
The Novel Alpha-2 Adrenoceptor Inhibitor Beditin Reduces Cytotoxicity and Huntingtin Aggregates in Cell Models of Huntington’s Disease

 , , and
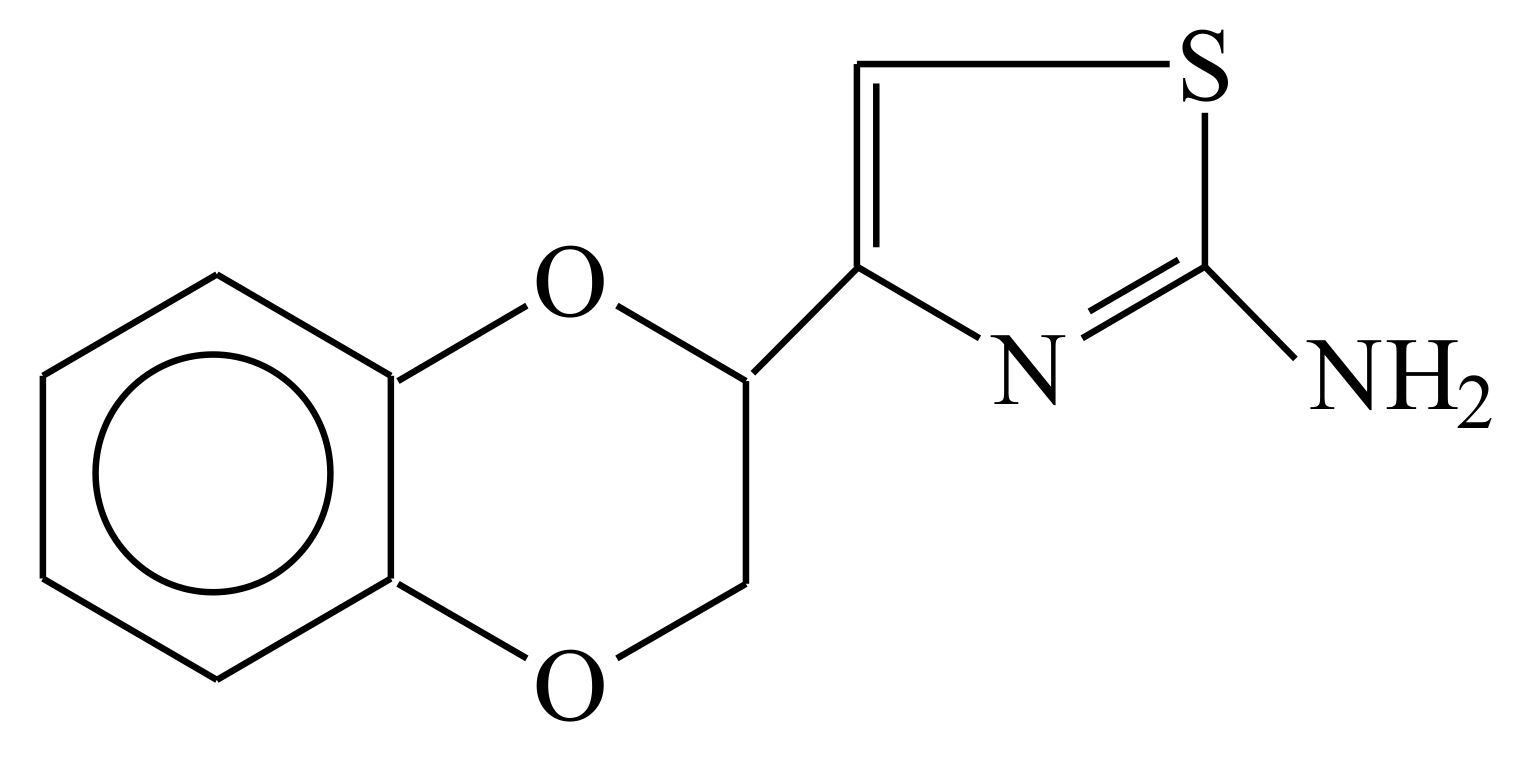
Abstract
:1. Introduction
2. Results
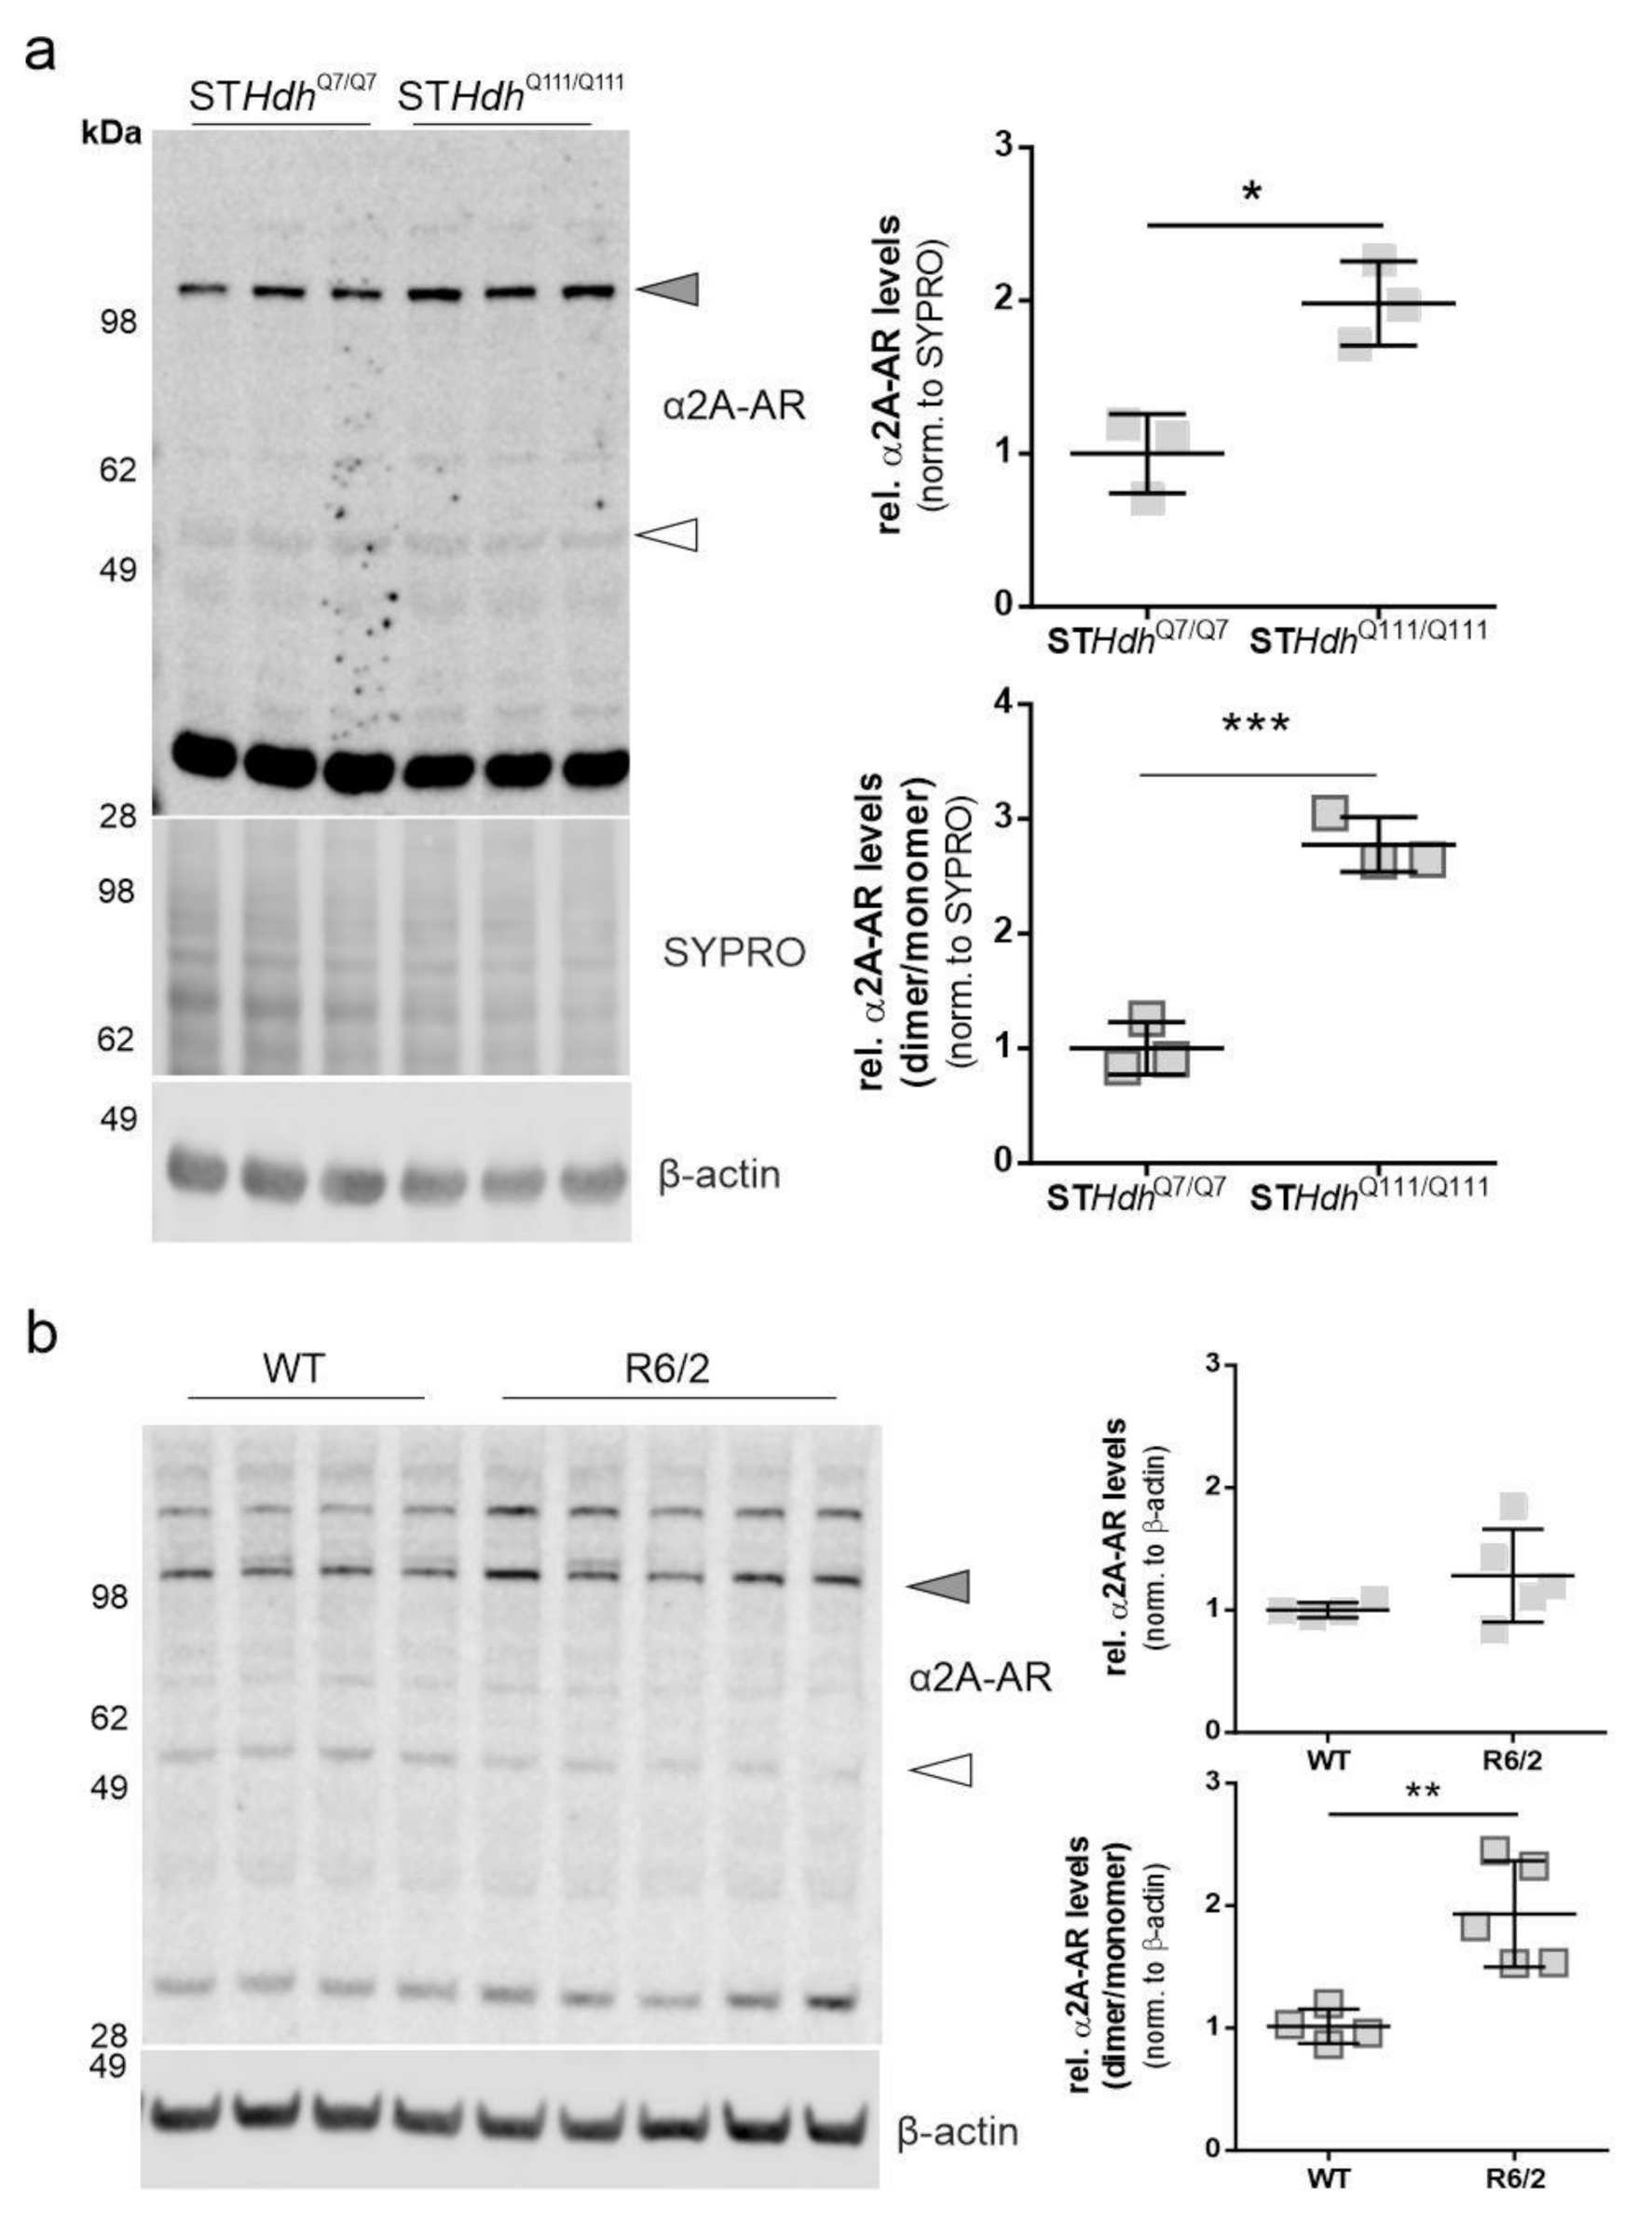
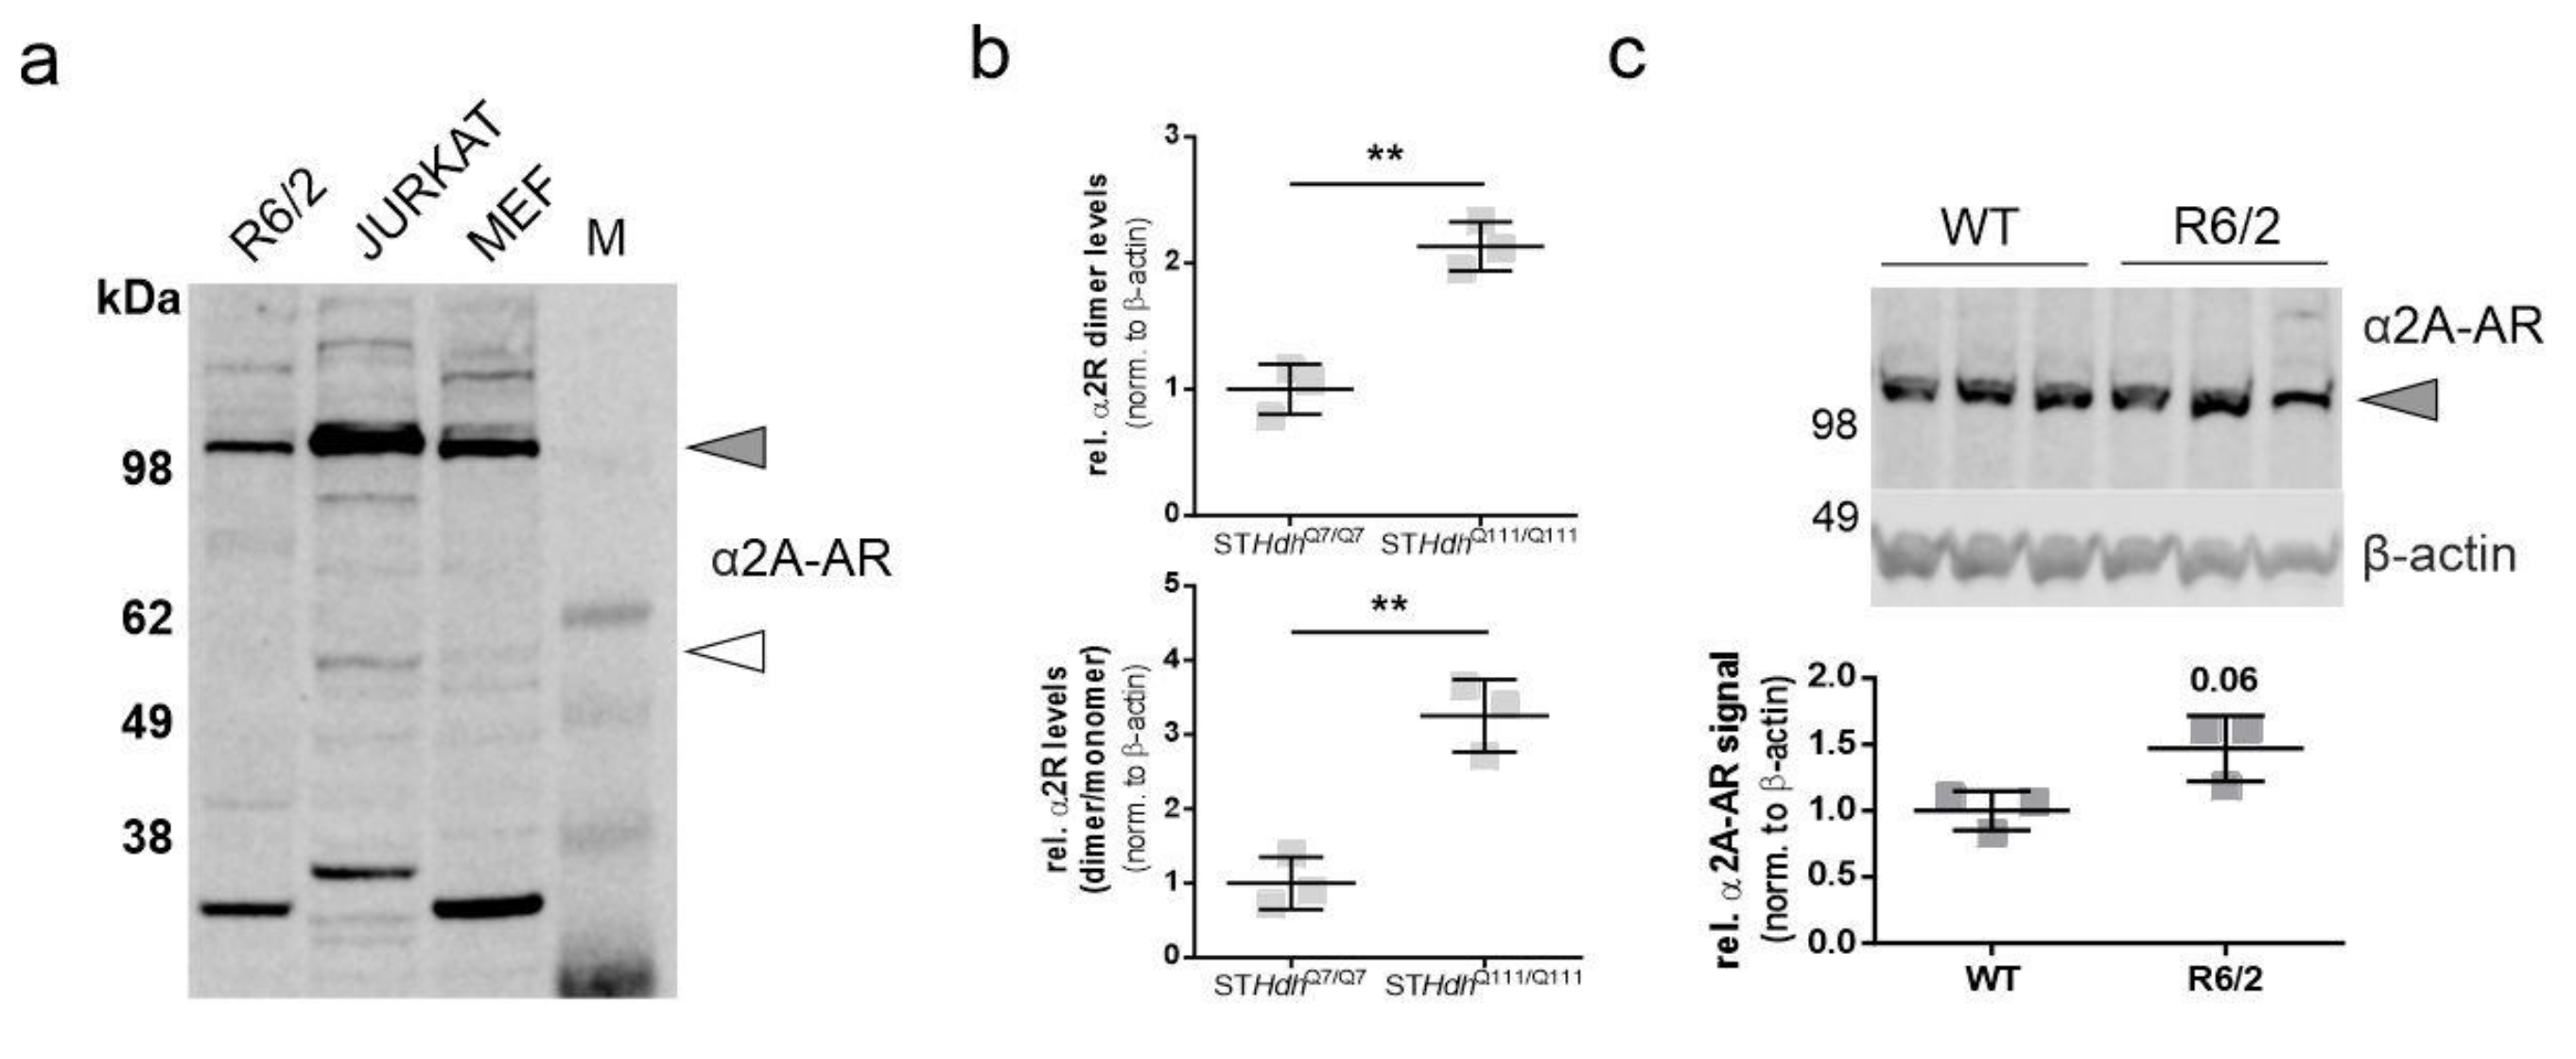
2.1. α2A-Adrenergic Receptor Levels Are Increased in STHdhQ111/Q111 Cells
2.2. Beditin Reduces Cytotoxicity in an In Vitro Model of HD
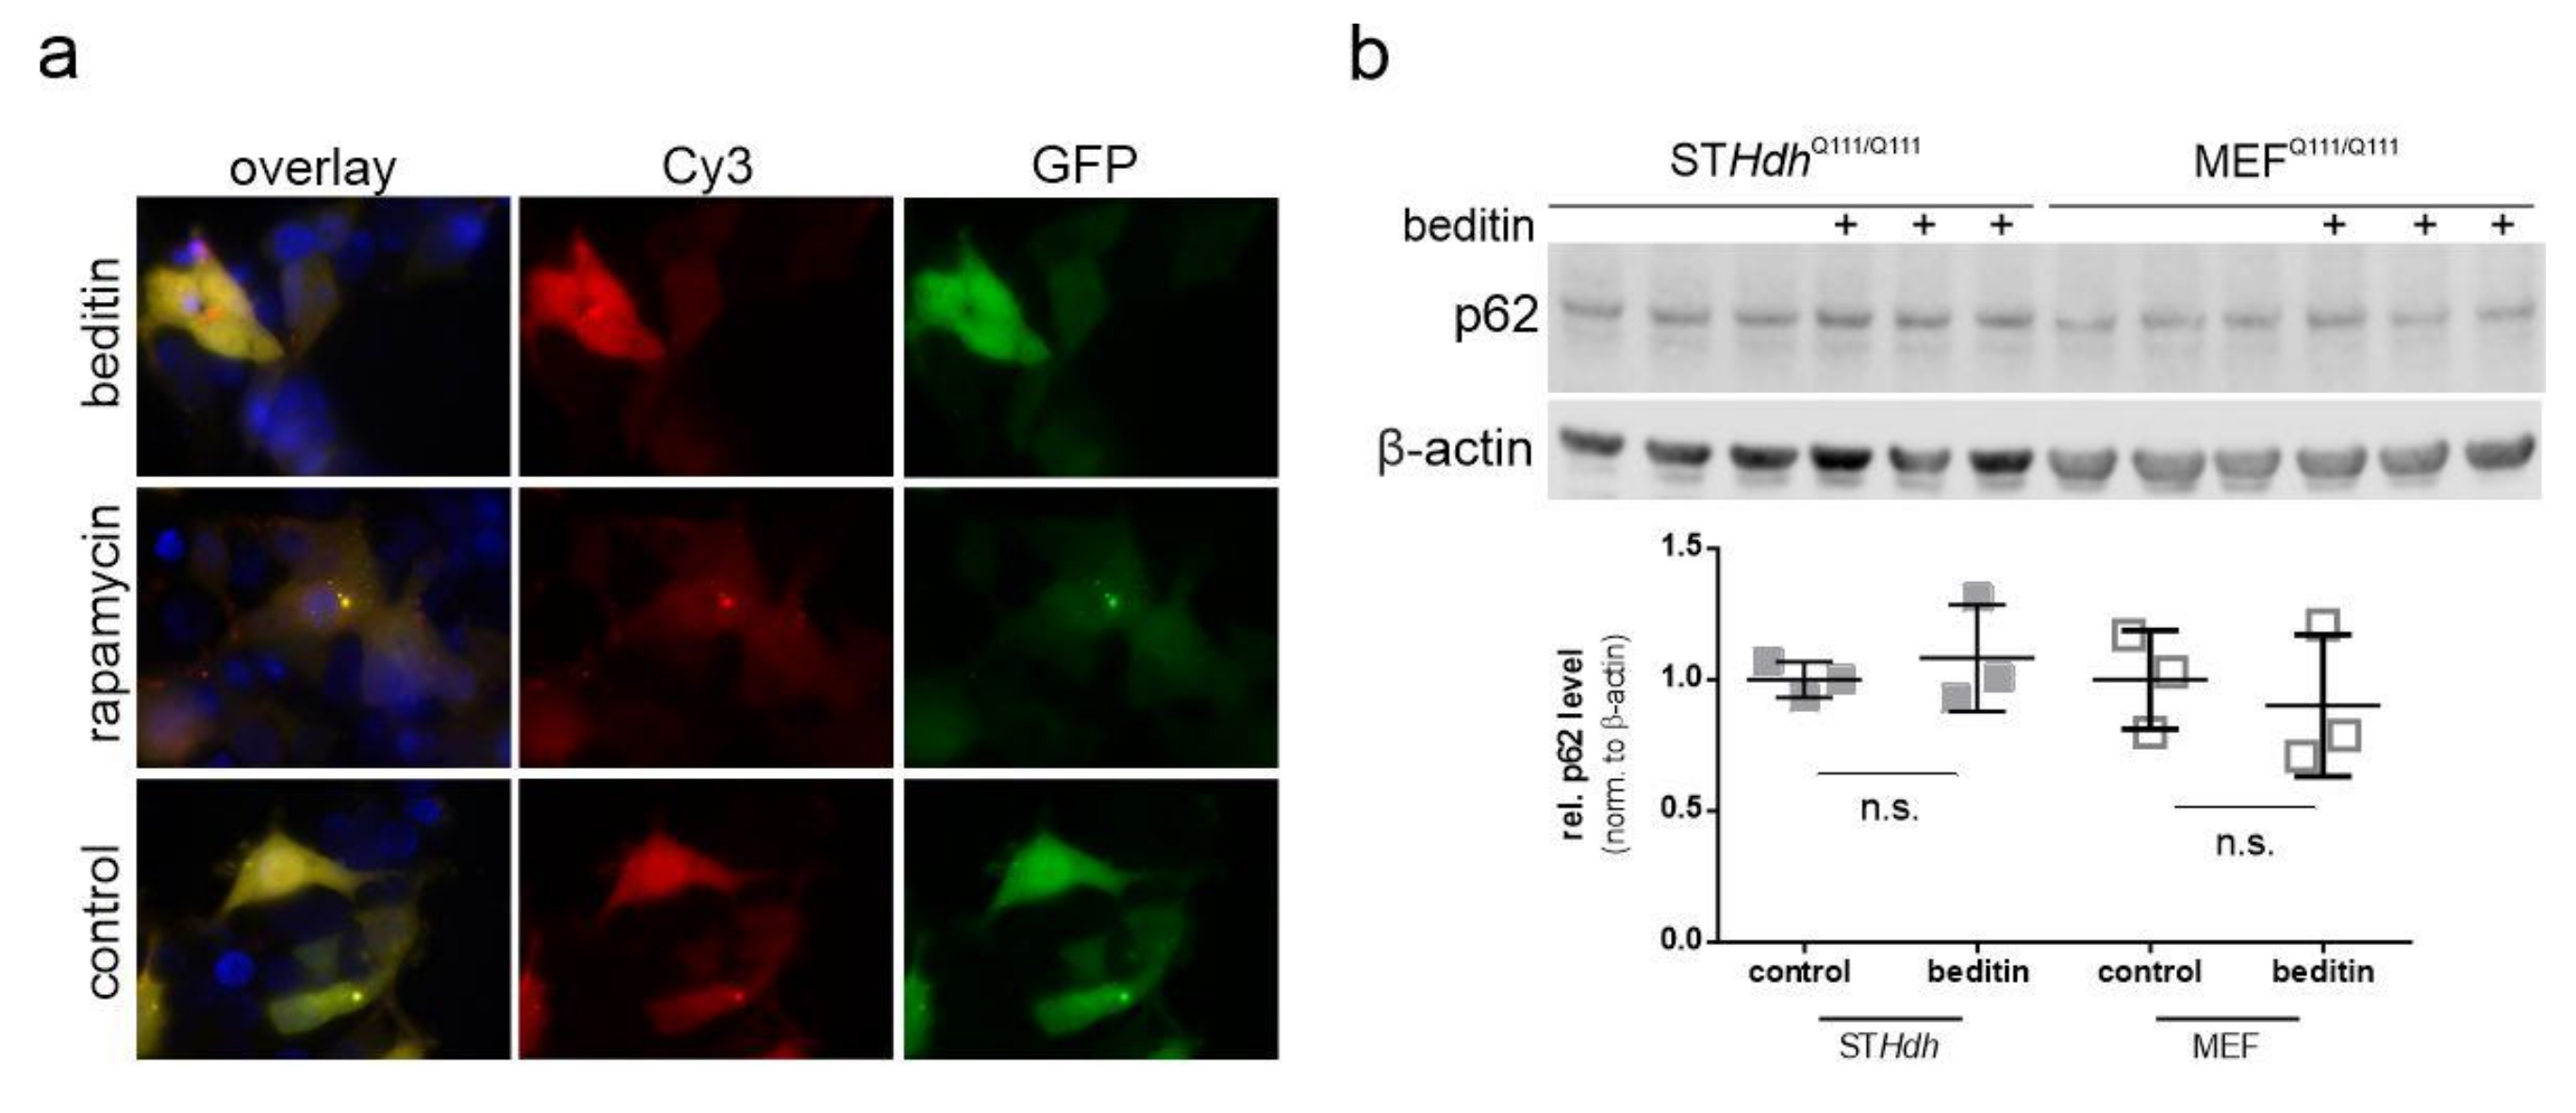
2.3. Beditin Induces Autophagy Independent of mTOR
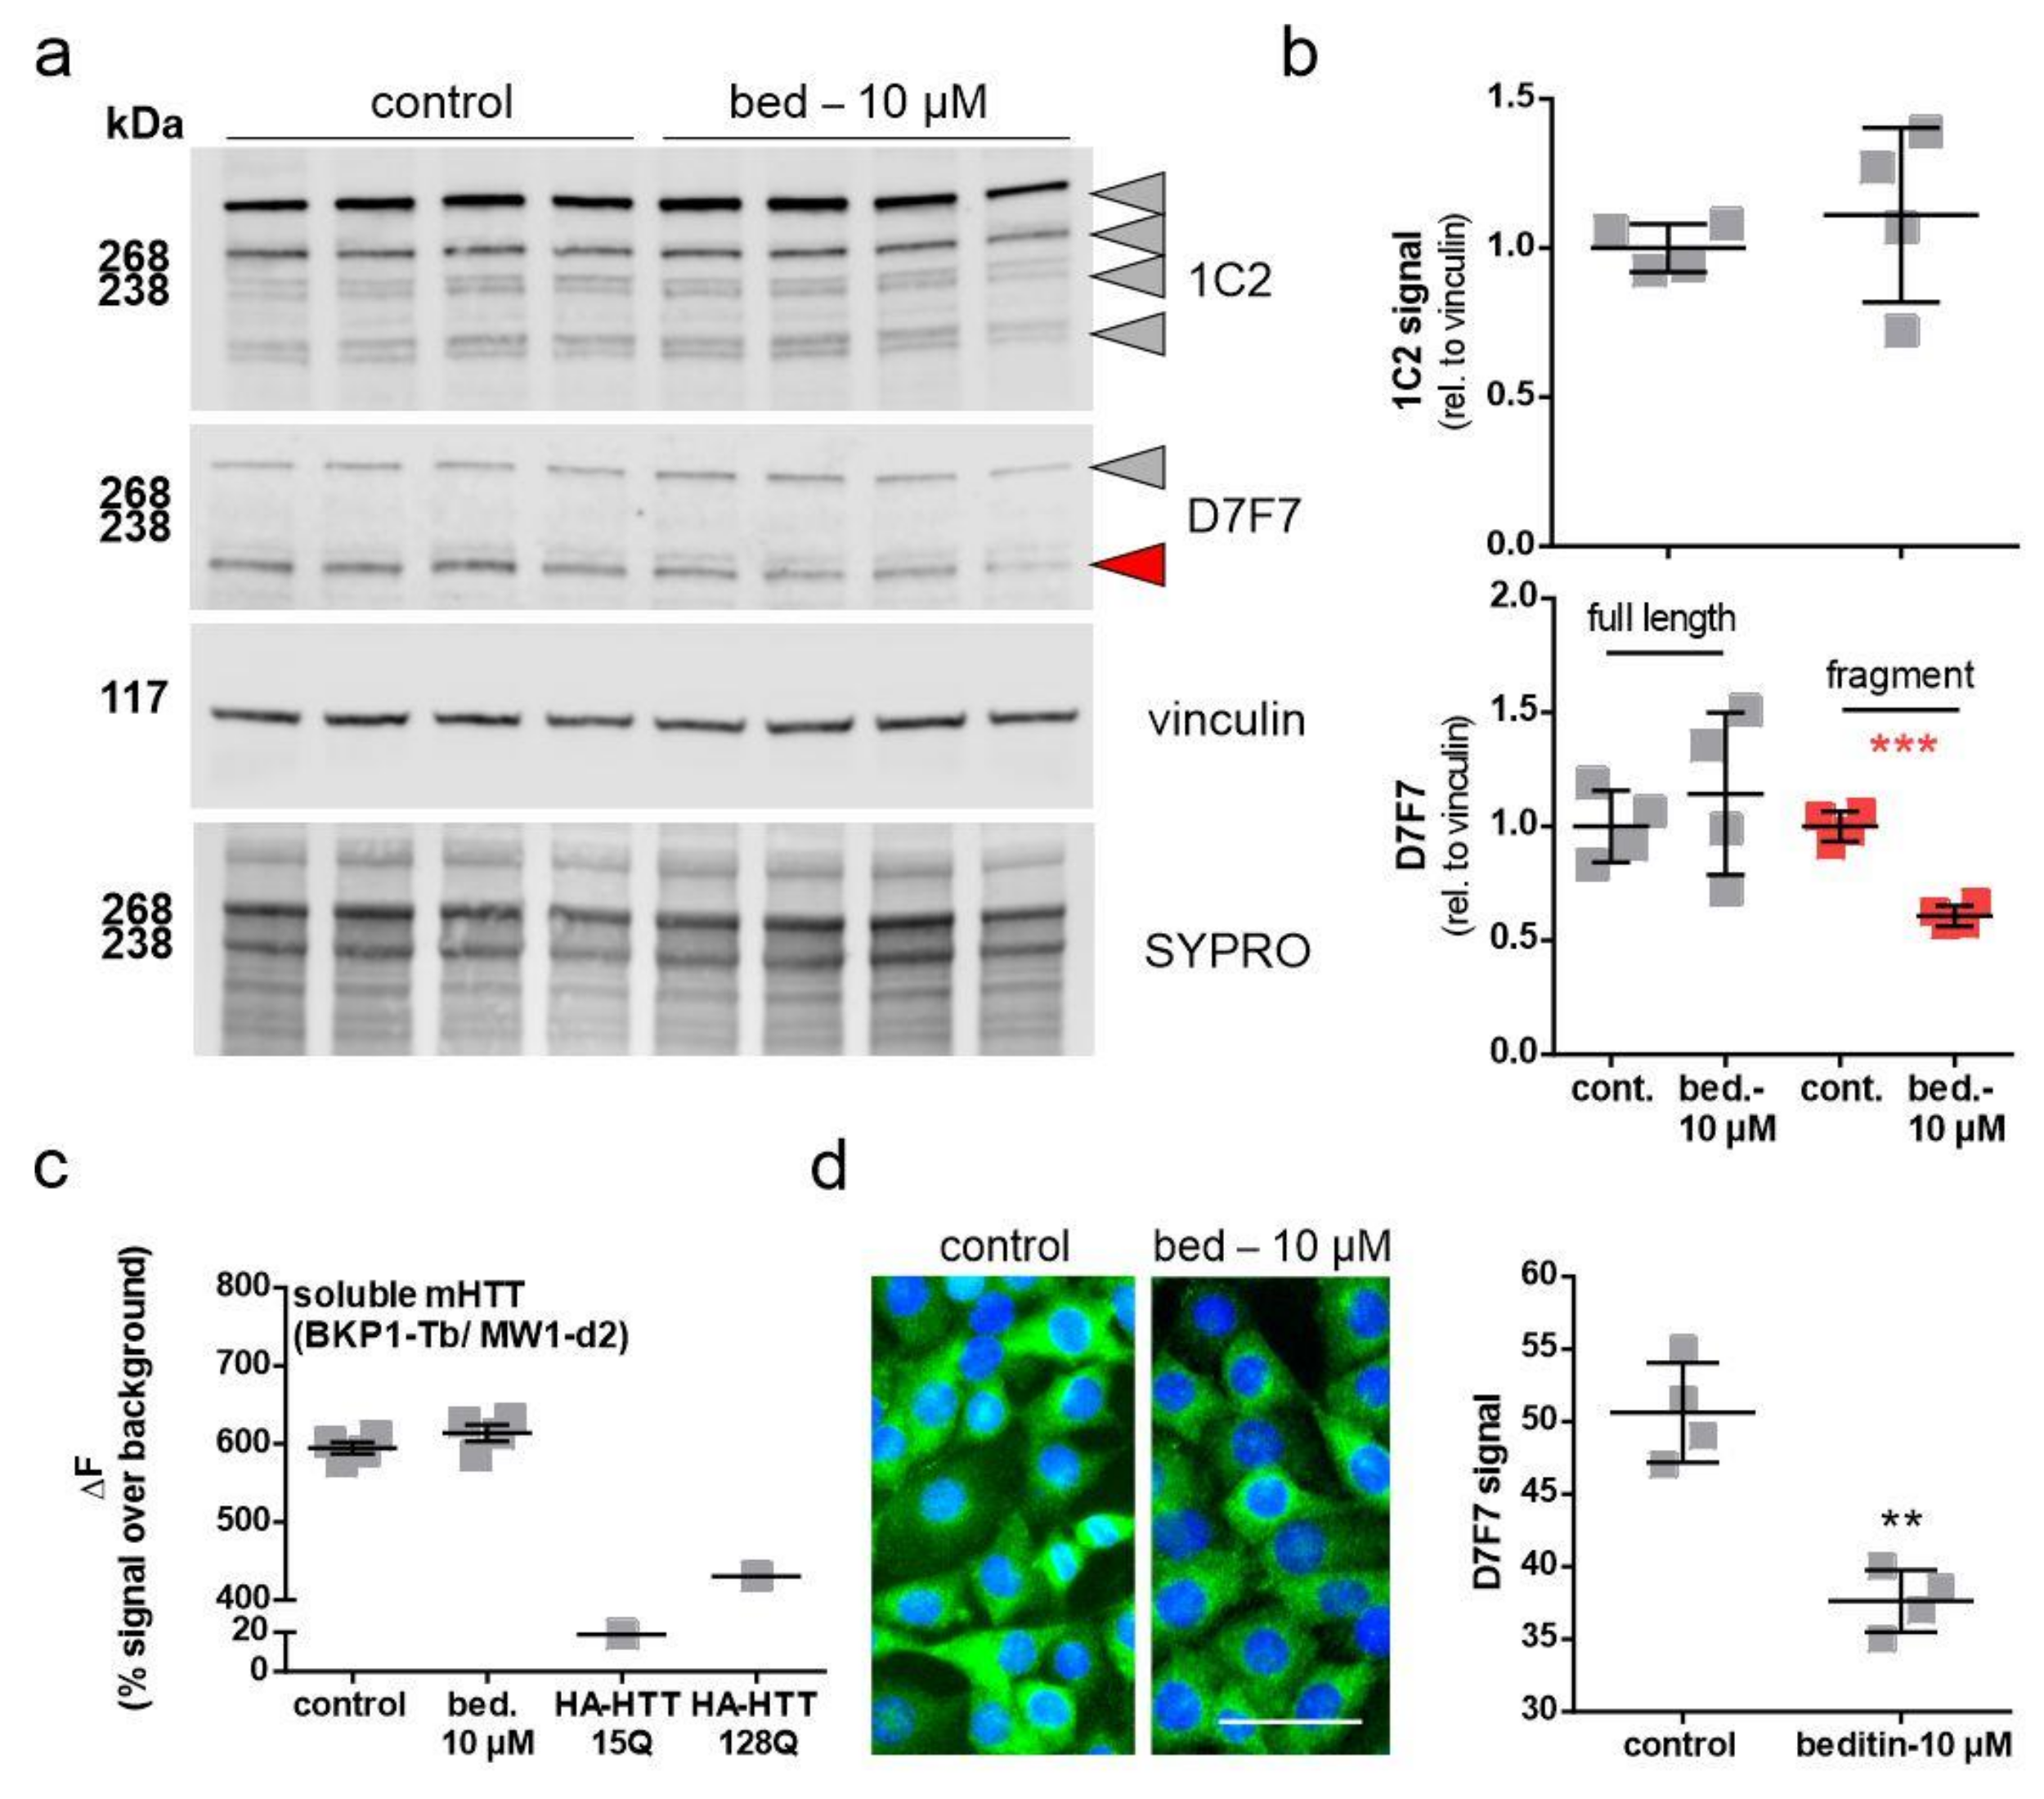
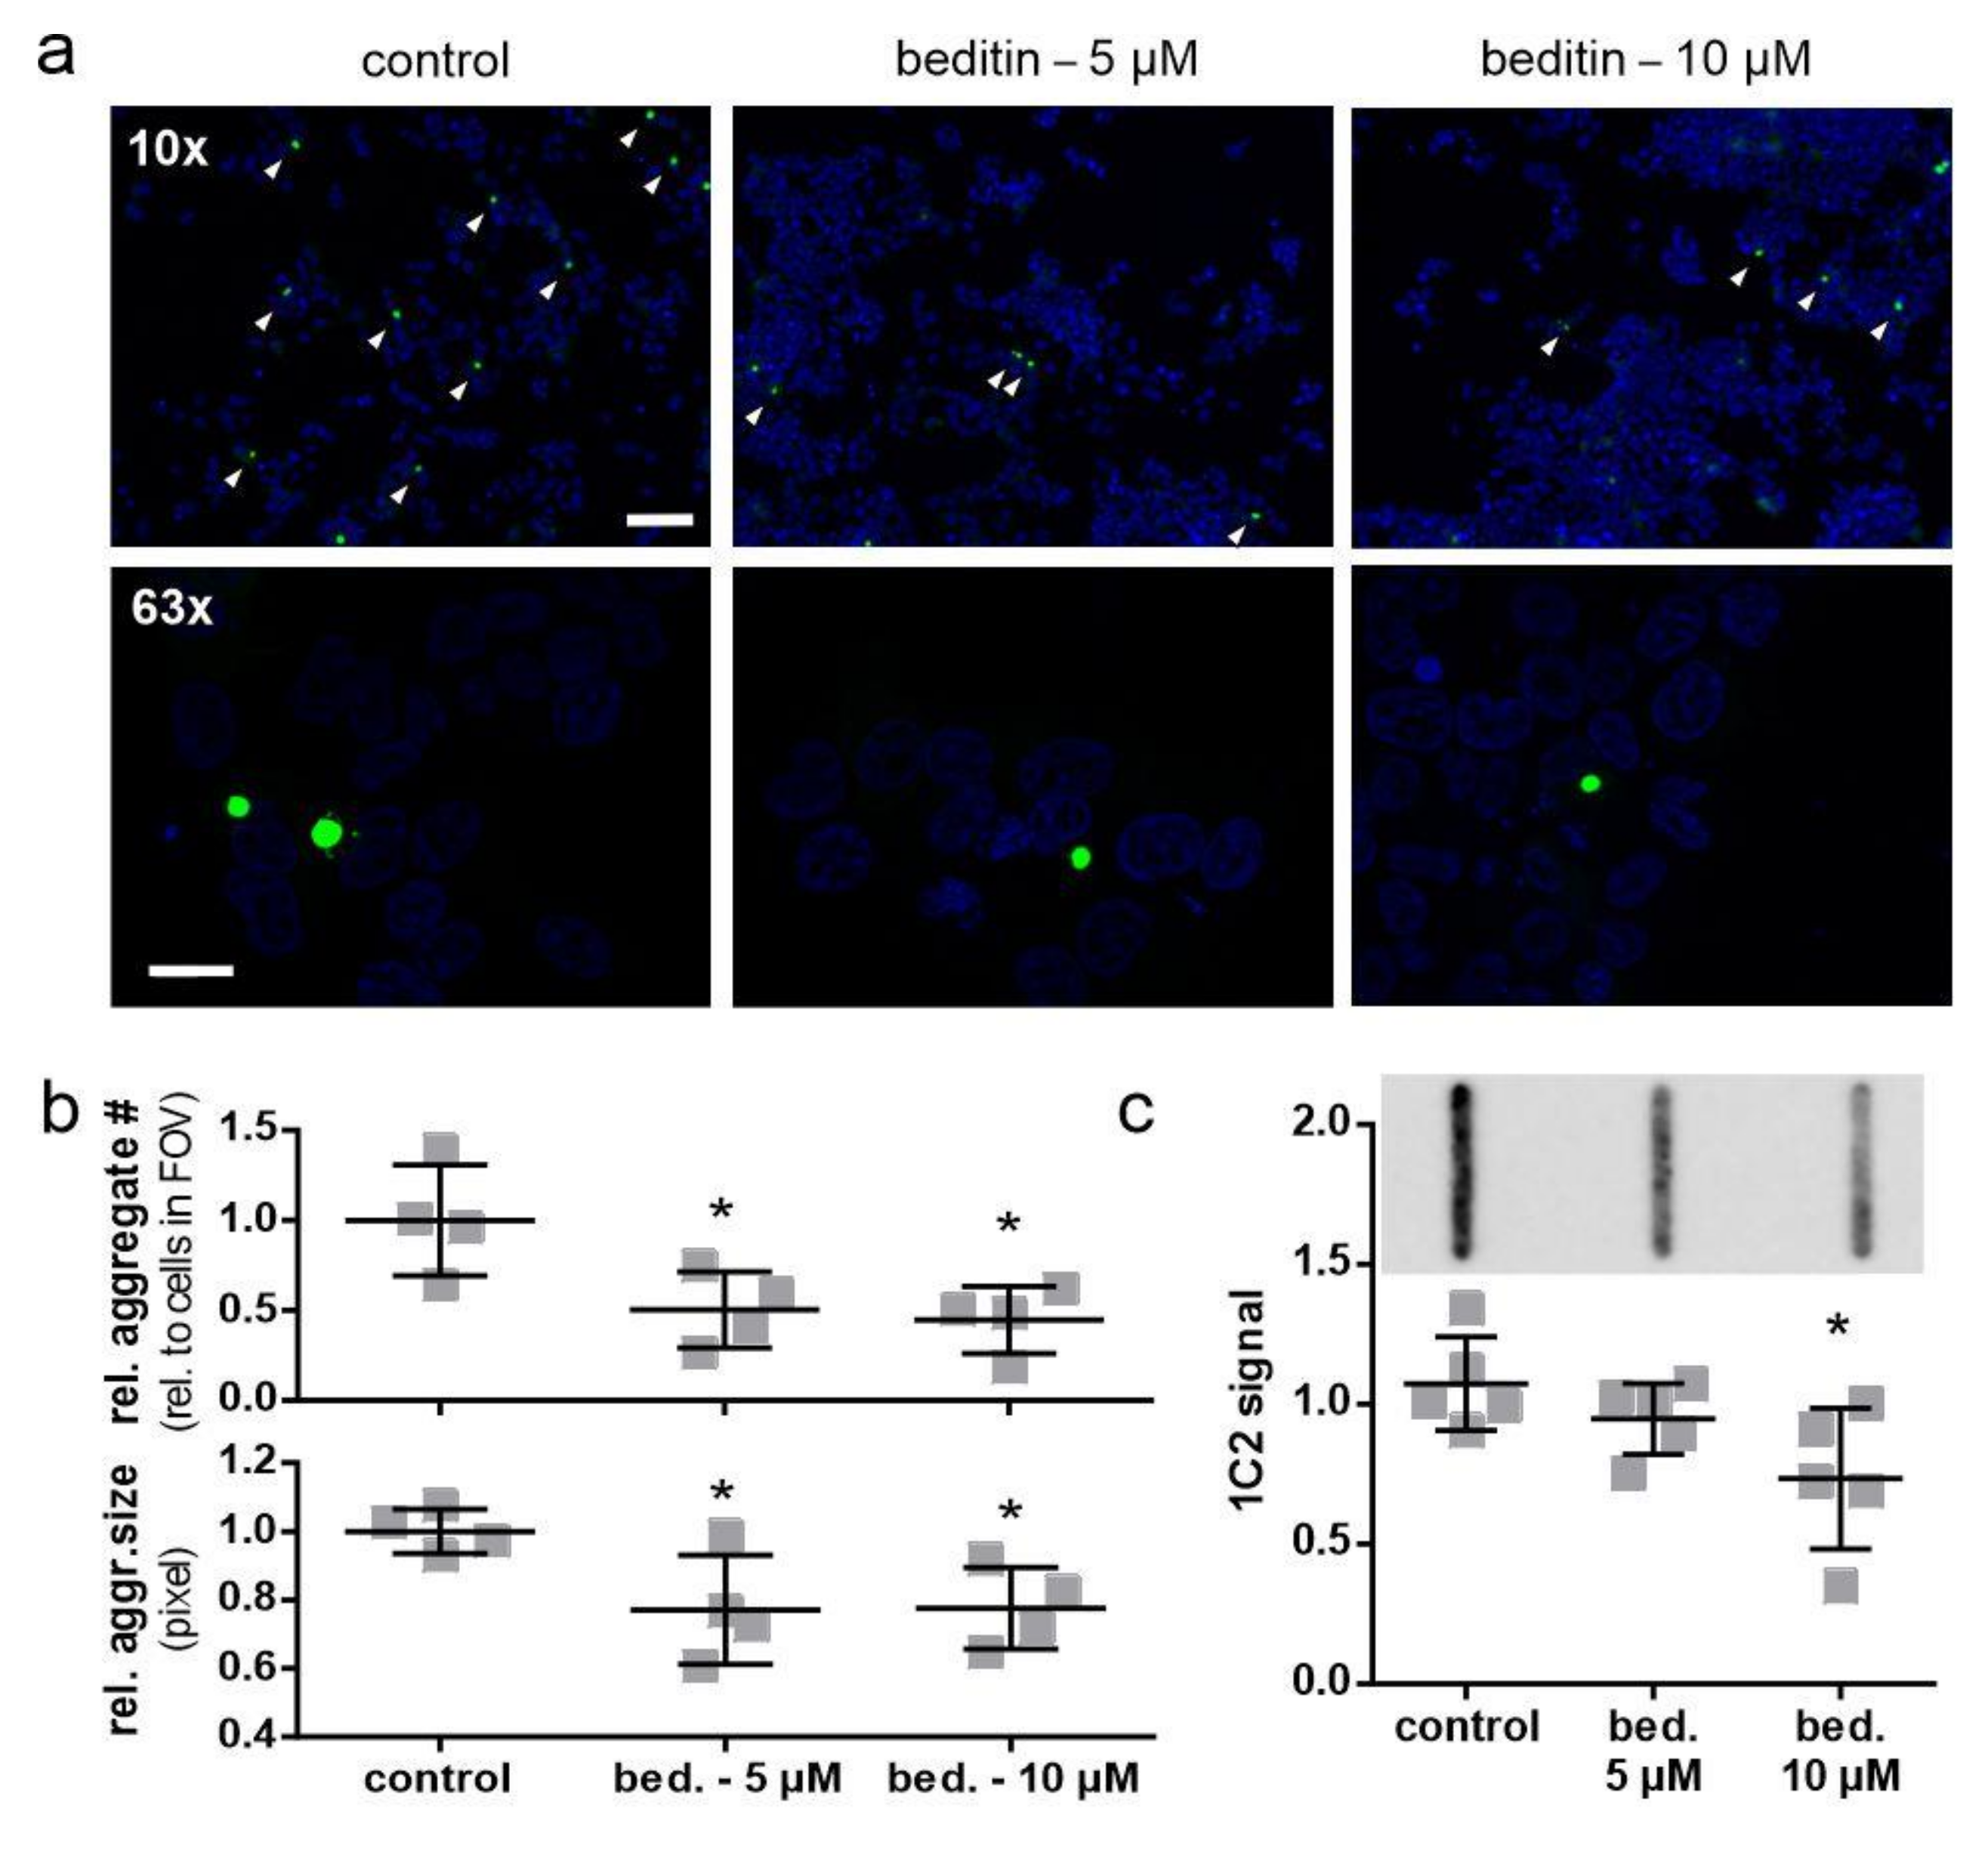
2.4. Beditin Has Limited Effects on Soluble Full-Length Levels of Mutant Huntingtin, but Decreases HTT Fragments and HTT Exon 1 Aggregates
3. Discussion
4. Materials and Methods
4.1. Cell Culture and Treatment
4.2. Cell Transfection and Protein Overexpression
4.3. Immunocytochemistry
4.4. Western Blot and Immunodetection
4.5. TR-FRET
4.6. LDH Assay
4.7. Filter Trap and Microscopic Aggregate Analysis
4.8. Statistical Analysis
5. Conclusions
Supplementary Materials
Author Contributions
Funding
Institutional Review Board Statement
Informed Consent Statement
Data Availability Statement
Acknowledgments
Conflicts of Interest
Appendix A


References
- The Huntington’s Disease Collaborative Research Group. A novel gene containing a trinucleotide repeat that is expanded and unstable on huntington’s disease chromosomes. The huntington’s disease collaborative research group. Cell 1993, 72, 971–983. [Google Scholar] [CrossRef]
- Wild, E.J.; Tabrizi, S.J. Therapies targeting DNA and rna in huntington’s disease. Lancet Neurol. 2017, 16, 837–847. [Google Scholar] [CrossRef] [Green Version]
- Zuccato, C.; Valenza, M.; Cattaneo, E. Molecular mechanisms and potential therapeutical targets in huntington’s disease. Physiol. Rev. 2010, 90, 905. [Google Scholar] [CrossRef] [PubMed]
- Ferrante, R.J.; Kowall, N.W.; Beal, M.F.; Martin, J.B.; Bird, E.D.; Richardson, E.P., Jr. Morphologic and histochemical characteristics of a spared subset of striatal neurons in huntington’s disease. J. Neuropathol. Exp. Neurol. 1987, 46, 12–27. [Google Scholar] [CrossRef]
- MacDonald, E.; Kobilka, B.K.; Scheinin, M. Gene targeting—Homing in on α2-adrenoceptor-subtype function. Trends Pharmacol. Sci. 1997, 18, 211–219. [Google Scholar] [CrossRef]
- Hara, M.; Fukui, R.; Hieda, E.; Kuroiwa, M.; Bateup, H.S.; Kano, T.; Greengard, P.; Nishi, A. Role of adrenoceptors in the regulation of dopamine/darpp-32 signaling in neostriatal neurons. J. Neurochem. 2010, 113, 1046–1059. [Google Scholar] [CrossRef] [PubMed] [Green Version]
- Sánchez-Soto, M.; Casadó-Anguera, V.; Yano, H.; Bender, B.J.; Cai, N.-S.; Moreno, E.; Canela, E.I.; Cortés, A.; Meiler, J.; Casadó, V.; et al. Α(2a)- and α(2c)-adrenoceptors as potential targets for dopamine and dopamine receptor ligands. Mol. Neurobiol. 2018, 55, 8438–8454. [Google Scholar] [CrossRef]
- Martel, J.C.; Chopin, P.; Colpaert, F.; Marien, M. Neuroprotective effects of the α2-adrenoceptor antagonists, (+)-efaroxan and (±)-idazoxan, against quinolinic acid-induced lesions of the rat striatum. Exp. Neurol. 1998, 154, 595–601. [Google Scholar] [CrossRef] [PubMed]
- Vartanyan, S.O.; Avakyan, A.S.; Sargsyan, A.B.; Arutyunyan, S.A.; Noravyan, O.S.; Tsatinyan, A.S. Synthesis and biologic properties of new thiazolylbenzodioxane derivatives. Russ. J. Org. Chem. 2016, 52, 244–248. [Google Scholar] [CrossRef]
- Mirzoian, S.A.; Petrosian, A.A.; Arutiunian, S.A.; Gukasian, T.G.; Medvedev, O.S.; Shirinian, E.A. Vliianie beditina na mozgovoe krovoobrashchenie i nekotorye drugie metabolicheskie pokazateli [Effect of beditine on the cerebral circulation and various metabolic parameters]. Eksp Klin Farmakol 2000, 63, 20–23. (In Russian) [Google Scholar]
- Shirinian, E.A.; Arutiunian, S.A.; Petrosian, A.A.; Gevorkian, G.A.; Markarian, E.A.; Vartanian, S.O.; Medvedev, O.S.; Garibdzhanian, B.T. effect of a postsynaptic alpha2-adrenoreceptor antagonist beditin on the rat resistance to seizure and ca(+)-level in the brain tissue. Eksp Klin Farmakol 2004, 67, 11–14. [Google Scholar]
- Melkonyan, M.M.; Hunanyan, L.; Lourhmati, A.; Layer, N.; Beer-Hammer, S.; Yenkoyan, K.; Schwab, M.; Danielyan, L. Neuroprotective, neurogenic, and amyloid beta reducing effect of a novel alpha 2-adrenoblocker, mesedin, on astroglia and neuronal progenitors upon hypoxia and glutamate exposure. Int. J. Mol. Sci. 2017, 19, 9. [Google Scholar] [CrossRef] [Green Version]
- Trettel, F.; Rigamonti, D.; Hilditch-Maguire, P.; Wheeler, V.C.; Sharp, A.H.; Persichetti, F.; Cattaneo, E.; MacDonald, M.E. Dominant phenotypes produced by the hd mutation in sthdhq111 striatal cells. Hum. Mol. Genet. 2000, 9, 2799–2809. [Google Scholar] [CrossRef]
- de Salamanca, A.E.Q.; Siemasko, K.F.; Diebold, Y.; Calonge, M.; Gao, J.; Juaárez-Campo, M.N.; Stern, M.E. Expression of muscarinic and adrenergic receptors in normal human conjunctival epithelium. Investig. Ophthalmol. Vis. Sci. 2005, 46, 504–513. [Google Scholar] [CrossRef]
- Singer, E.; Walter, C.; Weber, J.J.; Krahl, A.-C.; Mau-Holzmann, U.A.; Rischert, N.; Riess, O.; Clemensson, L.E.; Nguyen, H.P. Reduced cell size, chromosomal aberration and altered proliferation rates are characteristics and confounding factors in the sthdh cell model of huntington disease. Sci. Rep. 2017, 7, 16880. [Google Scholar] [CrossRef] [Green Version]
- Bae, B.I.; Hara, M.R.; Cascio, M.B.; Wellington, C.L.; Hayden, M.R.; Ross, C.A.; Ha, H.C.; Li, X.J.; Snyder, S.H.; Sawa, A. Mutant huntingtin: Nuclear translocation and cytotoxicity mediated by gapdh. Proc. Natl. Acad. Sci. USA 2006, 103, 3405–3409. [Google Scholar] [CrossRef] [PubMed] [Green Version]
- Burke, J.R.; Enghild, J.J.; Martin, M.E.; Jou, Y.S.; Myers, R.M.; Roses, A.D.; Vance, J.M.; Strittmatter, W.J. Huntingtin and drpla proteins selectively interact with the enzyme gapdh. Nat. Med. 1996, 2, 347–350. [Google Scholar] [CrossRef] [PubMed]
- Mangiarini, L.; Sathasivam, K.; Seller, M.; Cozens, B.; Harper, A.; Hetherington, C.; Lawton, M.; Trottier, Y.; Lehrach, H.; Davies, S.W. Exon 1 of the hd gene with an expanded cag repeat is sufficient to cause a progressive neurological phenotype in transgenic mice. Cell 1996, 87, 493–506. [Google Scholar] [CrossRef] [Green Version]
- N'Diaye, E.N.; Kajihara, K.K.; Hsieh, I.; Morisaki, H.; Debnath, J.; Brown, E.J. Plic proteins or ubiquilins regulate autophagy-dependent cell survival during nutrient starvation. EMBO Rep. 2009, 10, 173–179. [Google Scholar] [CrossRef] [PubMed] [Green Version]
- Sahani, M.H.; Itakura, E.; Mizushima, N. Expression of the autophagy substrate sqstm1/p62 is restored during prolonged starvation depending on transcriptional upregulation and autophagy-derived amino acids. Autophagy 2014, 10, 431–441. [Google Scholar] [CrossRef] [PubMed] [Green Version]
- Klionsky, D.J.; Abdelmohsen, K.; Abe, A.; Abedin, M.J.; Abeliovich, H.; Acevedo Arozena, A.; Adachi, H.; Adams, C.M.; Adams, P.D.; Adeli, K. Guidelines for the use and interpretation of assays for monitoring autophagy. Autophagy 2016, 12, 1–222. [Google Scholar] [CrossRef] [PubMed] [Green Version]
- Terrillon, S.; Bouvier, M. Roles of g-protein-coupled receptor dimerization. EMBO Rep. 2004, 5, 30–34. [Google Scholar] [CrossRef] [PubMed] [Green Version]
- Riess, O.; Thies, U.; Siedlaczck, I.; Potisek, S.; Graham, R.; Theilmann, J.; Grimm, T.; Epplen, J.T.; Hayden, M.R. Precise mapping of the brain alpha 2-adrenergic receptor gene within chromosome 4p16. Genomics 1994, 19, 298–302. [Google Scholar] [CrossRef]
- Bode, F.J.; Stephan, M.; Wiehager, S.; Nguyen, H.P.; Björkqvist, M.; von Hörsten, S.; Bauer, A.; Petersén, Å. Increased numbers of motor activity peaks during light cycle are associated with reductions in adrenergic α2-receptor levels in a transgenic huntington’s disease rat model. Behav. Brain Res. 2009, 205, 175–182. [Google Scholar] [CrossRef]
- Luthi-Carter, R.; Strand, A.; Peters, N.L.; Solano, S.M.; Hollingsworth, Z.R.; Menon, A.S.; Frey, A.S.; Spektor, B.S.; Penney, E.B.; Schilling, G.; et al. Decreased expression of striatal signaling genes in a mouse model of huntington’s disease. Hum. Mol. Genet. 2000, 9, 1259–1271. [Google Scholar] [CrossRef] [Green Version]
- Varani, K.; Abbracchio, M.P.; Cannella, M.; Cislaghi, G.; Giallonardo, P.; Mariotti, C.; Cattabriga, E.; Cattabeni, F.; Borea, P.A.; Squitieri, F. Aberrant a2a receptor function in peripheral blood cells in huntington’s disease. FASEB J. 2003, 17, 1–16. [Google Scholar] [CrossRef]
- Drouin, C.; Bobadilla, A.-C.; Tassin, J.-P. Norepinephrine. In Reference Module in Neuroscience and Biobehavioral Psychology; Elsevier: Amsterdam, The Netherlands, 2017. [Google Scholar]
- Nasman, J.; Kukkonen, J.P.; Ammoun, S.; Akerman, K.E.O. Role of g-protein availability in differential signaling by alpha 2-adrenoceptors. Biochem. Pharmacol. 2001, 62, 913–922. [Google Scholar] [CrossRef]
- Angers, S.; Salahpour, A.; Bouvier, M. Dimerization: An emerging concept for g protein-coupled receptor ontogeny and function. Annu. Rev. Pharmacol. Toxicol. 2002, 42, 409–435. [Google Scholar] [CrossRef] [PubMed] [Green Version]
- George, S.R.; O’Dowd, B.F.; Lee, S.P. G-protein-coupled receptor oligomerization and its potential for drug discovery. Nat. Rev. Drug Discov. 2002, 1, 808–820. [Google Scholar] [CrossRef]
- Small, K.M.; Schwarb, M.R.; Glinka, C.; Theiss, C.T.; Brown, K.M.; Seman, C.A.; Liggett, S.B. Alpha2a- and alpha2c-adrenergic receptors form homo- and heterodimers: The heterodimeric state impairs agonist-promoted grk phosphorylation and beta-arrestin recruitment. Biochemistry 2006, 45, 4760–4767. [Google Scholar] [CrossRef] [PubMed]
- Zhou, F.; Filipeanu, C.M.; Duvernay, M.T.; Wu, G. Cell-surface targeting of alpha2-adrenergic receptors—Inhibition by a transport deficient mutant through dimerization. Cell Signal 2006, 18, 318–327. [Google Scholar] [CrossRef] [Green Version]
- Moreno-Delgado, D.; Puigdellívol, M.; Moreno, E.; Rodríguez-Ruiz, M.; Botta, J.; Gasperini, P.; Chiarlone, A.; Howell, L.A.; Scarselli, M.; Casadó, V.; et al. Modulation of dopamine d(1) receptors via histamine h(3) receptors is a novel therapeutic target for huntington’s disease. eLife 2020, 9, e51093. [Google Scholar] [CrossRef] [PubMed]
- Pierzynowska, K.; Gaffke, L.; Cyske, Z.; Puchalski, M.; Rintz, E.; Bartkowski, M.; Osiadły, M.; Pierzynowski, M.; Mantej, J.; Piotrowska, E.; et al. Autophagy stimulation as a promising approach in treatment of neurodegenerative diseases. Metab. Brain Dis. 2018, 33, 989–1008. [Google Scholar] [CrossRef]
- Hu, Y.-D.; Tang, C.-L.; Jiang, J.-Z.; Lv, H.-Y.; Wu, Y.-B.; Qin, X.-D.; Shi, S.; Zhao, B.; Zhu, X.-N.; Xia, Z.-Y. Neuroprotective effects of dexmedetomidine preconditioning on oxygen-glucose deprivation-reoxygenation injury in pc12 cells via regulation of ca2+-stim1/orai1 signaling. Curr. Med. Sci. 2020, 40, 699–707. [Google Scholar] [CrossRef]
- Weber, J.J.; Pereira Sena, P.; Singer, E.; Nguyen, H.P. Killing two angry birds with one stone: Autophagy activation by inhibiting calpains in neurodegenerative diseases and beyond. BioMed Res. Int. 2019, 2019, 4741252. [Google Scholar] [CrossRef] [Green Version]
- Russo, R.; Berliocchi, L.; Adornetto, A.; Varano, G.; Cavaliere, F.; Nucci, C.; Rotiroti, D.; Morrone, L.; Bagetta, G.; Corasaniti, M. Calpain-mediated cleavage of beclin-1 and autophagy deregulation following retinal ischemic injury in vivo. Cell Death Dis. 2011, 2, e144. [Google Scholar] [CrossRef] [Green Version]
- Pinton, P.; Giorgi, C.; Siviero, R.; Zecchini, E.; Rizzuto, R. Calcium and apoptosis: Er-mitochondria ca2+ transfer in the control of apoptosis. Oncogene 2008, 27, 6407–6418. [Google Scholar] [CrossRef] [Green Version]
- Walter, C.; Clemens, L.E.; Muller, A.J.; Fallier-Becker, P.; Proikas-Cezanne, T.; Riess, O.; Metzger, S.; Nguyen, H.P. Activation of ampk-induced autophagy ameliorates huntington disease pathology in vitro. Neuropharmacology 2016, 108, 24–38. [Google Scholar] [CrossRef]
- Kegel, K.B.; Kim, M.; Sapp, E.; McIntyre, C.; Castaño, J.G.; Aronin, N.; DiFiglia, M. Huntingtin expression stimulates endosomal–lysosomal activity, endosome tubulation, and autophagy. J. Neurosci. 2000, 20, 7268–7278. [Google Scholar] [CrossRef]
- Petersén, Å.; Puschban, Z.; Lotharius, J.; NicNiocaill, B.; Wiekop, P.; O’Connor, W.T.; Brundin, P. Evidence for dysfunction of the nigrostriatal pathway in the r6/1 line of transgenic huntington’s disease mice. Neurobiol. Dis. 2002, 11, 134–146. [Google Scholar] [CrossRef] [PubMed] [Green Version]
- Martinez-Vicente, M.; Talloczy, Z.; Wong, E.; Tang, G.; Koga, H.; Kaushik, S.; de Vries, R.; Arias, E.; Harris, S.; Sulzer, D.; et al. Cargo recognition failure is responsible for inefficient autophagy in huntington’s disease. Nat. Neurosci. 2010, 13, 567–576. [Google Scholar] [CrossRef] [Green Version]
- Ravikumar, B.; Berger, Z.; Vacher, C.; O’Kane, C.J.; Rubinsztein, D.C. Rapamycin pre-treatment protects against apoptosis. Hum. Mol. Genet. 2006, 15, 1209–1216. [Google Scholar] [CrossRef]
- Ravikumar, B.; Rubinsztein, D.C. Role of autophagy in the clearance of mutant huntingtin: A step towards therapy? Mol. Asp. Med. 2006, 27, 520–527. [Google Scholar] [CrossRef]
- Sarkar, S.; Ravikumar, B.; Floto, R.A.; Rubinsztein, D.C. Rapamycin and mtor-independent autophagy inducers ameliorate toxicity of polyglutamine-expanded huntingtin and related proteinopathies. Cell Death Differ. 2009, 16, 46–56. [Google Scholar] [CrossRef] [Green Version]
- Singer, E.; Walter, C.; Fabbro, D.; Rageot, D.; Beaufils, F.; Wymann, M.P.; Rischert, N.; Riess, O.; Hillmann, P.; Nguyen, H.P. Brain-penetrant pqr620 mtor and pqr530 pi3k/mtor inhibitor reduce huntingtin levels in cell models of hd. Neuropharmacology 2019, 107812. [Google Scholar] [CrossRef] [PubMed]
- Perez-Lloret, S.; Rascol, O. Piribedil for the treatment of motor and non-motor symptoms of parkinson disease. CNS Drugs 2016, 30, 703–717. [Google Scholar] [CrossRef] [PubMed]
- Bauer, S.; Moyse, E.; Jourdan, F.; Colpaert, F.; Martel, J.C.; Marien, M. Effects of the alpha 2-adrenoreceptor antagonist dexefaroxan on neurogenesis in the olfactory bulb of the adult rat in vivo: Selective protection against neuronal death. Neuroscience 2003, 117, 281–291. [Google Scholar] [CrossRef]
- Chen, Y.; Peng, Y.; Che, P.; Gannon, M.; Liu, Y.; Li, L.; Bu, G.; van Groen, T.; Jiao, K.; Wang, Q. Α(2a) adrenergic receptor promotes amyloidogenesis through disrupting app-sorla interaction. Proc. Natl. Acad. Sci. USA 2014, 111, 17296–17301. [Google Scholar] [CrossRef] [PubMed] [Green Version]
- Meana, J.J.; Barturen, F.; Garro, M.A.; García-Sevilla, J.A.; Fontán, A.; Zarranz, J.J. Decreased density of presynaptic alpha 2-adrenoceptors in postmortem brains of patients with alzheimer’s disease. J. Neurochem. 1992, 58, 1896–1904. [Google Scholar] [CrossRef]
- Menalled, L.B. Knock-in mouse models of huntington’s disease. NeuroRX 2005, 2, 465–470. [Google Scholar] [CrossRef] [PubMed] [Green Version]
- Addgene. Available online: https://www.addgene.org/22418/ (accessed on 11 March 2021).
- Baldo, B.; Paganetti, P.; Grueninger, S.; Marcellin, D.; Kaltenbach, L.S.; Lo, D.C.; Semmelroth, M.; Zivanovic, A.; Abramowski, D.; Smith, D.; et al. Tr-fret-based duplex immunoassay reveals an inverse correlation of soluble and aggregated mutant huntingtin in huntington’s disease. Chem. Biol. 2012, 19, 264–275. [Google Scholar] [CrossRef] [Green Version]
- Clemens, L.E.; Weber, J.J.; Wlodkowski, T.T.; Yu-Taeger, L.; Michaud, M.; Calaminus, C.; Eckert, S.H.; Gaca, J.; Weiss, A.; Magg, J.C.D.; et al. Olesoxime suppresses calpain activation and mutant huntingtin fragmentation in the bachd rat. Brain 2015, 138, 3632–3653. [Google Scholar] [CrossRef] [PubMed] [Green Version]
- Wellington, C.L.; Ellerby, L.M.; Gutekunst, C.-A.; Rogers, D.; Warby, S.; Graham, R.K.; Loubser, O.; van Raamsdonk, J.; Singaraja, R.; Yang, Y.-Z.; et al. Caspase cleavage of mutant huntingtin precedes neurodegeneration in huntington’s disease. J. Neurosci. 2002, 22, 7862. [Google Scholar] [CrossRef] [Green Version]
- Ko, J.; Ou, S.; Patterson, P.H. New anti-huntingtin monoclonal antibodies: Implications for huntingtin conformation and its binding proteins. Brain Res. Bull. 2001, 56, 319–329. [Google Scholar] [CrossRef]
- Schneider, C.A.; Rasband, W.S.; Eliceiri, K.W. Nih image to imagej: 25 years of image analysis. Nat. Methods 2012, 9, 671–675. [Google Scholar] [CrossRef]


Publisher’s Note: MDPI stays neutral with regard to jurisdictional claims in published maps and institutional affiliations. |
© 2021 by the authors. Licensee MDPI, Basel, Switzerland. This article is an open access article distributed under the terms and conditions of the Creative Commons Attribution (CC BY) license (http://creativecommons.org/licenses/by/4.0/).
Share and Cite
Singer, E.; Hunanyan, L.; Melkonyan, M.M.; Weber, J.J.; Danielyan, L.; Nguyen, H.P. The Novel Alpha-2 Adrenoceptor Inhibitor Beditin Reduces Cytotoxicity and Huntingtin Aggregates in Cell Models of Huntington’s Disease. Pharmaceuticals 2021, 14, 257. https://0-doi-org.brum.beds.ac.uk/10.3390/ph14030257
Singer E, Hunanyan L, Melkonyan MM, Weber JJ, Danielyan L, Nguyen HP. The Novel Alpha-2 Adrenoceptor Inhibitor Beditin Reduces Cytotoxicity and Huntingtin Aggregates in Cell Models of Huntington’s Disease. Pharmaceuticals. 2021; 14(3):257. https://0-doi-org.brum.beds.ac.uk/10.3390/ph14030257
Chicago/Turabian StyleSinger, Elisabeth, Lilit Hunanyan, Magda M. Melkonyan, Jonasz J. Weber, Lusine Danielyan, and Huu Phuc Nguyen. 2021. "The Novel Alpha-2 Adrenoceptor Inhibitor Beditin Reduces Cytotoxicity and Huntingtin Aggregates in Cell Models of Huntington’s Disease" Pharmaceuticals 14, no. 3: 257. https://0-doi-org.brum.beds.ac.uk/10.3390/ph14030257