
Adequacy of Anesthesia Guidance for Colonoscopy Procedures

 , , , ,
Abstract
:1. Introduction
2. Results
3. Discussion
4. Materials and Methods
4.1. Patients
4.2. Anesthetic Technique
4.3. Colonoscopy Technique
4.4. Evaluation of Patients and Endoscopist Satisfaction
4.5. Statistical Analysis
5. Conclusions
Supplementary Materials
Author Contributions
Funding
Institutional Review Board Statement
Informed Consent Statement
Data Availability Statement
Acknowledgments
Conflicts of Interest
References
- Erstad, D.J.; Krowsoski, L.S.; Kaafarani, H.M. Abdominal Pain after Colonoscopy. Gastroenterology 2017, 152, 486–487. [Google Scholar] [CrossRef] [Green Version]
- Baker, F.A.; Mari, A.; Aamarney, K.; Hakeem, A.R.; Ovadia, B.; Kopelman, Y. Propofol sedation in colonoscopy: From satisfied patients to improved quality indicators. Clin. Exp. Gastroenterol. 2019, 12, 105–110. [Google Scholar] [CrossRef] [Green Version]
- Early, D.S.; Lightdale, J.R.; Vargo, J.J.; Acosta, R.D.; Chandrasekhara, V.; Chathadi, K.V.; DeWitt, J.M. Guidelines for sedation and anesthesia in GI endoscopy. Gastrointest. Endosc. 2018, 87, 327–337. [Google Scholar] [CrossRef] [PubMed] [Green Version]
- Pace, D.; Borgaonkar, M. Deep sedation for colonoscopy is unnecessary and wasteful. CMAJ 2018, 190, 153–154. [Google Scholar] [CrossRef] [Green Version]
- Gruenewald, M.; Ilies, C. Monitoring the nociception–anti-nociception balance. Best Pract. Res. Clin. Anaesthesiol. 2013, 27, 235–247. [Google Scholar] [CrossRef]
- Maja, V.; Talja, P.; Tenkanen, N.; Tolvanen-Laakso, H. Description of the Entropy™ algorithm as applied in the datex-ohmeda S/5™ entropy module. Acta Anaesthesiol. Scand. 2004, 48, 154–161. [Google Scholar]
- Gruenewald, M.; Zhou, J.; Schloemerkemper, N.; Meybohm, P.; Weiler, N.; Tonner, P.H.; Bein, B. M-Entropy guidance vs. standard practice during propofol-remifentanil anaesthesia: A randomised controlled trial. Anaesthesia 2007, 62, 1224–1229. [Google Scholar] [CrossRef] [PubMed]
- Horn, C.C.; Wallisch, W.J.; Homanics, G.E.; Williams, J.P. Pathophysiological and neurochemical mecha-nisms of postoperative nausea and vomiting. Eur. J. Pharmacol. 2014, 722, 55–66. [Google Scholar] [CrossRef] [PubMed] [Green Version]
- Yoldas, H.; Yildiz, I.; Karagoz, I.; Sit, M.; Ogun, M.N.; Demirhan, A.; Bilgi, M. Effects of Bispectral Index-controlled Use of Magnesium on Propofol Consumption and Sedation Level in Patients Undergoing Colonoscopy. Medeni. Med. J. 2019, 34, 380–386. [Google Scholar] [CrossRef]
- Ferreira, A.O.; Torres, J.; Barjas, E.; Nunes, J.; Glória, L.; Ferreira, R.; Cravo, M. Non-anesthesiologist administration of propofol sedation for colonoscopy is safe in low risk patients: Results of a noninferiority randomized controlled trial. Endoscopy 2016, 48, 747–753. [Google Scholar] [CrossRef]
- Becerra, L.; Aasted, C.M.; Boas, D.A.; George, E.; Yücel, M.A.; Kussman, B.D.; Borsook, D. Brain measures of nociception using near infrared spectroscopy in patients undergoing routine screening colonoscopy. Pain 2016, 157, 840–848. [Google Scholar] [CrossRef] [PubMed]
- Lee, H.; Kim, J.H. Superiority of split dose midazolam as conscious sedation for outpatient colonoscopy. World J. Gastroenterol. WJG 2009, 15, 3783–3787. [Google Scholar] [CrossRef] [PubMed]
- Forster, C.; Vanhaudenhuyse, A.; Gast, P.; Louis, E.; Hick, G.; Brichant, J.F.; Joris, J. Intravenous infusion of lidocaine significantly reduces propofol dose for colonoscopy: A randomised placebo-controlled study. Br. J. Anaesth. 2018, 121, 1059–1064. [Google Scholar] [CrossRef] [PubMed] [Green Version]
- Stasiowski, M.J.; Duława, A.; Król, S.; Marciniak, R.; Kaspera, W.; Niewiadomska, E.; Jałowiecki, P. Polyspikes and Rhythmic Polyspikes during Volatile Induction of General Anesthesia with Sevoflurane Result in Bispectral Index Variations. Clin. EEG Neurosci. 2020. [Google Scholar] [CrossRef] [PubMed]
- Stasiowski, M.; Duława, A.; Szumera, I.; Marciniak, R.; Niewiadomska, E.; Kaspera, W.; Jałowiecki, P. Variations in Values of State, Response Entropy and Haemodynamic Parameters Associated with Development of Different Epileptiform Patterns during Volatile Induction of General Anaesthesia with Two Different Anaesthetic Regimens Using Sevoflurane in Comparison with Intravenous Induct: A Comparative Study. Brain Sci. 2020, 10, 366. [Google Scholar]
- Stasiowski, M.J.; Marciniak, R.; Duława, A.; Krawczyk, L.; Jałowiecki, P. Epileptiform EEG patterns during different techniques of induction of general anaesthesia with sevoflurane and propofol: A randomised trial. Anaesthesiol. Intensive Ther. 2019, 51, 21–34. [Google Scholar] [CrossRef]
- Musialowicz, T.; Lahtinen, P. Current Status of EEG-Based Depth-of-Consciousness Monitoring During General Anesthesia. Curr. Anesthesiol. Rep. 2014, 4, 251–260. [Google Scholar] [CrossRef] [Green Version]
- Gruenewald, M.; Willms, S.; Broch, O.; Kott, M.; Steinfath, M.; Bein, B. Sufentanil administration guided by surgical pleth index vs. standard practice during sevoflurane anaesthesia: A randomized controlled pilot study. Br. J. Anaesth. 2014, 112, 898–905. [Google Scholar] [CrossRef] [Green Version]
- Gruenewald, M.; Meybohm, P.; Ilies, C.; Höcker, J.; Hanss, R.; Scholz, J.; Bein, B. Influence of different remifentanil concentrations on the performance of the surgical stress index to detect a standardized painful stimulus during sevoflurane anaesthesia. Br. J. Anaesth. 2009, 103, 586–593. [Google Scholar] [CrossRef] [Green Version]
- Bonhomme, V.; Uutela, K.; Hans, G.; Maquoi, I.; Born, J.D.; Brichant, J.F.; Hans, P. Comparison of the Surgical Pleth Index™ with haemodynamic variables to assess nociception–anti-nociception balance during general anaesthesia. Br. J. Anaesth. 2011, 106, 101–111. [Google Scholar] [CrossRef] [Green Version]
- Stasiowski, M.; Missir, A.; Pluta, A.; Szumera, I.; Stasiak, M.; Szopa, W.; Kaspera, W. Influence of infiltration anaesthesia on perioperative outcomes following lumbar discec-tomy under surgical pleth index-guided general anaesthesia: A preliminary report from a randomised controlled prospective trial. Adv. Med. Sci. 2020, 65, 149–155. [Google Scholar] [CrossRef]
- Fratino, S.; Peluso, L.; Talamonti, M.; Menozzi, M.; Costa Hirai, L.A.; Lobo, F.A.; Prezioso, C.; Creteur, J.; Payen, J.; Taccone, F.S. Evaluation of Nociception Using Quantitative Pupillometry and Skin Conductance in Critically Ill Unconscious Patients: A Pilot Study. Brain Sci. 2021, 11, 109. [Google Scholar] [CrossRef] [PubMed]
- Chen, X.; Thee, C.; Gruenewald, M.; Wnent, J.; Illies, C.; Hoecker, J.; Bein, B. Comparison of surgical stress index-guided analgesia with standard clinical practice during routine general anesthesia: A pilot study. Anesthesiology 2010, 112, 1175–1183. [Google Scholar] [CrossRef] [PubMed] [Green Version]
- Kim, J.H.; Jwa, E.K.; Choung, Y.; Yeon, H.J.; Kim, S.Y.; Kim, E. Comparison of Pupillometry with Surgical Pleth Index Monitoring on Perioperative Opioid Consumption and Nociception during Propofol-Remifentanil Anesthesia: A Prospective Randomized Controlled Trial. Anesth. Analg. 2020, 131, 1589–1598. [Google Scholar] [CrossRef]
- Gruenewald, M.; Harju, J.; Preckel, B.; Molnár, Z.; Yli-Hankala, A.; Rosskopf, F.; AoA Study Group. Comparison of adequacy of anaesthesia monitoring with standard clinical practice monitoring during routine general anaesthesia: An international, multicentre, single-blinded randomised controlled trial. Eur. J. Anaesthesiol. 2021, 38, 73–81. [Google Scholar] [CrossRef]
- Stasiowski, M.J.; Pluta, A.; Lyssek-Boroń, A.; Kawka, M.; Krawczyk, L.; Niewiadomska, E.; Grabarek, B.O. Preventive Analgesia, Hemodynamic Stability, and Pain in Vitreoretinal Surgery. Medicina 2021, 57, 262. [Google Scholar] [CrossRef]
- Stogiannou, D.; Protopapas, A.; Protopapas, A.; Tziomalos, K. Is propofol the optimal sedative in gastrointestinal endoscopy? Acta Gastroenterol. Belg. 2018, 81, 520–524. [Google Scholar]
- Musialowicz, T.; Valtola, A.; Hippeläinen, M.; Halonen, J.; Lahtinen, P. Spectral Entropy Parameters during Rapid Ventricular Pacing for Transcatheter Aortic Valve Implantation. Entropy 2017, 19, 133. [Google Scholar] [CrossRef] [Green Version]
- Musialowicz, T.; Lahtinen, P.; Pitkänen, O.; Kurola, J.; Parviainen, I. Comparison of Spectral Entropy and BIS VISTA™ monitor during general anesthesia for cardiac surgery. J. Clin. Monit. Comput. 2011, 25, 95. [Google Scholar] [CrossRef]
- Yli-Hankala, A. The effect of nitrous oxide on EEG spectral power during halothane and isoflurane anaesthesia. Acta Anaesthesiol. Scand. 1990, 34, 579–584. [Google Scholar] [CrossRef]
- Jameson, L.C.; Sloan, T.B. Using EEG to monitor anesthesia drug effects during surgery. J. Clin. Monit. Comput. 2006, 20, 445–472. [Google Scholar] [CrossRef] [PubMed]
- Chhabra, A.; Subramaniam, R.; Srivastava, A.; Prabhakar, H.; Kalaivani, M.; Paranjape, S. Spectral entropy monitoring for adults and children undergoing general anaesthesia. Cochrane Database Syst. Rev. 2016. [Google Scholar] [CrossRef] [PubMed]
- Soral, M.; Altun, G.T.; Dinçer, P.Ç.; Arslantaş, M.K.; Aykaç, Z. Effectiveness of the analgesia nociception index monitoring in patients who undergo colonoscopy with sedo-analgesia. Turk. J. Anaesthesiol. Reanim. 2020, 48, 50–57. [Google Scholar] [CrossRef]
- Ledowski, T.; Pascoe, E.; Ang, B.; Schmarbeck, T.; Clarke, M.W.; Fuller, C.; Kapoor, V. Monitoring of intra-operative nociception: Skin conductance and surgical stress index versus stress hormone plasma levels. Anaesthesia 2010, 65, 1001–1006. [Google Scholar] [CrossRef]
- Ledowski, T.; Burke, J.; Hruby, J. Surgical pleth index: Prediction of postoperative pain and influence of arousal. Br. J. Anaesth. 2016, 117, 371–374. [Google Scholar] [CrossRef] [Green Version]
- Zhang, W.; Zhu, Z.; Zheng, Y. Effect and safety of propofol for sedation during colonoscopy: A meta-analysis. J. Clin. Anesth. 2018, 51, 10–18. [Google Scholar] [CrossRef] [PubMed]
- Vanluchene, A.L.G.; Struys, M.M.R.F.; Heyse, B.E.K.; Mortier, E.P. Spectral entropy measurement of patient responsiveness during propofol and remifentanil. A comparison with the bispectral index. Br. J. Anaesth. 2004, 93, 645–654. [Google Scholar] [CrossRef] [Green Version]
- Seleem, W.M.; El Hossieny, K.M.; Abd-Elsalam, S. Evaluation of different sedatives for colonoscopy. Curr. Drug Saf. 2020, 15, 20–24. [Google Scholar] [CrossRef]
- Bergmann, I.; Göhner, A.; Crozier, T.A.; Hesjedal, B.; Wiese, C.H.; Popov, A.F.; Hinz, J.M. Surgical pleth index-guided remifentanil administration reduces remifentanil and propofol consumption and shortens recovery times in outpatient anaesthesia. Br. J. Anaesth. 2013, 110, 622–628. [Google Scholar] [CrossRef] [PubMed] [Green Version]
- Won, Y.J.; Lim, B.G.; Kim, Y.S.; Lee, M.; Kim, H. Usefulness of surgical pleth index-guided analgesia during general anesthesia: A systematic review and meta-analysis of randomized controlled trials. J. Int. Med. Res. 2018, 46, 4386–4398. [Google Scholar] [CrossRef] [Green Version]
- Bellolio, M.F.; Gilani, W.I.; Barrionuevo, P.; Murad, M.H.; Erwin, P.J.; Anderson, J.R.; Hess, E.P. Incidence of adverse events in adults undergoing procedural sedation in the emergency department: A systematic review and meta-analysis. Acad. Emerg. Med. 2016, 23, 119–134. [Google Scholar] [CrossRef] [PubMed] [Green Version]
- Von Delius, S.; Thies, P.; Rieder, T.; Wagenpfeil, S.; Herberich, E.; Karagianni, A.; Frimberger, E.; Meining, A.; Ludwig, L.; Ebert, M.P.A.; et al. Auditory evoked potentials compared with bispectral index for monitoring of midazolam and propofol sedation during colonoscopy. Am. J. Gastroenterol. 2009, 104, 318–325. [Google Scholar] [CrossRef] [PubMed]
- Bilgi, M.; Tekelioglu, U.Y.; Sit, M.; Demirhan, A.; Akkaya, A.; Yildiz, I.; Kocoglu, H. Comparison of the effects of bispectral index-controlled use of remifentanil on propofol consumption and patient comfort in patients undergoing colonoscopy. Acta Gastro-Enterol. Belg. 2015, 78, 314–318. [Google Scholar]
- Hazewinkel, Y.; Dekker, E. Colonoscopy: Basic principles and novel techniques. Nat. Rev. Gastroenterol. Hepatol. 2011, 8, 554–564. [Google Scholar] [CrossRef]
- Sargin, M.; Uluer, M.S.; Şimşek, B. The effect of bispectral index monitoring on cognitive performance following sedation for outpatient colonoscopy: A randomized controlled trial. Sao Paulo Med. J. Rev. Paul. Med. 2019, 137, 305–311. [Google Scholar] [CrossRef]
- Krebs, E.E.; Carey, T.S.; Weinberger, M. Accuracy of the pain numeric rating scale as a screening test in primary care. J. Gen. Intern. Med. 2007, 22, 1453–1458. [Google Scholar] [CrossRef] [Green Version]
- Aho, A.J.; Yli-Hankala, A.; Lyytikäinen, L.P.; Jäntti, V. Facial muscle activity, Response Entropy, and State Entropy indices during noxious stimuli in propofol—Nitrous oxide or propofol—Nitrous oxide—Remifentanil anaesthesia without neuromuscular block. Br. J. Anaesth. 2009, 102, 227–233. [Google Scholar] [CrossRef] [Green Version]
- Apfel, C.C.; Laara, E.; Koivuranta, M.; Greim, C.A.; Roewer, N. A simplified risk score for predicting postoperative nausea and vomiting: Conclusions from cross-validations between two centers. Anesthesiology 1999, 91, 693–700. [Google Scholar] [CrossRef] [PubMed] [Green Version]
- Darvall, J.; Handscombe, M.; Maat, B.; So, K.; Suganthirakumar, A.; Leslie, K. Interpretation of the four risk factors for postoperative nausea and vomiting in the Apfel simplified risk score: An analysis of published studies. Can. J. Anaesth./J. Can. Anesth. 2021. [Google Scholar] [CrossRef]
- Johnson, D.A.; Barkun, A.N.; Cohen, L.B.; Dominitz, J.A.; Kaltenbach, T.; Martel, M.; Robertson, D.J.; Boland, C.R.; Giardello, F.M.; Lieberman, D.A.; et al. Optimizing adequacy of bowel cleansing for colonoscopy: Recommendations from the U.S. multi-society task force on colorectal cancer. Gastrointest. Endosc. 2014, 80, 543–562. [Google Scholar] [CrossRef]


| Parameter | Total n = 158 (100%) | Group C n = 53 (33.5%) | Group SE n = 52 (32.9%) | Group AoA n = 53 (33.5%) | p-Value |
|---|---|---|---|---|---|
| Stage 1—ONSET | |||||
| HR (beats/min) | 76.4 ± 14.3 73 (20) | 76.1 ± 12.8 75 (20) | 77.4 ± 16 72 (22) | 75.6 ± 14.1 71 (19) | p = 0.91 |
| SAP (mmHg) | 137.2 ± 22.3 133.5 (27) | 138.1 ± 23.1 133 (25) | 139.8 ± 20.5 138 (26.5) | 133.8 ± 23.1 132 (30) | p = 0.23 |
| MAP (mmHg) | 98.3 ± 13.9 97.5 (18) | 98.2 ± 13.2 97 (13) | 100.2 ± 14.1 99.5 (17) | 96.6 ± 14.2 96 (18) | p = 0.34 |
| DAP (mmHg) | 70 ± 11.7 68.5 (16) | 69.1 ± 10.8 68 (15) | 71.3 ± 12.7 69 (16.5) | 69.6 ± 11.6 68 (15) | p = 0.68 |
| SE | 87.3 ± 4.9 89 (2) | - | 87.7 ± 3.5 89 (2) | 87 ± 6 89 (2) | p = 0.56 |
| SPI | 60.4 ± 20.7 68.5 (32) | - | 60.1 ± 20.7 68 (28) | - | |
| Parameter | Total n = 158 (100%) | Group C n = 53 (33.5%) | Group SE n = 52 (32.9%) | Group AoA n = 53 (33.5%) | p-value |
| Stage 2—CP | |||||
| mean HR (beats/min) | 67 ± 9.5 65.5 (13.3) | 68.2 ± 10.2 65.7 (14.5) | 65.3 ± 9.1 64.9 (12.5) | 67.3 ± 9.1 64.7 (12.7) | p = 0.47 |
| mean SAP (mmHg) | 114.8 ± 23.2 111.5 (30.1) | 124.4 ± 23.5 124 (35.8) | 112.2 ± 24.4 111.3 (31.5) | 107.6 ± 18.2 107 (26) | p = 0.0004 p < 0.001 A,B |
| mean MAP (mmHg) | 84.1 ± 14.8 82.8 (21.1) | 89.5 ± 14.6 89.5 (21.4) | 82.9 ± 15.7 82 (21.7) | 79.9 ± 12.5 80 (16.4) | p = 0.002 p < 0.01 C |
| mean DAP (mmHg) | 61.6 ± 11.6 61.2 (16.6) | 64.6 ± 11.3 66 (16) | 61 ± 12.5 59 (15.8) | 59.3 ± 10.3 59 (14) | p = 0.06 |
| mean SE | 66.3 ± 9.6 69.2 (10.3) | - | 67.4 ± 8 68.8 (9.7) | 65.3 ± 10.8 69.5 (13.4) | p = 0.69 |
| mean SPI | 36.4 ± 14.7 33.1 (16.7) | - | - | 36.4 ± 14.7 33.1 (16.7) | - |
| Parameter | Total n = 158 (100%) | Group C n = 53 (33.5%) | Group SE n = 52 (32.9%) | Group AoA n = 53 (33.5%) | p-value |
| Stage 3—PACU | |||||
| mean HR (beats/min) | 67.9 ± 9.7 67.5 (14.3) | 69.3 ± 10.5 70 (17) | 67.5 ± 9.4 66.4 (12.3) | 66.9 ± 9.3 67.6 (14.3) | p = 0.47 |
| mean SAP (mmHg) | 113.7 ± 21.3 111 (28.8) | 119.7 ± 24.8 118.8 (33) | 114.2 ± 20.1 113.8 (24) | 107.2 ± 16.5 104.6 (22) | p = 0.01 p < 0.05 C |
| mean MAP (mmHg) | 83.2 ± 14 81.8 (20) | 86.5 ± 16.1 89 (24.3) | 83.5 ± 13.3 82.2 (17.3) | 79.6 ± 11.7 78 (16.2) | p = 0.04 p < 0.05 D |
| mean DAP (mmHg) | 61.6 ± 12 61.2 (17.3) | 63.5 ± 12.3 64 (18.8) | 61.3 ± 11.5 60.8 (15.6) | 60.1 ± 12.1 58.3 (14.2) | p = 0.21 |
| mean SE | 83.6 ± 6.7 85.3 (6.1) | - | 83.5 ± 7.5 85.5 (6.7) | 83.8 ± 4.5 84.4 (6) | p = 0.54 |
| mean SPI | 38 ± 14 33.4 (16.4) | - | - | 38 ± 14 33.4 (16.4) | - |
| Parameter | Total n = 158 (100%) | Group C n = 53 (33.5%) | Group SE n = 52 (32.9%) | Group AoA n = 53 (33.5%) | p-Value |
|---|---|---|---|---|---|
| Intraprocedural rescue FNT consumption (microgram) | 102.8 ± 26.2 100 (0) | 98.1 ± 21.3 100 (0) | 90.4 ± 23.8 100 (12.5) | 119.8 ± 24.2 100 (50) | p < 0.0001 A,B |
| Intraprocedural propofol consumption (mg) | 156.7 ± 64.3 150 (80) | 128.9 ± 57.5 120 (70) | 179.6 ± 62.2 180 (75) | 162.2 ± 63.5 160 (80) | p < 0.0001 A,C |
| Intraprocedural requirement for intravenous crystalloids (mL) | 493.7 ± 79.6 500 (0) | 471.7 ± 116.6 500 (0) | 509.6 ± 69.3 500 (0) | 500 ± 0 500 (0) | p = 0.36 |
| Length of CP (min) | 11.9 ± 6.9 10 (8) | 11.4 ± 7.6 9 (8) | 11.6 ± 6 10 (8) | 12.6 ± 6.9 11 (7) | p = 0.37 |
| Necessity of intraprocedural rescue atropine administration (number of patients) | 12 (7.6%) | 6 (11.3%) | 5 (9.6%) | 1 (1.9%) | p = 0.1 |
| Necessity of intraprocedural rescue ephedrine administration (number of patients) | 2 (1.3%) | 0 (0%) | 1 (1.9%) | 1 (1.9%) | p = 0.44 |
| Survey | Total n = 158 (100%) | Group C n = 53 (33.5%) | Group SE n = 52 (32.9%) | Group AoA n = 53 (33.5%) | p-Value |
|---|---|---|---|---|---|
| APFEL score | 1.44 ± 0.77 1 (1) | 1.45 ± 0.82 2 (1) | 1.46 ± 0.8 1 (1) | 1.4 ± 0.69 1 (1) | p = 0.89 |
| Apfel (%) | 0.3 ± 0.13 0.21 (0.18) | 0.3 ± 0.14 0.39 (0.18) | 0.3 ± 0.15 0.21 (0.18) | 0.29 ± 0.12 0.21 (0.18) | p = 0.89 |
| PONV No/Yes | 155 (98.1%)/ 3 (1.9%) | 51 (96.2%)/ 2 (3.8%) | 52 (100%)/ 0 (0%) | 52 (98.1%)/ 1 (1.9%) | p = 0.25 |
| Number of patients declaring unacceptable PPP (NRS > 3) | 20 (12.7%) | 8 (15.1%) | 7 (13.5%) | 5 (9.4%) | p = 0.66 |
| Number of patients declaring acceptable PPP (NRS < 4) | 138 (87.3%) | 45 (84.9%) | 45 (86.5%) | 48 (90.6%) | p = 0.66 |
| NRS at admission to PACU | 0.7 ± 1.6 0 (0) | 1.1 ± 1.9 0 (2) | 0.7 ± 1.6 0 (0) | 0.2 ± 0.6 0 (0) | p = 0.08 |
| NRS 2 at discharge from PACU | 0.86 ± 1.7 0 (0) | 1 ± 1.9 0 (1) | 0.8 ± 1.6 0 (0) | 0.8 ± 1.6 0 (0) | p = 0.85 |
| Endoscopists’ satisfaction with quality of performed ISA (no/yes) | 5 (3.2%) / 153 (96.8%) | 3 (5.7%)/ 50 (94.3%) | 2 (3.8%)/ 50 (96.2%) | 0 (0%)/ 53 (100%) | p = 0.11 |
| Level of endoscopists’ satisfaction with quality of performed ISA using Likert scale (0–4) | 3.7 ± 0.5 4 (0) | 3.7 ± 0.6 4 (0) | 3.6 ± 0.7 4 (1) | 3.9 ± 0.3 4 (0) | p = 0.99 |
| Patient satisfaction with quality of performed ISA (no/yes) | 3 (1.9%)/ 155 (98.1%) | 2 (3.8%)/ 51 (96.2%) | 1 (1.9%)/ 51 (98.1%) | 0 (0%)/ 53 (100%) | p = 0.24 |
| Level of patient satisfaction with quality of performed ISA using Likert scale (0–4) | 3.9 ± 0.3 4 (0) | 3.8 ± 0.5 4 (0) | 3.9 ± 0.3 4 (0) | 4 ± 0.1 4 (0) | p = 0.09 |
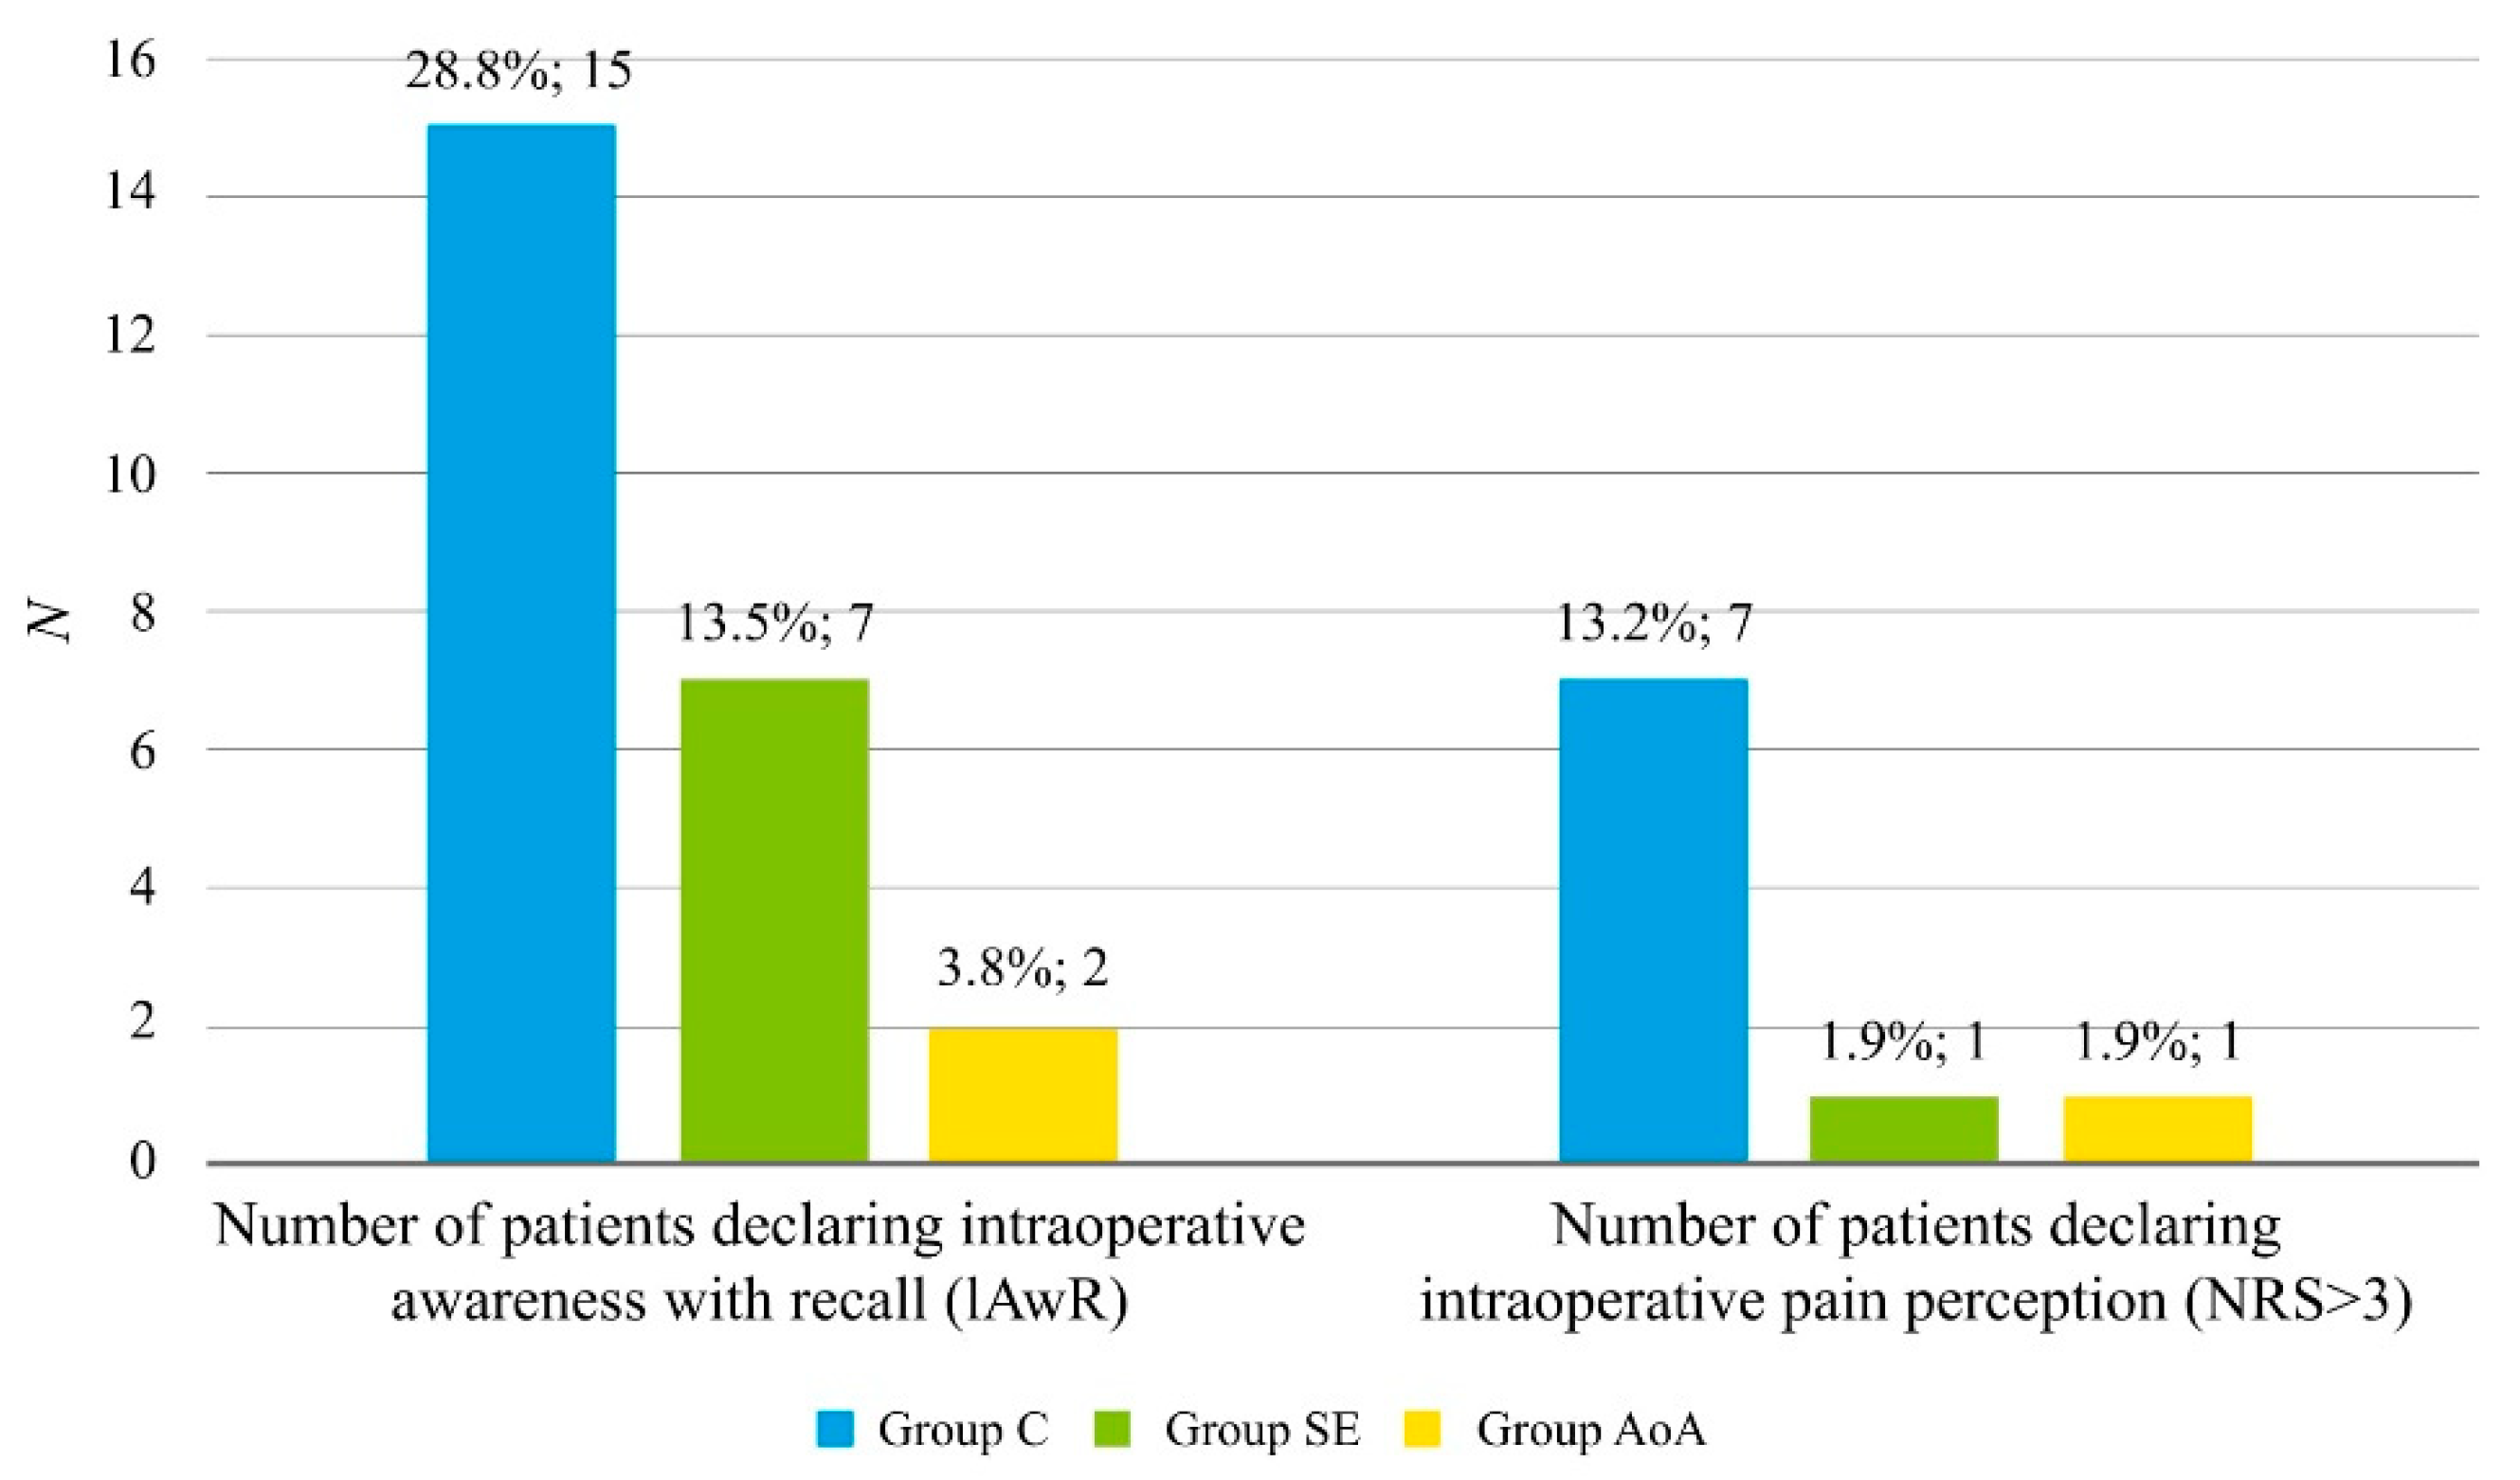
| Number of patients declaring intraprocedural awareness with recall (IAwR) | 24 (15.3%) | 15 (28.8%) | 7 (13.5%) | 2 (3.8%) | p = 0.001 p < 0.01 A |
| Number of patients declaring intraprocedural (IPP) (NRS > 3) | 9 (5.7%) | 7 (13.2%) | 1 (1.9%) | 1 (1.9%) | p = 0.02 p < 0.05 A |
| Value of IPP using NRS | 0.3 ± 1.3 0 (0) | 0.8 ± 2 0 (0) | 0.1 ± 0.7 0 (0) | 0 ± 0.3 0 (0) | p = 0.0003 p < 0.001 A |
| Parameter | Total n = 158 (100%) | Group C n = 53 (33.5%) | Group SE n = 52 (32.9%) | Group AoA n = 53 (33.5%) | p-Value |
|---|---|---|---|---|---|
| Stage 2—CP | |||||
| max HR (beats/min) | 76 ± 12.8 74 (15) | 77.6 ± 12.7 75 (20) | 73.3 ± 11.2 71.5 (12) | 77.1 ± 14 75 (16) | p = 0.19 |
| max SAP (mmHg) | 124.5 ± 26.7 119.5 (31) | 134.3 ± 27.2 128 (44) | 121.3 ± 27.3 116 (32.5) | 117.8 ± 23 115 (25) | p = 0.004 p < 0.01 A,B |
| max MAP (mmHg) | 90.9 ± 17.3 88.5 (22) | 95.9 ± 17.6 95 (21) | 89.5 ± 18.6 87 (26) | 87.2 ± 14.7 87 (20) | p = 0.03 p < 0.05 C |
| max DAP (mmHg) | 67 ± 13.3 65 (17) | 69.2 ± 13.4 69 (16) | 66.6 ± 14.3 65 (14.5) | 65.2 ± 12 62 (19) | p = 0.32 |
| max SE | 85 ± 7.3 87 (6) | - | 84.3 ± 7.4 87 (7.5) | 85.7 ± 7.2 88 (4) | p = 0.14 |
| max SPI | 53.1 ± 17.7 53 (26) | - | - | 53.1 ± 17.7 53 (26) | - |
| min HR (beats/min) | 60.4 ± 9.3 59 (13) | 60.4 ± 10.6 60 (15) | 59.2 ± 8.7 58 (13) | 61.6 ± 8.3 59 (10) | p = 0.42 |
| min SAP (mmHg) | 105.6 ± 21.6 105 (27) | 114.3 ± 22.8 116 (28) | 104.5 ± 21.7 107 (22) | 98.1 ± 17.2 100 (20) | p = 0.0004 p < 0.001 D |
| min MAP (mmHg) | 77.4 ± 14.4 79 (19) | 82.4 ± 14.9 82 (22) | 76.3 ± 14.5 78.5 (17) | 73.6 ± 12.4 74 (14) | p = 0.005 p < 0.01 A |
| min DAP (mmHg) | 56.5 ± 11.7 56 (15) | 60.1 ± 11.7 60 (19) | 55.4 ± 12.4 56 (13.5) | 53.9 ± 10.3 54 (13) | p = 0.02 p < 0.05 C |
| min SE | 45.7 ± 14.2 48 (21) | 45.6 ± 12.6 48.5 (18) | 45.5 ± 15.5 47 (24) | p = 0.97 | |
| min SPI | 23.8 ± 12.8 20 (12) | - | - | 23.8 ± 12.8 20 (12) | - |
| Stage 3 –PACU | |||||
| max HR (beats/min) | 72.3 ± 11.6 71 (18) | 71.7 ± 12.7 70 (19.5) | 72.6 ± 10.3 71 (11) | 72.5 ± 11.8 71 (22) | p = 0.93 |
| max SAP (mmHg) | 119.5 ± 22.8 117 (29) | 123.8 ± 27 121 (39) | 121.1 ± 22.6 119.5 (28) | 113.6 ± 16.9 112 (27) | p = 0.12 |
| max MAP (mmHg) | 87.3 ± 15.2 86 (20) | 89.2 ± 18.2 90 (26) | 88.1 ± 14.7 84.5 (19.5) | 84.6 ± 12 85 (20) | p = 0.34 |
| max DAP (mmHg) | 65.2 ± 12.4 65 (18) | 65.7 ± 13.9 67 (21) | 66.3 ± 12.3 66 (19) | 63.7 ± 10.8 64 (13) | p = 0.56 |
| max SE | 88.6 ± 5.8 90 (1) | - | 89.3 ± 2.7 90 (2) | 88 ± 7.7 90 (1) | p = 0.46 |
| max SPI | 52 ± 16.1 48 (25.5) | - | - | 52 ± 16.1 48 (25.5) | - |
| min HR (beats/min) | 63.4 ± 9.5 62 (12) | 64.5 ± 10.3 65.5 (16) | 63.5 ± 9.4 62 (12) | 62.3 ± 8.7 61 (10) | p = 0.51 |
| min SAP (mmHg) | 106.9 ± 21.3 105 (29) | 113.8 ± 25.2 115.5 (35) | 106.4 ± 20.2 103.5 (24) | 100.7 ± 15.8 100 (17) | p = 0.009 p < 0.01 A |
| min MAP (mmHg) | 78.1 ± 13.9 77 (20) | 82.6 ± 15.8 83.5 (22.5) | 77.6 ± 13.6 77 (17.5) | 74.3 ± 11.1 72 (15) | p = 0.01 p < 0.05 C |
| min DAP (mmHg) | 56.9 ± 11.6 56 (16) | 59.8 ± 12.1 60.5 (19.4) | 56.4 ± 12.2 56 (16) | 54.5 ± 10 53 (15) | p = 0.06 |
| min SPI | 27 ± 14.9 23 (14) | - | - | 25.1 ± 11.2 23 (10) | - |
| Correlation | Total n (100%) | Yes | No | % Yes/No | p-Value |
|---|---|---|---|---|---|
| SPI max vs. HR max | 48 (90.6%) | 26 (49.1%) | 22 (41.5%) | 118.2% | p = 0.43 |
| SPI max vs. MAP max | 41 (77.4%) | 15 (28.3%) | 26 (49.1%) | 57.7% | p = 0.03 p < 0.05 A |
| SPI min vs. HR min | 50 (94.3%) | 23 (43.4%) | 27 (50.9%) | 85.2% | p = 0.44 |
| SPI min vs. MAP min | 31 (58.5%) | 14 (26.4%) | 17 (32.1%) | 82.4% | p = 0.52 |
Publisher’s Note: MDPI stays neutral with regard to jurisdictional claims in published maps and institutional affiliations. |
© 2021 by the authors. Licensee MDPI, Basel, Switzerland. This article is an open access article distributed under the terms and conditions of the Creative Commons Attribution (CC BY) license (https://creativecommons.org/licenses/by/4.0/).
Share and Cite
Stasiowski, M.J.; Starzewska, M.; Niewiadomska, E.; Król, S.; Marczak, K.; Żak, J.; Pluta, A.; Eszyk, J.; Grabarek, B.O.; Szumera, I.; et al. Adequacy of Anesthesia Guidance for Colonoscopy Procedures. Pharmaceuticals 2021, 14, 464. https://0-doi-org.brum.beds.ac.uk/10.3390/ph14050464
Stasiowski MJ, Starzewska M, Niewiadomska E, Król S, Marczak K, Żak J, Pluta A, Eszyk J, Grabarek BO, Szumera I, et al. Adequacy of Anesthesia Guidance for Colonoscopy Procedures. Pharmaceuticals. 2021; 14(5):464. https://0-doi-org.brum.beds.ac.uk/10.3390/ph14050464
Chicago/Turabian StyleStasiowski, Michał Jan, Małgorzata Starzewska, Ewa Niewiadomska, Seweryn Król, Kaja Marczak, Jakub Żak, Aleksandra Pluta, Jerzy Eszyk, Beniamin Oskar Grabarek, Izabela Szumera, and et al. 2021. "Adequacy of Anesthesia Guidance for Colonoscopy Procedures" Pharmaceuticals 14, no. 5: 464. https://0-doi-org.brum.beds.ac.uk/10.3390/ph14050464