
Neuroprotective Effects of Tripeptides—Epigenetic Regulators in Mouse Model of Alzheimer’s Disease

 , , ,
, , ,
Abstract
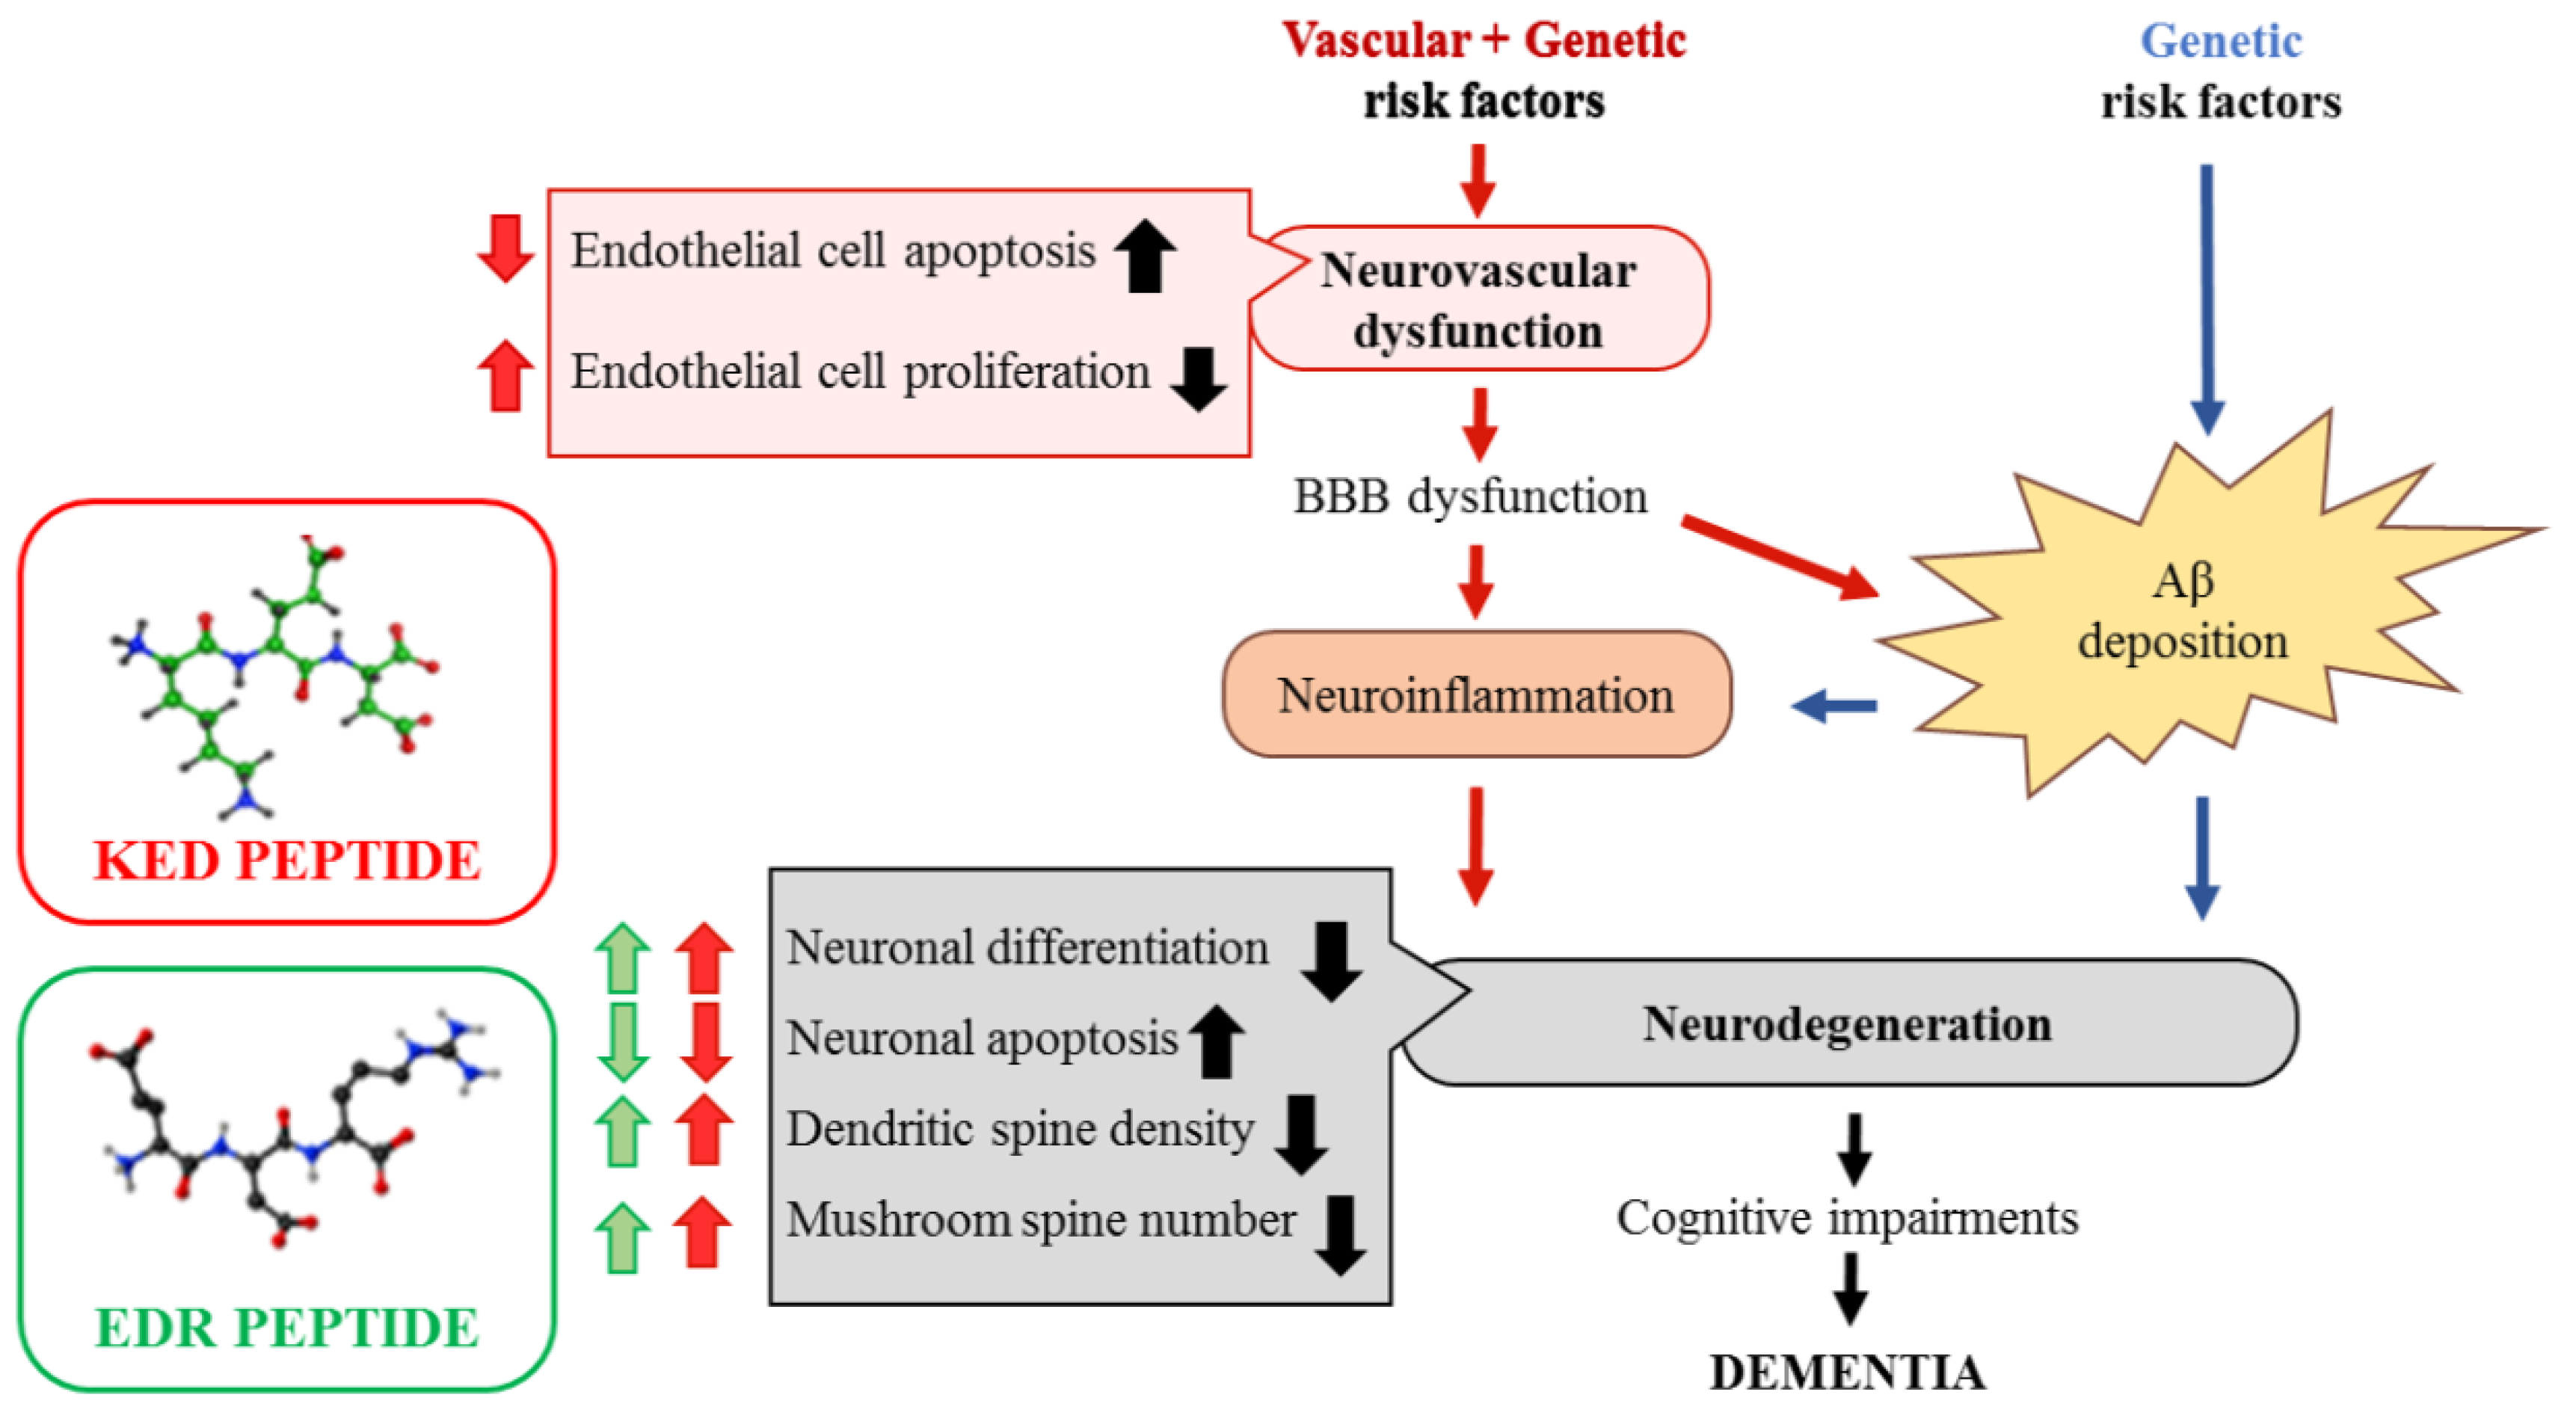
:1. Introduction
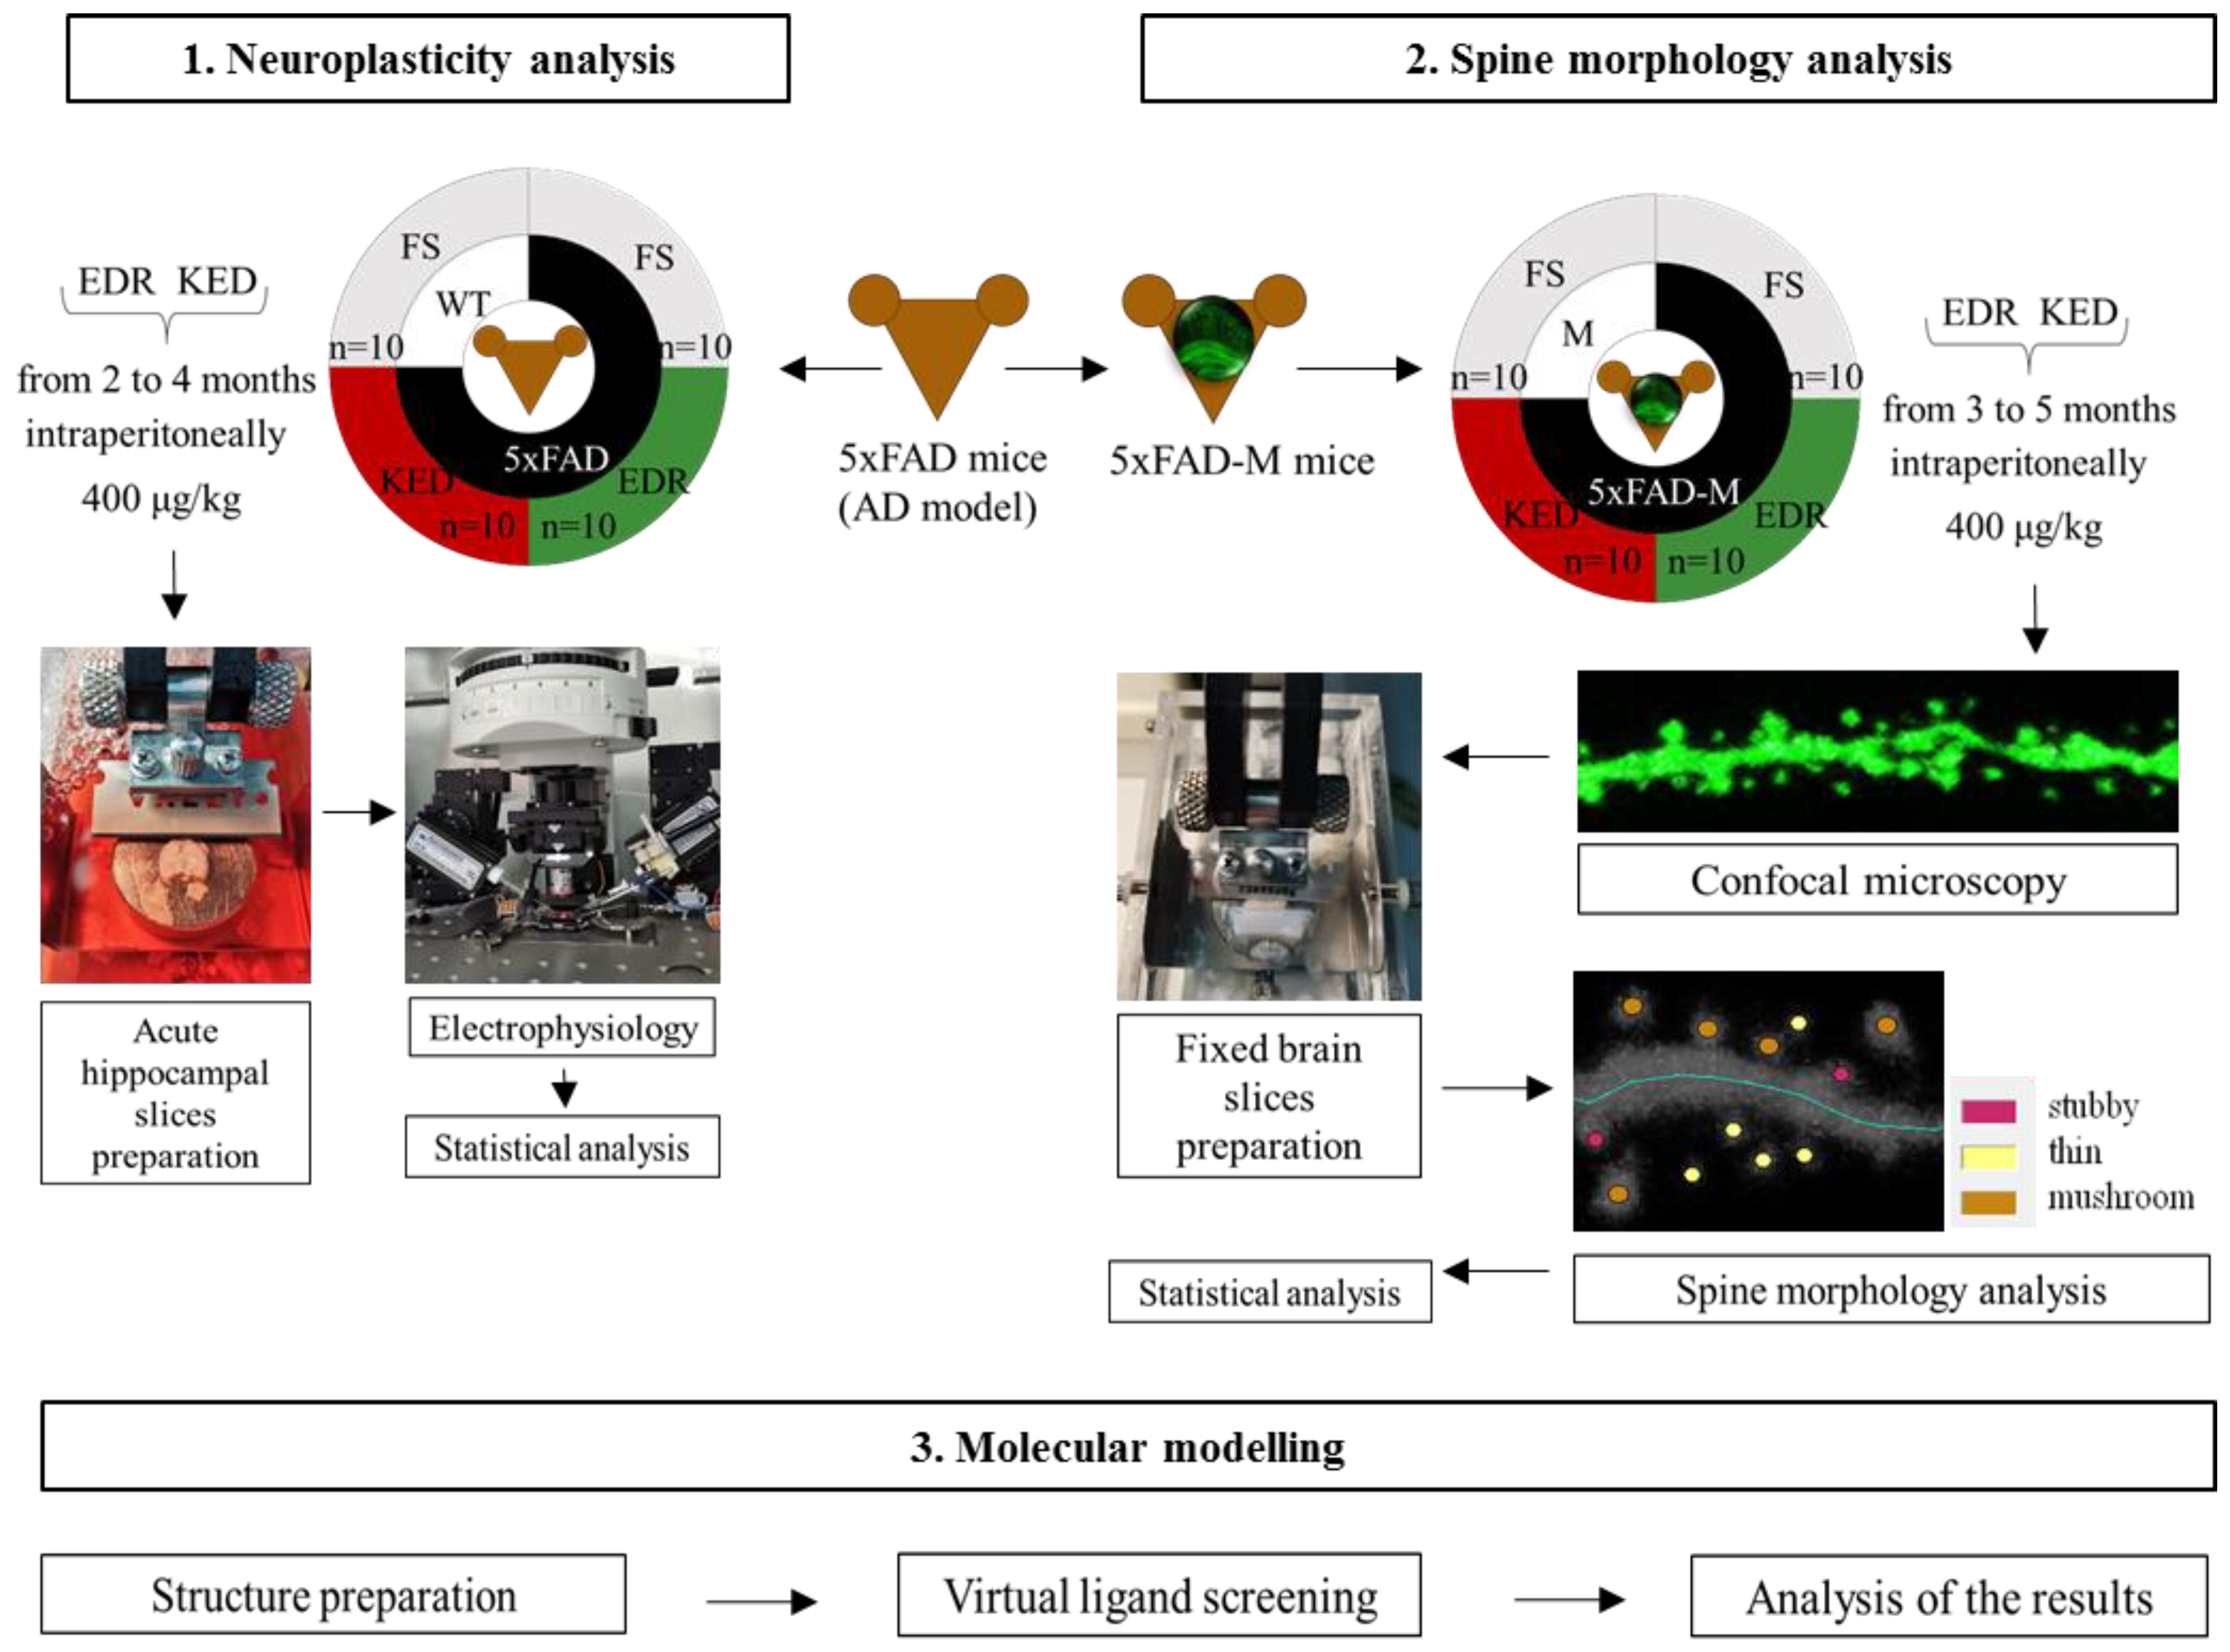
2. Results
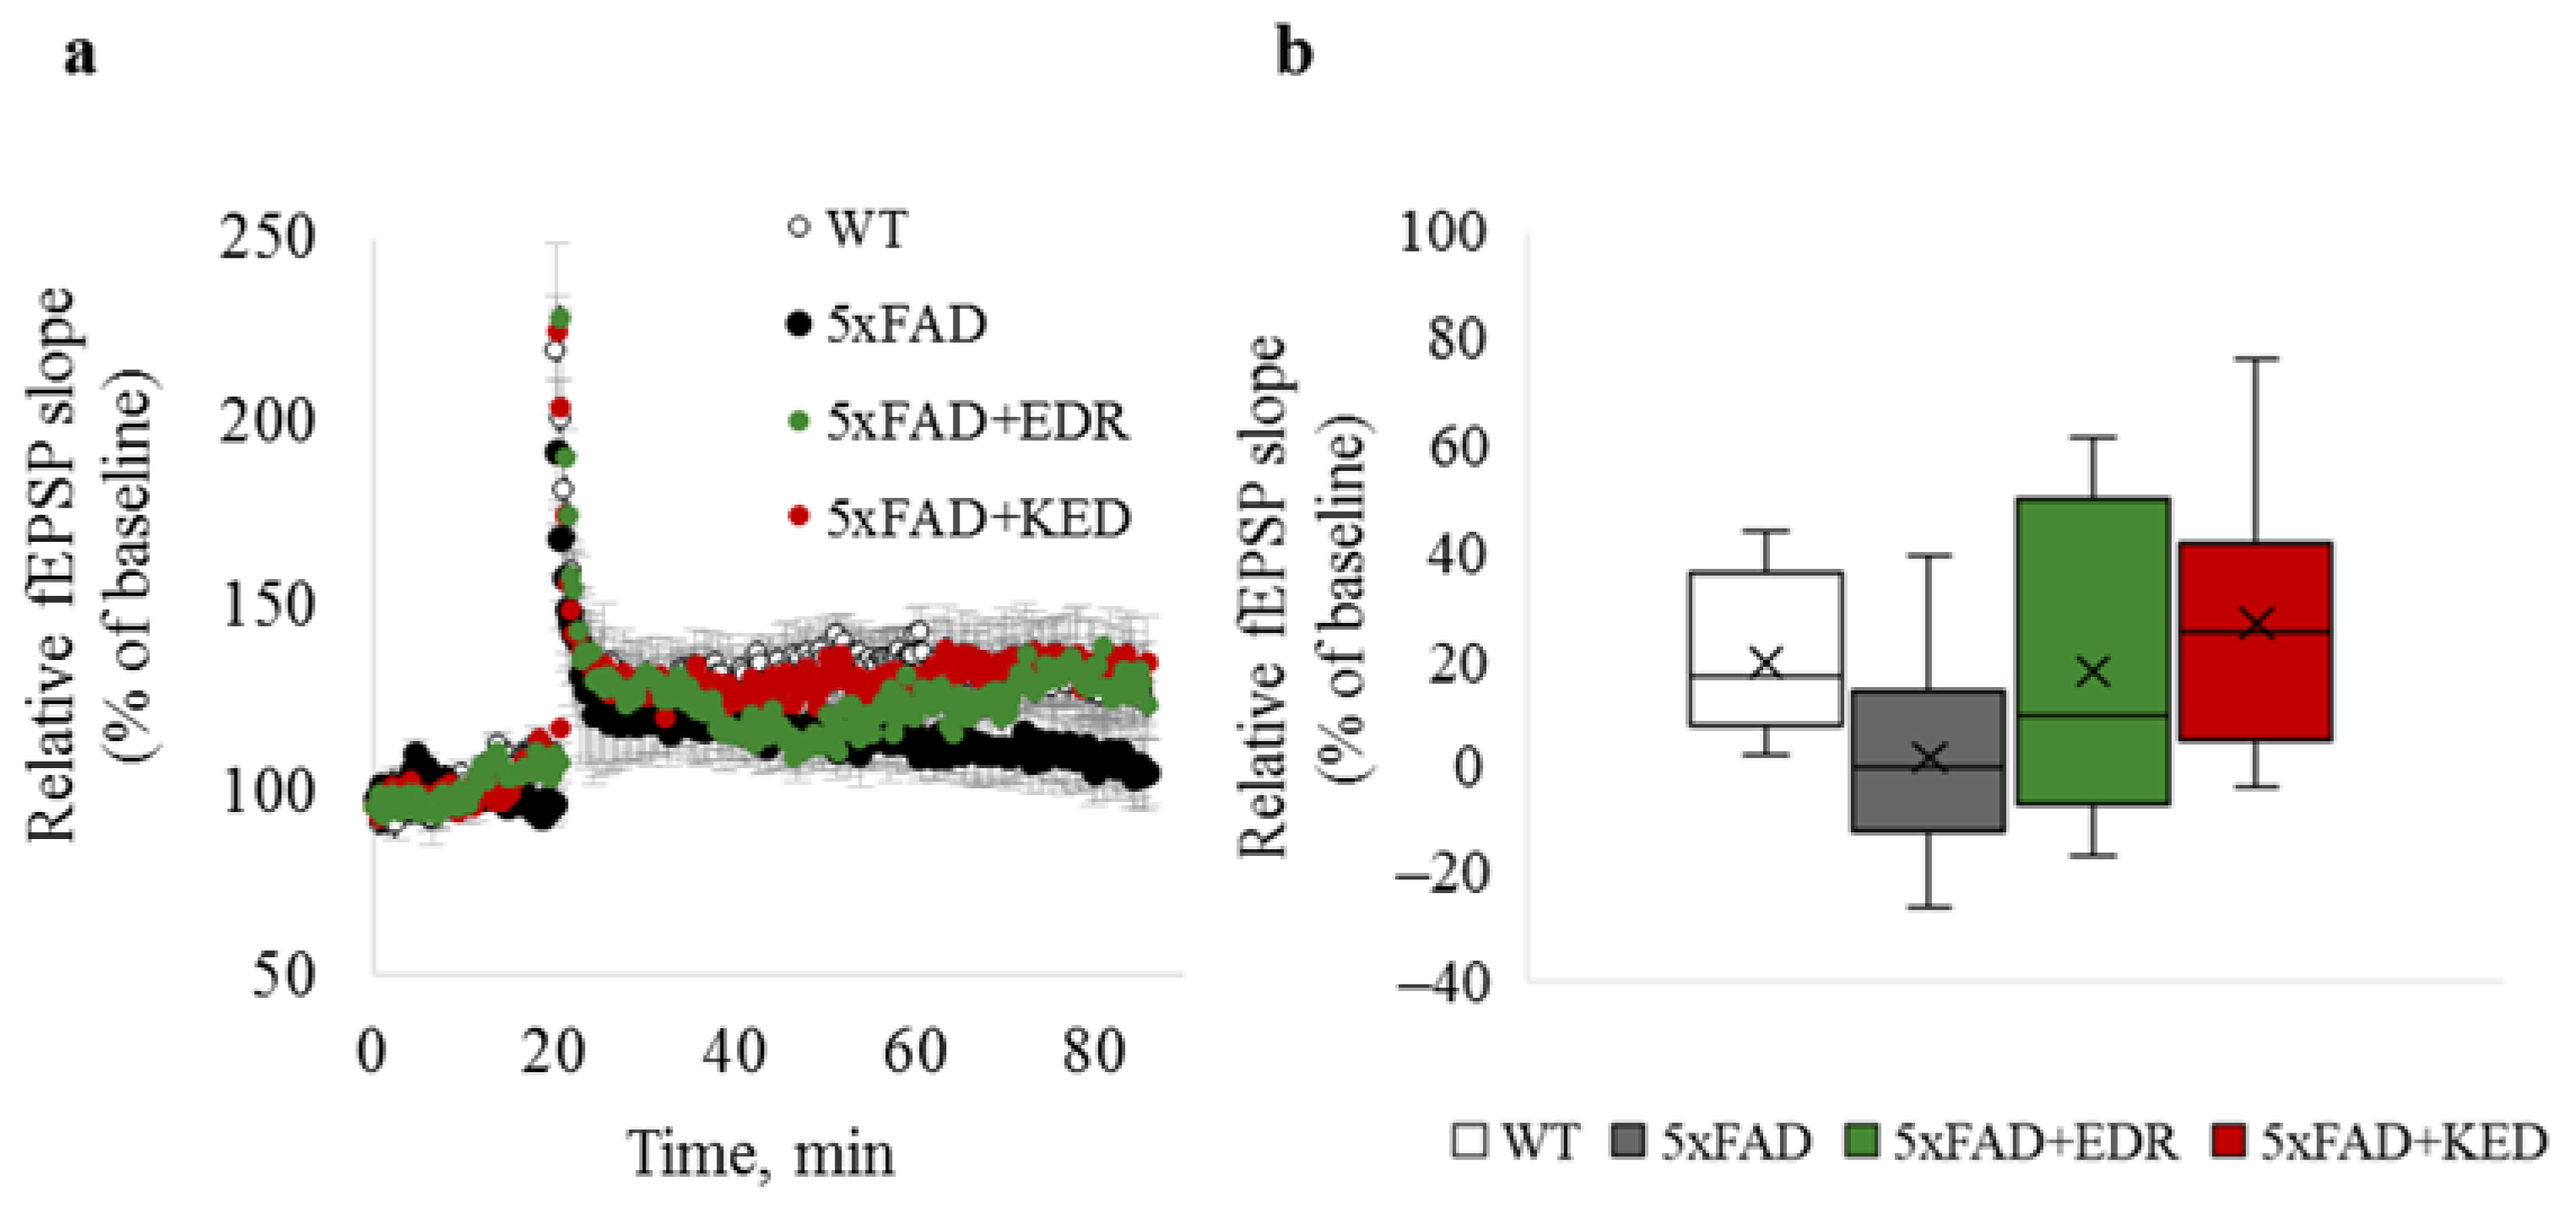
2.1. Effects of Tripeptides on LTP in Hippocampus of 5xFAD Mice in AD
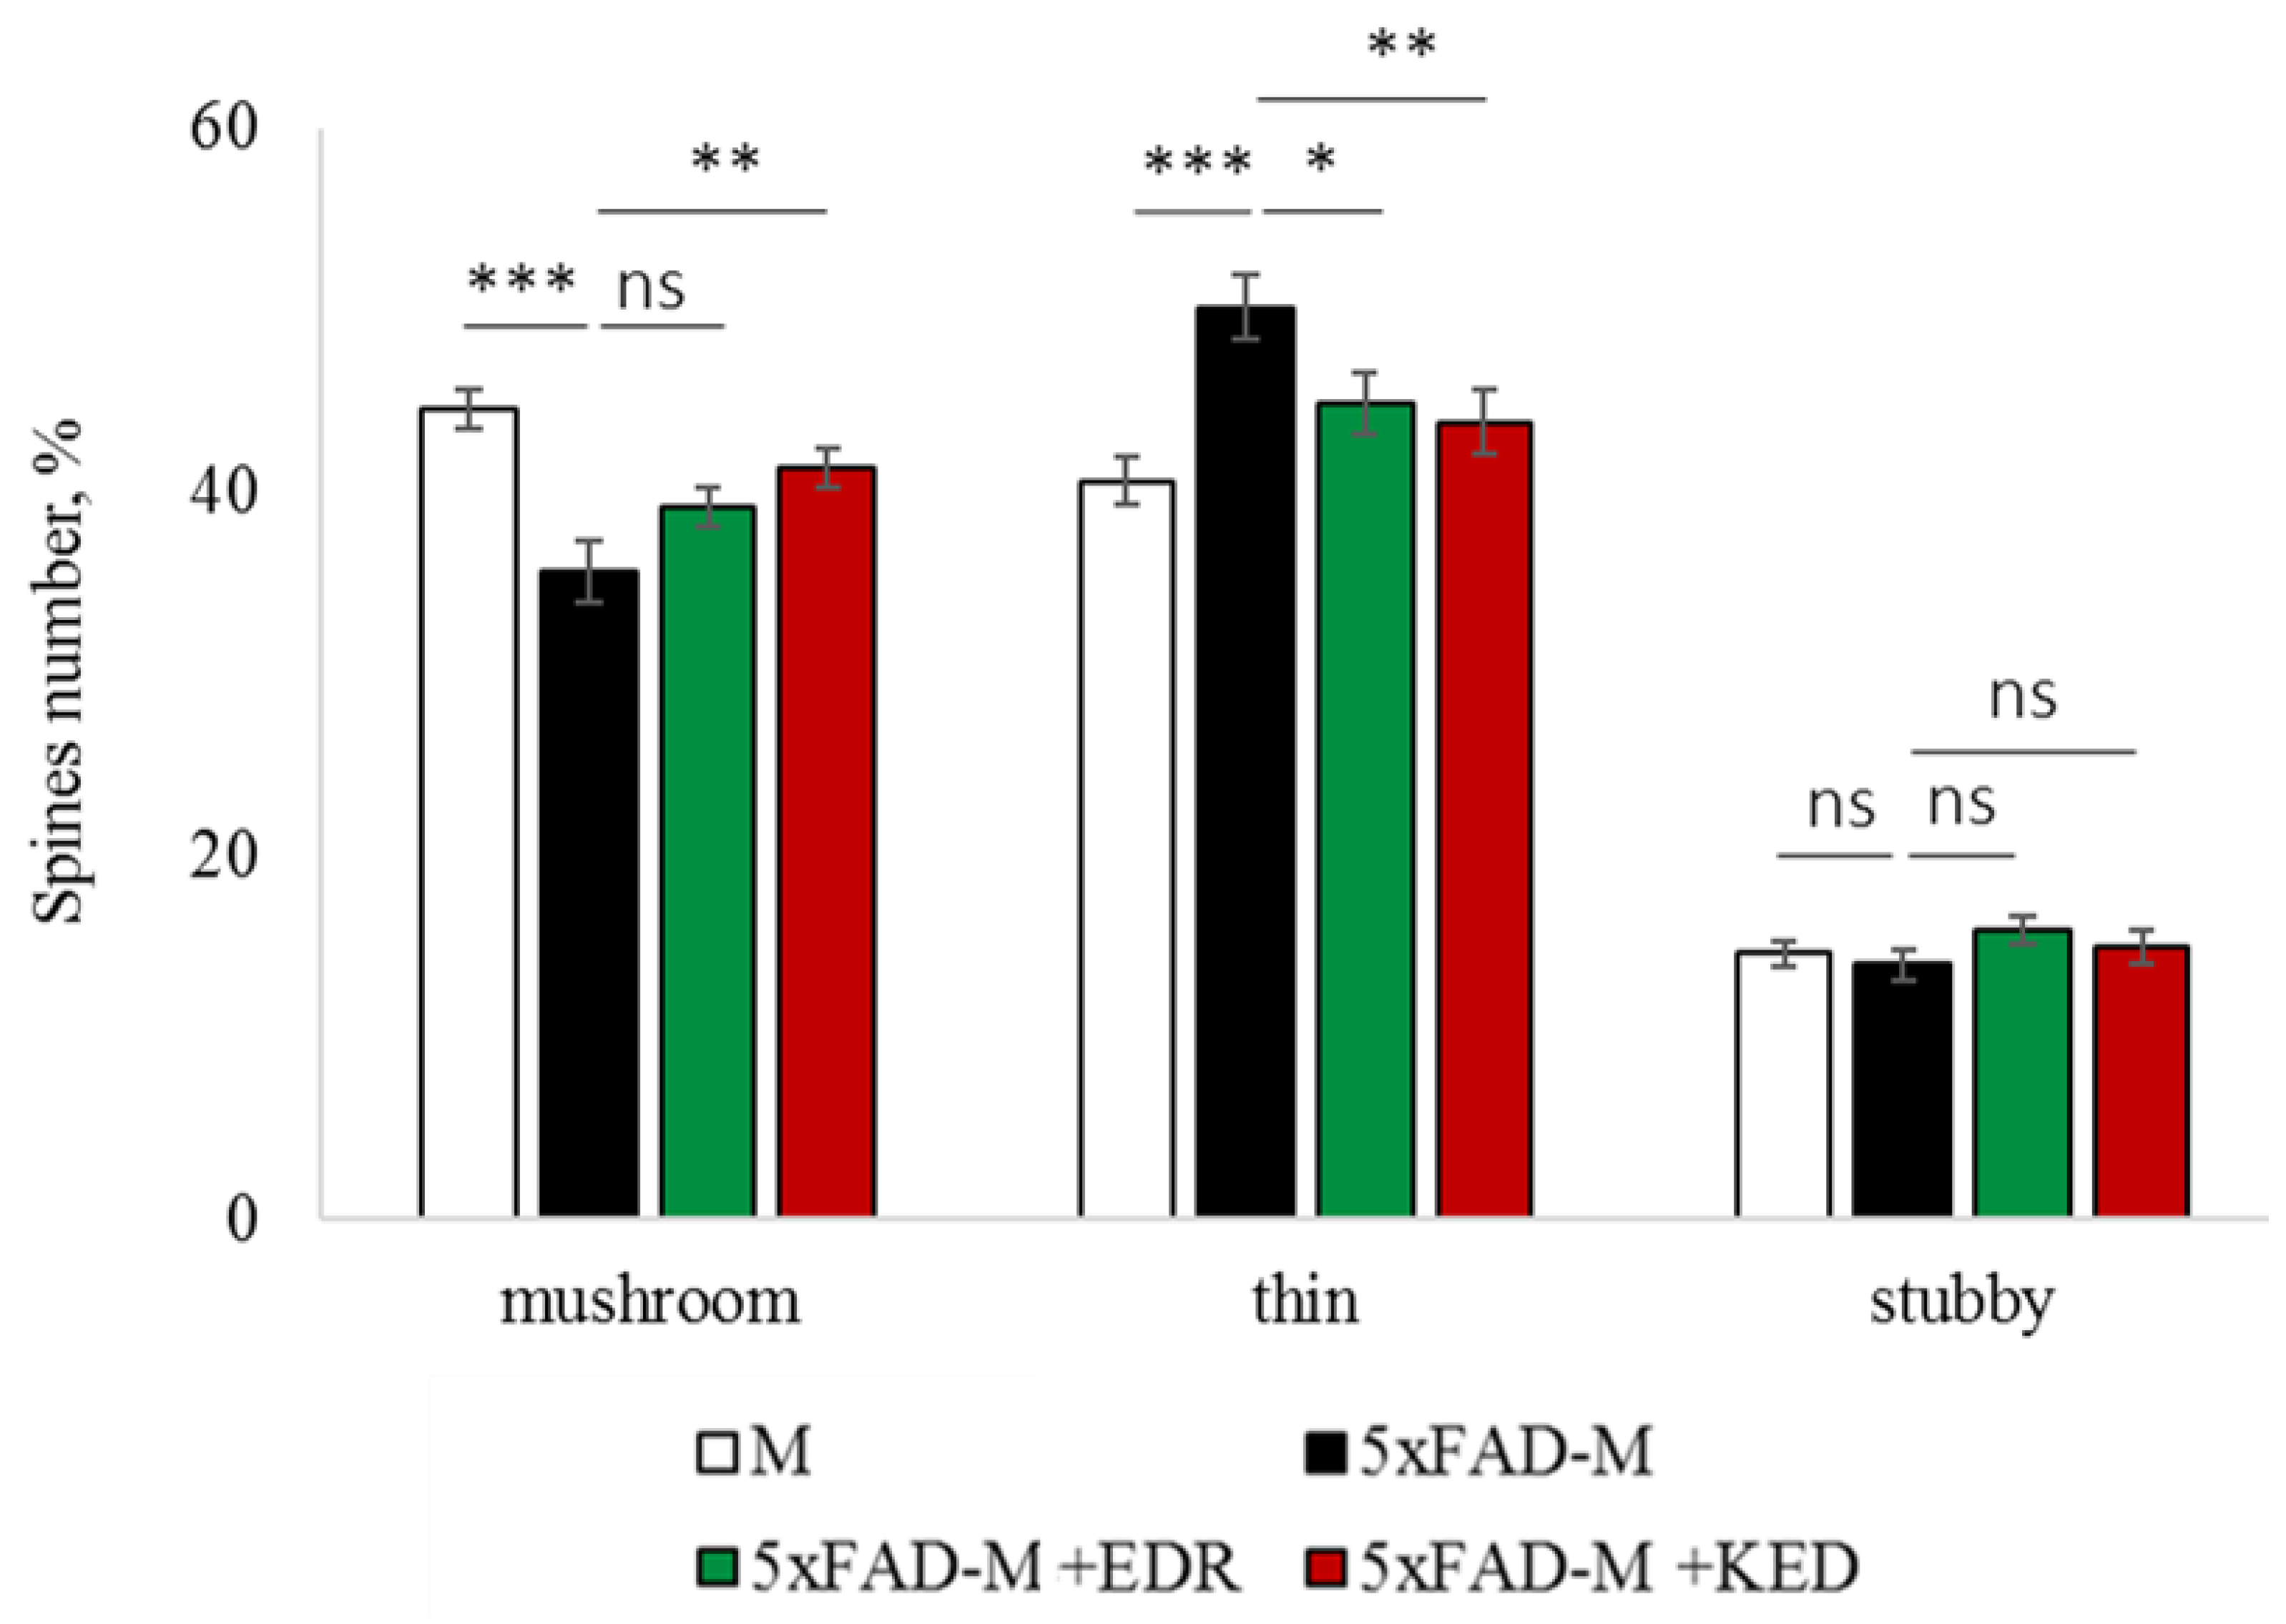
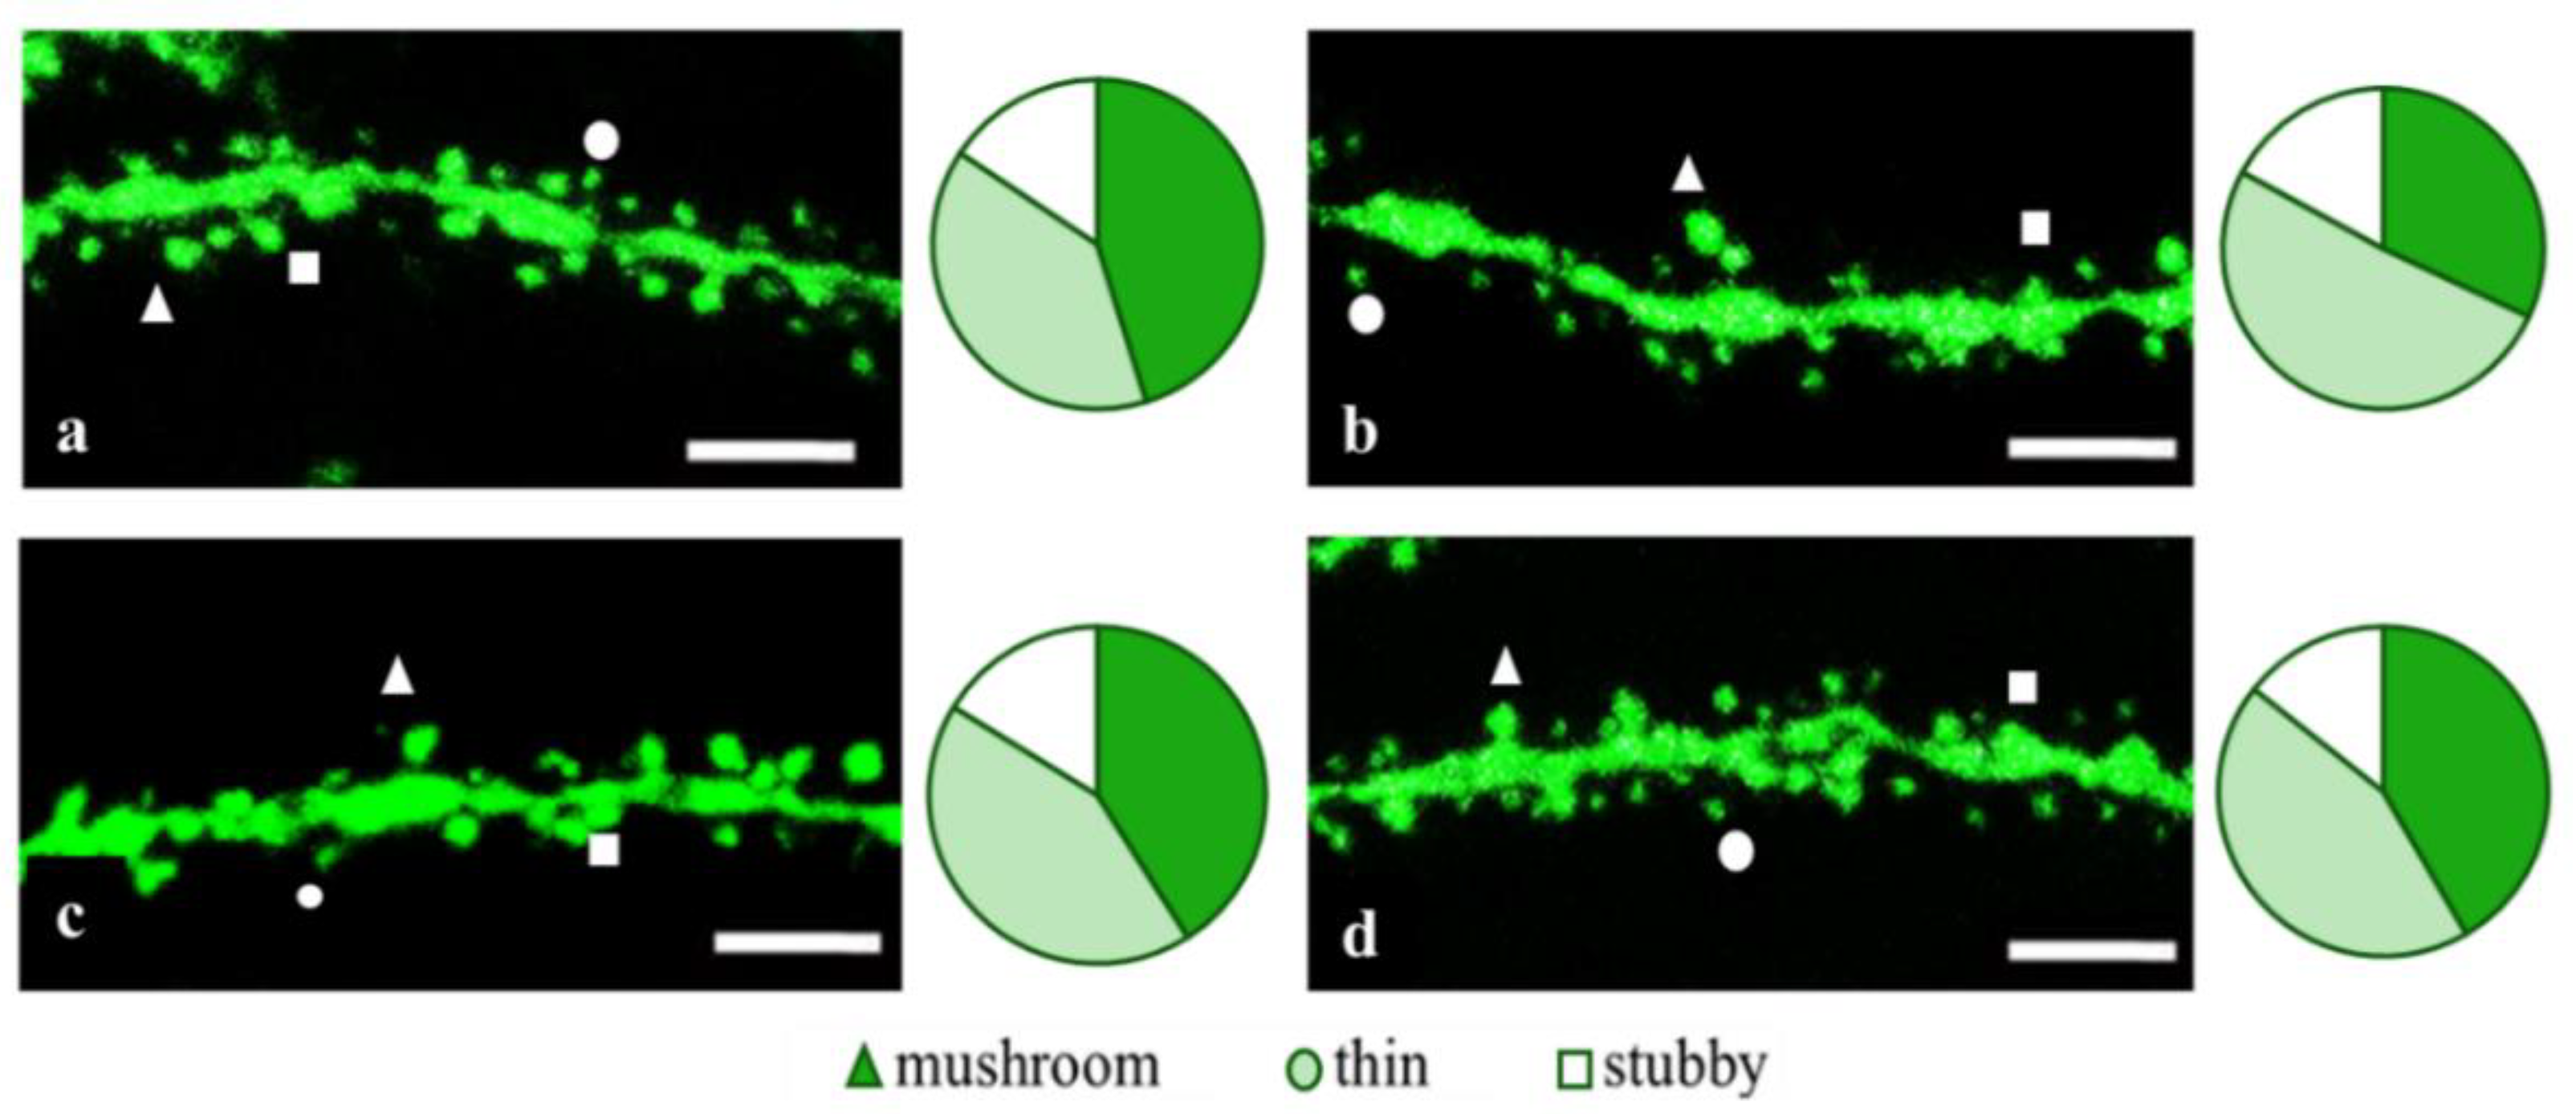
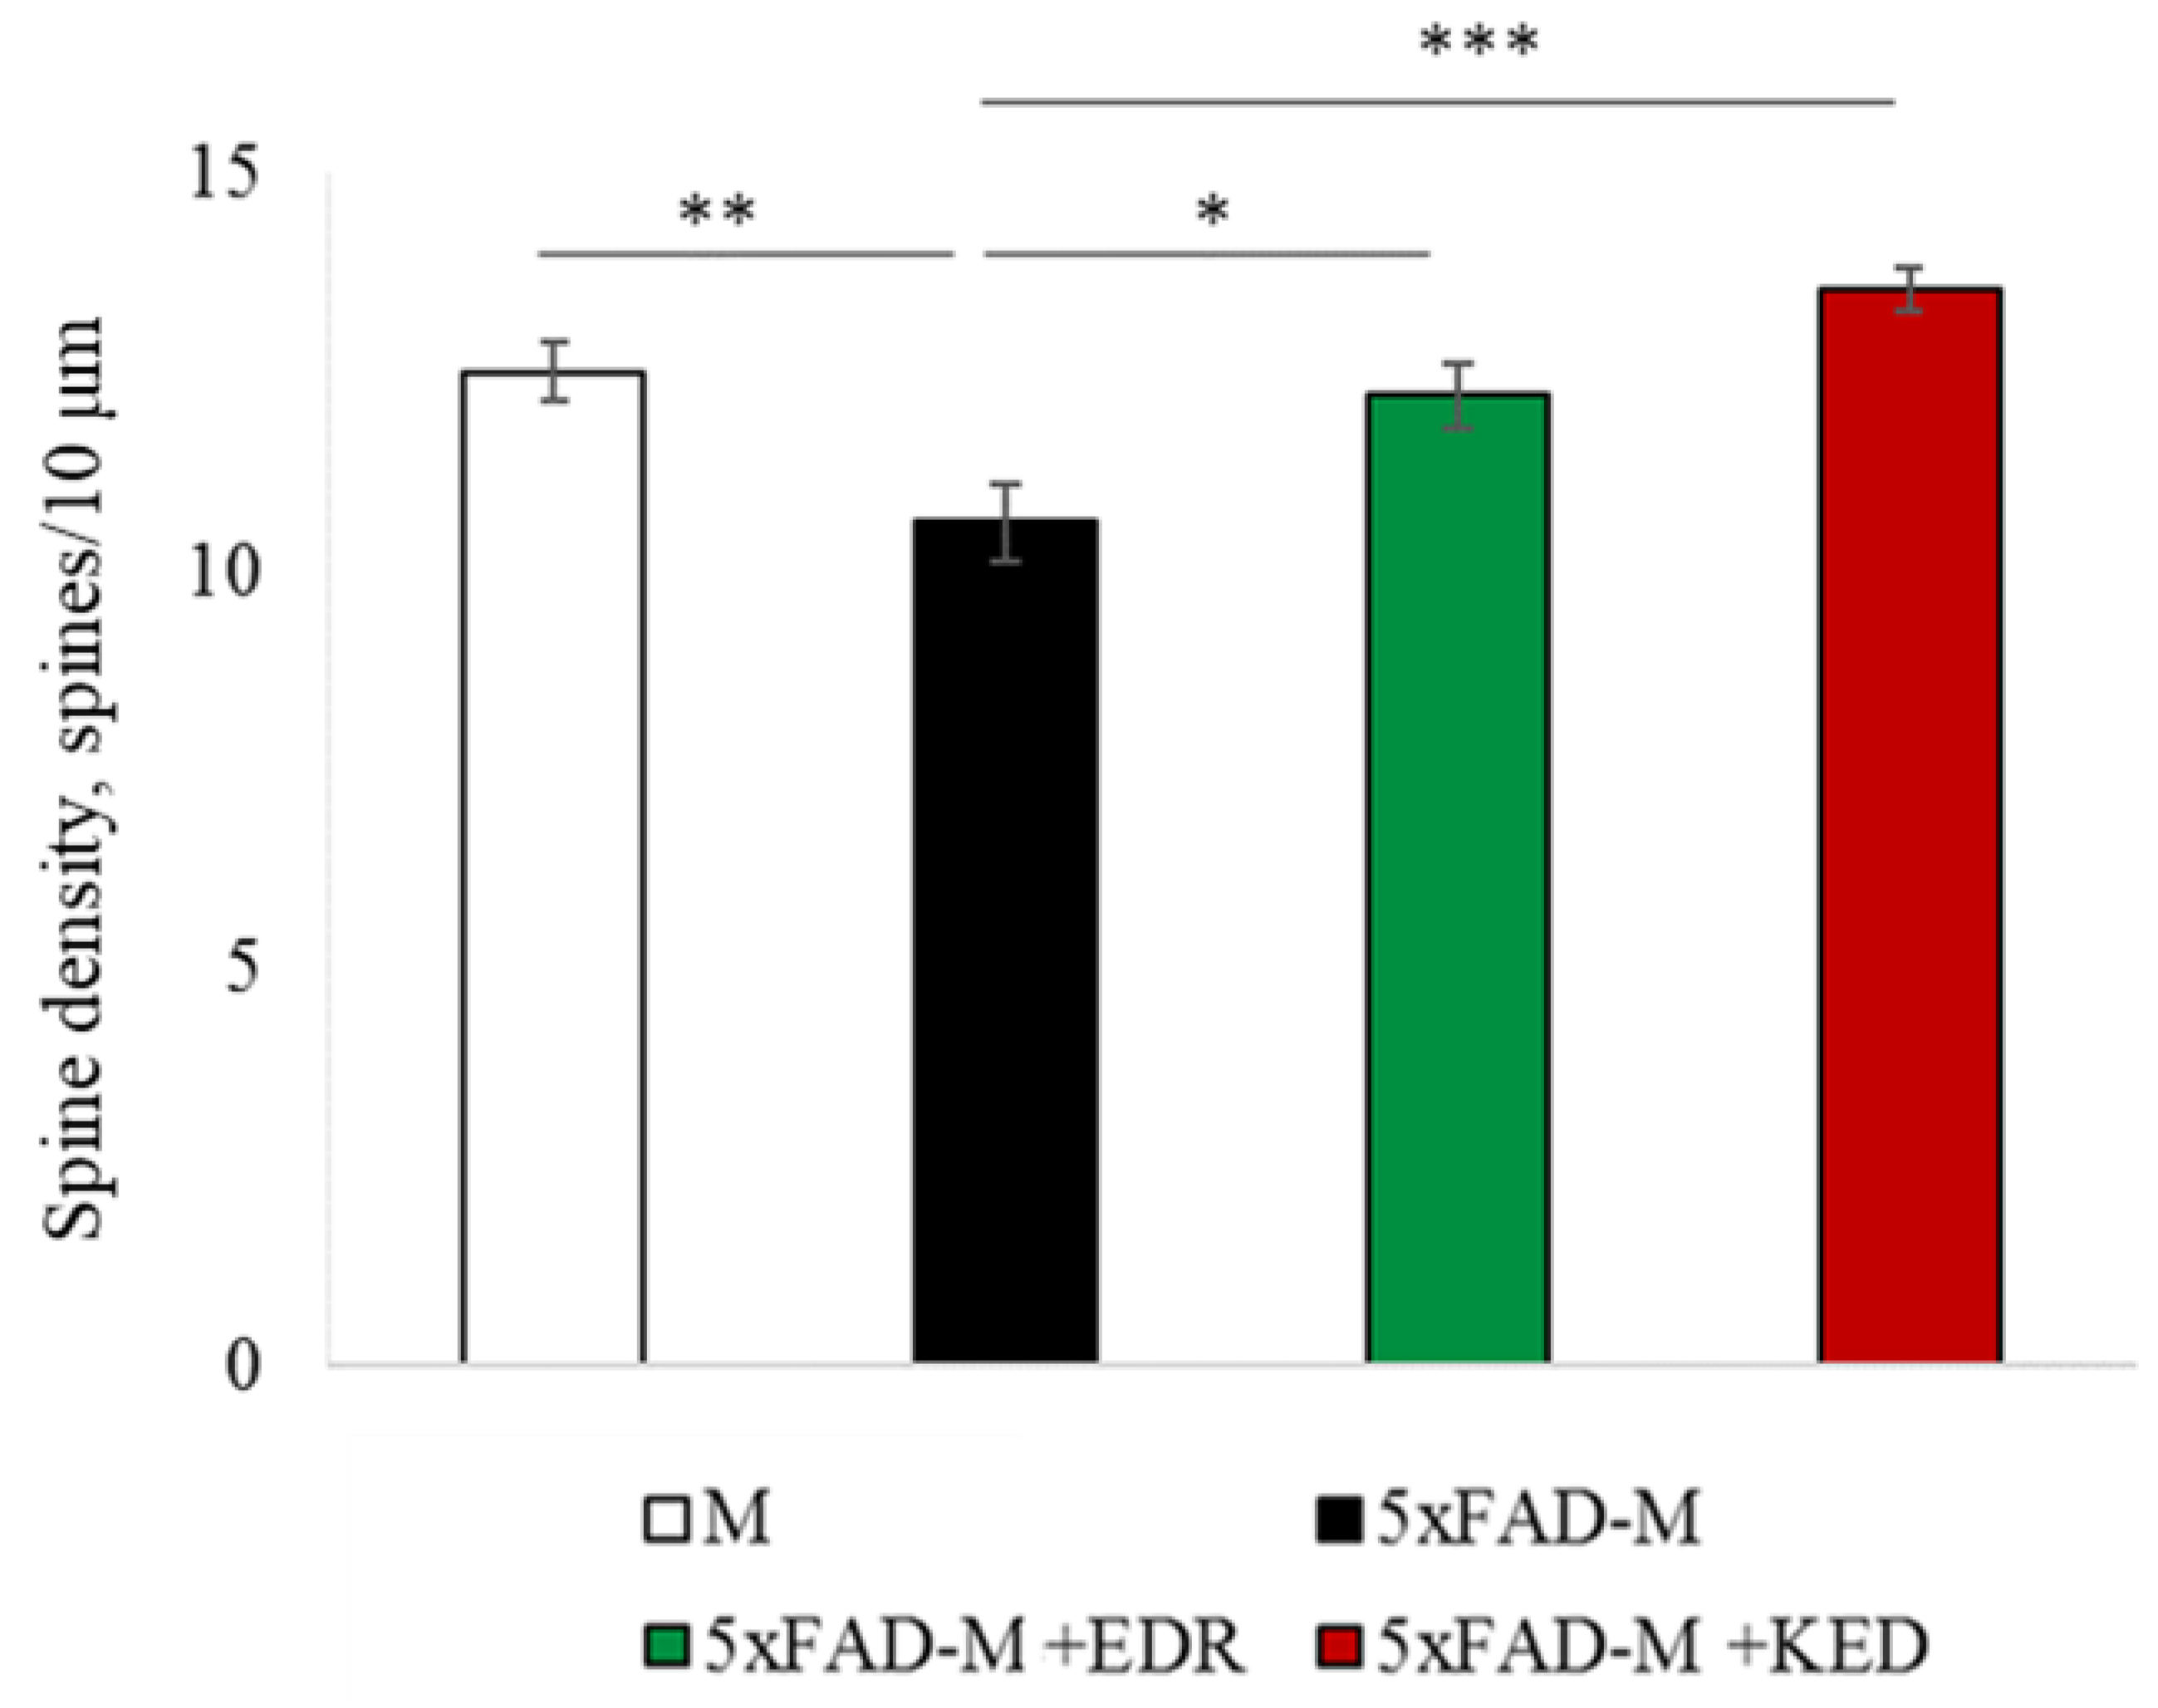
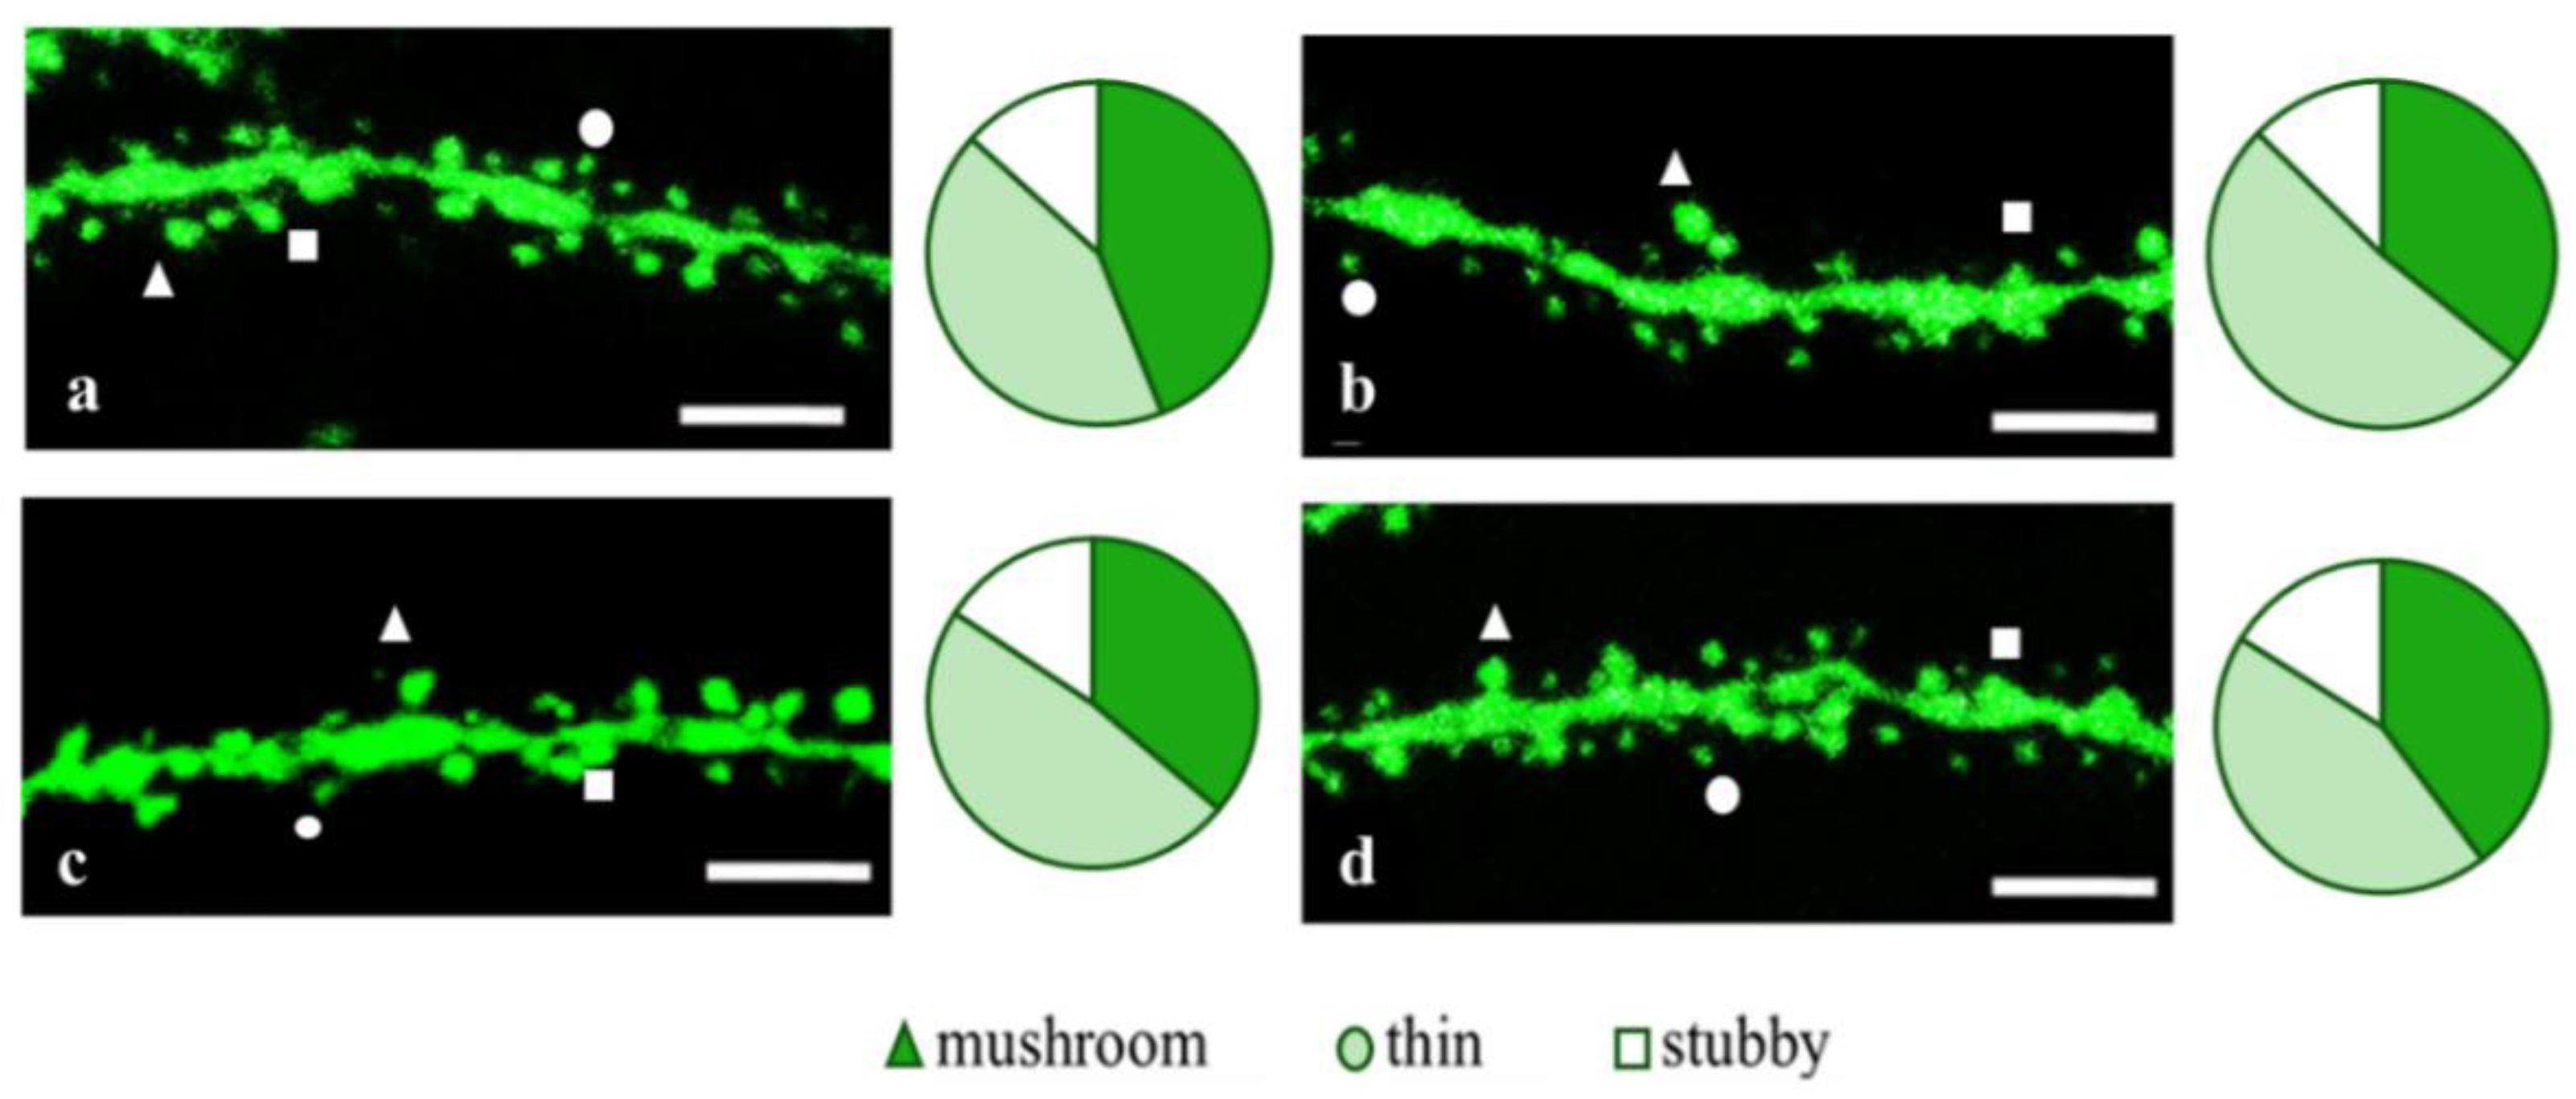
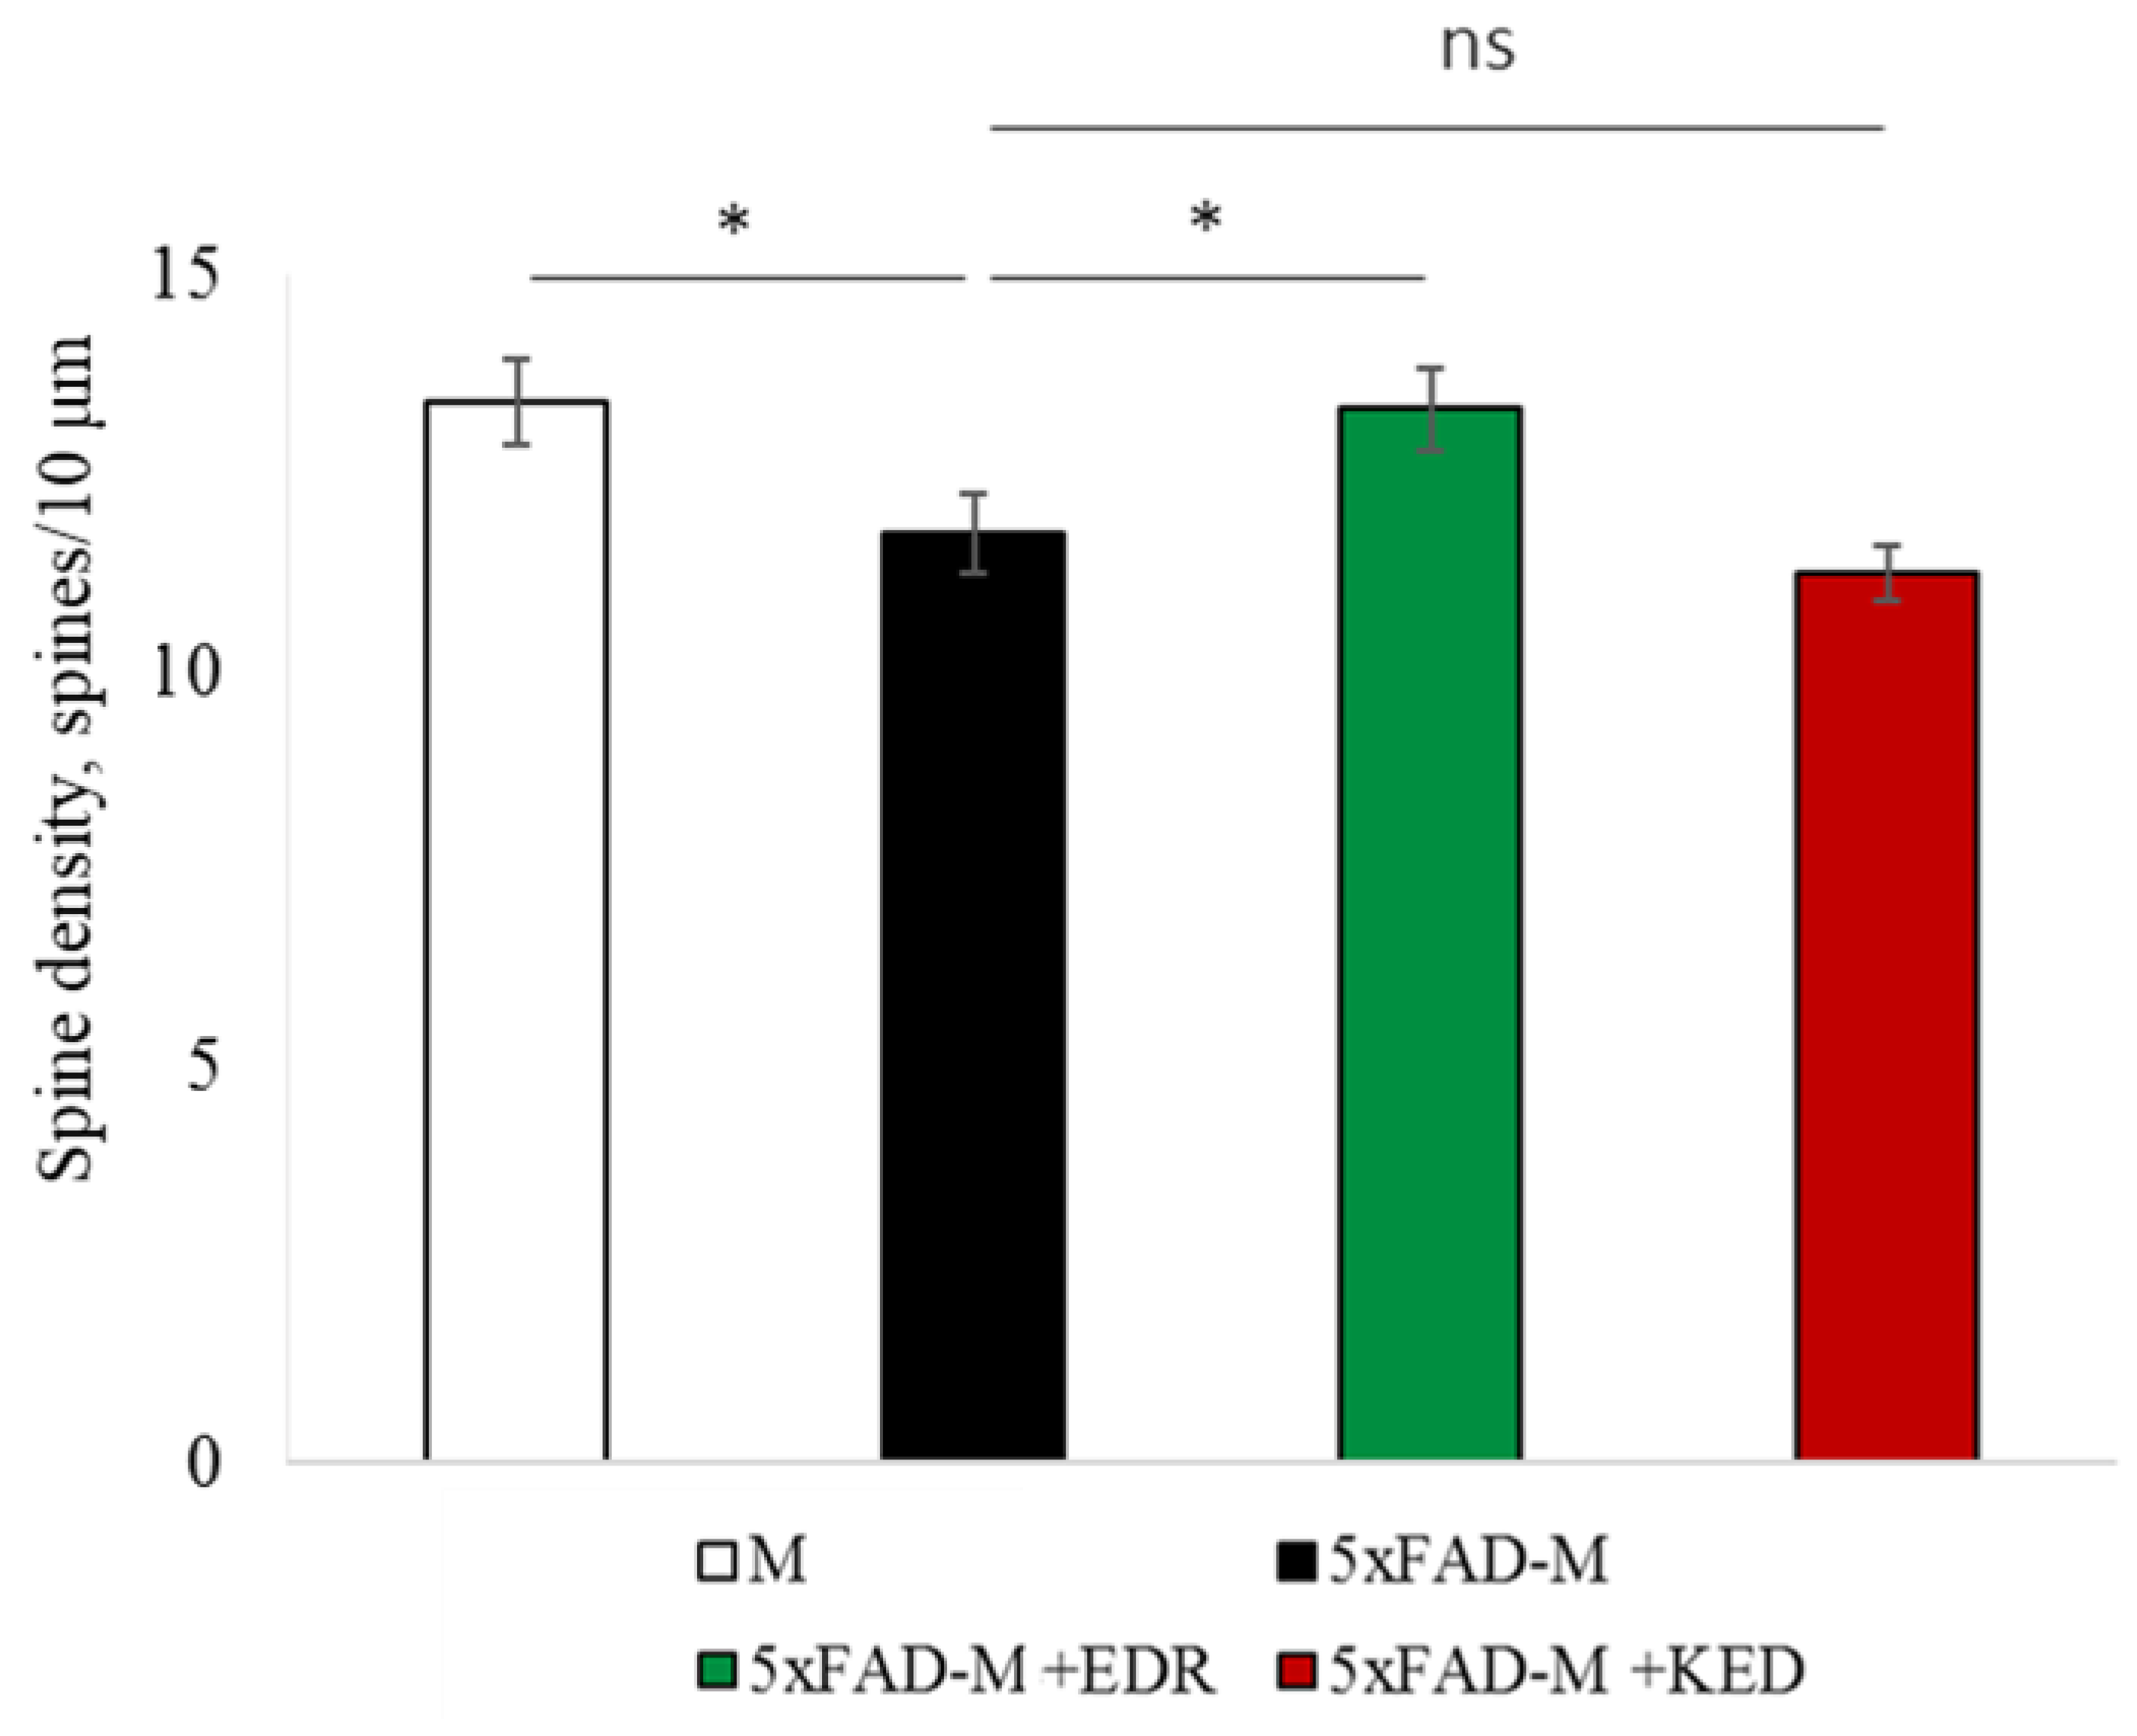
2.2. Effects of Tripeptides on the Neuron Morphology of 5xFAD-M Mice in AD
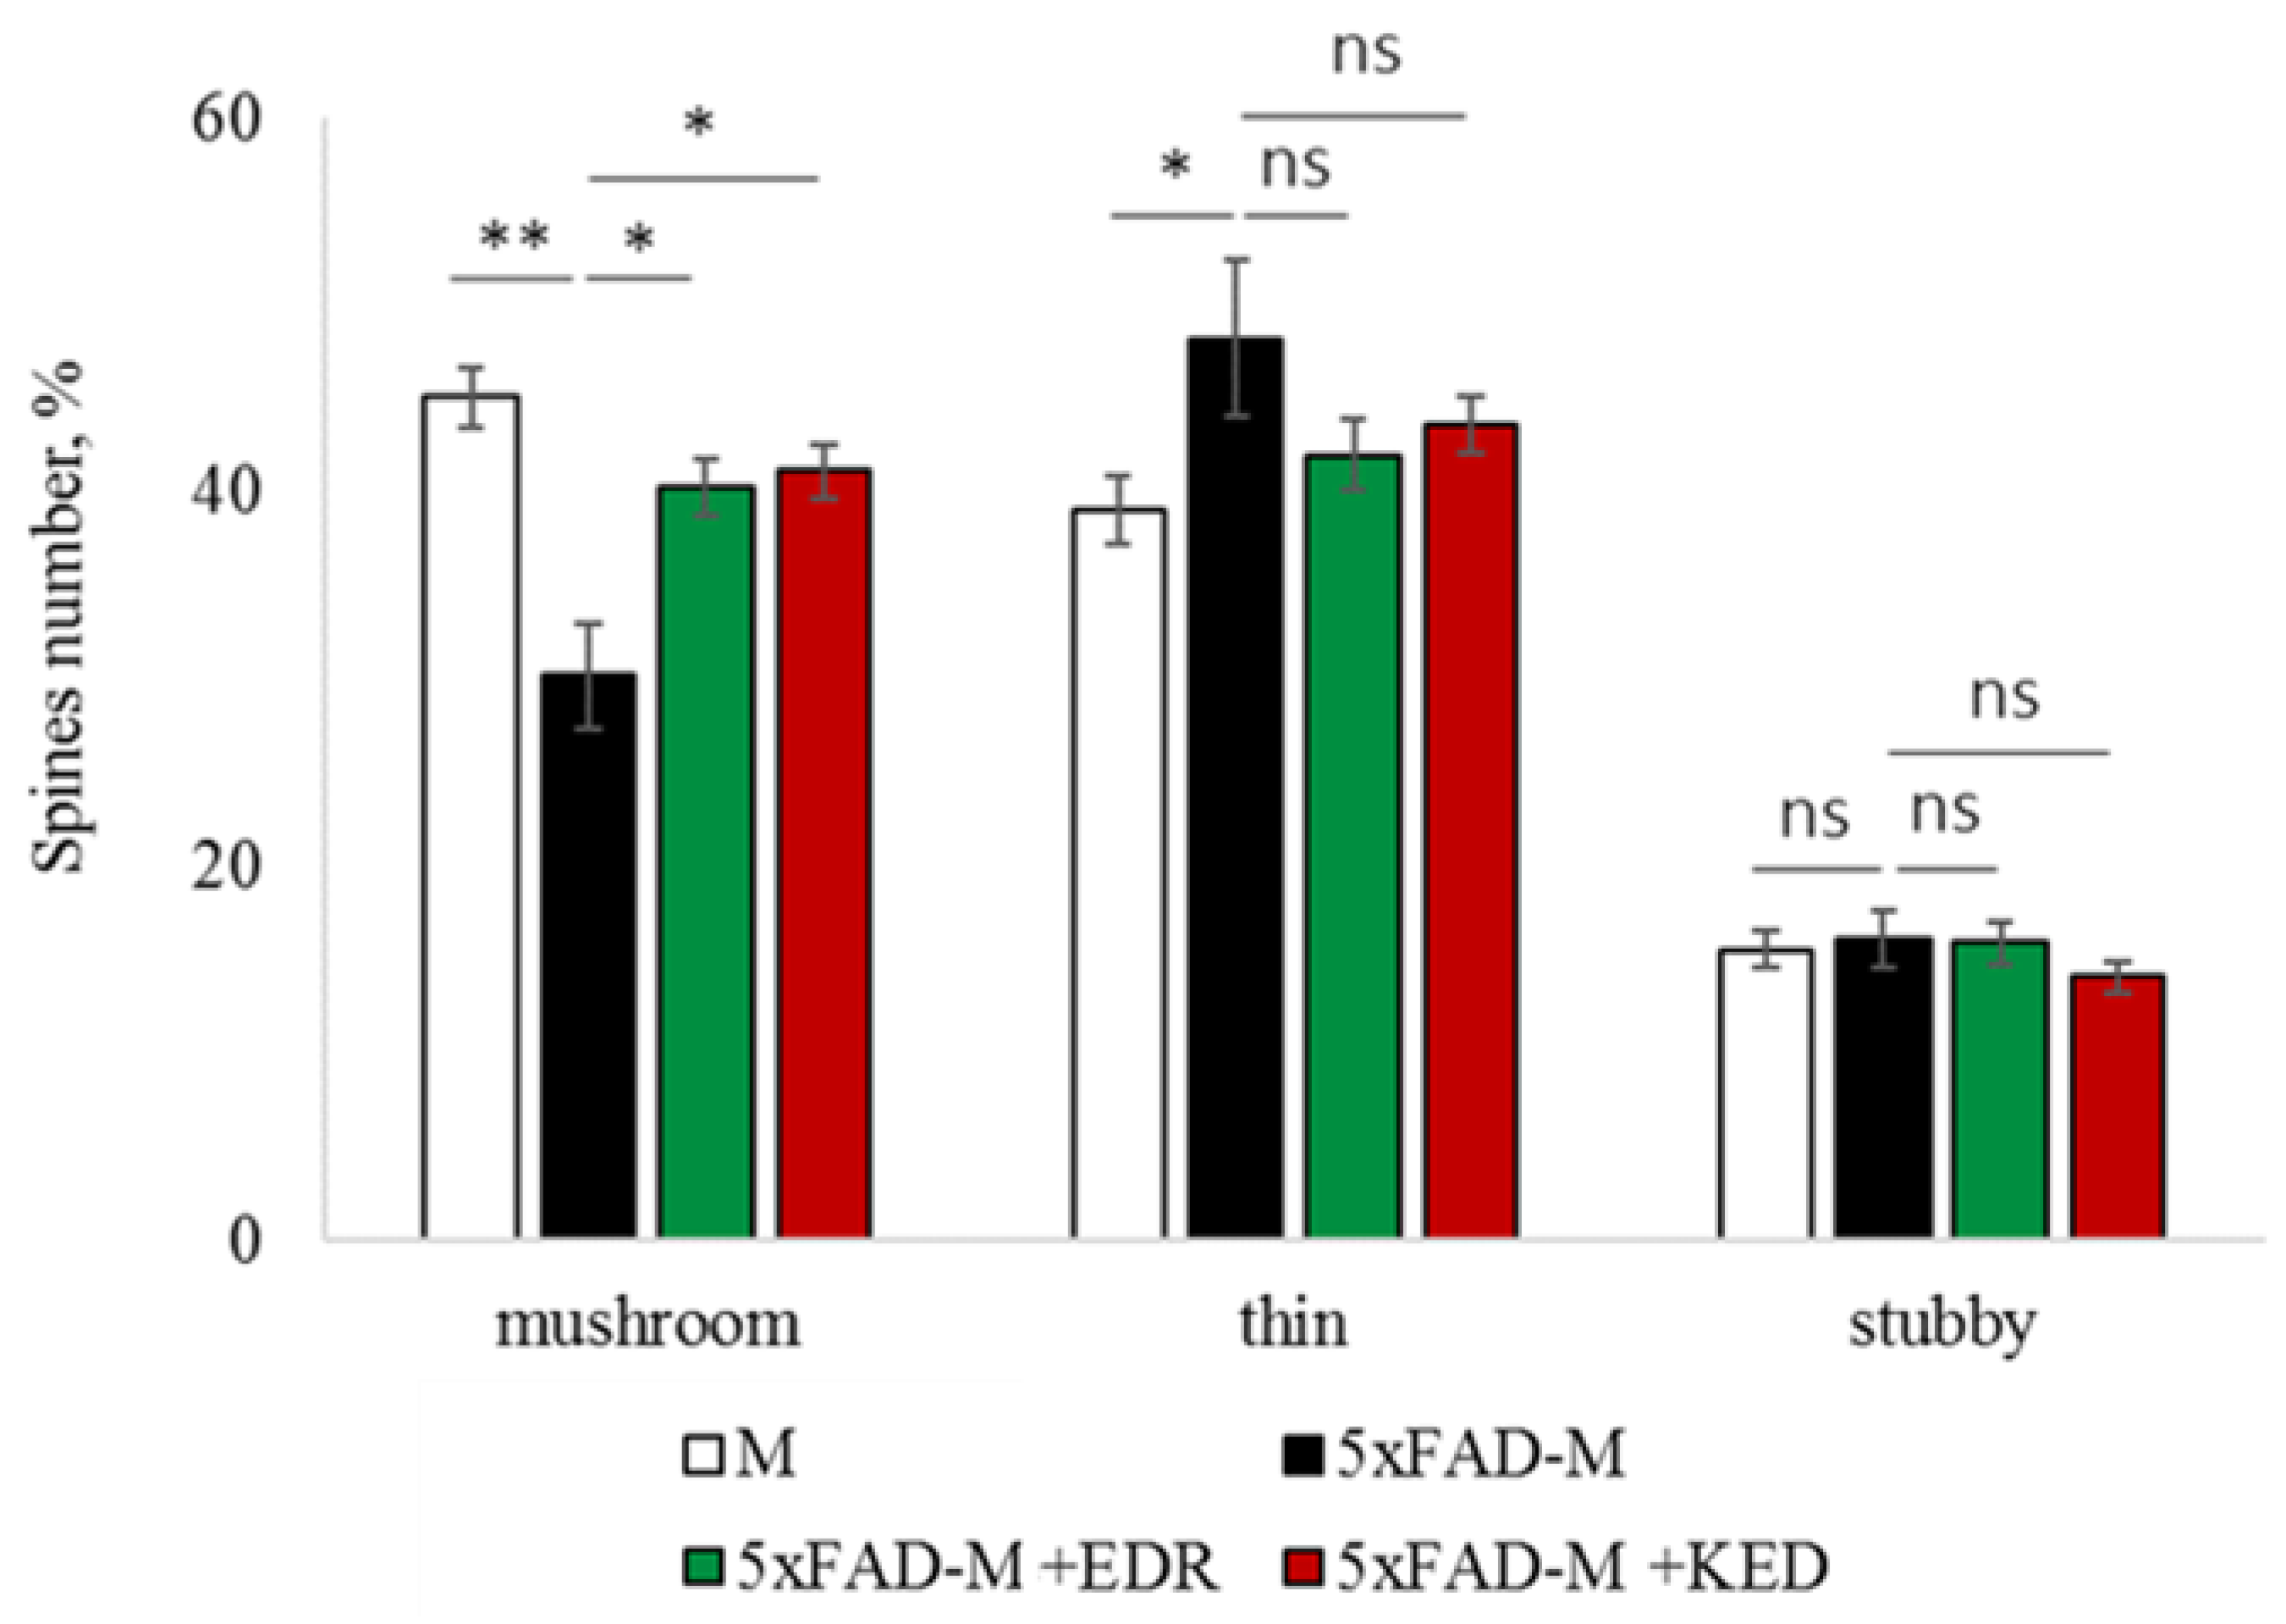
2.3. Sex-Related Differences in the Neuroprotective Effect of Short Peptides in 5xFAD-M Mice
2.3.1. Males
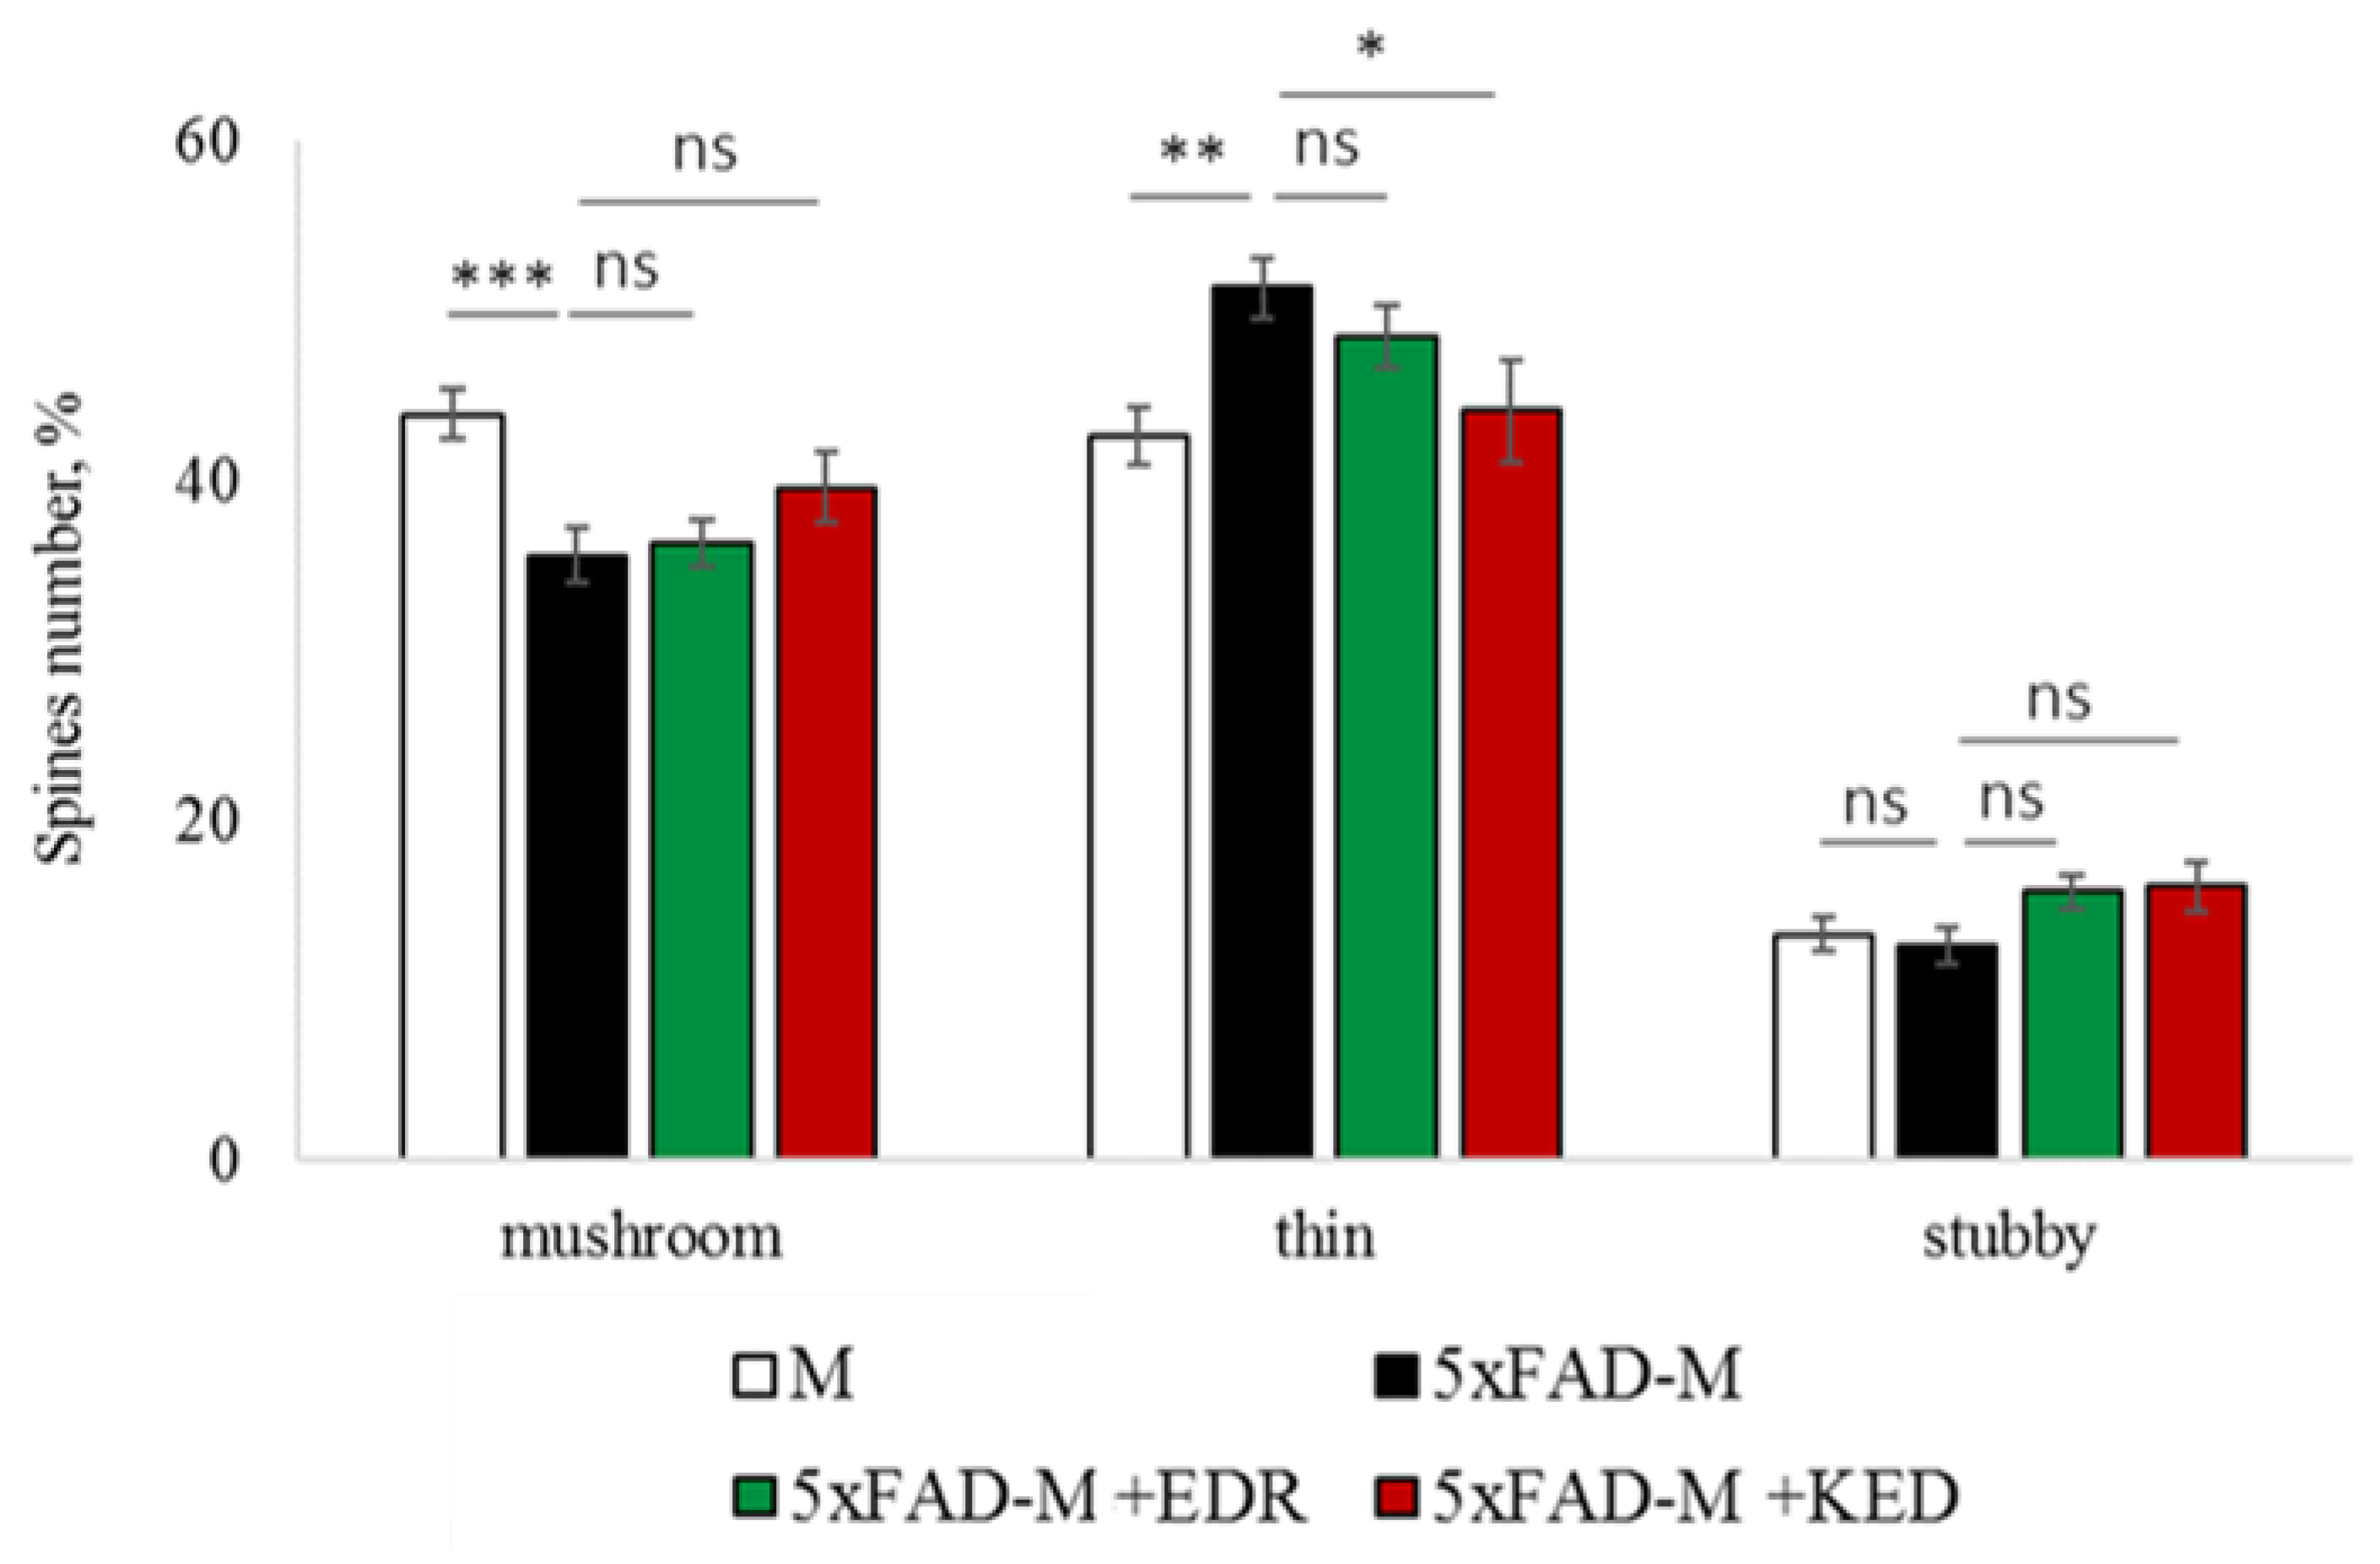
2.3.2. Females
2.4. Possible Molecular Mechanism of KED and EDR Neuroprotective Activity

| EDR Peptide | KED Peptide | ||||||
|---|---|---|---|---|---|---|---|
| DNA Mask * Sequence | Mean ICM Score (STD) | Best ICM Score | Best DNA Sequence | DNA Mask * Sequence | Mean ICM Score (STD) | Best ICM Score | Best DNA Sequence |
| SWSWSS | −38.67 (3.24) | −44.71 | GAGTGG | SWSWSS | −16.15 (3.57) | −26.56 | CAGAGG |
| WSSWSS | −38.66 (2.35) | −44.01 | ACGTCG | WSWSWS | −15.96 (2.94) | −24.02 | ACAGTG |
| SWSSWS | −38.20 (3.50) | −42.76 | CACGTG | WSWSSW | −15.91 (2.86) | −20.52 | TCTGGA |
| SSSWSS | −38.02 (2.27) | −43.31 | GGGACG | WWSWSW | −15.72 (2.68) | −22.32 | AACACT |
| WSSWSW | −37.96 (2.25) | −43.78 | AGGAGT | SSWSWS | −15.55 (3.91) | −22.54 | GCAGTG |
| SWSWWS | −37.89 (2.66) | −44.43 | GAGTAC | WSWSWW | −15.53 (3.12) | −22.33 | ACAGAA |
| SWSSSS | −37.73 (2.61) | −42.76 | GTCCCC | SSSWSS | −15.36 (2.93) | −20.72 | CGCTGG |
| WWSWSS | −37.65 (2.87) | −43.04 | TACTCG | SSWSSS | −15.34 (3.09) | −22.25 | CGTGGG |
| WSSWWS | −37.45 (2.38) | −42.99 | TGGTTG | WSWSSS | −15.31 (3.73) | −21.34 | AGTCCC |
| WWSSWS | −37.36 (2.88) | −44.04 | AAGCTC | WWWSWS | −15.28 (3.36) | −23.85 | TTTCAG |
| WSSSSS | −37.34 (2.64) | −43.10 | AGGCCC | SWWSWS | −15.27 (3.07) | −21.63 | GTTGTG |
| SSSSSS | −37.31 (3.02) | −42.81 | CGGGCG | WWSWSS | −15.26 (3.52) | −24.69 | TACAGG |
| SSSSWS | −37.21 (2.37) | −41.61 | GGGGTG | SWWWSS | −15.25 (2.84) | −23.29 | CAAACG |
| WSWSWW | −37.17 (2.87) | −42.70 | AGAGTA | WSSWSS | −15.23 (3.53) | −25.71 | AGCTCG |
| SSSWWS | −37.14 (2.57) | −41.29 | GGGTAG | WSSWSW | −15.10 (4.66) | −25.11 | AGCAGT |
| SSWSSS | −37.08 (2.39) | −41.00 | GCACGC | WWWSSS | −15.01 (3.75) | −25.22 | ATACGG |
| WWSWSW | −37.06 (3.34) | −44.27 | AAGAGT | SWSSWS | −15.01 (4.27) | −22.33 | CACCAG |
| WWSWWS | −37.04 (2.23) | −42.15 | AAGTTG | WSSSWS | −15.00 (3.64) | −25.23 | AGGGTC |
| WWSSSS | −37.04 (2.23) | −42.27 | AAGGGG | SSWWWS | −14.89 (3.88) | −22.08 | GCTTAG |
| WSWSSS | −37.03 (2.66) | −43.21 | AGACCG | WSWWSS | −14.87 (2.70) | −22.29 | TGTTCC |
| WSSWWW | −36.96 (2.29) | −41.35 | AGGAAA | SSWWSS | −14.86 (2.84) | −20.45 | CGAAGG |
| SSWSWS | −36.85 (2.68) | −42.59 | GGACTG | WSWWWW | −14.74 (3.13) | −18.83 | AGTATA |
| WSSSSW | −36.81 (2.38) | −40.87 | ACGCGT | WWSSSS | −14.63 (3.94) | −21.87 | ATCGGC |
| WSWSSW | −36.71 (2.10) | −41.49 | TGAGGA | SWWSSS | −14.62 (3.14) | −21.51 | CATCCG |
| WSSSWS | −36.62 (2.19) | −40.55 | AGCGTC | WWSSSW | −14.62 (3.20) | −22.91 | AAGGGT |
| WSWWSW | −36.59 (2.56) | −41.18 | AGAAGT | WSWWWS | −14.56 (2.98) | −22.72 | TCATTG |
| WWSWWW | −36.47 (1.91) | −39.94 | ATGTTA | SSSWWS | −14.51 (2.66) | −19.82 | GGGTAG |
| SWWSWS | −36.44 (3.33) | −41.99 | GAAGTC | SWWWWS | −14.48 (3.29) | −22.39 | GATATG |
| WSWSWS | −36.34 (3.19) | −41.94 | ACAGTG | SWSWWS | −14.38 (2.97) | −18.72 | GACAAG |
| WWSSSW | −36.05 (2.83) | −41.93 | TAGCCA | WWSSWS | −14.36 (3.83) | −26.00 | TACGAC |
| WWWSWS | −35.86 (3.38) | −41.59 | TAACTC | WWWWSS | −14.35 (3.07) | −22.83 | TTAACG |
| SSWWSS | −35.79 (2.06) | −41.18 | GCAACG | SWSSSS | −14.28 (4.52) | −26.11 | GAGGGG |
| WWSSWW | −35.74 (2.17) | −39.62 | AACGTA | WSSWWS | −14.02 (3.10) | −20.15 | ACCTAC |
| WSWWSS | −35.59 (2.58) | −41.05 | AGTTCG | WSSSWW | −14.01 (2.56) | −17.09 | ACGGTA |
| WSWWWW | −35.16 (3.00) | −40.00 | AGTTTA | SSSSWS | −13.98 (4.40) | −22.68 | GGGCTG |
| WWWSSW | −35.14 (2.55) | −42.01 | AAACCT | WSWWSW | −13.97 (2.36) | −19.40 | TGTTGA |
| SWWSSS | −35.13 (2.52) | −39.57 | GAACCC | WWSWWS | −13.93 (3.51) | −23.04 | AAGAAG |
| WWWSWW | −35.06 (2.63) | −39.44 | AATGTT | WSSSSW | −13.91 (4.71) | −23.66 | ACGGGT |
| WWWSSS | −34.93 (2.14) | −39.43 | AAACGG | WWWWWS | −13.86 (3.07) | −21.03 | TATAAG |
| WSSSWW | −34.77 (2.58) | −39.61 | AGCCTA | WSSSSS | −13.71 (4.14) | −26.54 | AGGGGC |
| SSWWWS | −34.45 (2.59) | −39.13 | GCTTAG | WWWWSW | −13.61 (3.46) | −20.26 | TATTGA |
| WWWWSW | −34.32 (2.84) | −40.54 | AAAAGT | WWWSSW | −13.47 (3.69) | −21.40 | TTTCCA |
| WSWWWS | −34.25 (2.64) | −40.14 | AGATAG | WWSWWW | −13.38 (3.44) | −19.74 | ATGTTA |
| SWWWSS | −33.78 (2.37) | −38.47 | GAAACC | WSSWWW | −13.27 (4.01) | −17.57 | AGCATA |
| WWWWSS | −33.26 (2.26) | −38.85 | TAAACC | WWSSWW | −13.06 (3.12) | −21.35 | ATGGTA |
| SWWWWS | −31.90 (2.05) | −36.60 | CAAAAG | SSSSSS | −12.78 (3.86) | −20.21 | GCGCCG |
| WWWWWS | −31.82 (2.63) | −39.52 | TTAAAG | WWWWWW | −12.50 (3.93) | −21.35 | TATATA |
| WWWWWW | −31.76 (2.17) | −38.93 | AAAAAA | WWWSWW | −11.90 (3.24) | −22.18 | ATAGTA |
3. Discussion
4. Materials and Methods
4.1. Tripeptides
4.2. Animals
4.3. Genotyping
4.4. Acute Hippocampal Slices Preparation
4.5. Electrophysiology
4.6. Fixed Brain Slices Preparation
4.7. Dendritic Spine Morphology Analysis
4.8. Statistical Analysis
4.9. Molecular Modeling
4.9.1. Structure Preparation
4.9.2. Virtual Ligand Screening and Analysis of the Results Obtained
5. Conclusions
Author Contributions
Funding
Institutional Review Board Statement
Informed Consent Statement
Data Availability Statement
Acknowledgments
Conflicts of Interest
References
- Fan, L.; Mao, C.; Hu, X.; Zhang, S.; Yang, Z.; Hu, Z. New insights into the pathogenesis of Alzheimer’s disease. Front. Neurol. 2020, 10, 1312. [Google Scholar] [CrossRef]
- Trevisan, K.; Cristina-Pereira, R.; Silva-Amaral, D.; Aversi-Ferreira, T.A. Theories of aging and the prevalence of Alzheimer’s disease. Biomed. Res. 2019, 1–9. [Google Scholar] [CrossRef] [Green Version]
- Sengoku, R. Aging and Alzheimer’s disease pathology. Neuropathology 2020, 40, 22–29. [Google Scholar] [CrossRef]
- Piaceri, I.; Nacmias, B.; Sorbi, S. Genetics of familial and sporadic Alzheimer’s disease. Front. Biosci. 2013, 5, 167–177. [Google Scholar] [CrossRef] [Green Version]
- Lue, L.-F.; Kuo, Y.-M.; Roher, A.; Brachova, L.; Shen, Y.; Sue, L. Soluble amyloid β peptide concentration as a predictor of synaptic change in Alzheimer’s disease. Am. J. Pathol. 1999, 155, 853–862. [Google Scholar] [CrossRef]
- Terry, R.D.; Masliah, E.; Salmon, D.P.; Terry, R.D.; Masliah, E.; Salmon, D.P. Physical basis of cognitive alterations in Alzheimer’s disease: Synapse loss is the major correlate of cognitive impairment. Ann. Neurol. 1991, 30, 572–580. [Google Scholar] [CrossRef] [PubMed]
- Hering, H.; Sheng, M. Dendritic spines: Structure, dynamics and regulation. Nat. Rev. Neurosci. 2001, 2, 880–888. [Google Scholar] [CrossRef] [PubMed]
- Bourne, J.; Harris, K.M. Do thin spines learn to be mushroom spines that remember? Curr. Opin. Neurobiol. 2007, 17, 381–386. [Google Scholar] [CrossRef] [PubMed]
- Popugaeva, E.; Supnet, C.; Bezprozvanny, I. Presenilins, deranged calcium homeostasis, synaptic loss and dysfunction in Alzheimer’s disease. Messenger 2012, 1, 53–62. [Google Scholar] [CrossRef]
- Popugaeva, E.; Pchitskaya, E.; Speshilova, A.; Alexandrov, S.; Zhang, H.; Vlasova, O. STIM2 protects hippocampal mushroom spines from amyloid synaptotoxicity. Mol. Neurodegener. 2015, 10, 37. [Google Scholar] [CrossRef]
- Dickstein, D.L.; Weaver, C.M.; Luebke, J.I.; Hof, P.R. Dendritic spine changes associated with normal aging. Neuroscience 2013, 251, 21–32. [Google Scholar] [CrossRef] [Green Version]
- Dorostkar, M.M.; Zou, C.; Blazquez-Llorca, L.; Herms, J. Analyzing dendritic spine pathology in Alzheimer’s disease: Problems and opportunities. Acta Neuropathol. 2015, 130, 1–19. [Google Scholar] [CrossRef] [PubMed] [Green Version]
- Gipson, C.D.; Olive, M.F. Structural and functional plasticity of dendritic spines—Root or result of behavior? Genes Brain Behav. 2017, 16, 101–117. [Google Scholar] [CrossRef] [Green Version]
- Segal, M. Dendritic spines: Morphological building blocks of memory. Neurobiol. Learn. Mem. 2017, 138, 3–9. [Google Scholar] [CrossRef] [PubMed]
- Chidambaram, S.B.; Rathipriya, A.G.; Bolla, S.R.; Bhat, A.; Ray, B.; Mahalakshmi, A.M. Dendritic spines: Revisiting the physiological role. Prog. Neuro-Psychopharmacol. Biol. Psychiatry 2019, 92, 161–193. [Google Scholar] [CrossRef] [PubMed]
- Khavinson, V.K. Peptides and ageing. Neuroendocrinol. Lett. 2002, 23, 144. [Google Scholar]
- Xiao, S.F.; Yan, H.Q.; Yao, P.F. Cerebrolysin study group. Efficacy of FPF 1070 (cerebrolysin) in patients with Alzheimer’s disease. A multi-center, randomized, double-blind, placebocontrolled trial. Clin. Drug Invest. 2000, 19, 43–53. [Google Scholar]
- Fedin, A.I.; Belskaya, G.N.; Kurushina, O.V.; Kovalchuk, V.V.; Starych, E.V.; Chichanovskaya, L.V. Dose-dependent effects of cortexin in chronic cerebral ischemia (results of a multicenter randomized controlled study). S. S. Korsakov J. Neurol. Psychiatry 2018, 118, 35–42. [Google Scholar] [CrossRef]
- Mashin, V.V.; Belova, L.A.; Aizatullin, I.F.; Pavlova, V.A.; Slasten, E.V.; Abramova, V.V. Evaluation of the efficacy and safety of application of the drug cortexin in the complex rehabilitation of verticalization in patients with ischemic stroke in the acute period. S. S. Korsakov J. Neurol. Psychiatry 2019, 119, 62–67. [Google Scholar] [CrossRef] [PubMed]
- Rockenstein, E.; Torrance, M.; Mante, M.; Adame, A.; Paulino, A.; Rose, J.B. Cerebrolysin decreases amyloid-beta production by regulating amyloid protein precursor maturation in a transgenic model of Alzheimer’s disease. J. Neurosci. Res. 2006, 83, 1252–1261. [Google Scholar] [CrossRef] [PubMed]
- Medvedeva, E.V.; Dmitrieva, V.G.; Limborska, S.A.; Myasoedov, N.F.; Dergunova, L.V. Semax, an analog of ACTH(4-7), regulates expression of immune response genes during ischemic brain injury in rats. Mol. Genet. Genom. 2017, 292, 635–653. [Google Scholar] [CrossRef]
- Gusev, E.I.; Martynov, M.Y.; Kostenko, E.V.; Petrova, L.V.; Bobyreva, S.N. The efficacy of semax in the treatment of patients at different stages of ischemic stroke. S. S. Korsakov J. Neurol. Psychiatry 2018, 118, 61–68. [Google Scholar]
- Umnov, R.S.; Linkova, N.S.; Khavinson, V.K. Neuroprotective effects of peptides bioregulators in people of various age. Adv. Gerontol. 2013, 26, 671–678. [Google Scholar] [PubMed]
- Galati, C.; Spinella, N.; Renna, L.; Milardi, D.; Attanasio, F.; Sciacca, M.F.M. Strategy to discover full-length amyloid-beta peptide ligands using high-efficiency microarray technology. Beilstein J. Nanotechnol. 2017, 20, 2446–2453. [Google Scholar] [CrossRef] [Green Version]
- Grivennikov, I.A.; Dolotov, O.V.; Zolotarev, Y.A.; Andreeva, L.A.; Myasoedov, N.F.; Leacher, L. Effects of behaviorally active ACTH (4-10) analogue—Semax on rat basal forebrain cholinergic neurons. Restor. Neurol. Neurosci. 2008, 26, 35–43. [Google Scholar] [PubMed]
- Mendzheritskiĭ, A.M.; Karantysh, G.V.; Ryzhak, G.A.; Dem’ianenko, S.V. Regulation of content of cytokines in blood serum and of caspase-3 activity in brains of old rats in model of sharp hypoxic hypoxia with Cortexin and Pinealon. Adv. Gerontol. 2014, 27, 94–97. [Google Scholar] [PubMed]
- Arutjunyan, A.; Kozina, L.; Stvolinskiy, S.; Bulygina, Y.; Mashkina, A.; Khavinson, V. Pinealon protects the rat offspring from prenatal hyperhomocysteinemia. Int. J. Clin. Exp. Med. 2012, 5, 179–185. [Google Scholar] [PubMed]
- Khavinson, V.K.; Grigoriev, E.I.; Malinin, V.V.; Ryzhak, G.A. Peptide Substance Stimulating Regeneration of Central Nervous System Neurons, Pharmaceutical Composition on its Base, and the Method of its Application. EP Patent Application 06843998, 18 February 2009. [Google Scholar]
- Khavinson, V.; Linkova, N.; Kukanova, E.; Bolshakova, A.; Gainullina, A.; Tendler, S. Neuroprotective effect of EDR peptide in mouse model of huntington’s disease. J. Neurol. Neurosci. 2017, 8, 166. [Google Scholar] [CrossRef]
- Kraskovskaya, N.A.; Kukanova, E.O.; Linkova, N.S.; Popugaeva, E.A.; Khavinson, V.K. Tripeptides restore the number of neuronal spines under conditions of in vitro modeled Alzheimer’s disease. Cell Technol. Biol. Med. 2017, 2, 550–553. [Google Scholar]
- Khavinson, V.; Linkova, N.; Kozhevnikova, E.; Trofimova, S. EDR Peptide: Possible Mechanism of Gene Expression and Protein Synthesis Regulation Involved in the Pathogenesis of Alzheimer’s Disease. J. Mol. Spec. Issue Pept. Ther. 2.0. 2021, 26, 1–16. [Google Scholar]
- Kitachov, K.V.; Sazonov, A.D.; Kozlov, K.L.; Petrov, K.Y.; Slusarev, A.S.; Sedova, E.V. The role of vasoactive peptide in lower limbs chronic arterial insufficiency treatment. Adv. Gerontol. 2013, 26, 292–296. [Google Scholar]
- Khavinson, V.K.; Grigoriev, E.I.; Malinin, V.V.; Ryzhak, G.A. Peptide Substance Enhancing Capillaries Resistance, Pharmaceutical Composition on its Base and the Method of Its Application. Publication of EP2024387B1, 21 October 2009. [Google Scholar]
- Bashkireva, A.S.; Artamonova, V.G. The peptide correction of neurotic disorders among professional truck-drivers. Adv. Gerontol. 2012, 25, 718–728. [Google Scholar]
- Caputi, S.; Trubiani, O.; Sinjari, B.; Trofimova, S.; Diomede, F.; Linkova, N. Effect of short peptides on neuronal differentiation of stem cells. Int. J. Immunapathol. Farmacol. 2019, 33, 1–12. [Google Scholar] [CrossRef] [PubMed] [Green Version]
- Oakley, H.; Cole, S.L.; Logan, S.; Maus, E.; Shao, P.; Craft, J. Intraneuronal beta-amyloid aggregates, neurodegeneration, and neuron loss in transgenic mice with five familial Alzheimer’s disease mutations: Potential factors in amyloid plaque formation. J. Neurosci. 2006, 26, 10129–10140. [Google Scholar] [CrossRef]
- Wang, M.; Ramasamy, V.S.; Samidurai, M.; Jo, J. Acute restraint stress reverses impaired LTP in the hippocampal CA1 region in mouse models of Alzheimer’s disease. Sci. Rep. 2019, 9, 10955. [Google Scholar] [CrossRef] [PubMed]
- Crouzin, N.; Baranger, K.; Cavalier, M.; Marchalant, Y.; Cohen-Solal, C.; Roman, F.S. Area-specific alterations of synaptic plasticity in the 5XFAD mouse model of Alzheimer’s disease: Dissociation between somatosensory cortex and hippocampus. PLoS ONE 2013, 8, e74667. [Google Scholar] [CrossRef]
- Bernardes, C.P.; Santos, N.A.G.; Sisti, F.M.; Ferreira, R.S.; Santos-Filho, N.A.; Cintra, A.C.O.; Cilli, E.M.; Sampaio, S.V.; Santos, A.C. A synthetic snake-venom-based tripeptide (Glu-Val-Trp) protects PC12 cells from MPP(+) toxicity by activating the NGF-signaling pathway. Peptides 2018, 104, 24–34. [Google Scholar] [CrossRef] [Green Version]
- Branden, C.-I.; Tooze, J. Introduction to Protein Structure; Garland Pub.: New York, NY, USA, 1999; p. 424. [Google Scholar]
- Cornish-Bowden, A. Nomenclature for incompletely specified bases in nucleic acid sequences: Recommendations. Nucleic Acids Res. 1985, 13, 3021–3030. [Google Scholar] [CrossRef]
- Shevchenko, K.V.; Nagaev, I.Y.; Shevchenko, V.P.; Andreeva, L.A.; Shram, S.I.; Myasoedov, N.F. The penetration of 5-oxo-Pro-Arg-Pro into the brain and the major metabolic pathways of this peptide in the rat brain and blood at the intranasal and intravenous administration. Dokl. Biochem. Biophys. 2017, 473, 151–154. [Google Scholar] [CrossRef] [PubMed]
- Guan, J.; Thomas, G.B.; Lin, H.; Mathai, S.; Bachelor, D.C.; George, S.; Gluckman, P.D. Neuroprotective effects of the N-terminal tripeptide of insulin-like growth factor-1, glycine-proline-glutamate (GPE) following intravenous infusion in hypoxic-ischemic adult rats. Neuropharmacology 2004, 47, 892–903. [Google Scholar] [CrossRef]
- Mileusnic, R.; Lancashire, C.; Clark, J.; Rose, S.P. Protection against Abeta-induced memory loss by tripeptide D-Arg-L-Glu-L-Arg. Behav. Pharmacol. 2007, 18, 231–238. [Google Scholar] [CrossRef]
- Ting, J.T.; Lee, B.R.; Chong, P.; Soler-Llavina, G.; Cobbs, C.; Koch, C. Preparation of acute brain slices using an optimized N-Methyl-D-glutamine protective recovery method. J. Vis. Exp. 2018, 132, 53825. [Google Scholar]
- Ahn, K.C.; Learman, C.R.; Dunbar, G.L.; Maiti, P.; Jang, W.C.; Cha, H.C. Characterization of impaired cerebrovascular structure in APP/PS1 mouse brains. Neuroscience 2018, 385, 246–254. [Google Scholar] [CrossRef] [PubMed]
- Malinin, V.V.; Durnova, A.O.; Polyakova, V.O.; Kvetnoi, I.M. Effects of Lys-Glu-Asp peptide on cell-cell interactions and vascular endothelium proliferation under normal conditions and during atherosclerosis. Bull. Exp. Biol. Med. 2014, 157, 324–326. [Google Scholar] [CrossRef]
- Kozlov, K.L.; Bolotov, I.I.; Linkova, N.S.; Drobintseva, A.O.; Khavinson, V.K.; Dyakonov, M.M. Molecular aspects of vasoprotective peptide KED activity during atherosclerosis and restenosis. Adv. Gerontol. 2016, 29, 646–650. [Google Scholar] [PubMed]
- Lange, C.; Storkebaum, E.; de Almodóvar, C.R.; Dewerchin, M.; Carmeliet, P. Vascular endothelial growth factor: A neurovascular target in neurological diseases. Nat. Rev. Neurol. 2016, 12, 439–454. [Google Scholar] [CrossRef]
- Meshchaninov, V.N.; Tkachenko, E.L.; Zharkov, S.V.; Gavrilov, I.V.; Katyreva, I.E. Effect of synthetic peptides on aging of patients with chronic polymorbidity and organic brain syndrome of the central nervous system in remission. Adv. Gerontol. 2015, 28, 62–67. [Google Scholar]
- Ashapkin, V.; Khavinson, V.; Shilovsky, G.; Linkova, N.; Vanuyshin, B. Gene expression in human mesenchymal stem cell aging cultures: Modulation by short peptides. Mol. Biol. Rep. 2020, 47, 4323–4329. [Google Scholar] [CrossRef] [PubMed]
- Khavinson, V.K.; Pendina, A.; Efimova, O.A.; Tikhonov, A.V.; Koltsova, A.S.; Krapivin, M.I. Effect of peptide AEDG on telomere lenght and mitotic index of PHA-stimulated of blood lymphocytes. Bull. Exp. Biol. Med. 2019, 3, 141–144. [Google Scholar] [CrossRef]
- Sinjari, B.; Diomede, F.; Khavinson, V.; Mironova, E.; Linkova, N.; Trofimova, S. Short peptides protect oral stem cells from ageing. Stem Cell Rev. Rep. 2020, 16, 159–166. [Google Scholar] [CrossRef]
- De la Monte, S.M.; Ng, S.C.; Hsu, D.W. Aberrant GAP-43 gene expression in Alzheimer’s disease. Am. J. Pathol. 1995, 147, 934–946. [Google Scholar]
- Chung, D.; Shum, A.; Caraveo, G. GAP-43 and BASP1 in Axon Regeneration: Implications for the Treatment of Neurodegenerative Diseases. Front. Cell Dev. Biol. 2020, 8, 567537. [Google Scholar] [CrossRef]
- Masliah, E.; Mallory, M.; Hansen, L.; Alford, M.; Albright, T.; DeTeresa, R.; Terry, R.; Baudier, J.; Saitoh, T. Patterns of aberrant sprouting in Alzheimer’s disease. Neuron 1991, 6, 729–739. [Google Scholar] [CrossRef]
- Bogdanovic, N.; Davidsson, P.; Volkmann, I.; Winblad, B.; Blennow, K. Growth-associated protein GAP-43 in the frontal cortex and in the hippocampus in Alzheimer’s disease: An immunohistochemical and quantitative study. J. Neural Transm. 2000, 107, 463–478. [Google Scholar] [CrossRef]
- Rekart, J.L.; Meiri, K.; Routtenberg, A. Hippocampal-dependent memory is impaired in heterozygous GAP-43 knockout mice. Hippocampus 2005, 15, 1–7. [Google Scholar] [CrossRef]
- Ji, Y.; Gong, Y.; Gan, W.; Beach, T.; Holtzman, D.M.; Wisniewski, T. Apolipoprotein E isoform-specific regulation of dendritic spine morphology in apolipoprotein E transgenic mice and Alzheimer’s disease patients. Neuroscience 2003, 122, 305–315. [Google Scholar] [CrossRef] [PubMed]
- Basak, J.M.; Kim, J. Differential Effects of ApoE Isoforms on Dendritic Spines in Vivo: Linking an Alzheimer’s Disease Risk Factor with Synaptic Alterations. J. Neurosci. 2010, 30, 4526–4527. [Google Scholar] [CrossRef] [PubMed] [Green Version]
- Dumanis, S.B.; Tesoriero, J.A.; Babus, L.W.; Nguyen, M.T.; Trotter, J.H.; Ladu, M.J. ApoE4 decreases spine density and dendritic complexity in cortical neurons in vivo. J. Neurosci. 2009, 29, 15317–15322. [Google Scholar] [CrossRef]
- Neustadtl, A.L.; Winston, C.N.; Parsadanian, M.; Main, B.S.; Villapol, S.; Burns, M.P. Reduced cortical excitatory synapse number in ApoE4 mice is associated with increased calcineurin activity. Neuroreport 2017, 28, 618–624. [Google Scholar] [CrossRef] [PubMed]
- Wilhelmsson, U.; Lebkuechner, I.; Leke, R.; Marasek, P.; Yang, X.; Antfolk, D.; Chen, M.; Mohseni, P.; Lasič, E.; Bobnar, S.T.; et al. Nestin Regulates Neurogenesis in Mice Through Notch Signaling from Astrocytes to Neural Stem Cells. Cereb. Cortex 2019, 29, 4050–4066. [Google Scholar] [CrossRef] [PubMed]
- Zeng, Q.; Zheng, M.; Zhang, T.; He, G. Hippocampal neurogenesis in the APP/PS1/nestin-GFP triple transgenic mouse model of Alzheimer’s disease. Neuroscience 2016, 314, 64–74. [Google Scholar] [CrossRef]
- Nägerl, U.V.; Eberhorn, N.; Cambridge, S.B.; Bonhoeffer, T. Bidirectional activity-dependent morphological plasticity in hippocampal neurons. Neuron 2004, 44, 759–767. [Google Scholar] [CrossRef] [Green Version]
- D’Amelio, M.; Cavallucci, V.; Middei, S. Caspase-3 triggers early synaptic dysfunction in a mouse model of Alzheimer’s disease. Nat. Neurosci. 2011, 14, 69–76. [Google Scholar] [CrossRef] [Green Version]
- Louneva, N.; Cohen, J.W.; Han, L.Y. Caspase-3 is enriched in postsynaptic densities and increased in Alzheimer’s disease. Am. J. Pathol. 2008, 173, 1488–1495. [Google Scholar] [CrossRef] [Green Version]
- Wójtowicz, S.; Strosznajder, A.K.; Jeżyna, M. The Novel Role of PPAR Alpha in the Brain: Promising Target in Therapy of Alzheimer’s Disease and Other Neurodegenerative Disorders. Neurochem. Res. 2020, 45, 972–988. [Google Scholar] [CrossRef] [Green Version]
- Patel, D.; Roy, A.; Pahan, K. PPARα serves as a new receptor of aspirin for neuroprotection. J. Neurosci. Res. 2020, 98, 626–631. [Google Scholar] [CrossRef] [PubMed]
- Chiang, M.-C.; Cheng, Y.-C.; Chen, H.-M.; Liang, Y.-J.; Yen, C.-H. Rosiglitazone promotes neurite outgrowth and mitochondrial function in N2A cells via PPARgamma pathway. Mitochondrion 2014, 14, 7–17. [Google Scholar] [CrossRef] [PubMed]
- Haran, T.K.; Nanayakkara, G.; Parameshwaran, K. Central activation of PPAR-gamma ameliorates diabetes induced cognitive dysfunction and improves BDNF expression. Neurobiol. Aging 2015, 36, 1451–1461. [Google Scholar]
- Zolezzi, J.M.; Santos, M.J.; Bastías-Candia, S.; Pinto, C.; Godoy, J.A.; Inestrosa, N.C. PPARs in the central nervous system: Roles in neurodegeneration and neuroinflammation. Biol. Rev. 2017, 92, 2046–2069. [Google Scholar] [CrossRef] [PubMed]
- Govindarajulu, M.; Pinky, P.D.; Bloemer, J.; Ghanei, N.; Suppiramaniam, V.; Amin, R. Signaling Mechanisms of Selective PPARγ Modulators in Alzheimer’s Disease. PPAR Res. 2018, 1–20. [Google Scholar] [CrossRef] [PubMed] [Green Version]
- Ansari, M.A.; Scheff, S.W. Oxidative stress in the progression of Alzheimer disease in the frontal cortex. J. Neuropathol. Exp. Neurol. 2010, 69, 155–167. [Google Scholar] [CrossRef] [Green Version]
- Flynn, J.M.; Melov, S. SOD2 in mitochondrial dysfunction and neurodegeneration. Free Radic. Biol. Med. 2013, 62, 4–12. [Google Scholar] [CrossRef] [Green Version]
- Nelson, A.R.; Sweeney, M.D.; Sagare, A.P.; Zlokovic, B.V. Neurovascular dysfunction and neurodegeneration in dementia and Alzheimer’s disease. Biochim. Biophys. Acta 2016, 1862, 887–900. [Google Scholar] [CrossRef]
- Eremin, K.O.; Kudrin, V.S.; Saransaari, P.; Oja, S.S.; Grivennikov, I.A.; Myasoedov, N.F.; Rayevsky, K.S. Semax, an ACTH(4-10) analogue with nootropic properties, activates dopaminergic and serotoninergic brain systems in rodents. Neurochem. Res. 2005, 30, 1493–1500. [Google Scholar] [CrossRef]
- Popugaeva, E.; Chernyuk, D.; Zhang, H.; Postnikova, T.Y.; Pats, K.; Fedorova, E. Derivatives of piperazines as potential therapeutic agents for Alzheimer’s disease. Mol. Pharmacol. 2019, 95, 337–348. [Google Scholar] [CrossRef] [PubMed] [Green Version]
- Tetteh, H.; Lee, J.; Lee, J.; Kim, J.G.; Yang, S. Investigating long-term synaptic plasticity in interlamellar hippocampus CA1 by electrophysiological field recording. J. Vis. Exp. 2019, 150. [Google Scholar] [CrossRef] [Green Version]
- Rodriguez, A.; Ehlenberger, D.B.; Dickstein, D.L.; Hof, P.R.; Wearne, S.L. Automated three-dimensional detection and shape classification of dendritic spines from fluorescence microscopy images. PLoS ONE 2008, 3, e1997. [Google Scholar] [CrossRef] [PubMed] [Green Version]
- Sun, S.; Zhang, H.; Liu, J.; Popugaeva, E.; Xu, N.J.; Feske, S. Reduced synaptic STIM2 expression and impaired store-operated calcium entry cause destabilization of mature spines in mutant presenilin mice. Neuron 2014, 82, 79–93. [Google Scholar] [CrossRef] [PubMed] [Green Version]
- Abagyan, R.; Totrov, M. Biased probability Monte Carlo conformational searches and electrostatic calculations for peptides and proteins. J. Mol. Biol. 1994, 235, 983–1002. [Google Scholar] [CrossRef] [Green Version]
- Neves, M.A.; Totrov, M.; Abagyan, R. Docking and scoring with ICM: The benchmarking results and strategies for improvement. J. Comput. Aided Mol. Des. 2012, 26, 675–686. [Google Scholar] [CrossRef] [Green Version]
- Kolchina, N.; Khavinson, V.; Linkova, N.; Yakimov, A.; Baitin, D.; Afanasyeva, A.; Petukhov, M. Systematic search for structural motifs of peptide binding to double-stranded DNA. Nucleic Acids Res. 2019, 47, 10553–10563. [Google Scholar] [CrossRef] [PubMed]
- Khavinson, V.; Shataeva, L.; Chernova, A. DNA double-helix binds regulatory peptides similarity to transcription factors. Neuroendocrinol. Lett. 2005, 26, 237–241. [Google Scholar]


| N | Mean ICM Score (STD) | DNA Mask Sequence | Gene | Frequency of DNA Mask Sequence Occurrence in Gene Promotor |
|---|---|---|---|---|
| 1 | −38.66 | WSSWSS | GPX1 | 1 time |
| 2 | −38.20 | SWSSWS | APOE | 2 times |
| 3 | −38.02 | SSSWSS | PPARA | 3 times |
| GAP43 | 4 times | |||
| 4 | −37.96 | WSSWSW | SOD2 | 1 time |
| APOE | 1 time | |||
| 5 | 37.89 | SWSWWS | SOD2 | 1 time |
| PPARA | 2 times | |||
| GAP43 | 1 time | |||
| 6 | −37.73 | SWSSSS | PPARA | 2 times |
| GAP43 | 1 time | |||
| APOE | 2 times | |||
| 7 | −37.65 | WWSWSS | SOD2 | 1 time |
| 8 | −37.45 | WSSWWS | PPARG | 1 time |
| 9 | −37.36 | WWSSWS | SOD2 | 1 time |
| GPX1 | 1 time |
Publisher’s Note: MDPI stays neutral with regard to jurisdictional claims in published maps and institutional affiliations. |
© 2021 by the authors. Licensee MDPI, Basel, Switzerland. This article is an open access article distributed under the terms and conditions of the Creative Commons Attribution (CC BY) license (https://creativecommons.org/licenses/by/4.0/).
Share and Cite
Khavinson, V.; Ilina, A.; Kraskovskaya, N.; Linkova, N.; Kolchina, N.; Mironova, E.; Erofeev, A.; Petukhov, M. Neuroprotective Effects of Tripeptides—Epigenetic Regulators in Mouse Model of Alzheimer’s Disease. Pharmaceuticals 2021, 14, 515. https://0-doi-org.brum.beds.ac.uk/10.3390/ph14060515
Khavinson V, Ilina A, Kraskovskaya N, Linkova N, Kolchina N, Mironova E, Erofeev A, Petukhov M. Neuroprotective Effects of Tripeptides—Epigenetic Regulators in Mouse Model of Alzheimer’s Disease. Pharmaceuticals. 2021; 14(6):515. https://0-doi-org.brum.beds.ac.uk/10.3390/ph14060515
Chicago/Turabian StyleKhavinson, Vladimir, Anastasiia Ilina, Nina Kraskovskaya, Natalia Linkova, Nina Kolchina, Ekaterina Mironova, Alexander Erofeev, and Michael Petukhov. 2021. "Neuroprotective Effects of Tripeptides—Epigenetic Regulators in Mouse Model of Alzheimer’s Disease" Pharmaceuticals 14, no. 6: 515. https://0-doi-org.brum.beds.ac.uk/10.3390/ph14060515