Article

Pharmacological and Epigenetic Regulators of NLRP3 Inflammasome Activation in Alzheimer’s Disease

1
IRCCS Fondazione Don C. Gnocchi, ONLUS, 20148 Milan, Italy
2
Department of Pathophysiology and Transplantation, University of Milan, 20122 Milan, Italy
3
Fondazione Cà Granda, IRCCS Ospedale Maggiore Policlinico, 20122 Milan, Italy
4
Department of Biomedical, Surgical and Dental Sciences, University of Milan, 20100 Milan, Italy
*
Author to whom correspondence should be addressed.
Pharmaceuticals 2021, 14(11), 1187; https://0-doi-org.brum.beds.ac.uk/10.3390/ph14111187
Submission received: 30 September 2021 / Revised: 17 November 2021 / Accepted: 18 November 2021 / Published: 20 November 2021

Abstract

:
Activation of the NLRP3 inflammasome complex results in the production of IL-18, Caspase-1 and IL-1β. These cytokines have a beneficial role in promoting inflammation, but an excessive activation of the inflammasome and the consequent constitutive inflammatory status is a negative factor in human pathologies including Alzheimer’s Disease (AD). MicroRNAs (miR-NAs) target the 3′UTR region of NLRP3, preventing the activation of the inflammasome and inhibiting cytokine production. Because Stavudine (D4T), an antiretroviral drug, was recently shown to reduce inflammasome activation, we verified whether its effect is mediated by miR-7-5p, miR-22-3p, miR-30e-5p and miR-223-3p: miRNAs that bind the NLRP3-mRNA-UTR region and interfere with protein translation, reducing NLRP3 activation. Peripheral blood mononuclear cells (PBMCs) of twenty AD patients and ten sex-matched Healthy Controls (HC) were stimulated with Lipopolysaccharides (LPS)+Amyloid-beta (Aβ42) in the absence/presence of D4T. Expression of genes within the inflammasome complex and of miRNAs was evaluated by RT-PCR; cytokines and caspase-1 production was measured by ELISA. Results have shown that: NLRP3, ASC, IL-1β and IL-18 expression, as well as IL-18, IL-1β and caspase-1 production, were significantly augmented (p < 0.05) in LPS+Aβ42-stimulated PBMCs of AD patients compared to HC. D4T reduced the expression of inflammasome genes and cytokine production (p < 0.005). miR-7-5p and miR-223-3p expression was significantly increased in LPS+Aβ42-stimulated PBMCs of AD patients (p < 0.05), and it was reduced by D4T in AD alone. In conclusion: miR-223-3p and mir-7-5p expression is increased in AD, but this does not result in down-regulation of NLRP3 inflammasome expression and of IL-1β and IL-18 production. D4T increased miRNA expression in HC but had an opposite effect in AD, suggesting that miRNA regulatory mechanisms are altered in AD.

1. Introduction

Alzheimer’s disease (AD) is associated with impaired cognition and the accumulation of amyloid-β peptides (Aβ) and neurofibrillary T-tau protein tangles in the brain. Neuroinflammation is suggested to play a pivotal role in the pathogenesis of AD [1,2,3], as this disease is associated with activation of microglia and recruitment of peripheral monocytes in the central nervous system (CNS) [4,5,6,7,8,9]. Once in the CNS, monocytes produce inflammatory cytokines as well as molecules with direct neurotoxic effects. Notably, Aβ can directly stimulate the activation of the NLRP3 inflammasome. This results in the assembly of NLRP3 (nucleotide-binding do-main leucine-rich repeat (NLR) and pyrin domain containing receptor 3), ASC (apoptosis-associated speck-like protein containing a caspase recruitment domain), and procaspase- 1 proteins, a process that leads to the cleavage and activation of caspase-1, and the maturation and secretion of IL-1β and IL-18 [10,11,12,13].
Different inflammasomes have been shown to be involved in neurodegenerative diseases [14,15,16] but a close association between AD and NLRP3 has been convincingly demonstrated both in animal models of AD [17,18] and in experiments performed using human monocytes [19]. Therefore, pharmacological inhibitors that specifically target the NLRP3 inflammasome could be an option for treatment of AD-associated neuroinflammation. Emerging evidence has shown that Stavudine (D4T), an antiviral nucleoside reverse transcriptase inhibitor (NRTIs) designed to target HIV, down-modulates NLRP3 inflammasome activation as well as IL-18 and caspase-1 production, and stimulates amyloid-β autophagy by macrophages [20,21,22]. Recent results showed that the activation of the NLRP3 inflammasome can be modulated as well by miRNAs, non-coding RNAs that target mRNA and, as a result, reduce transcripts with consequent effect on protein production. miR-7-5p, miR-22-3p, miR-30e and miR-223-3p, in particular, were shown to bind a highly conserved region of the 3′UTR of NLRP3 mRNA and interfere with protein translation [23], thus reducing NLRP3 activation [24].
Based on the observations that: (1) the NLRP3 inflammasome is a major culprit for inflammation in AD; (2) D4T significantly down-regulates NLRP3 activation; (3) NLRP3 activation is modulated by miRNAs, we analyzed the possible role of 3′UTR of NLRP3-binding mRNAs in mediating the hampering effect of D4T on the NLRP3 inflammasome.

2. Results

2.1. Clinical Characteristics of the Individuals Enrolled in the Study

Demographic and clinical characteristics of the individuals enrolled in the study are summarized in Table 1. No differences were observed in gender, age, and years of education. As per the inclusion criteria, global cognitive levels (MMSE) were significantly reduced in AD patients (median 21 ± 3.9) compared to healthy controls (>28) (p < 0.05). For APOE e-4 carriers, no differences were shown between AD (20%) patients and HC (20%).
With respect to CSF proteins, Aβ (mean 486 ± 109 pg/mL), total-Tau (mean 747 ± 206 pg/mL), and P-Tau (mean 84 ± 44 pg/mL) were analyzed only in patients to confirm the AD diagnosis. Mean values of the CSF protein quantification (Aβ, total-Tau, P-Tau) are shown in Table 1.

2.2. MTT Stavudine (D4T)

The MTT assay showed that, in accordance with previous studies [25], PBMC vitality was 90 ± 3.5% using D4T at a 50 µM concentration.

2.3. NLRP3 and Downstream Signaling of Inflammasome Gene Expression in PBMC

mRNA expression of NLRP3, ASC, Caspase-1, IL-18 and IL-1β was quantified by qPCR in cells of all AD patients and healthy controls. Data are expressed as the fold change (n-fold) compared to results obtained in unstimulated cells (medium alone) and those obtained in LPS primed and Aβ42 stimulated cells in the absence/presence of D4T.
NLRP3, ASC, Caspase-1, IL-18 and IL-1β mRNA were significantly up-regulated in LPS+Aβ42 stimulated PBMC compared to unstimulated cell (medium alone) PBMC both for AD patients and HC (p < 0.05), see Supplementary Material.
To summarize: (1) NLRP3 (p < 0.05) (Figure 1A); (2) ASC (p < 0.01) (Figure 1B); (3) IL-18 (p < 0.001) (Figure 1D); (4) IL-1β (p < 0.001) (Figure 1E) mRNA expression was significantly upregulated in AD compared to HC.
An opposite trend was seen for Caspase-1 mRNA expression, which was upregulated in PBMC of HC compared to AD (p = 0.03) (Figure 1C).
D4T addition to cell cultures significantly reduced ASC, Caspase-1, IL-18 and IL-1β mRNA expression in both AD and HC (p < 0.05) (Figure 1B–E), and increased that of NLRP3 in AD patients alone (p < 0.05) (Figure 1A).

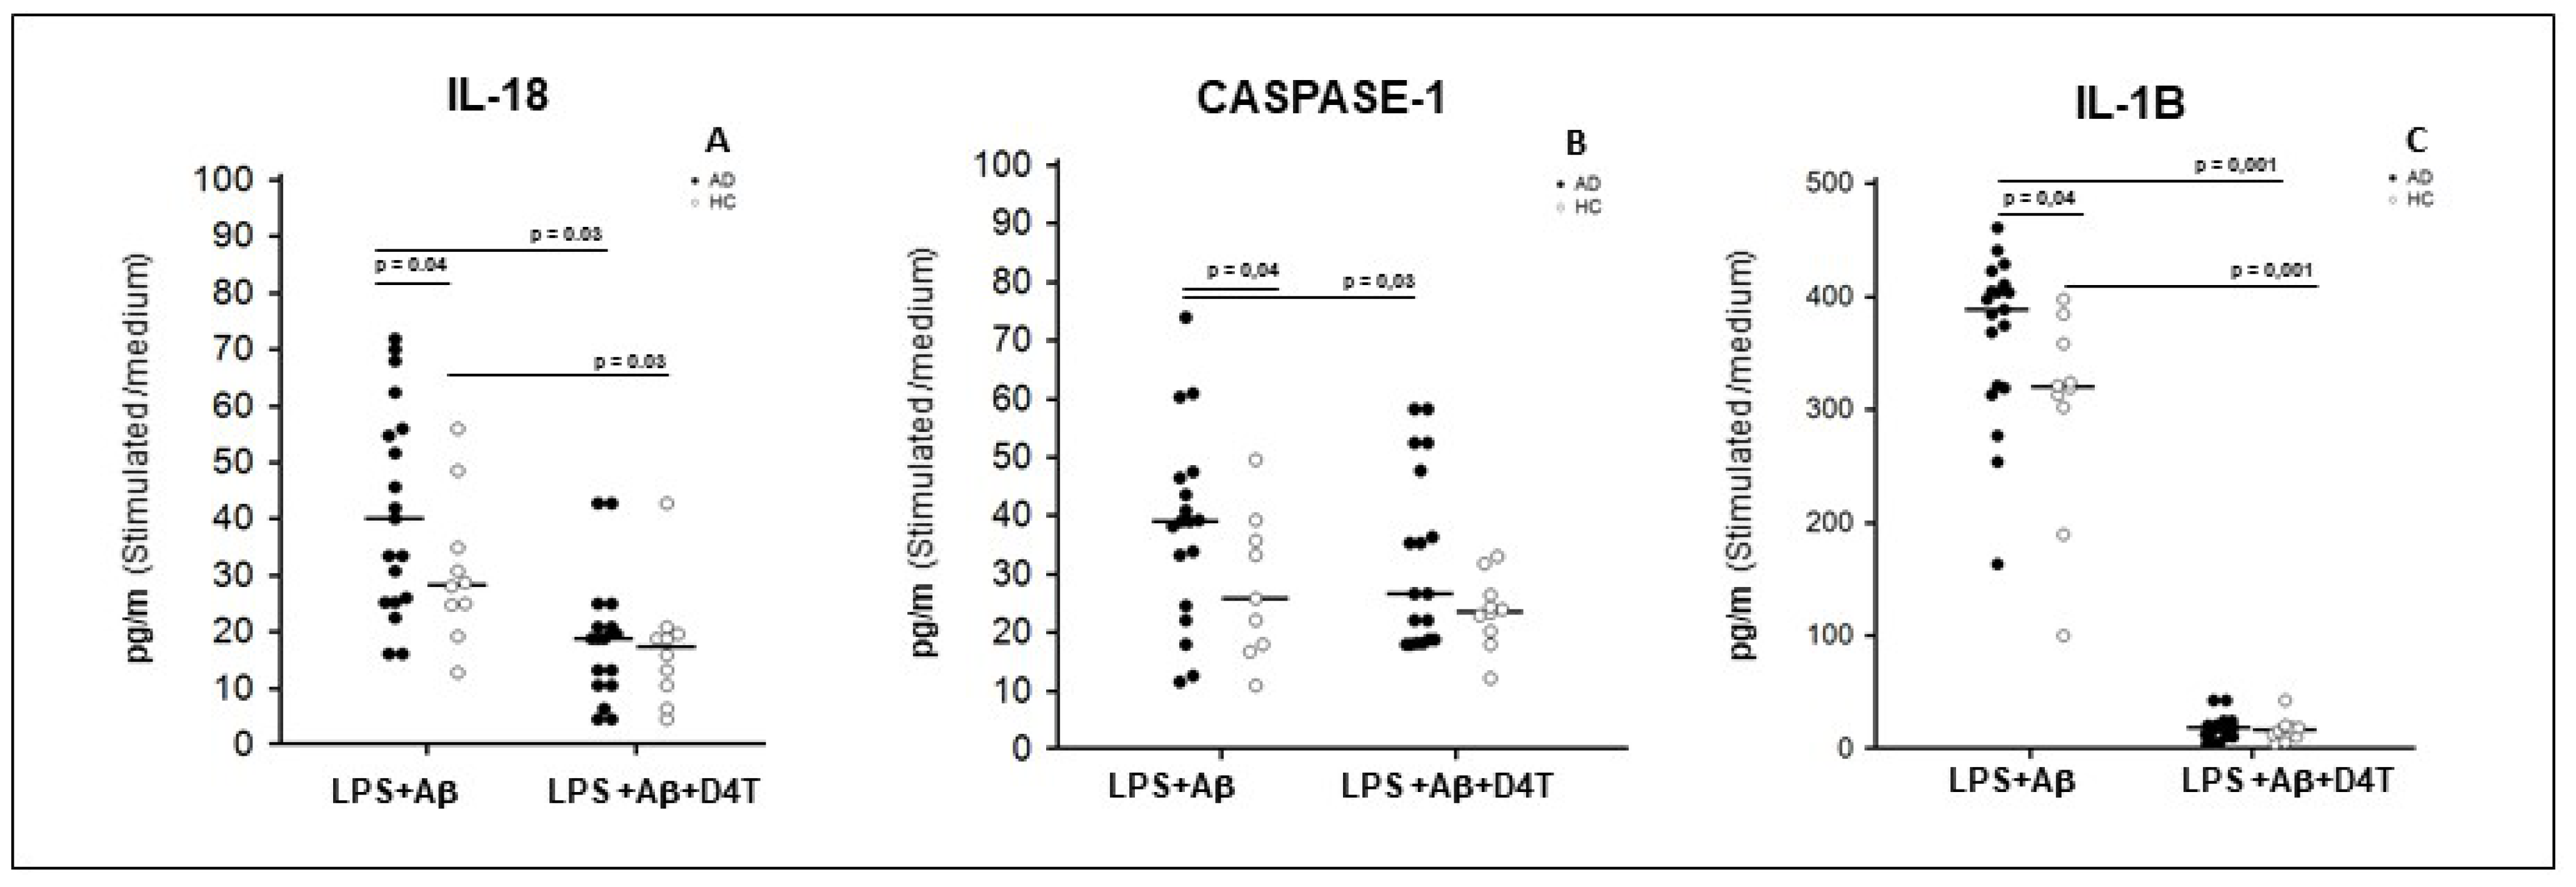
2.4. Inflammasome Related Cytokine Production in Supernatants of PBMC of AD Patients and HC

In in vitro LPS+Aβ42-stimulated PBMC, the production of IL-18, IL-1β and caspase-1 (p20 subunit) was significantly increased in AD patients compared to HC (p < 0.05) (Figure 2A–C). D4T addition to the culture significantly reduced IL-1β (p = 0.001) and IL-18 (p = 0.03) production in both AD and HC (Figure 2A–C); caspase-1 production was reduced in HC alone (p < 0.05) (Figure 2B). IL-18, IL-1β and caspase-1 were also significantly up-regulated in LPS+Aβ42 stimulated PBMC compared to unstimulated PBMC both for of AD patients and HC (p < 0.05) (see Supplementary Material).

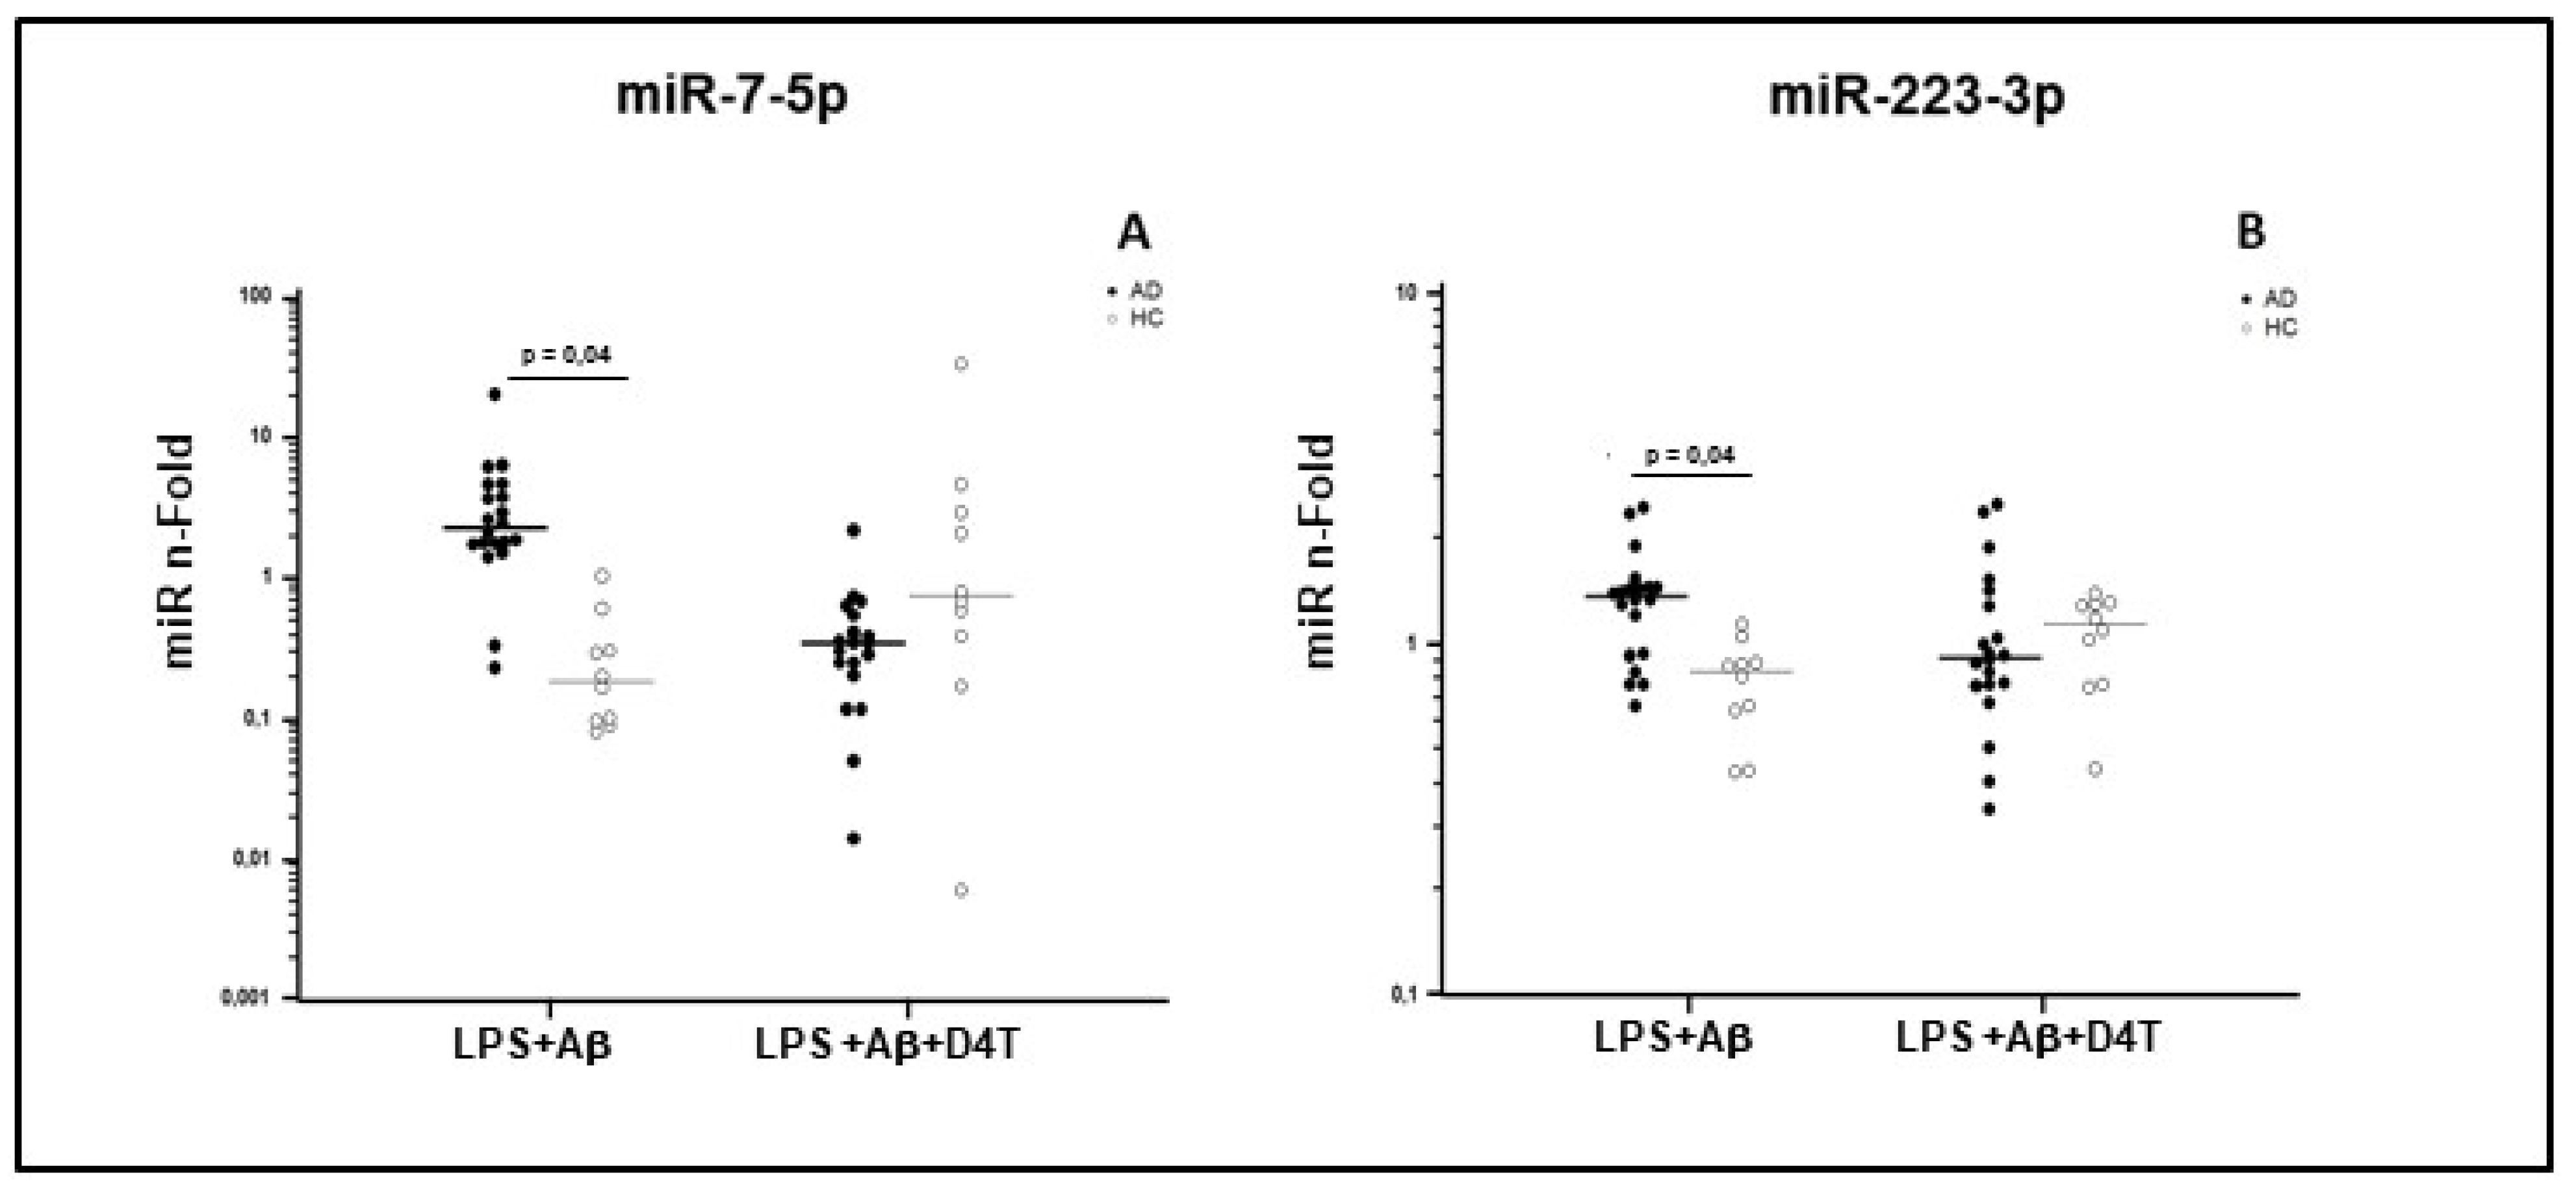
2.5. miRNAs Expression in PBMC of AD Patients and HC

To verify whether the expression of the miRNAs known to bind the 3′UTR region of NLRP3 is different in AD and HC, and whether such expression can be modulated by D4T, we analyzed the expression of miR-7-5p, miR-22-3p, miR-30e-5p, and miR-223-3p in PBMC of AD and HC that were either unstimulated or LPS- and Aβ42-stimulated in the absence/presence of D4T.
Results showed that miR-7-5p and miR-223-3p expression was significantly increased by LPS and Aβ42-stimulated PBMC of AD patients compared to HC (p < 0.05, Figure 3). Similar results were also observed for miR-30e-5p and for miR-22-3p, although without reaching statistical significance.
Interestingly, D4T treatment increased the expression of miR-7-5p and miR-223-3p in PBMC of HC, but it reduced such expression in AD patients, although without reaching statistical significance (Table 2). Taken together these results indicate an opposite modulation of miR-7-5p and miR-223-3p in PBMC of AD and HC subjects after stimulus with LPS+Aβ42 and with LPS+Aβ4 +D4T.

3. Discussion

A peculiar pattern of miRNA expression was suggested to characterize Alzheimer’s disease [26,27,28,29,30,31], a condition that is also associated with an excessive activation of the NLRP3 inflammasome [17,18,19]. Because the activation of the NLRP3 inflammasome was shown to be modulated by miRNAs [24,31,32], we decided to analyze whether the miRNAs profile seen in AD indicates a role of these non-coding RNAs in NLRP3 activation. Additionally, as D4T, an antiretroviral, was recently shown to inhibit the activation of the NLRP3 inflammasome, we verified if this effect is mediated by the modulation of miRNA expression.
Previous studies have documented that the expression of a number of miRNAs [33], including miR-223 [34,35], is dysregulated in AD and correlates with disease severity, supporting the idea that miR-223 might play a role in the pathogenesis of AD [35,36]. Three additional miRNAs, miR-7-5p, miR-22-3p, and miR-30-5p can bind to the UTR region of NLRP3-mRNA, hampering protein translation and blocking the inflammasome protein complex formation. Finally, other results reported a down-regulation of miR-7 and miR-30e in the brain [32] and a low expression of circulating miRNA-22 in AD patients [37].
In this work, the expression of miR-7-5p, miR-22-3p, miR-30e-5p and miR-223-3p was analyzed in AD patients and compared to that seen in age-matched healthy controls. The ability of D4T to modulate miRNA expression was analyzed as well. Results indicated that miR-223-3p and mir-7-5p are increased in AD patients compared to controls, but this does not result in down-regulation of the NLRP3-inflammasome expression and of IL-1β and IL-18 production. Interestingly, D4T increased miRNA expression in HC but had an opposite effect in AD, suggesting that miRNAs regulatory mechanisms might be altered in AD. Because the most striking differences in miRNA expression were seen when miR-223-3p and miR-7-5p were analyzed, we focused our attention on these two molecules.
miRNAs are powerful and sensitive post-transcriptional regulators of gene expression that directly target messenger RNAs (mRNAs) and inhibit mRNA stability and translation [38]. miR-223-3p, in particular, binds a highly conserved region of the 3′UTR Mrna of NLRP3 and is the best characterized NLRP3 miRNA inhibitor [24,39]. Herein, despite miR-223-3p expression being up-regulated in LPS primed and Aβ42-stimulated PBMC of AD patients, no significant reduction was observed in NLRP3 mRNA expression and this resulted in higher caspase-1 cleavage, IL-1β and IL-18 release. Previous experiments in primary human monocytes confirmed that miR-223-3p expression is inversely correlated with NLRP3 levels during macrophage differentiation: miR-223-3p is up-regulated in monocytes and is differently expressed when these cells mature into M1 or M2 macrophages [40]. This miRNA [38] was suggested not to trigger an immediate negative-feedback mechanism, but rather to modulate the priming signals needed to reach a certain “inflammatory level” that leads to the activation of the NLRP3 inflammasome. The paradoxical effect we observed, i.e., significant increase of miR-223-3p without a reduction of NLRP3 activation, could be justified by the use of whole peripheral lympho-monocytes that had not been previously differentiated in monocytes/macrophages, as in previous studies [38,40]. Alternatively, it is possible that the massive NLRP3 expression observed in LPS+ Aβ42-stimulated PBMC of AD overrules the inhibitory effect of miR-223-3p on NLRP3 activation, as was previously observed in an in vitro model of endothelial cells that were stimulated with the recombinant proteins of Treponema pallidum [41].
Our results confirm that D4T, an anti-retroviral drug, reduces NLRP3 inflammasome activation [20], showing a significant dampening effect on the generation of the NLRP3 inflammasome-downstream molecules ASC, Caspase-1, IL-1β and IL-18 mRNA. Interestingly, the effect of Stavudine was different in PBMC of AD patients and HC, as the compound decreased NLRP3 expression in HC but increased it in AD. The increased NLRP3 expression in the presence of a reduction in the concentration of its downstream inflammatory proteins is puzzling. It is known that mRNA could be transcribed without being translated into protein [42,43] and indeed, besides miR-7 5p and miR-223-3p, other miRNAs could be involved in NLRP3-mRNA post-transcriptional regulation; this will need to be further investigated.
To summarize the results of this pilot study: miR-7-5p and miR-223-3p expression in PBMC was increased in AD patients concomitantly with augmented activation of the NLRP3 inflammasome, and was reduced by D4T. These results suggest that these miRNAs are upregulated in AD in a futile attempt to dampen NLRP3 activation, possibly indicating that the inhibitory effect of these molecules on NLRP3 is lost in AD.

4. Materials and Methods

4.1. Patients and Controls

Twenty AD patients who fulfilled inclusion criteria for a clinical diagnosis of AD were enrolled from January 2017 to September 2018; these individuals were followed by the Neurology Clinic of Fondazione Cà Granda, IRCCS, Ospedale Maggiore Policlinico in Milan, Italy. The clinical diagnosis of AD was performed according to the NINCDS-ADRDA work group criteria [44] and the DMS IV–R [45]. Neuropsychological evaluation and psychometric assessment were performed with a Neuropsychological Battery [46,47]. All AD patients underwent complete medical and neurological evaluation, routine blood tests, brain MRI, and lumbar puncture (LP) for quantification of the CSF biomarkers Aβ, total tau (tau), and tau phosphorylated at position 181 (Ptau) [48].
Ten healthy sex and age matched healthy controls (HC) were also enrolled in the study; these individuals were volunteers without a family history of dementia or evidence of acute or chronic neurologic diseases at the time of enrollment, and were selected ac-cording to the SENIEUR protocol for immuno-gerontological studies of European Com-munity’s Control Action Programme on Aging [49]. The cognitive status of HC was assessed by MMSE (score for inclusion as normal control subjects ≥ 30). APOE genotyping, was available for all subjects and was determined by allelic discrimination [50]. The current study was approved by the Institutional Review Board of the Fondazione Cà Granda, IRCCS Ospedale Maggiore Policlinico (Milan, Italy) and conformed to the ethical principles of the Helsinki Declaration. All patients (or their legal guardians) and controls gave their written informed consent before entering the study. Epidemiological and clinical characterization of patients and controls is presented in Table 1.

4.2. Blood Sample Collection and Cell Separation

Whole blood was collected in vacutainer tubes containing ethylenediaminetet-raacetic acid (EDTA) (Becton Dickinson & Co., Rutherford, NJ, USA). Peripheral blood mononuclear cells (PBMC) were separated on lympholyte separation medium (Cedarlane, Hornby, Ontario, CA) and washed twice in PBS at 1500 RPM for 10 min; viable leukocytes were determined using a TC20 Automated Cell Counter (Biorad Hercules, CA, USA).

4.3. Cell Cultures

PBMC (3 × 10⁶/mL) were cultured in RPMI 1640 supplemented with 10% human serum, 2 mM L- glutamine, and 1% penicillin (Invitrogen, Ltd., Paisley, UK), incubated with lipopolysaccharide (LPS) (1 µg/mL) (Sigma-Aldrich, St. Louis, MO, USA) for 2 h, and then stimulated with Aβ42 (10 µg/mL Sigma-Aldrich, St. Louis, MO, USA) for 22 h in the absence/presence of D4T (50 µM) (Sigma-Aldrich) [25] at 37 °C in a humidified 5% CO2 atmosphere. Supernatants and PBMC pellets were collected at the end of the culture period.

4.4. D4T Cytotoxicity Assay

Cell toxicity of D4T was measured using MTT cell viability assay as previously described [51]. The 3-(4,5-Dimethylthiazol-2-yl)-2,5-diphenyltetrazolium bromide (MTT; Sigma-Aldrich St. Louis, MO, USA) powder was dissolved in PBS at the concentration of 5 mg/mL. PBMC cells were plated in 96-well plates at an initial density of 1×10⁵ cells/well and were treated with 50 μM concentration of D4T [25]. Cells were incubated at 37 °C for 22 h and centrifuged; pellets were dissolved using 100 μL/well of dimethyl sulfoxide (DMSO), and plates were read in a microplate reader using a test wavelength of 550 nm and a reference wavelength of 650 nm. Results were calculated as follows: % cytotoxicity = 100 − (OD test − OD control)/OD control × 100. Cell mortality was comparable (<5%) to unstimulated condition.

4.5. Total RNA Extraction

Total RNA was extracted from 3 × 10⁶ unstimulated or stimulated (see above) PBMCs using a column-based kit (miRNeasy Mini Kit, Qiagen GmbH, Hilden, Germany cat. 217004) according to the manufacturer’s protocol. RNA concentration was determined by a spectrophotometer (Nanoview plusTM, GE Healthcare, Little Chalfont, UK). Purity was determined as the 260/280 nm OD ratio, with the expected values between 1.8 and 2.0. RNA was treated with TURBO DNA-free DNAse (Ambion Inc., Austin, TX, USA).

4.6. NLRP3-Inflammasome Pathway Quantitative Transcriptional Analysis by Real Time PCR

A portion of the extracted-RNA (20 ng) was reverse-transcribed in cDNA using RT2 First Strand Kit (Qiagen, Hilden Germany) according to the manufacturer’s protocol. All NLRP3 (cat. PPH13170A), ASC (cat. PPH00907A), caspase-1 (cat.PPH00105C), IL-1β (cat. PPH72244A), and IL-18 (cat.PPH00580C) (Qiagen) primers were cDNA specific. Quantitative real-time RT-PCR (qPCR) was performed using a Biorad CFX Real-Time PCR instrument. mRNA expression of NLRP3, ASC, Caspase-1, IL-18 and IL-1β was analyzed using RT2 SYBR Green qPCR mastermix (Qiagen, Hilden Germany). Results are expressed as Ct and presented as the ratio between the target gene and the glyceraldehyde 3-phosphate dehydrogenase (GAPDH) (Qiagen) (cat. PPH68912A) housekeeping mRNA. Experiments were individually run on each one of the individuals included in the study.

4.7. miRNA Quantitative Analysis by Real Time PCR

Twenty nanograms of the extracted-RNA were retrotranscribed into cDNA using the universal cDNA synthesis kit (miRCURY LNA Universal cDNA synthesis kit, Qiagen, Hilden, Germany), according to the manufacturer’s protocol. Specific LNATM-individual microRNA assays (Qiagen, Hilden, Germany) were utilized to quantify hsa-miR-7-5p (cat.YP00205877), hsa-miR-22-3p (cat. YP00204606), hsa-miR-30e-5p (cat. YP00204714) and hsa-miR-223-3p (cat. YP00205986); reference miRNA (hsa-miR-103a, cat.204063) (Qiagen) was used to normalize the results. qPCR was performed using a real time PCR system (CFX96Touch real-time PCR Detection System, BioRad, Hercules, CA, USA) in 10 μL of reaction mix containing SYBR GREEN master mix (Exiqon Inc., Qiagen, Hilden, Germany), a specific primer set for each miRNA, and 4 μL of cDNA (30 × diluted). Each cDNA template was tested in triplicate. Negative controls, without rt-template controls, as well as no-template controls were included in each session. An additional step in the qPCR analysis was performed to evaluate the specificity of the amplification products by generating a melting curve for each reaction. For each sample, relative gene expression of the target miRNA was calculated as the ratio between the target gene and the endogenous reference miRNA [52] using the qBase+ software (version 3.0, Biogazelle, Belgium). Changes in miRNA expression (nFold) were calculated relative to unstimulated PBMC. miRNA relative expression was analyzed after logarithmic transformation.

4.8. Elisa

Concentrations of IL-1β, IL-18 and Caspase-1 in the supernatants of unstimulated and stimulated (see above) PBMC were analyzed by sandwich immunoassays according to the manufacturer’s instructions (Quantikine Immunoassay; R&D Systems, Minneapolis, MN, USA). A plate reader (Sunrise, Tecan, Mannedorf, Switzerland) was used and optical densities (OD) were determined at 450/620 nm. Sensitivity (S) and Assay Range (AR) were as follows: S: IL-1 = 1pg/mL; Caspase-1 = 1.24 pg/mL; IL-18 = 12.5 pg/mL. AR: IL-1 3.9–250 pg/mL; Caspase-1 = 6.3–400 pg/mL; IL-18 = 25.6–1000 pg/mL.

4.9. Statistical Analysis

Data analysis was performed using the MedCalc statistical package (MedCalc Soft-ware bvba, Mariakerke Belgium). For mRNA and miRNA expression, which was not normally distributed, the Mann–Whitney test was used to compare the fold change value in AD and HC (unpaired samples), while the Wilcoxon test was used to compare different stimuli (LPS+Aβ42 vs. LPS+ Aβ42 +D4T) within AD and HC (paired samples). For cytokine production, comparisons between AD and HC were based on the non-parametric Mann–Whitney test because the sample size was too small (20 AD and 10 HC) and the probability of normality test was greater than 0.05. All of the results are summarized as fold-change expression from the unstimulated samples. Summary results are shown in the dots-plot graphs. Horizontal bars indicate medians. p-Values of less than 0.05 were considered statistically significant.

Supplementary Materials

The supplementary materials are available online at www.mdpi.com/article/10.3390/ph14111187/s1.

Author Contributions

Conceptualization F.L.R., R.M., M.S. and M.C.; methodology, F.L.R., S.A., I.M., A.H. and F.P.; software, I.M.; validation, F.L.R. and M.S.; formal analysis, F.L.R. and R.M.; investigation, F.L.R. and R.M.; resources, F.L.R., R.M. and E.S.; data curation, F.L.R., R.M. and C.F.; writing—original draft preparation, F.L.R. and R.M.; writing—review and editing F.L.R. and MC.; supervision, M.C. and D.G.; project administration: F.L.R., R.M., M.S. and M.C.; funding acquisition, M.C. All authors have read and agreed to the published version of the manuscript.

Funding

This research was supported by the Italian Ministry of Health (RC 2018-2019).

Institutional Review Board Statement

The study was conducted according to the guidelines of the Declaration of Helsinki, and approved by Ethics Committee of Institutional Review Board of the Fondazione Cà Granda, IRCCS Ospedale Maggiore Policlinico (Milan, Italy) (protocol code 10_07/02/2018 and approvate in date 7 February 2018).

Informed Consent Statement

Informed consent was obtained from all subjects involved in the study.

Data Availability Statement

Data is contained within the article.

Acknowledgments

We thank all the subjects that collaborated at this study.

Conflicts of Interest

The authors declare no conflict of interest.

References

  1. Hardy, J.; Allsop, D. Amyloid deposition as the central event in the aetiology of Alzheimer’s disease. Trends Pharmacol. Sci. 1991, 12, 383–388. [Google Scholar] [CrossRef]
  2. Heppner, F.; Ransohoff, R.M.; Becher, B. Immune attack: The role of inflammation in Alzheimer disease. Nat. Rev. Neurosci. 2015, 16, 358–372. [Google Scholar] [CrossRef] [PubMed]
  3. Heneka, M.T.; Carson, M.J.; El Khoury, J.; Landreth, G.E.; Brosseron, F.; Feinstein, D.L.; Jacobs, A.H.; Wyss-Coray, T.; Vitorica, J.; Ransohoff, R.M.; et al. Neuroinflammation in Alzheimer’s disease. Lancet Neurol. 2015, 14, 388–405. [Google Scholar] [CrossRef] [Green Version]
  4. Fiala, M.; Zhang, L.; Gan, X.; Sherry, B.; Taub, D.; Graves, M.C.; Hama, S.; Way, D.; Weinand, M.; Lorton, D. Amyloid-beta induces chemokine secretion and monocyte migration across a human blood-brain barrier model. Mol. Med. 1998, 4, 480–489. [Google Scholar] [CrossRef] [PubMed] [Green Version]
  5. Feng, Y.; Li, L.; Sun, X.-H. Monocytes and Alzheimer’s disease. Neurosci. Bull. 2011, 27, 115–122. [Google Scholar] [CrossRef] [Green Version]
  6. Takeshita, Y.; Ransohoff, R.M. Inflammatory cell trafficking across the blood-brain barrier: Chemokine regulation and in vitro models. Immunol. Rev. 2012, 248, 228–239. [Google Scholar] [CrossRef] [PubMed] [Green Version]
  7. Corraliza, I. Recruiting specialized macrophages across the borders to restore brain functions. Front. Cell. Neurosci. 2014, 8, 262. [Google Scholar] [CrossRef] [Green Version]
  8. Zenaro, E.; Piacentino, G.; Constantin, G. The blood-brain barrier in Alzheimer’s disease. Neurobiol. Dis. 2016, 107, 41–56. [Google Scholar] [CrossRef] [Green Version]
  9. Vérité, J.; Page, G.; Paccalin, M.; Julian, A.; Janet, T. Differential chemokine expression under the control of peripheral blood mononuclear cells issued from Alzheimer’s patients in a human blood brain barrier model. PLoS ONE 2018, 13, e0201232. [Google Scholar] [CrossRef] [PubMed]
  10. Schroder, K.; Tschopp, J. The inflammosomes. Cell 2010, 140, 821–832. [Google Scholar] [CrossRef] [PubMed] [Green Version]
  11. Martinon, F.; Burns, K.; Tschopp, J. The inflammasome: A molecular platform triggering activation of inflammatory caspases and processing of proIL-beta. J. Mol. Cell 2002, 10, 417–426. [Google Scholar] [CrossRef]
  12. Lamkanfi, M. Emerging inflammasome effector mechanisms. Nat. Rev. Immunol. 2011, 11, 213–220. [Google Scholar] [CrossRef]
  13. Broz, P.; Dixit, V.M. Inflammasomes: Mechanism of assembly, regulation and signalling. Nat. Rev. Immunol. 2016, 16, 407–420. [Google Scholar] [CrossRef] [PubMed]
  14. Hornung, V.; Ablasser, A.; Charrel-Dennis, M.; Bauernfeind, F.; Horvath, G.; Caffrey, D.R.; Latz, E.; Fitzgerald, K.A. AIM2 recognizes cytosolic dsDNA and forms a caspase-1-activating inflammasome with ASC. Nature 2009, 458, 514–518. [Google Scholar] [CrossRef] [Green Version]
  15. Latz, E.; Xiao, T.; Stutz, A. Activation and regulation of the inflammasomes. Nat. Rev. Immunol. 2013, 13, 397–411. [Google Scholar] [CrossRef]
  16. Vanaja, S.K.; Rathinam, V.A.; Fitzgerald, K.A. Mechanisms of inflammasome activation: Recent advances and novel insights. Trends Cell Biol. 2015, 25, 308–315. [Google Scholar] [CrossRef] [PubMed] [Green Version]
  17. Halle, A.; Hornung, V.; Petzold, G.C.; Stewart, C.R.; Monks, B.G.; Reinheckel, T.; Fitzgerald, K.A.; Latz, E.; Moore, K.J.; Golenbock, D.T. The NALP3 inflammasome is involved in the innate immune response to amyloid-beta. Nat. Immunol. 2008, 9, 857–865. [Google Scholar] [CrossRef] [PubMed] [Green Version]
  18. Heneka, M.T.; Kummer, M.P.; Stutz, A.; Delekate, A.; Schwartz, S.; Vieira-Saecker, A.; Griep, A.; Axt, D.; Remus, A.; Tzeng, T.C.; et al. NLRP3 is activated in Alzheimer’s disease and contributes to pathology in APP/PS1 mice. Nature 2013, 493, 674–678. [Google Scholar] [CrossRef]
  19. Saresella, M.; La Rosa, F.; Piancone, F.; Zoppis, M.; Marventano, I.; Calabrese, E.; Rainone, V.; Nemni, R.; Mancuso, R.; Clerici, M. The NLRP3 and NLRP1 inflammasomes are activated in Alzheimer’s disease. Mol. Neurodegener. 2016, 11, 1–14. [Google Scholar] [CrossRef] [Green Version]
  20. Fowler, B.J.; Gelfand, B.D.; Kim, Y.; Kerur, N.M.; Tarallo, V.; Hirano, Y.; Amarnath, S.; Fowler, D.H.; Radwan, M.; Young, M.T.; et al. Nucleoside reverse transcriptase inhibitors possess intrinsic anti-inflammatory activity. Science 2014, 346, 1000–1003. [Google Scholar] [CrossRef] [Green Version]
  21. La Rosa, F.; Saresella, M.; Marventano, I.; Piancone, F.; Ripamonti, E.; Al-Daghri, N.; Bazzini, C.; Zoia, C.P.; Conti, E.; Ferrarese, C.; et al. Stavudine Reduces NLRP3 Inflammasome Activation and Modulates Amyloid-β Autophagy. J. Alzheimers Dis. 2019, 72, 401–412. [Google Scholar] [CrossRef] [PubMed]
  22. Shao, B.-Z.; Xu, Z.-Q.; Han, B.-Z.; Su, D.-F.; Liu, C. NLRP3 inflammasome and its inhibitors: A review. Front. Pharmacol. 2015, 6, 262. [Google Scholar] [CrossRef] [Green Version]
  23. Lewis, B.P.; Burge, C.B.; Bartel, D.P. Conserved seed pairing, often flanked by adenosines, indicates that thousands of human genes are microRNA targets. Cell 2005, 120, 15–20. [Google Scholar] [CrossRef] [Green Version]
  24. Xie, Y.; Tang, L.; Han, Y.L.; Yang, L.; Xie, G.X.; Peng, J.W.; Tian, C.; Zhou, X.; Liu, Q.; Rong, X.M.; et al. Reduction in nitrogen fertilizer applications by the use of polymer-coated urea: Effect on maize yields and environmental impacts of nitrogen losses. J. Sci. Food Agric. 2019, 99, 2259–2266. [Google Scholar] [CrossRef]
  25. Gray, L.; Tachedjian, G.; Ellett, A.M.; Roche, M.; Cheng, W.-J.; Guillemin, G.; Brew, B.; Turville, S.; Wesselingh, S.L.; Gorry, P.R.; et al. The NRTIs Lamivudine, Stavudine and Zidovudine Have Reduced HIV-1 Inhibitory Activity in Astrocytes. PLoS ONE 2013, 8, e62196. [Google Scholar] [CrossRef] [Green Version]
  26. Cogswell, J.P.; Ward, J.; Taylor, I.A.; Waters, M.; Shi, Y.; Cannon, B.; Kelnar, K.; Kemppainen, J.; Brown, D.; Chen, C.; et al. Identification of miRNA changes in Alzheimer’s disease brain and CSF yields putative biomarkers and insights into disease pathways. J. Alzheimers Dis. 2008, 14, 27–41. [Google Scholar] [CrossRef] [PubMed]
  27. Eacker, S.M.; Dawson, T.M.; Dawson, V.L. Understanding microRNAs in neurodegeneration. Nat. Rev. Neurosci. 2009, 10, 837–841. [Google Scholar] [CrossRef]
  28. Provost, P. Interpretation and applicability of microRNA data to the context of Alzheimer’s and age-related diseases. Aging 2010, 2, 166–169. [Google Scholar] [CrossRef] [PubMed] [Green Version]
  29. Sonntag, K.C. MicroRNAs and deregulated gene expression networks in neurodegeneration. Brain Res. 2010, 1338, 48–57. [Google Scholar] [CrossRef] [Green Version]
  30. Miñones-Moyano, E.; Porta, S.; Escaramis, G.; Rabionet, R.; Iraola, S.; Kagerbauer, B.; Espinosa-Parrilla, Y.; Ferrer, I.; Estivill, X.; Martì, E. MicroRNA profiling of Parkinson’s disease brains identifies early down regulation of miR-34b/c which modulate mi-tochondrial function. Hum. Mol. Genet. 2011, 20, 3067–3078. [Google Scholar] [CrossRef] [PubMed]
  31. Filipowicz, W.; Bhattacharyya, S.N.; Sonenberg, N. Mechanisms of post-transcriptional regulation by mi-croRNAs: Are the answers in sight? Nat. Rev. Genet. 2008, 9, 102–114. [Google Scholar] [CrossRef] [PubMed]
  32. Tezcan, G.; Martynova, E.V.; Gilazieva, Z.E.; McIntyre, A.; Rizvanov, A.A.; Khaiboullina, S.F. MicroRNA Post-transcrip-tional Regulation of the NLRP3 Inflammasome in Immunopathologies. Front. Pharmacol. 2019, 1, 451. [Google Scholar] [CrossRef] [PubMed] [Green Version]
  33. Wu, H.Z.; Ong, K.L.; Seeher, K.; Armstrong, N.J.; Thalamuthu, A.; Brodaty, H.; Schadev, P.; Mather, K. Circulating microRNAs as biomarkers of Alz-heimer’s disease: Asystematic review. J. Alzheimers Dis. 2015, 49, 755–766. [Google Scholar] [CrossRef] [PubMed]
  34. Li, M.; Zhang, J. Circulating microRNAs: Potential and emergingbiomarkers for diagnosis of cardiovascular and cere-bro-vascular diseases. Biomed. Res. Int. 2015, 2015, 730535. [Google Scholar] [PubMed]
  35. Mancuso, R.; Agostini, S.; Hernis, A.; Zanzottera, M.; Bianchi, A.; Clerici, M. Circulatory miR-223–3 p Discriminates Between Parkinson’s and Alzheimer’s Patients. Sci. Rep. 2019, 9, 9393. [Google Scholar] [CrossRef]
  36. Jia, L.H.; Liu, Y.N. Downregulated serum miR-223 servers as biomarker in Alzheimer’s disease. Cell Biochem. Funct. 2016, 34, 233–237. [Google Scholar] [CrossRef]
  37. Chenyang, H.; Li, G.; Yi, Y.; Qiaobing, G.; Heping, S.; Yongjia, S.; Qingcai, J. Mechanism of mi-croRNA-22 in regulating neuroinflammation in Alzheimer’s disease. Brain Behav. 2020, 10, e01627. [Google Scholar] [CrossRef]
  38. Junichi, S. Molecular network analysis of human microRNA targetome: From cancers to Alzheimer’s disease. BioData Min. 2012, 5, 17. [Google Scholar] [CrossRef] [Green Version]
  39. Dorhoi, A.; Iannaccone, M.; Farinacci, M.; Fae, K.C.; Schreiber, J.; Moura-Alves, P.; Nouailles, G.; Mollenkopf, H.J.; Oberbeck-Muller, D.; Jorg, S.; et al. MicroRNA-223 controls sus-ceptibility to tuberculosis by regulating lung neutrophil recruitment. J. Clin. Investig. 2013, 123, 4836–4848. [Google Scholar] [CrossRef] [Green Version]
  40. Awad, F.; Assrawi, E.; Jumeau, C.; Lavialle, S.G.; Cobret, L.; Duquesnoy, P.; Piterboth, W.; Thomas, L.; Stankovic-Stojanovic, K.; Louvrier, C.; et al. Impact of human monocyte and mac-rophage polarization on NLR expression and NLRP3 inflammasome activation. PLoS ONE 2017, 12, e0175336. [Google Scholar] [CrossRef]
  41. Long, F.Q.; Kou, C.X.; Li, K.; Wu, Q.; Wang, Q. MiR-223–3 p inhibits rTp17-induced inflammasome activation and pyroptosis by targeting NLRP3. J. Cell Mol. Med. 2020, 24, 14405–14414. [Google Scholar] [CrossRef]
  42. Krol, J.; Loedige, I.; Filipowicz, W. The widespread regulation of microRNA biogenesis, function and decay. Nat. Rev. Genet. 2010, 11, 597–610. [Google Scholar] [CrossRef]
  43. Yates, L.A.; Norbury, C.J.; Gilbert, R.J. The long and short of microRNA. Cell 2013, 153, 516–519. [Google Scholar] [CrossRef] [PubMed] [Green Version]
  44. McKhann, G.; Drachman, D.; Folstein, M.; Katzman, R.; Price, D.; Stadlan, E.M. Clinical diagnosis of Alzheimer’s disease: Report of the NINCDS-ADRDA Work Group under the auspices of Department of Health and Human Services Task Force on Alzheimer’s Disease. Neurology 1984, 34, 939. [Google Scholar] [CrossRef] [Green Version]
  45. American Psychiatric Association. Diagnostic and Statistical Manual of Mental Disorders DSM-IV-R. 1994. Available online: http://www.psychiatryonline.com/DSMPDF/dsm-iv.pdf (accessed on 20 May 2021).
  46. Folstein, M.F.; Folstein, S.E.; McHugh, P.R. “Mini-mental state”. A practical method for grading the cognitive state of patients for the clinician. J. Psychiatr. Res. 1975, 12, 189–198. [Google Scholar] [CrossRef]
  47. Hughes, C.P.; Berg, L.; Danziger, W.L.; Coben, L.A.; Martin, R.L. A New Clinical Scale for the Staging of Dementia. Br. J. Psychiatry 1982, 140, 566–572. [Google Scholar] [CrossRef]
  48. Galimberti, D.; Bonsi, R.; Fenoglio, C.; Serpente, M.; Cioffi, S.M.G.; Fumagalli, G.; Arighi, A.; Ghezzi, L.; Arcaro, M.; Mercurio, M.; et al. Inflammatory molecules in Frontotemporal Dementia: Cerebrospinal fluid signature of progranulin mutation carriers. Brain Behav. Immun. 2015, 49, 182–187. [Google Scholar] [CrossRef] [PubMed]
  49. Ligthart, G.J.; Corberand, J.X.; Fournier, C.; Galanaud, P.; Hijmans, W.; Kennes, B.; Müller-Hermelink, H.K.; Steinmann, G.G. Admission criteria for immuno immunogerontological studies in man: The SENIEUR protocol. Mech. Ageing Dev. 1984, 28, 47–55. [Google Scholar] [CrossRef]
  50. Koch, W.; Teipel, S.; Mueller, S.; Benninghoff, J.; Wagner, M.; Bokde, A.L.W.; Hampel, H.; Coates, U.; Reiser, M.; Meindl, T. Diagnostic power of default mode network resting state fMRI in the detection of Alzheimer’s disease. Neurobiol. Aging 2012, 33, 466–478. [Google Scholar] [CrossRef]
  51. Mosmann, T. Rapid colorimetric assay for cellular growth and survival: Application to proliferation and cytotoxicity assays. J. Immunol. Methods 1983, 65, 55–63. [Google Scholar] [CrossRef]
  52. Fleige, S.; Pfaffl, M.W. RNA integrity and the effect on the real-time qRT-PCR performance. Mol. Asp. Med. 2006, 27, 126–139. [Google Scholar] [CrossRef] [PubMed]
Figure 1. Genes of inflammasome complex. Expression of mRNA for Nod-like receptor protein 3 (NLRP3) (A), ASC (B), caspase-1 (C), IL-18 (D), and IL-1β (E) is shown. Results were obtained after the samples were primed with lipopolysaccharide (LPS) (1 μg/mL) and stimulated with Aβ42 (10 µg/mL) in the presence/absence of D4T (Stavudine) (50 µM) PBMC of AD (black dots) patients and Healthy Controls (HC) (white dots). Summary results are shown in the dots-plot-graphs and are expressed as the fold change (n-fold) between results obtained in stimulated cells/medium (unstimulated cells). NLRP3, ASC, Caspase-1, IL-18 and IL-1β gene expression was calculated relative to the GAPDH housekeeping gene. Horizontal bars indicate medians. Statistical significance is shown.
Pharmaceuticals 14 01187 g001
Figure 2. Cytokines and caspase-1 production. IL-18 (A), Caspase-1 (B), and IL-1β (C), production was assessed by multiplex ELISA in supernatants primed with lipopolysaccharide (LPS) (1 μg/mL) and stimulated with Aβ42 (10 µg/mL) in the presence/absence of D4T (Stavudine) (50 µM) PBMC of AD (black dots) patients and Healthy Controls (HC) (white dots). Summary results are shown in the dots-plot-graphs. Summary results are shown in the dots-plot graphs are expressed as the cytokines and caspase-1 production (pg/mL) between results obtained in stimulated cells/medium (unstimulated cells). Horizontal bars indicate medians. Statistical significance is shown.
Pharmaceuticals 14 01187 g002
Figure 3. miR-7-5p (A) and miR-223-3p (B) concentration. Results were obtained after samples were primed with lipopolysaccharide (LPS) (1 μg/mL) and stimulated with Aβ42 (10 µg/mL) in the presence/absence of D4T (Stavudine) (50 µM) PBMC of AD (black dots) patients and Healthy Controls (HC) (white dots). Summary results are shown in the dots-plot-graphs and are expressed as the fold change (n-fold) between results obtained in stimulated cells/medium (unstimulated cells). Row data were normalized relative to a reference miRNA (miR-103-3p). Horizontal bars indicate medians. Statistical significance is shown.
Pharmaceuticals 14 01187 g003
Table 1. Demographic, clinical and genetic characteristics of the individuals enrolled in the study.
ADHC
N2010
Gender (M:F)05:0504:06
Age (years)76 a ± 5.9 b72 a ± 6.2 b
Level of education (years)8.25 a ± 2.71 b7.62 a ± 3.62 b
MMSE (Baseline)21 a ± 2.9 b>28
APOE e-4 cariers (%)20 a20 a
Amyloid-β (pg/mL)486 a ± 109 b_
Total-tau (pg/mL)747 a ± 206 b_
P-tau (pg/mL)84 a ± 44 b_
Data are expressed as mean (a) ± standard deviation (b). MMSE: Mini-Mental State Examination.
Table 2. Summary results of miRNA expression in PBMC of AD patients and HC.
ADHC
ConditionNMedianIQRNMedianIQR
miR-7LPS+Aβ202.1701.625–4.455100.1000.083–0.823
LPS+Aβ+D4T0.3550.250–0.6400.8100.225–4.185
miR-223LPS+Aβ201.4240.964–1.511100.8650.659–0.920
LPS+Aβ+D4T0.9930.737–1.3961.0870.755–1.281
Publisher’s Note: MDPI stays neutral with regard to jurisdictional claims in published maps and institutional affiliations.

