
A Review of Mathematics Determining Solute Uptake at the Blood–Brain Barrier in Normal and Pathological Conditions

 , , , ,
Abstract
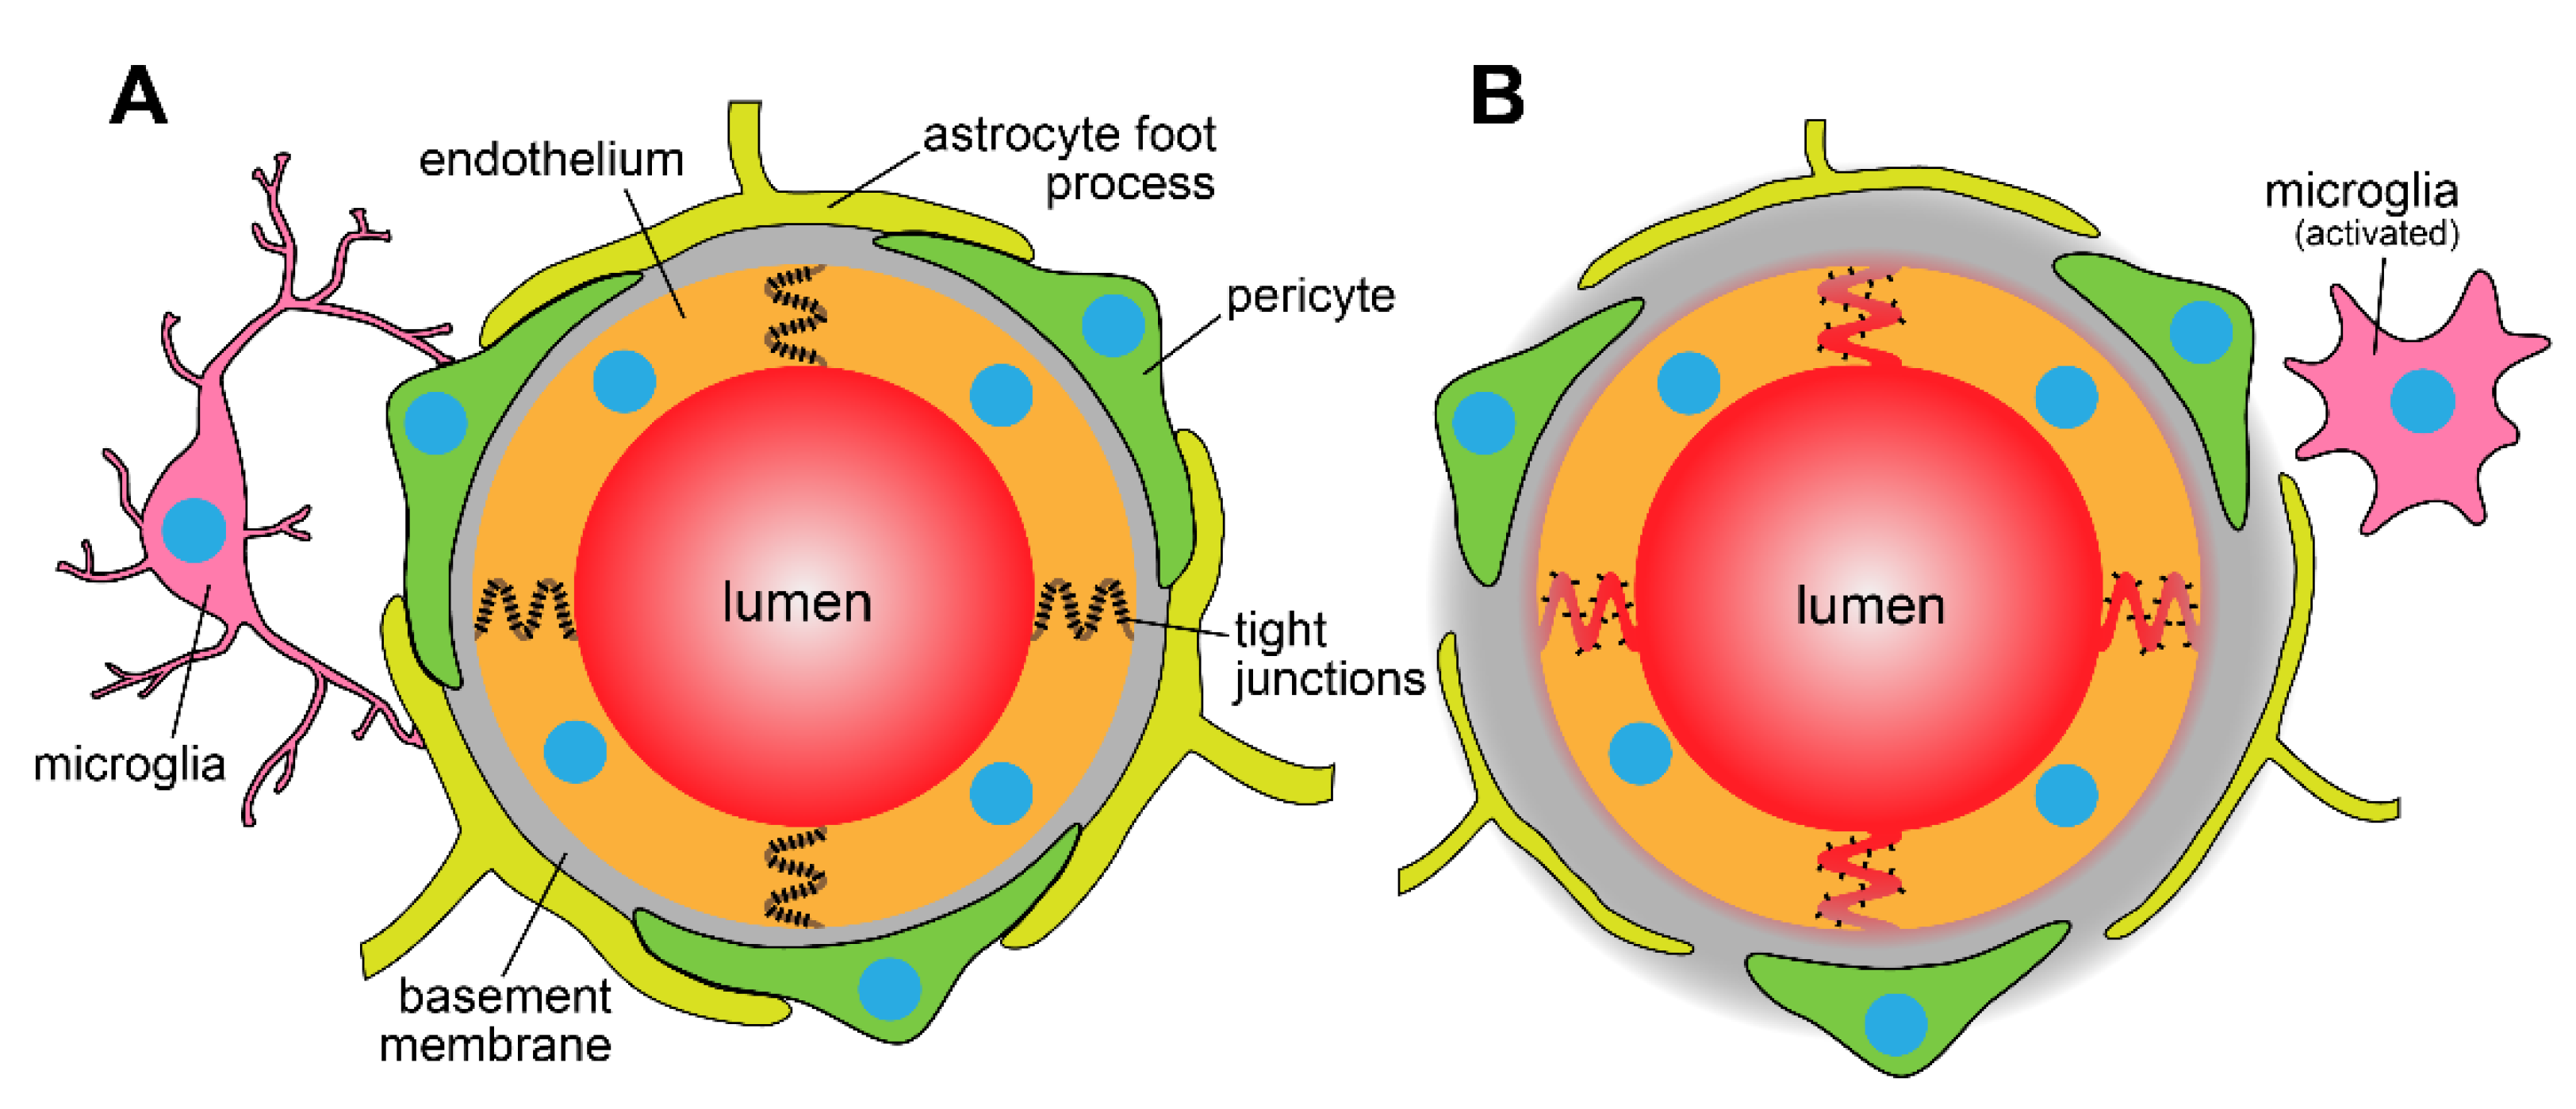
:1. The Blood–Brain Barrier
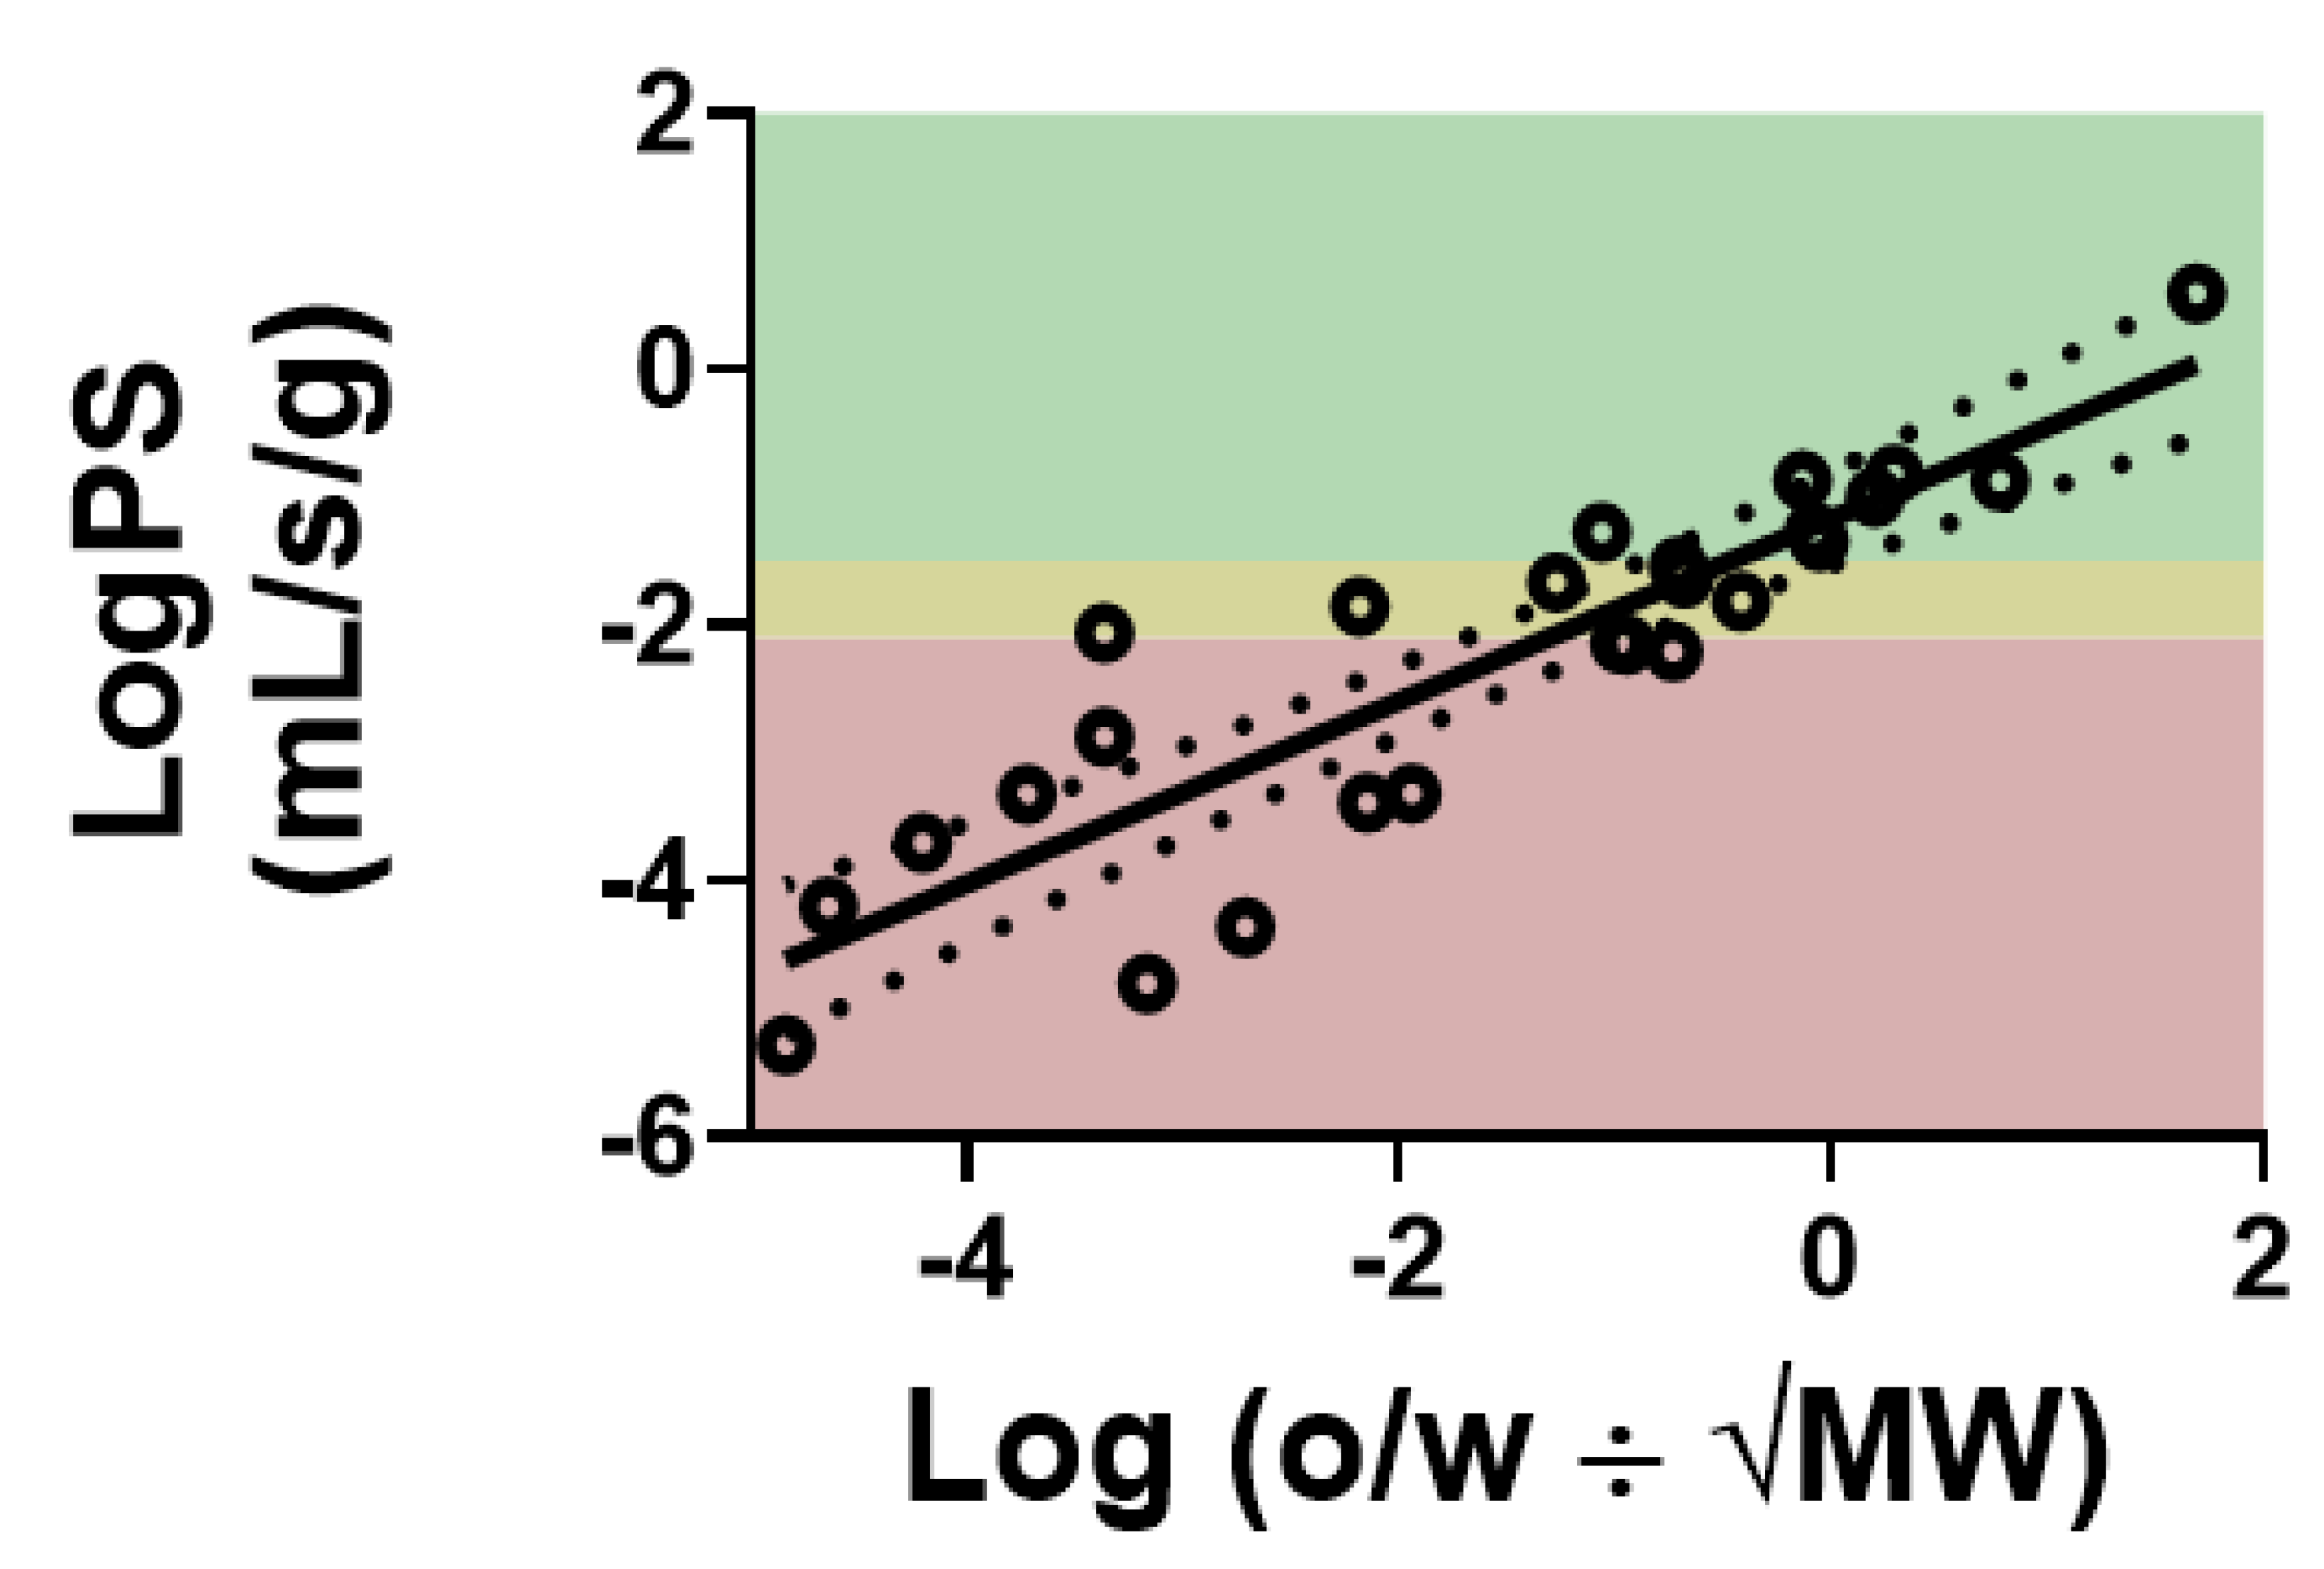
2. Mapping Drug Kinetics at the Blood–Brain Barrier
3. Active Efflux at the Blood–Brain Barrier
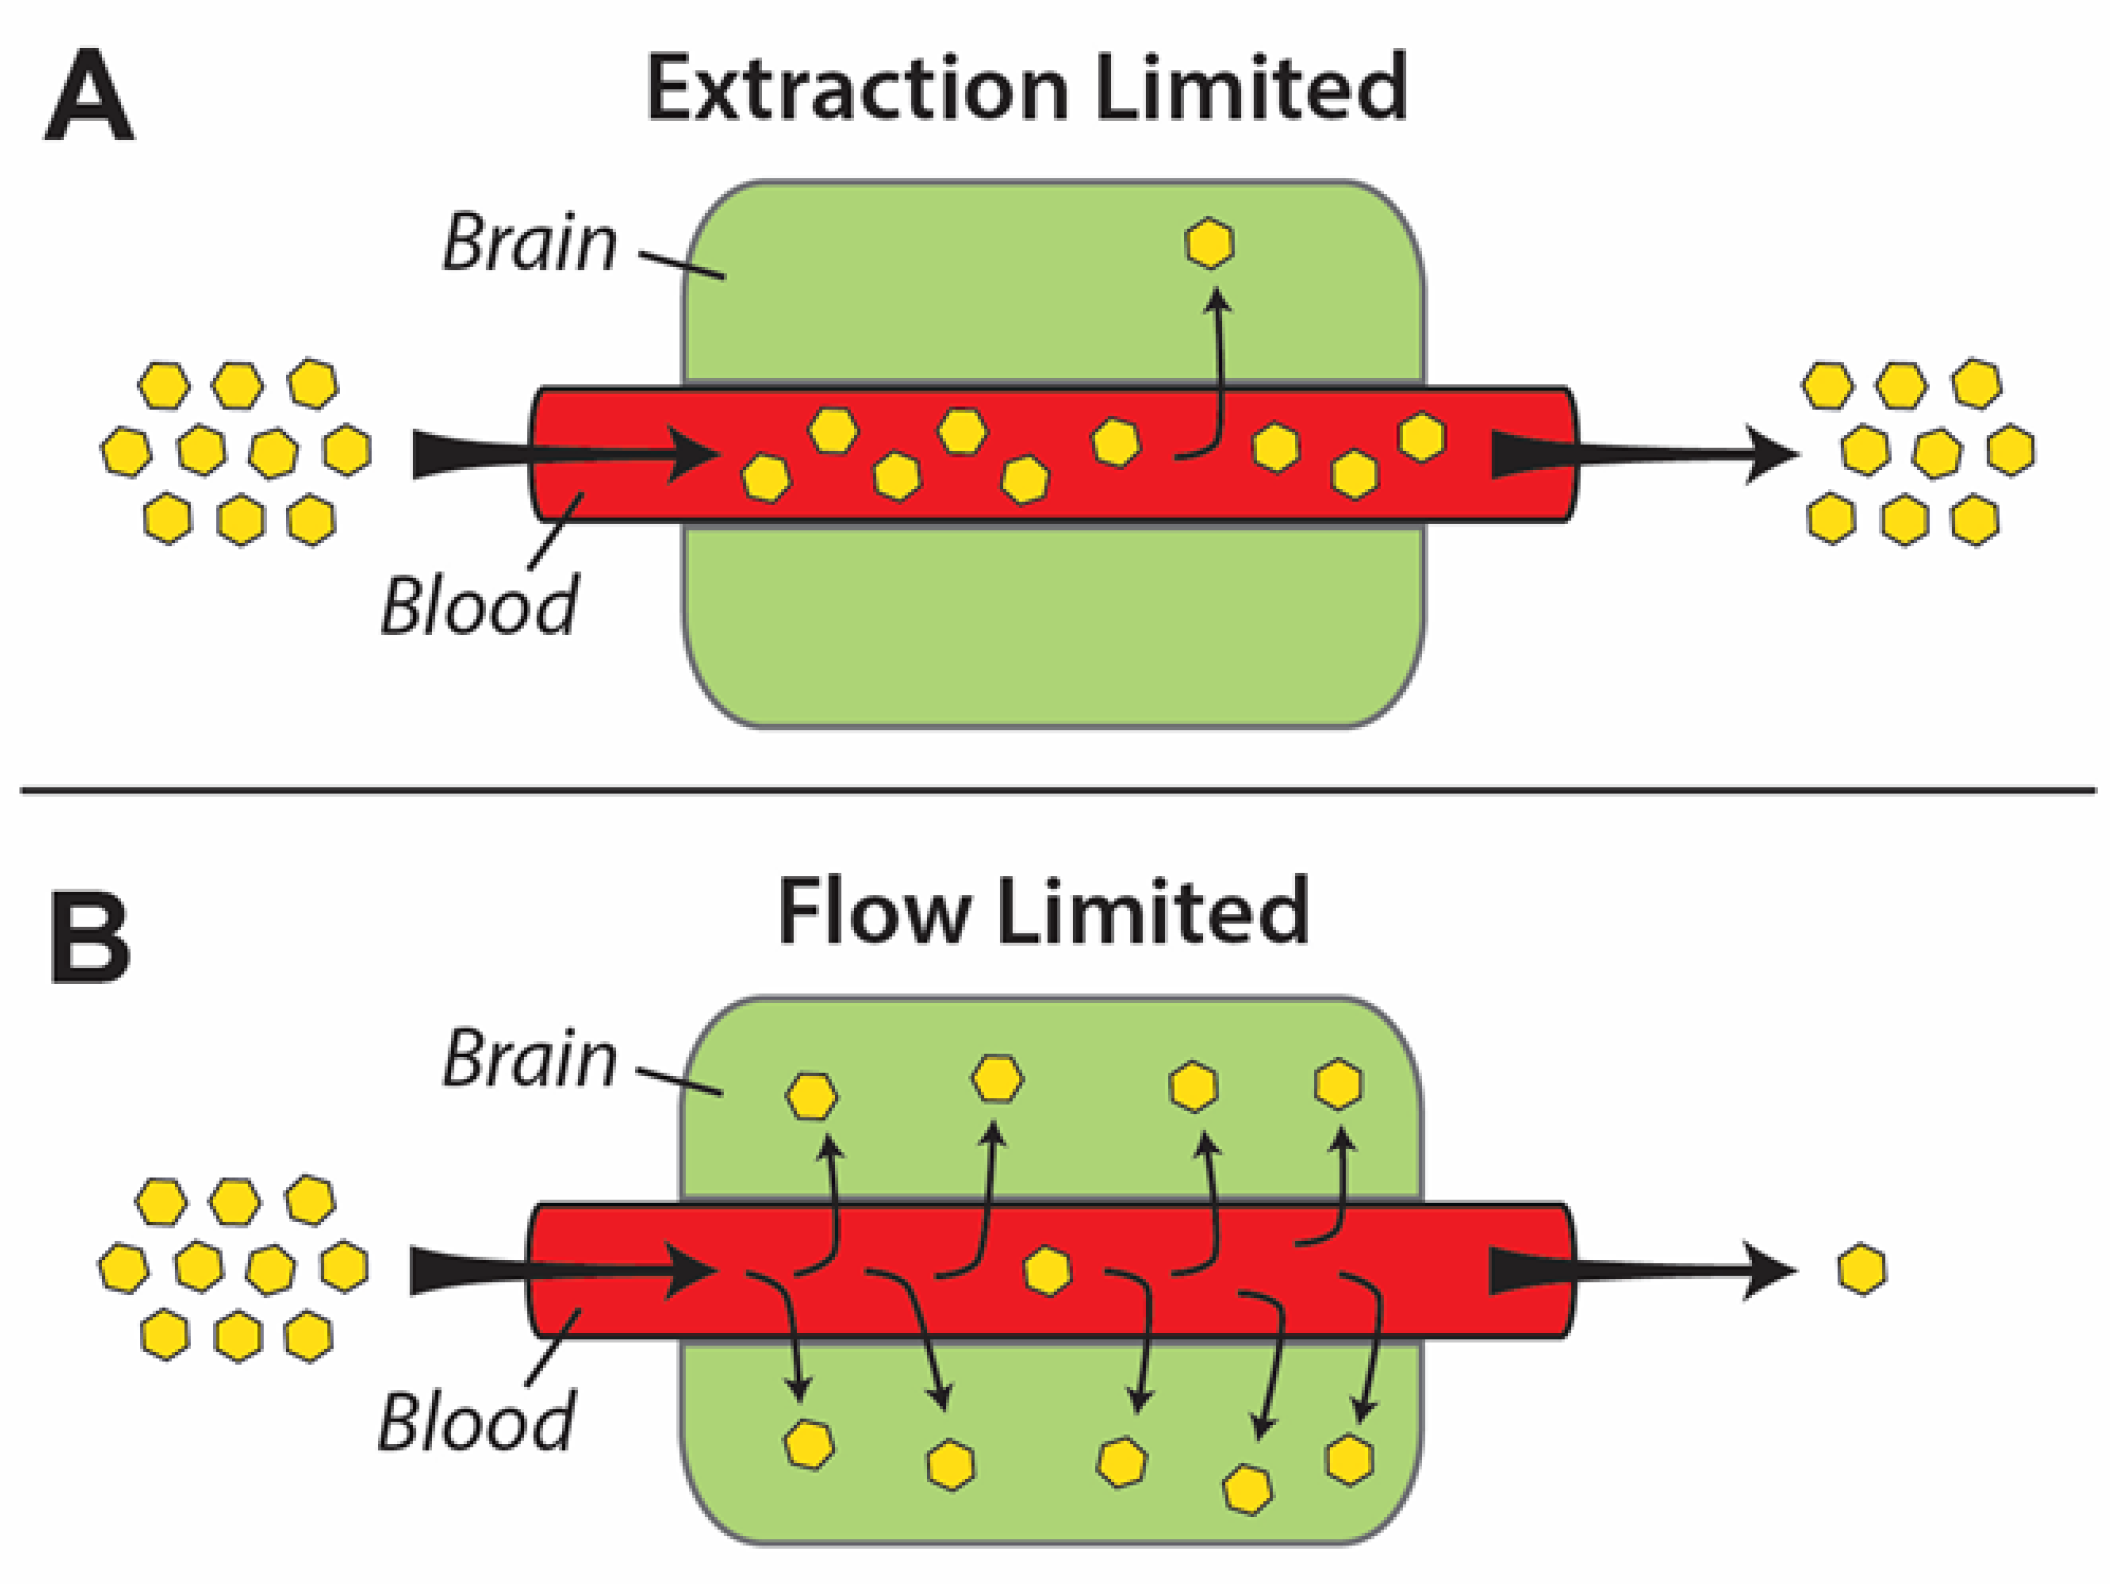
4. Flow- vs. Perfusion-Limited Blood–Brain Barrier Transport
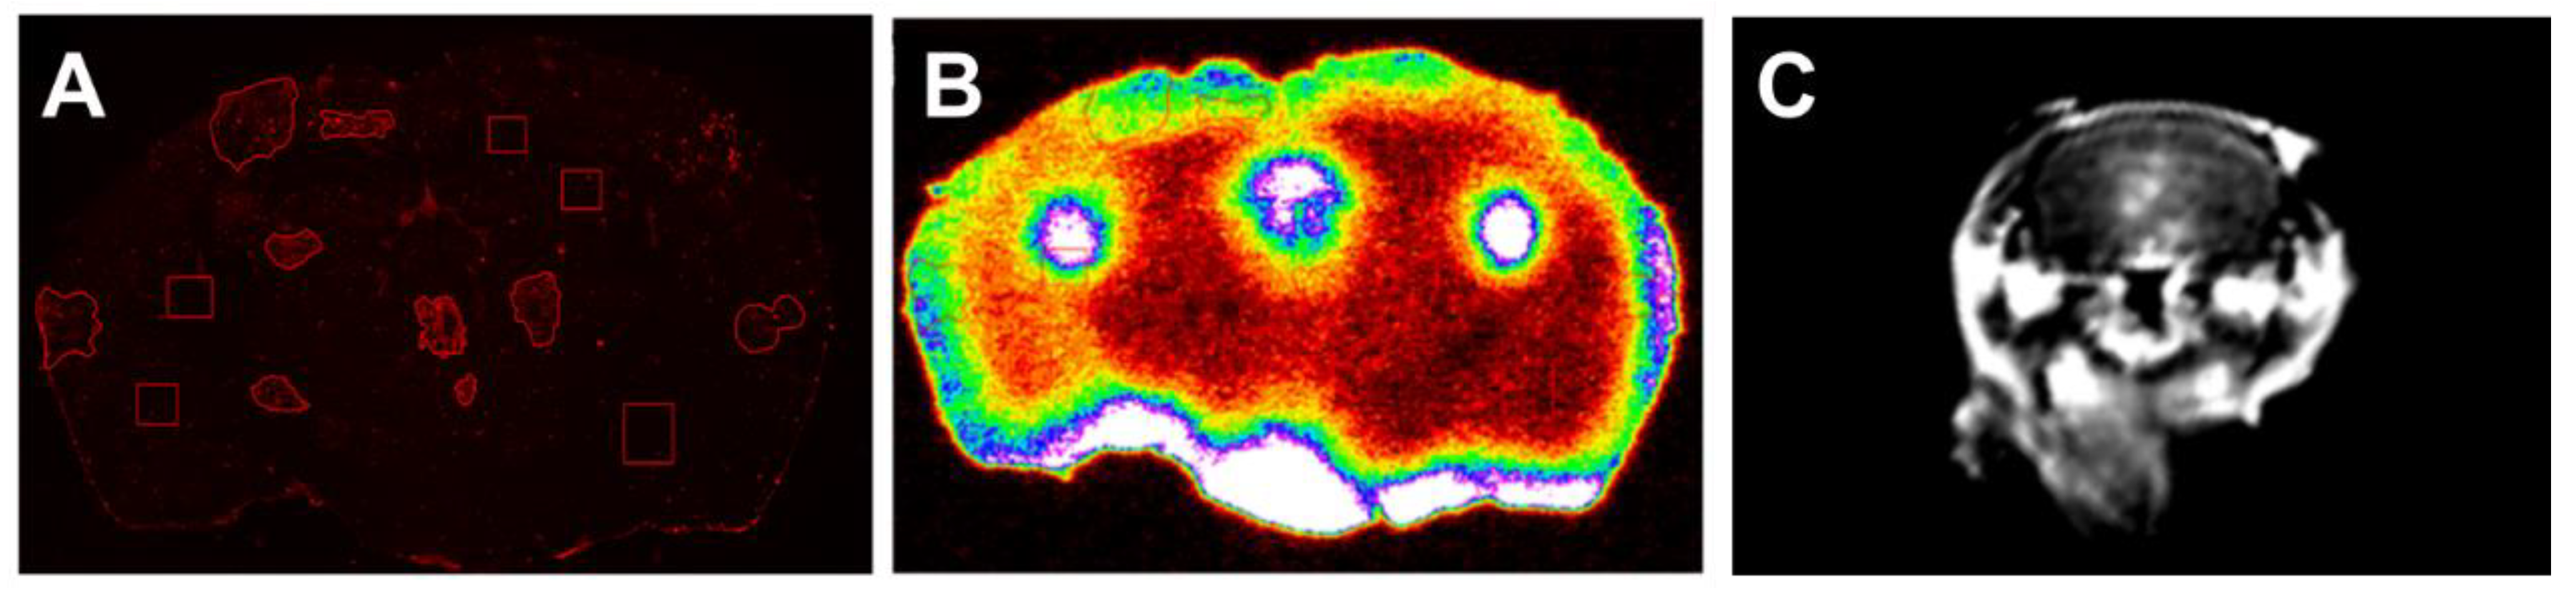
5. Preclinical Measurements of Blood–Brain Barrier Permeability in Pathological Conditions
6. Clinical BBB PK in Disease States and Preclinical Model Translatability
7. Conclusions
Author Contributions
Funding
Data Availability Statement
Acknowledgments
Conflicts of Interest
References
- Daneman, R.; Prat, A. The blood-brain barrier. Cold Spring Harb. Perspect. Biol. 2015, 7, a020412. [Google Scholar] [CrossRef] [Green Version]
- Abbott, N.J.; Patabendige, A.; Dolman, D.E.; Yusof, S.R.; Begley, D.J. Structure and function of the blood-brain barrier. Neurobiol. Dis. 2010, 37, 13–25. [Google Scholar] [CrossRef]
- Xu, L.; Nirwane, A.; Yao, Y. Basement membrane and blood–brain barrier. Stroke Vasc. Neurol. 2019, 4, 78–82. [Google Scholar] [CrossRef] [Green Version]
- Kalliokoski, A.; Niemi, M. Impact of OATP transporters on pharmacokinetics. Br. J. Pharmacol. 2009, 158, 693–705. [Google Scholar] [CrossRef] [Green Version]
- Nakanishi, T.; Tamai, I. Solute Carrier Transporters as Targets for Drug Delivery and Pharmacological Intervention for Chemotherapy. J. Pharm. Sci. 2011, 100, 3731–3750. [Google Scholar] [CrossRef]
- Mergenthaler, P.; Lindauer, U.; Dienel, G.A.; Meisel, A. Sugar for the brain: The role of glucose in physiological and pathological brain function. Trends Neurosci. 2013, 36, 587–597. [Google Scholar] [CrossRef] [Green Version]
- Zhao, Z.; Nelson, A.R.; Betsholtz, C.; Zlokovic, B.V. Establishment and Dysfunction of the Blood-Brain Barrier. Cell 2015, 163, 1064–1078. [Google Scholar] [CrossRef] [Green Version]
- Sprowls, S.A.; Arsiwala, T.A.; Bumgarner, J.R.; Shah, N.; Lateef, S.S.; Kielkowski, B.N.; Lockman, P.R. Improving CNS Delivery to Brain Metastases by Blood–Tumor Barrier Disruption. Trends Cancer 2019, 5, 495–505. [Google Scholar] [CrossRef]
- Patlak, C.S.; Blasberg, R.G.; Fenstermacher, J.D. Graphical Evaluation of Blood-to-Brain Transfer Constants from Multiple-Time Uptake Data. Br. J. Pharmacol. 1983, 3, 1–7. [Google Scholar] [CrossRef]
- Lockman, P.R.; Mumper, R.J.; Allen, D.D. Evaluation of blood-brain barrier thiamine efflux using the in situ rat brain perfusion method. J. Neurochem. 2003, 86, 627–634. [Google Scholar] [CrossRef] [Green Version]
- Manda, V.K.; Mittapalli, R.K.; Bohn, K.A.; Adkins, C.E.; Lockman, P.R. Nicotine and cotinine increases the brain penetration of saquinavir in rat. J. Neurochem. 2010, 115, 1495–1507. [Google Scholar] [CrossRef] [PubMed]
- Thomas, F.C.; Taskar, K.; Rudraraju, V.; Goda, S.; Thorsheim, H.R.; Gaasch, J.A.; Mittapalli, R.K.; Palmieri, D.; Steeg, P.S.; Lockman, P.R.; et al. Uptake of ANG1005, a novel paclitaxel derivative, through the blood-brain barrier into brain and experimental brain metastases of breast cancer. Pharm. Res. 2009, 26, 2486–2494. [Google Scholar] [CrossRef] [PubMed] [Green Version]
- Adkins, C.E.; Mittapalli, R.K.; Manda, V.K.; Nounou, M.I.; Mohammad, A.S.; Terrell, T.B.; Bohn, K.A.; Yasemin, C.; Grothe, T.R.; Lockman, J.A.; et al. P-glycoprotein mediated efflux limits substrate and drug uptake in a preclinical brain metastases of breast cancer model. Front. Pharmacol. 2013, 4, 136. [Google Scholar] [CrossRef] [Green Version]
- Takasato, Y.; Rapoport, S.I.; Smith, Q.R. An in situ brain perfusion technique to study cerebrovascular transport in the rat. Am. J. Physiol. Circ. Physiol. 1984, 247, H484–H493. [Google Scholar] [CrossRef]
- Geldenhuys, W.J.; Mohammad, A.S.; Adkins, C.E.; Lockman, P.R. Molecular determinants of blood–brain barrier permeation. Ther. Deliv. 2015, 6, 961–971. [Google Scholar] [CrossRef]
- Smith, Q.R.; Allen, D.D. In situ brain perfusion technique. Methods Mol. Med. 2003, 89, 209–218. [Google Scholar]
- Smith, Q.R. A Review of Blood–Brain Barrier Transport Techniques. Blood Brain Barrier 2003, 89, 193–208. [Google Scholar]
- Löscher, W.; Potschka, H. Blood-brain barrier active efflux transporters: ATP-binding cassette gene family. NeuroRx 2005, 2, 86–98. [Google Scholar] [CrossRef]
- De Lange, E.C. Potential role of ABC transporters as a detoxification system at the blood-CSF barrier. Adv. Drug Deliv. Rev. 2004, 56, 1793–1809. [Google Scholar] [CrossRef]
- Ohtsuki, S.; Uchida, Y.; Kubo, Y.; Terasaki, T. Quantitative targeted absolute proteomics-based ADME research as a new path to drug discovery and development: Methodology, advantages, strategy, and prospects. J. Pharm. Sci. 2011, 100, 3547–3559. [Google Scholar] [CrossRef]
- Agarwal, S.; Hartz, A.M.; Elmquist, W.F.; Bauer, B. Breast Cancer Resistance Protein and P-Glycoprotein in Brain Cancer: Two Gatekeepers Team Up. Curr. Pharm. Des. 2011, 17, 2793–2802. [Google Scholar] [CrossRef] [PubMed] [Green Version]
- Chai, W.Y.; Chu, P.C.; Tsai, M.Y.; Lin, Y.C.; Wang, J.J.; Wei, K.C.; Wai, Y.Y.; Liu, H.L. Magnetic-resonance imaging for kinetic analysis of permeability changes during focused ultrasound-induced blood-brain barrier opening and brain drug delivery. J Control Release 2014, 192, 1–9. [Google Scholar] [CrossRef]
- Bart, J.; Willemsen, A.T.; Groen, H.J.; van der Graaf, W.T.; Wegman, T.D.; Vaalburg, W.; de Vries, E.G.; Hendrikse, N. Quantitative assessment of P-glycoprotein function in the rat blood–brain barrier by distribution volume of [11C]verapamil measured with PET. NeuroImage 2003, 20, 1775–1782. [Google Scholar] [CrossRef]
- Preston, J.E.; Abbott, N.J.; Begley, D.J. Transcytosis of Macromolecules at the Blood–Brain Barrier. Adv. Pharmacol. 2014, 71, 147–163. [Google Scholar] [PubMed]
- Lipinski, C.A.; Lombardo, F.; Dominy, B.W.; Feeney, P.J. Experimental and computational approaches to estimate solubility and permeability in drug discovery and development settings. Adv. Drug Deliv. Rev. 2001, 46, 3–26. [Google Scholar] [CrossRef]
- Vendel, E.; Rottschäfer, V.; de Lange, E.C.M. The need for mathematical modelling of spatial drug distribution within the brain. Fluids Barriers CNS 2019, 16, 12. [Google Scholar] [CrossRef] [PubMed]
- Bradbury, M.W. The blood-brain barrier. Transport across the cerebral endothelium. Circ. Res. 1985, 57, 213–222. [Google Scholar] [CrossRef] [Green Version]
- Smith, Q.R.; Takasato, Y. Kinetics of Amino Acid Transport at the Blood-Brain Barrier Studied Using an in Situ Brain Perfusion Technique. Ann. N. Y. Acad. Sci. 1986, 481, 186–201. [Google Scholar] [CrossRef]
- Robinson, P.J. Measurement of Blood-Brain Barrier Permeability. Clin. Exp. Pharmacol. Physiol. 1990, 17, 829–840. [Google Scholar] [CrossRef]
- Pardridge, W.M. CSF, blood-brain barrier, and brain drug delivery. Expert Opin. Drug Deliv. 2016, 13, 963–975. [Google Scholar] [CrossRef]
- Jain, R.; Ellika, S.; Scarpace, L.; Schultz, L.; Rock, J.; Gutierrez, J.; Patel, S.; Ewing, J.; Mikkelsen, T. Quantitative Estimation of Permeability Surface-Area Product in Astroglial Brain Tumors Using Perfusion CT and Correlation with Histopathologic Grade. Am. J. Neuroradiol. 2008, 29, 694–700. [Google Scholar] [CrossRef] [PubMed] [Green Version]
- Wong, A.D.; Ye, M.; Levy, A.F.; Rothstein, J.D.; Bergles, D.E.; Searson, P.C. The blood-brain barrier: An engineering perspective. Front. Neuroeng. 2013, 6, 7. [Google Scholar] [CrossRef] [Green Version]
- Oldendorf, W.H. Brain uptake of radiolabeled amino acids, amines, and hexoses after arterial injection. Am. J. Physiol. Content 1971, 221, 1629–1639. [Google Scholar] [CrossRef] [Green Version]
- Patlak, C.S.; Fenstermacher, J.D. Measurements of dog blood-brain transfer constants by ventriculocisternal perfusion. Am. J. Physiol. Content 1975, 229, 877–884. [Google Scholar] [CrossRef] [PubMed] [Green Version]
- Raichle, M.E.; Eichling, J.O.; Straatmann, M.G.; Welch, M.J.; Larson, K.B.; Ter-Pogossian, M.M. Blood-brain barrier permeability of 11C-labeled alcohols and 15O-labeled water. Am. J. Physiol. Content 1976, 230, 543–552. [Google Scholar] [CrossRef] [Green Version]
- Crone, C. The Permeability of Capillaries in Various Organs as Determined by Use of the ‘Indicator Diffusion’ Method. Acta Physiol. Scand. 1963, 58, 292–305. [Google Scholar] [CrossRef]
- Ohno, K.; Pettigrew, K.D.; Rapoport, S.I. Lower limits of cerebrovascular permeability to nonelectrolytes in the conscious rat. Am. J. Physiol. Circ. Physiol. 1978, 235, H299–H307. [Google Scholar] [CrossRef]
- Mittapalli, R.K.; Manda, V.K.; Bohn, K.A.; Adkins, C.E.; Lockman, P.R. Quantitative fluorescence microscopy provides high resolution imaging of passive diffusion and P-gp mediated efflux at the in vivo blood–brain barrier. J. Neurosci. Methods 2013, 219, 188–195. [Google Scholar] [CrossRef] [PubMed] [Green Version]
- Allen, D.D.; Smith, Q.R. Characterization of the blood-brain barrier choline transporter using the in situ rat brain perfusion technique. J. Neurochem. 2001, 76, 1032–1041. [Google Scholar] [CrossRef] [Green Version]
- Smith, Q.R.; Takasato, Y.; Sweeney, D.J.; Rapoport, S.I. Regional Cerebrovascular Transport of Leucine as Measured by the in situ Brain Perfusion Technique. Br. J. Pharmacol. 1985, 5, 300–311. [Google Scholar] [CrossRef] [Green Version]
- Lockman, P.R.; McAfee, G.; Geldenhuys, W.J.; van der Schyf, C.J.; Abbruscato, T.J.; Allen, D.D. Brain Uptake Kinetics of Nicotine and Cotinine after Chronic Nicotine Exposure. J. Pharmacol. Exp. Ther. 2005, 314, 636–642. [Google Scholar] [CrossRef] [PubMed] [Green Version]
- Lockman, P.R.; Manda, V.K.; Geldenhuys, W.J.; Mittapalli, R.K.; Thomas, F.; Albayati, Z.F.; Crooks, P.A.; Dwoskin, L.P.; Allen, D.D. Carrier-Mediated Transport of the Quaternary Ammonium Neuronal Nicotinic Receptor Antagonist N,N′-Dodecylbispicolinium Dibromide at the Blood-Brain Barrier. J. Pharmacol. Exp. Ther. 2007, 324, 244–250. [Google Scholar] [CrossRef] [PubMed]
- Asotra, K.; Ningaraj, N.; Black, K.L. Measurement of Blood–Brain and Blood–Tumor Barrier Permeabilities with [14C]-Labeled Tracers. Blood Brain Barrier 2003, 89, 177–190. [Google Scholar]
- Nakagawa, H.; Groothuis, D.R.; Owens, E.S.; Fenstermacher, J.D.; Patlak, C.S.; Blasberg, R.G. Dexamethasone Effects on [125I]Albumin Distribution in Experimental RG-2 Gliomas and Adjacent Brain. Br. J. Pharmacol. 1987, 7, 687–701. [Google Scholar] [CrossRef] [Green Version]
- Blasberg, R.G.; Shapiro, W.R.; Molnar, P.; Patlak, C.S.; Fenstermacher, J.D. Local blood flow in Walker 256 metastatic brain tumors. J. Neuro Oncol. 1984, 2, 195–204. [Google Scholar] [CrossRef]
- Blasberg, R.G.; Fenstermacher, J.D.; Patlak, C.S. Transport of alpha-aminoisobutyric acid across brain capillary and cellular membranes. J. Cereb. Blood Flow Metab. 1983, 3, 8–32. [Google Scholar] [CrossRef] [Green Version]
- Loryan, I.; Hammarlund-Udenaes, M.; Syvänen, S. Brain Distribution of Drugs: Pharmacokinetic Considerations. In Handbook of Experimental Pharmacology; Springer: Berlin/Heidelberg, Germany, 2020. [Google Scholar]
- Hammarlund-Udenaes, M. Microdialysis as an Important Technique in Systems Pharmacology-a Historical and Methodological Review. AAPS J. 2017, 19, 1294–1303. [Google Scholar] [CrossRef] [Green Version]
- Gupta, A.; Chatelain, P.; Massingham, R.; Jonsson, E.N.; Hammarlund-Udenaes, M. Brain distribution of cetirizine enantiomers: Comparison of three different tissue-to-plasma partition coefficients: K(p), K(p,u), and K(p,uu). Drug Metab. Dispos. 2006, 34, 318–323. [Google Scholar] [CrossRef] [Green Version]
- Hu, Y.; Gaillard, P.J.; Rip, J.; de Lange, E.C.; Hammarlund-Udenaes, M. In Vivo Quantitative Understanding of PEGylated Liposome’s Influence on Brain Delivery of Diphenhydramine. Mol. Pharm. 2018, 15, 5493–5500. [Google Scholar] [CrossRef] [Green Version]
- Hammarlund-Udenaes, M.; Fridén, M.; Syvänen, S.; Gupta, A. On The Rate and Extent of Drug Delivery to the Brain. Pharm. Res. 2007, 25, 1737–1750. [Google Scholar] [CrossRef] [Green Version]
- Boström, E.; Simonsson, U.S.H.; Hammarlund-Udenaes, M. In Vivo Blood-Brain Barrier Transport of Oxycodone in the Rat: Indications for Active Influx and Implications for Pharmacokinetics/Pharmacodynamics. Drug Metab. Dispos. 2006, 34, 1624–1631. [Google Scholar] [CrossRef] [PubMed] [Green Version]
- Dubey, R.K.; McAllister, C.B.; Inoue, M.; Wilkinson, G.R. Plasma binding and transport of diazepam across the blood-brain barrier. No evidence for in vivo enhanced dissociation. J. Clin. Investig. 1989, 84, 1155–1159. [Google Scholar] [CrossRef] [PubMed] [Green Version]
- Deguchi, Y.; Inabe, K.; Tomiyasu, K.; Nozawa, K.; Yamada, S.; Kimura, R. Study on brain interstitial fluid distribution and blood-brain barrier transport of baclofen in rats by microdialysis. Pharm. Res. 1995, 12, 1838–1844. [Google Scholar] [CrossRef] [PubMed]
- Tunblad, K.; Jonsson, E.N.; Hammarlund-Udenaes, M. Morphine blood-brain barrier transport is influenced by probenecid co-administration. Pharm. Res. 2003, 20, 618–623. [Google Scholar] [CrossRef]
- Yankeelov, T.E.; Gore, J.C. Dynamic Contrast Enhanced Magnetic Resonance Imaging in Oncology: Theory, Data Acquisition, Analysis, and Examples. Curr. Med. Imaging Rev. 2009, 3, 91–107. [Google Scholar] [CrossRef] [Green Version]
- Mross, K.; Fasol, U.; Frost, A.; Benkelmann, R.; Kuhlmann, J.; Büchert, M.; Unger, C.; Blum, H.; Hennig, J.; Milenkova, T.P.; et al. DCE-MRI assessment of the effect of vandetanib on tumor vasculature in patients with advanced colorectal cancer and liver metastases: A randomized phase I study. J. Angiogenesis Res. 2009, 1, 5. [Google Scholar] [CrossRef] [PubMed] [Green Version]
- Leigh, R.; Jen, S.S.; Hillis, A.E.; Krakauer, J.W.; Barker, P.B.; Albers, G.W.; Davis, S.M.; Donnan, G.A.; Fisher, M.; Furlan, A.J.; et al. Pretreatment Blood–Brain Barrier Damage and Post-Treatment Intracranial Hemorrhage in Patients Receiving Intravenous Tissue-Type Plasminogen Activator. Stroke 2014, 45, 2030–2035. [Google Scholar] [CrossRef] [PubMed]
- Gordon, Y.; Partovi, S.; Müller-Eschner, M.; Amarteifio, E.; Bäuerle, T.; Weber, M.-A.; Kauczor, H.-U.; Rengier, F. Dynamic contrast-enhanced magnetic resonance imaging: Fundamentals and application to the evaluation of the peripheral perfusion. Cardiovasc. Diagn. Ther. 2014, 4, 147–164. [Google Scholar]
- Tofts, P.S.; Brix, G.; Buckley, D.L.; Evelhoch, J.L.; Henderson, E.; Knopp, M.V.; Larsson, H.B.; Lee, T.-Y.; Mayr, N.A.; Parker, G.J.; et al. Estimating kinetic parameters from dynamic contrast-enhanced t1-weighted MRI of a diffusable tracer: Standardized quantities and symbols. J. Magn. Reson. Imaging 1999, 10, 223–232. [Google Scholar] [CrossRef]
- Bergamino, M.; Saitta, L.; Barletta, L.; Bonzano, L.; Mancardi, G.L.; Castellan, L.; Ravetti, J.L.; Roccatagliata, L. Measurement of Blood-Brain Barrier Permeability with T1-Weighted Dynamic Contrast-Enhanced MRI in Brain Tumors: A Comparative Study with Two Different Algorithms. ISRN Neurosci. 2013, 2013, 905279. [Google Scholar] [CrossRef] [Green Version]
- Tofts, P.S. Modeling tracer kinetics in dynamic Gd-DTPA MR imaging. J. Magn. Reson. Imaging 1997, 7, 91–101. [Google Scholar] [CrossRef] [PubMed]
- Zhang, N.; Zhang, L.; Qiu, B.; Meng, L.; Wang, X.; Hou, B.L. Correlation of volume transfer coefficient Ktrans with histopathologic grades of gliomas. J. Magn. Reson. Imaging 2012, 36, 355–363. [Google Scholar] [CrossRef] [PubMed] [Green Version]
- Law, M.; Yang, S.; Babb, J.S.; Knopp, E.A.; Golfinos, J.G.; Zagzag, D.; Johnson, G. Comparison of cerebral blood volume and vascular permeability from dynamic susceptibility contrast-enhanced perfusion MR imaging with glioma grade. Am. J. Neuroradiol. 2004, 25, 746–755. [Google Scholar] [PubMed]
- Gerstner, E.R.; Fine, R.L. Increased Permeability of the Blood-Brain Barrier to Chemotherapy in Metastatic Brain Tumors: Establishing a Treatment Paradigm. J. Clin. Oncol. 2007, 25, 2306–2312. [Google Scholar] [CrossRef] [PubMed]
- De Vries, N.A.; Beijnen, J.H.; Boogerd, W.; van Tellingen, O. Blood-brain barrier and chemotherapeutic treatment of brain tumors. Expert Rev. Neurother. 2006, 6, 1199–1209. [Google Scholar]
- Zhang, J.; Liu, Z.; Du, X.; Guo, Y.; Chen, X.; Wang, S.; Fang, J.; Cao, P.; Zhang, B.; Zhang, W. Increasing of Blood-Brain Tumor Barrier Permeability through Transcellular and Paracellular Pathways by Microbubble-Enhanced Diagnostic Ultrasound in a C6 Glioma Model. Front. Neurosci. 2017, 11, 86. [Google Scholar] [CrossRef] [PubMed]
- Lockman, P.R.; Mittapalli, R.K.; Taskar, K.S.; Rudraraju, V.; Gril, B.; Bohn, K.A.; Adkins, C.E.; Roberts, A.; Thorsheim, H.R.; Gaasch, J.A.; et al. Heterogeneous Blood–Tumor Barrier Permeability Determines Drug Efficacy in Experimental Brain Metastases of Breast Cancer. Clin. Cancer Res. 2010, 16, 5664–5678. [Google Scholar] [CrossRef] [Green Version]
- Mohammad, A.S.; Adkins, C.E.; Shah, N.; Aljammal, R.; Griffith, J.I.G.; Tallman, R.M.; Jarrell, K.L.; Lockman, P.R. Permeability changes and effect of chemotherapy in brain adjacent to tumor in an experimental model of metastatic brain tumor from breast cancer. BMC Cancer 2018, 18, 1225. [Google Scholar] [CrossRef]
- Villringer, K.; Cuesta, B.E.S.; Ostwaldt, A.-C.; Grittner, U.; Brunecker, P.; Khalil, A.A.; Schindler, K.; Eisenblätter, O.; Audebert, H.; Fiebach, J.B. DCE-MRI blood–brain barrier assessment in acute ischemic stroke. Neurology 2016, 88, 433–440. [Google Scholar] [CrossRef]
- Fernández-López, D.; Faustino, J.; Daneman, R.; Zhou, L.; Lee, S.Y.; Derugin, N.; Wendland, M.F.; Vexler, Z.S. Blood-Brain Barrier Permeability is Increased After Acute Adult Stroke But Not Neonatal Stroke in the Rat. J. Neurosci. 2012, 32, 9588–9600. [Google Scholar] [CrossRef]


Publisher’s Note: MDPI stays neutral with regard to jurisdictional claims in published maps and institutional affiliations. |
© 2021 by the authors. Licensee MDPI, Basel, Switzerland. This article is an open access article distributed under the terms and conditions of the Creative Commons Attribution (CC BY) license (https://creativecommons.org/licenses/by/4.0/).
Share and Cite
Sprowls, S.A.; Saralkar, P.; Arsiwala, T.; Adkins, C.E.; Blethen, K.E.; Pizzuti, V.J.; Shah, N.; Fladeland, R.; Lockman, P.R. A Review of Mathematics Determining Solute Uptake at the Blood–Brain Barrier in Normal and Pathological Conditions. Pharmaceutics 2021, 13, 756. https://0-doi-org.brum.beds.ac.uk/10.3390/pharmaceutics13050756
Sprowls SA, Saralkar P, Arsiwala T, Adkins CE, Blethen KE, Pizzuti VJ, Shah N, Fladeland R, Lockman PR. A Review of Mathematics Determining Solute Uptake at the Blood–Brain Barrier in Normal and Pathological Conditions. Pharmaceutics. 2021; 13(5):756. https://0-doi-org.brum.beds.ac.uk/10.3390/pharmaceutics13050756
Chicago/Turabian StyleSprowls, Samuel A., Pushkar Saralkar, Tasneem Arsiwala, Christopher E. Adkins, Kathryn E. Blethen, Vincenzo J. Pizzuti, Neal Shah, Ross Fladeland, and Paul R. Lockman. 2021. "A Review of Mathematics Determining Solute Uptake at the Blood–Brain Barrier in Normal and Pathological Conditions" Pharmaceutics 13, no. 5: 756. https://0-doi-org.brum.beds.ac.uk/10.3390/pharmaceutics13050756