
Infrared Spectrum and UV-Induced Photochemistry of Matrix-Isolated Phenyl 1-Hydroxy-2-Naphthoate


1
Department of Physics, Faculty of Science and Arts, Bitlis Eren University, 13000 Bitlis, Turkey
2
CQC, Department of Chemistry, University of Coimbra, 3004-535 Coimbra, Portugal
3
MTA-ELTE Lendület Laboratory Astrochemistry Research Group, Institute of Chemistry, ELTE Eötvös Loránd University, H-1518 Budapest, Hungary
*
Authors to whom correspondence should be addressed.
Photochem 2021, 1(1), 10-25; https://0-doi-org.brum.beds.ac.uk/10.3390/photochem1010002
Submission received: 15 January 2021
/
Revised: 13 February 2021
/
Accepted: 21 February 2021
/
Published: 26 February 2021
(This article belongs to the Special Issue Feature Papers in Photochemistry)
Abstract
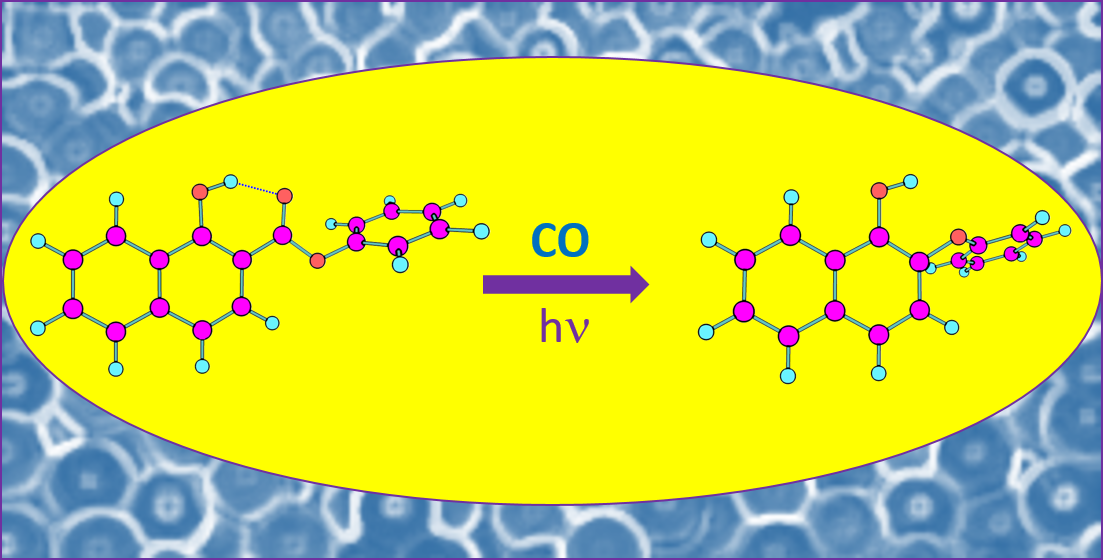
:The conformational stability, infrared spectrum, and photochemistry of phenyl 1-hydroxy-2-naphthoate (PHN) were studied by matrix isolation infrared spectroscopy and theoretical computations performed at the DFT(B3LYP)/6-311++G(d,p) level of theory. The main intramolecular interactions determining the relative stability of seven conformers of the molecule were evaluated. According to the calculations, the twofold degenerated O–H···O=C intramolecularly hydrogen-bonded conformer with the phenyl ring ester group ±68.8° out of the plane of the substituted naphtyl moiety is the most stable conformer of the molecule. This conformer is considerably more stable than the second most stable form (by ~15 kJ mol−1), in which a weaker O–H···O–C intramolecular hydrogen bond exists. The compound was isolated in cryogenic argon and N2 matrices, and the conformational composition in the matrices was investigated by infrared spectroscopy. In agreement with the predicted relative energies of the conformers, the analysis of the spectra indicated that only the most stable conformer of PHN was present in the as-deposited matrices. The matrices were then irradiated at various wavelengths by narrowband tunable UV light within the 331.7–235.0 nm wavelength range. This resulted in the photodecarbonylation of PHN, yielding 2-phenoxynaphthalen-1-ol, together with CO. The extension of the decarbonylation was found to depend on the excitation wavelength.

1. Introduction
Hydroxynaphthoate derivatives show important biological and medicinal properties. For example, methyl 1-hydroxy-2-naphthoate and ethyl 1,6-dihydroxy-2-naphthoate present anti-inflammatory activity [1,2], while 1-hydroxy-2-naphthoic acid itself has a recognized antibacterial action [3]. The 1-hydroxy-2-naphthoate moiety is observed in natural products such as the cytotoxic compounds 3-hydroxymollugin and 3-methoxymollugin [4]. In addition, hydroxynaphthoates have been used as precursors for the synthesis of the anti-carcinogenic compounds taiwanin C [5,6], α- and β-sorigenin methyl ethers [7], and olivin trimethyl ether [8].
Woolfe and Thistlethwaite [9,10] have reported on the photophysics of methyl 3-hydroxy-2-naphthoate and phenyl 1-hydroxy-2-naphthoate. They observed that the first compound gives rise to a dual fluorescence emission, with one component exhibiting a large Stokes shift, in contrast to the second compound, which exhibits normal fluorescence [9,10]. Law and Shoham have also investigated the photophysics of methyl 3-hydroxy-2-naphthoate in different solvent media and at various temperatures, confirming the previous observations regarding its unusual fluorescence pattern, which they interpreted as being the result of a photoinduced excited-state intramolecular proton transfer (ESIPT), leading to the formation of the enol tautomer of the compound that is responsible for the Stokes-shifted emission [11]. The formation of the enol is facilitated by the presence in the ground state of a strong intramolecular hydrogen bond.
Evidence on the existence of intramolecular hydrogen bonding in methyl 2-hydroxy-3-naphthoate has been reported by Bergmann and co-workers [12]. Similarly to methyl 3-hydroxy-2-naphthoate, methyl 2-hydroxy-3-naphthoate exhibits a dual fluorescence emission, which was also explained assuming the occurrence of enolization via ESIPT upon excitation [13]. The ESIPT mechanism in jet-cooled methyl 2-hydroxy-3-naphthoate has been investigated comprehensively, more recently, by McCarthy and Ruth [14]. On the other hand, the lack of ESIPT emission for both methyl 1-hydroxy-2-naphthoate and methyl 2-hydroxy-1-naphthoate has been explained by Catalán et al. [15] in terms of the rapid non-radiative dynamics of their respective lowest-energy keto tautomers. Those authors concluded that the relative position of the intramolecular hydrogen bond in the naphthalene skeleton in this type of compound acts as a switch, and controls the yield of the ESIPT process [15]. These results are also in agreement with the work of Tobita and co-workers on methyl 1-hydroxy-2-naphthoate, in which the fluorescence characteristics of this compound were compared with those exhibited by 1-hydroxy-2-acetonaphthone and 1-hydroxy-2-naphthaldehyde [16]. The occurrence of ESIPT has also been observed for phenyl 1-hydroxy-2-naphthoate (PHN) in a previous study by some of the present authors [17], in which the solvatochromism, intramolecular hydrogen bonding, and ground and excited state dipole moments of the compound were investigated using fluorescence spectroscopy in solutions of different solvents.
In the present study, we focused on the ground-state conformational preferences exhibited by PHN, its infrared spectrum, and UV-induced photochemistry under matrix isolation (Ar and N2 matrices) conditions. The interpretation of the experimental results received support from structural and spectroscopic data obtained from electronic structure calculations undertaken within the density functional theory (DFT) framework. As described in detail below, intramolecular hydrogen bonding plays a major structural role in PHN. Conformational photo-isomerization, with production of a high-energy conformer of the compound, and photo-induced decarbonylation of PHN were found experimentally to be the major processes taking place upon in situ narrowband UV excitation of the matrix-isolated compound within the 331.7–235.0 nm range, with the extension of the conformational isomerization reaction depending on the excitation wavelength.
2. Experimental Details: Matrix Isolation Infrared and Photochemical Experiments
A commercial sample of PHN was provided by Sigma-Aldrich, St. Louis, MO, USA (powder; 99% purity), and was used without any further purification. In order to prepare the cryogenic matrices, the sample was placed in a mini glass oven attached to the vacuum chamber of the cryostat, and was sublimated using a thermoelectrical heating system, whosemain component is a DC Power Supply VITEECOM, model 75-HY5003. The vapor of the compound was co-deposited with a large excess of the host matrix gas (Ar or N2, obtained from Air Liquide) onto a cold CsI window assembled at the tip of the cryostat, and cooled to 10 K by an APD Cryogenics DE202 closed-cycle refrigerator system. The solute to matrix ratios were kept at ~1:1000 in order to guarantee the adequate isolation of the compound. The temperature of the matrix sample was measured at the sample holder by using a LakeShore Model 331S Temperature Controller, with 0.1 K accuracy.
The infrared spectra were collected in the 4000–400 cm−1 range, with 0.5 cm−1 resolution, using a Nicolet 6700 FTIR spectrometer (Waltham, MA, USA) equipped with a mercury cadmium telluride (MCT) detector and a KBr beam splitter. The instrument was purged by a stream of dry/CO2-filtered air in order to avoid interference from atmospheric H2O and CO2 vapors.
The photoexcitation of the matrix-isolated PHN was performed through the outer KBr window of the cryostat using tunable narrowband UV light (full-width at half-maximum of 0.2 cm−1) provided by a Spectra Physics MOPO-SL optical parametric oscillator (OPO) pumped by a pulsed (pulse duration 10 ns, repetition rate 10 Hz) Quanta Ray Pro-Series Nd-YAG laser. The excitations were undertaken within the 331.7–235.0 nm wavelength range, and were performed with different pulse energies and exposure times (see Table S1 in the Supplementary Materials for details).
3. Computational Details
All quantum chemical computations were performed with Gaussian 09 (revision A.02) [18]. The geometries were fully optimized at the DFT level of theory using the B3LYP functional [19,20,21] and the 6-311++G(d,p) basis set [22]. The harmonic vibrational frequencies and infrared intensities were calculated at the same level of theory, the frequencies being subsequently scaled by a factor of 0.978 in order to approximately correct them for the neglected anharmonicity and method/basis set limitations. The assignment of the vibrational modes was performed with the help of the animation module of GaussView (version 5.0) [23]. In the simulated spectra, the infrared bands were built using Lorentzian functions centered at the calculated (scaled) frequencies, and with a full-width at half-maximum (fwhm) of 2 cm−1.
4. Results and Discussion
4.1. Geometries and Relative Energies of the PHN Conformers
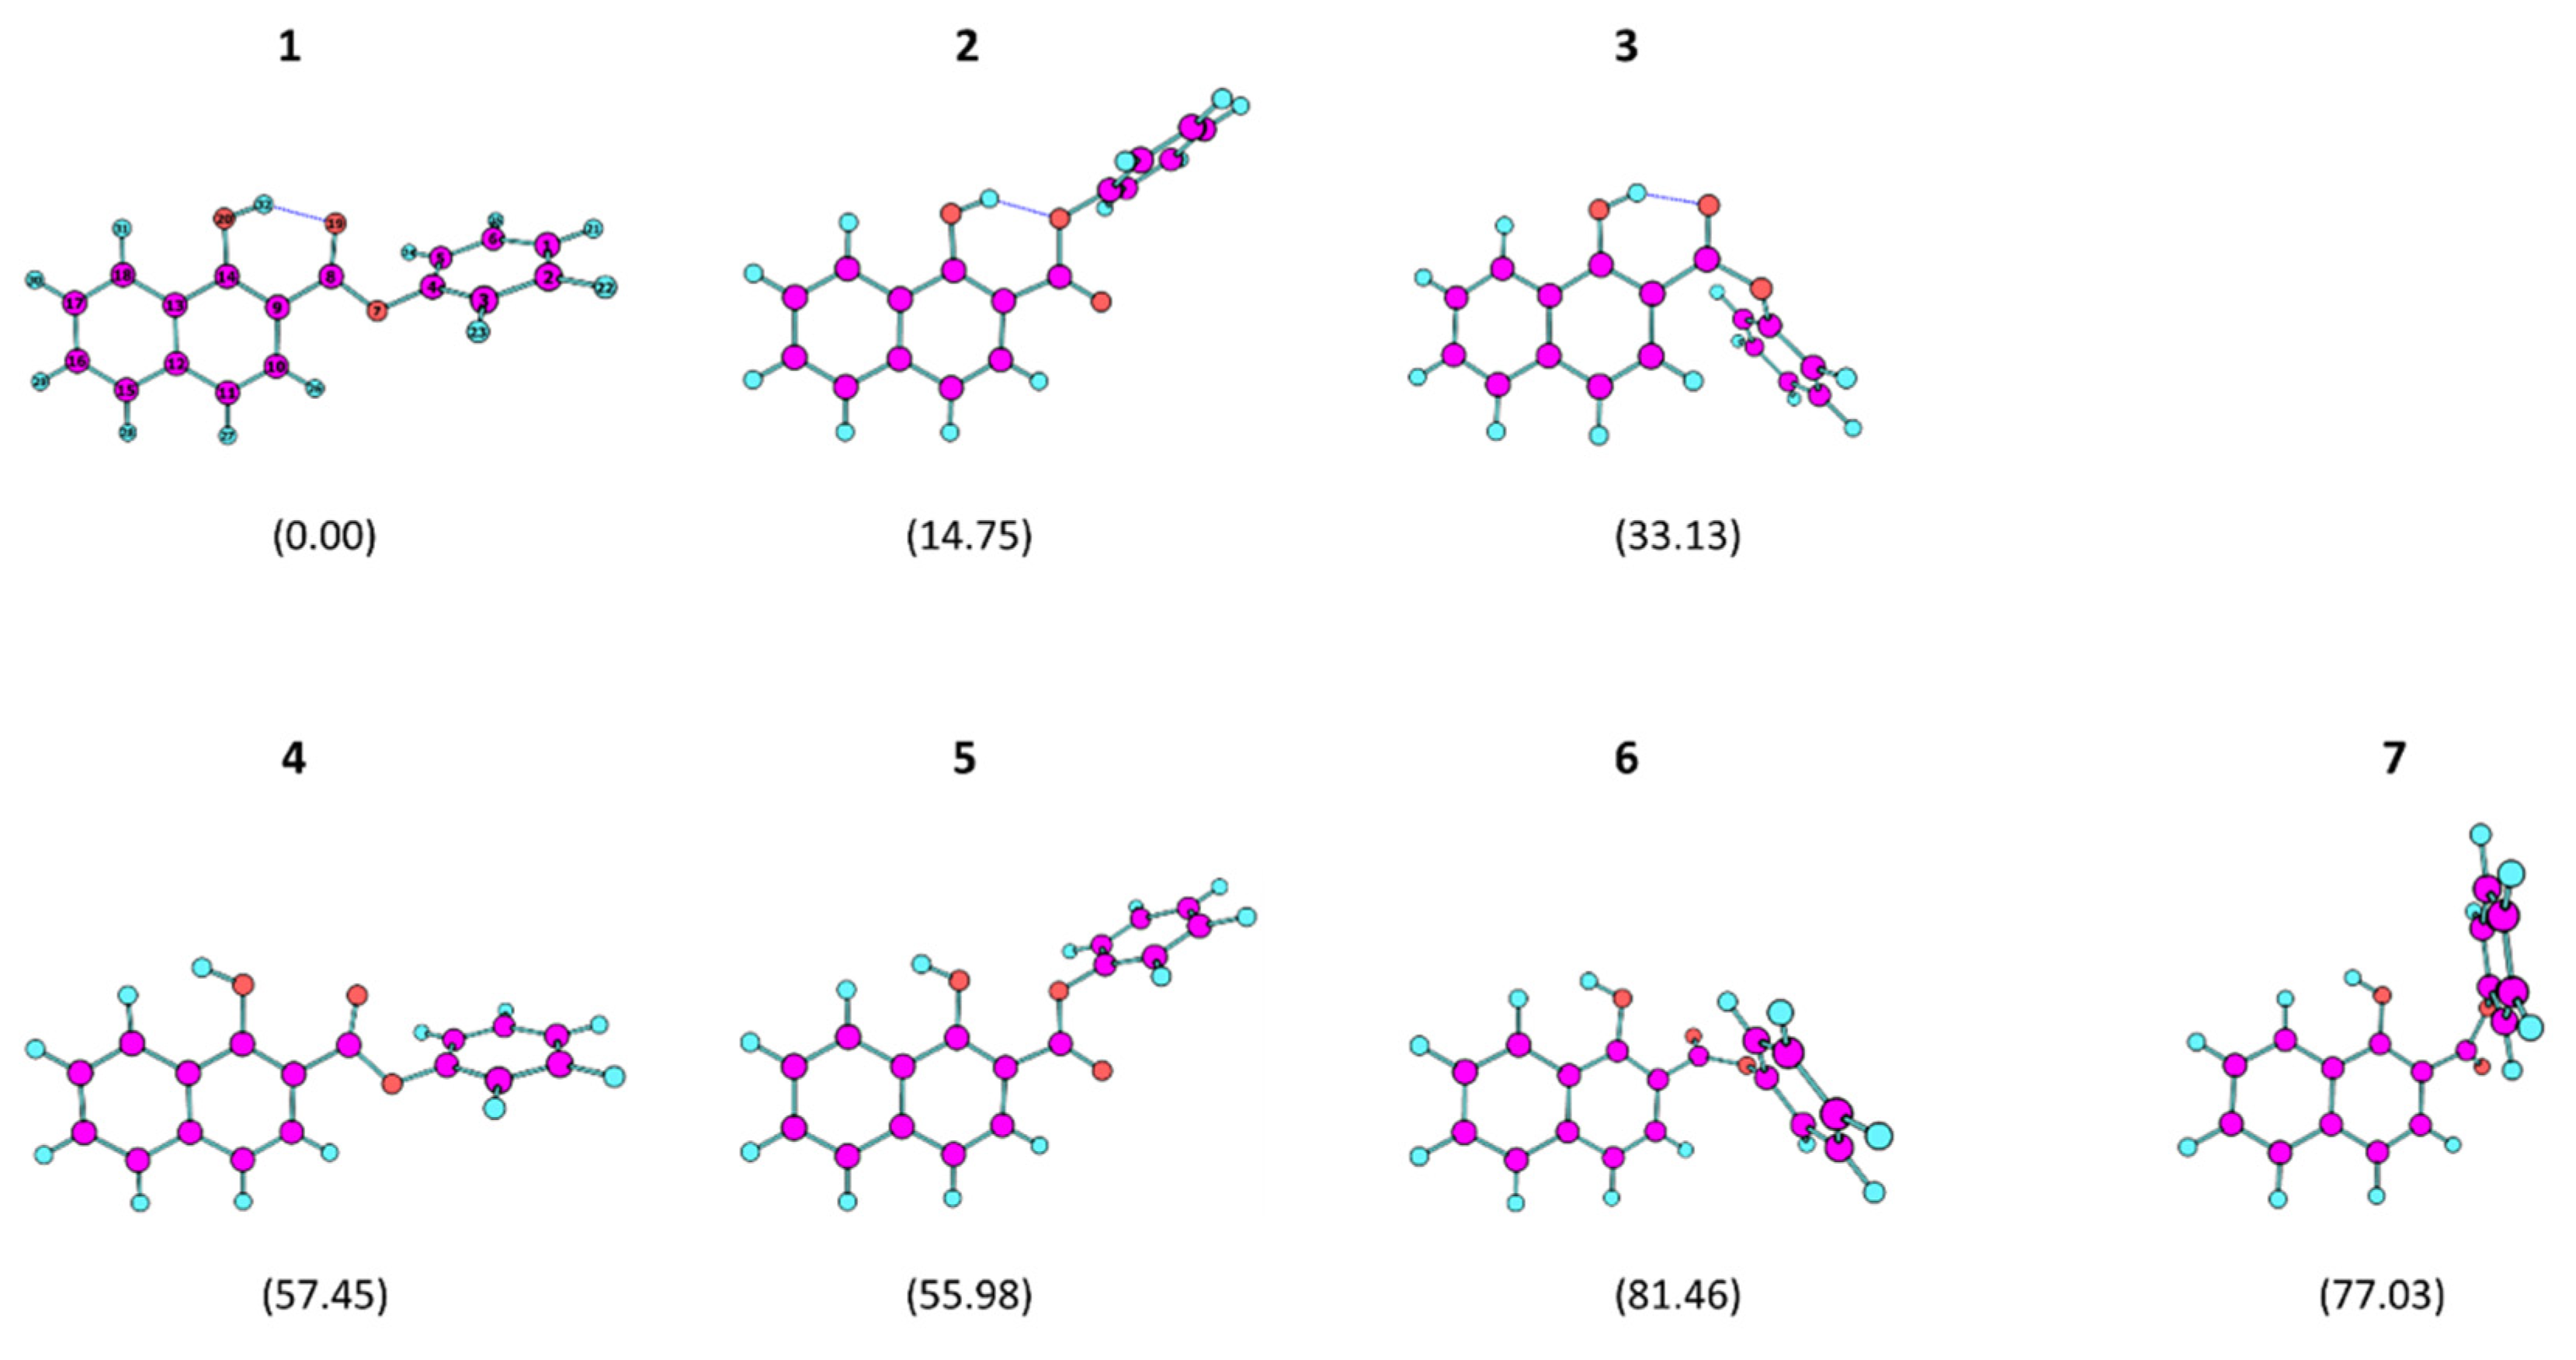
The relative energies of the conformers of PHN, calculated at the B3LYP/6-311++G(d,p) level, are presented in Table 1. The optimized structures of the various conformers are represented in Figure 1, while their Cartesian coordinates are provided in Table S2 (Supporting Information). Table 2 gives the optimized values for the conformationally-relevant dihedral angles of the different conformers of PHN.
The molecule of PHN has four a priori conformationally-relevant internal rotation axes, which can be defined as a function of the C–C–O–H, O=C–C–C, C–O–C=O and C–C–O–C dihedrals provided in Table 2. The first and second dihedrals determine the relative orientation of the OH and phenylcarboxy substituents, while the third and fourth dihedrals are related to the conformation assumed by the phenyl ester group. One can group the seven different conformers of PHN into two groups, the first comprising conformers 1–3, which bear an O–H···O intramolecular hydrogen bond and are of lower energy, and the second including the remaining four conformers (4–7), in which no intramolecular hydrogen bond exists, and that are of higher energy. All conformers are doubly-degenerated by symmetry, so that all structures shown in Figure 1—the dihedrals of which are specified in Table 2—have symmetry-related equivalent forms in which all of the dihedral angles have symmetric values. For simplicity, in the discussion below, we will only refer to the structures depicted in the Figure.
In the first group of conformers, the two lower energy forms (1 and 2) have the ester group in the intrinsically more stable cis conformation (C–O–C=O dihedral equal to ~0°) [24,25], whereas conformer 3 has this group in a distorted trans geometry where the C–O–C=O dihedral is −118.2° (the trans arrangement corresponds to a C–O–C=O dihedral equal to ~180°). The reasons for the higher stability of the cis ester arrangement have been pointed out in detail elsewhere [24]. Essentially, the main factor responsible for the stabilization of a cis carboxylic ester arrangement in relation to the trans one is electrostatic in nature, and results from the different relative orientation of the dipoles associated with the C=O and O–C (ester) bonds in the two types of geometries. In the cis geometry, this alignment is nearly anti-parallel (attractive, stabilizing), while in the trans it is approximately parallel (repulsive, destabilizing). In conformer 3, the distortion relative to the trans conformation results from the strong steric repulsion in that geometry between the phenyl and naphtol moieties (see Figure 1). Conformer 1, in which a strong intramolecular hydrogen bond is established with the carbonyl oxygen atom, is the most stable conformer of PHN, with conformer 2, where a weaker intramolecular hydrogen bond is established with the ester oxygen atom, being higher in energy than form 1 by 14.75 kJ mol−1. In all of the conformers 1–3, the phenyl ester group is considerably out of the carboxylic plane in order to minimize repulsions within the carboxylic ester group (for 1 and 2) and with the naphtol moiety (in the case of 3). Conformer 3 is higher in energy than the most stable PHN conformer by 33.13 kJ mol−1.
The four higher-energy non-hydrogen bonded conformers (4–7) have relative energies from ca. 55 to about 81 kJ mol−1 above conformer 1. In all these conformers, the dominant intramolecular interactions are of repulsive type, and are established between the lone electron pairs of the hydroxylic and the carbonylic or carboxylic ester oxygen atoms. In the case of the highest energy conformers 6 and 7, to these repulsions one must also add the extra energy resulting from the unfavorable trans arrangement of the ester group and the phenyl-naphtol repulsions (in the case of 6). As for the lower energy conformers, the high-energy conformers of PHN also have the phenyl ester group considerably out of the carboxylic plane in order to minimize repulsions.
It is interesting to examine in more detail the intramolecular hydrogen bonds present in conformers 1–3. Table 3 presents some structural parameters (bond distances and angles) that are useful to estimate the different strengths of the hydrogen bonds in these conformers. Some of these structural parameters can also be correlated with the different stability of the cis and trans ester arrangements. As seen in the Table, the strongest hydrogen bond occurs in conformer 3, as measured by the values of the H···O and O···O distances and, to a less extent, by the O–H bond lengths found in the three conformers under consideration. The hydrogen bond in conformer 1 is slightly less strong than that present in conformer 3, while that present in conformer 2 (which is established with the ester oxygen atom as acceptor instead of the carbonylic oxygen atom as in 1 and 3) is much weaker, in particular if one takes into account the smaller value for the O–H···O angle and the much longer H···O distance (see Table 3). If we assume that the energy difference between 1 and 2 is mostly due to the different strengths of the intramolecular hydrogen bonds present in these two forms, we can estimate that the one that is present in the most stable conformer is about 10–15 kJ mol−1 stronger than that which is present in conformer 2. On the other hand, assuming that the hydrogen bonds in 1 and 3 do not differ by more than 3–5 kJ mol−1 in energy, the (trans-ester)–(cis-ester) intrinsic energy difference can be roughly estimated as being of ca. 30 kJ mol−1 in PHN, a value that is similar to those found in other carboxylic esters [24,25].
The relative values of the C–O (naphtol) and O–H bond lengths and the H···O distances correlate with the relative strength of the intramolecular hydrogen bonds in the three conformers, the first and the last becoming shorter and the second becoming longer when the hydrogen bond becomes stronger, as expected. On the other hand, the relative values of the C=O bond lengths require a somewhat more elaborated explanation, because two factors are relevant to their determination. On the one side, there is the well-known, more important π-electron delocalization in the cis-ester arrangement compared to the trans-ester geometry, which favors a longer C=O bond in 1 and 2 compared to 3 [24,25], and on the other side, there are the relative strengths of the hydrogen bonds in 1 and 3, in which the carbonyl oxygen atom acts as the acceptor, and the non-participation of this atom in the hydrogen bond in 2, which favors a longer C=O bond in the order 3 > 1 > 2. On the whole, the two factors lead to the observed order for the C=O bond lengths: 1 > 3 >> 2. The higher degree of π-electron delocalization in the cis-ester conformation (as in 1 and 2), compared to the trans-ester geometry (as in 3) is also in accordance with the shorter C–O (carboxylic) bond length in 1 compared to 3 (form 2 has the longest C–O bond among the three conformers because of its involvement in the intramolecular hydrogen bonding).
In the context of the present work, the relative energies of the different conformers are of particular importance. It is clear from Table 1 that, in the room temperature (298.15 K) gas phase equilibrium, conformer 1 accounts for 99.5 % of the total population. Because the gaseous beam of the compound (and matrix gas: Ar; N2) was at room temperature in the matrix isolation experiments described in the next sections, one can expect that only conformer 1 shall be present in the matrices in a detectable amount. Conformer 2 is predicted by the calculations to account for only 0.5% of the population, which is too low to allow its experimental detection, while the remaining conformers have a negligible population.
4.2. Infrared Spectra of Matrix-Isolated PHN
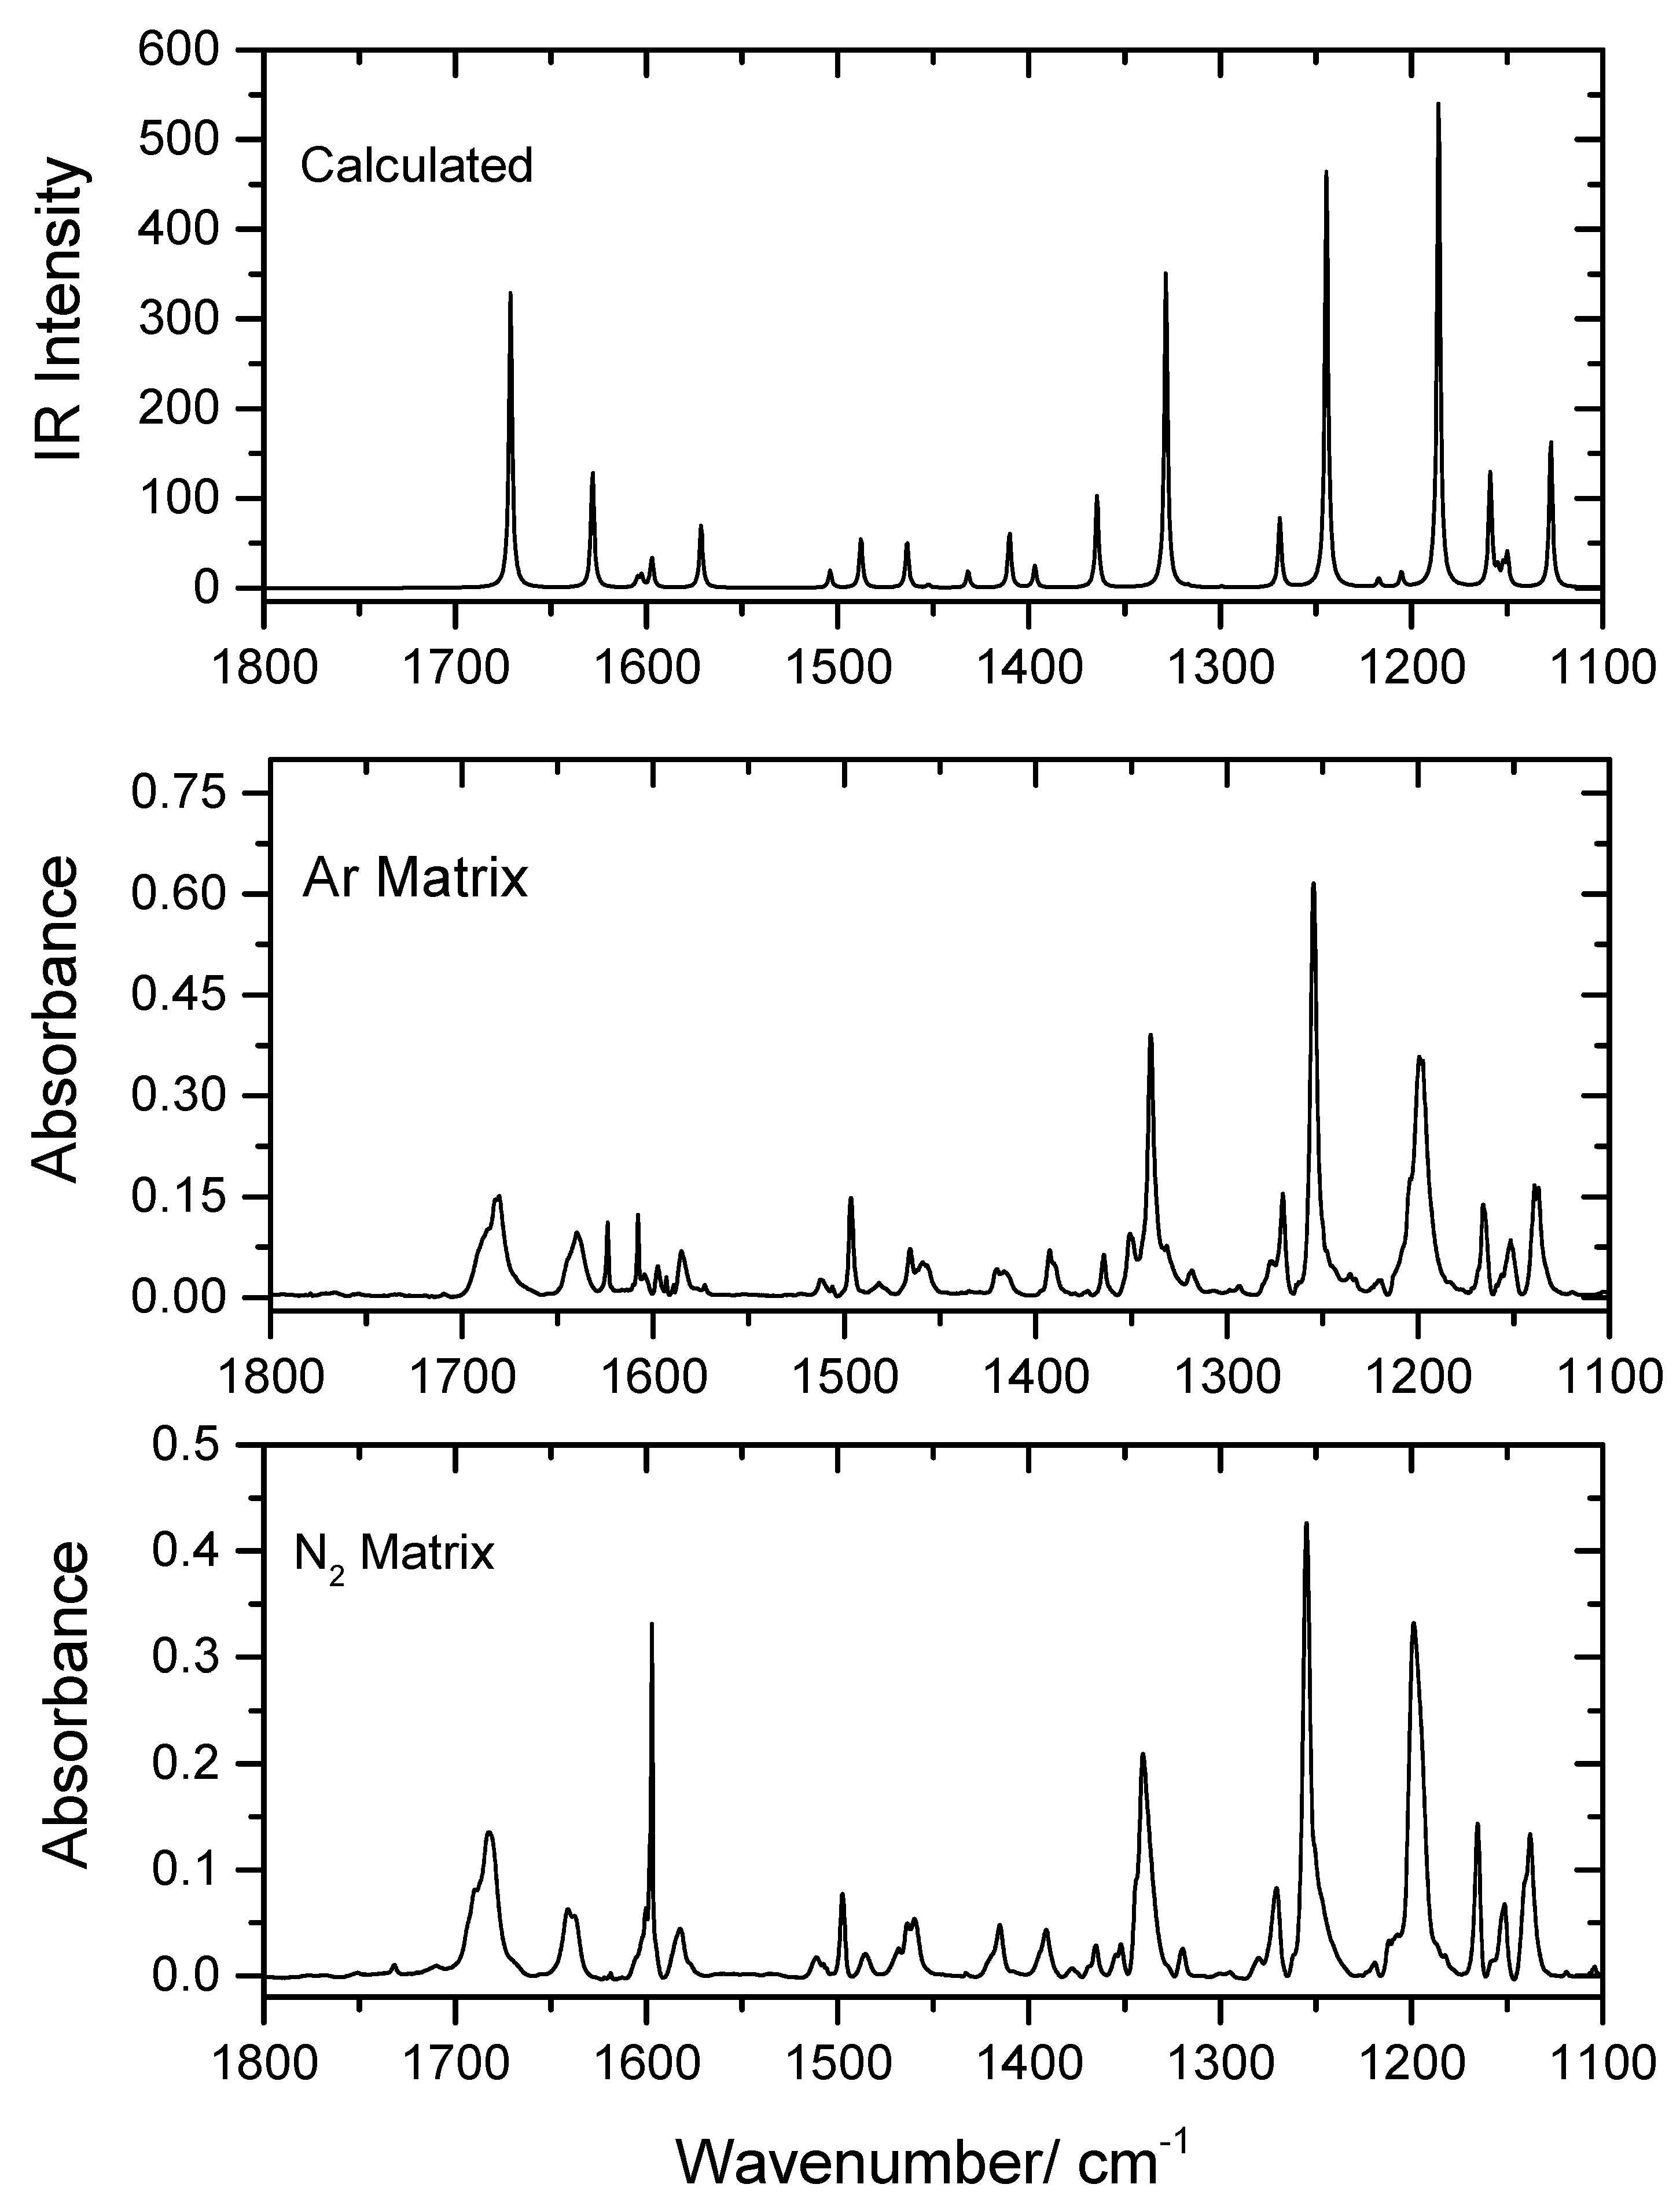
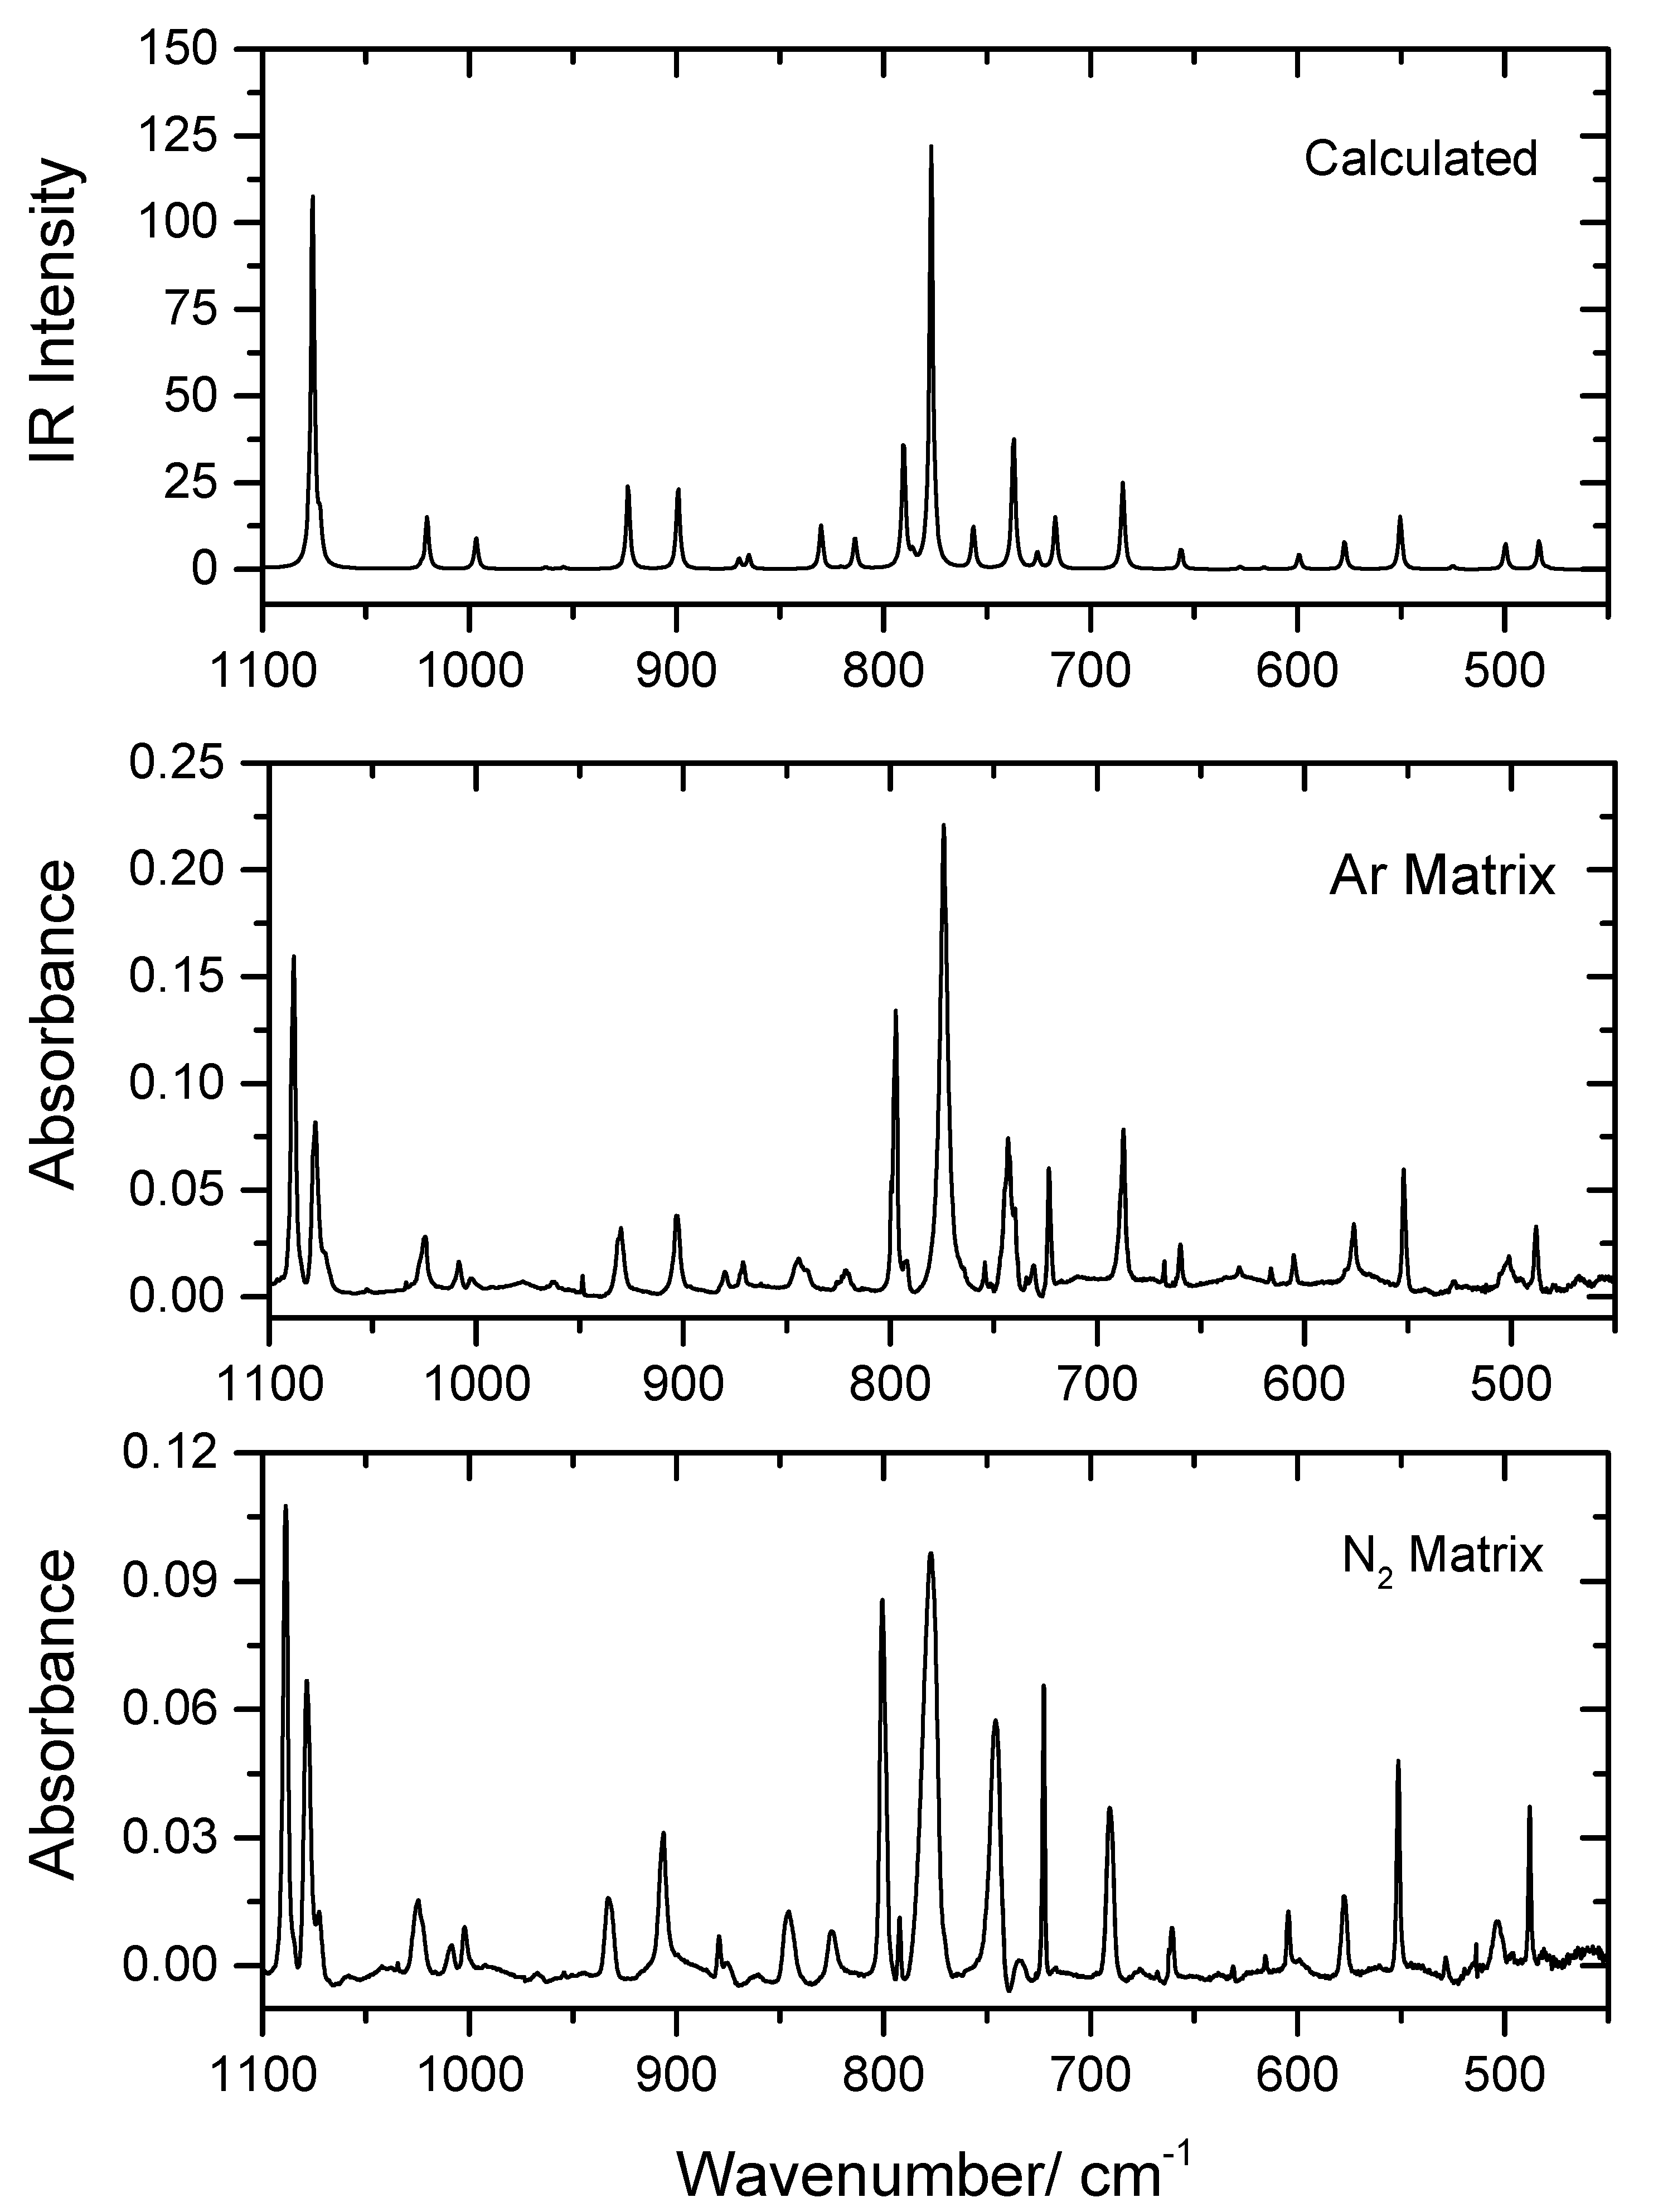
In the present study, PHN was isolated in low temperature (10 K) Ar and N2 matrices, as described in Section 2. The recorded experimental mid-IR spectra of the as-deposited matrices in the 1800–1100 and 1100–450 cm−1 spectral regions are shown in Figure 2 and Figure 3, in which they are compared with the B3LYP/6-311++G(d,p)-calculated infrared spectrum of conformer 1 (the spectral range 3500–2900 cm−1 is shown in Figure S1). The proposed band assignments are provided in Table 4, together with the calculated frequencies and infrared intensities.
As seen from Figure 2 and Figure 3 and Table 4, the calculated spectrum for conformer 1 reproduces the experimental data very well, demonstrating the sole existence of this conformer in the matrices and making the assignment of the experimental spectra straightforward. The excellent reproduction of the experimental data by the calculations shall be highlighted, because frequently the DFT method does not describe hydrogen bonding precisely, which is an essential intramolecular interaction in the case of the experimentally-relevant conformer of the studied molecule. Nevertheless, the functional/basis set used in the present study has been shown to be reliable for infrared spectra predictions for many other intramolecularly-bonded molecules formed exclusively by atoms of the first and second row of the periodic table [26,27,28]. In here, only the assignments for the most prominent characteristic vibrations of PHN will be briefly addressed.
4.2.1. 3500–2900 cm−1 Region
The stretching mode of the H-bonded O–H group can be expected to give rise to a very broad band, spreading across a wide range of frequencies. Accordingly, in the experimental spectra, a broad feature is observed within the 3460–3350 cm−1 range, with maxima at 3435 and 3375 cm−1 in the case of the argon matrix spectrum, and at 3429 and 3375 cm−1 for the N2 matrix, which are ascribed to the νO–H stretching mode. It is interesting to note that the calculations predict this vibration at 3314 cm−1, i.e., somewhat shifted to lower frequencies when compared to the experimental data. Such a result may indicate that the intramolecular hydrogen bond strength is overestimated to some extent by the DFT calculations, a result that has been found for other molecules bearing strong intramolecular hydrogen bonds, e.g., malonic acid [29]. The fact that the experimentally-observed bands have two major maxima indicates that, in both matrices, PHN molecules have been trapped in two main matrix sites, a conclusion that is reinforced by the observation of other bands exhibiting a doublet-type structure in other spectral regions, as pointed out below.
The bands originating in the aromatic C–H stretching modes give rise to the structured features spreading from 3261 and 2970 cm−1, and from 3229 and 2895 cm−1, in the argon and N2 matrices, respectively. These spectral features result from extensive overlapping bands due to the different νC–H stretching modes (which can also be expected to be site split) and also comprise contributions resulting from Fermi resonance interactions involving the overtones and combination modes of the δC–H bending and νC–C stretching ring modes whose fundamentals are observed in the 1550–1450 cm−1 range. This is in accordance with the findings of earlier theoretical studies that found a strong contribution of non-fundamental modes to the C–H stretching region [30].
4.2.2. 1800–1100 cm−1 Region
In this spectral range, the IR spectrum of PHN is dominated by the strong bands predicted at 1671 (νC=O), 1328 (a mixed mode with major contributions from δO–H, νC–O(H), νC–O and νC–C), 1244 (corresponding essentially to the anti-symmetric stretching mode involving the C–C and C–O bonds α to the carbonyl) and 1185 (νO–C–O anti-symmetric stretching) cm−1. These bands have experimental counterparts in the experimental spectra obtained in the argon and N2 matricesat 1691/1686/1682/1680, 1351/1350/1340/1331, 1255 and 1205/1204/1199/1198 cm−1, and 1693/1689/1682/1681, 1354/1352/1343/1340, 1255 and 1212/1207/1199/1195 cm−1, respectively (see Table 4).
With the exception of the feature observed at 1255 cm−1, the remaining three modes give rise to four overlapping bands resulting from the simultaneous occurrence of matrix site splitting (two major sites, as seen also for νO–H; see above) and Fermi resonance interactions (tentative interacting modes are respectively the overtone of the mode whose fundamental is observed at 845 cm−1, the combination tone 687 + 660 cm−1, and the overtone of the fundamental at 605 cm−1, in the argon matrix, which in N2 appear at 846, 691+661 and 604 cm−1, respectively). It is also interesting to note that the calculations predict the νC=O stretching at a slightly lower frequency value compared to the observed ones, which supports the above conclusion that the strength of the intramolecular hydrogen bond is somewhat overestimated by the calculations.
A remarkable result that can be extracted from the calculations is the fact that the δO–H bending vibration is mixed extensively with other vibrations, contributing significantly to eight normal modes, whose frequencies span from ca. 1270 up to about 1630 cm−1 (see Table 4). As expected, all of these modes thus give rise to bands with a significantly high infrared intensity, which is confirmed by the experimental data (see Table 4 and Figure 2). To a lesser extent, the same can be also stated for both the C–O and C–O(H) stretching vibrations, which are predicted to contribute significantly to four and five normal modes, respectively (in some cases the same to which the δO–H vibration contributes), all of them giving rise to considerably intense experimental infrared bands.
The remaining bands observed in this spectral region in the matrix isolation spectra of PHN are mostly ascribable to vibrations of the aromatic rings and could be assigned straightforwardly in view of the very good agreement with the calculated data (see Table 4).
4.2.3. 1100–450 cm−1 Region
In the higher frequency range of this spectral region, from 1100 to 800 cm−1, most of the bands are of low intensity and originate from vibrations of the aromatic moieties, and the experimental spectra are globally very well reproduced by the calculations. Only two vibrations with significant contributions from other molecular fragments are observed in this part of the spectrum. The first corresponds to the intense bands observed in argon and N2 at 1088 and 1089 cm−1, respectively, which are ascribed to a vibration with a relevant contribution from the νC–O(H) stretching (predicted at 1076 cm−1). The second appears at 845/840 and 846 cm−1 in the spectra obtained in the argon and N2 matrices, respectively, which—according to the calculations—will also have a non-negligible contribution from the δC–O–C bending (calculated at 830 cm−1; see Table 4). On the other hand, below 800 cm−1, the number of bands ascribable other than the aromatic groups is larger. The most prominent band is due to the τO–H torsion, which is observed at 774 and 777 cm−1 in the argon and N2 matrices, respectively, in good agreement with the predicted value (777 cm−1). Besides this, the bands observed at about 800, 755, 735 and 630 cm−1 are also observed in this spectral region in both the argon and N2 matrices, and have significant contributions from the δO–C=O, γC=O and γC–O(H) vibrations. Both the frequencies and relative intensities of these bands agree fairly well with the calculated data, as can be seen in Figure 3 and Table 4.
4.3. Narrowband UV-Induced Decarbonylation of PHN
The photochemistry of matrix-isolated PHN (in both argon and N2 matrices) was here investigated for the first time. The matrices were irradiated using narrowband UV-light (see Section 2 for details); the excitation wavelength range used was chosen whilst taking into account the TD-DFT-B3LYP/6-31G(d) calculated UV spectrum of the compound [17]. After each irradiation, an infrared spectrum was collected and analyzed in order to probe the changes taking place in the sample. The irradiation experiments started using UV light with λ = 331.7 nm, which was subsequently decreased stepwise down to λ = 235.0 nm (the sequences of irradiations performed are described in Table S1, which gives the irradiation wavelengths, laser pulse energies and exposure times used). Noticeable spectral changes indicating the transformation of PHN into other molecules were observed for all wavelengths used, the efficiency of the process increasing with the energy of the excitation UV light used.
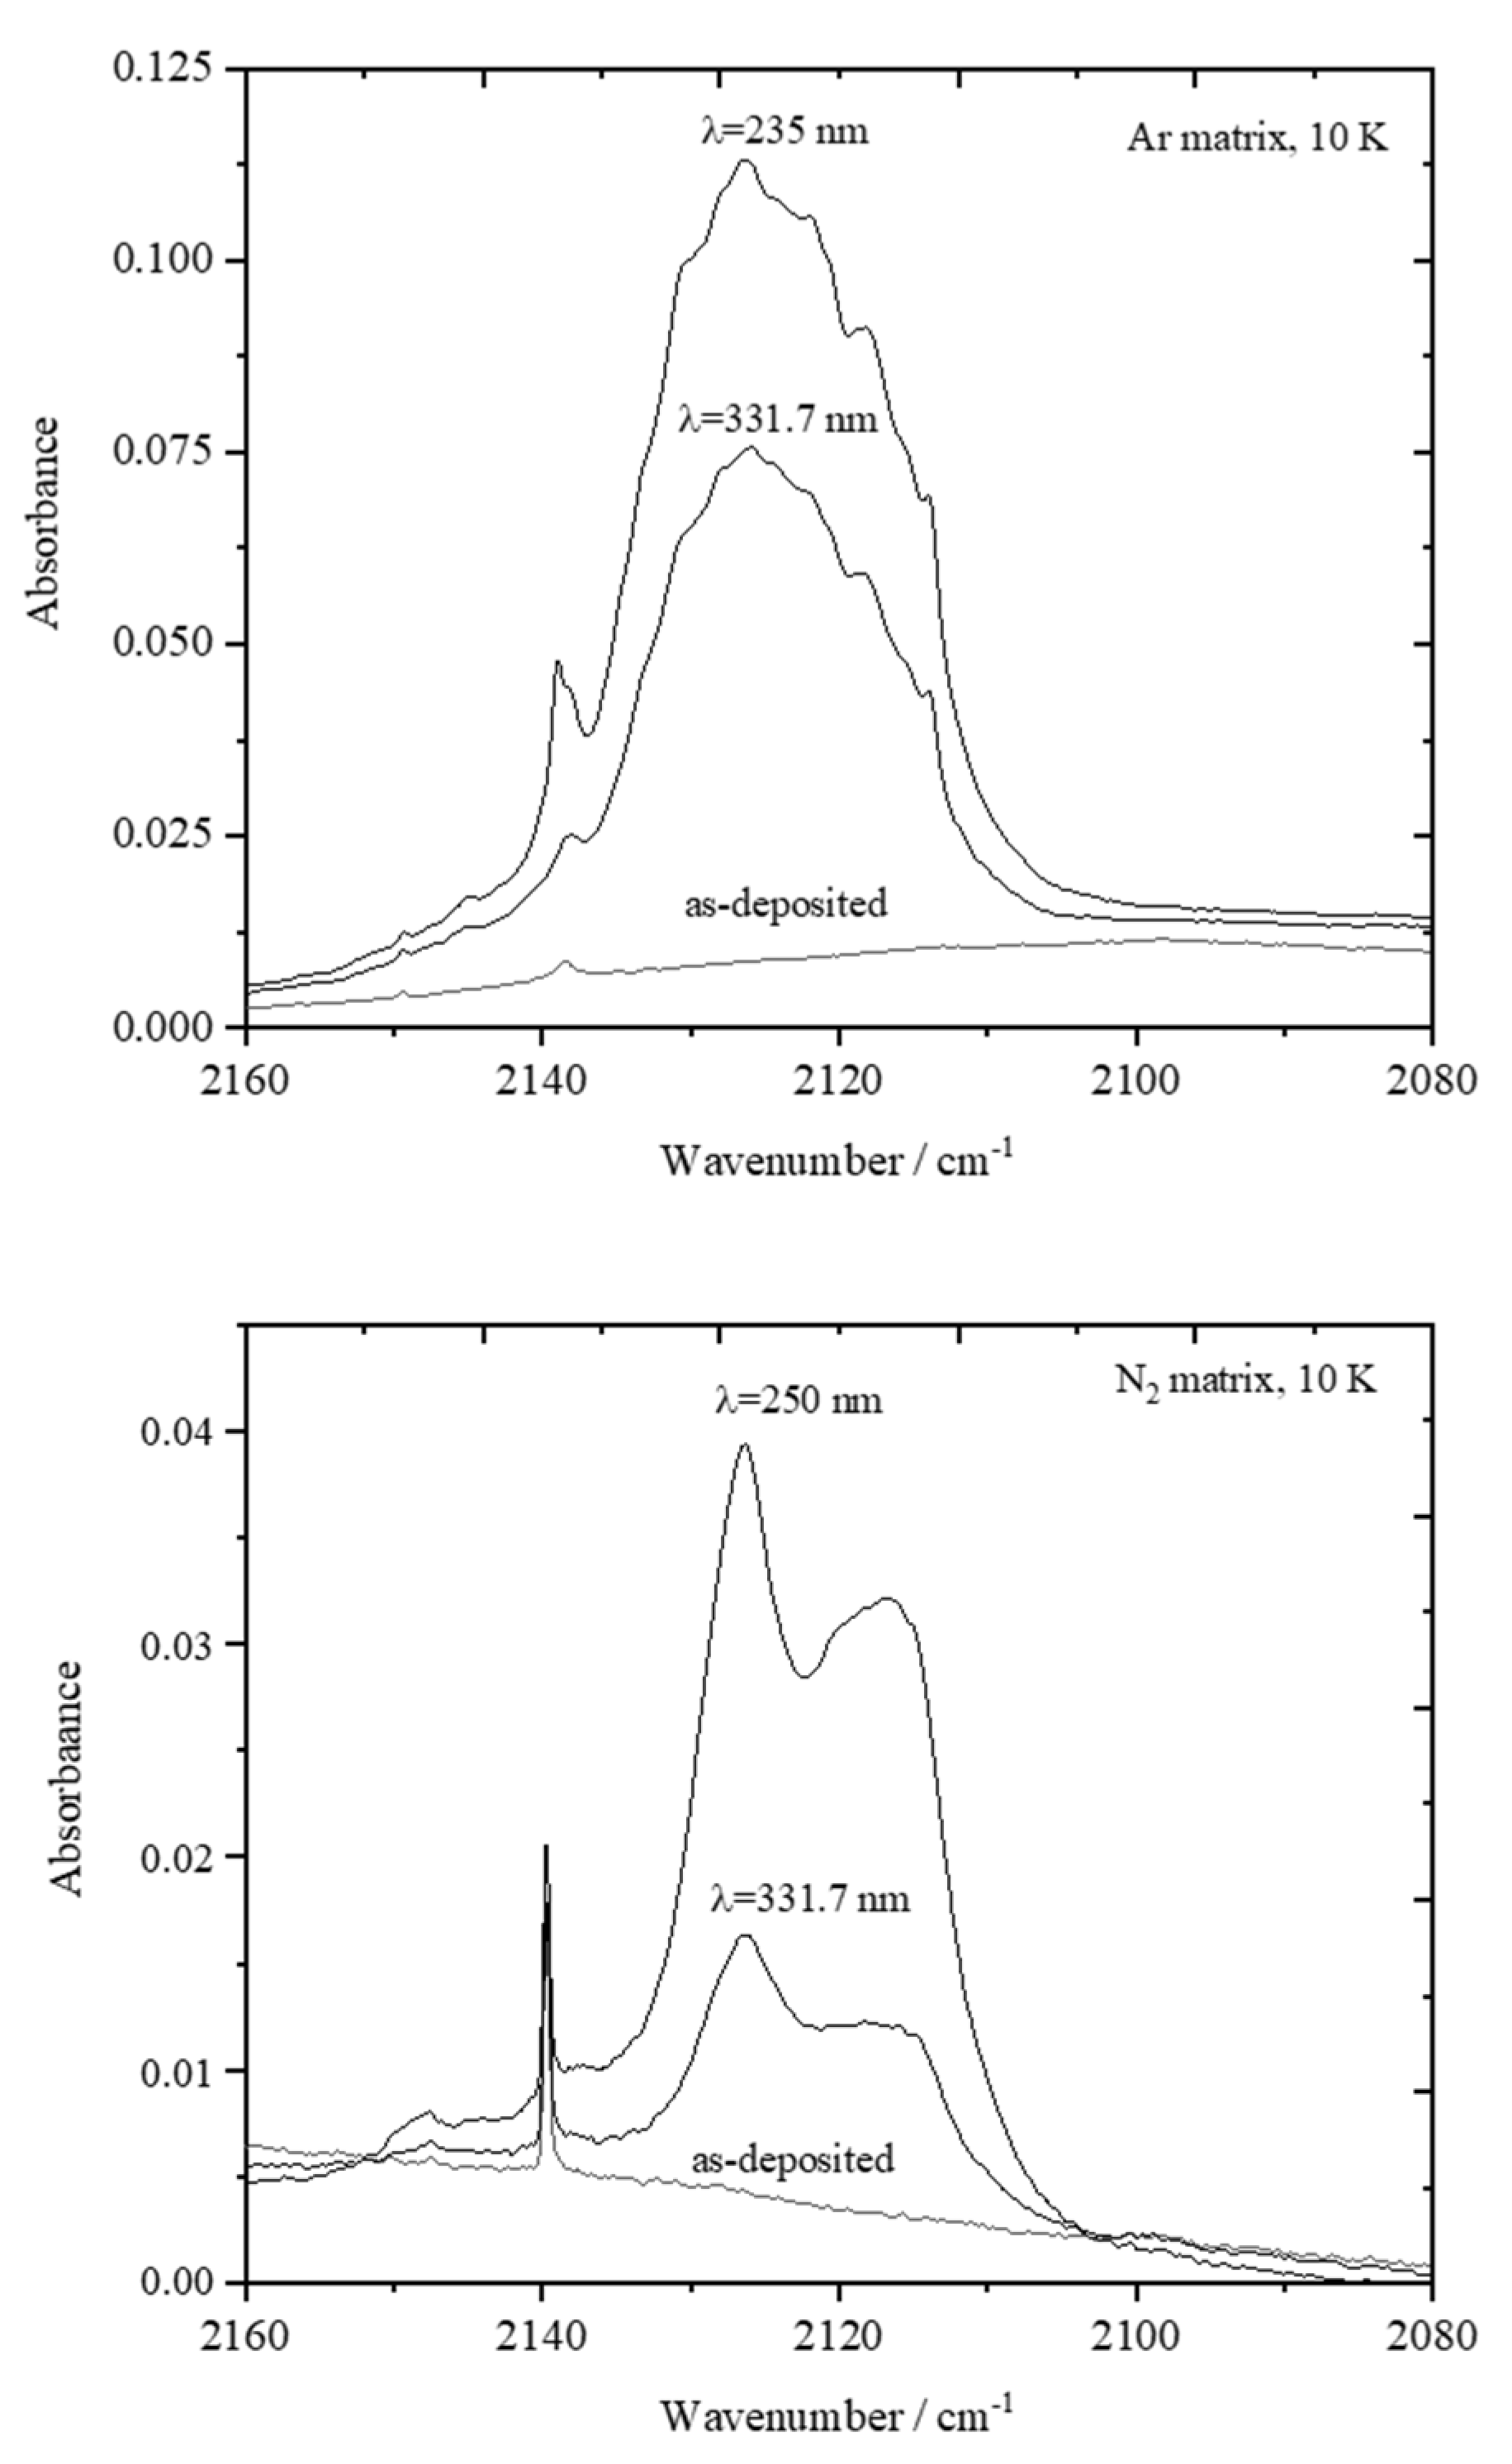
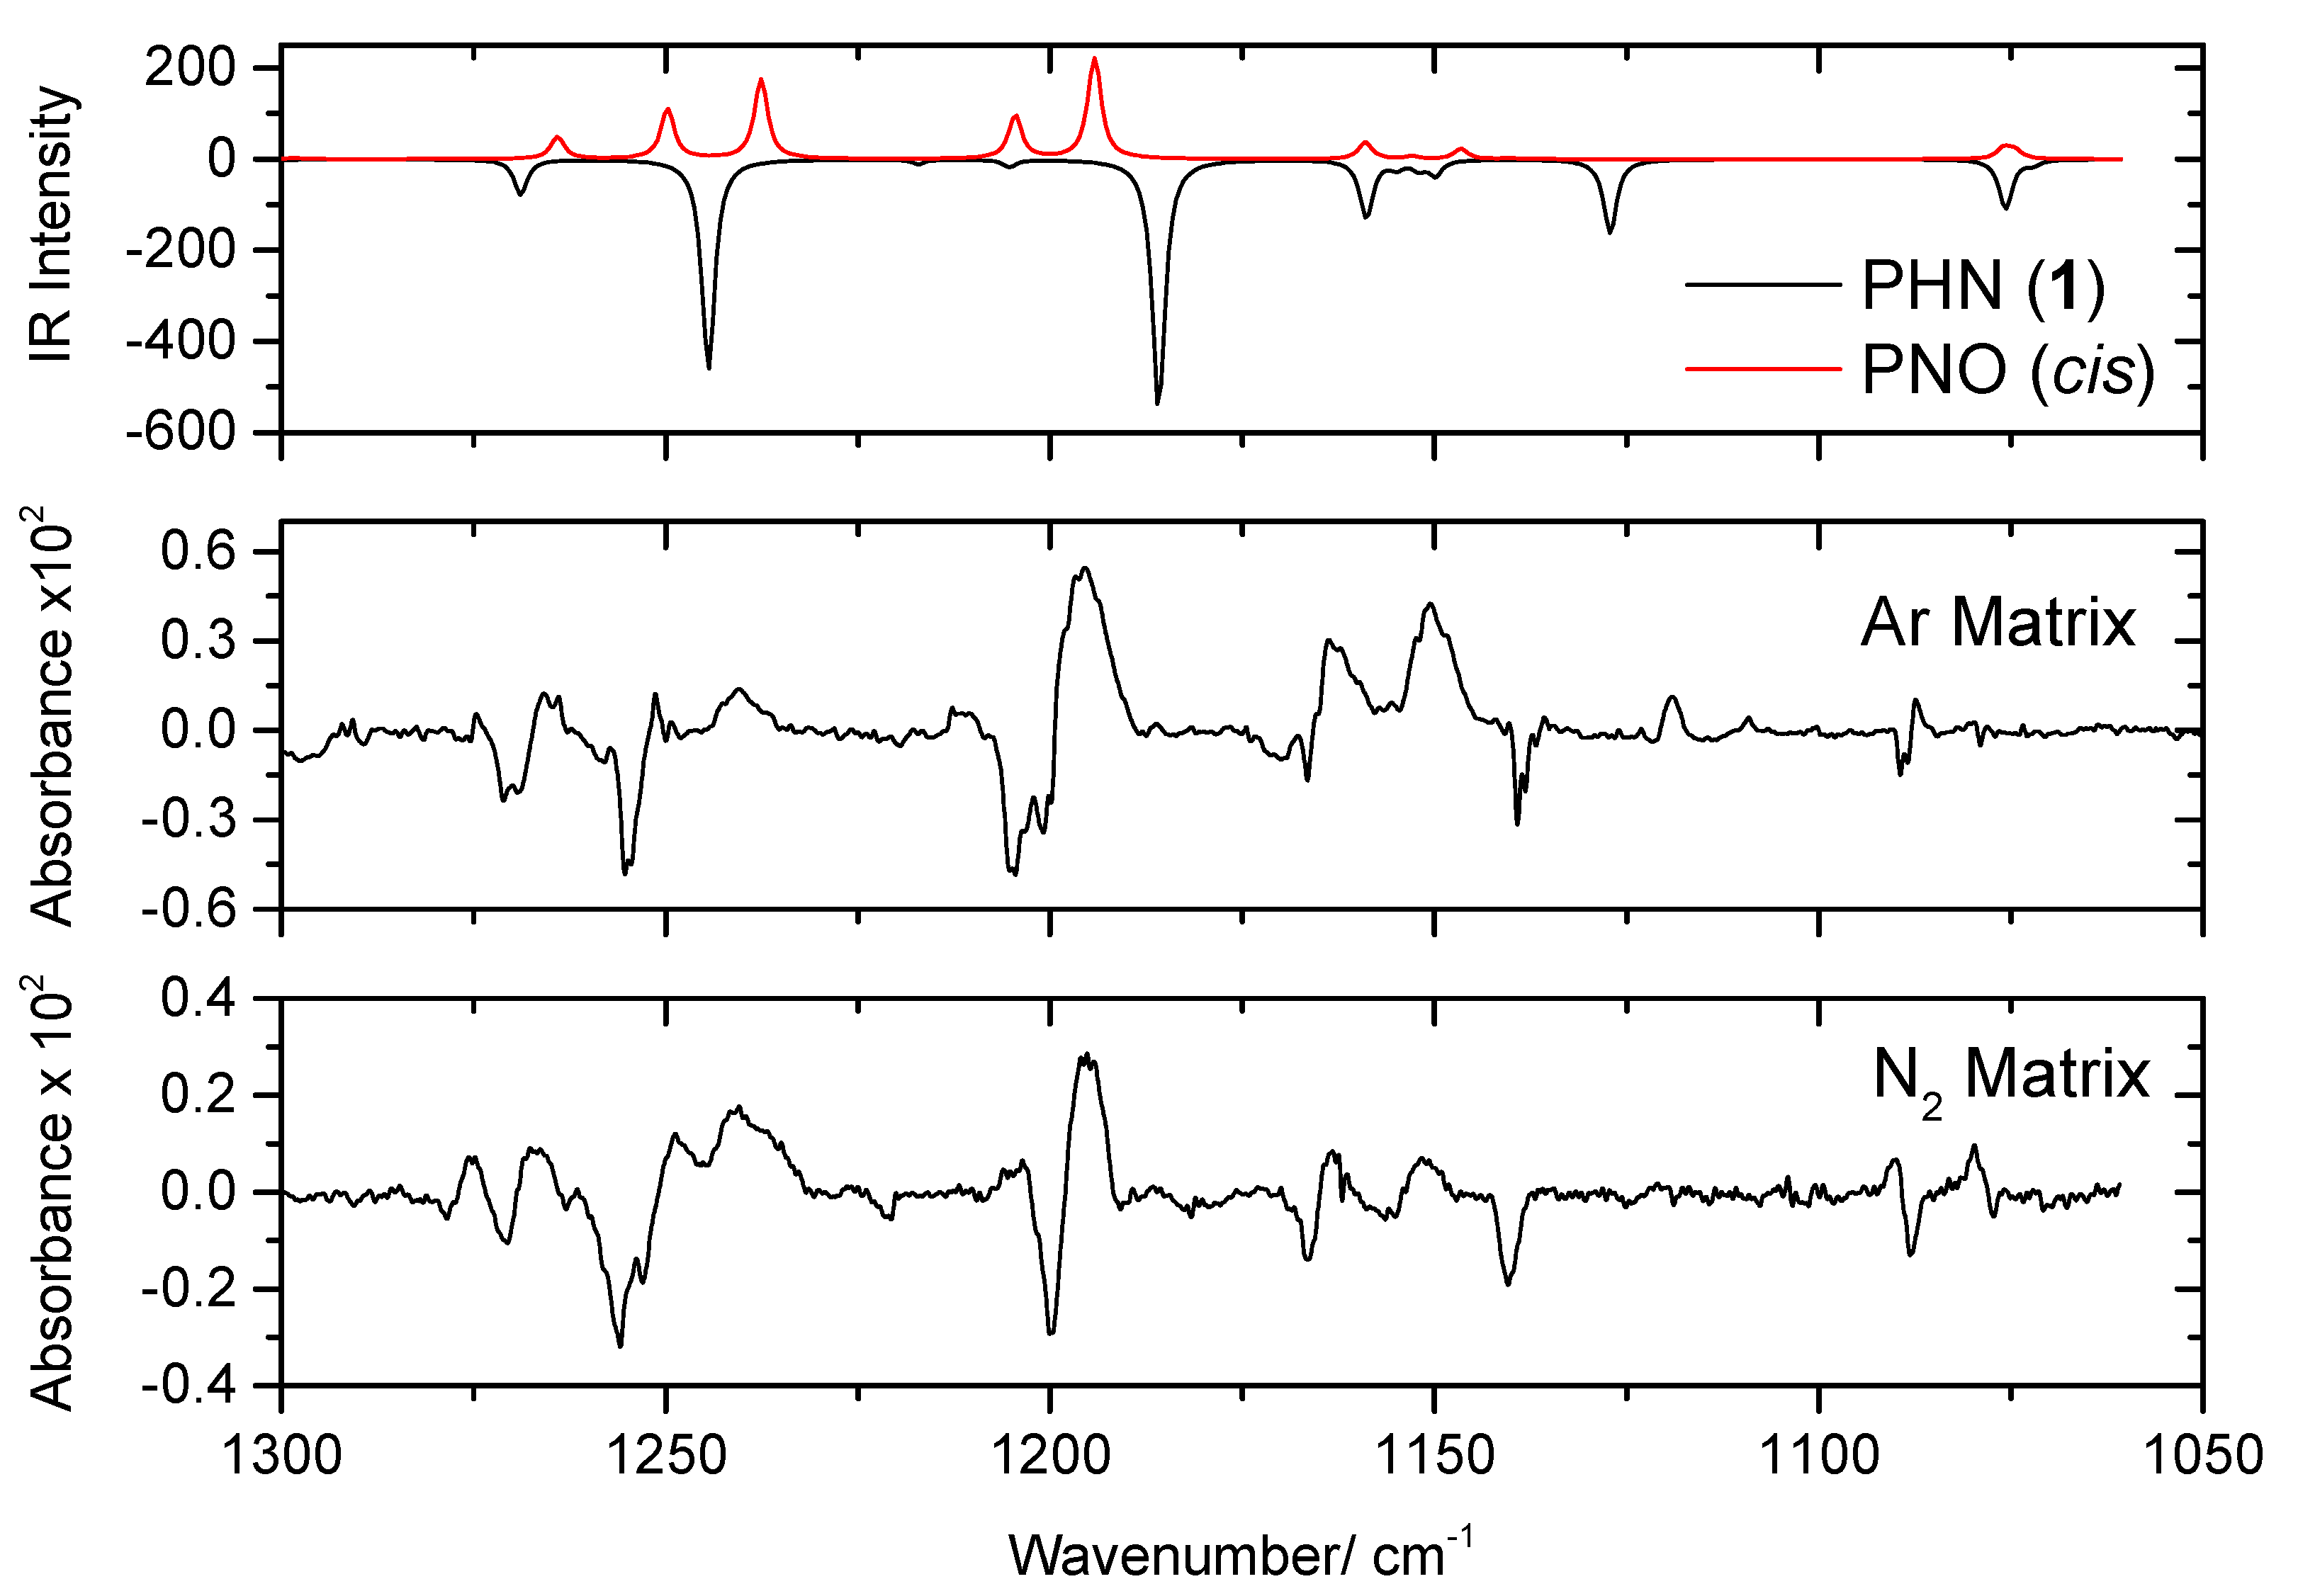
The spectra of the irradiated matrices reveal the photogeneration of carbon monoxide (CO), which gives rise to the bands at 2138 cm−1 (in the Ar matrix) and at 2139 cm−1 (in the N2 matrix), which were assigned to the well-isolated monomer, and at 2126/2122/2118/2114 cm−1 (Ar) and 2126/2117 cm−1 (N2) due to CO molecules interacting with other species in the matrices (Figure 4) [31,32,33,34,35]. These results doubtlessly indicate the occurrence of photodecarbonylation. Together with CO, 2-phenoxynapthalen-1-ol (PNO) shall be produced, which is confirmed by the comparison of the experimental spectra of the irradiated matrices with the calculated spectra of this molecule. This comparison is presented in Figure 5, which shows the 1300–1050 cm−1 spectral region of the difference infrared spectra (spectra of the irradiated matrices at the end of the full sequence of irradiations, minus the spectra of the as-deposited matrices), with the simulated difference spectrum built based on the B3LYP/6-311++G(d,p) calculated infrared spectra of cis PNO (with positive intensities) and of PHN (with negative intensities). In this figure, the calculated spectrum of the cis conformer of PNO is presented, because it was calculated to be more stable than the trans form (by 22.9 kJ mol−1) (see Figure 6). The full calculated infrared spectrum of PNO is provided in Figure S2.
The calculations predict that, globally, the infrared spectrum of PNO is less intense than that of PHN. Together with the low efficiency of the decarbonylation reaction (the estimated amount of reactant consumed at the end of the full sequences of irradiation, based on the decrease of intensity of its bands, is less than 5%), this fact makes it possible to detect only the most intense bands of the photoproduct. However, in the 1300–1050 cm−1 spectral region (see Figure 5), in which almost all of the most intense bands of PNO are predicted to occur, the emerging bands fit fairly well those calculated for this compound. Specifically, the comparatively intense vibrations predicted at 1264, 1250, 1238, 1205, 1194, 1159, 1146, 1075, and 1074 cm−1, most of them with significant contributions from the δO–H (in most of the cases), νC–O, or/and νC–O(H) coordinates, have experimentally-observed counterparts at 1274/1265, 1251, 1241, 1211, 1195, 1162, 1150, 1087, and 1080 cm−1 in the argon matrix, and at 1275/1267, 1248, 1241/1237, 1205, 1195, 1163, 1152, 1090, and 1080 cm−1 in the N2 matrix, all being in good agreement with the calculated values (the approximate descriptions of the calculated normal modes for cis PNO are given in Table S4).
5. Conclusions
Phenyl 1-hydroxy-2-naphthoate (PHN) was investigated by matrix isolation infrared spectroscopy, complemented by DFT(B3LYP)/6-311++G(d,p) calculations. The investigations were focused on the evaluation of the conformational space of the molecule and reasons for the different stability of its conformers, and on the UV-induced phototransformation of matrix-isolated PHN in argon and N2 matrices (at 10 K).
The twofold degenerated O–H···O=C intramolecularly hydrogen bonded conformer with the phenyl ring ester group ±68.8° out of the plane of the substituted naphtyl moiety is the most stable conformer of the molecule, being considerably more stable than the second most stable form (by over 14.75 kJ mol−1), in which a weaker O–H···O–C intramolecular hydrogen bond exists. The non-hydrogen bonded conformers were characterized by dominant repulsive intramolecular interactions involving the lone electron pairs of the oxygen atoms as well as the aromatic rings, and were predicted to have much higher energies than the H-bonded forms (over 55 kJ mol−1).
The most stable conformer of PHN was successfully trapped both in argon and nitrogen matrices, and was shown to photodecarbonylate upon UV irradiation within the wavelength range 331.7–235.0 nm, with the decarbonylation process showing a low efficiency which increases for shorter irradiation wavelengths. Together with CO, 2-phenoxynaphthalen-1-ol (PNO) was produced and successfully detected in the photolysed matrices. No evidence of the occurrence of any other photo-induced process was gathered. On the whole, the present study contributes to the better understanding of the structure, intramolecular interactions and photochemistry of PHN, a relevant member of the hydroxynaphtoate family of compounds.
Supplementary Materials
The following are available online https://0-www-mdpi-com.brum.beds.ac.uk/2673-7256/1/1/2/s1. Figure S1: Infrared spectrum of PHN in Ar and N2 matrices (10 K), and B3LYP/6-311++G(d,p) calculated spectra for PHN conformer 1 in the 3500–2900 cm−1 range. Figure S2: Graphical representation of the full calculated infrared spectrum of cis PNO. Table S1: Information on the used UV-irradiation sequences. Tables S2 and S3: B3LYP/6-311++G(d,p) optimized Cartesian coordinates for the conformers of PHN and PNO, respectively. Table S4: Calculated infrared data for cis PNO, including the approximate description of the vibrations.
Author Contributions
R.F., conceptualization, formal analysis, supervision, funding acquisition, writing, final version; S.G., methodology, laboratory work, writing—review and editing; İ.S. and Y.G.S., laboratory work, computations, funding acquisition, writing—original draft. All authors have read and agreed to the published version of the manuscript.
Funding
İ.S. and Y.G.S. thank Bitlis Eren University for the computational facilities, the Bitlis Eren University Research Foundation for the financial support (Project BEBAP-2013.04), and the Erasmus Offices of the Bitlis Eren and Coimbra Universities for short term ERASMUS+ Grants at the University of Coimbra. S.G. thanks the LaserLab Coimbra for a researcher position at the Coimbra Chemistry Centre (CQC)–Coimbra. The Coimbra Chemistry Centre (CQC) is supported by the Portuguese Science Foundation (FCT) (Projects UI0313B/QUI/2020 and UI0313P/QUI/2020) and COMPETE-UE. Support from FCT through Project PTDC/QUI-QFI/1880/2020 is also acknowledged.
Data Availability Statement
The data presented in this study are available in Supplementary Materials.
Conflicts of Interest
The authors declare no conflict of interest.
References
- Zhang, J.-Y.; Jin, H.; Wang, G.-F.; Yu, P.-J.; Wu, S.-Y.; Zhu, Z.-G.; Li, Z.-H.; Tian, Y.-X.; Xu, W.; Zhang, J.-J.; et al. Liposomal Curcumin Targeting Endometrial Cancer Through the NF-κB Pathway. Inflamm. Res. 2011, 60, 851–859. [Google Scholar] [CrossRef]
- Morand, E.F.; Iskander, M.N. Napththalene Derivatives Which Inhibit the Cytokine or Biological Activity of Macrophage Migration Inhibitory Factor (mif). PCT International Application 2003. WO 2003104178A1, 18 December 2003. [Google Scholar]
- Baboshin, M.A.; Golovleva, L.A. Increase of 1-Hydroxy-2-naphthoic Acid Concentration as a Cause of Temporary Cessation of Growth for Arthrobacter sp. K3: Kinetic Analysis. Microbiology 2009, 78, 180–186. [Google Scholar] [CrossRef]
- Sastry, M.N.V.; Claessens, S.; Habonimana, P.P.; De Kimpe, N. Synthesis of the Natural Products 3-Hydroxymollugin and 3-Methoxymollugin. J. Org. Chem. 2010, 75, 2274–2280. [Google Scholar] [CrossRef]
- Meyers, A.I.; Avila, W.B. Chemistry of Aryloxazolines. Applications to the Synthesis of Lignan Lactone Derivatives. J. Org. Chem. 1981, 46, 3881–3886. [Google Scholar] [CrossRef]
- Zjawiony, J.; Peterson, J.R. An Improved Synthesis of Naphtho[2,3-d]-1,3-dioxole-5-methoxy-6-carboxylic acid. Org. Prep. Proced. Int. 1991, 23, 163–172. [Google Scholar] [CrossRef]
- Hauser, F.M.; Rhee, R.P. Syntheses of .alpha.- and .beta.-Sorigenin Methyl Ethers. J. Org. Chem. 1977, 42, 4155–4157. [Google Scholar] [CrossRef]
- Franck, R.W.; Bhat, V.; Subramaniam, C.S. The Sstereoselective Total Synthesis of the Natural Enantiomer of Olivin Trimethyl Ether. J. Am. Chem. Soc. 1986, 108, 2455–2457. [Google Scholar] [CrossRef]
- Woolfe, G.J.; Thistlethwaite, P.J. Excited-state Prototropic Reactivity in Salicylamide and Salicylanilide. J. Am. Chem. Soc. 1980, 102, 6917–6923. [Google Scholar] [CrossRef]
- Woolfe, G.J.; Thistlethwaite, P.J. Excited-state Prototropism in Esters of o-Hydroxy-2-naphthoic Acids. J. Am. Chem. Soc. 1981, 103, 3849–3854. [Google Scholar] [CrossRef]
- Law, K.Y.; Shoham, J. Photoinduced Proton Transfers in Methyl Salicylate and Methyl 2-hydroxy-3-naphthoate. J. Phys. Chem. 1994, 98, 3114–3120. [Google Scholar] [CrossRef]
- Bergmann, E.D.; Hirshberg, Y.; Pinchas, S. Ultra-violet Spectrum and Constitution of 3-Hydroxy-2-naphthoic Acid and Related Compounds. J. Chem. Soc. 1950, 2351–2356. [Google Scholar] [CrossRef]
- Naboikin, U.V.; Zadorozhnyi, B.A.; Pavlova, E.N. Peculiarities of the Luminescence of Ortho-Disubstituted Aromatic Hydrocarbons: II. Opt. Spectrosc. (Eng. Transl.) 1959, 6, 312. [Google Scholar]
- McCarthy, A.; Ruth, A.A. Fluorescence Excitation and Excited State Intramolecular Relaxation Dynamics of Jet-cooled Methyl-2-hydroxy-3-naphthoate. Chem. Phys. 2013, 425, 177–184. [Google Scholar] [CrossRef]
- Catalán, J.; del Valle, J.C.; Palomar, J.; Díaz, C.; de Paz, J.L.G. The Six-Membered Intramolecular Hydrogen Bond Position as a Switch for Inducing an Excited State Intramolecular Proton Transfer (ESIPT) in Esters of o-Hydroxynaphthoic Acids. J. Phys. Chem. A 1999, 103, 10921–10934. [Google Scholar] [CrossRef]
- Tobita, S.; Yamamoto, M.; Kurahayashi, N.; Tsukagoshi, R.; Nakamura, Y.; Shizuka, H. Effects of Electronic Structures on the Excited-state Intramolecular Proton Transfer of 1-Hydroxy-2-acetonaphthone and Related Compounds. J. Phys. Chem. A 1998, 102, 5206–5214. [Google Scholar] [CrossRef]
- Sıdır, İ.; Gülseven Sıdır, Y. Solvatochromism and Intramolecular Hydrogen-bonding Assisted Dipole Moment of Phenyl 1-Hydroxy-2-naphthoate in the Ground and Excited States. J. Mol. Liq. 2016, 221, 972–985. [Google Scholar] [CrossRef]
- Frisch, M.J.; Trucks, G.W.; Schlegel, H.B.; Scuseria, G.E.; Robb, M.A.; Cheeseman, J.R.; Scalmani, G.; Barone, V.; Petersson, G.A.; Nakatsuji, H.; et al. Gaussian 09, Revision A.02; Gaussian, Inc.: Wallingford, CT, USA, 2009. [Google Scholar]
- Becke, A.D. Density-functional Exchange-energy Approximation with Correct Asymptotic Behavior. Phys. Rev. A 1988, 38, 3098–3100. [Google Scholar] [CrossRef]
- Lee, C.T.; Yang, W.T.; Parr, R.G. Development of the Colle-Salvetti Correlation-energy Formula into a Functional of the Electron Density. Phys. Rev. B 1988, 37, 785–789. [Google Scholar] [CrossRef] [PubMed] [Green Version]
- Vosko, S.H.; Wilk, L.; Nusair, M. Accurate Spin-dependent Electron Liquid Correlation Energies for Local Spin Density Calculations: A Critical Analysis. Can. J. Phys. 1980, 58, 1200–1211. [Google Scholar] [CrossRef] [Green Version]
- McLean, A.D.; Chandler, G.S. Contracted Gaussian Basis Sets for Molecular Calculations. I. Second Row Atoms, Z=11–18. J. Chem. Phys. 1980, 72, 5639–5648. [Google Scholar] [CrossRef]
- Dennington, R.; Keith, T.; Milam, J. GaussView (Version 5.0); Semichem Inc.: Shawnee Mission, KS, USA, 2009. [Google Scholar]
- Fausto, R.; Batista de Carvalho, L.A.E.; Teixeira-Dias, J.J.C. Conformational Analysis of Carbonyl and Thiocarbonyl Ethyl Esters: The HC(=X)Y-CH2CH3 (X, Y = O or S) Internal Rotation. J. Comput. Chem. 1992, 13, 799–809. [Google Scholar] [CrossRef]
- Lopes, S.; Nikitin, T.; Fausto, R. Structural, Spectroscopic, and Photochemical Study of Ethyl Propiolate Isolated in Cryogenic Argon and Nitrogen Matrices. Spectrochim. Acta A 2020, 241, 118670. [Google Scholar] [CrossRef] [PubMed]
- Reva, I.D.; Stepanian, S.; Adamowicz, L.; Fausto, R. Combined FTIR Matrix Isolation and Ab Initio Studies of Pyruvic Acid: Proof for Existence of the Second Conformer. J. Phys. Chem. A 2001, 105, 4773–4780. [Google Scholar] [CrossRef] [Green Version]
- Apóstolo, R.F.G.; Bento, R.F.; Tarczay, G.; Fausto, R. The First Experimental Observation of the Higher-Energy Trans Conformer of Trifuoroacetic Acid. J. Mol. Struct. 2016, 1125, 288–295. [Google Scholar] [CrossRef]
- Avadanei, M.; Cozan, V.; Kuş, N.; Fausto, R. Structure and Photochemistry of N-Salicylidene-p-carboxyaniline Isolated in Solid Argon. J. Phys. Chem. A 2015, 119, 9121–9132. [Google Scholar] [CrossRef]
- Maçôas, E.M.S.; Fausto, R.; Lundell, J.; Pettersson, M.; Khriachtchev, L.; Räsänen, M. Conformational Analysis and Near-infrared-induced Rotamerization of Malonic Acid in an Argon Matrix. J. Phys. Chem. A 2000, 104, 11725–11732. [Google Scholar] [CrossRef] [Green Version]
- Beć, K.B.; Grabska, J.; Ozaki, Y.; Hawranek, J.P.; Huck, C.W. Influence of Non-fundamental Modes on Mid-infrared Spectra: Anharmonic DFT Study of Aliphatic Ethers. J. Phys. Chem. A 2017, 121, 1412–1424. [Google Scholar] [CrossRef]
- Wu, L.; Lambo, R.; Tan, Y.; Liu, A.-W.; Hu, S.-M. Infrared Spectroscopy of CO Isolated in Solid Nitrogen Matrix. Chin. J. Chem. Phys. 2014, 27, 5–8. [Google Scholar] [CrossRef] [Green Version]
- Jarmelo, S.; Reva, I.D.; Lapinski, L.; Nowak, M.J.; Fausto, R. Matrix-isolated Diglycolic Anhydride: Vibrational Spectra and Photochemical Reactivity. J. Phys. Chem. A 2008, 112, 11178–11189. [Google Scholar] [CrossRef] [Green Version]
- Giuliano, B.M.; Reva, I.; Fausto, R. Infrared Spectra and Photochemistry of Matrix-isolated Pyrrole-2-carbaldehyde. J. Phys. Chem. A 2010, 114, 2506–2517. [Google Scholar] [CrossRef] [Green Version]
- Breda, S.; Reva, I.; Fausto, R. UV-induced Unimolecular Photochemistry of Diketene Isolated in Cryogenic Inert Matrices. J. Phys. Chem. A 2012, 116, 2131–2140. [Google Scholar] [CrossRef] [PubMed]
- Lapinski, L.; Reva, I.; Gerega, A.; Nowak, M.J.; Fausto, R. UV-induced Transformations of Matrix-isolated 6-Azacytosine. J. Chem. Phys. 2018, 149, 104301. [Google Scholar] [CrossRef] [PubMed] [Green Version]
Figure 1.
Optimized structures of the PHN conformers. The relative electronic energies are given in parentheses (in kJ mol−1). See Table 1 and Table 2 for the details concerning the energies and conformationally-relevant dihedral angles. The full Cartesian coordinates are provided in Table S2.

Figure 2.
Infrared spectrum of PHN in Ar (middle) and N2 (bottom) matrices (10 K), and the B3LYP/6-311++G(d,p) calculated spectra for PHN conformer 1 (top) in the 1800–1100 cm−1 range. The band at 1597 cm−1 in the N2 matrix spectrum, and those at 1624, 1608, 1593 and 1590 cm−1 in the Ar matrix spectrum are due to traces of monomeric water impurity.

Figure 3.
Infrared spectrum of PHN in Ar (middle) and N2 (bottom) matrices (10 K), and the B3LYP/6-311++G(d,p) calculated spectra for PHN conformer 1 (top) in the 1100–500 cm−1 range. The very small bands at ~668 cm−1 are due to atmospheric CO2.
Figure 3.
Infrared spectrum of PHN in Ar (middle) and N2 (bottom) matrices (10 K), and the B3LYP/6-311++G(d,p) calculated spectra for PHN conformer 1 (top) in the 1100–500 cm−1 range. The very small bands at ~668 cm−1 are due to atmospheric CO2.

Figure 4.
UV-induced generation of carbon monoxide: fragment of the infrared spectra of PHN isolated in the Ar and N2 matrices recorded after the deposition of the matrix before any irradiation, after irradiation with λ = 331.7 nm and λ = 235.0 nm in an Ar matrix, and after irradiation with λ = 331.7 nm and λ = 250.0 nm in an N2 matrix.

Figure 5.
Infrared difference spectra (1300–1050 cm−1 region, in which the most intense bands of PNO occur; baseline corrected) showing the results of the full sequence of the performed irradiations (see Table S1) of PHN isolated in Argon (middle) and N2 (bottom) matrices. The simulated difference spectrum built based on the B3LYP/6-311++G(d,p) calculated IR spectra of PNO (cis form) and PHN (conformer 1) is presented in the (top) of the figure. In the calculated spectra, the wavenumbers were scaled by 0.978.

Figure 6.
B3LYP/6-311++G(d,p) optimized structures of the cis and trans conformers of PNO. The ΔE(trans-cis) value is given in parentheses (in kJ mol−1). The Cartesian coordinates for the optimized structures are given in Table S3.
Figure 6.
B3LYP/6-311++G(d,p) optimized structures of the cis and trans conformers of PNO. The ΔE(trans-cis) value is given in parentheses (in kJ mol−1). The Cartesian coordinates for the optimized structures are given in Table S3.


Table 1.
Calculated relative electronic energies (ΔE), zero-point corrected electronic energies (ΔE(0)), and standard Gibbs energies (ΔG°; 298.15 K; 1 atm) for the different conformers of PHN, dipole moments (μ), and estimated gas phase equilibrium populations at 298.15 K (p(298.15)) a.
Table 1.
Calculated relative electronic energies (ΔE), zero-point corrected electronic energies (ΔE(0)), and standard Gibbs energies (ΔG°; 298.15 K; 1 atm) for the different conformers of PHN, dipole moments (μ), and estimated gas phase equilibrium populations at 298.15 K (p(298.15)) a.
| 1 | 2 | 3 | 4 | 5 | 6 | 7 | |
|---|---|---|---|---|---|---|---|
| ΔE | 0.00 | 14.75 | 33.13 | 57.45 | 55.98 | 81.46 | 77.03 |
| ΔE(0) | 0.00 | 14.41 | 32.35 | 54.14 | 53.04 | 77.36 | 73.15 |
| ΔG° | 0.00 | 13.02 | 33.53 | 49.65 | 49.48 | 75.72 | 73.19 |
| p(298.15) | 99.5 | 0.5 | 0.0 | 0.0 | 0.0 | 0.0 | 0.0 |
| μ | 1.75 | 1.25 | 3.80 | 3.41 | 3.89 | 5.55 | 6.17 |
a Relative energies in kJ mol−1; dipole moments in Debye.Populations in % were estimated using the Boltzmann equation. The calculated absolute values for E, E(0) and G° for conformer 1 are: −880.9763632, −880.730014, and −880.774689 hartrees, respectively.
Table 2.
Optimized conformationally-relevant dihedral angles of the different conformers of PHN a.
| Dihedral Angle b | 1 | 2 | 3 | 4 | 5 | 6 | 7 |
|---|---|---|---|---|---|---|---|
| C–C–O–H | −0.1 | 0.1 | −3.4 | −172.5 | −171.1 | 164.3 | −170.6 |
| O=C–C–C | −0.2 | −179.8 | 6.6 | −10.8 | 162.5 | −59.6 | −132.9 |
| C–O–C=O | −0.7 | 0.7 | −118.2 | −2.1 | −3.3 | 157.1 | −153.1 |
| C–C–O–C | −68.8 | 76.6 | 25.7 | −63.7 | −57.5 | −52.3 | 44.6 |
a Angles in degrees. The indicated values correspond to the form shown in Figure 1; for all of the conformers, there is a symmetry-related minimum wherethe dihedral angles assume the symmetric values. b The carbon atoms in bold correspond to the two ring carbon atoms where the substituents are bound; the C–C–O–C dihedral corresponds to the smaller dihedral made by the phenyl ring of the ester group relative to the plane of the carboxylate moiety.
Table 3.
Selected optimized geometric parameters (distances and angles) for the intramolecularly hydrogen-bonded conformers 1–3 of PHN a.
Table 3.
Selected optimized geometric parameters (distances and angles) for the intramolecularly hydrogen-bonded conformers 1–3 of PHN a.
| Conformer | C–O (Naphtol) | O–H | H…O | C=O | C–O (Carboxylic) | O…O | <(O–H…O) |
|---|---|---|---|---|---|---|---|
| 1 | 1.339 | 0.986 | 1.715 | 1.224 | 1.358 | 2.593 | 146.2 |
| 2 | 1.347 | 0.973 | 1.751 | 1.201 | 1.397 | 2.597 | 143.2 |
| 3 | 1.336 | 0.987 | 1.700 | 1.221 | 1.377 | 2.579 | 146.2 |
a Distances in Å; angles in degrees.
Table 4.
Assignment of the observed IR spectra of PHN in argon and N2 matrices (10 K), and the B3LYP/6-311++G(d,p) calculated spectra for conformer 1 a.
Table 4.
Assignment of the observed IR spectra of PHN in argon and N2 matrices (10 K), and the B3LYP/6-311++G(d,p) calculated spectra for conformer 1 a.
| Experimental | Calculated (Form 1) | |||
|---|---|---|---|---|
| Ar Matrix | N2 Matrix | νb | IIR | Approximate Description c |
| 3435/3375 | 3429/3375 | 3314 | 476.4 | νO–H |
| 3166 | 3167 | 3141 | 3.3 | νC–H ring2 |
| 3138 | 5.0 | νC–H ring3 | ||
| n.obs. | n.obs. | 3133 | 1.3 | νC–H ring1 |
| 3124 | 3131 | 3128 | 7.1 | νC–H ring1 |
| 3119 | 22.0 | νC–H ring1 | ||
| 3097 | 3102 | 3117 | 21.8 | νC–H ring3 |
| 3085 | 3087 | 3109 | 7.8 | νC–H ring1 |
| 3074 | 3078 | 3107 | 15.8 | νC–H ring2 |
| 3105 | 4.0 | νC–H ring3 | ||
| 3100 | 0.4 | νC–H ring1 | ||
| n.obs. | n.obs. | 3093 | 0.4 | νC–H ring3 |
| 1691/1686/1682/1680 | 1693/1689/1682/1681 | 1671 | 329.1 | νC=O |
| 1644/1639 | 1641/1638 | 1628 | 131.5 | ν rings2-3, δO–H |
| 1610 | 1619 | 1605 | 10.4 | ν rings2-3 |
| 1605 | 1606 | 1602 | 12.8 | ν ring1 |
| 1598 | 1600 | 1597 | 33.6 | ν ring1 |
| 1585 | 1582 | 1571 | 69.9 | ν rings2-3, δO–H |
| 1512/1506 | 1511/1507 | 1504 | 19.0 | ν rings2-3, δC–H rings2-3 |
| 1496 | 1498 | 1488 | 55.5 | ν ring1, δC–H ring1 |
| 1465 | 1469/1464 | 1464 | 51.6 | ν rings2-3, δC–H rings2-3, δO–H |
| 1459 | 1460 | 1453 | 3.4 | ν ring1, δC–H ring1 |
| 1434 | 1431 | 1432 | 18.6 | ν rings2-3, δC–H rings2-3, δO–H |
| 1420/1415 | 1420/1415 | 1410 | 62.1 | δC–H rings2-3, νC–O(H), δO–H |
| 1393/1390 | 1395/1391 | 1397 | 24.3 | δC–H rings2-3, νC–O(H), δO–H |
| 1373/1364 | 1369/1365 | 1364 | 103.0 | ν rings2-3, δO–H |
| 1351/1350/1340/1331 | 1354/1352/1343/1340 | 1328 | 354.9 | δO–H, νC–C, νC–O, νC–O(H), ν rings2-3 |
| 1318 | 1320 | 1317 | 1.4 | ν ring1, δC–H ring1 |
| 1298/1294 | 1300/1295 | 1299 | 1.4 | ν ring1, δC–H ring1 |
| 1276/1271 | 1280/1271 | 1269 | 78.2 | δO–H, δC–H ring3 |
| 1255 | 1255 | 1244 | 464.8 | νC–C, νC–O, δC–H rings2-3 |
| 1236/1234 | 1242 | 1217 | 10.0 | νC–O(H), δ rings2-3, δC–H rings2-3 |
| 1223/1219 | 1223/1219 | 1205 | 16.5 | δ rings2-3, δC–H rings2-3 |
| 1205/1204/1199/1198 | 1212/1207/1199/1195 | 1186 | 549.5 | νC–O–C asym. |
| 1166/1165 | 1165 | 1159 | 129.6 | δC–H ring1 |
| 1159 | 1158 | 1155 | 16.6 | δC–H ring1 |
| 1156 | 1152 | 1152 | 19.6 | δC–H ring3 |
| 1151 | 1151 | 1150 | 34.6 | δC–H rings2-3 |
| 1139/1137 | 1140/1138 | 1127 | 165.6 | δC–H rings2-3, δO–H, νC–O |
| 1088 | 1089 | 1076 | 110.6 | δ rings2-3, δC–H rings2-3, νC–O(H) |
| 1078/1074 | 1079/1073 | 1072 | 10.3 | δC–H ring1 |
| 1027 | 1025 | 1023 | 0.8 | ν ring3 |
| 1025 | 1022 | 1020 | 15.0 | δC–H ring1 |
| 1008/1002 | 1009/1002 | 997 | 9.3 | δ ring1 |
| n.obs. | n.obs. | 980 | 0.0 | γC–H ring3 |
| n.obs. | n.obs. | 977 | 0.1 | γC–H ring1 |
| 963 | 967 | 963 | 0.6 | γC–H rings2-3 |
| 955 | n.obs. | 958 | 0.1 | γC–H ring1 |
| 953 | 954 | 954 | 0.7 | γC–H rings2-3 |
| 931/930 | 933 | 923 | 24.5 | γC–H ring1 |
| 903/902 | 906 | 899 | 24.0 | γC–H ring1 |
| 880 | 879 | 870 | 3.1 | δ ring3 |
| 871 | 875 | 865 | 4.0 | γC–H rings2-3 |
| 845/840 | 846 | 830 | 13.0 | γC–H ring1, δC–O–C |
| 826 | n.obs. | 821 | 0.5 | γC–H ring1 |
| 822 | 825 | 814 | 9.2 | γC–H rings2-3 |
| 800/797 | 801 | 790 | 36.9 | γC–H rings2-3 |
| 794/792 | 792 | 786 | 3.1 | δO–C=O, δ rings1-2-3 |
| 774 | 777 | 777 | 122.2 | τO–H |
| 754 | 755 | 757 | 12.2 | γC=O |
| 745/743/742/740 | 746 | 737 | 38.6 | γC–H ring1 |
| 734/731 | 735 | 726 | 4.7 | γC–H rings2-3, γC=O |
| 723 | 723 | 717 | 14.9 | δ rings2-3 |
| 687 | 691 | 684 | 25.2 | γC–H ring1 |
| 660 | 661 | 656 | 5.9 | γC–O(H) |
| 632 | 631 | 628 | 0.8 | δ rings1-2-3 |
| 616 | 617 | 616 | 0.7 | δ ring1 |
| 605 | 604 | 599 | 4.4 | δ rings2-3 |
| 576 | 578 | 577 | 8.1 | τ rings2-3 |
| 552 | 551 | 550 | 15.2 | Skeletal deformation |
| 527 | 528 | 525 | 1.1 | Skeletal deformation |
| 504/501 | 503 | 500 | 7.5 | τ ring1 |
| 488 | 488 | 483 | 8.1 | δ rings2-3 |
| 479 | 481 | 479 | 0.4 | τ rings2-3 |
| 422 | 422 | 423 | 6.1 | τ ring3 |
| n.obs. | n.obs. | 412 | 0.2 | τ ring1 |
| n.obs. | n.obs. | 408 | 4.7 | δC–O(ph) |
| n.i. | n.i. | 387 | 1.3 | Skeletal deformation |
| 345 | 12.4 | νH...O | ||
| 277 | 1.1 | Skeletal deformation | ||
| 268 | 2.2 | Skeletal deformation | ||
| 220 | 2.6 | rings2-3 sym. butterfly | ||
| 214 | 0.7 | τ ring1 | ||
| 157 | 1.5 | δC–C=O | ||
| 142 | 0.5 | rings2-3 asym. butterfly | ||
| 99 | 0.1 | γC–C(ester) | ||
| 74 | 0.2 | τC–C | ||
| 56 | 0.7 | γC–O(ph) | ||
| 28 | 0.5 | τC–O | ||
| 15 | 0.1 | τO–C | ||
a Frequencies in cm−1; calculated intensities in km mol−1; n.obs., not observed; n.i., not investigated. b The calculated frequencies were scaled by 0.978. c ν, stretching; δ, bending; γ, rocking; τ, torsion; sym., symmetric; asym., anti-symmetric; ph, phenyl ester group. Rings 1, 2, and 3 correspond to the phenyl ester, phenol, and benzo aromatic moieties, respectively.
Publisher’s Note: MDPI stays neutral with regard to jurisdictional claims in published maps and institutional affiliations. |
© 2021 by the authors. Licensee MDPI, Basel, Switzerland. This article is an open access article distributed under the terms and conditions of the Creative Commons Attribution (CC BY) license (http://creativecommons.org/licenses/by/4.0/).
Share and Cite
MDPI and ACS Style
Sıdır, İ.; Góbi, S.; Gülseven Sıdır, Y.; Fausto, R. Infrared Spectrum and UV-Induced Photochemistry of Matrix-Isolated Phenyl 1-Hydroxy-2-Naphthoate. Photochem 2021, 1, 10-25. https://0-doi-org.brum.beds.ac.uk/10.3390/photochem1010002
AMA Style
Sıdır İ, Góbi S, Gülseven Sıdır Y, Fausto R. Infrared Spectrum and UV-Induced Photochemistry of Matrix-Isolated Phenyl 1-Hydroxy-2-Naphthoate. Photochem. 2021; 1(1):10-25. https://0-doi-org.brum.beds.ac.uk/10.3390/photochem1010002
Chicago/Turabian StyleSıdır, İsa, Sándor Góbi, Yadigar Gülseven Sıdır, and Rui Fausto. 2021. "Infrared Spectrum and UV-Induced Photochemistry of Matrix-Isolated Phenyl 1-Hydroxy-2-Naphthoate" Photochem 1, no. 1: 10-25. https://0-doi-org.brum.beds.ac.uk/10.3390/photochem1010002