Joint Estimation of Symbol Rate and Chromatic Dispersion Using Delayed Multiplier for Optical Performance Monitoring

1
College of Intelligence Science and Technology, National University of Defense Technology, Changsha 410073, China
2
College of Electric and Information Engineering, Hunan University of Technology, Zhuzhou 412007, China
*
Author to whom correspondence should be addressed.
Photonics 2021, 8(2), 58; https://0-doi-org.brum.beds.ac.uk/10.3390/photonics8020058
Submission received: 11 January 2021
/
Revised: 14 February 2021
/
Accepted: 17 February 2021
/
Published: 20 February 2021
(This article belongs to the Section Optical Communication and Network)
Abstract
:Symbol rate and chromatic dispersion (CD) are very important for optical performance monitoring. The CD, however, hinders the symbol rate detection. In this paper, we proposed a joint estimation of symbol rate and chromatic dispersion. We show that, when the signal conjugates and multiplies with the delayed replica, the spectral line can be restored. The proposed method provides a fast and simple solution for joint estimation as traditional tentative CD scanning is time consuming. The simulation shows that the root-mean-squared error (RMSE) for CD was 39.5 ps/nm and the symbol rate was 2.4 MHz. For the squared-root-raised-cosine (SRRC) pulse shape with a roll-off factor of 0.1, the experimental results show that 25,000 input samples were needed for an error-free estimation. The RMSE is 105.6 ps/nm and 63.5 kHz for CD and symbol rate, respectively.
1. Introduction
Over the past decade, the volume of optical communication has been increasingly growing and the optical performance monitor (OPM) has become a popular field of study [1]. The OPM system measures the quality of the light path and intelligently routes the signal with reconfigurable optical add-drop multiplexers (ROADM) and optical cross-connects [1,2]. As a result, the overall spectral efficiency and reliability are enhanced. The symbol rate and chromatic dispersion (CD) estimation are vital for OPM techniques as they enable several practical features, such as data-rate adaption, automatic routing, and power-saving [3,4]. This paper proposed a joint estimation that proves to be feasible for the OPM system.
At the early stage of fiber communication, the wavelength of 1.3 μm is adopted with the breakthroughs in InGaAsP semiconductor lasers. The CD coefficient is nearly zero but with a loss of 0.5 dB/km. As the total capacity is limited by the fiber loss, operation near 1.5 μm becomes mainstream for the lower attenuation (typically 0.2 dB/km) but at higher CD. To solve the problem, dispersion management fiber, including dispersion compensation fiber (DCF) and nonzero-dispersion-shifted fiber (NZDSF) is used [5]. In the era of 100-Gb/s, the CD is no more a limiting factor as the digital coherent receiver can compensate a large amount of accumulated CD with digital signal processing techniques [6]. In the future, the pure-silica-core fiber with lower loss (typically 0.15 dB/km) and nonlinear coefficient (typically 0.8 km−1W−1) may be used to support the high-spectral efficient modulation formats which are sensitive to nonlinear interference and optical signal-to-noise ratio (OSNR) [7]. The high OSNR requirement leads to an increase in input power, which consequently increases fiber nonlinear interference [8].
For the OPM application, the accumulated CD, modulation, and symbol rate are assumed to be unknown at the monitoring port. As a result, the OPM cannot rely on CD tolerant modulation techniques such as single-sideband (SSB) modulation [9] and discrete multitone [10]. The fiber topology can be either a traditional CD managed link or dispersion unmanaged link. We use the hardware of the digital coherent receiver since it can operate at different levels of CD.
The main category of CD estimation methods that do not require prior knowledge of the symbol rate is known as the best-match search [11,12,13,14]. Metrics, including squarer clock tone [11], peak-to-average-power ratio (PAPR) [12], and fractional Fourier transform [14] are calculated to test the CD compensation. The CD compensation can be realized with a digital filter or with a tunable dispersion compensation module (TDCM). This method, however, contains 2D scanning of CD compensation and symbol rate frequency. Furthermore, the scanning step scales proportionally to the square of the symbol rate [15,16]. If the symbol rate is unknown, a low scanning step is required to avoid estimation failure.
The autocorrelation of the signal power waveform (ACSPW) method is a well-known scanning-free CD estimation method [17]. However, it requires the symbol rate to formulate the CD compensation filter. Later research [18] extends to the correlation between narrow band around ±1/2 symbol rate to estimate the CD. Yao proposed a spectrum superposition method [19], which improves the performance of ACSPW; however, these methods require knowledge of the symbol rate.
Ionescu and Isautier proposed adopting the cyclostationarity-based method for the joint estimation of symbol-rate, frequency offset, CD, and optical signal-to-noise ratio (OSNR) [20,21]. Their study showed the all-around potential of the cyclostationarity-based method. The main challenge is the input length and computational complexity. In the presence of CD of 50,000 ps/nm, their method requires more than 219 samples for a reliable estimation. Besides, a scanning size of 0.3 × 10⁶ is required for an unambiguous estimation. The total computation is very high for their proposed method.
Recently, CD estimation using the machine learning method [22,23] was proposed to avoid FFT operation. Additionally, these methods are more appropriate for the situation where the accumulated CD is limited (up to 2000 ps/nm [23]). Additionally, these methods require a large amount of training to cover all parameters. Despite all the drawbacks, this field is very promising for future study.
In this study, we propose a non-data-aided joint estimation method for the symbol rate and CD. Compared to the CD best-match search, the computation complexity is reduced as CD compensation is removed from the estimation procedure.
The main contribution of this work is to show that the cyclostationary property can be restored by delay-and-multiplying. The symbol rate and CD can then be simultaneously estimated. The computation size of the cyclostationarity-based method will be significantly reduced. This property further explains the long input length requirement of Ionescu and Isautier’s method. Moreover, our proposed method gives a unique result for symbol rate estimation, thus reduces the required effort for testing candidate frequencies. This feature is especially useful for applications that employ various data rates.
This method is capable of simultaneously estimating the CD value and symbol rate using 4096 input samples for NRZ signals and 65,536 input samples for squared-root-raised-cosine (SRRC) pulse shaping with a roll-off factor of 0.1. The simulation shows that at the accumulated CD from 2567 to 51,350 ps/nm, the root-mean-squared error (RMSE) was 39.5 ps/nm, and the absolute maximum error was 154.0 ps/nm for linear modulation, including binary phase-shift keying (BPSK), quadrate phase-shift keying (QPSK), and 16-quadrate amplitude modulation (QAM). The RMSE for the symbol rate was 2.4 MHz. For SRRC signals with a roll-off factor of 0.1, 65,536 input samples were needed for a success rate above 91.6% and RMSE of 287.3 ps/nm. The experimental result shows that 25,000 input samples were needed for a success rate of 100% and an RMSE of 105.6 ps/nm and 64.5 kHz for CD and symbol rate, respectively. We use international system of units (SI units) and all symbols are in SI units.
2. Operation Principles
2.1. Problem Formulation
In this paper, we consider using a coherent receiver as the optical front end for the joint estimation. The transmitted baseband signal x(t) can be expressed as
where p(t) denotes the pulse shape function, T is the symbol period (Hz) and sn denotes the independent and identically distributed M-PSK/QAM information symbols.
The received signal y(t) with a coherent receiver can be expressed as y(t) = h(t)⊛x(t), where h(t) is the impulse response from the CD and ⊛ denotes convolution. H(f) is the Fourier transform of h(t) and is given by [24]
where Ψ = 2π2β2z, β2 is the group velocity dispersion (GVD) coefficient (s/m2), and z is the transmission length (m). The major task is to estimate the symbol rate 1/T and the CD, namely 2πcβ2z/λ2. In the deviation, we used the notion of a single polarization system for simplicity. In the simulation and experiments, we showed that the proposed method is applicable for the polarization-division-multiplexed (PDM) system.
2.2. Spectral Line Generation with Delayed Input
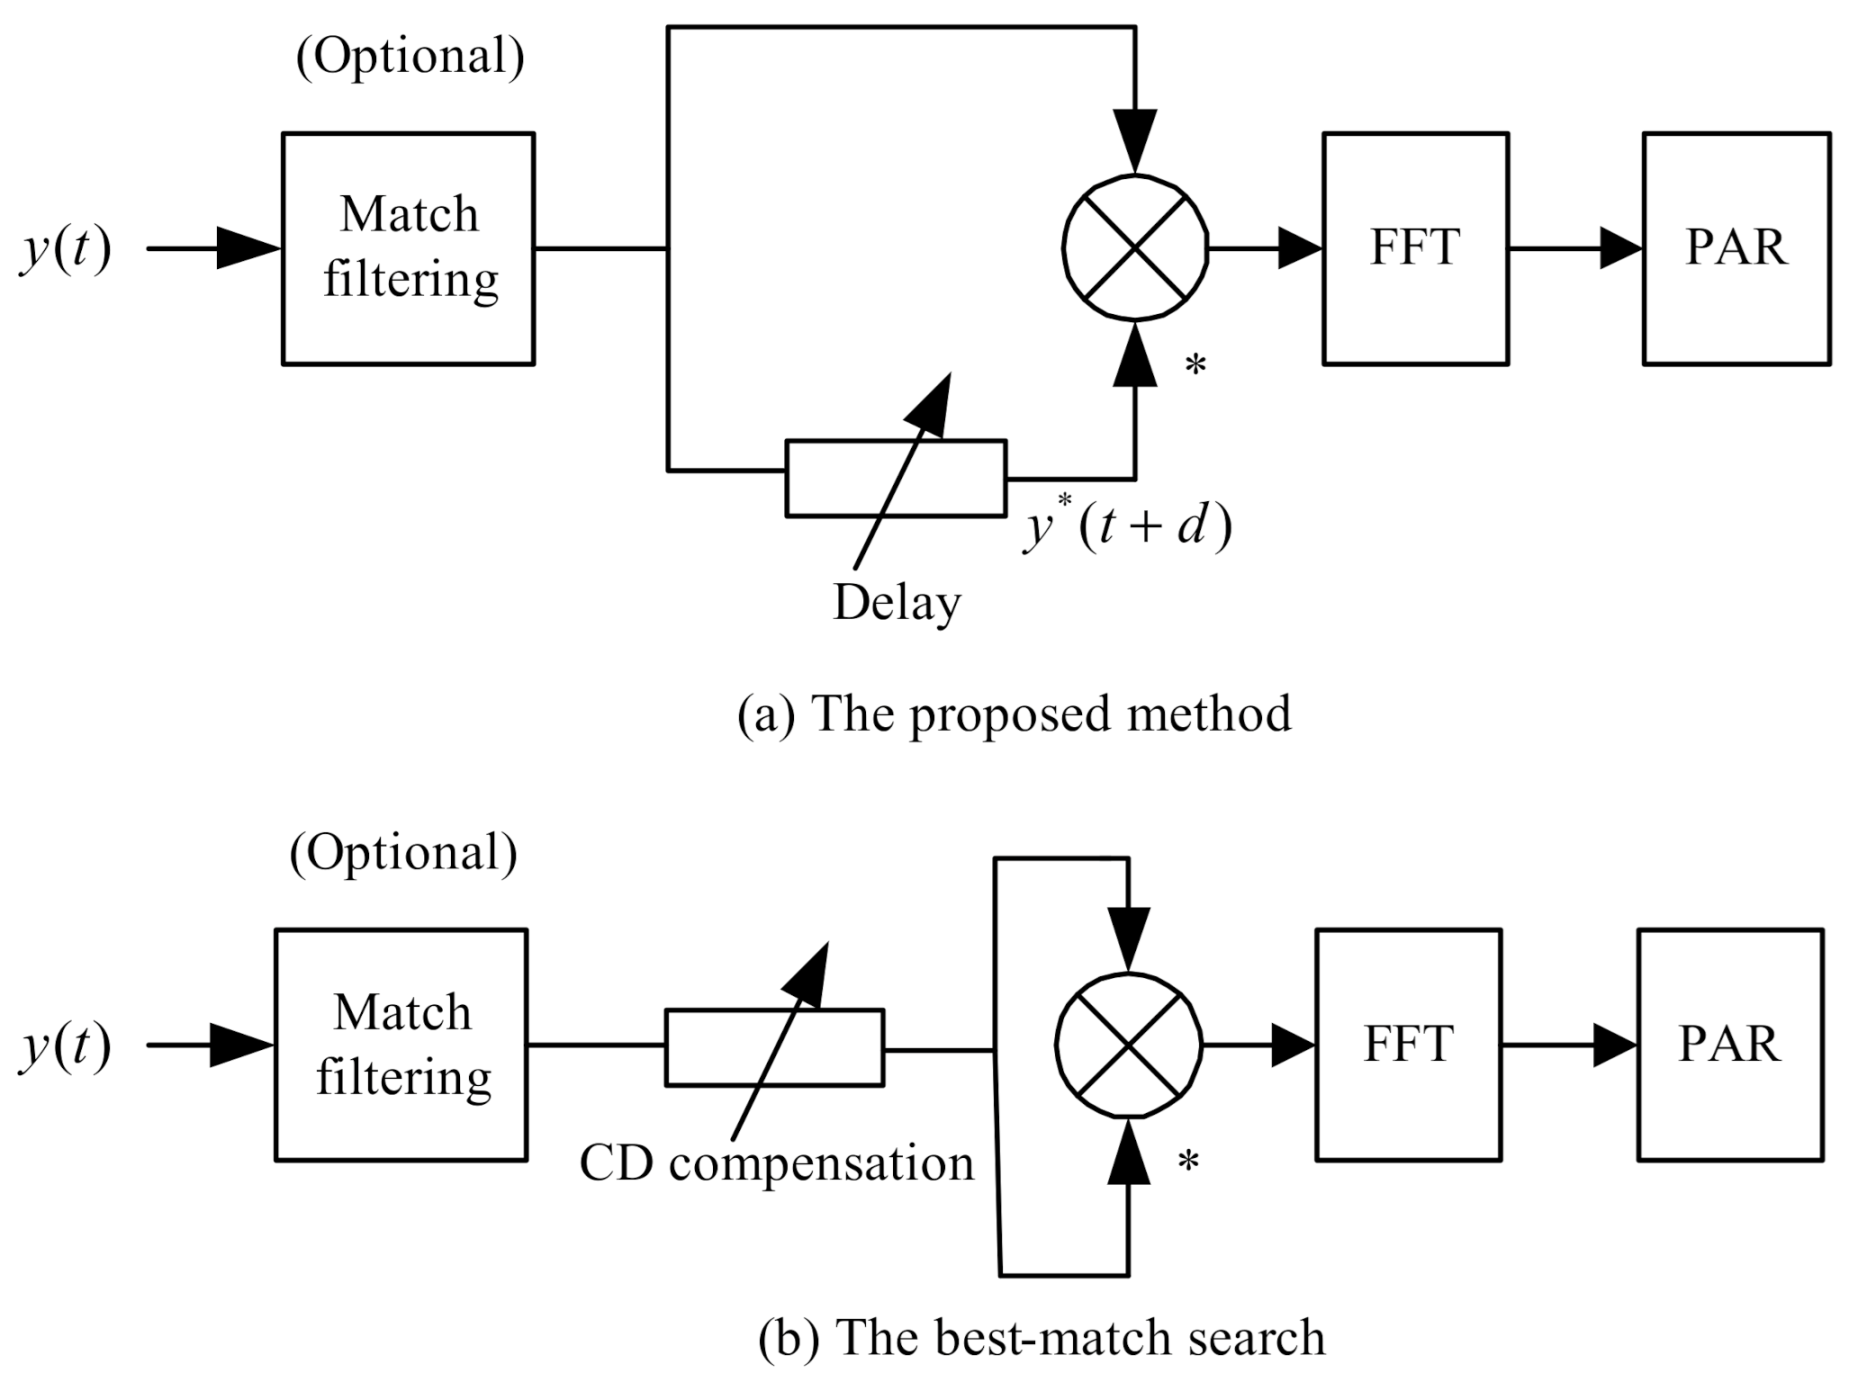
For a linearly modulated signal, including M-PSK/M-QAM and constellations with probabilistic shaping, the symbol-rate clock tone can be recovered by a squarer [25]. However, this method fails in the presence of CD [26] due to the frequency-dependent group delay caused by CD. If we delay the just value of that group delay, the spectral line can be restored after the squarer. The architecture of the proposed method is depicted in Figure 1a. The structure is very similar to the best-match method [11] except for CD compensation (see Figure 1b).
The strength of the sine wave generated by the delay and multiplier y(t)y*(t + d) is given by
where α is the symbol rate frequency, α = ±1/T, and T is the symbol period (s) [25]. || denotes the modulus of a complex number.
To derivate the strength of the sine-wave generated with y(t)y*(t + d), we used the Parseval-Plancherel identity [27]. By treating the integration in Equation (3) as the inner product of y(t) and y(t + d)exp(j2παt), Equation (3) can be rewritten as
We can further rewrite Equation (4) with the aid of Equation (2),
The term is canceled since it has a constant modulus of 1. Using the principle of the stationary phase [28], Z ≠ 0 only if
The most prominent spectral line can be generated at the frequency of α = ±1/T, where T is the symbol period [25]. Hence, the corresponding frequency can be uniquely estimated at the specific delay that maximizes the spectral-line generation in the discrete time y[n]y*[n + d] (y[n] denotes the discrete-time sample of y(t)). We can obtain by scanning the delay d and calculating the peak-to-average ratio (PAR) of FFT{y[n]y*[n + d]} to detect whether a spectral line is markedly generated. The optimal delay can be expressed as,
where PAR is computed as,
and N is the size of the input sample.
Then, the symbol rate and CD value can be simultaneously estimated according to
where c is the speed of light in vacuum (m/s), β2 is the GVD coefficient, z is the transmitted length, λ is the wavelength (m), Test is the estimated symbol duration (s), Fs is the sample rate (GSa/s), and FFT denotes the fast Fourier transform.
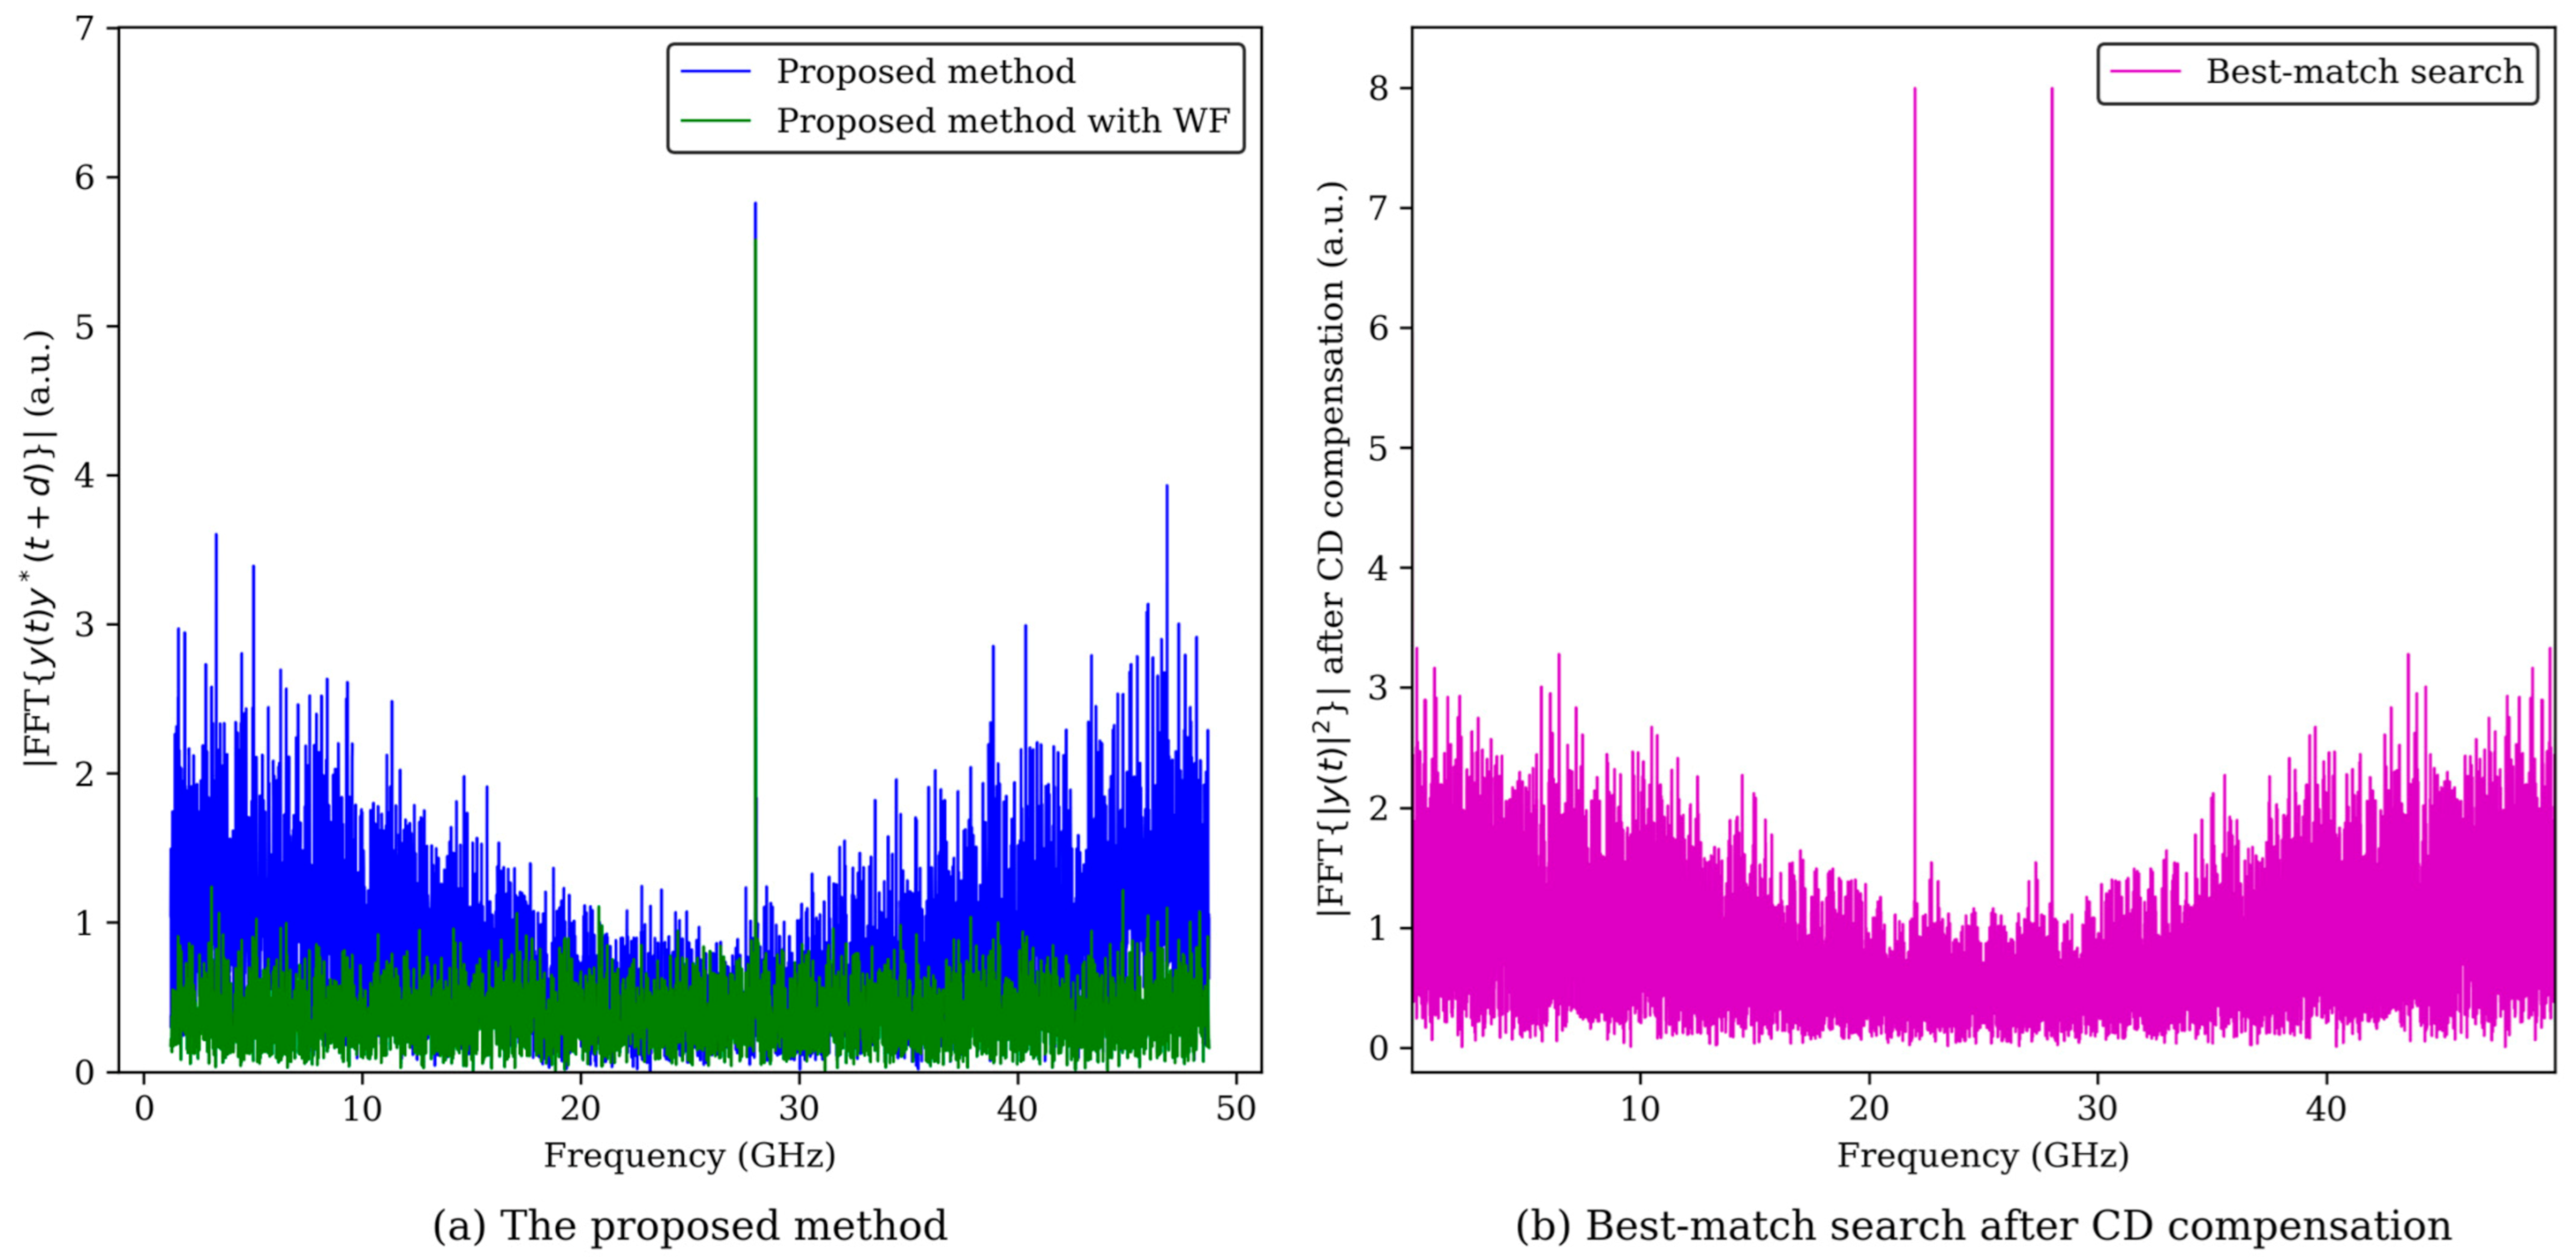
An example plot is shown in Figure 2. When the delay d is matched, the FFT of y[n]y*[n + d] contains the restored clock tone. For the best-match search, extra trials will be spent on testing the candidate frequency. While our proposed method provides a unique result for symbol rate estimation.
2.3. Enhancing Results with the Whitening Filter
In the spectrum of y(t)y*(t + d), the self-generated noise interferes with the clock tone detection. To reduce the effect of the self-generated noise, a whitening filter is required. Interestingly, the ACSPW method likewise requires a high-pass filter for SRRC signals with a low roll-off factor [17].
In the theory of cyclostationarity, this technique is referred to as “spectral coherence” [29]. Spectral coherence enhances the performance of an SRRC signal. To effectively estimate the whitening filter, we adopted the modified Yule–Walker method [30].
The whitening filter can be estimated by solving the regular equation with the Levinson recursion:
where r(k) is the autocorrelation of the signal y[n],
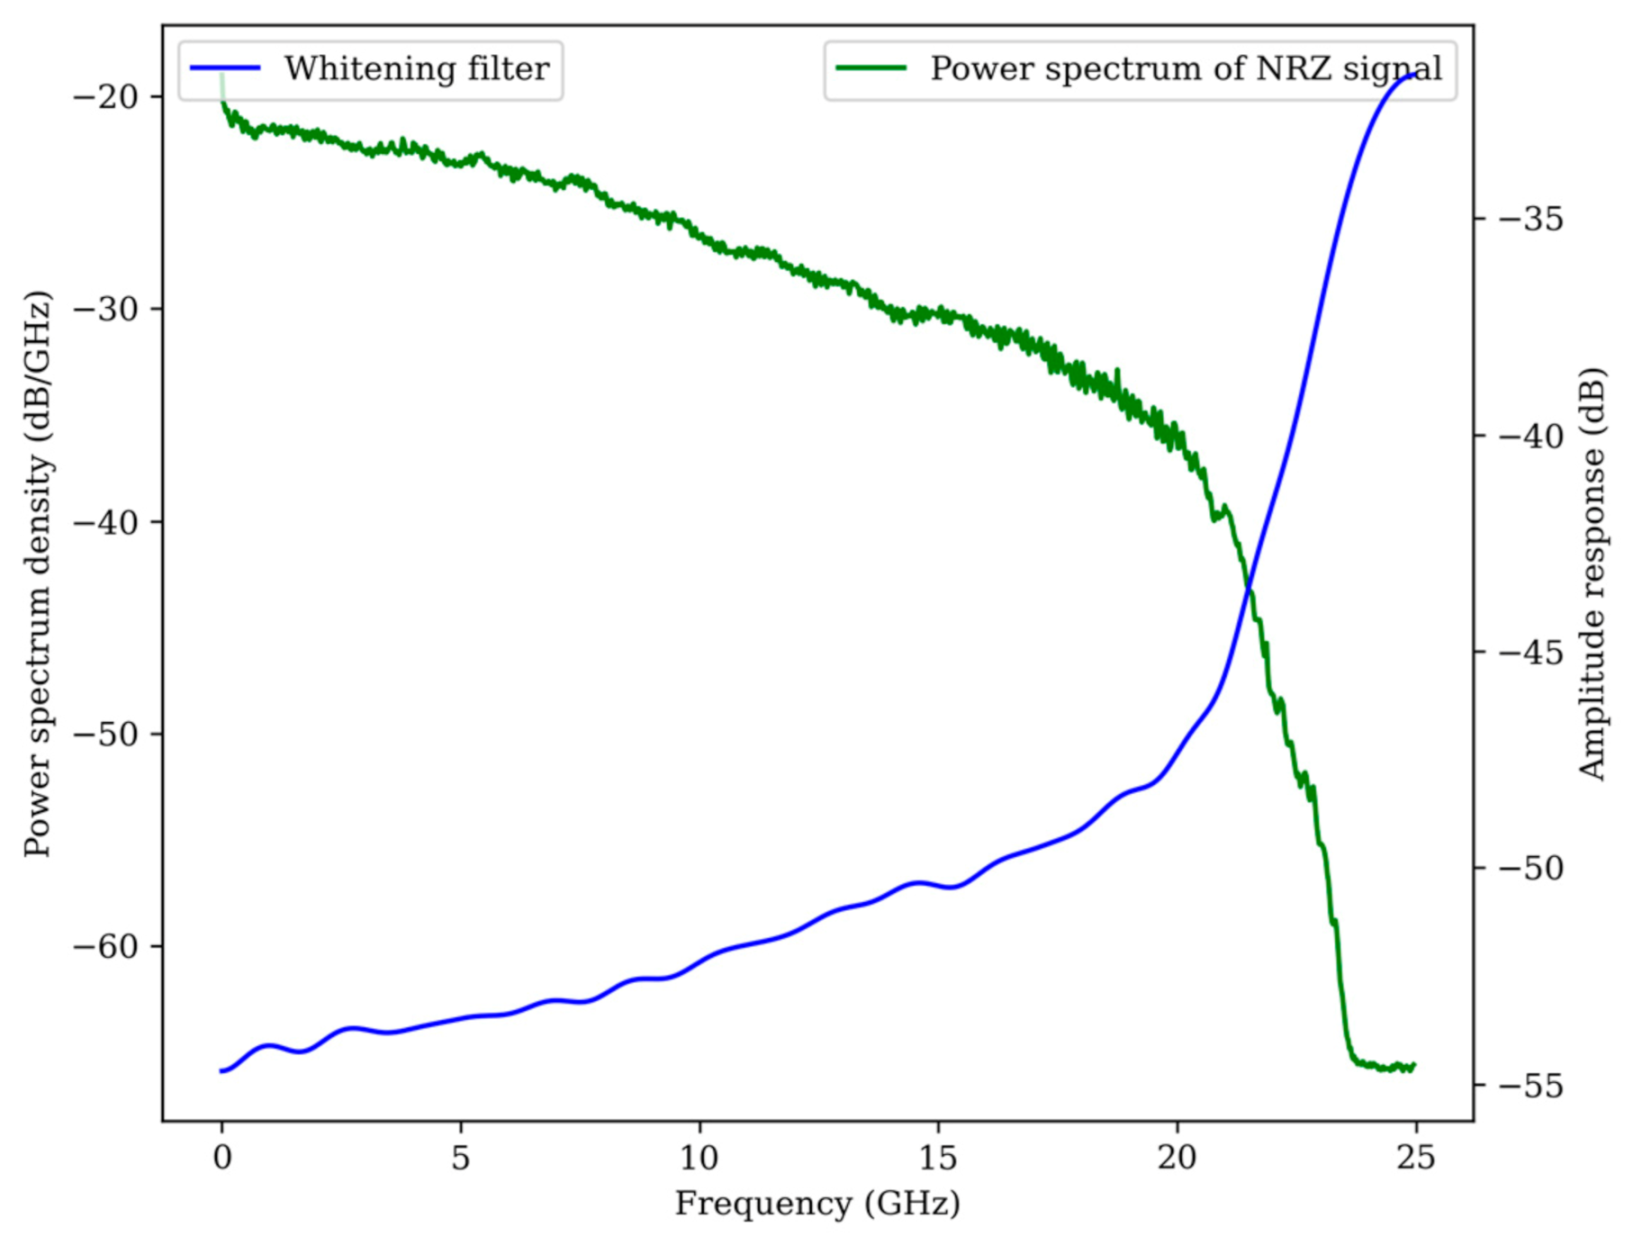
and L is the order of the filter. An example of a whitening filter of an NRZ signal is depicted in Figure 3. The whitening filter works as a reverse filter of the pulse shape. As an engineering rule, the length L must be larger than 31 for a roll-off factor near zero.
2.4. Robustness to Other Transmission Impairments
In this section, we analyze the impact of the polarization effect, frequency offset, and random interference including amplified spontaneous emission (ASE) noise, and nonlinear interference.
In a PDM system, the polarization effect must be considered. At the receiver, two polarizations are randomly combined by the polarization mode dispersion (PMD). There is a null-point where the PMD reduces the spectral line to zero when differential group delay (DGD) is T/2 [26]. However, the special case does not affect the estimation because of the random polarization state. In the simulation part, we address the impact of PMD by setting the mean DGD to T/2. However, no obvious performance degradation is observed.
Theoretically, the frequency offset does not affect the clock tone strength in Equation (5). However, considering that the signal is band-limited by the optical filter, the frequency offset must not exceed ±5 GHz, which is adequate for most applications.
Finally, one of the key merits of the cyclostationarity-based method is the tolerance to additive Gaussian noise [31]. The ASE noise and nonlinear interference can be modeled as Gaussian noise [32]. Additionally, this method can operate at relatively high Gaussian interference. The simulation shows that, for the PDM-QPSK system, the proposed method is able to operate above OSNR of 5 dB with an input length of 4096. Since the required OSNR for bit error rate (BER) of 3.8 × 10⁻³ is 12 dB, the joint estimation has a large margin for nonlinear interference. In the simulation part, the performance does not degrade for the launch power ranging from −9 dBm to 6 dBm.
3. Simulation Results
3.1. Simulation Setups and Analysis Method
We use a VPI transmission Maker simulation environment to verify the feasibility of our proposed method. We used the 28 GBaud NRZ and Nyquist systems for PDM-BPSK, PDM-QPSK, and PDM-16QAM. At the transmitter, the information symbols are generated from the pseudorandom binary sequence with a period of 218−1. The signal is modulated with a continuous-wave laser with a linewidth of 1 MHz.
The circular loop includes an 80 km standard single-mode fiber (SMF) (dispersion parameter is 16.75 ps/nm/km at 1550 nm and the nonlinear coefficient is 1.6 km−1W−1, respectively) and an ideal amplifier to compensate for the fiber loss. After the transmission, the ASE noise is added after the signal runs out of the loop, and then the signal is detected using a coherent receiver with the same 1 MHz linewidth laser at 1550 nm. The frequency offset is chosen randomly between ±5 GHz. Finally, the signal is resampled using spline interpolation with seven different sampling phases.
The PMD is added using the vectorial PMD model and the mean DGD is set to the worst half symbol period scenario. At the same time, the launch power is set to 2 dB higher than the optimal launch power to include the nonlinear interferences.
We use the RMSE to determine the performance. The RMSE is computed as follows:
The resolution of the frequency estimation is Fs/2NFFT, and the resolution for CD is cT/(λ2Fs). As an example, if the symbol rate of 28 GBaud, the sampling rate of 50 GSa/s, and a sample size of 4096 are assumed, the resolution for the symbol rate estimation is 12.2 MHz, and the resolution of CD is 89.7 ps/nm.
We also use the success rate to indicate the robustness of the proposed method. The absolute error tolerance is 870 ps/nm for NRZ signals and 1500 ps/nm for SRRC signals. The success rate is defined as follows:
where NSuc is the number of successful estimation and NTotal is the total number of simulations.
3.2. Simulation Results
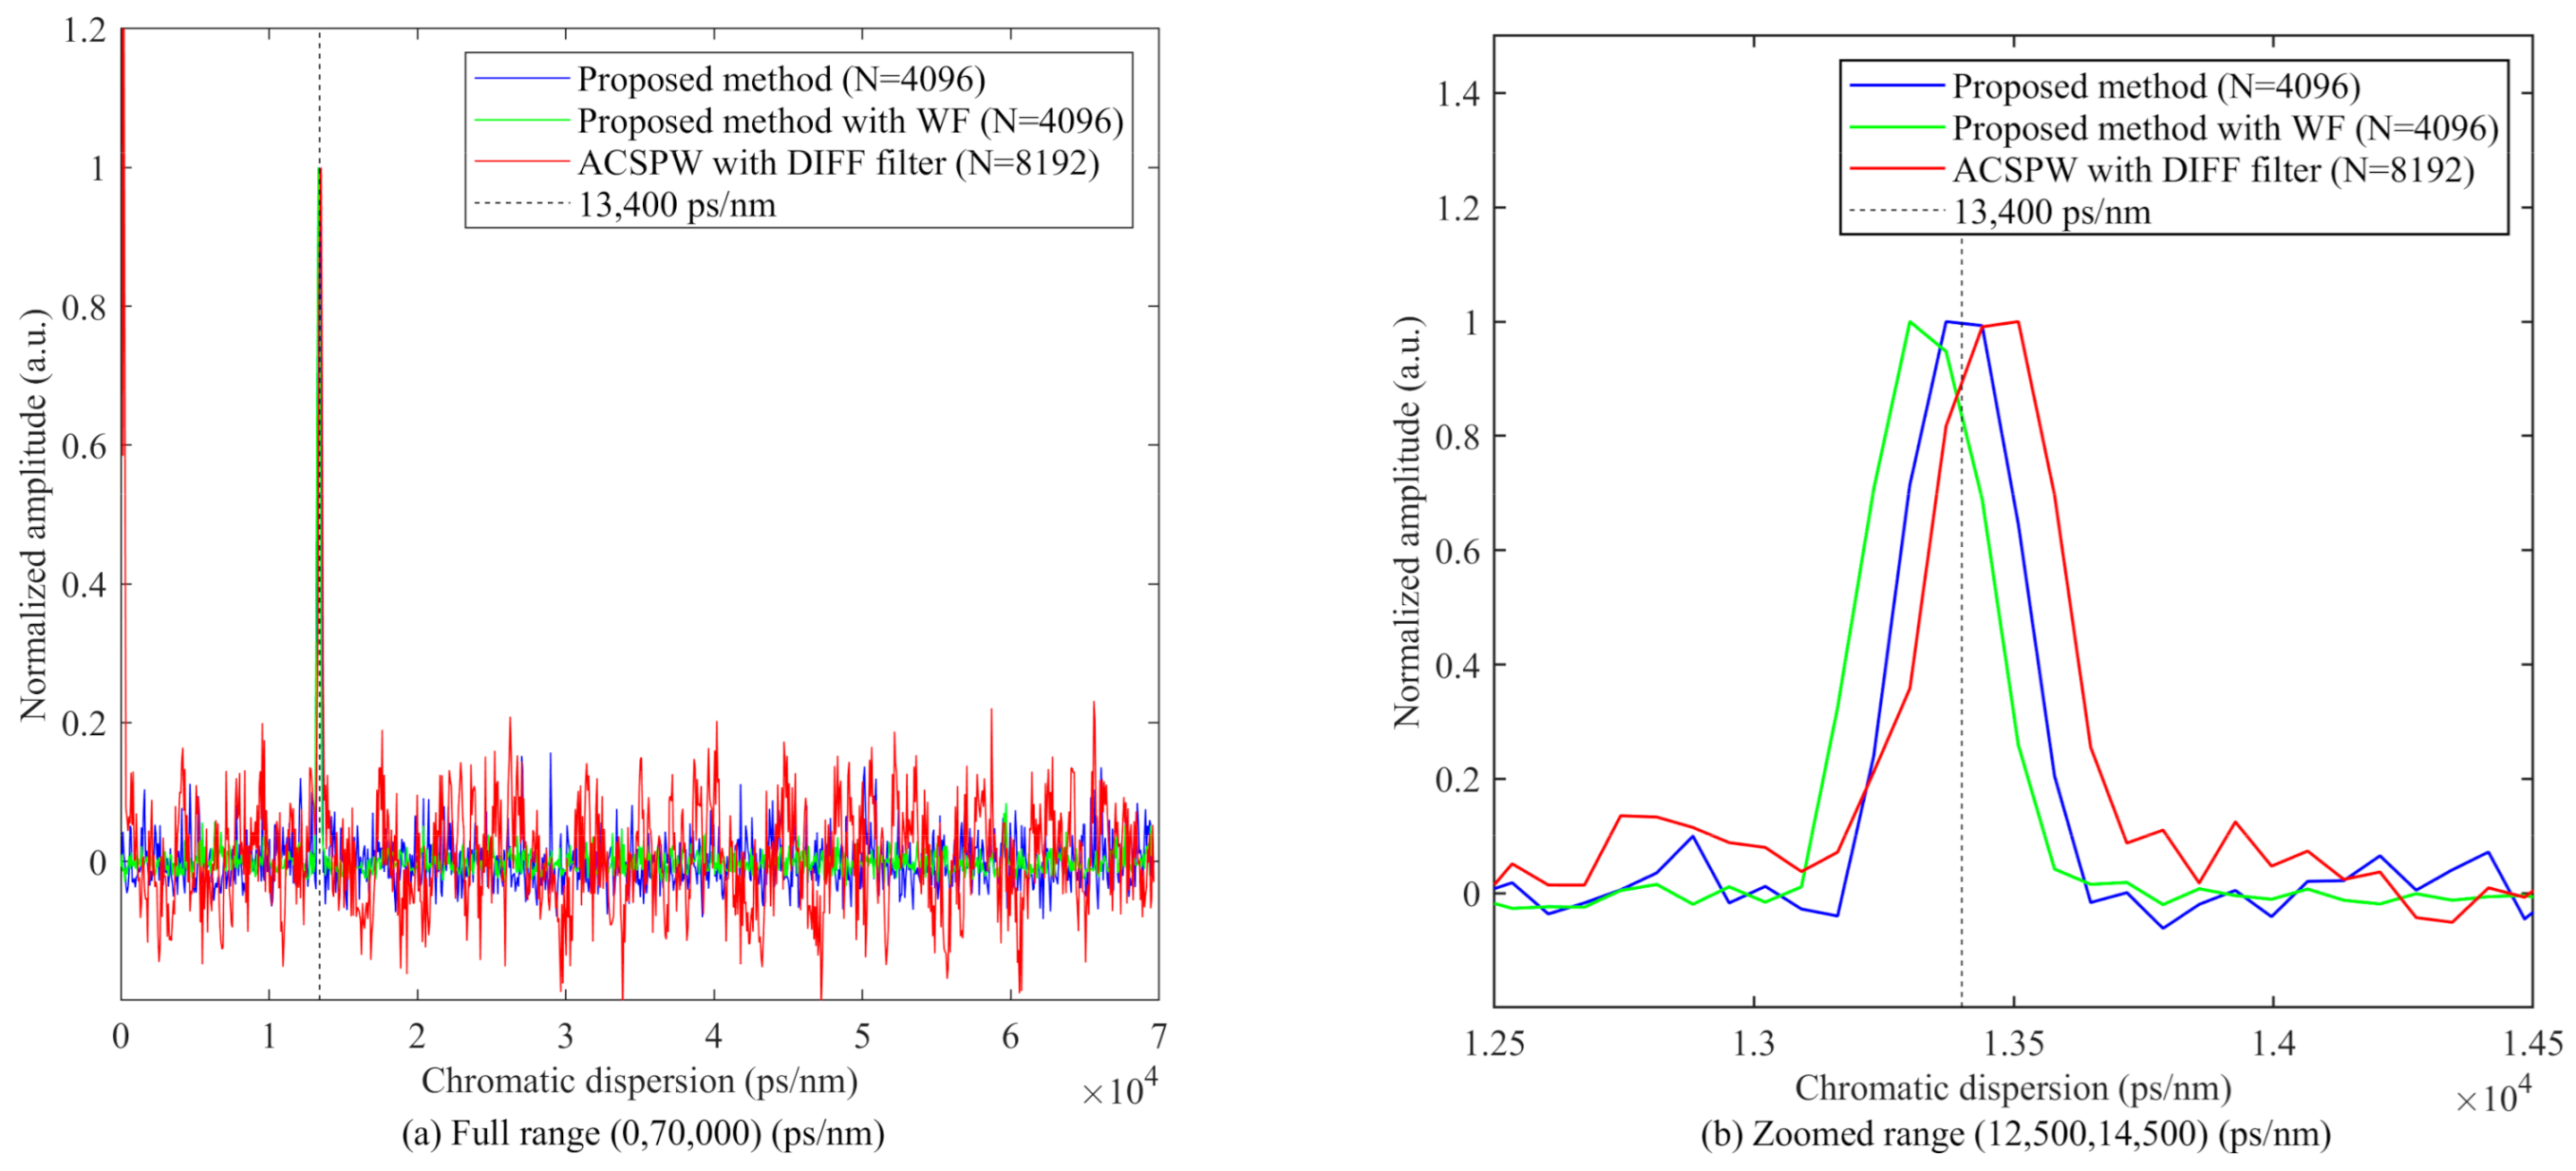
The first simulation was carried out using the PDM-QPSK with 800 km transmission. The CD present in the fiber link is 13,400 ps/nm. As depicted in Figure 4, our proposed method achieves a similar result as ACSPW with half the input length. As predicted by theoretical derivation, the spectral line appears on the same delay as ACSPW. In addition, the variance of our proposed method is lower with half the input length. Moreover, the location of the spectral line reveals the symbol rate, while ACSPW requires the symbol rate information for CD compensation.
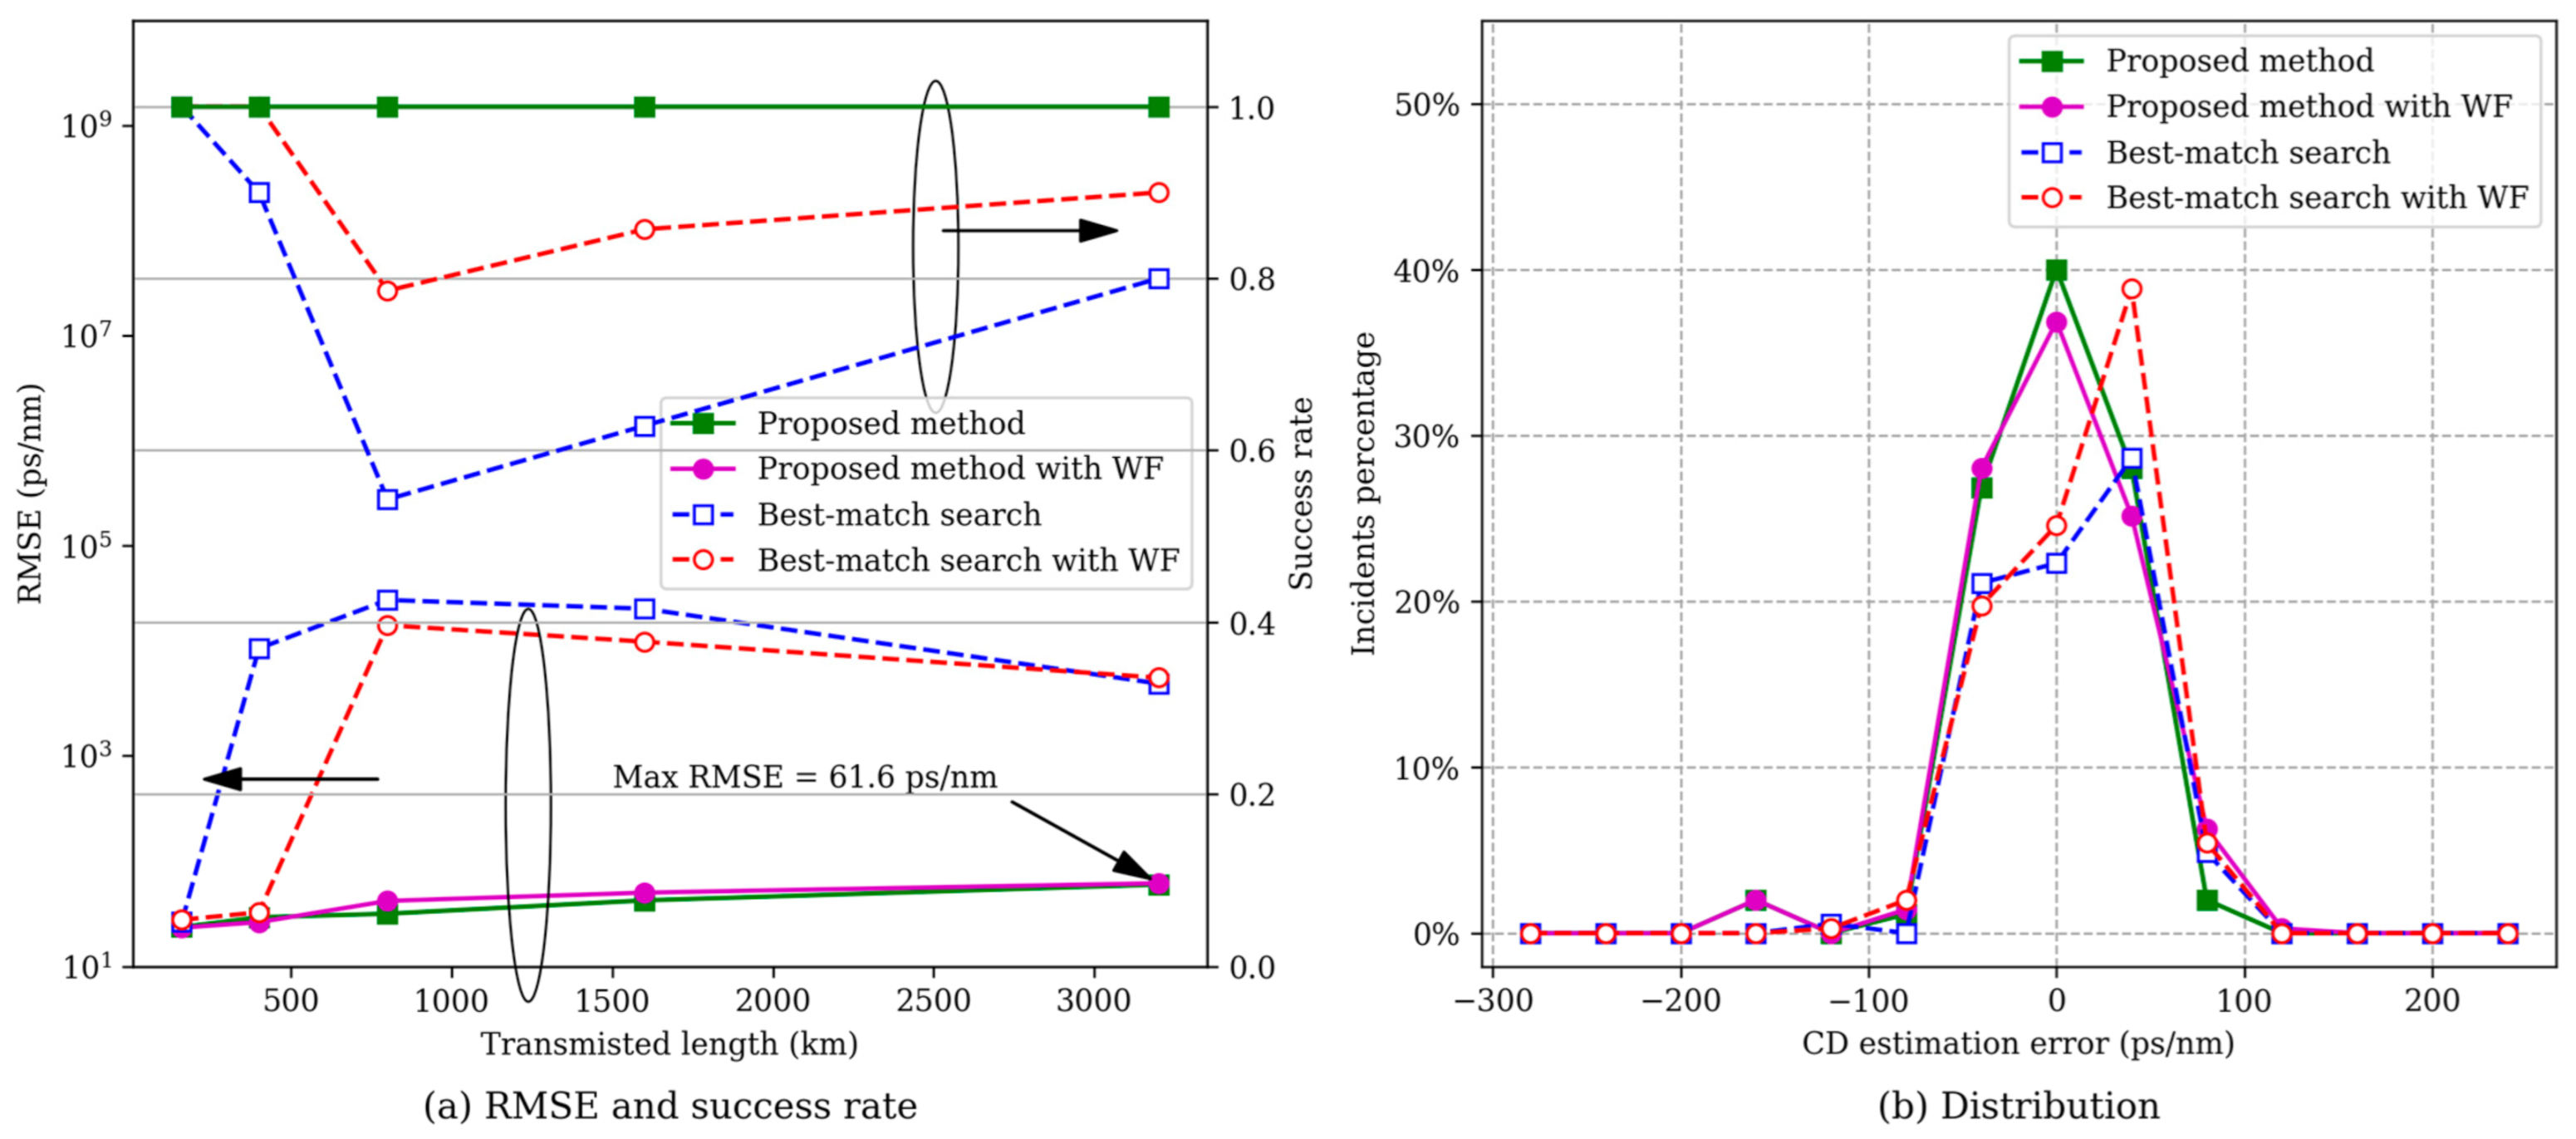
Subsequently, we investigated the performance using the RMSE and success rate. We used a 10-channel DWDM coherent system with PDM-QPSK for five transmission lengths ranging from 160 to 3200 km. We tested all the starting phases for ten independent runs, resulting in 3500 cases for the RMSE and success rate estimation. For a fair comparison, we set the scanning resolution of the best-match search to 70 ps/nm with the same input length of 4096. At the oversampling ratio of 16/7 and 12 dB OSNR, our proposed method achieved a better success rate than the best-match search, as shown in Figure 5a. For our proposed method, the RMSE is 39.5 ps/nm and 43.1 ps/nm with the whitening filter, while the best-match search is 35.7 ps/nm for the successful samples. The detected maximum absolute error is 140.6 ps/nm for our proposed method, and no extreme case is found in all 3500 trials.
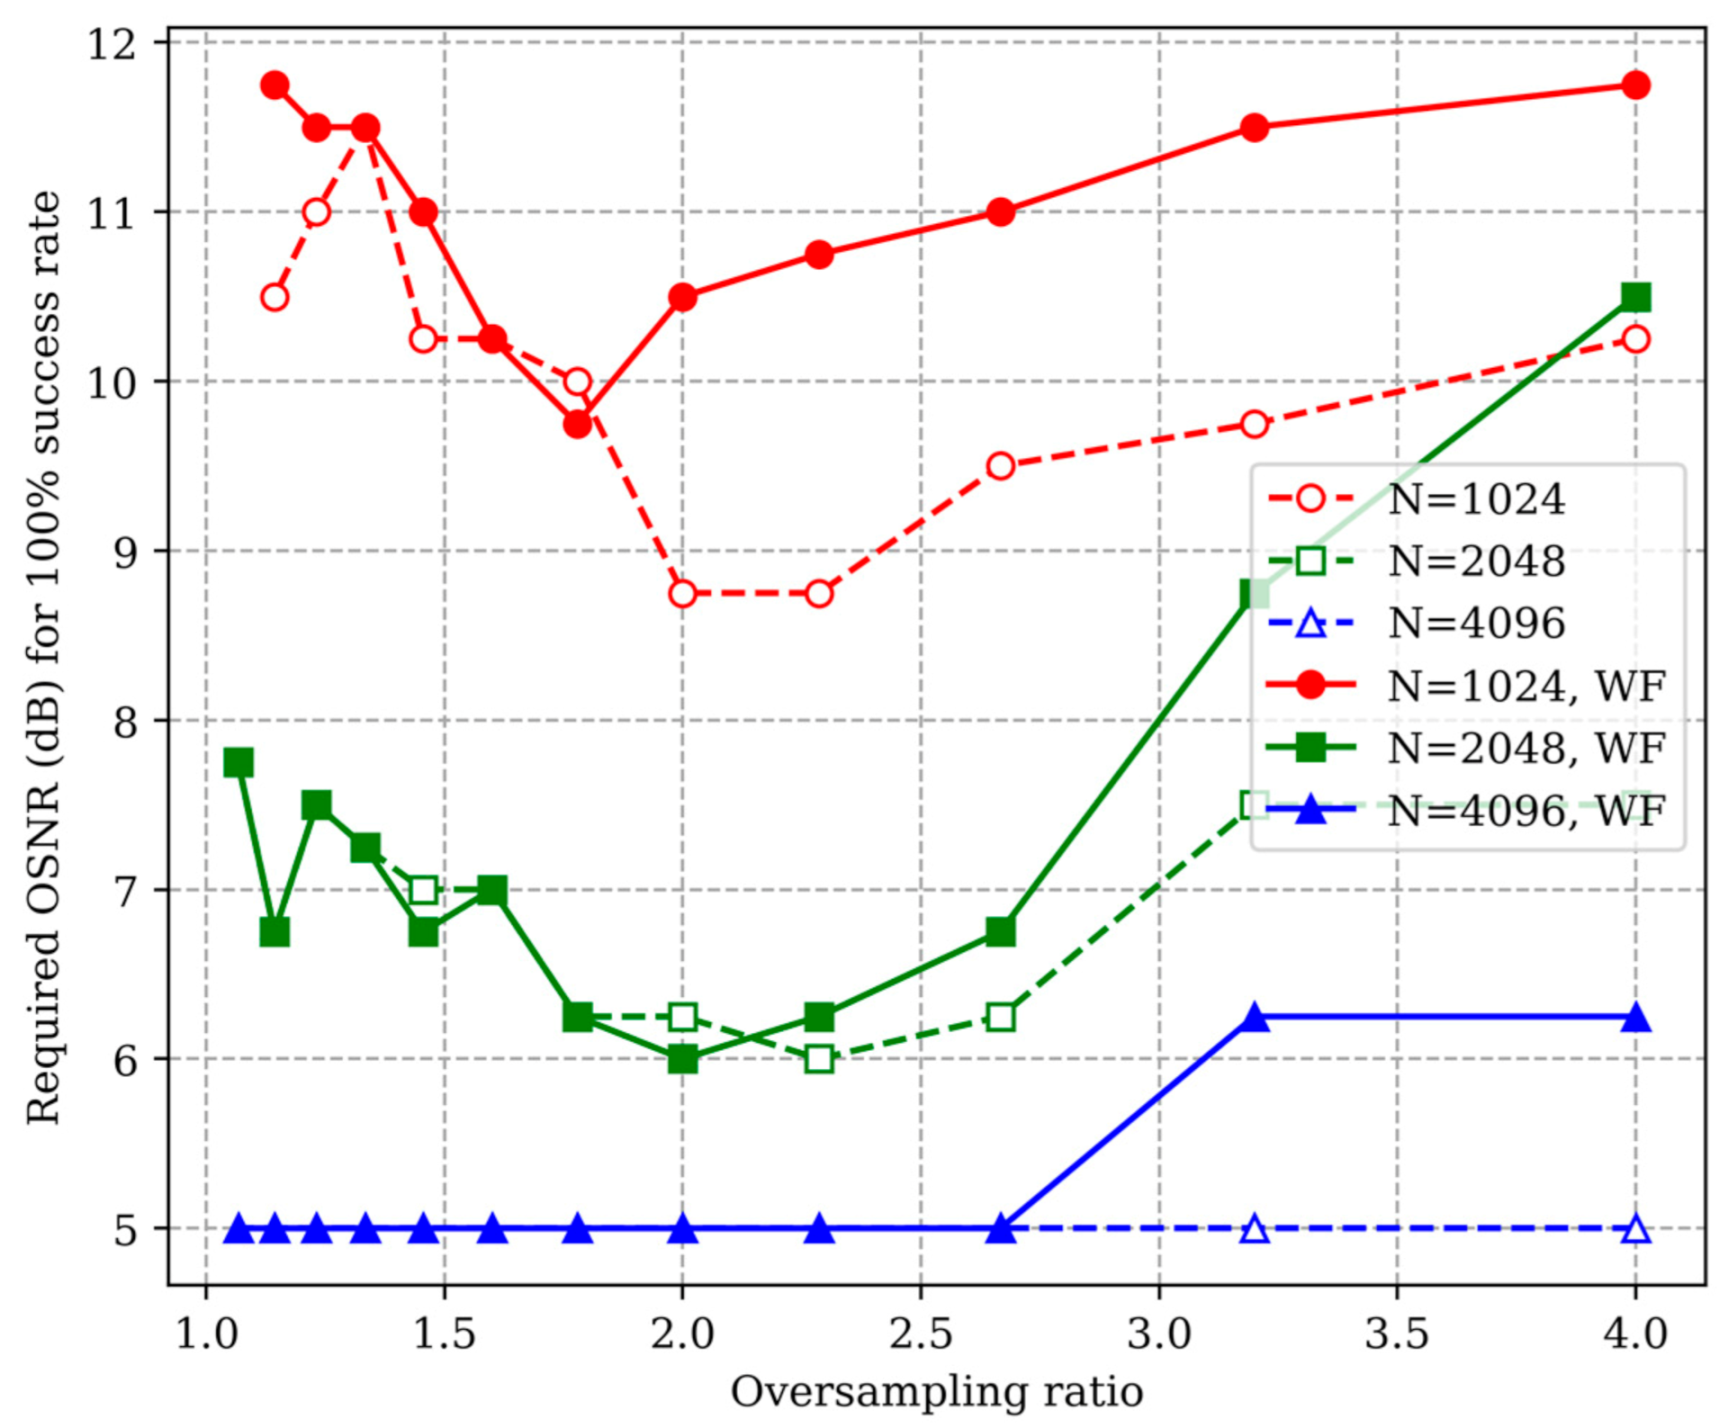
To fully explore the limit of our proposed method, we depicted the required OSNR and the oversampling ratio in Figure 6. The transmission length is fixed at 1200 km, and the OSNR is set from 5 to 12 dB. The required OSNR is calculated for a 100% success rate for oversampling ratios ranging from 16/15 to 4. With an input length of 4096, the OSNR tolerance is below 6.25 dB. For a reliable estimation in the low OSNR (such as optical coupler based OPM), we recommend an input length larger than 4096 for NRZ signals.
Surprisingly, the required OSNR for the whitening filtering method is reduced by 2 dB. The results are attributed to the fact that the filter parameter is estimated from the observed data. When the sampling rate is relatively high, the Yule–Walker method cannot distinguish the signal spectrum from the ASE noise. From the observation in Figure 5a, the estimated filter will result in a larger variance. Therefore, a whitening filter is desirable for a low roll-off signal.
It should be noted that the required OSNR is generally lower than the required OSNR to achieve a bit error rate (BER) of ~10−3. For the application in a rate-adaptive transceiver, the required OSNR must be sufficient to support multi-level modulation, such as QAM.
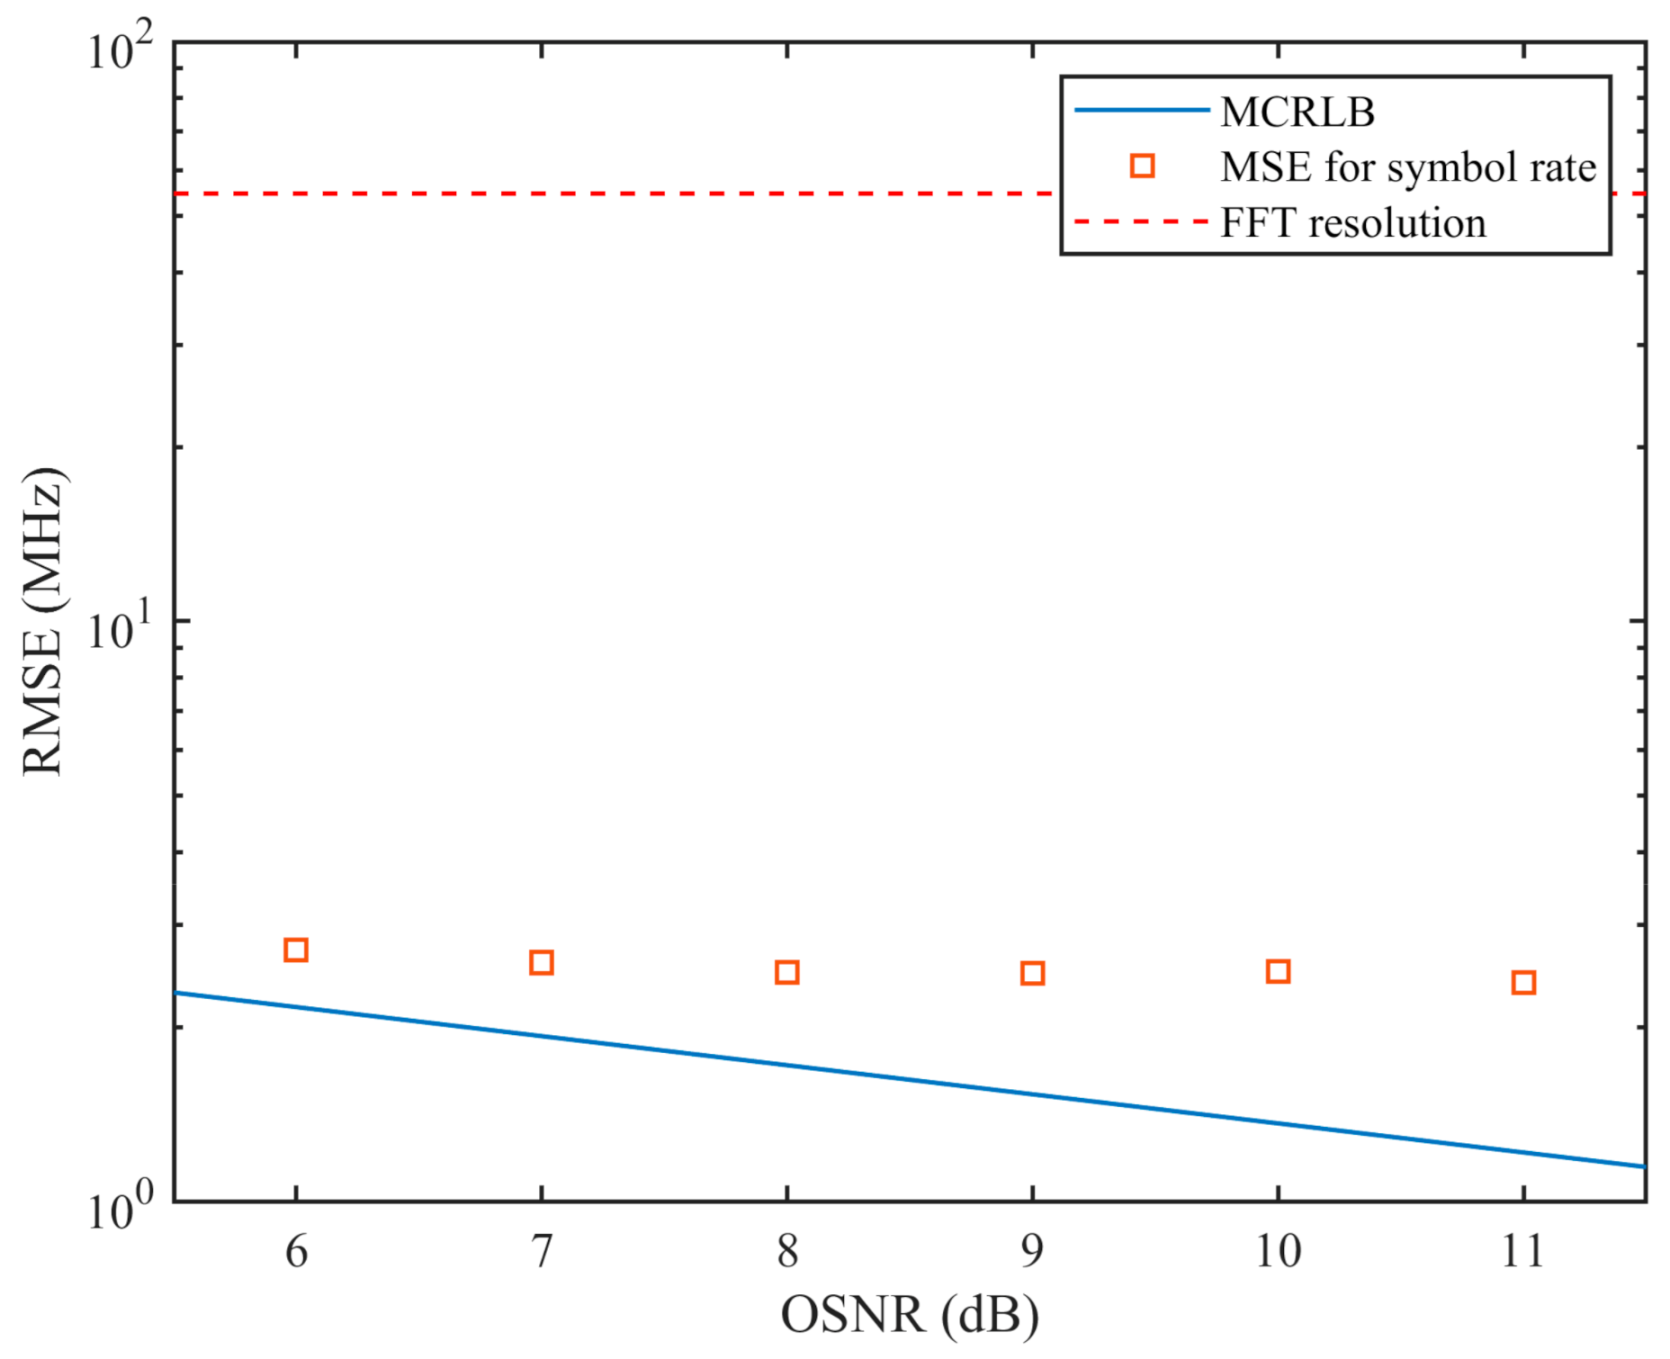
The performance of symbol rate estimation is similar to in [33], which states that the main error for symbol rate estimation comes from the resolution of FFT, especially for relatively high OSNR requirements for high-speed optical communication. As shown in Figure 7, all errors are within the frequency resolution.
Theoretically, the cyclic-correlation symbol rate estimation is an unbiased and consistent estimator [34]. We use the modified Cramer-Rao low bound (MCRLB) as the analytical performance limit of an unbiased estimator. The MCRLB of symbol rate estimation [35,36] is computed as
where L is the size of the symbol in the input sample, γs is the signal-to-noise ratio per symbol (Es/N0), T is the symbol period. As the variance is lower than the FFT resolution, we use a fine search with a grid spacing of 10−4/T around the FFT-based result. The RMSE of symbol rate estimation is visualized in Figure 7 as a function of OSNR. We can see the gap between the proposed method’s performance and the analytic limit. The main reason is the nuisance parameter, such as residue CD, PMD, and the frequency offset.
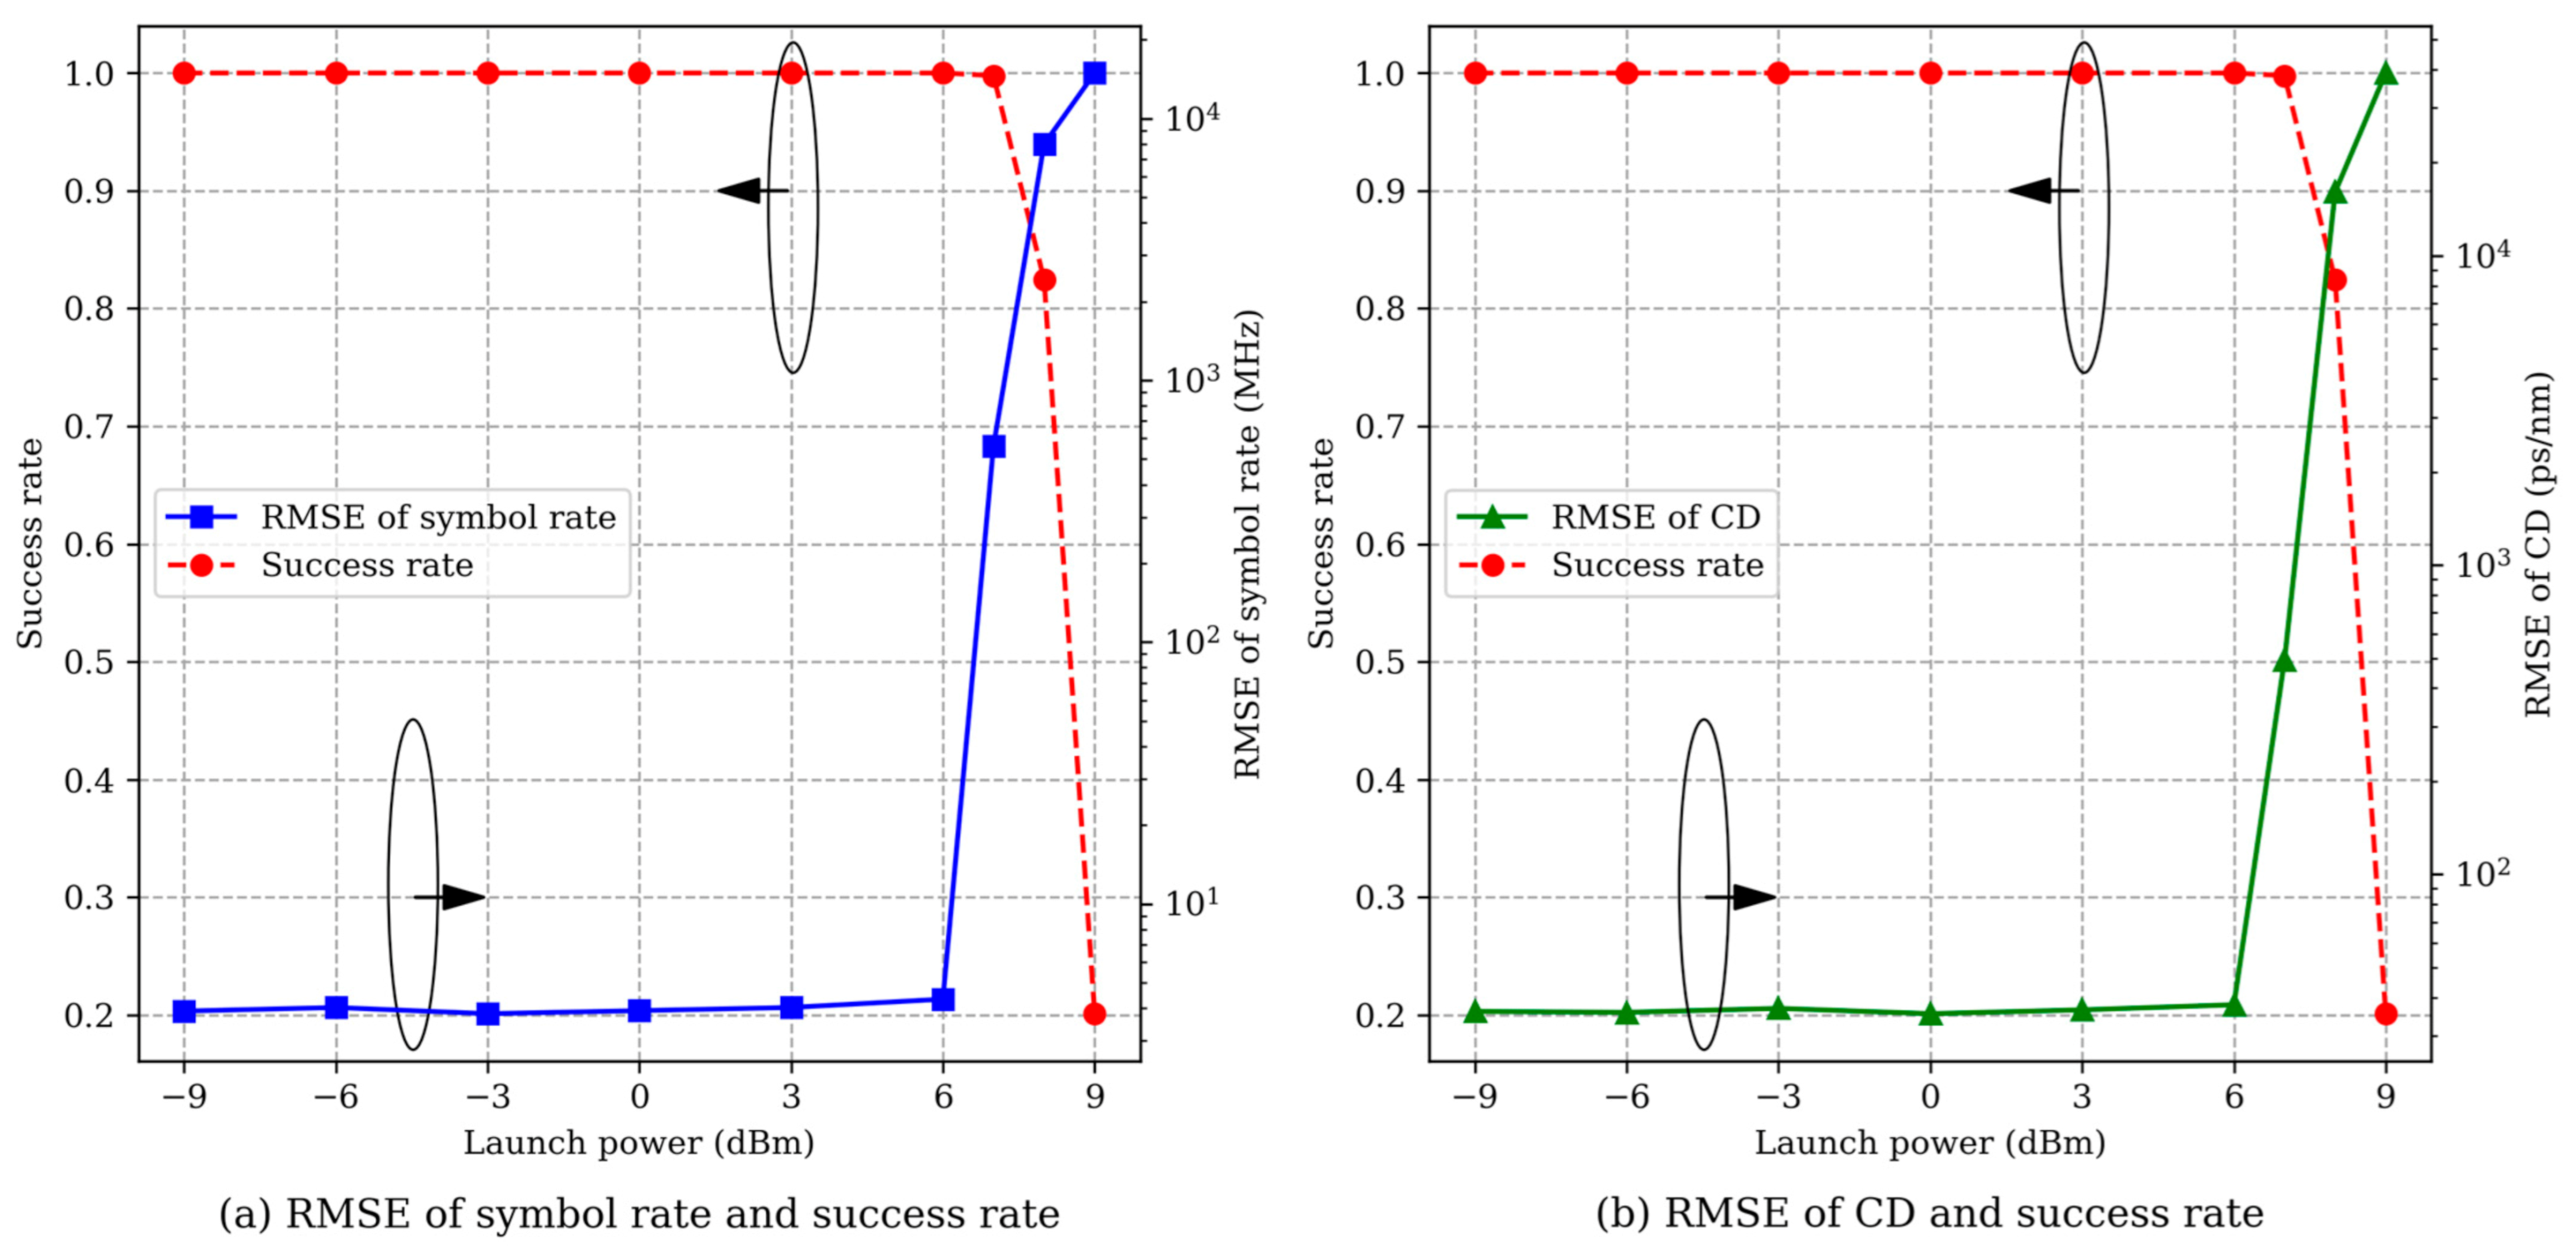
Figure 8 shows the performance variation against launch power when the transmission distance is fixed at 1600 km. The input length is 4096 and the OSNR is set to 12 dB. No significant loss of accuracy is observed when the launch power is lower than 6 dBm for the 10-channel DWDM system with a 50 GHz grid. For the launch power higher than 7 dBm, the success rate begins to drop.
Next, we extended our study to different modulations. The setup is the same as QPSK except that the OSNR is set to 8 and 18 dB for BPSK and 16-QAM, respectively. When the oversampling ratio is 16/7, the CD is depicted in Figure 9. These modulations have similar performances, owing to the same spectrum shape.
The SRRC pulse shaping with a low roll-off factor significantly reduces the cyclostationary component with its decreased bandwidth. We choose a filter length of 32 symbols for generating the SRRC filter.
We investigated the SRRC PDM-QPSK system with a roll-off factor β ranging from 0.06 to 0.2. We used the same simulation setup and set the OSNR to 13 dB. A total of 50 independent trials were performed, and the estimation was performed using 65,536 samples under an oversampling ratio of 16/7. For β = 0.06, we relax the success rate to a maximum absolute error of 1500 ps/nm. As shown in Figure 10 and Table 1, the whitening filter decreases the outage possibility for small roll-off factors when β ≤ 0.1.
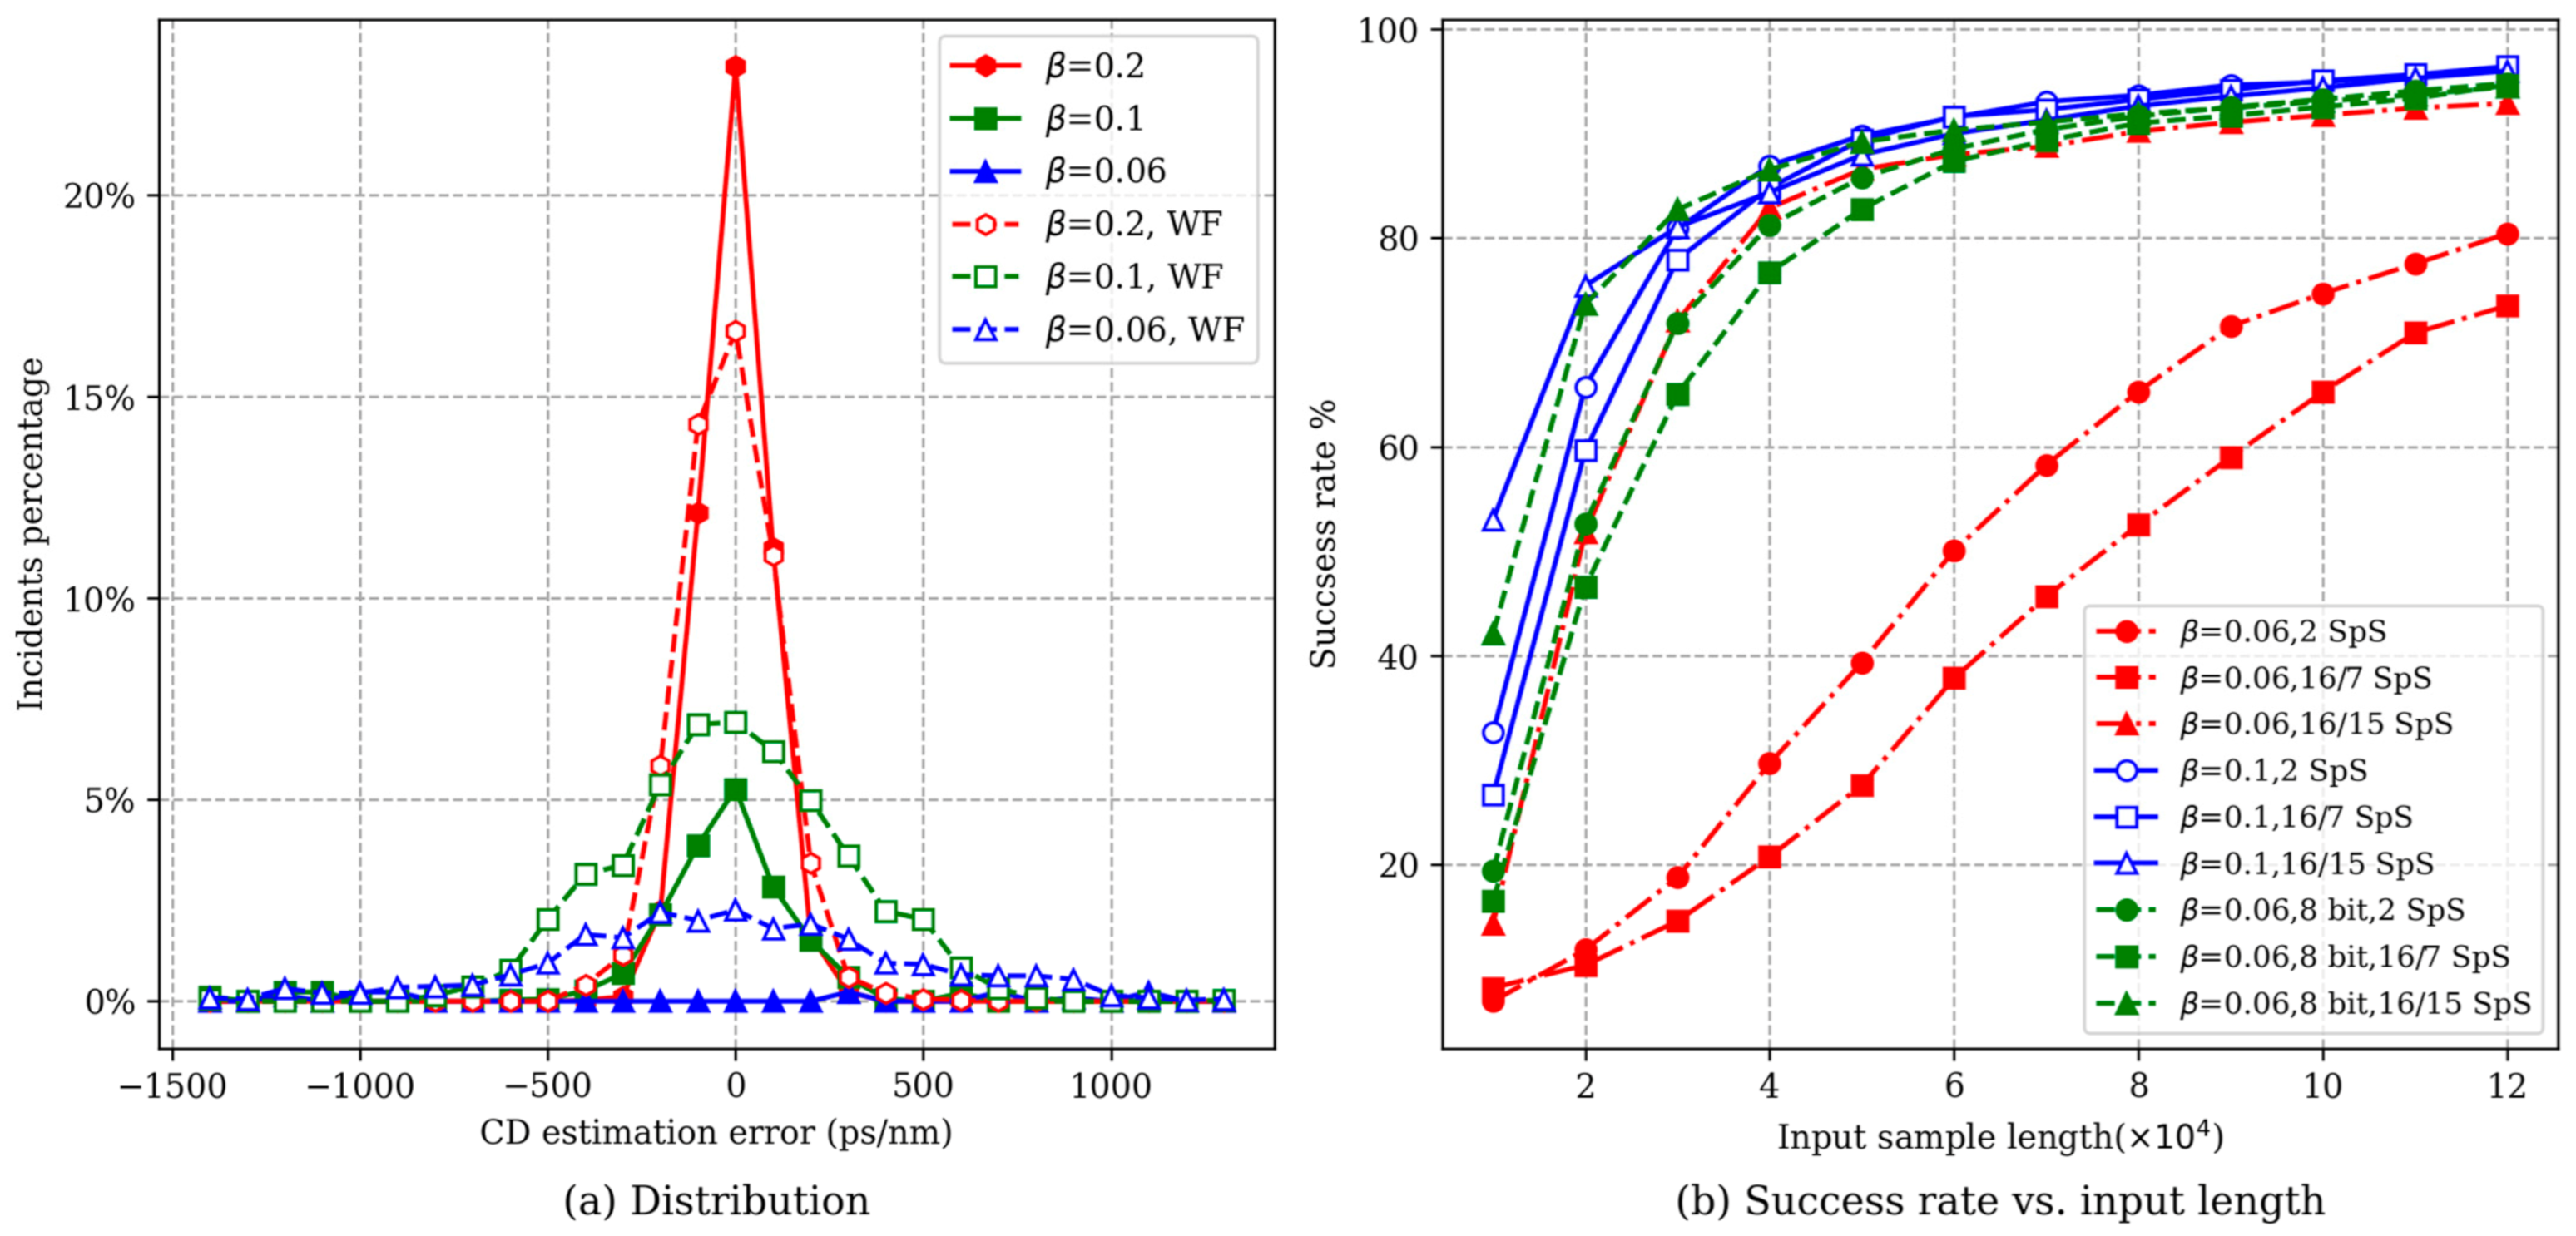
A longer input length is required to increase the robustness of systems with low roll-off factors. We plot the results for input lengths ranging from 10,000 to 130,000 for β = 0.06 and 0.1 for oversampling ratio [16/7, 2, 16/15] in Figure 10b. Notably, at a low oversampling ratio, the input length is reduced, as it covers more symbols with a low oversampling ratio. Eventually, the problem caused by the SRRC pulse shaping can be overcome by increasing the input length and lowering the scanning range.
In real-time implements, the bandwidth is broader than the ideal signal because of the hardware limitations. The actual input sample requirements may be relaxed, owing to the imperfection of the SRRC signal generation. As shown in Figure 10b, signal generation with a lower precision generation [37]. Experimental results in the next part further verify that, for a commercially available SRRC linecard, an input length of 25,000 is enough for robust estimation.
4. Experimental Results
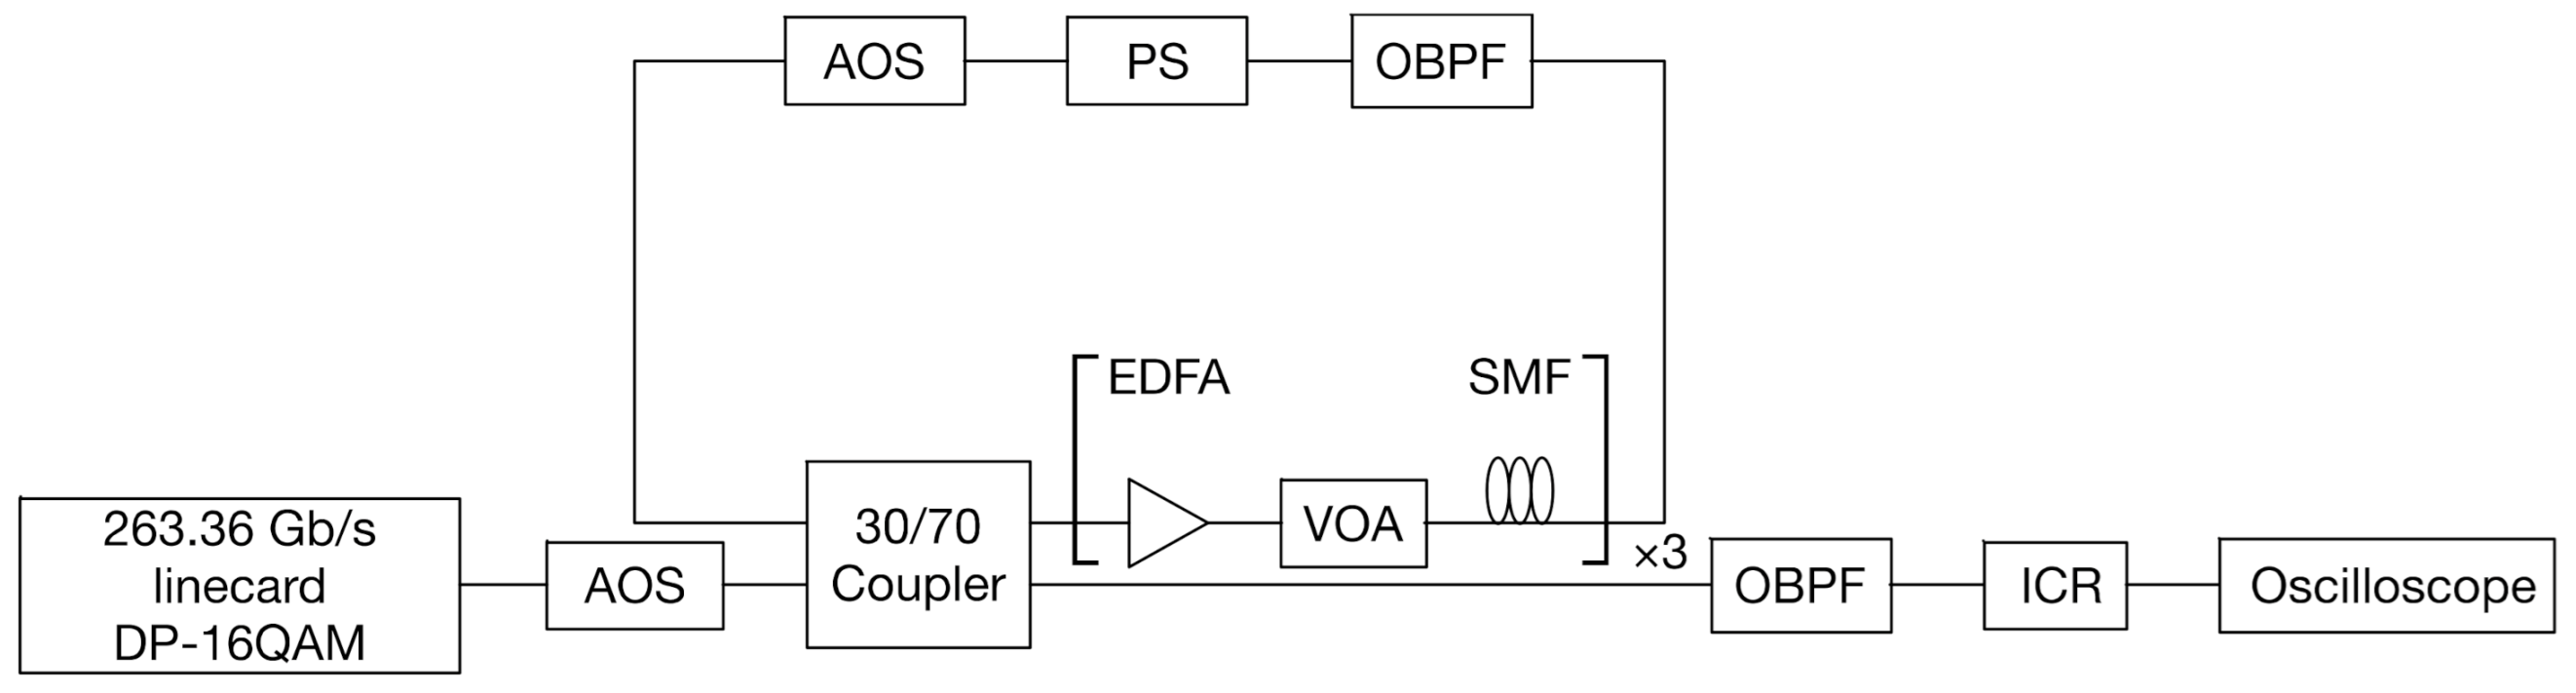
We depicted the experimental setup in Figure 11. The SRRC PDM-16QAM is generated with a 263.36 Gb/s linecard (the actual baud rate is 32.92 GBaud). The wavelength is set to 1552.9 nm and the roll-off factor is set to 0.1. The loop consists of 3 × 80 km SMF with 16.49 ps/nm/km dispersion parameter at 1552.9 nm. The optical power is controlled by an erbium-doped-fiber amplifier (EDFA) and a variable optical attenuator (VOA). A polarization scrambler (PS) is used to make random polarization rotation after each loop. An optical band-pass filter (OBPF) is applied to remove the off-band noise before the integrated coherent receiver (ICR) and after the EDFA. Finally, the signal is sampled with a real-time oscilloscope of 50 GSa/s.
We use the fiber recirculating loop to increase the transmission. The fiber recirculating controller Ovlink IOM-601 consists of two optical switches that make the optical signal go around in the recirculating loop. The oscilloscope (Tektronix DPO72004B) is triggered by IOM-601 at the end of the transmission. The signal is circulated 1 to 15 times, resulting in a transmission length ranging from 240 to 3600 km.
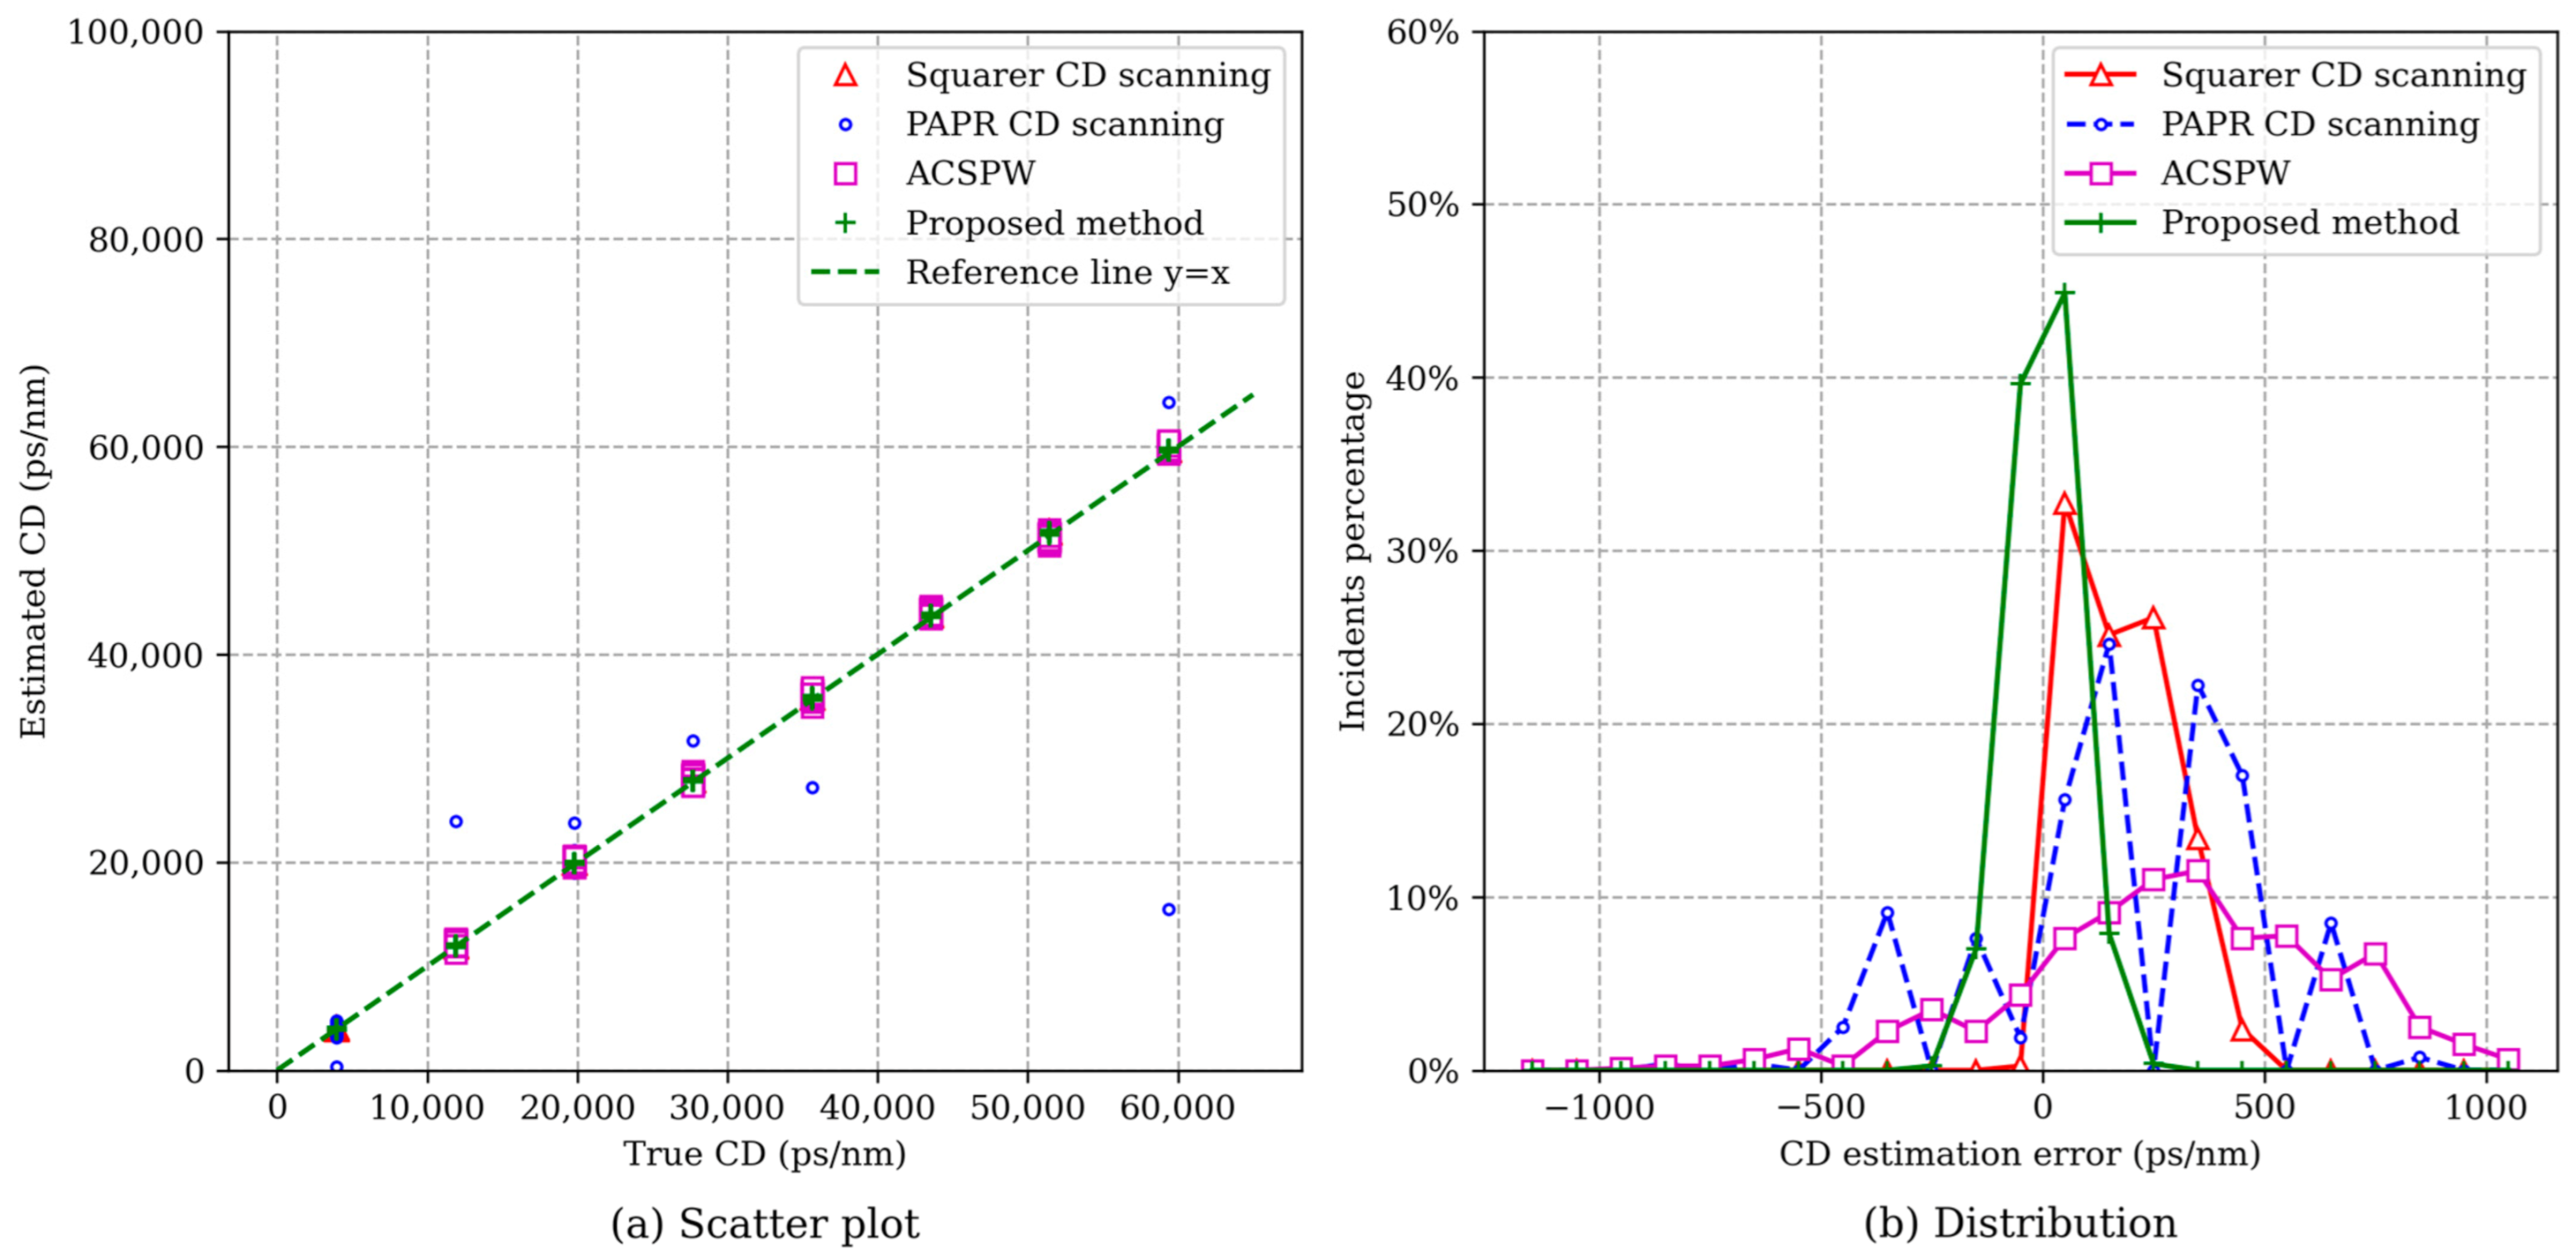
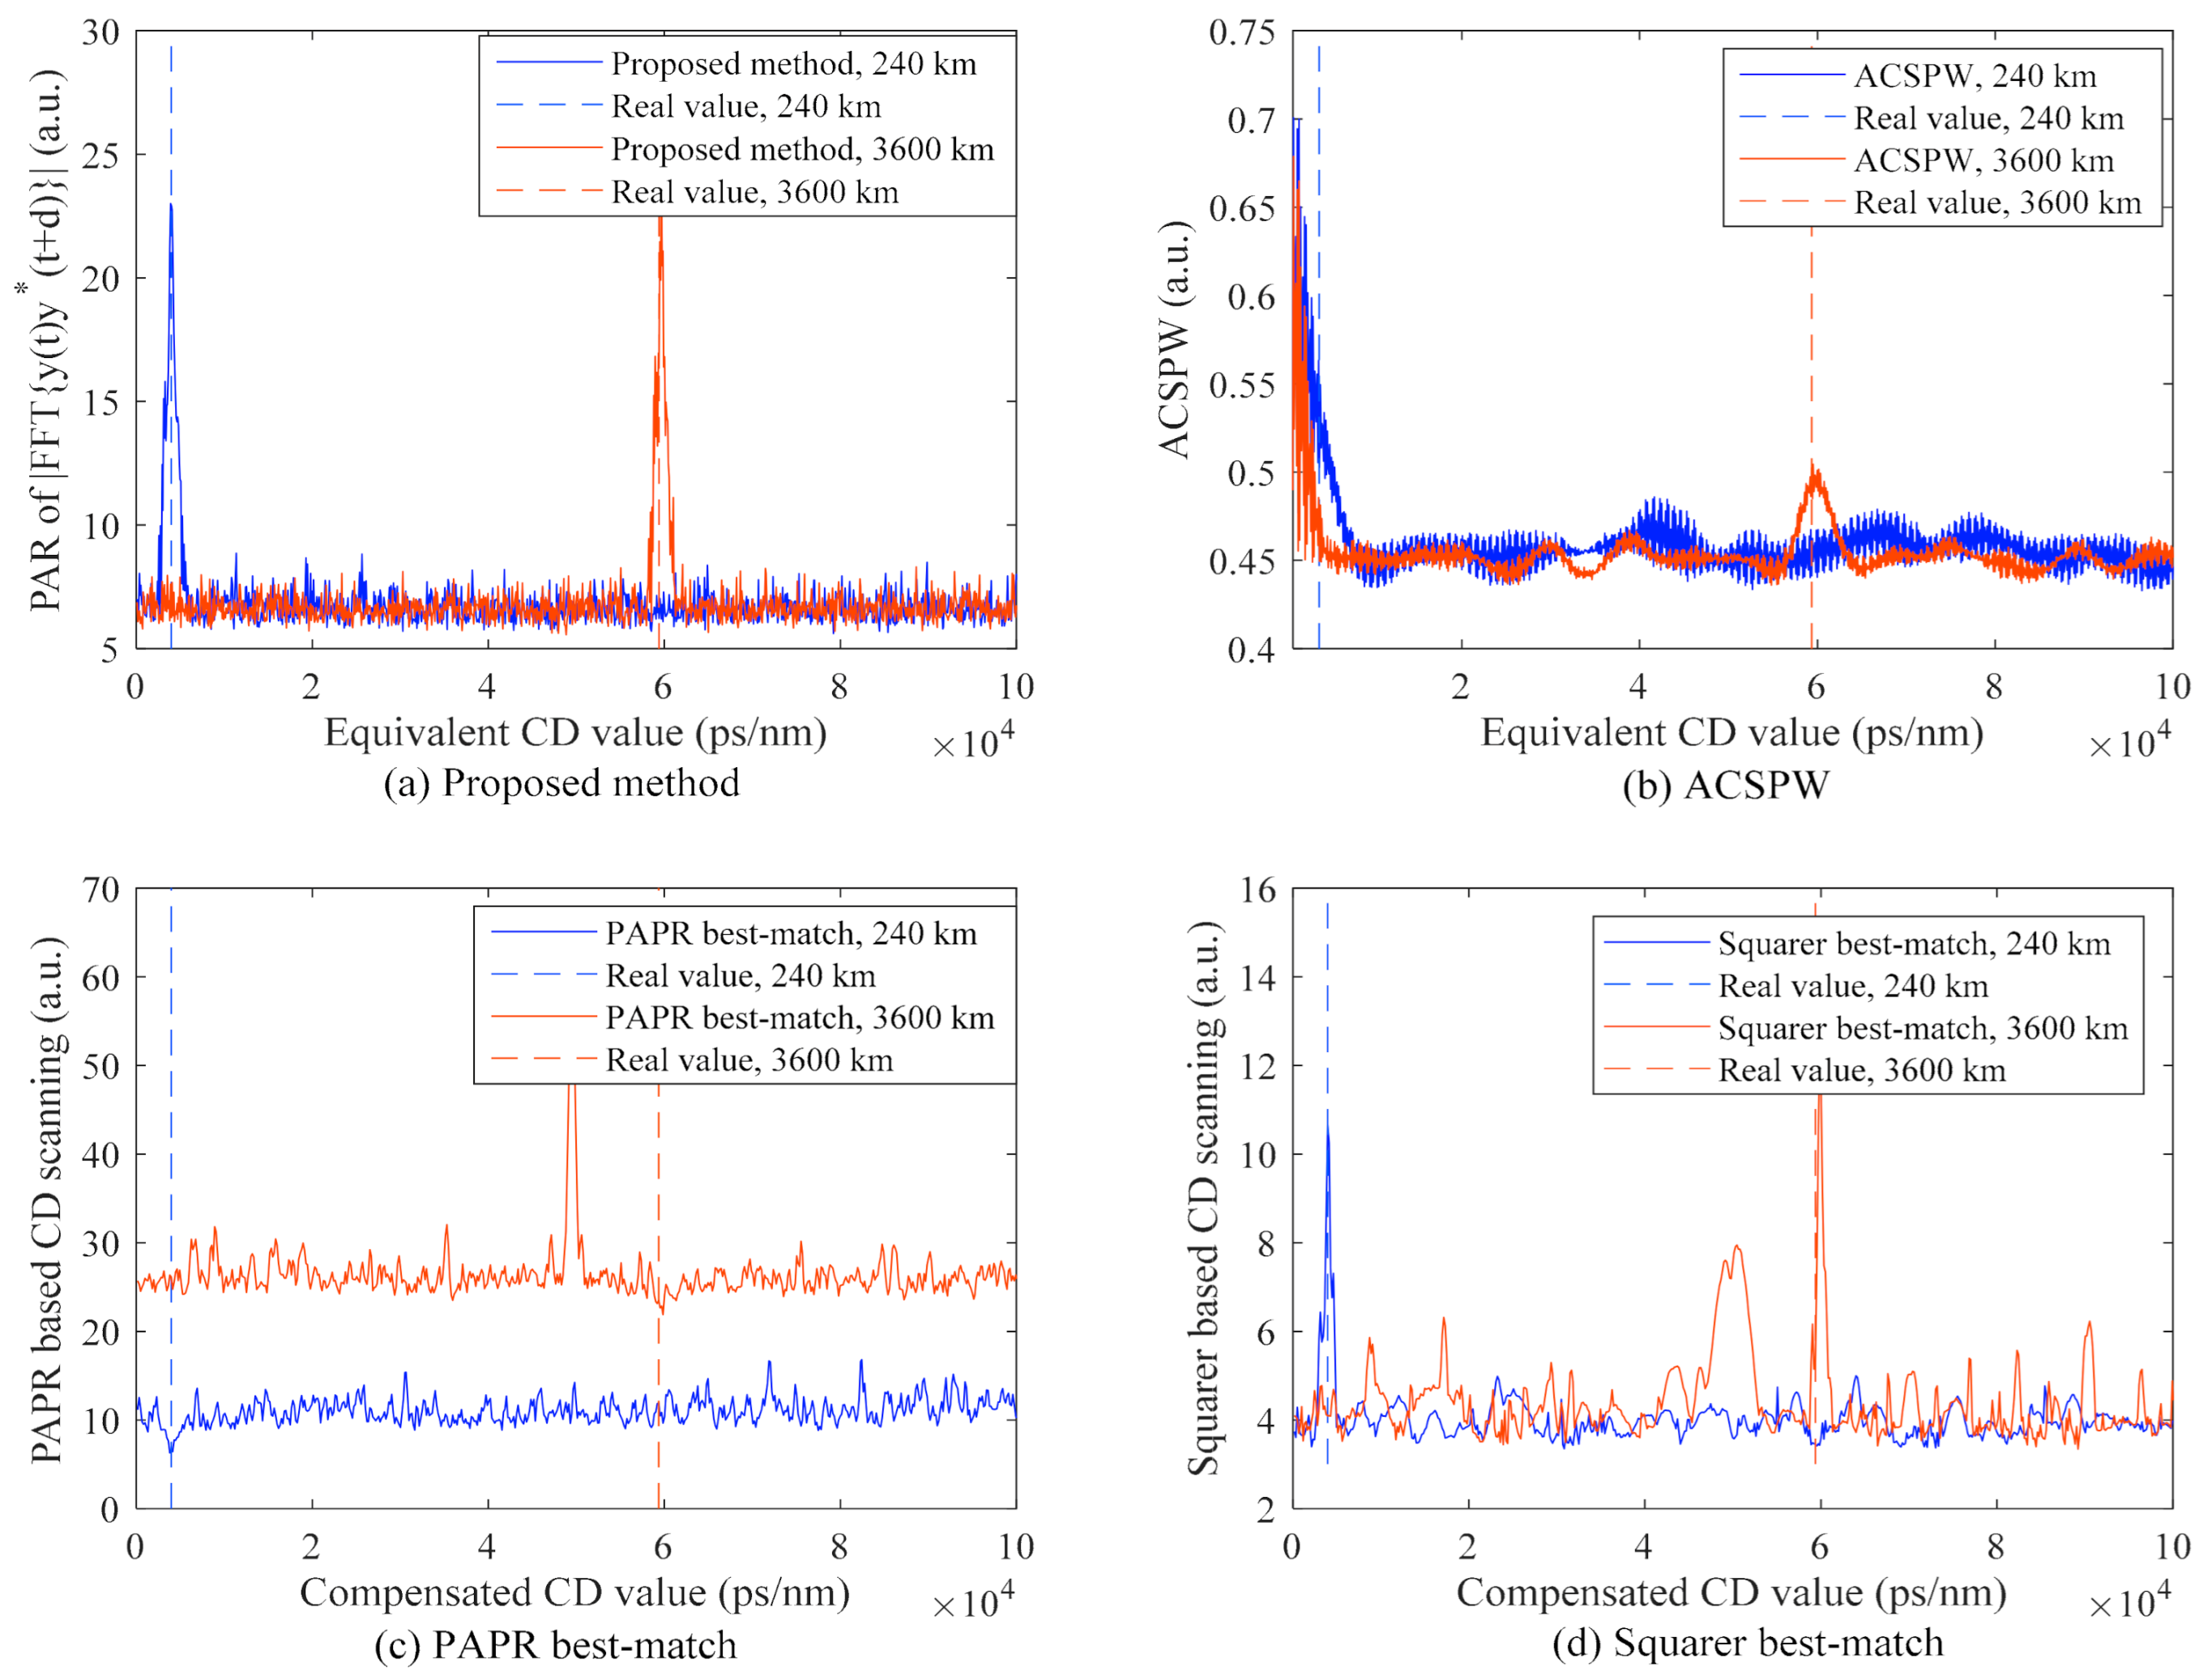
In the first evaluation, all input sizes are 32,768. The CD estimation result is shown in Figure 12, and Figure 13 further explains CD estimation when the transmission length is 240 and 3600 km, respectively. To compare justly with the squarer based best-match search [11], we added the same whitening filter to enhance the clock tone detection. A finite impulse response filter described in [17] is adopted for ACSPW and the 240 km case is omitted as the accumulated CD is not enough (see Figure 13b). For the CD scanning method, the CD scanning step is set to 150 ps/nm and the delay step for our proposed method is set to 2 samples, which is equivalent to the CD scanning step of 151.4 ps/nm.
As we can see from the figures, the degradation owing to the SRRC is obvious for all methods. In addition, obvious outliers are observed for PAPR best-match owing to the higher PAPR that exhibits in SRRC signals. On the contrary, the other methods achieve a 100% success rate for the tolerance of 1500 ps/nm. The results are listed in Table 2.
The experimental result is better than the simulation due to the limited precision of the digital-to-analog converter and pulse shaping procedure, which leads to a broader bandwidth in practice. For systems that employ SRRC with higher fidelity, a longer input length is required for robust estimation.
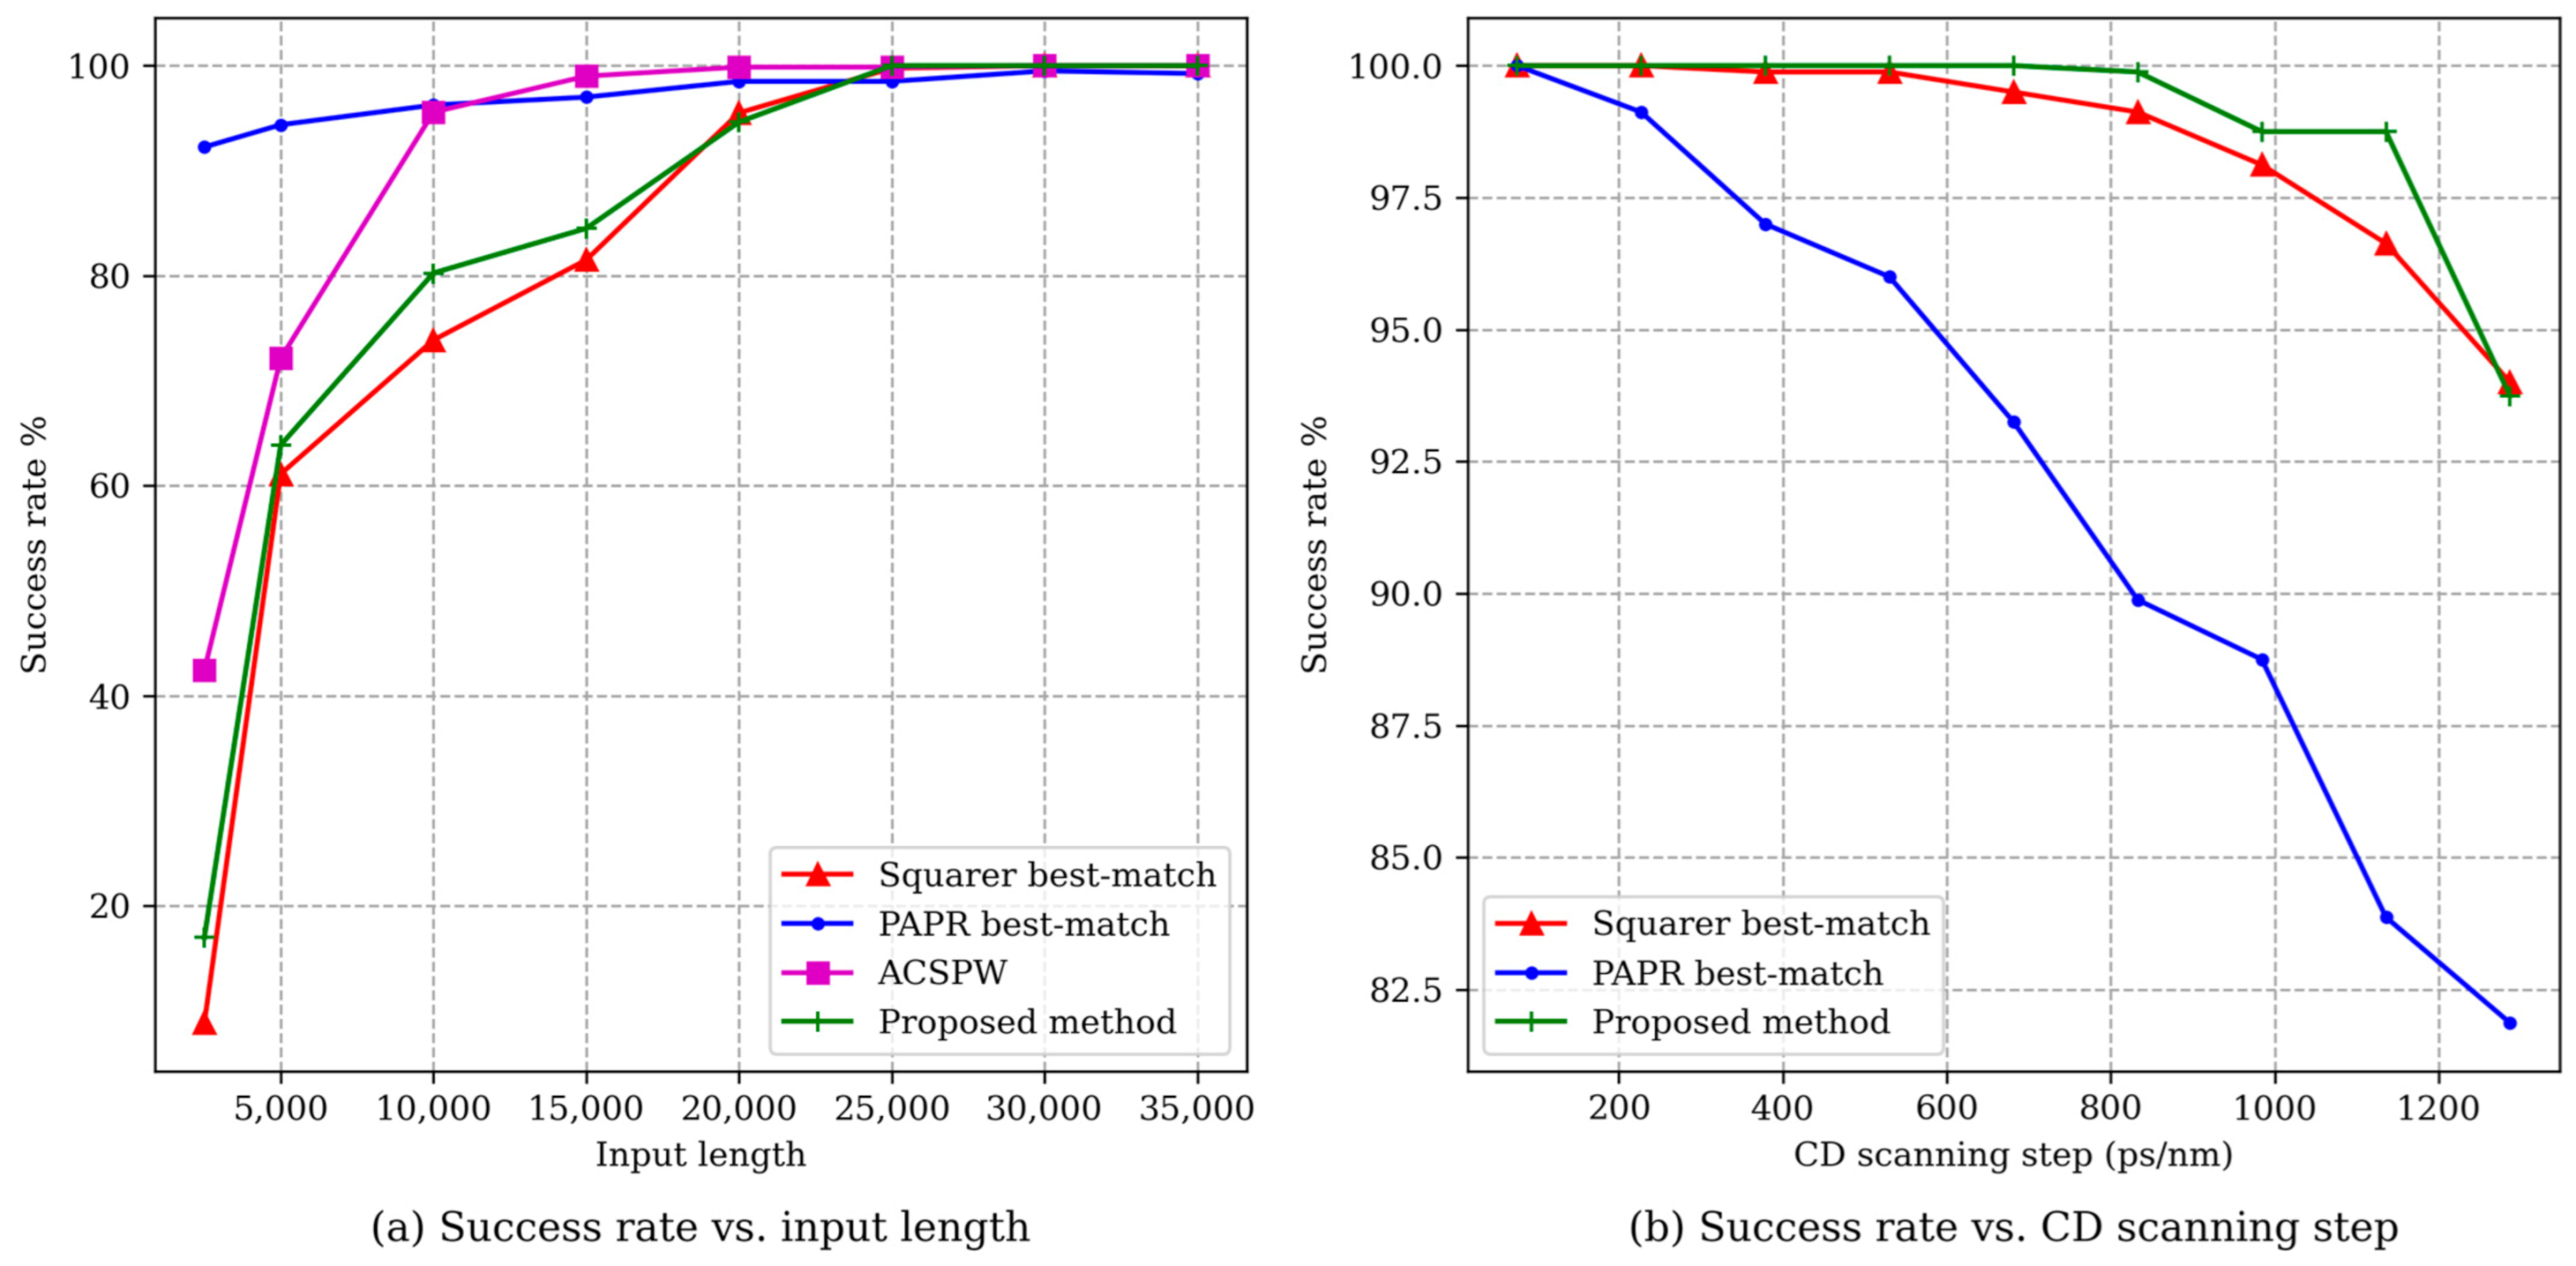
Furthermore, we test our proposed method with the input length of 2000 to 35,000. As shown in Figure 14a, an input length of 25,000 is required for an error-free estimation. The result of the scanning step is shown in Figure 14b. The maximum scanning step for a 100% successful rate is 681.3 ps/nm, and all symbol rate estimation outputs are 32.919 GBaud. To further measure the RMSE of the symbol rate, we adopted the same fine search step in the simulation. The RMSE of symbol rate is 64.5 kHz with the input length of 25,000.
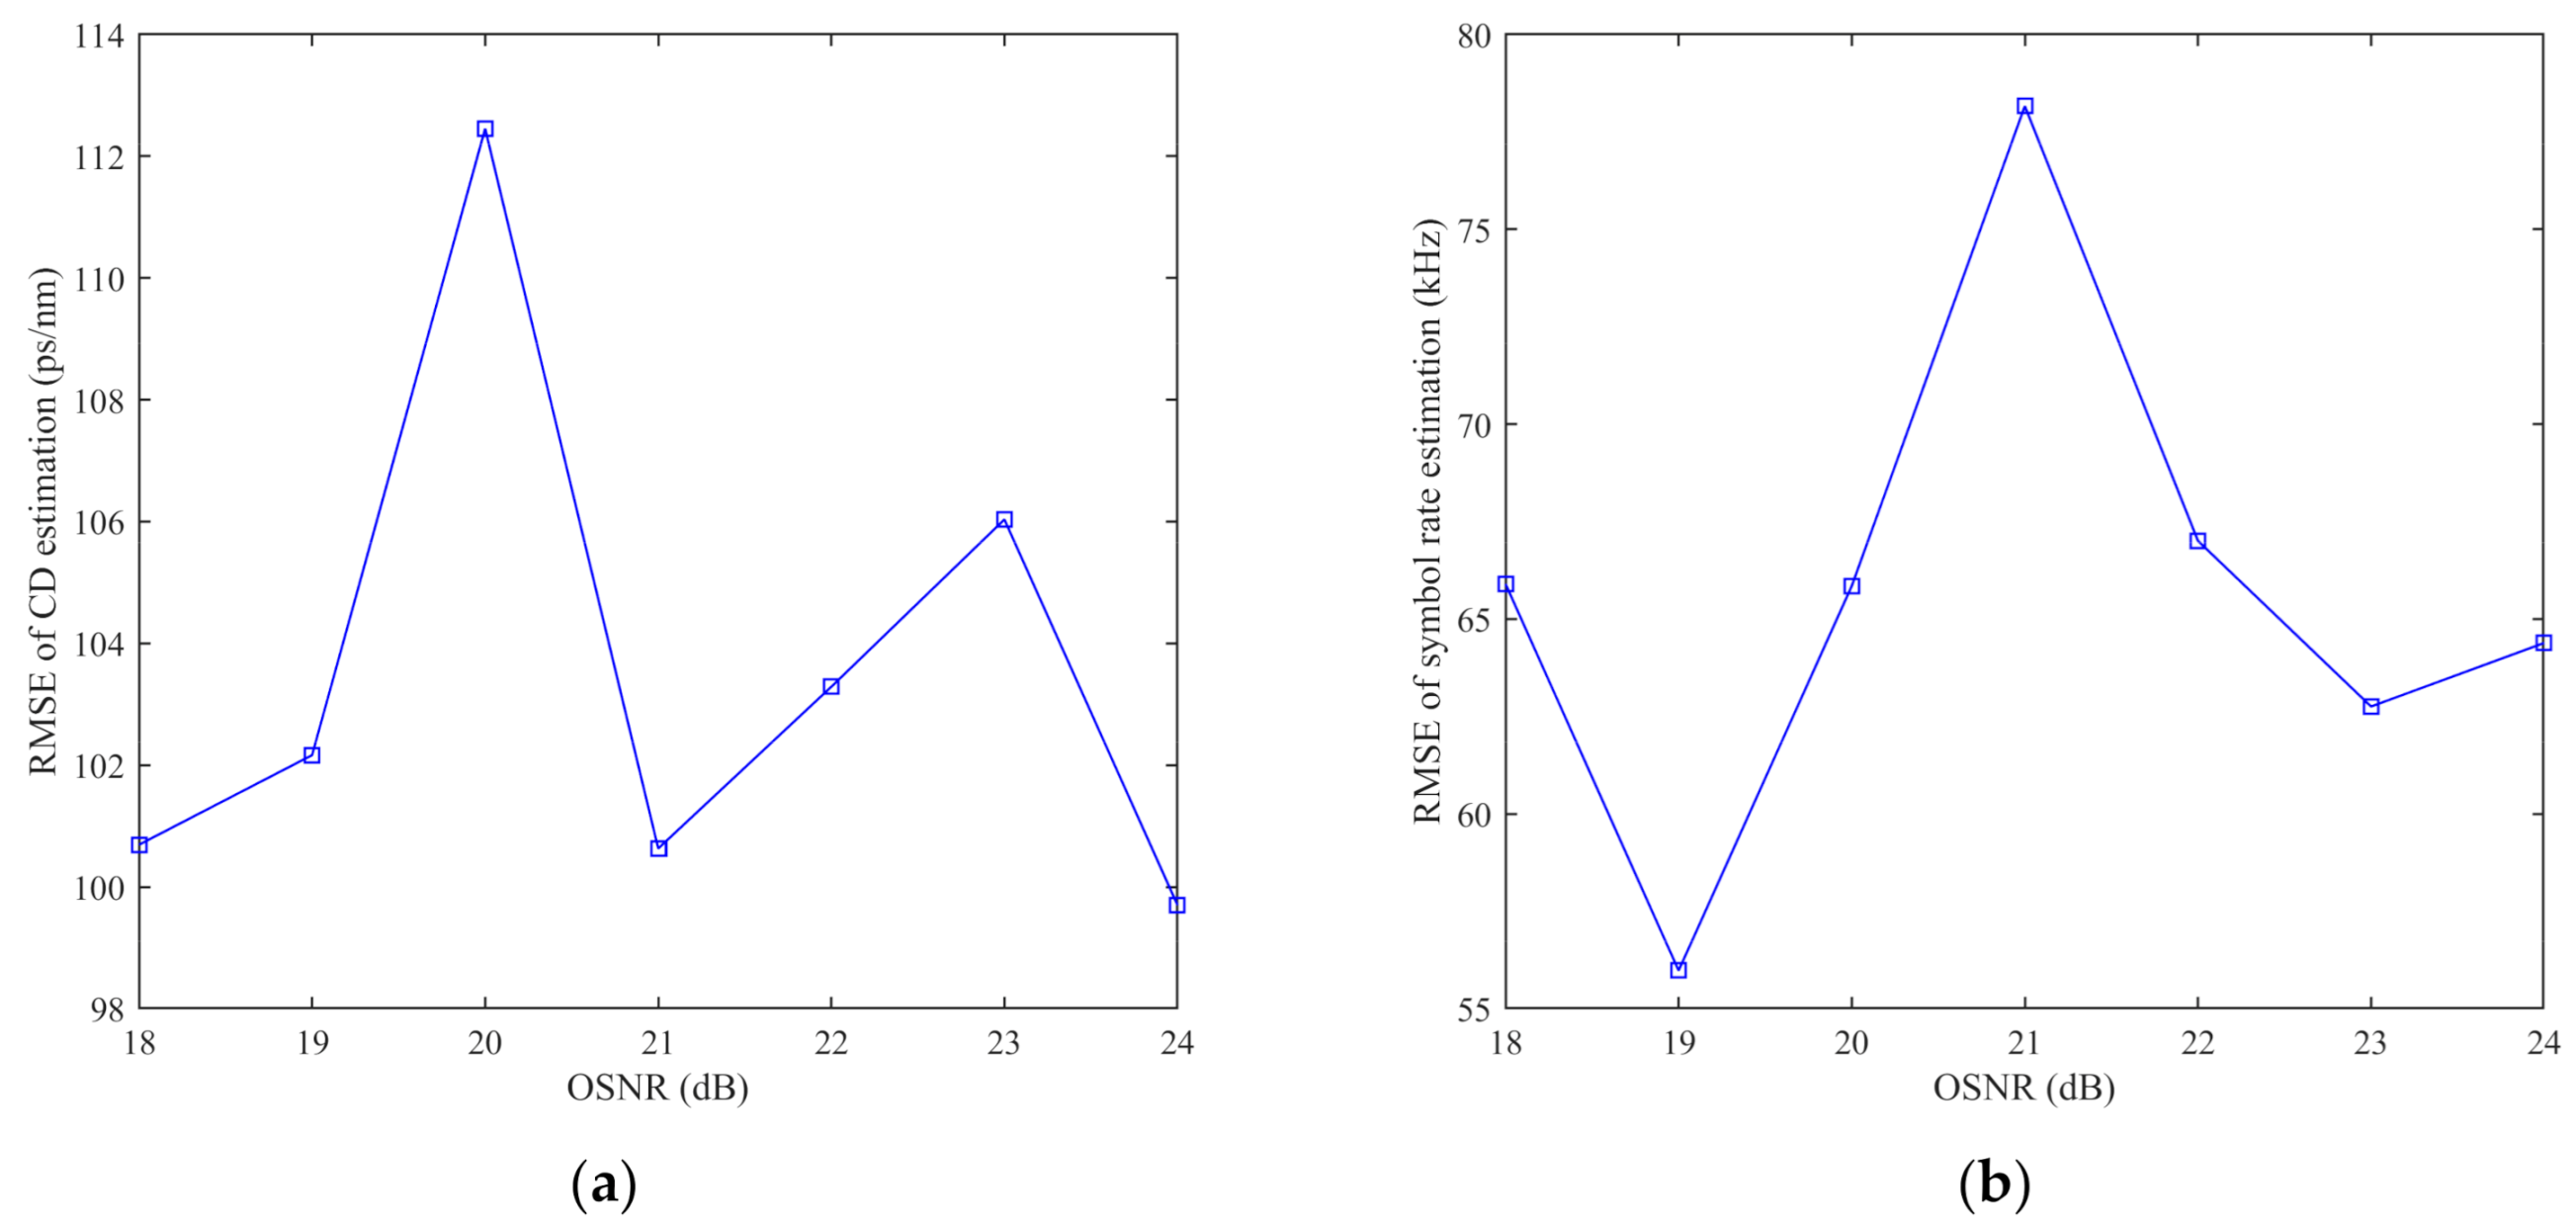
Figure 15 shows the RMSE performance under various OSNR. No obvious performance degradation is observed. As 25,000 input samples are used in the joint estimation, the variance of symbol rate estimation is lower than the case in Figure 7.
As compared to all four estimation methods, our proposed method does not require extra steps for determining the symbol rate. The variance is the lowest among all estimation methods. The scanning requirement and the success rate are slightly better than those of the squarer-based best-match search. The PAPR based best-match search is feasible for a short input sample but sensitive to the scanning step. If the symbol rate is known at the receiver, ACSPW with narrow band filtering can be used for SRRC signals but with a higher variance.
5. Discussion
5.1. Computation Complexity Comparison
The problem of joint estimation of symbol rate and CD is a 2D estimation problem. The task is more practical for a side processor. The generic computation complexity is MNLog2N, where M is the required scanning size and N is the size of FFT. The computation complexity is listed in Table 3. The scanning size is calculated with the following example: 33 GBaud NRZ PDM-QPSK and the sampling rate is 50 GSa/s and the maximum accumulated CD is 105 ps/nm.
It is worth noting that the scanning size of the best-match search is dependent on the symbol rate. The ACSPW is scanning-free and the most computationally efficient. However, when the SRRC filter is applied, it requires symbol rate related filtering [18]. If the symbol rate is unknown, additional scanning on the symbol rate is required for the SRRC signals.
For the NRZ signals, which do not require filtering, a scanning-free joint estimation can be achieved by combining ACSPW and our proposed method. The delay d can be calculated efficiently with ACSPW and then the symbol rate can be estimated via FFT{y(t)y*(t + d)}.
5.2. Relationship to Other Methods Employ Cyclostationary Analysis
Compared to Ionescu and Isautier’s method [20] (see Table 3), they used a brute-force estimation of the spectral correlation function. The computation burden is heavy due to the CD induced group delay. It takes 0.3 × 10⁶ scans for all candidate frequency at 50 GSa/s. More computation efficient methods for symbol rate methods fail due to the presence of CD.
The authors in [18] used the hardware implementation of SCF, which is feasible for estimation at a low sample rate. However, when the symbol rate is unknown, the correlation relationship will break if the frequency spacing is not accurate. Our method, however, does not have this limitation.
6. Conclusions
Joint estimation of the symbol rate and CD was proposed and evaluated in this study. This method is applicable for linear modulations, including BPSK, QPSK, and 16-QAM. It works well with the NRZ pulse shape, and only 4096 samples are required for a 100% estimation success rate with an RMSE of 39.5 ps/nm, a maximum absolute error of 140.6 ps/nm, and a required OSNR of 5 dB. The RMSE for the symbol rate is 2.4 MHz. The performance exacerbates with a very narrow bandwidth pulse, such as SRRC. With an input length of 65,536 samples at an oversampling ratio of 16/7, the match filtering technique improved the success rate from 30.6 to 91.6% at the cost of increased variance.
In the experiments, we compare the performance of our proposed method and other CD estimation methods. With the input length of 25,000 samples, the RMSE of 105.6 ps/nm for CD estimation and 64.5 kHz for symbol rate estimation is achieved. Therefore, this method is promising for the autonomous operation of elastic optical networks.
Author Contributions
Conceptualization, J.B. and Z.H.; methodology, J.B.; software, J.B.; validation, J.B., and Z.H.; formal analysis, J.W.; investigation, Z.H.; resources, J.W.; data curation, F.S.; writing—original draft preparation, J.B.; writing—review and editing, F.S.; visualization, J.B.; supervision, Z.H.; project administration, J.W.; funding acquisition, J.W. All authors have read and agreed to the published version of the manuscript.
Funding
This research was funded by National Natural Science Foundation of China, grant number 51575517 and Natural Science Foundation of Hunan Province, grant number 2019JJ50121.
Data Availability Statement
Experimental data is available from the corresponding author upon request.
Conflicts of Interest
The authors declare no conflict of interest.
References
- Dong, Z.; Khan, F.N.; Sui, Q.; Zhong, K.; Lu, C.; Lau, A.P.T. Optical Performance Monitoring: A Review of Current and Future Technologies. J. Light. Technol. 2016, 34, 525–543. [Google Scholar] [CrossRef]
- Layec, P.; Morea, A.; Vacondio, F.; Rival, O.; Antona, J.-C. Elastic optical networks: The global evolution to software configurable optical networks. Bell Labs Tech. J. 2013, 18, 133–151. [Google Scholar] [CrossRef]
- Morea, A.; Rival, O.; Brochier, N.; Le Rouzic, E. Datarate adaptation for night-time energy savings in core networks. J. Light. Technol. 2013, 31, 779–785. [Google Scholar] [CrossRef]
- Nag, A.; Tornatore, M.; Mukherjee, B. Optical network design with mixed line rates and multiple modulation formats. Opt. InfoBase Conf. Pap. 2009, 28, 466–475. [Google Scholar] [CrossRef]
- Yadlowsky, M.J.; Deliso, E.M.; Silva, V.L.D.A. Optical fibers and amplifiers for WDM systems. Proc. IEEE 1997, 85, 1765–1779. [Google Scholar] [CrossRef]
- Savory, S.J. Digital filters for coherent optical receivers. Opt. Express 2008, 16, 804. [Google Scholar] [CrossRef]
- Kawaguchi, Y.; Tamura, Y.; Haruna, T.; Yamamoto, Y.; Hirano, M. Ultra low-loss pure silica core fiber. In Proceedings of the 2018 Optical Fiber Communications Conference and Exposition (OFC), San Diego, CA, USA, 11–15 March 2018; pp. 50–55. [Google Scholar]
- Amari, A.; Dobre, O.A.; Venkatesan, R.; Kumar, O.S.S.; Ciblat, P.; Jaouen, Y. A Survey on Fiber Nonlinearity Compensation for 400 Gb/s and beyond Optical Communication Systems. IEEE Commun. Surv. Tutor. 2017, 19, 3097–3113. [Google Scholar] [CrossRef]
- Yonenaga, K.; Takachio, N. A Fiber Chromatic Dispersion Compensation Technique With An Optical Ssb Transmission In Optical Homodyne Detection Systems. IEEE Photonics Technol. Lett. 1993, 5, 949–951. [Google Scholar] [CrossRef]
- Zhang, L.; Zuo, T.; Mao, Y.; Zhang, Q.; Zhou, E.; Liu, G.N.; Xu, X. Beyond 100-Gb/s Transmission over 80-km SMF Using Direct-Detection SSB-DMT at C-Band. J. Light. Technol. 2016, 34, 723–729. [Google Scholar] [CrossRef]
- Soriano, R.A.; Hauske, F.N.; Gonzalez, N.G.; Zhang, Z.; Ye, Y.; Monroy, I.T. Chromatic Dispersion Estimation in Digital Coherent Receivers. J. Light. Technol. 2011, 29, 1627–1637. [Google Scholar] [CrossRef] [Green Version]
- Xie, C. Chromatic dispersion estimation for single-carrier coherent optical communications. IEEE Photonics Technol. Lett. 2013, 25, 992–995. [Google Scholar] [CrossRef]
- Malouin, C.; Thomas, P.; Zhang, B.; O’Neil, J.; Schmidt, T. Natural Expression of the Best-Match Search Godard Clock-Tone Algorithm for Blind Chromatic Dispersion Estimation in Digital Coherent Receivers. Adv. Photonics Congr. 2012, 2, SpTh2B.4. [Google Scholar] [CrossRef]
- Zhou, H.; Li, B.; Tang, M.; Zhong, K.; Feng, Z.; Cheng, J.; Lau, A.P.T.; Lu, C.; Fu, S.; Shum, P.P.; et al. Fractional Fourier Transformation-Based Blind Chromatic Dispersion Estimation for Coherent Optical Communications. J. Light. Technol. 2016, 34, 2371–2380. [Google Scholar] [CrossRef]
- Borkowski, R.; Zhang, X.; Zibar, D.; Younce, R.; Monroy, I.T. Experimental demonstration of adaptive digital monitoring and compensation of chromatic dispersion for coherent DP-QPSK receiver. Opt. Express 2011, 19, B728. [Google Scholar] [CrossRef] [PubMed] [Green Version]
- Ip, E.; Kahn, J.M. Digital equalization of chromatic dispersion and polarization mode dispersion. J. Light. Technol. 2007, 25, 2033–2043. [Google Scholar] [CrossRef]
- Sui, Q.; Lau, A.P.T.; Lu, C. Fast and robust blind chromatic dispersion estimation using auto-correlation of signal power waveform for digital coherent systems. J. Light. Technol. 2013, 31, 306–312. [Google Scholar] [CrossRef]
- Chen, Y.; Sui, Q.; Li, Z.; Liang, Z.; Liu, W. Joint CD and PMD monitoring based on a pair of low-bandwidth coherent receivers. Opt. Express 2016, 24, 26756. [Google Scholar] [CrossRef] [PubMed]
- Yao, S.; Eriksson, T.A.; Fu, S.; Johannisson, P.; Karlsson, M.; Andrekson, P.A.; Ming, T.; Liu, D. Fast and robust chromatic dispersion estimation based on temporal auto-correlation after digital spectrum superposition. Opt. Express 2015, 23, 15418. [Google Scholar] [CrossRef] [PubMed]
- Ionescu, M.; Sato, M.; Thomsen, B. Cyclostationarity-based joint monitoring of symbol-rate, frequency offset, CD and OSNR for Nyquist WDM superchannels. Opt. Express 2015, 23, 25762. [Google Scholar] [CrossRef]
- Isautier, P.; Mehta, K.; Stark, A.J.; Ralph, S.E. Robust Architecture for Autonomous Coherent Optical Receivers. J. Opt. Commun. Netw. 2015, 7, 864. [Google Scholar] [CrossRef]
- Tang, D.; Wang, X.; Zhuang, L.; Guo, P.; Yang, A.; Qiao, Y. Delay-Tap-Sampling-Based Chromatic Dispersion Estimation Method with Ultra-Low Sampling Rate for Optical Fiber Communication Systems. IEEE Access 2020, 8, 101004–101013. [Google Scholar] [CrossRef]
- Li, J.; Wang, D.; Zhang, M. Low-Complexity Adaptive Chromatic Dispersion Estimation Scheme Using Machine Learning for Coherent Long-Reach Passive Optical Networks. IEEE Photonics J. 2019, 11, 1–11. [Google Scholar] [CrossRef]
- Agrawal, G.P. Nonlinear Fiber Optics. In Nonlinear Science at the Dawn of the 21st Century; Springer: Berlin/Heidelberg, Germany, 2020; pp. 195–211. ISBN 0120451433. [Google Scholar]
- Spooner, C.M.; Gardner, W.A. Robust feature detection for signal interception. IEEE Trans. Commun. 1994, 42, 2165–2173. [Google Scholar] [CrossRef]
- Hauske, F.N.; Stojanovic, N.; Xie, C.; Chen, M. Impact of optical channel distortions to digital timing recovery in digital coherent transmission systems. In Proceedings of the 2010 12th International Conference on Transparent Optical Networks, Munich, Germany, 27 June–1 July 2010; pp. 2–5. [Google Scholar] [CrossRef]
- Plancherel, M.; Leffler, M. Contribution à l’étude de la représentation d’une fonction arbitraire par des intégrales définies. Rend. Circ. Mat. Palermo 1910, 30, 289–335. [Google Scholar] [CrossRef]
- Cooke, J.C. Note on the Principle of Stationary Phase. IMA J. Appl. Math. 1978, 22, 297–303. [Google Scholar] [CrossRef] [Green Version]
- Gardner, W.A. The spectral correlation theory of cyclostationary time-series. Signal Process. 1986, 11, 405. [Google Scholar] [CrossRef]
- Friedlander, B.; Porat, B. The Modified Yule-Walker Method of ARMA Spectral Estimation. IEEE Trans. Aerosp. Electron. Syst. 1984, AES-20, 158–173. [Google Scholar] [CrossRef]
- Gardner, W.A.; Spooner, C.M. Signal interception: Performance advantages of cyclic-feature detectors. IEEE Trans. Commun. 1992, 40, 149–159. [Google Scholar] [CrossRef]
- Serena, P.; Bononi, A. A time-domain extended gaussian noise model. J. Light. Technol. 2015, 33, 1459–1472. [Google Scholar] [CrossRef]
- Ciblat, P.; Ghogho, M. Blind NLLS carrier frequency-offset estimation for QAM, PSK, and PAM modulations: Performance at low SNR. IEEE Trans. Commun. 2006, 54, 1725–1730. [Google Scholar] [CrossRef] [Green Version]
- Ciblat, P.; Loubaton, P.; Serpedin, E.; Giannakis, G.B. Asymptotic analysis of blind cyclic correlation-based symbol-rate estimators. IEEE Trans. Inf. Theory 2002, 48, 1922–1934. [Google Scholar] [CrossRef]
- Suesser-Rechberger, B.; Gappmair, W. New Results on Symbol Rate Estimation in Digital Satellite Receivers. In Proceedings of the 2018 11th International Symposium on Communication Systems, Networks & Digital Signal Processing (CSNDSP), Budapest, Hungary, 18–20 July 2018. [Google Scholar] [CrossRef]
- Suesser-Rechberger, B.; Gappmair, W. Asymptotic CRLB for Blind Symbol Rate Estimation in Digital Satellite Receivers. In Proceedings of the 2020 12th International Symposium on Communication Systems, Networks and Digital Signal Processing (CSNDSP), Porto, Portugal, 20–22 July 2020; pp. 1–6. [Google Scholar]
- Schmogrow, R.; Meyer, M.; Schindler, P.C.; Nebendahl, B.; Dreschmann, M.; Meyer, J.; Josten, A.; Hillerkuss, D.; Ben-Ezra, S.; Becker, J.; et al. Real-time Nyquist signaling with dynamic precision and flexible non-integer oversampling. Opt. Express 2014, 22, 193. [Google Scholar] [CrossRef] [PubMed] [Green Version]
Figure 1.
(a) The proposed joint estimation with delay-multiplier and fast Fourier transform (FFT). PAR: peak-to-average ratio. (b) The architecture of the squarer best-match search. The asterisk (*) denotes conjugation.
Figure 1.
(a) The proposed joint estimation with delay-multiplier and fast Fourier transform (FFT). PAR: peak-to-average ratio. (b) The architecture of the squarer best-match search. The asterisk (*) denotes conjugation.

Figure 2.
Symbol rate estimation result of (a) the proposed method and (b) the squarer best-match search. Our proposed method is able to uniquely estimate the symbol rate. WF stands for the method that adopts the whitening filter.
Figure 2.
Symbol rate estimation result of (a) the proposed method and (b) the squarer best-match search. Our proposed method is able to uniquely estimate the symbol rate. WF stands for the method that adopts the whitening filter.

Figure 3.
The shape of the whitening filter and the power spectrum of the NRZ signal.

Figure 4.
Comparison of ACSPW (input length is 8192), the proposed method, and our proposed method with the whitening filter (input length is 8192) after normalizing the peak of the true CD to 1. DIFF stands for the differential filter of x[n] − x[n − 1] that ACSPW uses. The dashed vertical line shows the actual value of the accumulated CD in the channel (13,400 ps/nm). The metric is plotted in (a) full range and (b) zoomed range around the true CD.

Figure 5.
(a) Success rate and RMSE performance with respect to transmission length obtained with the proposed method and best-match search. No observed escape error is observed for the proposed method, while the squarer best-match search has an ~80% success rate. (b) CD estimation error distribution for the proposed method and best-match search.

Figure 6.
Required OSNR for a 100% success rate with respect to a variety of oversampling ratios.

Figure 7.
The RMSE performance of the symbol rate estimation. We compare the MCRLB (in the blue solid line) and the FFT resolution (in the dashed red line). We set the oversampling ratio to 4, as required by the MCRLB computation. The input length is 2048 and contains 512 symbols.
Figure 7.
The RMSE performance of the symbol rate estimation. We compare the MCRLB (in the blue solid line) and the FFT resolution (in the dashed red line). We set the oversampling ratio to 4, as required by the MCRLB computation. The input length is 2048 and contains 512 symbols.

Figure 8.
(a) The RMSE performance and (b) success rate vs. the launch power.

Figure 9.
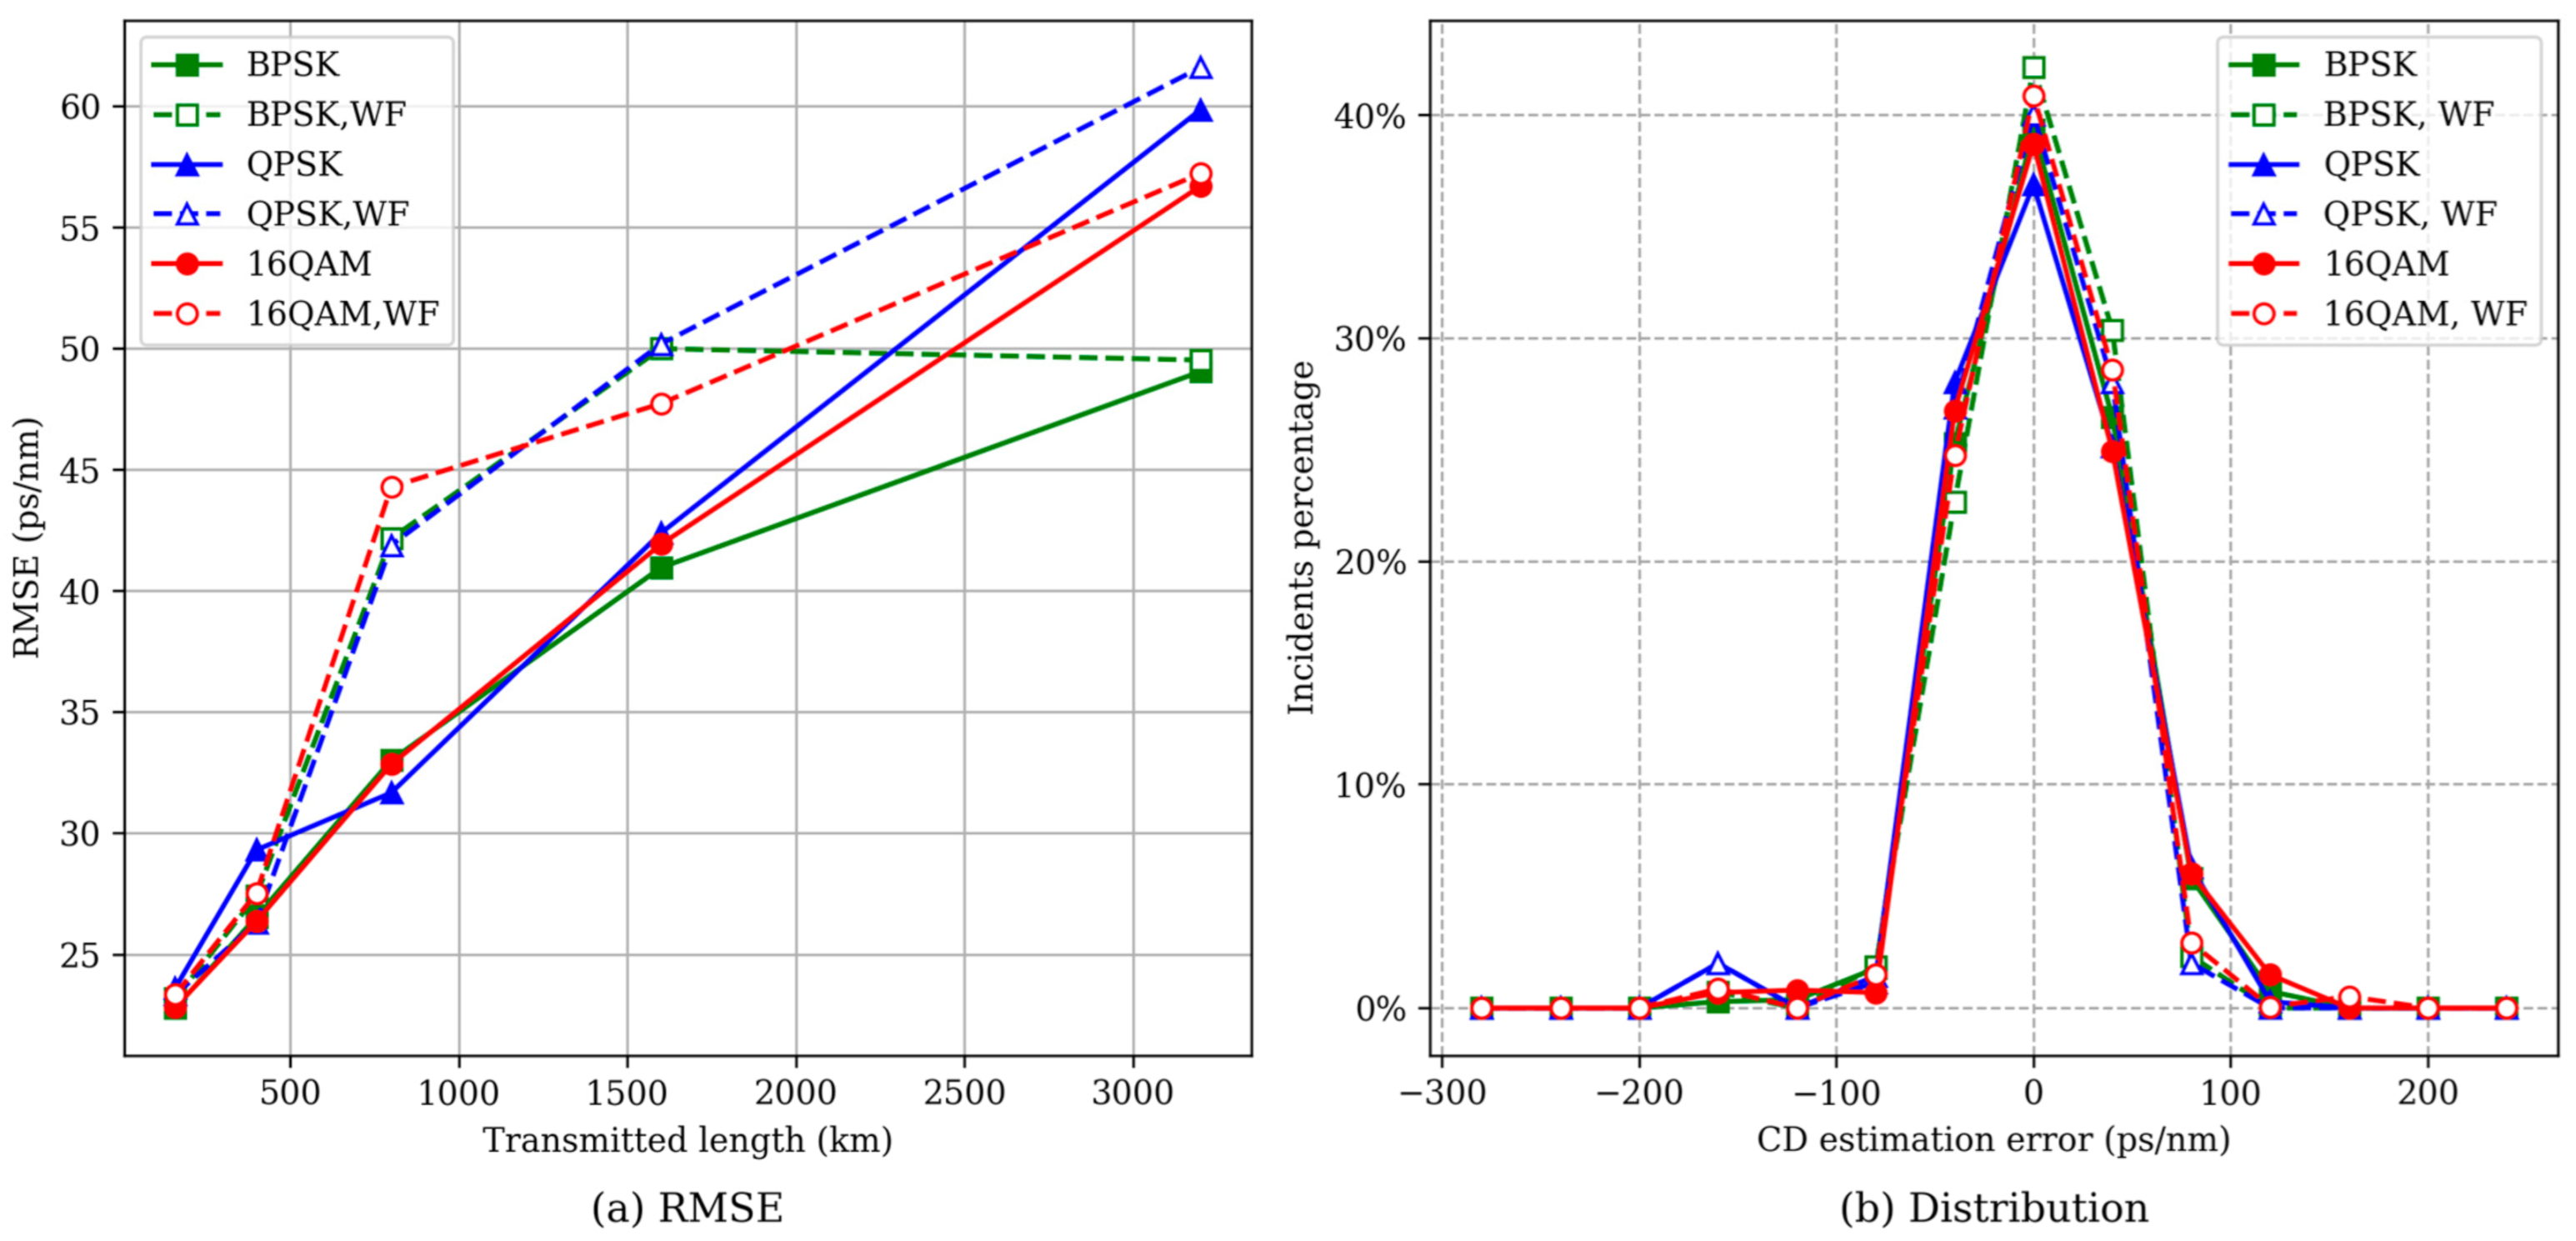
CD estimation results for BPSK, QPSK, 16QAM present in (a) RMSE results and (b) distribution.
Figure 9.
CD estimation results for BPSK, QPSK, 16QAM present in (a) RMSE results and (b) distribution.

Figure 10.
Histogram from 50 trials for 10-channel 28 GBaud PDM-QPSK system with SRRC pulse shaping at various values of the roll-off factor (β). (a) Distribution at oversampling ratio 16/7. (b) Success rate with respect to input length at various values of β and sample rate. SpS stands for samples per symbol.

Figure 11.
Experimental setup for 263.36 Gb/s PDM-16QAM transmission. VOA: variable optical attenuator; PS: polarization scrambler; AOS: acousto-optic switch; OBPF: optical band-pass filter; SMF: standard single-mode fiber; ICR: integrated dual polarization intradyne coherent receiver.
Figure 11.
Experimental setup for 263.36 Gb/s PDM-16QAM transmission. VOA: variable optical attenuator; PS: polarization scrambler; AOS: acousto-optic switch; OBPF: optical band-pass filter; SMF: standard single-mode fiber; ICR: integrated dual polarization intradyne coherent receiver.

Figure 12.
Experimental CD estimation results. (a) Scatter plot. The measurement results are shown in the collection of points. △: The squarer-based CD scanning; ◦: The PAPR-based CD scanning; □: The ACSPW method; +: The proposed method. The green dash line is used as a reference line for the true CD equals the estimated CD. (b) Distribution.

Figure 13.
Comparison of CD estimation methods. Experimental CD estimation for SRRC DP-16QAM after 240 and 3600 km with (a) proposed method, (b) ACSPW [17], (c) PAPR based best-match search [12], and (d) squarer based best-match search [11].

Figure 14.
Success rate with respect to (a) input length and (b) CD scanning step. The input length is measured at the scanning step of 150 ps/nm and the scanning step is measure at the input length of 32,768.
Figure 14.
Success rate with respect to (a) input length and (b) CD scanning step. The input length is measured at the scanning step of 150 ps/nm and the scanning step is measure at the input length of 32,768.

Figure 15.
RMSE performance of (a) CD estimation and (b) symbol rate estimation vs. OSNR.


Table 1.
Performance of CD estimation method for SRRC systems.
| β | Success Rate % | RMSE (ps/nm) | ||
|---|---|---|---|---|
| With Filter | w/o Filter | With Filter | w/o Filter | |
| 0.06 | 37.30 | 1.29 | 385.20 | 655.16 |
| 0.1 | 91.55 | 30.60 | 287.27 | 162.28 |
| 0.2 | 94.95 | 88.85 | 127.30 | 88.90 |
Table 2.
Performance of CD estimation using the input size of 32,768.
| Delay-and-Multiply | PAPR Best-Match | Squarer Best-Match | ACSPW | |
|---|---|---|---|---|
| RMSE (ps/nm) | 105.7 | 462.8 | 207.5 | 471.5 |
| Success Rate % | 100 | 98.3 | 100 | 100 |
Table 3.
Computation complexity comparison for the symbol rate and CD estimation.
| Method | Scanning Size (M) | FFT Size(N) | Additional Filtering Length | ||
|---|---|---|---|---|---|
| NRZ | SRRC | NRZ | SRRC | ||
| Delay-and-Multiply | 164 | 4096 | 25,000 | - | 32 |
| Squarer best-match | 350 | 6144 | 30,000 | 348 | 348 |
| ACSPW | 2 | 16,384 | 30,000 | - | 64 |
| Ionescu and Isautier [20] | 0.3 × 10⁶ | 524,288 | - | - | - |
Publisher’s Note: MDPI stays neutral with regard to jurisdictional claims in published maps and institutional affiliations. |
© 2021 by the authors. Licensee MDPI, Basel, Switzerland. This article is an open access article distributed under the terms and conditions of the Creative Commons Attribution (CC BY) license (http://creativecommons.org/licenses/by/4.0/).
Share and Cite
MDPI and ACS Style
Ba, J.; Huang, Z.; Shen, F.; Wei, J. Joint Estimation of Symbol Rate and Chromatic Dispersion Using Delayed Multiplier for Optical Performance Monitoring. Photonics 2021, 8, 58. https://0-doi-org.brum.beds.ac.uk/10.3390/photonics8020058
AMA Style
Ba J, Huang Z, Shen F, Wei J. Joint Estimation of Symbol Rate and Chromatic Dispersion Using Delayed Multiplier for Optical Performance Monitoring. Photonics. 2021; 8(2):58. https://0-doi-org.brum.beds.ac.uk/10.3390/photonics8020058
Chicago/Turabian StyleBa, Junhao, Zhiping Huang, Fangqi Shen, and Junyu Wei. 2021. "Joint Estimation of Symbol Rate and Chromatic Dispersion Using Delayed Multiplier for Optical Performance Monitoring" Photonics 8, no. 2: 58. https://0-doi-org.brum.beds.ac.uk/10.3390/photonics8020058
Note that from the first issue of 2016, this journal uses article numbers instead of page numbers. See further details here.