Communication

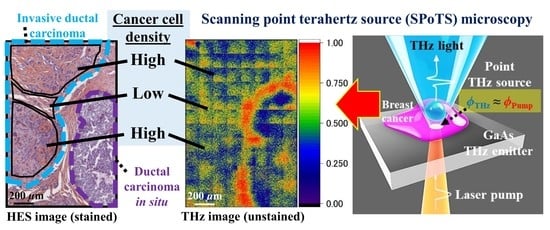
Label-Free Observation of Micrometric Inhomogeneity of Human Breast Cancer Cell Density Using Terahertz Near-Field Microscopy

1
Institute of Laser Engineering, Osaka University, 2-6 Yamadaoka, Suita, Osaka 565-0871, Japan
2
Integration: from Material to Systems Laboratory, UMR CNRS 5218, University of Bordeaux, 33400 Talence, France
3
Department of Pathology, Bergonié Institute, 33076 Bordeaux, France
*
Author to whom correspondence should be addressed.
Submission received: 25 March 2021 / Revised: 23 April 2021 / Accepted: 28 April 2021 / Published: 1 May 2021
(This article belongs to the Section Biophotonics and Biomedical Optics)

Abstract

:
Terahertz-light imaging is attracting great attention as a new approach in non-invasive/non-staining biopsy of cancerous tissues. Positively, terahertz light has been shown to be sensitive to the cell density, the hydration content, and the chemical composition of biological samples. However, the spatial resolution of terahertz imaging is typically limited to several millimeters, making it difficult to apply the technology to image biological tissues which have sub-terahertz-wavelength-scale inhomogeneity. For overcoming the resolution, we have recently developed a terahertz near-field microscope with a spatial resolution of 10 µm, named scanning point terahertz source (SPoTS) microscope. In contrast to conventional far-field terahertz techniques, this microscope features the near-field interactions between samples and point terahertz sources on a sub-terahertz-wavelength scale. Herein, to evaluate the usefulness of terahertz imaging in cancer tissue biopsy in greater detail, we performed terahertz near-field imaging of a paraffin-embedded human-breast-cancer section having sub-terahertz-wavelength-scale inhomogeneity of the cancer cell density using the SPoTS microscope. The observed terahertz images successfully visualized local (~250 µm) inhomogeneities of the cell density in breast invasive ductal carcinoma. These results may bypass the terahertz limitation in terms of spatial resolution and may further motivate the application of terahertz light to cancer tissue biopsy.

Graphical Abstract

1. Introduction

In recent years, there has been a significant increase in the number of cancers worldwide; the number of new cancer cases worldwide is predicted to reach 21.6 million by 2030 [1]. Therefore, it remains of capital importance to accurately, rapidly, quantitatively, and non-invasively identify cancerous lesions with their malignancy. The current golden standard for such diagnosis is the histopathology examination following tissue removal procedure [2]. During the inspection, the pathologist evaluates the stained tissue sections under a microscope. However, this method requires a complex process and well-trained pathologists, which poses challenges in terms of speed and objectivity. Recently, optical biopsy has been attracting much attention as a new method to achieve accurate, rapid, quantitative, and non-invasive histopathological diagnosis [2]. Such a method relies on the inspection of various tissue information, e.g., the morphology and the chemical composition, that can be analyzed with a cellular resolution by using multiple optical measurement techniques. For example, Raman spectroscopy and infrared spectroscopy can provide molecular information about the lesion, while optical coherence tomography can probe the lesion in depth [2].
Currently, as well as such optical techniques, terahertz light (Frequency: 0.1–30 THz) imaging is attracting great interest as a new approach for cancer tissue biopsy [3]. Biosensing with terahertz light has several advantages for pathological assessment. At first, it can detect differences in cell density associated with cancer cell proliferation [4]. The cell density is one of the important factors for quantitative cancer detection. Secondly, differences in tissue hydration level can be detected [5]. It was suggested that the hydration content in cancer lesions is higher than that found in normal tissues [6]. Finally, it is possible to detect molecular information related to cancer lesions. It has been reported that tryptophan, a protein related to the degree of proliferation of cancer cells, absorbs terahertz light whose frequency is around 1.4 THz [7], while cancer methylated DNA has an absorption peak around 1.6 THz [8]. In addition, terahertz light has a low risk to ionize and damage biological samples at the power commonly used for terahertz biosensing, owing to its low photon energy (1 THz ≈ 4 meV) [9]. Terahertz imaging thus can visualize morphological, physiological, and some-molecular-complex information of biological tissues [10]. These advantages may make it possible to detect various cancer lesions, accurately, rapidly, quantitatively, and non-invasively without stain process required in conventional optical imaging [11,12,13,14,15,16]. Although the terahertz technology is expected to play an important role in the biopsy for cancer tissues, its low spatial resolution is one of the critical limitations. The resolution of terahertz imaging, which is dictated by the diffraction limit, is usually of a few millimeters. Hence, terahertz imaging can hardly resolve entities at the cellular level, and suffers from sub-terahertz-wavelength-scale inhomogeneity of the biological samples [17,18]. Consequently, the use of such a technology for tissue biopsy remains under study. In recent years, to solve the problem, researchers have proposed various high-spatial-resolution terahertz microscopes, employing subwavelength apertures/tips [19,20], attenuated total reflection [18], solid immersion lens [10], photonic jet [21], waveguides [22], or detectors close to a sample [23,24]. While the advanced terahertz systems have successfully enhanced spatial resolution up to nanometric level, most of them require sub-wavelength probes (long scanning time, severe optical alignment) and/or high-performance terahertz emitters/detectors (high cost, large). These drawbacks make it difficult to apply the terahertz microscopes to biomedical imaging.
To realize microscopic terahertz biomedical imaging, we have developed a near-field optical microscope with terahertz light named scanning point terahertz source (SPoTS) microscope [25,26]. In this microscope, terahertz light is generated in the process of optical rectification by irradiating a nonlinear optical crystal (NLOC) with femtosecond (fs) laser pulses. By focusing the laser beam near the NLOC surface, a point terahertz source with a diameter close to the laser beam is generated. Since the spatial resolution of the SPoTS microscope is not determined by the wavelength of terahertz light but by that of fs laser, terahertz microscopic imaging can be performed with micrometer-scale spatial resolution by setting the samples near the point terahertz source. Moreover, high-speed terahertz imaging is done by two-dimensional scanning of the point terahertz source with a galvanometer. Indeed, we have achieved transmission/reflection terahertz imaging with a spatial resolution of 10 μm, a broad frequency range up to ~3 THz, a dynamic range of ~500, and a maximum imaging speed of 4 s/image (128 × 128 pixels) [25,26]. Thus, unlike the abovementioned terahertz microscopes, the SPoTS microscope enables high-speed micrometric-spatial-resolution terahertz imaging without sub-wavelength probes and expensive large terahertz components. It indicates that the SPoTS method provides more practical (high-speed, lower-cost, compact, and simply measurable) terahertz near-field microscopy and therefore be suitable for biomedical imaging. We have already demonstrated terahertz microscopy on various biological samples [25,26,27,28,29,30]. Particularly, in our recent study, it was found that paraffin-embedded ductal carcinoma in situ (DCIS), which is a small (50–500 µm), early-stage human breast cancer, can be distinguished from invasive ductal carcinoma (IDC) and benign tissues in terahertz near-field images [31]. The discrimination was achieved based on the micrometric differences in cell densities found within the biological samples. Although most studies of terahertz cancer imaging to date have only measured macroscopic differences in cell density above the millimeter level [4,32,33,34], our previous results indicate that such terahertz cancer detection based on the cell density can be conducted at the micrometric level using the SPoTS microscopy. On the other hand, we focused only on the discrimination between different types of cancer lesions (DCIS and IDC) in the previous study [31].
In this study, to evaluate the usefulness of terahertz microscopic imaging for cancer tissue biopsy in greater detail, we demonstrated the visualization of subwavelength-scale inhomogeneity of cancer cell densities in a single type of human cancer lesion using the SPoTS microscope. Concretely, we performed near-field terahertz imaging on paraffin-embedded human breast cancer tissues (invasive ductal carcinoma), which have the inhomogeneity of cancer cell densities. In addition, by conducting pixel analysis of obtained terahertz near-field images, we quantitatively evaluated the terahertz microscopic attenuation against cell density. As a result, it is found that the micrometric (several hundred microns) inhomogeneity of the cancer cell densities can be visualized in the terahertz images in both transmission and reflection modes. This outcome may break through the limitation of terahertz imaging in terms of the spatial resolution and may open up the possibility of the terahertz technology for cancer tissue biopsy.

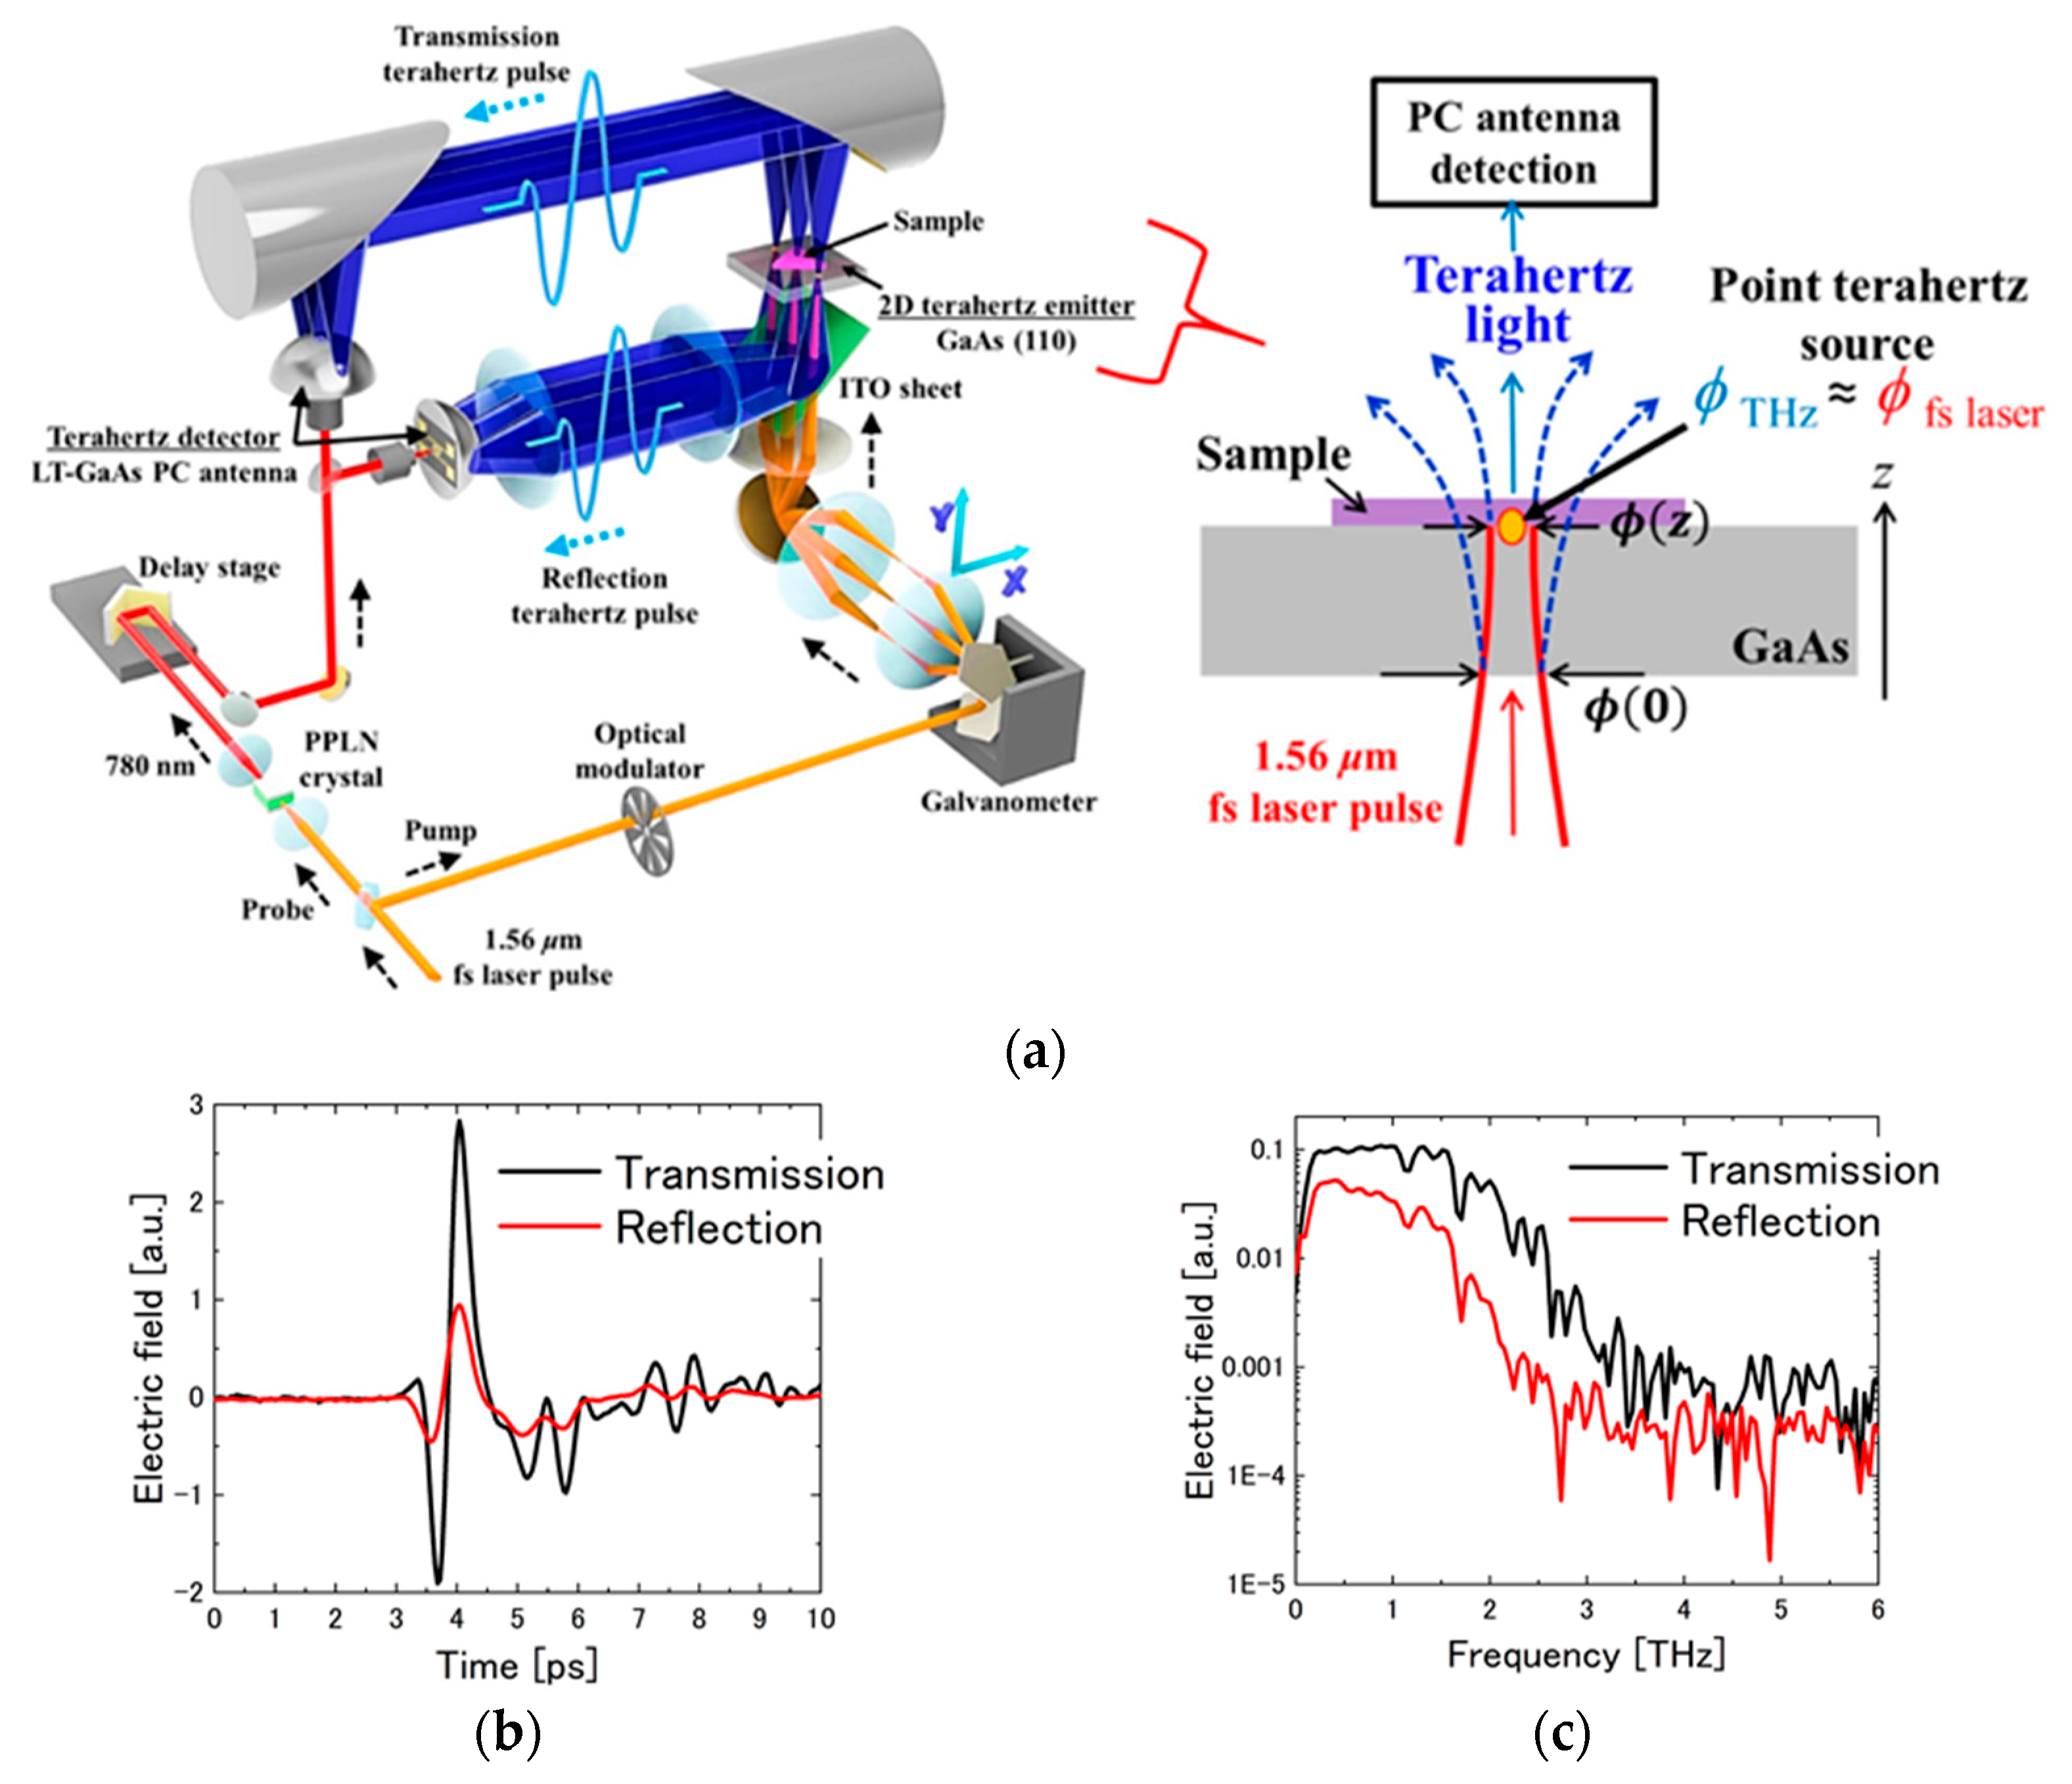
2. Setup of Terahertz Near-Field Microscopy System

Figure 1a shows the schematic illustration of the SPoTS microscope. The optical source for terahertz-light generation and detection is a femtosecond (fs) fiber laser (TOPTICA FemtoFiber pro IR: center wavelength of 1.56 µm, maximum power of 350 mW, pulse width of 100 fs, and repetition rate of 80 MHz). The laser beam is divided into pump and probe beams. The pump pulse is modulated via an optical modulator and irradiates a (110)-oriented GaAs crystal with a 500-µm-thickness for terahertz generation [35]. The pump pulse is focused near the upper surface of the crystal, and thereby a point terahertz source is created at the laser-focusing spot of approximately ϕ10 μm by optical rectification effect [36]. The measured sample is placed in the near-field domain of the point source, i.e., on the upper surface of the GaAs crystal. Then, the localized, intense-terahertz pulse beam emitted from the source is transmitted through the sample, or is reflected at the interface between the sample and the GaAs crystal. Note that the beam diameter of the generated terahertz pulse beam ϕ(z) is defined as ϕ ( z ) = ϕ ( 0 ) 1 + { λ THz ·   z / ( π · ϕ ( 0 ) ) } 2 , where z, ϕ(0), and λTHz are distance from the bottom face of the GaAs crystal, initial terahertz beam diameter and center wavelength of incident terahertz beam, respectively. From this equation, it is necessary to obtain higher spatial resolution by shortening the propagation distance of terahertz light inside the crystal; thinner crystals and focusing the laser beam at the output surface of the crystal by using a high NA lens are desired [25]. The terahertz light is eventually detected by a spiral-shaped low-temperature-grown (LT-) GaAs photoconductive antenna (PCA). The detector is driven by the probe pulse, whose wavelength is converted from 1.56 µm to 780 nm by a periodically poled-LiNbO3 (PPLN) crystal. We can obtain terahertz transmission and reflection time-domain waveforms of the sample by monitoring the amplitude of the terahertz pulses while moving a delay stage. Figure 1b shows typical terahertz time-domain waveforms in transmission and reflection mode obtained at the GaAs bare region (i.e., no sample). Their corresponding frequency spectra are also shown in Figure 1c. The terahertz light pulses obtained in transmission and reflection modes have broad frequency ranges up to 4 THz and 2.5 THz, respectively. It is noted that the remarkable absorption peaks, observed at 1.17 THz and 1.66 THz, are due to water vapor [37]. In terahertz imaging measurement, the delay-stage is fixed at the highest positive peak of the terahertz time-domain waveform (around 4 ps in Figure 1b). The terahertz imaging is performed by the high-speed two-dimensional scanning of the point terahertz source over the GaAs in the XY direction using a galvanometer. Before the measurements, we evaluated the spatial resolution of the SPoTS microscope. Figure 2a shows the terahertz reflection image of a 9 μm gold interdigitate structure fabricated on the GaAs crystal. The metallic and bare GaAs regions were clearly visualized on a micrometer scale. This provides the evidence that the spatial resolution of the SPoTS microscope is correlated with the beam diameter of the focused laser beam (ϕ10 μm). The similar image could be also observed in the transmission mode (Not shown here). Thus, terahertz imaging with a spatial resolution of 10 µm is possible in both transmission and reflection modes. In addition, since the laser beams are scanned over the GaAs crystal two dimensionally and the generated terahertz beams are guided to the one-dimensional PCA detector, the field-of-view (FOV) of the microscope is limited. Figure 2b,c show the terahertz transmission images when no samples are set on the GaAs crystal in wide (1.1 mm × 1.1 mm) and narrow (280 μm × 280 μm) scanning modes, respectively. Line profiles along the white dashed lines inserted in the terahertz images are shown above the images. As can be seen, the uniform terahertz background signals are limited to an area of approximately 280 µm × 280 µm. Therefore, the field-of-view (FOV) of the microscope is estimated to be approximately 280 µm × 280 µm. This makes difficult to image large scale samples. Therefore, acquisition of the terahertz image beyond the FOV is conducted by the combination of several terahertz images in the size of the FOV. In the measurements, the terahertz image at the bare region of the GaAs is firstly measured as a reference and then the terahertz images at the sample regions are measured. Finally, a differential image between those two images are calculated. The details of the SPoTS microscope and image acquisition process are described in our previous reports [25,26,31].

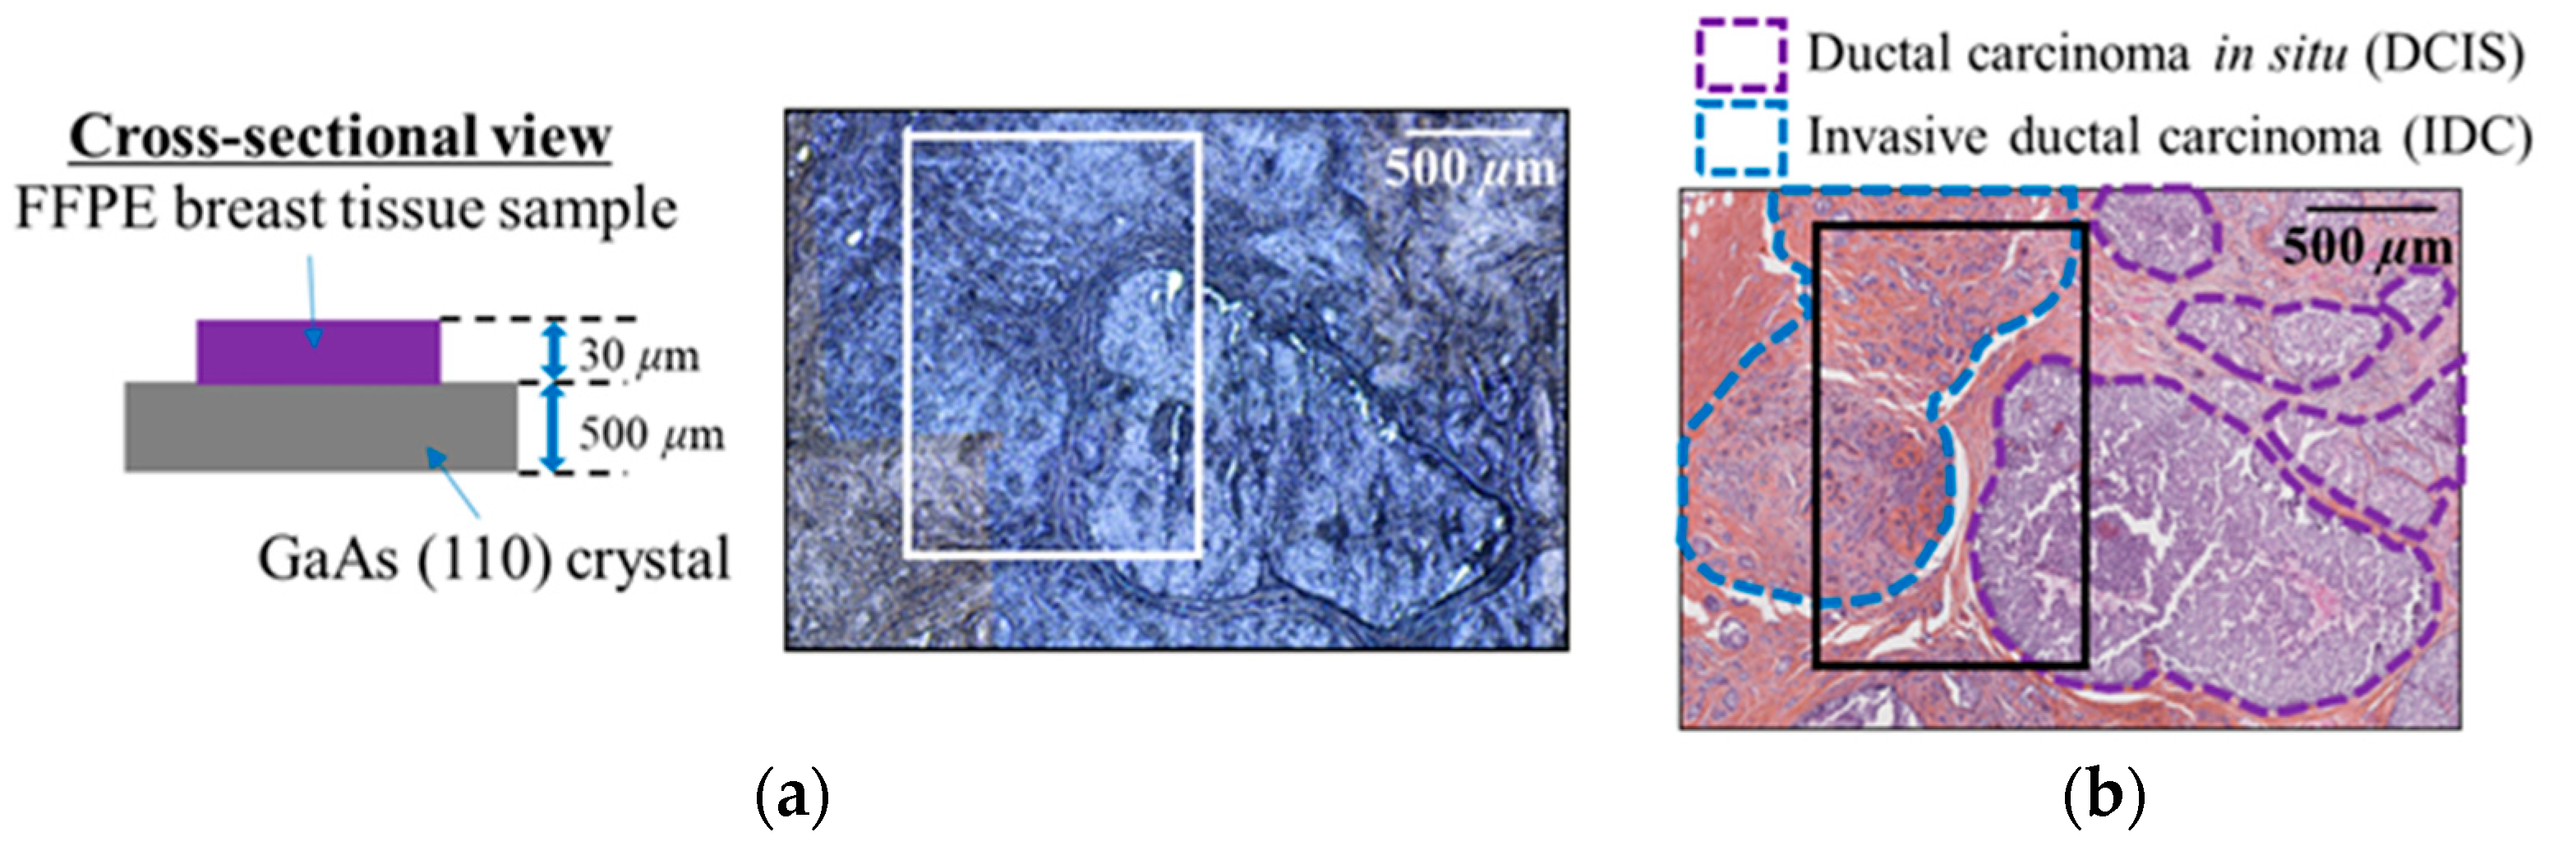
3. Sample Information

To obtain good coupling of terahertz light and tissue samples, we employed a formalin-fixed paraffin-embedded (FFPE) human breast cancer tissue directly deposited on the GaAs terahertz-emitter crystal. Figure 3a shows an optical image of a 30-μm-thick FFPE human breast tissue section deposited on a 500-μm-thick GaAs crystal as well as its cross-sectional view. The breast tissue sample was excised from a 44-year-old woman. The formalin-fixation and paraffin-embedding technique was used for the preservation of the tissue sample without alteration for a relatively long time [38]. Figure 3b presents the corresponding hematoxylin, eosin, and saffron (HES) section of the sample. Pink-stained regions depict cell cytoplasms. Orange/yellow regions correspond to fibro-collagenous tissue. Purple-stained areas denote the presence of nucleic acids/nuclei, and white regions correspond to adipose tissues and/or retraction artifacts. As seen in the stained image, the sample includes DCIS and IDC that are pathologically identified, and other normal tissues such as collagen fibers and retraction artifacts. Note that lipids were purged from the adipose tissues, during the clearing process. The type of invasive carcinoma is hormone-receptor-positive/ERBB2-negative [39]. In this study, terahertz imaging was performed on a region of the unstained-tissue sample highlighted by white solid lines in Figure 3a. This region contains fibrosis, retraction artifacts, DCIS, and IDC having micrometric inhomogeneity of cancer cell densities, according to Figure 3b.

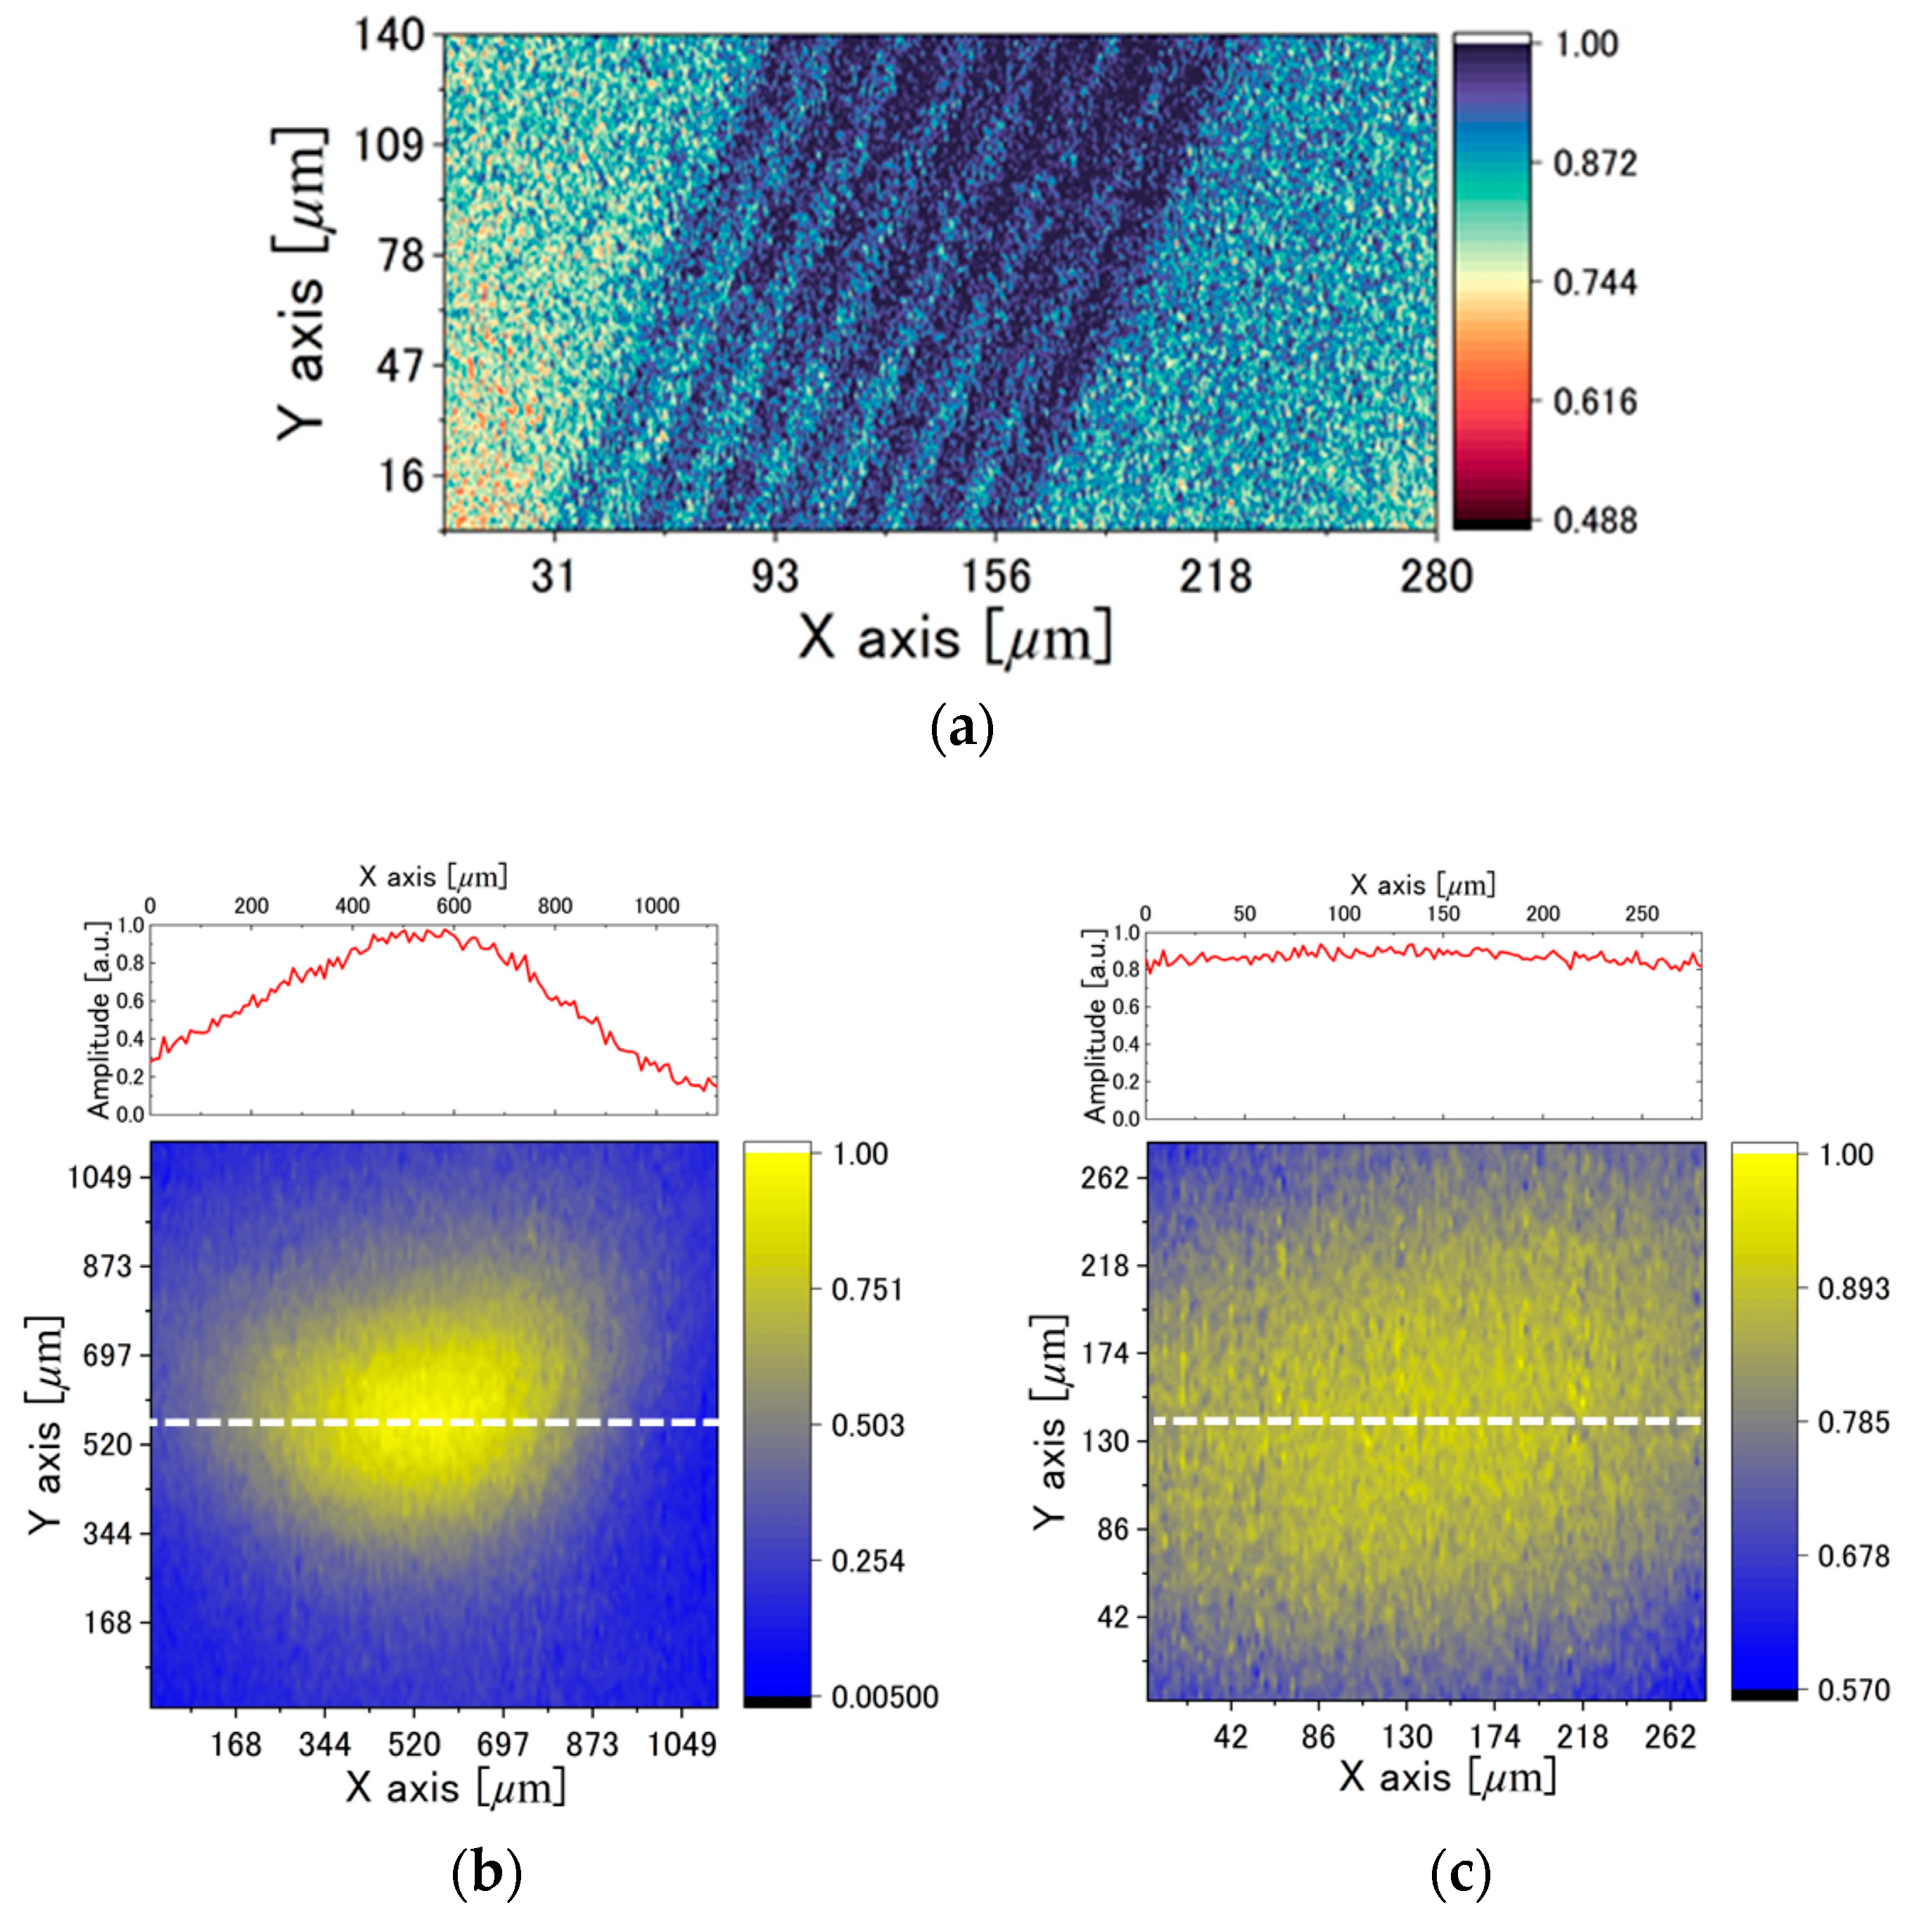
4. Results and Discussion

Figure 4 shows the (a) HES-stained, (b) optical, and (c) terahertz transmission images of the tissue area highlighted in Figure 3. In the HES image, DCIS and IDC lesions are highlighted by purple and blue dashed lines, respectively. Fibrous-tissue region corresponds to the orange/yellow-stained area between the two malignant structures. At first, in the terahertz transmission image of Figure 4c, it is found that the terahertz amplitudes are lower in the cancerous tissues than in the fibrous tissue (benign tissue area), and the fibrous region approximately 100 µm wide between the DCIS and the IDC is clearly visualized. In the cancerous lesions, the terahertz amplitudes in the DCIS region tend to be smaller than those in the IDC region, and inhomogeneous terahertz amplitude distribution is observed in each region. For clarity of these points, we applied a histogram-equalization process, which is one of the well-known methods for enhancing the contrast of digital images [40], to the terahertz image of Figure 4c. Figure 4d shows the histogram-equalized terahertz transmission image reproduced by commercial software (Origin Pro 2021). Compared with the original image of Figure 4c, we are able to more effectively visualize the distinction between the IDC region and the DCIS region as well as the inhomogeneities of the terahertz amplitude distribution in each region. In the DCIS compartment, terahertz amplitudes are locally high in the area designated by the white dashed box in Figure 4d. This may be affected by an abnormal paraffin state, probably arising from some paraffin removal in the region during the sample fabrication. Indeed, in the corresponding area highlighted by the white dashed box in the optical image of Figure 4b, there is something like a crack. On the other hand, especially at the edge of the DCIS (closer to the fibrous region), terahertz amplitudes are lower than in other regions. In the IDC compartment, although there are no such noticeable artifacts, terahertz amplitudes increase in the central area with a size of several hundred microns, highlighted by the white dashed circle in Figure 4d. From Figure 4e displaying a line profile along the yellow dotted line inserted in the image, it is estimated that the width of the central area is approximately 250 µm. To investigate these phenomena in detail, we divided the IDC lesion into three regions (IDC 1-3) as depicted in Figure 4a. In addition, as shown in Figure 4f, we calculated the average pixel values (APVs) of the terahertz amplitudes of the corresponding regions in the terahertz image of Figure 4c. The error bars show their standard deviations (SDs). Concretely, the APVs with their SDs for the different tissues are as follows. (The numbers in parentheses indicate the total number of pixels used in the average calculation. The pixels corresponding to the area of the aforementioned artifacts in the DCIS were excluded from the calculation.) DCIS: 0.369 ± 0.0577 (209,111), IDC 1: 0.383 ± 0.0601 (212,666), IDC 2: 0.380 ± 0.0502 (271,569), IDC 3: 0.406 ± 0.0467 (36,954), Fibrous: 0.464 ± 0.0580 (62,176). It can be quantitatively understood that the APVs become smaller in the order of DCIS < IDC < Fibrous. We also found that the APV in IDC 3 is approximately 0.02 higher than those in IDC 1 and IDC 2. For IDC 1 and IDC 2, the difference in the APVs is 0.003.
Next, Figure 4g presents the reflection terahertz image of the tissue area highlighted in Figure 3. Contrary to the transmission one, it is found that the terahertz amplitudes are higher in the cancer tissues than in the fibrous tissue. Interestingly, the amplitudes in the IDC 3 are lower than the other IDC areas, allowing a clear distinction between the IDC 3 and other IDC region without the histogram-equalization used in the transmission mode. Figure 4h shows a line profile along the yellow dotted line inserted in the terahertz image. Despite a lack of the histogram-equalization, we can estimate that the width of the IDC 3 is approximately 250 µm, which is consistent with the transmission results. As in the transmission image, the inhomogeneous terahertz amplitude distribution in the DCIS region was also observed. The APVs corresponding to the DCIS, IDC (1-3), and fibrous regions in the reflection image are presented in Figure 4i, as well as their SDs. The APVs with their SDs for the different tissues are DCIS: 0.442 ± 0.1006 (33,130), IDC 1: 0.441 ± 0.0944 (34,328), IDC 2: 0.426 ± 0.0958 (44,146), IDC 3: 0.363 ± 0.0869 (7114), Fibrous: 0.348 ± 0.0909 (32,595). In the data, the APVs become higher in the order of DCIS > IDC > Fibrous. In addition, the APV of IDC 3 is more than 0.05 lower than that of IDC 1 and IDC 2. Further, the value of IDC 1 is 0.015 higher than that of IDC 2. It is noticed that the SD values of the tissue APVs are large with respect to the aforementioned differences between the APVs. In order to more accurately confirm that these APV differences are relevant, additional experiments with a larger set of samples will be required.
The above results show that the terahertz reflection imaging can distinguish three tissue regions more sensitively compared to the transmission imaging, and the attenuation of terahertz light increases in the order of DCIS > IDC > fibrous tissue. It is also found that the degree of the terahertz attenuation differs depending on the location within the IDC with several hundred microns. Regarding the IDC 1 and the IDC 2, the terahertz attenuation is higher in IDC 1 in the reflection data while it is almost the same in the two regions in the transmission data. To discuss the cause of these results, we prepared the HES-stained images at the cellular level of each region as shown in Figure 5. Each region corresponds to the area highlighted by the yellow box in Figure 4a. Here, we focus on the cell nucleus in the size of approximately 5 µm, which is stained in purple. In the cancerous area, the cell density is high owing to abnormal proliferation of malignant cells, and therefore the cell nuclear density also tends to be high compared to benign tissue. As seen in Figure 5a, the DCIS compartment is filled with many cancer cell nuclei, and the density of cell nuclei is the highest among all tissues. On the contrary, the fibrous (benign) tissue in Figure 5e has the lowest density of the cell nucleus. This region is almost completely filled with orange-stained collagen fibers and contains sparse stromal cells characterized by their small purple nuclei. The IDC compartment has a nuclear density intermediate between the DCIS and the fibrous tissue, as shown in Figure 5b–d; however, there are differences (inhomogeneity) in the cancer cell nuclear density in IDC 1, 2, and 3. Specifically, the cell-nuclear density increases in the order of DCIS > IDC 1 > IDC 2 > IDC 3 > Fibrous tissue. Since the cell nucleus contains a large number of nucleic acids in a small area, they are denser than other biological components [41]. This would lead to higher attenuation (absorption and/or scattering) of terahertz light in regions with high cell nuclear density. In fact, many terahertz imaging studies of various paraffin-embedded cancer tissues have reported that there is a correlation between cell nuclear density and terahertz response [4,32,33,34]. Hence, the phenomenon that the terahertz attenuation increases in the order of DCIS > IDC 1,2 > IDC 3 > Fibrous tissue is considered to be primarily attributed to the cell density. Particularly, the IDC 3 area of which width is approximately 250 µm was successfully distinguished from other IDC areas thanks to high-spatial-resolution terahertz imaging. It indicates the SPoTS microscopy can evaluate sub-terahertz-wavelength-scale inhomogeneity of the cancer cell density. As for IDC 1 and IDC 2, because IDC 1 has a slightly higher nuclear density than IDC 2, the terahertz attenuation in the IDC 1 is expected to be higher than that in the IDC 2. In the reflection data, the terahertz attenuation is indeed higher in IDC 1. However, in the transmission data, the attenuations in the two regions are almost the same. This may be due to heterogeneity in the paraffin embedding over the sample; transmission measurement is susceptible to such artifacts because the configuration has a longer interaction length between terahertz light and the sample than the reflection configuration. The phenomenon indicates that the sensitivity in the reflection mode is better than that in the transmission mode. Other factors such as certain biomarker proteins may affect the result, but we have not yet identified them. It will clarify the factors by conducting detailed analysis in combination with existing technologies such as principal components analysis in the future [42].
Finally, by conducting terahertz near-field imaging with the SPoTS microscope, we succeeded in label-free visualization of sub-terahertz-wavelength scale (~250 µm) inhomogeneity of the cancer cell densities in a single type of cancer lesion (IDC). Reflection imaging, since it is less affected by sample artifacts, achieved the mapping of the inhomogeneity more accurately than transmission imaging. Although the accuracy of the transmission imaging is rather low at this time, the image processing (histogram equalization) allowed us to observe the inhomogeneity more clearly. These results indicate that the terahertz microscopic imaging technique may be useful for label-free tissue biopsy.

5. Conclusions

To examine the utility of terahertz imaging in a cancer tissue biopsy, we performed terahertz near-field imaging of paraffin-embedded human breast cancer tissue using the SPoTS microscope with 10 µm spatial resolution, focusing on the label-free observation of sub-terahertz-wavelength-scale inhomogeneity of cancer cell density in a single type of cancer lesion. It is found that both transmission and reflection terahertz near-field images allowed us to visualize micrometric (~250 µm) inhomogeneities of cancer cell density in IDC lesion without staining. In the transmission imaging measurement, the accuracy of the tissue evaluation was improved by performing the histogram-equalization process on the acquired images, while in the reflection imaging measurement, it was found that sufficient tissue evaluation can be performed without the image processing. In this study, we measured paraffin-embedded samples used for post-operative pathological assessment, but it will be necessary to measure hydrated tissue samples for practical applications such as intraoperative biopsy. For this purpose, we need to improve the performance of the SPoTS microscope and to increase the spatial resolution of acquired images by introducing artificial-intelligence technology. In addition, precise determination of optical constants of biological tissues in the terahertz regime on a sub-terahertz wavelength scale may also be achieved for detailed analysis of cancer tissues. Such attempts may enable micrometric-scale characterization not only of cell density, but also of other cancer-related information (e.g., tissue hydration level and specific biomarker proteins) using terahertz imaging technique without stain process required in conventional diagnostics. The results obtained in this study, which are still preliminary data, could overcome the challenge of terahertz imaging in terms of the spatial resolution and could motivate the application of terahertz imaging for tissue biopsy for cancer detection and other microscopic biomedical research.

Author Contributions

K.S., M.T. and P.M. conceptualized the study. G.M., Q.C., J.-P.G. and P.M. fabricated and prepared the breast tissue sample. G.M. performed histological assessment of the sample. K.S., M.T. and H.M. designed the scanning point terahertz source microscope, and K.S. and K.O. built its microscopy system. K.O. carried out the terahertz imaging measurements of the sample. All authors discussed the results. K.O. wrote the main manuscript, and K.S., Q.C., G.M., P.M. and M.T. contributed to writing. All authors have read and agreed to the published version of the manuscript.

Funding

This work was partially supported by JSPS KAKENHI (Grant Numbers JP18H01499, JP20H00247, JP20K20536) and New Aquitania Region, France.

Institutional Review Board Statement

Human tissue analysis and measurements were performed in view of the fundamental ethical principles stipulated in the Declaration of Helsinki and its subsequent revisions. Samples were used in accordance with the ethical regulations of the Bergonié Institute Tissue Bank.

Informed Consent Statement

Written informed consent from each patient undergoing breast surgery was collected, stipulating their agreement regarding the use of their tissues for research purposes.

Data Availability Statement

The data in this paper are available from the corresponding author on request.

Conflicts of Interest

The authors declare no conflict of interest.

References

  1. Bray, F.; Soerjomataram, I. The Changing Global Burden of Cancer: Transitions in Human Development and Implications for Cancer Prevention and Control. In Cancer: Disease Control Priorities, 3rd ed.; Gelband, H., Jha, P., Sankaranarayanan, R., Horton, S., Eds.; The International Bank for Reconstruction and Development/The World Bank: Washington, DC, USA, 2015; Volume 3. [Google Scholar]
  2. Meyer, T.; Schmitt, M.; Guntinas-Lichius, O.; Popp, J. Toward an all-optical biopsy. Opt. Photonics News 2019, 30, 26–33. [Google Scholar] [CrossRef]
  3. Son, J.H.; Oh, S.J.; Cheon, H. Potential clinical applications of terahertz radiation. J. Appl. Phys. 2019, 125, 190901. [Google Scholar] [CrossRef]
  4. Oh, S.J.; Kim, S.H.; Ji, Y.B.; Jeong, K.; Park, Y.; Yang, J.; Park, D.W.; Noh, S.K.; Kang, S.G.; Huh, Y.M.; et al. Study of freshly excised brain tissues using terahertz imaging. Biomed. Opt. Express 2014, 5, 2837–2842. [Google Scholar] [CrossRef] [PubMed] [Green Version]
  5. Smolyanskaya, O.; Chernomyrdin, N.; Konovko, A.; Zaytsev, K.; Ozheredov, I.; Cherkasova, O.; Nazarov, M.; Guillet, J.-P.; Kozlov, S.; Kistenev, Y.; et al. Terahertz biophotonics as a tool for studies of dielectric and spectral properties of biological tissues and liquids. Prog. Quantum Electron. 2018, 62, 1–77. [Google Scholar] [CrossRef]
  6. McIntyre, G.I. Cell hydration as the primary factor in carcinogenesis: A unifying concept. Med. Hypotheses 2006, 66, 518–526. [Google Scholar] [CrossRef] [PubMed]
  7. Özer, Z.; Gök, S.; Altan, H.; Severcan, F. Concentration-based measurement studies of L-tryptophan using terahertz time-domain spectroscopy (THz-TDS). Appl. Spectrosc. 2014, 68, 95–100. [Google Scholar] [CrossRef] [PubMed]
  8. Cheon, H.; Yang, H.J.; Lee, S.H.; Kim, Y.A.; Son, J.H. Terahertz molecular resonance of cancer DNA. Sci. Rep. 2016, 6, 37103. [Google Scholar] [CrossRef] [Green Version]
  9. Cheon, H.; Yang, H.J.; Son, J.H. Toward clinical cancer imaging using terahertz spectroscopy. IEEE J. Sel. Top. Quantum Electron. 2017, 23, 1–9. [Google Scholar] [CrossRef]
  10. Chernomyrdin, N.V.; Kucheryavenko, A.S.; Kolontaeva, G.S.; Katyba, G.M.; Karalkin, P.A.; Parfenov, V.A.; Gryadunova, A.A.; Norkin, N.E.; Smolyanskaya, O.A.; Minin, O.A.; et al. A potential of terahertz solid immersion microscopy for visualizing sub-wavelength-scale tissue spheroids. Proc. SPIE 2018, 10677, 106771Y. Available online: https://www.spiedigitallibrary.org/conference-proceedings-of-spie/10677/2306132/A-potential-of-terahertz-solid-immersion-microscopy-for-visualizing-sub/10.1117/12.2306132.short?SSO=1 (accessed on 19 April 2021).
  11. Grootendorst, M.R.; Fitzgerald, A.J.; Brouwer de Koning, S.G.; Santaolalla, A.; Portieri, A.; Van Hemelrijck, M.; Young, M.R.; Owen, J.; Cariati, M.; Pepper, M.; et al. Use of a handheld terahertz pulsed imaging device to differentiate benign and malignant breast tissue. Biomed. Opt. Express 2017, 8, 2932–2945. [Google Scholar] [CrossRef] [Green Version]
  12. Cassar, Q.; Caravera, S.; MacGrogan, G.; Bücher, T.; Hillger, P.; Pfeiffer, U.; Zimmer, T.; Guillet, J.P.; Mounaix, P. Terahertz refractive index-based morphological dilation for breast carcinoma delineation. Sci. Rep. 2021, 11, 6457. [Google Scholar] [CrossRef] [PubMed]
  13. Joseph, C.S.; Patel, R.; Neel, V.A.; Giles, R.H.; Yaroslavsky, A.N. Imaging of ex vivo nonmelanoma skin cancers in the optical and terahertz spectral regions optical and terahertz skin cancers imaging. J. Biophotonics 2014, 7, 295–303. [Google Scholar] [CrossRef] [PubMed]
  14. Sim, Y.C.; Park, J.Y.; Ahn, K.M.; Park, C.; Son, J.H. Terahertz imaging of excised oral cancer at frozen temperature. Biomed. Opt. Express 2013, 4, 1413–1421. [Google Scholar] [CrossRef]
  15. Ji, Y.B.; Park, C.H.; Kim, H.; Kim, S.H.; Lee, G.M.; Noh, S.K.; Jeon, T.I.; Son, J.H.; Huh, Y.M.; Haam, S.; et al. Feasibility of terahertz reflectometry for discrimination of human early gastric cancers. Biomed. Opt. Express 2015, 6, 1398–1406. [Google Scholar] [CrossRef] [PubMed] [Green Version]
  16. Ji, Y.B.; Oh, S.J.; Kang, S.G.; Heo, J.; Kim, S.H.; Choi, Y.; Song, S.; Son, H.Y.; Kim, S.H.; Lee, J.H.; et al. Terahertz reflectometry imaging for low and high grade gliomas. Sci. Rep. 2016, 6, 1–9. [Google Scholar] [CrossRef] [PubMed] [Green Version]
  17. Bowman, T.C.; El-Shenawee, M.; Campbell, L.K. Terahertz imaging of excised breast tumor tissue on paraffin sections. IEEE Trans. Antennas Propag. 2015, 63, 2088–2097. [Google Scholar] [CrossRef]
  18. Barr, L.E.; Karlsen, P.; Hornett, S.M.; Hooper, I.R.; Mrnka, M.; Lawrence, C.R.; Phillips, D.B.; Hendry, E. Super-resolution imaging for sub-IR frequencies based on total internal reflection. Optica 2021, 8, 88–94. [Google Scholar] [CrossRef]
  19. Adam, A.J.L.; Brok, J.M.; Seo, M.A.; Ahn, K.J.; Kim, D.S.; Kang, J.H.; Park, Q.H.; Nagel, M.; Planken, P.C.M. Advanced terahertz electric near-field measurements at sub-wavelength diameter metallic apertures. Opt. Express 2008, 16, 7407–7417. [Google Scholar] [CrossRef] [PubMed] [Green Version]
  20. Yang, Z.; Tang, D.; Hu, J.; Tang, M.; Zhang, M.; Cui, H.L.; Wang, L.; Chang, C.; Fan, C.; Li, J. Near-Field Nanoscopic Terahertz Imaging of Single Proteins. Small 2021, 17, 2005814. [Google Scholar] [CrossRef] [PubMed]
  21. Nguyen Pham, H.H.; Hisatake, S.; Minin, O.V.; Nagatsuma, T.; Minin, I.V. Enhancement of spatial resolution of terahertz imaging systems based on terajet generation by dielectric cube. APL Photonics 2017, 2, 056106. [Google Scholar] [CrossRef] [Green Version]
  22. Awad, M.; Nagel, M.; Kurz, H. Tapered Sommerfeld wire terahertz near-field imaging. Appl. Phys. Lett. 2009, 94, 051107. [Google Scholar] [CrossRef]
  23. Blanchard, F.; Doi, A.; Tanaka, T.; Hirori, H.; Tanaka, H.; Kadoya, Y.; Tanaka, K. Real-time terahertz near-field microscope. Opt. Express 2011, 19, 8277–8284. [Google Scholar] [CrossRef] [PubMed] [Green Version]
  24. Li, Z.; Yan, S.; Zang, Z.; Geng, G.; Yang, Z.; Li, J.; Wang, L.; Yao, C.; Cui, H.L.; Chang, C. Single cell imaging with near-field terahertz scanning microscopy. Cell Prolif. 2020, 53, e12788. [Google Scholar] [CrossRef] [PubMed]
  25. Serita, K.; Mizuno, S.; Murakami, H.; Kawayama, I.; Takahashi, Y.; Yoshimura, M.; Mori, Y.; Darmo, J.; Tonouchi, M. Scanning laser terahertz near-field imaging system. Opt. Express 2012, 20, 12959–12965. [Google Scholar] [CrossRef] [PubMed]
  26. Okada, K.; Serita, K.; Zang, Z.; Murakami, H.; Kawayama, I.; Cassar, Q.; MacGrogan, G.; Guillet, J.P.; Mounaix, P.; Tonouchi, M. Scanning laser terahertz near-field reflection imaging system. Appl. Phys. Express 2019, 12, 122005. [Google Scholar] [CrossRef]
  27. Serita, K.; Murakami, H.; Kawayama, I.; Takahashi, Y.; Yoshimura, M.; Mori, Y.; Tonouchi, M. Evaluation of human hairs with terahertz wave. Opt. Eng. 2013, 53, 031205. [Google Scholar] [CrossRef]
  28. Murakami, H.; Serita, K.; Maekawa, Y.; Fujiwara, S.; Matsuda, E.; Kim, S.; Kawayama, I.; Tonouchi, M. Scanning laser THz imaging system. J. Phys. D Appl. Phys. 2014, 47, 374007. [Google Scholar] [CrossRef]
  29. Serita, K.; Matsuda, E.; Okada, K.; Murakami, H.; Kawayama, I.; Tonouchi, M. Invited Article: Terahertz microfluidic chips sensitivity-enhanced with a few arrays of meta-atoms. APL Photonics 2018, 3, 051603. [Google Scholar] [CrossRef] [Green Version]
  30. Serita, K.; Murakami, H.; Kawayama, I.; Tonouchi, M. A terahertz-microfluidic chip with a few arrays of asymmetric meta-atoms for the ultra-trace sensing of solutions. Photonics 2019, 6, 12. [Google Scholar] [CrossRef] [Green Version]
  31. Okada, K.; Serita, K.; Cassar, Q.; Murakami, H.; MacGrogan, G.; Guillet, J.P.; Mounaix, P.; Tonouchi, M. Terahertz near-field microscopy of ductal carcinoma in situ (DCIS) of the breast. J. Phys. Photonics 2020, 2, 044008. [Google Scholar] [CrossRef]
  32. Bowman, T.; El-Shenawee, M.; Campbell, L.K. Terahertz transmission vs reflection imaging and model-based characterization for excised breast carcinomas. Biomed. Opt. Express 2016, 7, 3756–3783. [Google Scholar] [CrossRef] [PubMed] [Green Version]
  33. Zhang, P.; Zhong, S.; Zhang, J.; Ding, J.; Liu, Z.; Huang, Y.; Zhou, N.; Nsengiyumva, W.; Zhang, T. Application of Terahertz Spectroscopy and Imaging in the Diagnosis of Prostate Cancer. Curr. Opt. Photonics 2020, 4, 31–43. [Google Scholar]
  34. Wahaia, F.; Valusis, G.; Bernardo, L.M.; Almeida, A.; Moreira, J.A.; Lopes, P.C.; Macutkevic, J.; Kasalynas, I.; Seliuta, D.; Adomavicius, R. Detection of colon cancer by terahertz techniques. J. Mol. Struct. 2011, 1006, 77–82. [Google Scholar] [CrossRef]
  35. Nagai, M.; Tanaka, K.; Ohtake, H.; Bessho, T.; Sugiura, T.; Hirosumi, T.; Yoshida, M. Generation and detection of terahertz radiation by electro-optical process in GaAs using 1.56 μm fiber laser pulses. Appl. Phys. Lett. 2004, 85, 3974–3976. [Google Scholar] [CrossRef]
  36. Fumeaux, C.; Lin, H.; Serita, K.; Withayachumnankul, W.; Kaufmann, T.; Tonouchi, M.; Abbott, D. Distributed source model for the full-wave electromagnetic simulation of nonlinear terahertz generation. Opt. Express 2012, 20, 18397–18414. [Google Scholar] [CrossRef] [Green Version]
  37. Xin, X.; Altan, H.; Saint, A.; Matten, D.; Alfano, R.R. Terahertz absorption spectrum of para and ortho water vapors at different humidities at room temperature. J. Appl. Phys. 2006, 100, 094905. [Google Scholar] [CrossRef]
  38. Doleshal, M.; Magotra, A.A.; Choudhury, B.; Cannon, B.D.; Labourier, E.; Szafranska, A.E. Evaluation and validation of total RNA extraction methods for microRNA expression analyses in formalin-fixed, paraffin-embedded tissues. J. Mol. Diagnostics 2008, 10, 203–211. [Google Scholar] [CrossRef] [Green Version]
  39. Waks, A.G.; Winer, E.P. Breast cancer treatment: A review. JAMA 2019, 321, 288–300. [Google Scholar] [CrossRef]
  40. Kong, N.S.P.; Ibrahim, H. Color image enhancement using brightness preserving dynamic histogram equalization. IEEE Trans. Consum. Electron. 2008, 54, 1962–1968. [Google Scholar] [CrossRef]
  41. Yamaguchi, S.; Fukushi, Y.; Kubota, O.; Itsuji, T.; Ouchi, T.; Yamamoto, S. Origin and quantification of differences between normal and tumor tissues observed by terahertz spectroscopy. Phys. Med. Biol. 2016, 61, 6808. [Google Scholar] [CrossRef] [PubMed]
  42. Cassar, Q.; Al-Ibadi, A.; Mavarani, L.; Hillger, P.; Grzyb, J.; MacGrogan, G.; Zimmer, T.; Pfeiffer, U.R.; Guillet, J.P.; Mounaix, P. Pilot study of freshly excised breast tissue response in the 300–600 GHz range. Biomed. Opt. Express 2018, 9, 2930–2942. [Google Scholar] [CrossRef] [PubMed]
Figure 1. (a) Schematic illustration of the scanning point terahertz source (SPoTS) microscope (left: overall, right: around the sample). Typical terahertz transmission and reflection signals when no samples are set on the GaAs crystal in: (b) time-domain and (c) frequency-domain.
Photonics 08 00151 g001
Figure 2. (a) Terahertz reflection image of 9 μm gold interdigitate structure. (b,c) Terahertz transmission images when no samples are set on the GaAs crystal in a size of wide (1.1 mm × 1.1 mm) and narrow (280 μm × 280 μm, Field of view) scanning mode with a line profile along the white dashed line inserted in each image.
Photonics 08 00151 g002
Figure 3. (a) Optical image of a formalin-fixed paraffin-embedded (FFPE) human breast tissue section deposited on a GaAs (110) crystal as well as its cross-sectional view, and (b) corresponding hematoxylin-eosin-saffron (HES) section of the FFPE breast sample. In the HES image, the DCIS and IDC compartments are highlighted by purple and blue dashed lines, and the fibrous (benign) region corresponds to the orange/yellow-stained area between the two malignant structures. Terahertz imaging was conducted in the region surrounded by solid white lines in (a). The corresponding region is also depicted by solid black lines in (b) for comparison.
Photonics 08 00151 g003
Figure 4. (a) Hematoxylin-eosin-saffron (HES), (b) Optical, (c) Terahertz-transmission, and (d) Terahertz-transmission (histogram equalized) images of the tissue region highlighted in Figure 3a,b. Histogram equalization was performed by using an image processing function of Origin Pro 2021 (OriginLab Corporation, Northampton, MA, USA). (e) Line profile along the yellow dotted line inserted in (d). (f) Averaged pixel values (APVs) of each tissue in the transmission terahertz image of (c). Error bars indicate the standard deviations. Corresponding reflection terahertz images, line profile, and APVs are displayed in (gi). The terahertz images were obtained at the highest positive peaks of the time-domain terahertz waveforms. In the HES image, the DCIS and IDC compartments are highlighted by purple and blue dashed lines, respectively, and the fibrous region corresponds to the orange/yellow-stained area between these two malignant regions.
Photonics 08 00151 g004aPhotonics 08 00151 g004b
Figure 5. HES images of (a) DCIS, (b) IDC 1, (c) IDC 2, (d) IDC 3, and (e) Fibrous tissue at the cellular level, as shown in the yellow boxes in Figure 4a.
Photonics 08 00151 g005
Publisher’s Note: MDPI stays neutral with regard to jurisdictional claims in published maps and institutional affiliations.

