Communication

Investigation on Speckle-Free Imaging at the Output of a Multimode Fiber under Various Mode Excitation Conditions

1
College of Science, Zhejiang University of Technology, Hangzhou 310023, China
2
College of Engineering Training Center, China Jiliang University, Hangzhou 310018, China
*
Author to whom correspondence should be addressed.
Submission received: 15 April 2021 / Revised: 17 May 2021 / Accepted: 19 May 2021 / Published: 20 May 2021

Abstract

:
Speckle-free imaging using a multimode fiber has been widely used for imaging systems. Generally, previous work has assumed that all the propagating modes of the fiber are uniformly excited, but the modal power distribution is actually affected by excitation conditions. Here, we propose the utilization of a modal analysis method to study the dependence of the speckle contrast on the modal power distribution by changing the tilt angle of the Gaussian beam and on the group delay time difference caused by different fiber lengths. The results of numerical simulations and experiments show that, with an increase in the tilt angle of the Gaussian beam, the modal power is transferred to higher-order modes and the maximum delay difference between excitation modes becomes larger. Therefore, the inter-mode interference effect is effectively weakened, and the speckle contrast is significantly reduced. The increase in fiber length will also make the delay difference between excitation modes larger and thus the speckle contrast is decreased. For the larger tilt angle of the Gaussian beam, only a shorter optical fiber is required to reduce the speckle contrast significantly. Our work further promotes the use of a multimode fiber to produce speckle-free patterns in laser imaging systems.

1. Introduction

Laser light is widely used for imaging systems because it offers high brightness, a wide color gamut, high directionality, and a long lifetime [1,2,3]. However, when laser light with high coherence is transmitted through or reflected an optically rough object, speckle patterns produced by coherent waves interfering with each other are undesirable in many imaging applications, such as digital holographic microscopy [4], projection displays [5], optical coherence tomography [6], and synthetic aperture radar (SAR) imagery [7]. Speckles significantly deteriorate the image quality and have to be reduced to an extremely low value, or even speckle-free imaging is required.
Many approaches have been proposed to reduce speckle, such as a moving diffuser [8], screen movement [9], or a rotating light pipe [10], etc. Among them, the most popular method is to use moving diffraction optical elements (DOEs) [11,12], which enables efficient reduction in speckle, but the use of active moving elements will increase the power consumption and reduce the reliability of the systems.
Speckle reduction methods without active moving elements have also been developed. One of the attractive methods is to use a stationary multimode fiber. When a coherent laser is coupled into a multimode fiber, it will excite multiple modes with different propagation paths. Speckles can be reduced by destroying the laser temporal coherence by creating a sufficient delay difference among the fiber modes [13,14,15]. There are advantages of using multimode fibers for speckle reduction, such as their low image transmission loss, flexibility and easiness for bending, and applicability to high-power lasers.
In previously published papers, speckle patterns at the output of a multimode fiber have been analyzed, and the related theories for speckle contrast calculation have been studied [16,17,18,19]. It has been found that the speckle contrast for a multimode fiber is essentially given by the impulse response of the fiber and the power spectrum of the source [20,21,22]. To reduce the speckle contrast of light emitting from a multimode fiber, one should enhance the intermodal dispersion by increasing the length or numerical aperture (NA) of the multimode fiber. However, the relationship between the speckle contrast at the output of a multimode fiber and the interference among excitation modes has not been clearly revealed in the studies mentioned above. Moreover, most of the work assumes that all propagating modes of the fiber are uniformly excited (equal intensity), but the modal power distribution is actually affected by excitation conditions. It is well known that all propagating modes of a fiber are non-uniform modal distributions when a tilted Gaussian-shaped coherent laser beam is launched into a multimode fiber. The modal power distribution has a crucial impact on the speckle formation. Therefore, it is necessary to study the relationship between the speckle contrast at the output of a multimode fiber and inter-mode interference under various excitation conditions.
In this paper, firstly, the modal power distributions under different excitation conditions in a weakly guided multimode fiber were theoretically investigated. Additionally, various modal power distributions could be realized by changing the tilt angle of the Gaussian beam. Subsequently, a modal analysis method was employed to derive general expressions for the speckle contrast at the output of a multimode fiber, which revealed that the speckle contrast is related to the power excitation coefficient and spatial configuration of guided modes, the group delay time difference (intermodal dispersion), and the temporal coherence of the laser source. Finally, numerical simulations and experiments were conducted to investigate the dependence of the speckle contrast on the modal power distribution by changing the tilt angle of the Gaussian beam and on the group delay time difference caused by different fiber lengths.

2. Theoretical Analysis

2.1. Various Modal Power Distribution by Varying the Tilt Angle of the Gaussian

For simplicity, we consider a step-index multimode fiber with a small index difference ( Δ = ( n 1 n 2 ) / n 1 1 ) under a weakly guided condition [23,24], where n1 and n2 are the refractive indexes of the core and cladding, respectively. For an incident Gaussian-shaped laser beam at the incident end of the multimode fiber (z = 0), the expression in the cylindrical coordinate system (r, ϕ, z) can be written as follows:
E i n ( r , ϕ ) = 1 ρ e x p [ r 2 ρ 2 ] e x p ( i k θ r c o s ϕ )
where ρ is the Gaussian beam radius at the waist, k = 2π/λ is the wave number in free space, λ is the wavelength, and θ is the angle of the incident Gaussian beam relative to the optical fiber axis. The paraxial approximation from Equation (1) is used so that the tilt angle θ of the Gaussian beam is only restricted to a very small range.
The incident Gaussian beam on the multimode fiber allows only the transmission of a light field coupled into the linearly polarized (LP) modes in the fiber. Therefore, the incident Gaussian beam is expressed as a superposition of modal fields as given below [25]:
E i n ( r , ϕ ) = m n α m n L P m n ( r , ϕ )
where m and n are the indices of the LPmn mode and αmn is the modal field amplitude excitation coefficient that is given by the following:
α m n = 0 2 π 0 + L P m n * ( r , ϕ ) E i n ( r , ϕ ) r d r d ϕ
where the asterisk denotes the complex conjugate. Equation (3) can be further normalized, and the power excitation coefficient of the LPmn mode can be obtained as follows:
η m n = | 0 2 π 0 + L P m n * ( r , ϕ ) E i n ( r , ϕ ) r d r d ϕ | 2 0 2 π 0 + | L P m n ( r , ϕ ) | 2 r d r d ϕ × 0 2 π 0 + | E i n ( r , ϕ ) | 2 r d r d ϕ     , 0 η m n 1
The modal field of LPmn at the incident end (z = 0) of the step-index multimode fiber can be expressed as follows [26]:
L P m n ( r , ϕ ) = { A 1 J m ( U ) J m ( U r a ) c o s ( m φ )         r a A 1 K m ( W ) K m ( W r a ) c o s ( m φ )   r a
where A is a constant, a is the core radius, and Jm and Km are the Bessel and modified Hankel functions of order m, respectively. U is the normalized transverse propagation constant of the fiber core (ra), and W is the normalized transverse propagation constant of the fiber cladding (ra), which can be expressed as follows:
U = a ( k 2 n 1 2 β 2 ) 1 2 W = a ( β 2 k 2 n 2 2 ) 1 / 2 V 2 = U 2 + W 2 = a 2 k 2 ( n 1 2 n 2 2 )
where V is the normalized frequency and β is the propagation constant along the direction of the fiber axis. According to the boundary conditions of the modal field, it must satisfy the following eigenvalue equation [24]:
{ J 0 ( U ) U J 1 ( U ) = K 0 ( W ) W K 1 ( W ) , m = 0 J m ( U ) U J m 1 ( U ) = K m ( W ) W K m 1 ( W ) , m 1
The eigenvalue equation (Equation (7)) is a transcendental equation that must be solved numerically. The solution of the eigenvalue equation provides a set of discrete βmn values, each of which corresponds to a specific modal field of linear polarization (LPmn). Therefore, by using Equations (1), (5) and (7) and substituting them in Equation (4), we can obtain the modal power distributions under various excitation conditions (primarily by varying the tilt angle θ of the Gaussian beam).

2.2. Calculation of the Speckle Contrast at the Output of a Multimode Fiber

When a coherent light source is incident on a multimode fiber, a speckle field is formed at the output of the multimode fiber because of the interference among many guided modes. Subsequently, the general expression of the speckle contrast in the multimode fiber is derived using the modal field analysis method.
The multimode fiber is assumed to be an ideal optical guide, with no geometrical imperfections, to achieve mode guiding without attenuation and mode coupling. The optical field that propagates through the fiber of length z under the weakly guiding condition can be represented as a superposition of linearly polarized modes with their propagation constants βp(ω) at an angular frequency ω. This can be written as follows:
E ( r , ϕ , z , t ) = p α p E p ( r , ϕ ) 0 + g ( ω ) e x p { i [ ω t β p ( ω ) z ] } d ω  
where p is a simplified representation of the specific LPmn mode with modal index pairs (m, n); αp and Ep (r, ϕ) are the modal amplitude excitation coefficient and the spatial configuration of mode p, respectively; and g(ω) is the spectrum of the source field at the frequency ω. Thus, the instantaneous intensity of the light field output can be written as follows:
| E ( r , ϕ , z , t ) | 2 = p q α p α q * E p ( r , ϕ ) E q * ( r , ϕ ) 0 + 0 + g ( ω ) g * ( ω ) e x p [ i ( ω   ω ) t ] × e x p [ i { β p ( ω ) β q ( ω ) } z ] d ω d ω
For the intensity of the light field output I (r, ϕ, z) integrated over the eye (or camera), resolution time longer than the period of optical beat angular frequencies (ω-ω′), its expression can be written as follows:
I ( r , ϕ , z ) =   | E ( r , ϕ , z , t ) | 2 d t              = p q α p α q * E p ( r , ϕ ) E q * ( r , ϕ ) 0 + G ( ω ) e x p [ i { β p ( ω )              β q ( ω ) } z ] d ω
where G ( ω ) = | g ( ω ) | 2 is the spectrum density of the light source that satisfies the following normalization condition:
0 + G ( ω ) d ω = 1
The complex degree of the temporal coherence of the source field by the Fourier transform is given as follows:
γ ( t ) = 0 + G ( ω ) e x p ( i ω t ) d ω , γ ( 0 ) = 1  
The coherence time tc of the source is defined by the following equation [27]:
t c = 0 + | γ ( t ) | 2 d t
The frequency-dependent propagation constant of the individual mode can be expanded in two terms of a Taylor series around the central frequency ω0 as follows:
β p ( ω ) = β p ( ω 0 ) + 1 V p ( ω ω 0 ) ,   1 V p = d β p ( ω ) d ω | ω = ω 0
β q ( ω ) = β q ( ω 0 ) + 1 V q ( ω ω 0 ) ,   1 V q = d β q ( ω ) d ω | ω = ω 0
where Vp and Vq are the group velocities of the p mode and q mode, respectively. By substituting Equation (14) in Equation (10) and using the relation of Equation (12), we can rewrite the light field intensity expression as follows:
I ( r , ϕ , z ) = p q α p α q * E p ( r , ϕ ) E q * ( r , ϕ ) | γ ( τ p              τ q ) | e x p [ i ω 0 ( τ p τ q ) ] e x p [ i { β p ( ω 0 ) β q ( ω 0 ) } z ]
where τp = z/Vp and τq = z/Vq are the group delay times of the p mode and q mode, respectively. With the assumption that the speckle intensity pattern evolution in time is a random process, the phases of the different modes are realized as statistically independent and uniformly distributed between 0 and 2π. The ensemble average of the relevant phase terms is given by the following:
e x p [ i { β p ( ω 0 ) β q ( ω 0 ) } z ] = δ p q
where δpq = 1 and δpq = 0 for p = q and pq, respectively. The average intensity is obtained from Equation (15) as given below:
I ( r , ϕ , z ) = p | α p | 2 | E p ( r , ϕ ) | 2
Equation (17) can be interpreted as the direct sum of the intensities of each guided mode. Similarly, the second moment of the light field intensity is written as follows:
I 2 ( r , ϕ , z ) = p q s j α p α q * α s α j * E p ( r , ϕ ) E q * ( r , ϕ ) E s ( r , ϕ ) E j * ( r , ϕ ) | γ ( τ p τ q ) | | γ ( τ s         τ j ) | e x p [ i ω 0 ( τ p τ q ) ] e x p [ i ω 0 ( τ s τ j ) ]         × e x p [ i { β p ( ω 0 ) β q ( ω 0 ) + β s ( ω 0 ) β j ( ω 0 ) } z ]
The ensemble average of the relevant phase terms in Equation (18) is given by:
e x p [ i { β p ( ω 0 ) β q ( ω 0 ) + β s ( ω 0 ) β j ( ω 0 ) } z ] = δ p q δ s j + δ p j δ q s
Three cases with non-zero values can be obtained from Equation (19): (a) p = q = s = j, (b) p = q, s = j (pj), and (c) p = j, q = s (pq). Thus, the expression for the second moment of the light intensity in Equation (18) can be written as follows:
I 2 ( r , ϕ , z ) = p q | α p | 2 | α q | 2 | E p ( r , ϕ ) | 2 | E q ( r , ϕ ) | 2 +   p q | α p | 2 | α q | 2 | E p ( r , ϕ ) | 2 | E q ( r , ϕ ) | 2 | γ ( τ p τ q ) | 2
The quantitative measure of the speckle field at the output of a multimode fiber is characterized by the speckle contrast, which is defined as the ratio of the standard deviation of the intensity fluctuation to the mean intensity [28]. The speckle contrast (SC) can be represented as follows:
S C = σ I I ( r ,   ϕ ,   z ) = I ( r ,   ϕ ,   z ) 2 I ( r ,   ϕ ,   z ) 2 I ( r ,   ϕ ,   z )
The square of the average intensity in Equation (17) can be written as:
I ( r ,   ϕ ,   z ) 2 = p q | α p | 2 | α q | 2 | E p ( r , ϕ ) | 2 | E q ( r , ϕ ) | 2
The numerator term of Equation (21) by using the Equations (20) and (22) can be expressed as follows:
σ I = I ( r ,   ϕ ,   z ) 2 I ( r ,   ϕ ,   z ) 2                          =   p q | α p | 2 | α q | 2 | E p ( r , ϕ ) | 2 | E q ( r , ϕ ) | 2 | γ ( τ p τ q ) | 2
By substituting Equations (17) and (23) in Equation (21), the expression of the speckle contrast at the output of a multimode fiber can be obtained:
S C =   p q | α p | 2 | α q | 2 | E p ( r , ϕ ) | 2 | E q ( r , ϕ ) | 2 | γ ( τ p τ q ) | 2 p | α p | 2 | E p ( r , ϕ ) | 2
Equation (24) shows that speckle contrast is related to the following quantities: the power excitation coefficient ( | α p | 2 and | α q | 2 ), the modal spatial configuration (Ep (r, ϕ) and Eq (r, ϕ)), the group delay time difference between mode p and mode q (τpτq), and the complex degree of temporal coherence of the source field γ(t). The physical meaning of the complex degree of temporal coherence γ(t) in Equation (24) can be described as the temporal coherence properties of an excited laser source. The coherence time tc of the laser source has been given in Equation (13): t c = 0 + | γ ( t ) | 2 d t .
For a Gaussian-shaped laser source, the complex degree of temporal coherence can be written as follows:
γ ( t ) = e x p ( π t 2 2 t c 2 ) e x p ( i ω 0 t )
Using Equation (25), the complex degree term of the temporal coherence in Equation (24) can be expressed as | γ ( τ p τ q ) | 2 = e x p [ π ( τ p τ q ) 2 t c 2 ] . If the group delay time difference (τpτq) is greater than the coherence time tc, then | γ ( τ p τ q ) | 2 0 . Therefore, we can choose an appropriate fiber length L to ensure that the group delay difference between any two modes is greater than the coherence time, that the inter-mode interference does not exist, and that the speckle pattern does not appear.

3. Simulation Results and Discussion

3.1. Various Modal Power Distribution by Varying the Tilt Angle of the Gaussian Beam

To evaluate the modal power distribution under different excitation conditions, we altered the tilt angle θ of the Gaussian beam to obtain the normalized power excitation coefficient ηmn of each LPmn mode using Equations (1)–(7).
In the simulation, we first use the MATLAB software (7.9.0 (R2009b), MathWorks, Natick, MA 01760-2098, USA) to numerically solve the eigenvalue equation of Equation (7), and the normalized transverse propagation constants U and W of each modal field of linear polarization (LPmn) can be calculated. Then, the U and W values of each modal field are substituted into Equation (5); we can obtain the expression of each LPmn modal field. Finally, the expressions of the LPmn modal field and the incident field of the Gaussian beam (see Equation (1)) are simultaneously substituted into Equation (4) to solve the power excitation coefficient of the LPmn mode.
The following parameters were used in the numerical simulation: n1 = 1.483, n2 = 1.436, a = 100 µm, A = 1, λ = 0.53 µm, waist radius of the Gaussian beam ρ = 65 µm, numerical aperture of the multimode fiber NA =   n 1 2 n 2 2 = 0.37, and normalized frequency V =   2 π a λ N A   = 438.4. Figure 1 shows the modal power distribution under different excitation conditions (by varying the tilt angle θ of the Gaussian beam).
The excitation modes are very sensitive to the tilt angle of the Gaussian beam. As shown in Figure 1a, when the Gaussian beam is at normal incidence, a substantial amount of the excitation power of the multimode fiber is in LP01 mode (η01 = 0.926). As the tilt angle θ of the Gaussian beam is increased to 0.2° (as shown in Figure 1b), the excitation modes are concentrated in LP11(η11 = 0.259), LP02(η02 = 0.211), LP12(η12 = 0.161), LP21(η21 = 0.148), and LP01(η01 = 0.087). As the tilt angle of the Gaussian beam continues to be increased, the modal power is transferred to higher-order modes (as shown in Figure 1c,d).
However, the tilt angle of the Gaussian beam cannot be very large because the paraxial approximation is adopted in Equation (1). Meanwhile, as the tilt angle is increased, there will be a certain amount of energy loss when the Gaussian beam is coupled into the multimode fiber. Therefore, a maximum tilt angle of 1° is used in the simulation. The excitation modes and power excitation coefficients are listed in Table 1 (these fiber modes contain a large portion of the laser power).
It can be seen from Table 1 that, with an increase in the tilt angle of the Gaussian beam, the excitation modes are transferred to higher-order modes and the modal power distribution will be changed. All the propagating modes of the fiber are not uniformly excited, and the modal power distribution is affected by excitation conditions. When the tilt angle of the Gaussian beam is coupled into a multimode fiber, several dominant modes of a multimode fiber are selectively excited and then propagate along the fiber.

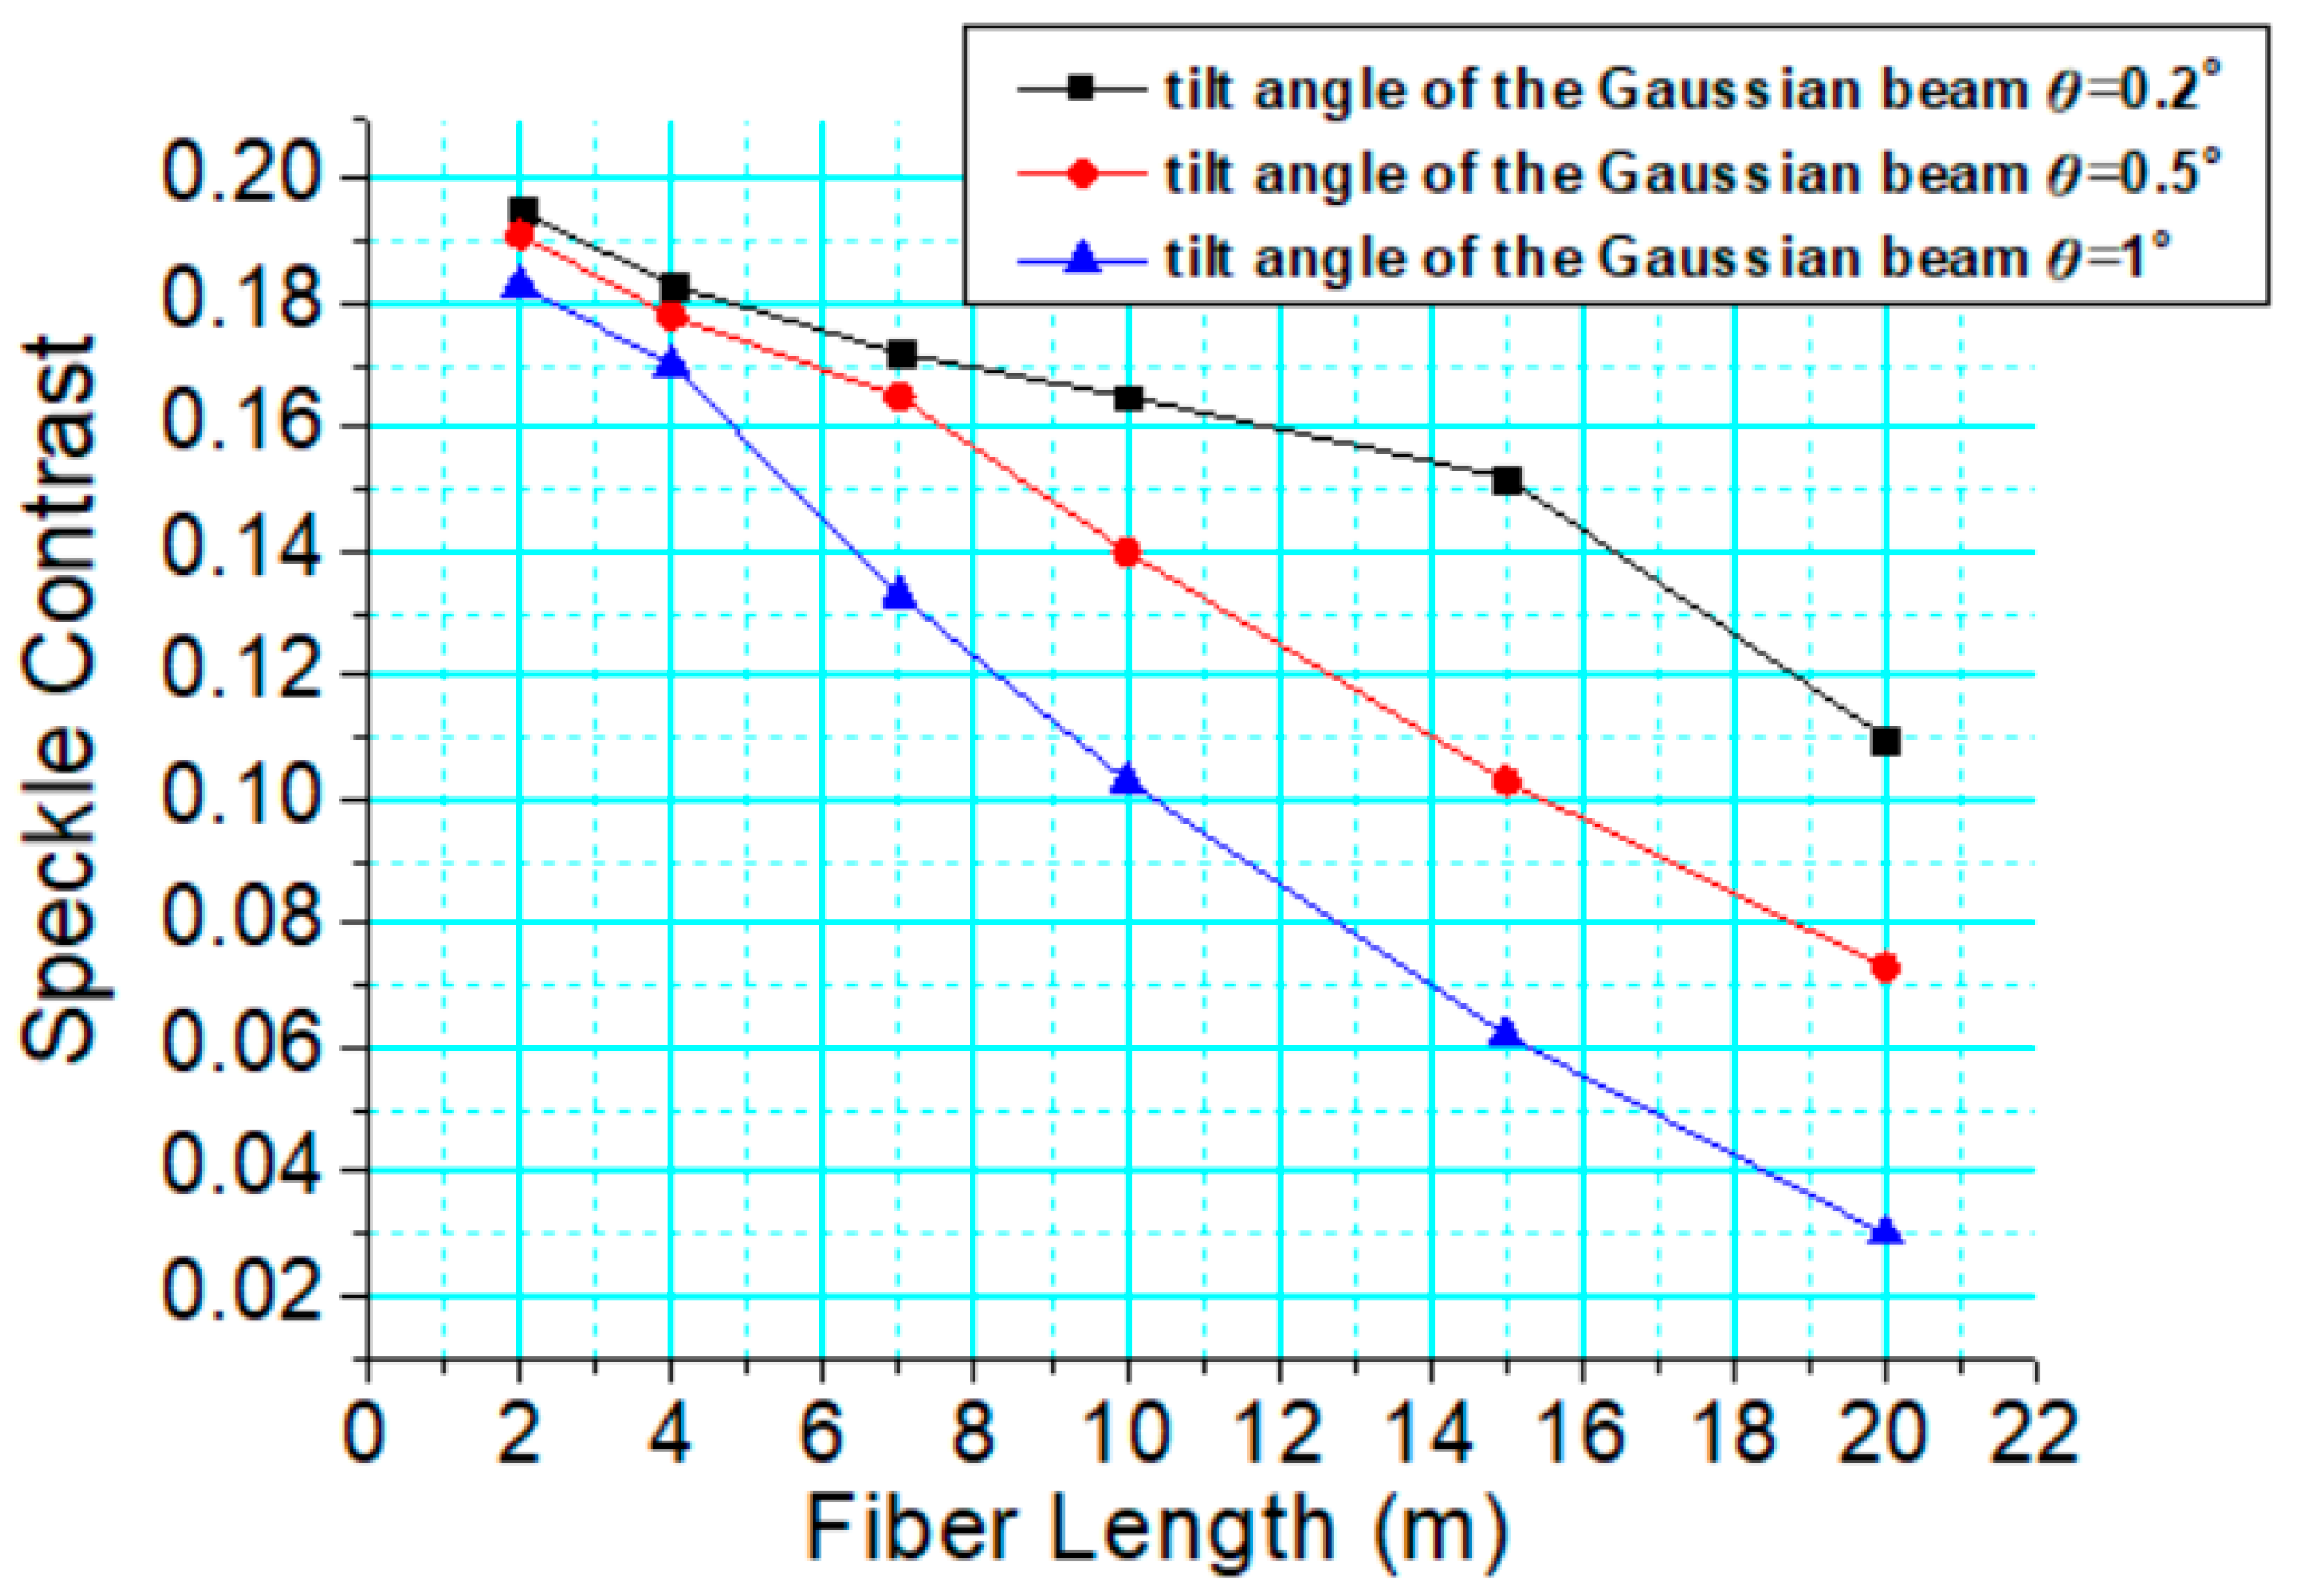
3.2. Speckle-Free Imaging under the Various Modal Power Distributions

It was shown in reference [22] that the presence of the speckle field at the output of the multimode fiber is related to the fiber length L. By changing the tilt angle of the Gaussian beam, various modal power distributions were obtained, as shown in Section 3.1. In this section, we calculate the required fiber length L under various modal power distributions to ensure that the group delay difference between any two modes is greater than the coherence time so that there is no interference, and speckle-free imaging can be achieved by using a sufficiently long multimode fiber.
The group delay time of the guide mode with the index values (m, n) to travel the length L of the multimode fiber is approximately given by the following expression [24]:
τ m n = L V m n = L d β m n ( ω ) d ω = L c { d ( n 2 k ) d k + n 2 Δ d ( V b ) d V }            = L c { d ( n 2 k ) d k + n 2 Δ [ 1 ( U V ) 2 ( 1 2 K m 2 ( W ) K m 1 ( W ) × K m + 1 ( W ) ) ] }
where c is the light velocity in a vacuum, and b is a normalized propagation constant, which is proportional to β and is defined by the following:
b = β k n 2 n 1 n 2
The first and second parts of Equation (26) represent the material and waveguide dispersions, respectively. In a multimode fiber, the waveguide dispersion is generally dominant when compared to the material dispersion, and hence, the material dispersion can be ignored. Therefore, the group delay time of the guide mode with the index values (m, n) can be approximated as follows:
τ m n L n 2 Δ c × [ 1 ( U V ) 2 ( 1 2 K m 2 ( W ) K m 1 ( W ) × K m + 1 ( W ) ) ]
According to reference [22], the maximum group delay time difference between the lowest order mode and the highest order mode supported by the fiber can be expressed as: Tmax =   L ( N A ) 2 2 n 1 c . For a step-index multimode fiber, the refractive index of the core n1 = 1.483, the numerical aperture of the multimode fiber NA = 0.37, the speed of light in vacuum c = 3.0 × 10⁸ (m/s), thus Tmax(s) = 153.85 × 10⁻¹² L. However, when the tilt angle of the Gaussian beam is coupled into a multimode fiber, only several fiber modes are selectively excited and then propagate along the fiber. The excitation dominant modes at different tilt angles of the Gaussian beam have been listed in Table 1.
The normalized propagation constant b varies with the group delay time of excitation modes per unit length of fiber by using Equations (27) and (28) for the tilt angle θ = 0.2° and 0.5° of the Gaussian beams, as shown in Figure 2. It is obvious that the normalized propagation constant b of the low-order modes is larger than that of the higher-order modes. In addition, with an increase in the tilt angle of the Gaussian beam, the maximum delay difference between excitation modes becomes larger, which contributes to the reduction in speckle contrast.
The group delay time of excitation modes for a tilt angle θ = 0.2° of the Gaussian beams in Table 1 can be calculated using Equation (28) as given below:
LP11: U = 3.2129, W = 438.3882, τ11(s) = 156.675 × 10⁻¹²(s·m−1) × L(m);
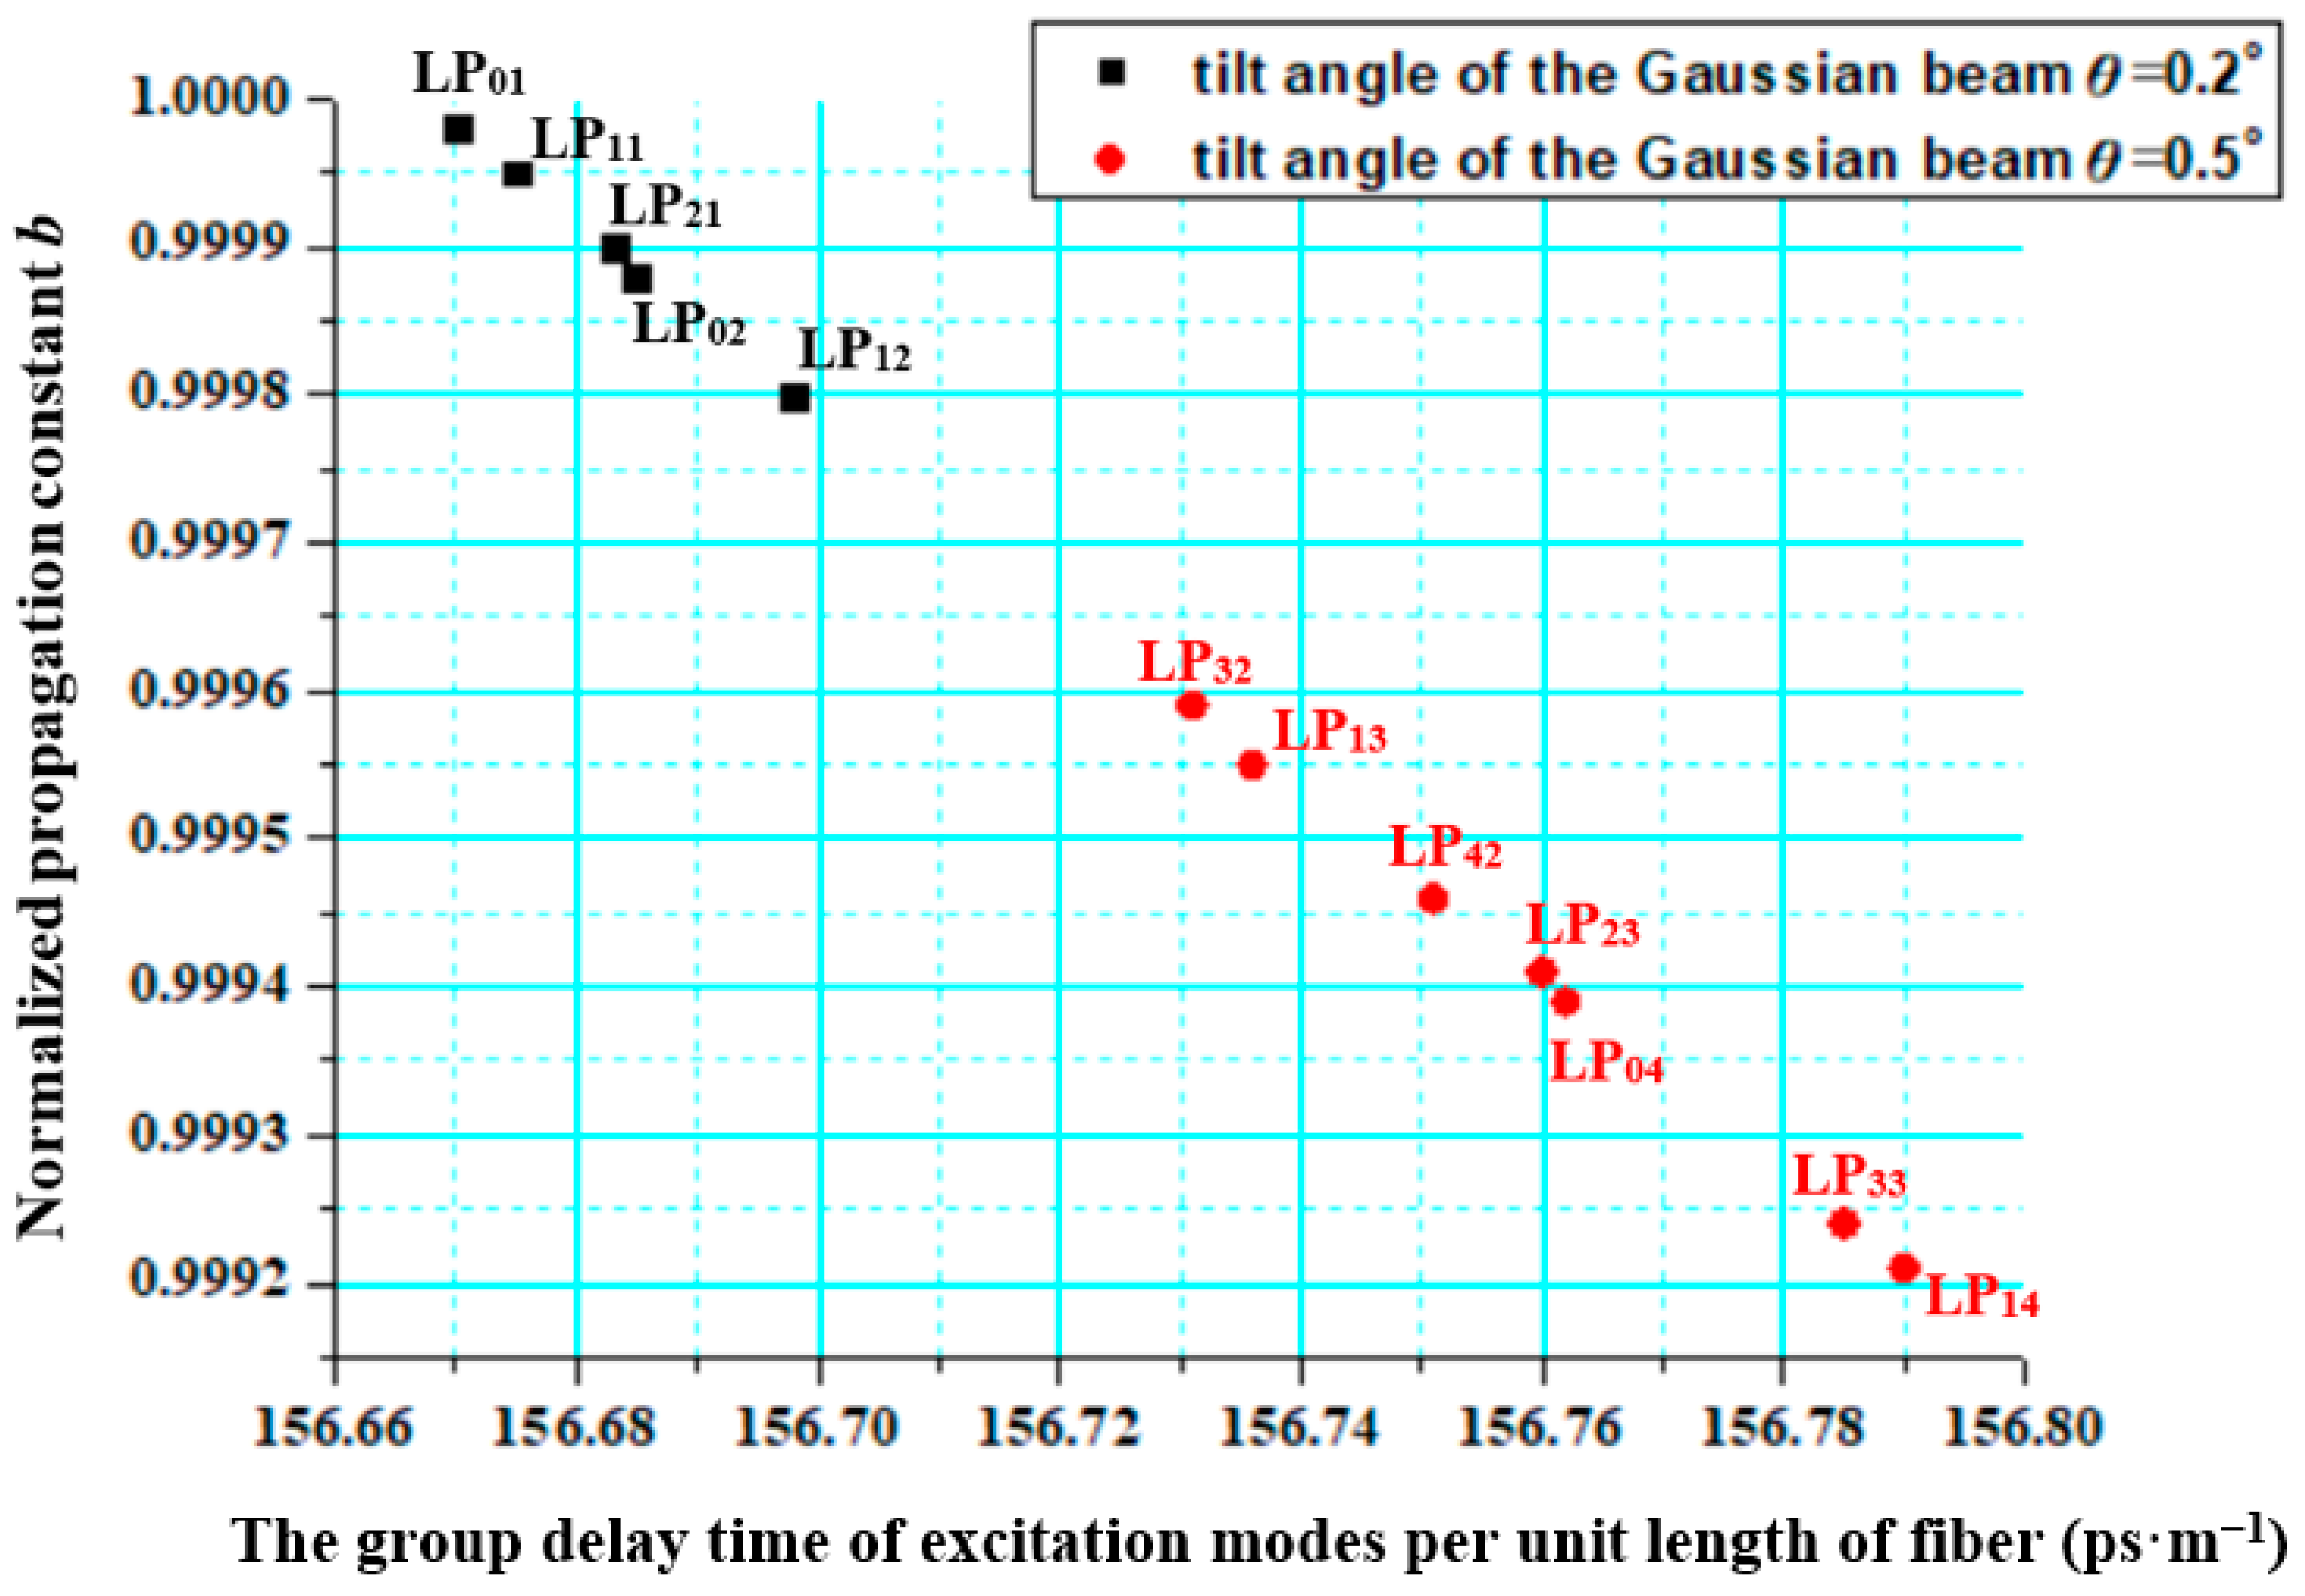
LP02: U = 4.7652, W = 438.3741, τ02(s) = 156.685 × 10⁻¹²(s·m−1) × L(m);
LP12: U = 6.2146, W = 438.3559, τ12(s) = 156.698 × 10⁻¹²(s·m−1) × L(m);
LP21: U = 4.4569, W = 438.3773, τ21(s) = 156.683 × 10⁻¹²(s·m−1) × L(m);
LP01: U = 1.8893, W = 438.3959, τ01(s) = 156.670 × 10⁻¹²(s·m−1) × L(m).
Then, the group delay time difference between any two modes can be calculated as follows:
T1 = |τ11τ02| = 1.0 × 10⁻¹⁴(s·m−1) × L(m); T2 = |τ11τ12| = 2.3 × 10⁻¹⁴(s·m−1) × L(m);
T3 = |τ11τ21| = 0.8 × 10⁻¹⁴(s·m−1) × L(m); T4 = |τ11τ01| = 0.5 × 10⁻¹⁴(s·m−1) × L(m);
T5 = |τ02τ12| = 1.3 × 10⁻¹⁴(s·m−1) × L(m); T6 = |τ02τ21| = 0.2 × 10⁻¹⁴(s·m−1) × L(m);
T7 = |τ02τ01| = 1.5 × 10⁻¹⁴(s·m−1) × L(m); T8 = |τ12τ21| = 1.5 × 10⁻¹⁴(s·m−1) × L(m);
T9 = |τ12τ01| = 2.8 × 10⁻¹⁴(s·m−1) × L(m); T10 = |τ21τ01| = 1.3 × 10⁻¹⁴(s·m−1) × L(m).
Thus, the maximum delay difference and the minimum delay difference from Equation (30) are expressed as follows:
Tmax(s) = T9 = 2.8 × 10⁻¹⁴(s·m−1) × L(m),
Tmin(s) = T6 = 0.2 × 10⁻¹⁴(s·m−1) × L(m).
Consider that the coherence time tc for a laser source with a spectral width Δv is 1/Δv; a green semiconductor laser (λ = 0.53 µm) is used with a spectrum width of Δλ = 2 nm, and the coherence time tc = λ2/(cΔλ) = 46.82 × 10⁻¹⁴ (s). Comparisons of the coherence time tc of the laser source with the maximum and minimum delay differences (Tmax and Tmin) lead to the following three conditions:
  • Tmax < tc: Interference occurs among all modes, and hence, the speckle contrast at the output of a multimode fiber is not significantly reduced. The optical fiber length L must be within 16.7 m.
  • Tmax > tc > Tmin: Interference occurs among some modes, and hence, the speckle contrast at the output of a multimode fiber is significantly reduced. The optical fiber length L must be in the following range: 16.7 m < L < 234.1 m.
  • Tmin > tc: Interference among all modes ceases, and hence, the speckle contrast at the output of a multimode fiber is equal to 0. The optical fiber length L must exceed 234.1 m.
To obtain speckle-free imaging, the length of the multimode fiber must exceed 234.1 m for the tilt angle θ = 0.2° of the Gaussian beams. In a similar way, the group delay time of excitation modes and the required length of the multimode fiber are calculated as shown in Table 2 when the tilt angle is θ = 0.5° and θ = 1°.
It can be seen from Table 2 that, with an increase in the tilt angle of the Gaussian beam, the modal power is transferred to higher-order modes and the maximum delay difference between excitation modes becomes larger. Therefore, the inter-mode interference effect is effectively weakened, and the speckle contrast is significantly reduced. The increase in fiber length will also make the delay difference between excitation modes larger and thus the speckle contrast is decreased. For the larger tilt angle of the Gaussian beam, only a shorter optical fiber is required to reduce the speckle contrast significantly.

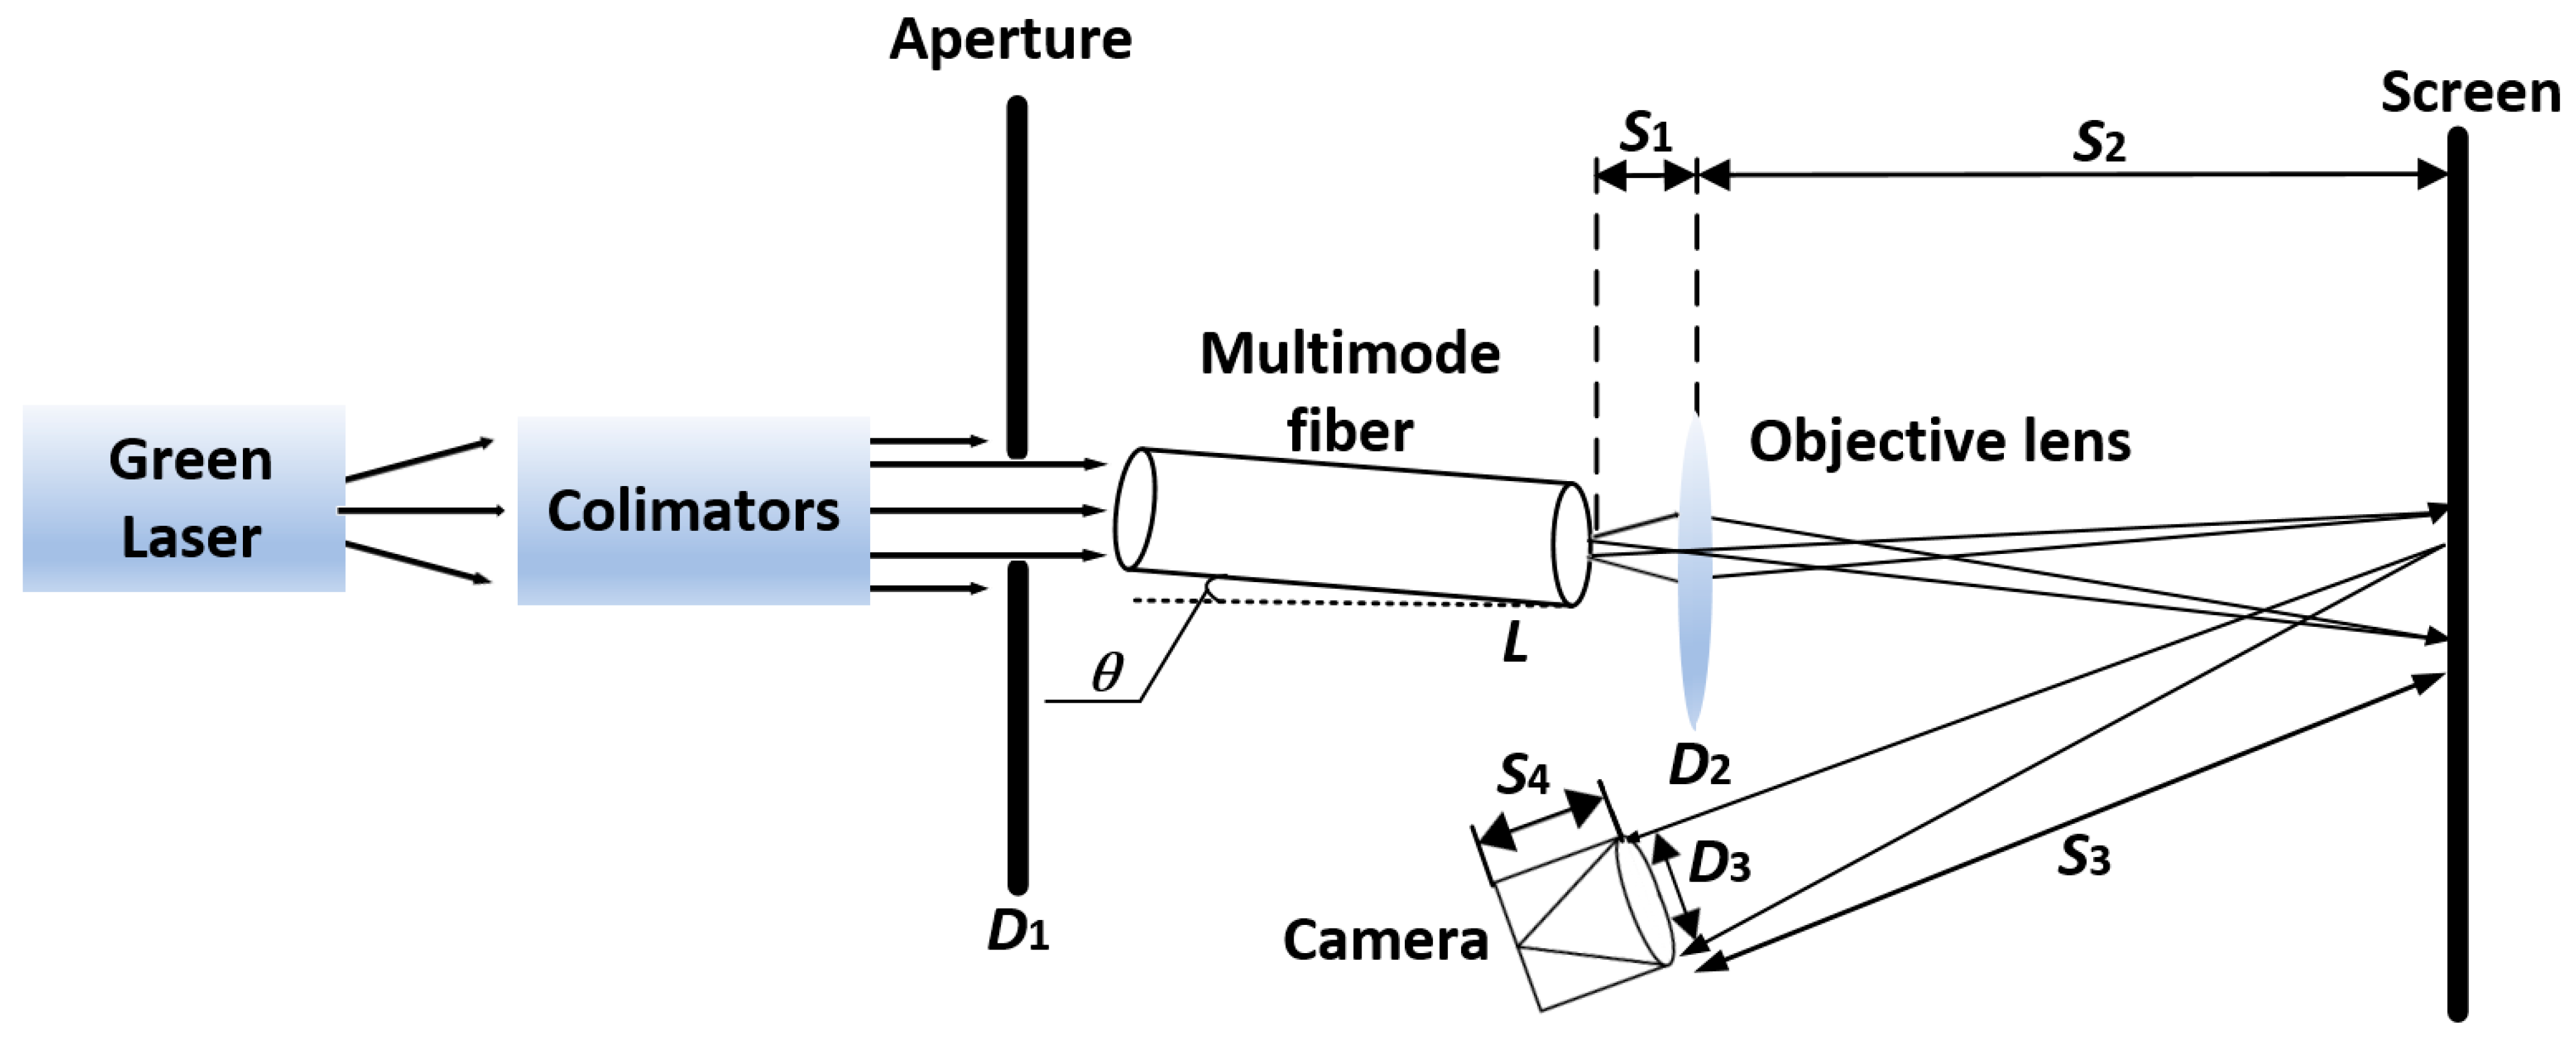
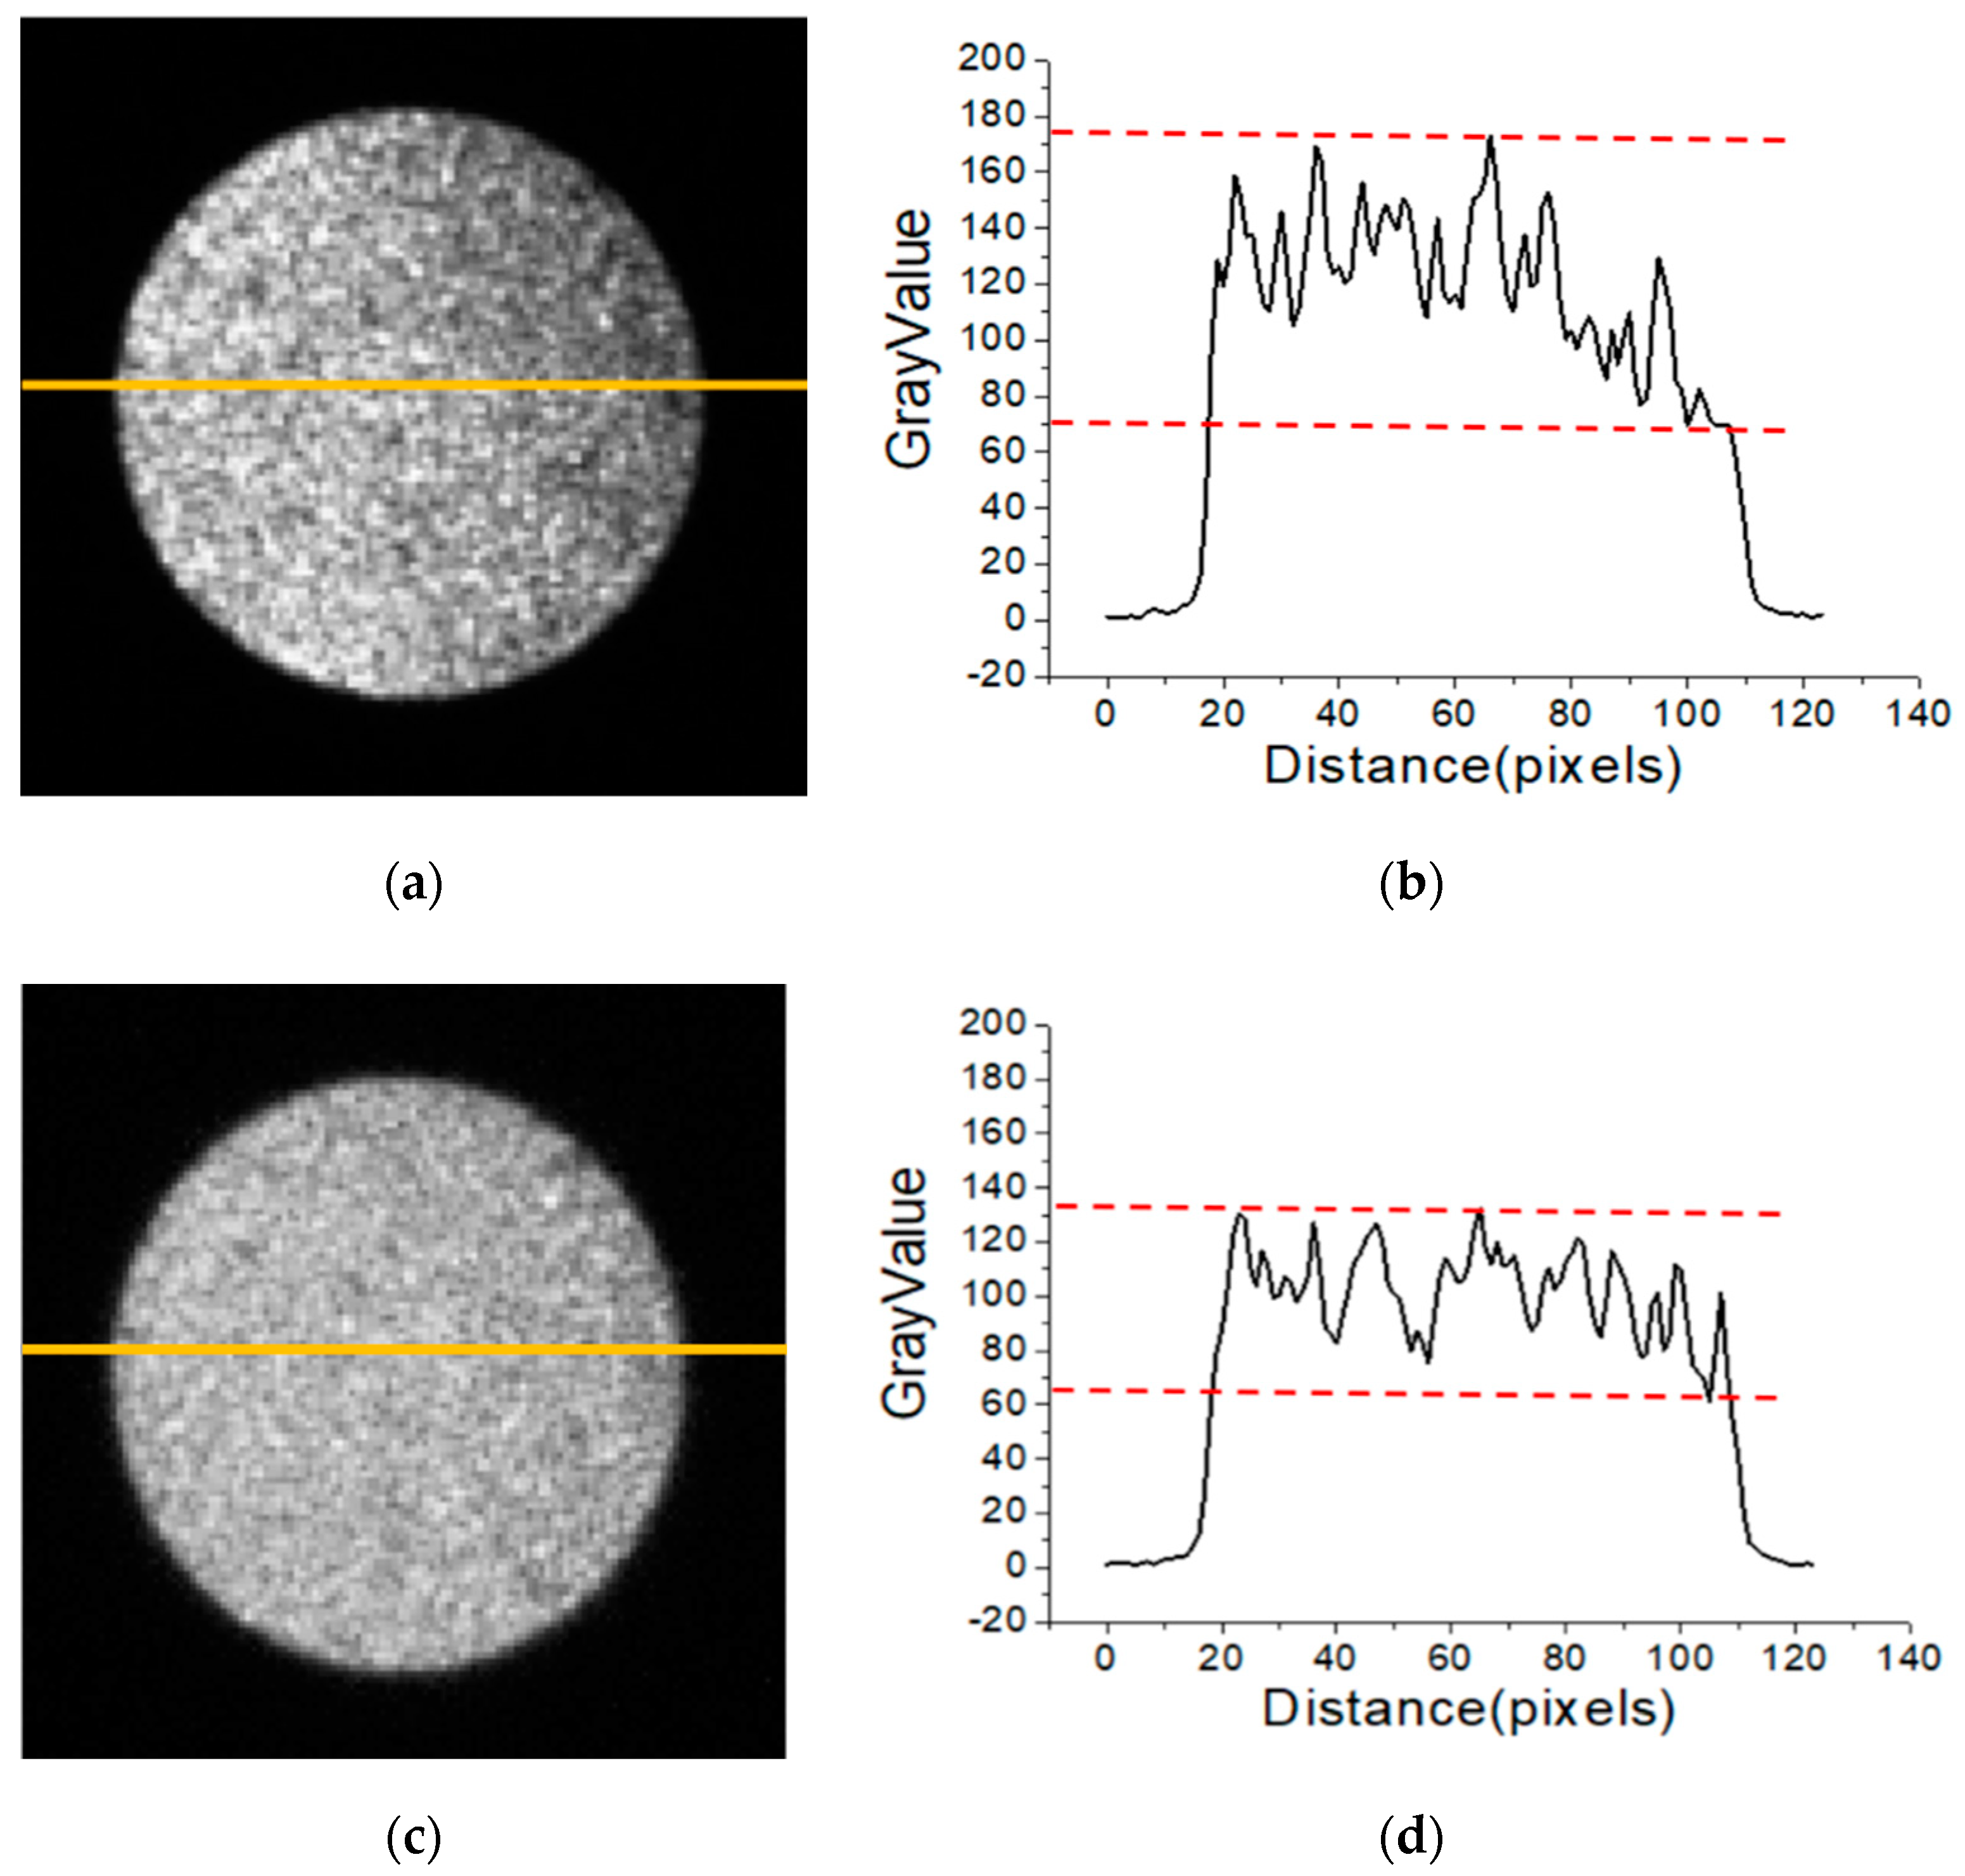
4. Experimental Results and Discussion

To verify the theoretical results shown above, an experimental setup based on the speckle contrast at the output of a multimode fiber under various excitation conditions (by varying the tilt angle of the Gaussian beam to θ = 0.2°, 0.5°, and 1°) was created, as illustrated in Figure 3. Multimode fibers of total length L = 2, 4, 7, 10, 15 and 20 m with a core diameter 2a = 200 µm and NA = 0.37 were used. A collimated green laser (λ = 0.53 µm) was incident on aperture D1 = 1.3 mm, followed by a laser beam into the multimode fiber. One end of the fiber was mounted on a rotational stage so that the incident beam has a tilt angle θ relative to the optical fiber axis, and the other end was clamped by the optical fiber holder to ensure parallel output relative to the fiber axis. Subsequently, the output light of the multimode fiber was imaged on a screen through an objective lens with an aperture of D2 = 50 mm and was finally captured by a Charge-coupled Device (CCD) camera.
Figure 4 shows the speckle patterns and their one-dimensional (1D) intensity distributions when the incident angles of the Gaussian beam θ = 0.5° and 1° with a multimode fiber of length L = 7 m. As illustrated in Figure 4, as the tilt angle of the Gaussian beam was increased from θ = 0.5° to θ = 1°, the speckle contrast was reduced significantly and the speckle grain size became smaller. It can be clearly seen from the significant reduction in 1D intensity fluctuations that were extracted from the yellow line of the speckle patterns. This can be explained by the fact that, as the tilt angle of the Gaussian beam is increased, the modal power is transferred to higher-order modes and the maximum delay difference between excitation modes becomes larger. At this point, the inter-mode interference effect is effectively weakened. Therefore, the speckle contrast at the output of the multimode fiber is significantly reduced.
Figure 5 shows the relationship between the speckle contrast of the image captured by a CCD camera and the variation in the incident angle of the Gaussian beam under multimode fibers with total length of L = 2, 4, 7, 10, 15, and 20 m. The comparison between experimental and theoretical results are given below.
According to the theoretical simulation and calculation, when the tilt angle of Gaussian beams is 0.2°, 0.5° and 1°, the required length for significant speckle reduction is L = 16.7 m, 7.9 m and 5.3 m, respectively. As illustrated in Figure 5, for the tilt angle of Gaussian beams is 0.2°, 0.5° and 1°, significant reduction in speckle contrast (steep curves segment) corresponding to the position range of fiber lengths are within 15 m–20 m, 7 m–10 m and 4 m–7 m. It can be concluded that for the larger tilt angle of the Gaussian beam, only a shorter optical fiber is required to reduce the speckle contrast significantly.
When fiber length L is less than the required length for significant speckle reduction (black curve segment with fiber length L < 15 m, red curve segment with fiber length L < 7 m, and blue curve segment with fiber length L < 4 m), the curves of speckle contrast decreased slowly. It can be theoretically explained that the group delay time difference between any excitation modes is less than the coherence time of the laser source, and the interference effect is not effectively weakened.
When fiber length L is great than the required length for significant speckle reduction (black curve segment with fiber length L > 15 m, red curve segment with fiber length L > 7 m, and blue curve segment with fiber length L > 4 m), the curves of speckle contrast decrease monotonically with fiber length L. Reference [22] shows the speckle contrast is inversely with L1/2, which is consistent with our experimental results.
As can be seen from the asymptotic trend of the curves in Figure 5, the longer the fiber length is, the lower the speckle contrast can be, and eventually, speckle-free imaging can be obtained. However, in practical situations where a long multimode fiber is used, the fiber is generally coiled in a compact optical system. A small bending radius of optical fiber will lead to mode leakage and loss of light intensity, which will have an impact on speckle reduction. Reference [29] shows that if the distorted fundamental mode experiences sudden transition from straight fiber segment to bend fiber segment, the excitation of higher order modes could be ignored when the bend radius is larger than 200 mm. Meanwhile, when the bending radius/core radius (a = 100 µm) ≥ 103, that is, the bending radius is greater than 100 mm, and the loss of light intensity due to bending is negligible. Therefore, the coiling radius of the multimode fiber is approximately 300 mm used in the experiment.
As focal ratio degeneration caused by the bending of the fiber, we can distinguish between higher order modes excited at the beginning of the fiber and during coiling/bending of the fiber by comparing whether the output focal ratio and the input focal ratio are equal. If the two are equal, it means that the higher order modes are excited at the beginning of the fiber. If the two are not equal, it means that the higher order modes are excited during coiling/bending of the fiber.
In order to avoid the influence of coiling/bending caused by using a long fiber, the compound speckle reduction scheme combining two or more speckle reduction approaches to achieve a better reduction effect has been proposed. According to Goodman’s speckle theory [28], each speckle reduction effect from the compound speckle reduction method may be viewed as introducing a certain number of degrees of freedom. If we have r independent mechanisms for introducing new degrees of freedom, then the total number R of degrees of freedom is simply R = r = 1 R R r , and the total contrast of the resulting speckle is as follows: S C = 1 / R . For example, in our previous publications [14,15], the use of short multimode fibers with other static optical elements such as a two-dimensional Barker code diffractive optical element (DOE) could be a technical solution in speckle-free laser imaging systems.
In the fabrication process of the fiber, we should consider the existence of some defects, such as irregular boundaries of core-cladding interface, random fluctuation of refractive index, and random bending of optical fiber axis, which will also affect our experimental results.
Mode coupling takes place in an imperfect fiber waveguide. The variation in the power of the mth mode can be expressed as: Δ P m = n = 1 M h m n ( P m P n ) , where Pm and Pn represent the initial power of the mth and nth modes, respectively. M is the total number of guided modes, and hmn is the coupling coefficient between modes m and n. The higher order modes generated by mode coupling will play a positive role in averaging the speckle patterns. In other words, the speckle contrast at the output end of the multimode fiber is decreased when the mode coupling occurs.

5. Conclusions

Speckle reduction using a multimode fiber has an important advantage in laser imaging systems because it is a passive method that does not increase power consumption or complicate the system. However, when a highly coherent laser is coupled with the multimode fiber, the modal power distribution is actually affected by the excitation conditions, which will have a crucial impact on speckle formation. Therefore, this article mainly investigated the relationship between the speckle contrast at the output of a multimode fiber and inter-mode interference under various excitation conditions. The modal field analysis method was employed to derive a general expression for the speckle contrast at the output of a multimode fiber under different excitation conditions by varying the tilt angle of the Gaussian beam. Moreover, numerical simulations were carried out to investigate the dependence of the speckle contrast on the modal power distribution by changing the tilt angle of the Gaussian beam and on the group delay time difference caused by different fiber lengths. The theoretical results obtained were confirmed by the experimental results. The results show that, with an increase in the tilt angle of the Gaussian beam, the modal power is transferred to higher-order modes and the maximum delay difference between excitation modes becomes larger. Therefore, the inter-mode interference effect is effectively weakened, and the speckle contrast is significantly reduced. The increase in fiber length will also make the delay difference between excitation modes larger and thus the speckle contrast is decreased. For the larger tilt angle of the Gaussian beam, only a shorter optical fiber is required to reduce the speckle contrast significantly. We anticipate that our work will facilitate the use of multimode fibers to produce speckle-free patterns in laser imaging systems.

Author Contributions

Conceptualization, J.Z. and Z.L. (Zichun Le); methodology, J.Z. and Z.L. (Zichun Le); software, J.Z. and Z.L. (Zongshen Liu); validation, Y.G., Q.X. and Y.D.; investigation, J.L. and D.C.; data curation, J.D.; writing—original draft preparation, J.Z.; writing—review and editing, Z.L. (Zichun Le); supervision, Z.L. (Zichun Le); funding acquisition, Z.L. (Zichun Le). All authors have read and agreed to the published version of the manuscript.

Funding

This research was funded by the National Natural Science Foundation of China (grant number 61975183), and the National Key R&D Program of China (grant numbers 2018YFB0504600 and 2018YFB0504603).

Institutional Review Board Statement

Not applicable.

Informed Consent Statement

Not applicable.

Data Availability Statement

Data is available from the corresponding author upon request.

Acknowledgments

J.Z. and Z.L. (Zichun Le) would like to thank A. Lapchuk for the valuable discussions.

Conflicts of Interest

The authors declare no conflict of interest.

References

  1. Murayama, M.; Nakayama, Y.; Yamazaki, K.; Hoshina, Y.; Watanabe, H.; Fuutagawa, N.; Kawanishi, H.; Yemura, T.; Narui, H. Watt-class green (530 nm) and blue (465 nm) laser diodes. Phys. Status Solidi A 2018, 215, 1700513. [Google Scholar] [CrossRef]
  2. Chellappan, K.V.; Erden, E.; Urey, H. Laser-based displays: A review. Appl. Opt. 2010, 49, F79–F98. [Google Scholar] [CrossRef]
  3. Humeau-Heurtier, A.; Mahe, G.; Durand, S.; Abraham, P. Multiscale entropy study of medical laser speckle contrast images. IEEE Trans. Biomed. Eng. 2012, 60, 872–879. [Google Scholar] [CrossRef] [Green Version]
  4. Feng, P.; Yang, L.; Wen, X. Coherent noise reduction in digital holographic microscopy by averaging multiple holograms recorded with a multimode laser. Opt. Express 2017, 25, 21815–21825. [Google Scholar]
  5. Chen, H.; Pan, J.; Yang, Z. Speckle reduction using deformable mirrors with diffusers in a laser pico-projector. Opt. Express 2017, 25, 18140–18151. [Google Scholar] [CrossRef]
  6. Ma, Y.; Chen, X.; Zhu, W.; Cheng, X.; Xiang, D.; Shi, F. Speckle noise reduction in optical coherence tomography images based on edge-sensitive cGAN. Biomed. Opt. Express 2018, 9, 5129–5146. [Google Scholar] [CrossRef]
  7. Ai, J.; Liu, R.; Tang, B.; Jia, L.; Zhao, J.; Zhou, F. A refined bilateral filtering algorithm based on adaptively-trimmed-statistics for speckle reduction in SAR imagery. Biomed. IEEE Access 2019, 7, 103443–103455. [Google Scholar] [CrossRef]
  8. Kubota, S.; Goodman, J.W. Very efficient speckle contrast reduction realized by moving diffuser device. Appl. Opt. 2010, 49, 4385–4391. [Google Scholar] [CrossRef] [PubMed]
  9. Shin, S.C.; Yoo, S.S.; Lee, S.Y.; Park, C.; Park, S.; Kwon, J.W.; Lee, S. Removal of hot spot speckle on laser projection screen using both the running screen and the rotating diffuser. J. Disp. Technol. 2006, 27, 91–96. [Google Scholar] [CrossRef]
  10. Sun, M.; Lu, Z. Speckle suppression with a rotating light pipe. Opt. Eng. 2010, 49, 024202. [Google Scholar] [CrossRef]
  11. Lapchuk, A.; Kryuchyn, A.; Petrov, V.; Yurlov, V.; Klymenko, V. Full speckle suppression in laser projectors using two Barker code-type optical diffractive elements. J. Opt. Soc. Am. A 2013, 30, 22–31. [Google Scholar] [CrossRef] [PubMed]
  12. Lapchuk, A.; Gorbov, I.; Le, Z.; Xiong, Q.; Lu, Z.; Prygun, O.; Pankratova, A. Experimental demonstration of a flexible DOE loop with wideband speckle suppression for laser pico-projectors. Opt. Express 2018, 26, 26188–26195. [Google Scholar] [CrossRef]
  13. Ma, Q.; Xu, C.Q.; Kitai, A.; Stadler, D. Speckle reduction by optimized multimode fiber combined with dielectric elastomer actuator and light pipe homogenizer. J. Disp. Technol. 2016, 12, 1162–1167. [Google Scholar] [CrossRef]
  14. Prygun, A.V.; Morozov, Y.M.; Kliuieva, T.Y.; Borodin, Y.A.; Le, Z. Completely passive method of speckle reduction utilizing static multimode fibre and two-dimensional diffractive optical element. J. Mod. Opt. 2019, 66, 1688–1694. [Google Scholar] [CrossRef]
  15. Le, Z.; Lapchuk, A.; Guo, Y.; Dai, Y.; Gorbov, I. Investigation of speckle suppression beyond human eye sensitivity by using a passive multimode fiber and a multimode fiber bundle. Opt. Express 2020, 28, 6820–6834. [Google Scholar]
  16. Imai, M.; Ohtsuka, Y. Speckle-pattern contrast of semiconductor laser propagating in a multimode optical fiber. Opt. Commun. 1980, 33, 4–8. [Google Scholar] [CrossRef]
  17. Efimov, A. Spatial coherence at the output of multimode optical fibers. Opt. Express 2014, 22, 15577–15588. [Google Scholar] [CrossRef]
  18. Efimov, A. Coherence and speckle contrast at the output of a stationary multimode optical fiber. Opt. Lett. 2018, 43, 4767–4770. [Google Scholar] [CrossRef]
  19. Halpaap, D.; Tiana-Alsina, J.; Vilaseca, M.; Masoller, C. Experimental characterization of the speckle pattern at the output of a multimode optical fiber. Opt. Express 2019, 27, 27737–27744. [Google Scholar] [CrossRef]
  20. Dandliker, R.; Bertholds, A.; Maystre, F. How modal noise in multimode fibers depends on source spectrum and fiber dispersion. J. Lightwave Technol. 1985, 3, 7–12. [Google Scholar] [CrossRef]
  21. Hlubina, P. Spectral and dispersion analysis of laser sources and multimode fibers via the statistics of the intensity pattern. J. Mod. Opt. 1994, 41, 1001–1014. [Google Scholar] [CrossRef]
  22. Manni, J.G.; Goodman, J.W. Versatile method for achieving 1% speckle contrast in large-venue laser projection displays using a stationary multimode optical fiber. Opt. Express 2012, 20, 11288–11315. [Google Scholar] [CrossRef] [PubMed]
  23. Crosignani, B.; DiPorto, P. Coherence of an electromagnetic field propagating in a weakly guiding fiber. J. Appl. Phys. 1973, 44, 4616–4617. [Google Scholar] [CrossRef]
  24. Gloge, D. Weakly guiding fibers. Appl. Opt. 1971, 10, 2252–2258. [Google Scholar] [CrossRef] [PubMed] [Green Version]
  25. Snyder, A.W.; Young, W.R. Modes of optical waveguides. J. Opt. Soc. Am. 1978, 68, 297–309. [Google Scholar] [CrossRef]
  26. Snyder, A.W.; Love, J.D. Optical Waveguide Theory; Chapman & Hall: New York, NY, USA, 1983. [Google Scholar]
  27. Born, M.; Wolf, E. Principles of Optics, 7th ed.; Cambridge University Press: Cambridge, UK, 1999. [Google Scholar]
  28. Goodman, J.W. Speckle Phenomena in Optics: Theory and Applications; Viva Books: New Delhi, India, 2008. [Google Scholar]
  29. Li, J.; Wang, J.; Ding, Y.; Xu, D.; Lin, H.; Jing, F. Effect of fiber coiling mode on modes excitation. Acta Opt. Sin. 2011, 31, s100204. [Google Scholar]
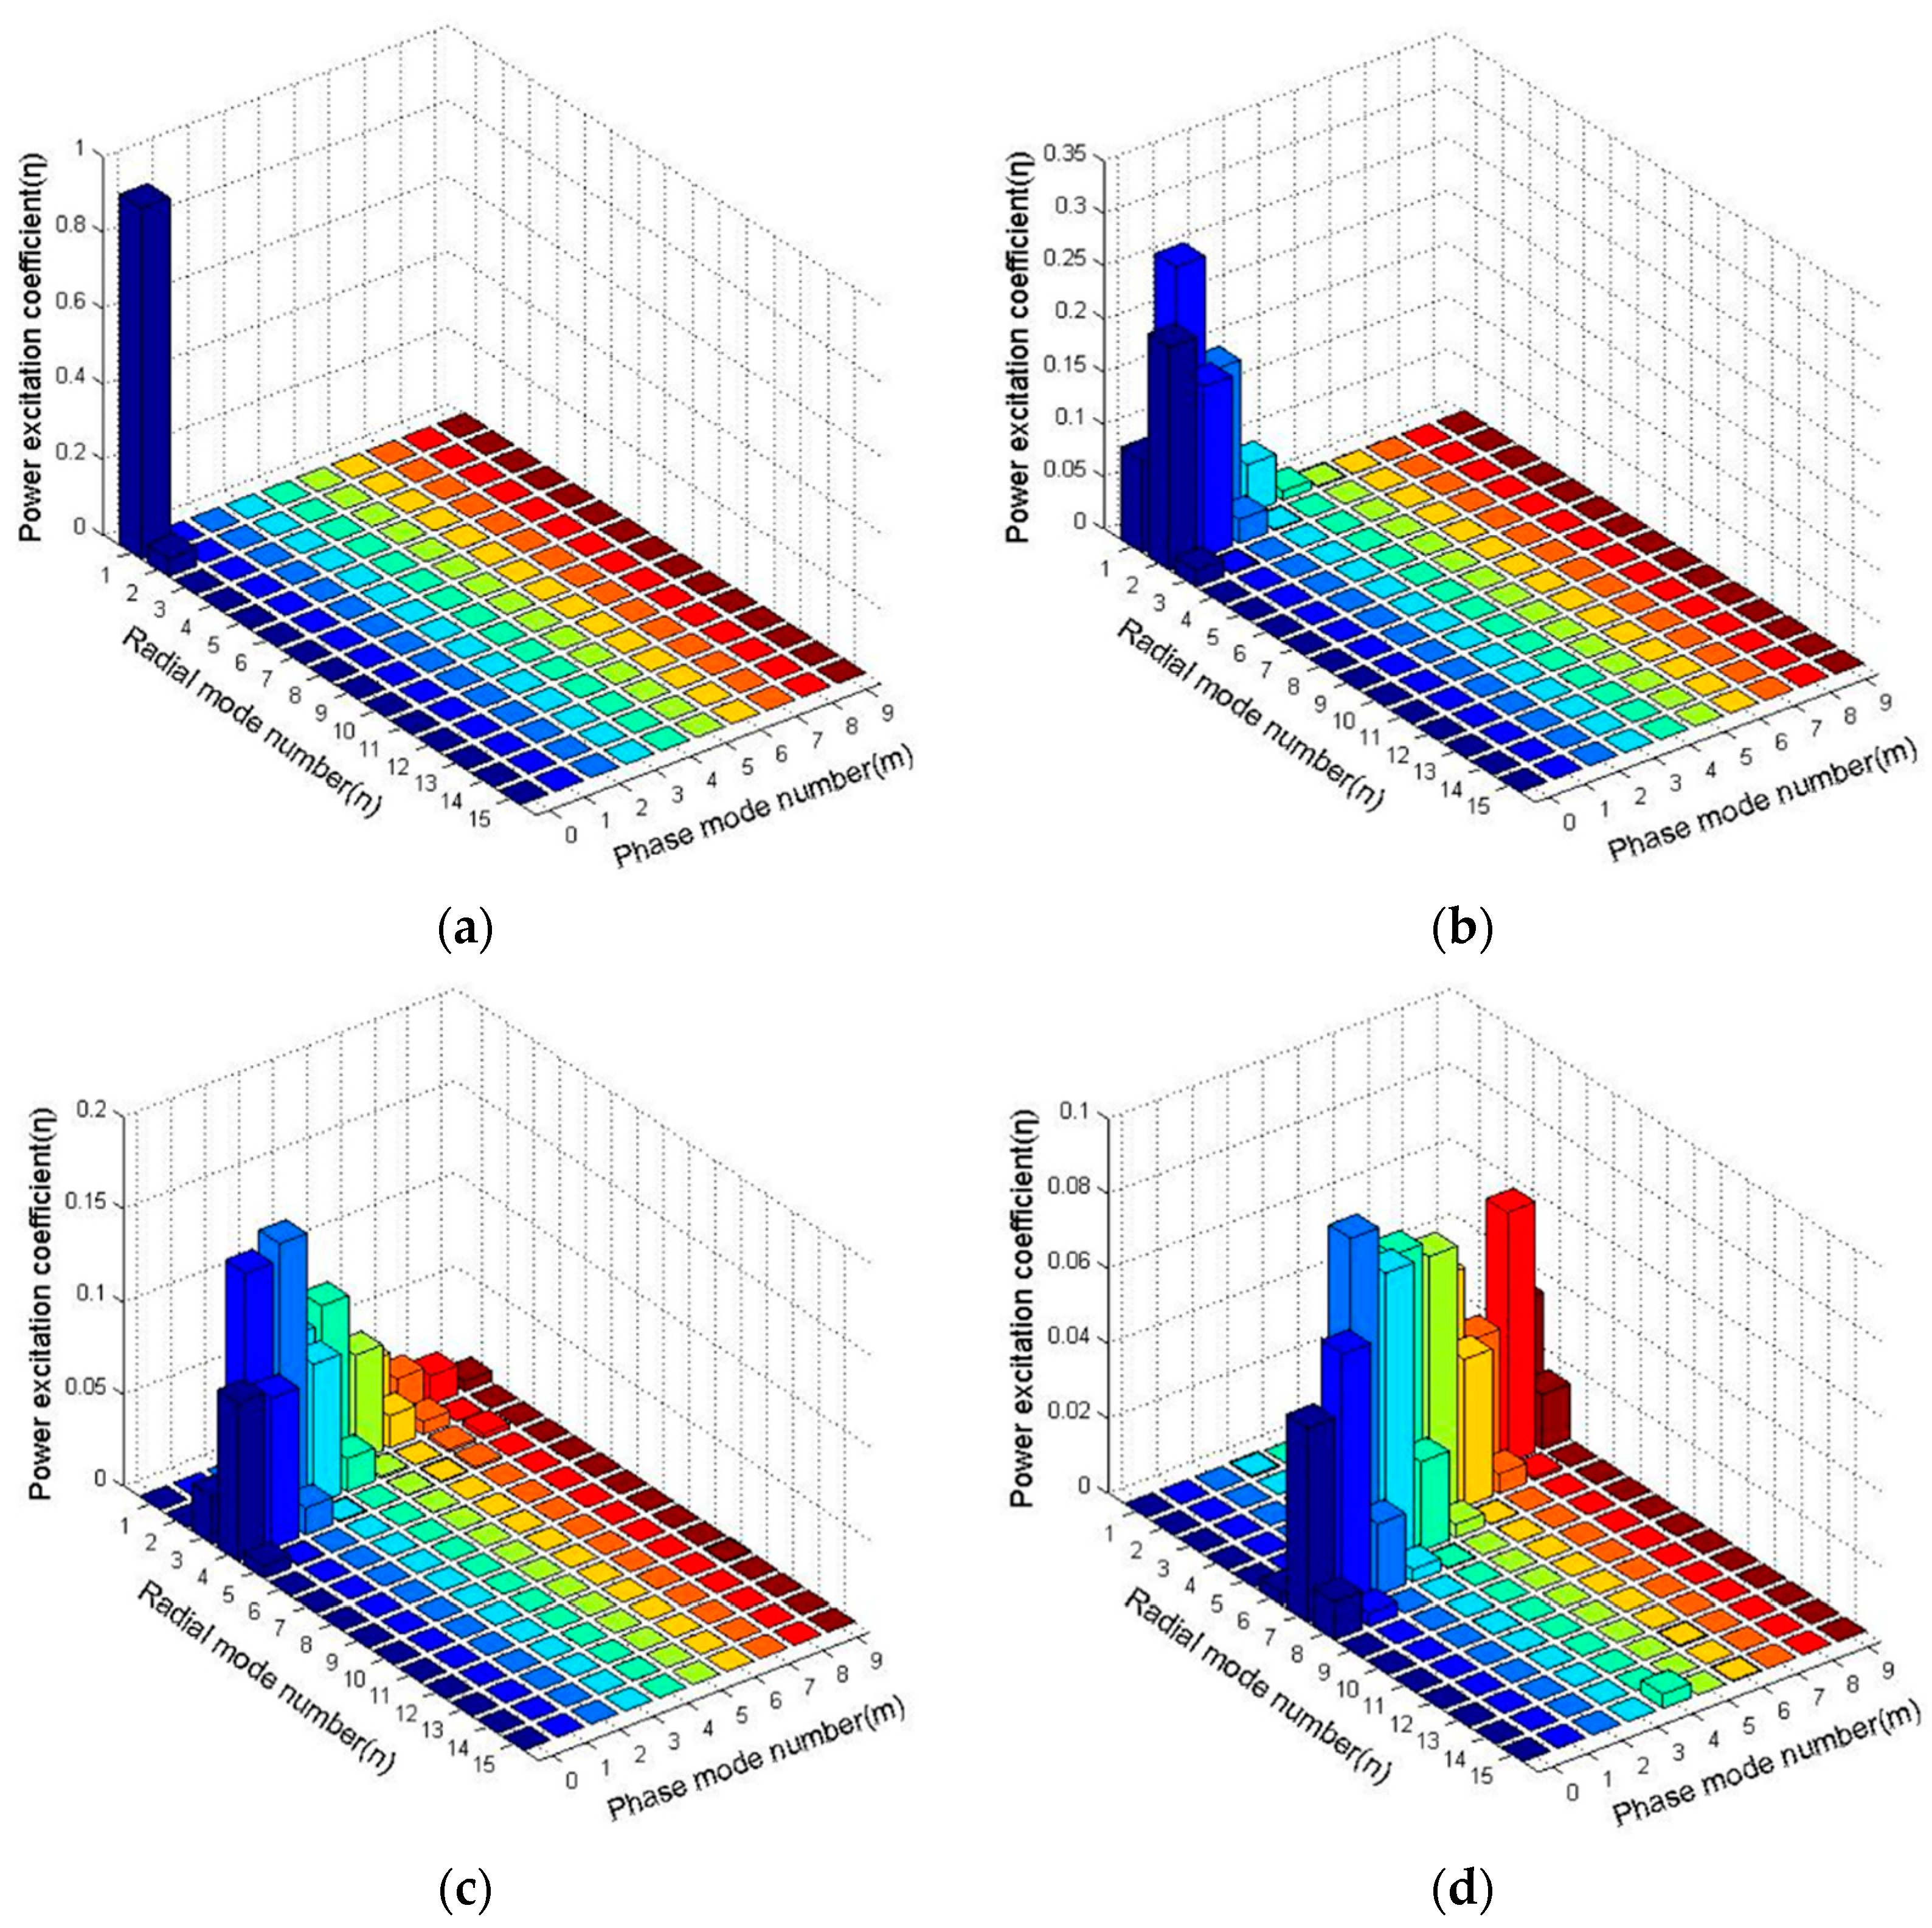
Figure 1. The modal power distributions under various excitation conditions (by varying the tilt angle θ of the Gaussian beam): (a) θ = 0°; (b) θ = 0.2°; (c) θ = 0.5°; (d) θ = 1°.
Photonics 08 00171 g001
Figure 2. The normalized propagation constant b varies with the group delay time of excitation modes per unit length of fiber for the tilt angle θ = 0.2° and 0.5 of the Gaussian beams.
Photonics 08 00171 g002
Figure 3. The experimental setup based on the speckle contrast at the output of a multimode fiber under various excitation conditions (by varying the tilt angle of the Gaussian beam to θ = 0.2°, 0.5°, and 1°). Here, D1 = 1.3 mm, S1 = 60 mm, D2 = 50 mm, S2 = 1800 mm, D3 = 1 mm, S3 = 1000 mm, and S4 = 25 mm.
Photonics 08 00171 g003
Figure 4. The speckle patterns and their 1D intensity distributions are shown when the incident angles of the Gaussian beam θ = 0.5° and 1° with a multimode fiber of length L = 7 m. (a) Speckle patterns under the condition of θ = 0.5° and L = 7 m, SC = 0.17; (b) 1D intensity distribution corresponding to (a); (c) speckle patterns under the condition of θ = 1° and L = 7 m, SC = 0.13; (d) 1D intensity distribution corresponding to (c). The 1D intensity distribution is extracted from the yellow line.
Photonics 08 00171 g004
Figure 5. The speckle contrast from the image on the screen as a function of the incident angle θ = 0.2°, 0.5°, and 1° of the Gaussian beams with multimode fibers of total length L = 2, 4, 7, 10, 15, 20 m.
Photonics 08 00171 g005
Table 1. Excitation modes and power excitation coefficients by varying the tilt angle θ of the Gaussian beam.
Tilt Angle of
the Gaussian Beam
Excitation ModesPower Excitation
Coefficient
θ = 0°LP01η01 = 0.926
θ = 0.2°LP11η11 = 0.259
LP02η02 = 0.211
LP12η12 = 0.161
LP21η21 = 0.148
LP01η01 = 0.087
θ = 0.5°LP23η23 = 0.148
LP13η13 = 0.139
LP42η42 = 0.091
LP04η04 = 0.085
LP32η32 = 0.081
LP14η14 = 0.081
LP33η33 = 0.076
θ = 1°LP26η26 = 0.090
LP36η36 = 0.078
LP45η45 = 0.074
LP55η55 = 0.070
LP17η17 = 0.068
LP84η84 = 0.067
LP64η64 = 0.056
LP07η07 = 0.052
Table 2. The group delay time of excitation modes and the required length of the multimode fiber when the tilt angle of the Gaussian beam is θ = 0.5° and θ = 1°, respectively.
Tilt Angle of
the Gaussian Beam
Group Delay Time (s) of the
Excitation Modes
Maximum Delay Difference Tmax (s) and Minimum Delay Difference Tmin (s)The Degree of Speckle Reduction Corresponds to the Required Length of Multimode Fiber
θ = 0.5°τ23 = 156.760 × 10⁻¹²L
τ13 = 156.736 × 10⁻¹²L
τ42 = 156.751 × 10⁻¹²L
τ04 = 156.762 × 10⁻¹²L
τ32 = 156.731 × 10⁻¹²L
τ14 = 156.790 × 10⁻¹²L
τ33 = 156.785 × 10⁻¹²L
Tmax = 5.9 × 10¹⁴L
Tmin = 0.2 × 10¹⁴L
No significant reduction in speckle
contrast: L < 7.9 m
Significant reduction in speckle
contrast: 7.9 m < L < 234.1 m
Speckle-free imaging:
L > 234.1 m
θ = 1°τ26 = 156.993 × 10⁻¹²L
τ36 = 157.042 × 10⁻¹²L
τ45 = 156.984 × 10⁻¹²L
τ55 = 157.030 × 10⁻¹²L
τ17 = 157.048 × 10⁻¹²L
τ84 = 157.057 × 10⁻¹²L
τ64 = 156.969 × 10⁻¹²L
τ07 = 156.995 × 10⁻¹²L
Tmax = 8.8 × 10¹⁴L
Tmin = 0.2 × 10¹⁴L
No significant reduction in speckle
contrast: L < 5.3 m
Significant reduction in speckle
contrast: 5.3 m < L < 234.1 m
Speckle-free imaging:
L > 234.1 m
Publisher’s Note: MDPI stays neutral with regard to jurisdictional claims in published maps and institutional affiliations.

