Luminosity Measurements at the LHC at CERN Using Medipix, Timepix and Timepix3 Devices


Institute of Experimental and Applied Physics (IEAP), Czech Technical University (CTU) in Prague, Husova 240/5, 110 00 Prague, Czech Republic
Physics 2021, 3(3), 579-654; https://0-doi-org.brum.beds.ac.uk/10.3390/physics3030037
Submission received: 10 April 2021
/
Revised: 22 June 2021
/
Accepted: 25 June 2021
/
Published: 11 August 2021
(This article belongs to the Section High Energy Physics)
Abstract
:The precise determination of the luminosity is essential for many analyses in physics based on the data from the particle accelerator Large Hadron Collider (LHC) at CERN. There are different types of detectors used for the luminosity measurements. The focus of this review is on luminosity measurements with hybrid-pixel detectors and the progress made over the past decade. The first generations of detectors of the Medipix and Timepix families had frame-based readout, while Timepix3 has a quasi-continuous readout. The applications of the detectors are manifold, and in particular, the detectors have been operated in the harsh environment of the LHC. The excellent performance in detecting high fluxes of elementary particles made these detectors ideal tools to measure the delivered luminosity resulting from proton–proton collisions. Important aspects of this review are the performance improvements in relative luminosity measurements from one detector generation to another, the long-term stability of the measurements, absolute luminosity measurements, material activation (radiation-induced) corrections, and the measurement of luminosity from neutron counting. Rather than bunch-average luminosity provided by previous detector generations, owing to the excellent time-resolution, Timepix3 measured the luminosity of individual proton bunches that are 25 ns apart. This review demonstrates the large progress in the precision of luminosity measurements during LHC Run-1 and Run-2 operations using hybrid-pixel detectors, and thus their importance for luminosity measurements in the future of LHC operations.
1. Introduction
Three generations of hybrid pixel detectors have significantly contributed to luminosity measurements at the Large Hadron Collider (LHC) [1] at CERN [2] in the first phase of operation, called Run-1 (2009–2013), and in the second phase of operation, called Run-2 (2015–2018). The detectors were hosted in the cavern of the ATLAS experiment [3]. The generations of hybrid pixel detectors which operated in the ATLAS experiment cavern were Medipix-2 (MPX) [4,5], Timepix (TPX) [6,7,8] and Timepix3 (TPX3) [9,10]. This article reviews the significant progress in the measurement precision of the luminosity with the MPX detectors [11], a comparison with the ATLAS reference luminosity [12], and specifically for neutron counting [13]. Furthermore, results for TPX detectors are reviewed [14], as well as absolute luminosity and activation [15], radiation stability [16], and neutron luminosity measurements [17]. Moreover, TPX3 luminosity measurements encompass, in addition, bunch-by-bunch luminosity measurements [18]. These results, based on technological developments, new methodologies and measurement techniques, will lead the research for future luminosity measurements using hybrid pixel detectors at LHC Run-3 starting in 2021, and the High-Luminosity LHC scheduled to operate at the end of the decade and in the 2030s.
The article is a comprehensive review of a research field that started with the analysis of the LHC Run-1 data for luminosity measurements using the Medipix and Timepix detector families. The Medipix and Timepix detector families have a very successful history of applications over about two decades, starting with the Collaboration Agreement in 1999 between 33 institutions from 15 countries. Recently, the 20th Anniversary Symposium on Medipix and Timepix took place [19].
2. Medipix Internal Precision Luminosity Monitoring
First, let us review the performance of the Medipix detectors as luminosity monitors. A network of 16 MPX silicon pixel devices was installed in the ATLAS detector [3] cavern at CERN. It was designed to measure the composition and spectral characteristics of the radiation field in the ATLAS experiment and its surroundings. This study demonstrates that the MPX network can also be used as a self-sufficient luminosity monitoring system. The MPX detectors collect data independently of the ATLAS data-recording chain, and thus they provide independent measurements of the bunch-integrated ATLAS/LHC luminosity. In particular, the MPX detectors located close enough to the primary interaction point are used to perform van der Meer (vdM) calibration scans with high precision. Results from the luminosity monitoring are presented for 2012 data taken at the center-of-mass energy TeV proton–proton collisions. The characteristics of the LHC luminosity reduction rate are studied, and the effects of beam–beam (burn-off) and beam–gas (single bunch) interactions are evaluated. The systematic variations observed in the MPX luminosity measurements are below 0.3% for one minute intervals.
A comprehensive analysis of data taken by a network of MPX devices is presented. The MPX devices are based on the Medipix-2 hybrid silicon pixel detector, which was developed by the Medipix-2 Collaboration [4]. It consists of a ≈2 cm silicon sensor matrix of cells, bump-bonded to a readout chip. Each matrix element ( pixel, thick) is connected to its respective readout chain integrated on the readout chip. Pulse height discriminators determine the input energy window and provide noise suppression. A counter in each pixel records interacting quanta of radiation, photons, neutrons, electrons, minimum ionizing particles and ions with energy deposits falling within the preset energy window [5]. At LHC, the ALICE, ATLAS, CMS and LHCb Collaborations have elaborate systems of luminosity measurements, described in [20,21,22,23], respectively. A comparative study of their results and the MPX luminosity monitoring is beyond the scope of this article. The methods and techniques described in this article were pioneered for high-precision luminosity determination for the 2012 data-taking period at the LHC. These techniques and analysis methods are based on precision counting of particles passing the sensors. Similar requirements apply to analysis techniques used in other fields of research (e.g., medical applications and space science) where high precision and long-term time-stability of measurements are needed. MPX devices have already been successfully applied in these areas of research and the fundamental studies presented in this article can lead to further advances in their application.
It is shown in this section that the MPX network is self-sufficient for luminosity monitoring. In particular, vdM scans [24] can be used for absolute luminosity calibration. Detailed analysis of the MPX data allows the quantification of the long-term stability over one year of data-taking. It also provides short-term (minute-by-minute) precision. This information is crucial to evaluate the performance of the MPX network as a luminosity monitoring system.
The detection of charged particles in the MPX devices is based on the ionization energy deposited by particles passing through the silicon sensor. The signals are amplified and counted during an adjustable time window (frame) for each pixel. Neutral particles, however, need to be converted to charged particles before they can be detected. Therefore, a part of each silicon sensor is covered by a LiF converter.
The MPX pixel detector can be operated in tracking or counting mode [5]. Every pixel records the number of hits within an adjustable time interval (acquisition time, e.g., between 5 and 120 s).
One of the important features of the MPX devices is the ability to record and identify clusters. Clusters are defined as patterns of adjacent pixels with energy deposits defined in [5] Section 2.2. Different particles that traverse the device cause different cluster shapes. These shapes allow particle identification and the distinction between keV-MeV electrons, photons, energetic hadrons, alpha particles and ion fragments. The energy deposited during the acquisition time can be estimated as well. The data are stored frame-by-frame. After the data acquisition is closed, it takes about 6 s to transmit the status of the full 65,536 pixel matrix. The device is not sensitive during the readout process (dead-time).
The primary goal of the MPX network was to provide information on the radiation composition within the ATLAS cavern (including the thermal neutron component). The MPX detectors also allow the measurement of beam-induced radioactivity during and after collisions. This real-time measurement of the LHC-generated background radiation permits the validation of background radiation simulation studies. Results of 2008 to 2011 MPX data-taking were released in [5] Section 4.
The use of the MPX network for relative luminosity measurements in proton–proton collisions is studied here in detail.
Thirteen out of the sixteen installed devices were used for the analysis. Two detectors were noisy due to radiation damage. One detector was located too far away from the interaction point. Table 1 lists the locations of the detectors and number of registered events (clusters) per unit sensor area and per unit integrated luminosity. Their locations are illustrated in Figure 4.
The structure of this section on MPX is as follows. Section 2.1 describes the luminosity measurements from hit counting, and Section 2.2 describes the luminosity measurements from heavy blob (thermal neutron) counting. The relation between hits and clusters used to evaluate the statistical precision is discussed in Section 2.3. Details of the analysis of MPX data taken during LHC vdM scans for an absolute luminosity calibration are given in Section 2.4. The short-term MPX precision evaluated from a detailed study of LHC luminosity curves is presented in Section 2.5. A summary is given in Section 2.6.
2.1. MPX Luminosity from Hit Counting
The six MPX devices with the highest cluster rates, specified in Table 1, are used (MPX01-05,13). Each device measures the luminosity independently and is cross-checked with the other devices. This is an intrinsic advantage of the MPX network.
Each MPX device has its own acquisition time window independent of the other devices. In order to compare luminosity measurements from different devices, a common time window is introduced, called luminosity block (LB), which is typically one minute long.
A small number of noisy pixels could have a significant effect on the luminosity measurement. Three independent methods differing in procedure and criteria for noisy pixel removal have been tested. The results of their respective luminosity measurements are compared as potential sources of systematic uncertainty.
- Method 1: A pixel is defined as noisy if its count rate is more than five standard deviations from the average. If a pixel is found to be noisy in a 24 h reference period (chosen as the day in 2012 that had the largest number of noisy pixels), it is removed from the entire 2012 data-taking period. A linear interpolation is made between the rates (number of hits per second) in different frames. The hit rate at the middle of an LB is obtained from this interpolation.
- Method 2: Noisy pixel removal is done frame by frame, i.e., a different set of noisy pixels is removed in each frame. Noisy pixels are those with a counting rate that differs from the mean by more than a luminosity-dependent threshold. The MPX luminosity from frames falling within an LB is used without an interpolation. A correction is made for the relative duration of the MPX frames and of the LB.
- Method 3: Noisy pixel removal is done frame by frame. The counts of 15 frames (the frame under investigation and seven frames before and after) are summed, and a pixel is removed if the sum of these counts is above a threshold. An interpolation of the frame hit rate at the time of each LB is done as in method 1.
All three methods show a significant increase in the number of noisy pixels with time, when applied to MPX01 data. This might indicate possible radiation damage in the readout chip. In method 1 (method 2), the number of noisy pixels in MPX01 increases from less than 10 (300) in April 2012 to about 300 (1800) at the end of November 2012. The other devices have a smaller number of noisy pixels since they are exposed to a much lower particle flux (Table 1).
The luminosities measured with the three methods were compared in short (frame-by-frame) and long (7 month) time periods. Depending on the MPX device considered, the frame-by-frame agreement varies from a few percent to less than 0.1% (for MPX01). The largest variation is between method 2 and the other two methods. We have determined that most of this variation is attributed to the conversion between frames and LBs in method 2. In the following, method 1 is used, and thus the same noisy pixels are removed for the whole 2012 data-taking period.
During the analysis of the MPX data, time-shifts between the three readout PCs were noticed. Therefore, they were synchronized off-line by analyzing the rising and falling luminosity curves when an LHC fill starts and ends. A time accuracy better than the LB length was therefore achieved.
In the process of performing the luminosity determination with MPX devices, the activation of the ATLAS detector material was investigated and found to have a negligible effect. A dedicated analysis of activation effects is given in Section 6.2.
First, the hit rates per frame are converted into hit rates per LB for each MPX device separately. The procedure is described below. Frames within the time window of the LB are selected. The hit rates of these frames are averaged. Thus, one hit rate is stored per LB. Given that the acquisition times vary between 5 and 120 s, the number of frames used per LB varies for the six MPX devices. If there is no hit rate for a given LB, the previous LB hit rate is used. In the MPX luminosity analysis, only those LBs are used, for which all six MPX devices (MPX01-05 and MPX13) were operational.
The hit rate for the MPX01 device is normalized to units of luminosity by multiplying with the factor derived in Section 2.4. Then, the other devices are normalized to MPX01 based on the average hit rate for the June to November 2012 running period. Table 2 summarizes the normalization factors.
The average luminosity (MPXav) for all other devices (excluding the one under consideration) is calculated LB-by-LB. Using this normalization factor, each MPX device obtains an equal weight, although the MPX devices have largely varying particle fluxes (hit rates).
The MPX/MPXav ratio is calculated LB-by-LB for the six MPX devices. Figure 5 shows the luminosity ratio per LB for the June–November 2012 data-taking period for MPX01 and MPX13. A single Gaussian fit is applied using the statistical uncertainty in each bin. Table 2 summarizes the Gaussian fit values. The width of these fits vary between 0.6% and 1.2% depending on the MPX device.
In addition, the long-term time stability (internal stability) of the six MPX devices is studied. For this study, the LBs for which all the MPX devices were operational are grouped into 14 time periods, such that each time period contains the same number of LBs. The luminosity ratio of an individual MPX device to the average of all other MPX devices (MPXav) is calculated for each time period and examples for MPX01 and MPX13 are given in Figure 6. A normalization is applied such that the ratio is unity in time period 1 for each MPX device.
A linear fit is applied to the MPX/MPXav luminosity ratio versus time for the June to November 2012 data-taking period. The slope of the linear fit is taken as a measure of time stability. The obtained slope values and their uncertainties are summarized in Table 3. The variance of these slope measurements is 0.69 [% per 200 days]. The resulting standard deviation of 0.83 [% per 200 days] is used as an estimation of the systematic uncertainty.
In summary, for the six high statistics MPX devices the width of the fluctuations LB-by-LB is between 0.6 and 1.2%, and the time-stability from June to November 2012 is better than 1%. This gives us an indication of the time stability of MPX luminosity monitoring.
2.2. MPX Luminosity from Heavy Blob (Thermal Neutron) Counting
Thermal neutrons are detected by MPX devices via reactions in a converter layer with a thickness of 2–3 mg/cm on average [5] (Section 2.3). In MPX tracking mode, tritons and alpha particles are registered by Si-sensors as so-called heavy blobs, HB (large round-shaped pixel clusters). The typical detection efficiency for thermal neutrons is 1%, determined from individual calibrations of the MPX devices in a thermal neutron field [5] (Section 2.3). Hence, the HB count rate is used as a measure of instantaneous luminosity since neutrons are generated in the LHC collisions.
The MPX06 to MPX12 devices are used for the HB (thermal neutron) counting since the pixel matrix occupancy for these devices is sufficiently small for pattern recognition. A dedicated study was performed to determine the misidentification of heavy blobs that are lost due to the overlap with other clusters [5] (Section 2.2). The resulting correction factors, specific to each MPX device, depend on the number of clusters per frame (i.e., on the LHC collision rate, on the device location and on the acquisition time). The precision of these correction factors was estimated to be below 1% with the exception of MPX06 with the largest pixel occupancy. Therefore, MPX06 was not used for the precision study and combination with the other devices.
An analytic model for the cluster overlap probability has been developed and agrees with the experimental results for simple cluster shapes.
The distribution of heavy blobs per frame recorded within the MPX12 region covered by a converter is described well by a Poisson distribution, demonstrated in [12].
For luminosity determination, the overlap corrected number of heavy blobs (cHB) is used for each MPX device. The number of cHB per frame is converted into LBs, similar to the hit analysis. Frames that lie within the time window of the LB are selected. The numbers of cHB of these frames are averaged for all operational MPX devices. Only those LBs for which all MPX devices (MPX07-12) were operational are used.
These LBs are grouped into 14 time periods, such that each time period has an equal number of LBs, in the same way as was done for the hit analysis. For each time period, the number of cHB are summed for each MPX device. The summed cHB are converted into luminosity using a normalization factor such that the luminosity ratio MPX/MPXav of time period 1 is unity. In order to calculate the luminosity ratio MPX/MPXav for each time period, the weighted luminosity average of all the devices (excluding the device under consideration) used in MPXav is determined. For each device and each time period, the statistical uncertainty is , where is the summed number of heavy blobs.
A linear fit is applied to determine the precision of the time history of the ratio between individual MPX devices with respect to the weighted average of all other devices, examples for MPX07 and MPX12 are shown in Figure 7. Table 4 summarizes the slope values and the uncertainties of the linear fits. The variance of these slope measurements is 0.38 [% per 200 days]. The resulting standard deviation of 0.62 [% per 200 days] is used as an estimation of the systematic uncertainty. The (per number of degrees of freedom, ndf) is close to unity; thus statistical uncertainties describe the fluctuations.
In the analysis of HB counting in the LiF-covered detector region, the statistical uncertainties are dominant since the HB count rate is rather small (a few HB per frame).
In summary, the long-term time-stability (internal stability) of from June to November 2015 of the HB analysis is better than 1%, comparing single MPX devices with the weighted average of all other MPX devices.
2.3. Relation between Hits and Clusters
The relation between the number of hits and clusters is investigated in order to determine the statistical uncertainty in luminosity from hit counting. The definition of six cluster types is based on different shapes observed. They are dots, small blobs, curly tracks, heavy blobs, heavy tracks and straight tracks [5] (Section 2.2).
During physics data-taking, MPX01 operates in counting mode. However, during the vdM scans, the occupancy of the device is sufficiently low for tracking particles. As an example, the last horizontal vdM scan of November 2012 (LHC fill 3316) is analysed to determine the ratio between hits and clusters. The data cover a time period of 1186 s, in which 103 frames were taken. The total number of clusters is 155,822. Figure 8 shows the number of hits per cluster, , for two of the six MPX devices with the highest cluster rates without distinguishing cluster types. In summary, the ratio is smallest for MPX01 and largest for MPX13 with . Table 5 lists the number of clusters, hit/cluster ratios and the root mean square (RMS) values. Assuming that one cluster is created by one particle, this ratio corresponds to the hit rate per interacting particle. The fluctuations in the number of particles, not the number of hits, contribute to the statistical uncertainty of the luminosity measurement.
2.4. MPX vdM Scans
vdM scans are used for absolute luminosity calibration at the LHC [24]. The vdM scan technique was pioneered at CERN in the 1960s to determine the luminosity calibration in a simple way. It involves scanning the LHC beams through one another to determine the size of the beams at their point of collision. The scans are performed to determine the horizontal and vertical widths of the beams. These width measurements are then combined with information on the number of circulating protons, allowing the determination of an absolute luminosity scale. Several ATLAS and CMS sub-detectors are used for vdM scans [21,22] since the luminosity calibration is very important for physics analyses.
The study of the MPX data taken during LHC vdM scans in April, July and November 2012 focuses on the horizontal and vertical width determination of the LHC proton beams. The data used in this vdM scan study were taken with the MPX device with the highest count rate. This study demonstrates that the operation of the MPX network is fully adapted to the low-luminosity regime of vdM scans and the high-luminosity regime of routine physics running. Owing to the low statistics in heavy blob (thermal neutron) counting, only the hit counting mode can be used for the vdM data analysis.
The beams are typically scanned transversely across each other in 25 steps. During each step, the beam orbits are left untouched (“quiescent beams”), and the luminosity remains constant for approximately 29 s. The beam separation is then incremented by several tens of microns (“non-quiescent beams”) over an interval of several seconds, during which the luminosity varies rapidly and the luminosity measurements are unreliable. Since the MPX exposure (acquisition) time is about 5 s per frame, followed by a 6 s readout period, two frames typically occur within each quiescent-beam scan step. Occasionally, the MPX devices need to reload their configuration files, in which case the dead time can be as long as 30 s. Therefore, only one frame is recorded in some scan steps.
The beam separation dependence of the measured MPX luminosity is well represented by the sum of a single Gaussian and a constant (Figure 9). The statistical uncertainty for each MPX frame, calculated from the number of hits, is scaled up by a factor to account for the ratio between hits and clusters, as explained before in Section 2.3. In this approach, it is assumed that one particle interacting with the MPX device creates one cluster, and it is the number of particles that leads to the statistical uncertainty.
The precision of the MPX01 device can be determined with respect to the expected statistical precision. For this study, the pull (data-fit)/ is calculated (Figure 10) for the last horizontal vdM scan in November 2012, where and . The sigma of the pull distribution is 1.78, which indicates that additional uncertainties are present beyond the determined statistical uncertainties.
The data show that the sensitivity of the MPX01 device is sufficient to measure the luminosity down to about , four orders of magnitude smaller than the luminosity typical of routine physics data-taking.
The luminosity can be calculated as:
where is the number of bunch crossings producing collisions per machine revolution, and are the average bunch populations (number of protons) in beam 1 and beam 2, respectively, f is the machine revolution frequency (11,245.5 Hz), and () are the convoluted horizontal (vertical) bunch-averaged beam sizes.
The specific luminosity is defined as:
Table 6 summarizes the scan results for all 2012 vdM scans registered with the MPX01 device.
In this section, the last horizontal and vertical November 2012 scans are used for the absolute luminosity calibration. These two scans are described well by a single Gaussian. The horizontal scan (Figure 9) has , and a similar value is obtained for the vertical scan . These ratios indicate that in addition to the statistical uncertainty (augmented by the factor ) systematic uncertainties are also present. The widths of the horizontal and vertical nominal beam sizes, and their uncertainties are µm and µm, respectively. The LHC parameters for fill 3316 are [25] (the cited web page allows to enter the LHC fill number to obtain basic information about the fill):
- Number of bunches: 29
- Average number of protons (in units ) per bunch in beam 1 and in beam 2: and , respectively.
Thus, the resulting luminosity is .
The corresponding number of MPX hits at the peak is determined from a Gaussian fit plus a constant background. The fit provides hits/s at the peak above the background. Thus, the normalization factor between the MPX01 hit rate and the instantaneous LHC luminosity is
The normalization factor for the absolute luminosity is only approximate, since the MPX acquisition time is much longer than the bunch spacing. Therefore, the bunch-integrated luminosity averages over the different bunch profiles.
The uncertainty of due to the bunch-integration by the MPX data-taking has been estimated by simulating 29 overlapping Gaussian distributions, corresponding to 29 colliding bunches, with varying individual widths. The simulated bunches vary in width in equal distances up to %. The envelope of the summed Gaussians is fitted, and the resulting width and height are compared with the nominal value without variations. The width uncertainty is 0.36% and height uncertainty is 0.49%. The fit is repeated 100 times with different sets of random numbers to test the reproducibility. For the determination of luminosity uncertainty, it is assumed that the horizontal and vertical width uncertainties are correlated, and thus the luminosity uncertainty is 0.72%. Furthermore, it is assumed that the widths and height (fitted hit rate) uncertainties are correlated; thus, the uncertainty on the normalization factor is .
Although further uncertainties could arise from non-Gaussian shapes, this study shows that the Gaussian approximation of the sum of Gaussians is quite robust and the luminosity approximation by bunch integration is a sensible approach. No attempt is made for a precise determination of the total uncertainty, which would require a dedicated study [21].
In summary, Figure 9 shows the hit rate and the absolute luminosity determined from the scan widths. The resulting normalization factor is used throughout this section.
2.5. LHC Luminosity Curve and MPX Short-Term Precision
The MPX network precisely measures the LHC luminosity as a function of time. As a proof of principle, it is demonstrated that the MPX network has the capability to study the underlying mechanisms of the rate of reduction of LHC luminosity.
The LHC luminosity reduction is mainly caused by beam–beam interactions (burning-off the proton bunches) and beam–gas (single bunch) interactions by the protons of the circulating beams with remaining gas in the vacuum pipe. The particle loss rate due to proton burn off in collision is proportional to the number of protons in the second power since protons are lost in both colliding bunches. In the case that the protons in a beam collide with remaining gas in the vacuum pipe, the particle loss rate is proportional to the number of protons in the beam. The loss rate of protons N in the colliding beam is thus governed by:
where is the initial number of protons and and are constants related to beam-beam and beam-gas interactions, respectively. This equation has a known solution:
with two known border cases:
and
In the following, the time dependence of the luminosity and of the average number of interactions per bunch crossing, , will be discussed. By definition is proportional to the luminosity L. Since both of these quantities are proportional to , one expects the time dependence of to be described by:
A fit is applied to the data using Equation (8). The uncertainty on the fit result is evaluated by several independent measurements of the MPX network.
The LHC fill 3236, taken on 28–29 October 2012, is investigated in this study. The MPX luminosity is converted to an average interaction per bunch crossing by:
where colliding bunches, 11,245.5 Hz and the inelastic cross-section mb [26]. The fill was chosen since it has a large range from about at the beginning to about at the end.
When studying the MPX measurements of the LHC luminosity, structures resulting from LHC parameter tuning can be noted. These beam tuning adjustments change the shape of the luminosity decrease, and are not described by Equation (8). It is noted that in the first half of a fill these tunings were frequent (about one every hour), while in the second half of a fill, adjustments of the beam were rarely made. Therefore, only the second half of a fill is used for this study and the range to is used for fitting the data distribution.
The fits are shown in Figure 11 individually for MPX01 and MPX13. The fits give the initial number of interactions per bunch crossing , and , summarized in Table 7.
The fit with both parameters and describes the data significantly better compared to that using only one of the two.
Figure 12 shows the difference between the fit and the data for MPX01. The observed structures could be attributed to small LHC luminosity fluctuations not described by the fit function. However, the origin of these fluctuations cannot be determined from the MPX data alone, and thus they are conservatively attributed to MPX systematics. The size of these fluctuations estimated as departure of the data from the fitted curve amounts to an RMS of approximately 0.3%, corresponding to for .
For all high-statistics devices used (MPX01-05 and MPX13), the uncertainties of the fits are dominated by systematic effects. The fit of the MPX01 data, for example, has a much larger than one. Therefore, the fits are repeated with a constant systematic uncertainty for each MPX data point such that . These fit parameters are also summarized in Table 7. The mean values of the beam–beam and beam–gas interactions are:
and
where the given standard deviations are calculated as the square root of the variance from the numbers in Table 7 for constant systematic uncertainties.
The fit results indicate that the LHC luminosity reduction is predominantly caused by the beam–beam interactions since a larger value of corresponds to a shorter lifetime. In addition to the interactions between the proton beams and the remaining gas in the vacuum pipe, there could be other processes which, assuming that they also depend linearly on the number of protons, are incorporated in the value of .
In the following, the expected mean lifetime of inelastic beam–beam interactions is calculated and compared with the experimental results. The mean lifetime from inelastic beam–beam interactions is given by [27]:
where k is the number of bunches, is the initial number of protons per bunch ( protons [25]). The initial luminosity is [25], the number of high-luminosity experiments is (ATLAS [3] and CMS [28]). We obtain and thus
We note that depends on the initial luminosity and the initial number of protons, and thus on the starting value of for the fit. Since , we can write . Thus, for the lower initial luminosity in the fit, one expects a longer lifetime from beam–beam interactions and therefore a smaller
We observe that the fitted value of Equation (10) is larger than calculated using the inelastic cross-section only given in Equation (14). This suggests, as expected, that the proton–proton interaction cross-section leading to the proton loss from the beam is indeed larger than the inelastic cross-section. In addition to inelastic hadronic scattering, hadronic diffractive, hadronic elastic, and Coulomb scattering contribute to the proton burn-off.
Another fit is performed using the combined data from MPX01-05 and MPX13 as a consistency check of the previously described analysis procedure, which used the average of the fit parameters from the individual MPX devices. The fit using the combined data is shown in Figure 13. It gives, as expected, almost identical fit parameters to the ones obtained as the average values of the previous procedure.
The ratio of the data in the first half and the extrapolated fit curve is studied, since the performed fits were based only on data from the second half of the LHC fill 3236. It was found that data at the beginning of the fill are up to 30% above the fit curve. This could indicate that the luminosity decreases more quickly than expected from beam–beam (burn-off) and beam–gas interactions alone at the beginning of a fill, possibly due to non-linear effects with small emittance and short-length bunches. Furthermore, faster reductions in collision rates at the beginning of the fill could arise from denser bunches.
An intrinsic uncertainty in the MPX luminosity measurements results from the bunch integration of the MPX network since the colliding bunches in the LHC contribute with different intensities.
The contour plot of and , given at 68% CL (confidence level) in Figure 14, shows a strong anti-correlation. The individual uncertainties are taken as constant (giving equal weight to the individual MPX devices in the combined data), since the uncertainty of the MPX data is systematically dominated. The constant uncertainty is scaled to , yielding .
This study of the LHC luminosity reduction allows us to investigate the contribution of statistical and systematic uncertainties for each MPX device without relying on comparisons with other luminometers, only using MPX01 data due to its large data statistics. The pull, (data-fit)/, is studied for each high-statistics MPX device individually with . The value is given in Table 5 for each MPX device. Figure 15 shows the pull distribution for MPX01 and MPX13. As expected from the observed structures in Figure 12, the pull value 15.47 (defined as the width of a Gaussian fit) is large for MPX01. The pull values vary between 2 and 3 for MPX02-05 and MPX13, given in Table 8. The uncertainty tends to be statistical in nature since the pull distributions are well described by Gaussians. While the hit statistics of MPX02-05 and MPX13 vary more than a factor 10 (Table 5), the pull is almost device-independent. Thus, the systematic uncertainty in addition to the hit statistics seems to also be of statistical nature. Therefore, the total uncertainty (statistical and systematic) can be described by scaling the statistical uncertainties such that the pull is unity.
Comparing the pull value of MPX01 with those of the other MPX devices, one can see that the statistical precision of MPX01 is high enough that, in addition to the intrinsic MPX uncertainties (scaling with the MPX hit statistics), variations in the LHC luminosity that are not described by the fit function become visible, as shown in Figure 12. This is corroborated by the observation that the pull distributions as a function of time show a structure only for MPX01.
The fluctuations of luminosity not described by the fit function (Figure 12) are interpreted as systematic uncertainty. Therefore, an additional uncertainty corresponding to the RMS of the data deviations from the fit function, , is added in quadrature to the statistical uncertainty. Figure 16 shows the resulting pull distributions for MPX01 and MPX13, and Table 8 summarizes the fit results. The width of the pull distribution is close to unity, as MPX01 was used to derive the systematic uncertainty. For the other MPX devices the pull varies between 1.44 and 2.10. Thus, as for the vdM scan, the fluctuations are about a factor two larger than expected from hit statistics alone for physics data-taking, which is about 3000 times larger in luminosity.
The effect of the varying hit/cluster ratio on the statistical evaluation is studied with a simple Monte Carlo simulation. The goal is to determine whether using the average hit/cluster ratio (2.65 for MPX01), rather than the varying ratios frame-by-frame, could increase the pull value. This study cannot be done with recorded data, since the pixel occupancy is too large during physics data-taking when the pull value is determined. First, a pull distribution has been simulated using a Gaussian distribution with unity width. Then, the statistical uncertainties are reduced by a constant value . Alternatively, they are reduced by a varying factor frame-by-frame, reflecting the MPX01 distribution in Figure 8. Both resulting pull distributions are fitted with a Gaussian. The former gives a width of , as expected, and the latter 1.2. Therefore, there is no increase in the width when using the varying hit/cluster ratios. Compared to the initial Gaussian distribution, the pull distribution with varying hit/cluster ratios shows a higher peak and higher populated side-bands. Thus, it can be excluded that the varying hit/cluster ratio is the source of the observed pull values for MPX02-05 and MPX13 ranging between 1.44 and 2.10 (Table 8).
The following observations could explain the luminosity fluctuations being about twice as large as the statistical expectations from the hit statistics alone:
- The average hit/cluster ratio, in particular for MPX01, could be larger as noisy pixels are not excluded when the ratio is determined.
- The assumption that one cluster corresponds to one particle bears an uncertainty involving the cluster definition.
- Some particles are reflected and could pass the MPX sensor more than once.
- The showering of particles in the ATLAS detector material increases the number of particles passing the MPX devices; thus, the number of independent particles to be used in the statistical determination of the expected uncertainty would be smaller. The determination of this effect would require a full simulation of the material distribution of the ATLAS detector in front of each of the MPX devices, which is beyond the scope of this study. However, the same pull value of about two, observed for all six MPX devices used in the hit study, indicates that the effect is independent of the MPX device and its position.
These effects could lead to a smaller number of independent objects impacting the luminosity measurement. Thus, the statistical uncertainty is presumably larger than from hit counting alone. A reduction of the number of independent objects by about a factor four increases the statistical uncertainty by a factor two and would reduce the pull distribution width to unity.
In summary, Figure 17 shows the contour plot of and , given at 68% CL, for the hit statistical uncertainties and systematic uncertainties from luminosity fluctuations not described by the fit function. They are added in quadrature, given in Table 9. Figure 18 shows the corresponding plots for . The variations of the fit values are well described by the contours. Owing to the strong anti-correlation between and , a transformation of the fit results is performed. The versus plane is used in order to illustrate the relative uncertainty between the fit values. The comparative sensitivities of the MPX devices at 68% CL are summarized in Figure 19.
The analysis performed with LHC fill 3236 data has been repeated with LHC fill 3249 data, taken 31 October to 1 November 2012, for to . The MPX01 results from LHC fill 3249 lead to a relative precision below RMS 0.3% (Figure 20) in agreement with the results from LHC fill 3236. Table 10 gives the relative statistical uncertainties and lists the total uncertainties for RMS 0.2% (obtained in LHC fill 3249) and RMS 0.3% (obtained for LHC fill 3236). The corresponding pull values for statistical and total uncertainties are given in Table 11.
2.6. Results Medipix Detectors Internal Precision
The network of MPX devices installed in the ATLAS detector cavern has successfully taken data from 2008 to 2013. The study presented here focuses on the proton–proton collisions from May to November 2012. This study has demonstrated that the MPX network is well suited for luminosity monitoring. The slopes of the long-term time-stability of the luminosity measurements from both the hit and heavy blob (thermal neutron) counting are below 1%. The uncertainties for the hit analysis are dominated by the systematic effects. For the heavy blob (thermal neutron) analysis, the statistical uncertainties describe the fluctuations. The MPX network has been used as well to study all the vdM scans performed in 2012 in detail. It is demonstrated that the MPX luminosity measurements can cope with a collision rate 1/1000 of the one characteristic for physics data-taking. Although not specifically designed for luminosity measurements, the MPX network gives reliable supplementary information for the luminosity determination of LHC proton–proton collisions. It is demonstrated that the precision of the MPX network is sufficient to study the underlying mechanisms of the LHC luminosity reduction. The evaluation of the variations around the fitted time-dependence of the LHC luminosity is found to give important information on the precision of the individual MPX devices. This study shows that the relative uncertainty on the luminosity measurement is below 0.3% for one minute intervals.
A network of TPX devices [6] (upgraded successors of the MPX devices) was installed as the replacement of the MPX network and operated during LHC Run 2.
3. Medipix Hit Counting Luminosity Performance with Respect to ATLAS Nominal
In this section, the performance of the MPX detectors as luminosity monitors are compared with the performance of the nominal ATLAS luminosity [12]. As already noted in the previous section, pixel detectors have a widespread use in various research fields and applications such as particle and nuclear physics, as well as medical and industrial imaging. A MPX chip developed at CERN in the framework of the Medipix2 Collaboration [4] is an example of such a device. The data of the MPX devices are recorded in frames that contain the status of all the 65,536 pixels after a given exposure time of the order of 1 s to 100 s. The dead time after each frame is about 6 s for data readout. The MPX devices can effectively be used for continuous measurements of the composition of complex radiation fields [5]. The network of MPX devices was primarily designed to provide real-time measurements of the composition (photons, neutrons and charged particles) and of the spectral characteristics of the radiation environment inside the ATLAS detector. The large dynamic range of the MPX devices allows the measurement of the natural radiation background and of the induced activity during and after collision periods. The devices record the decay of radioactive nuclei generated in ATLAS during LHC collisions. This measurement of the LHC-generated radiation field composition permits the validation of radiation simulation studies. Previously, descriptions and results from 2008–2011 MPX radiation field measurements have been released [5].
Sixteen devices placed in the ATLAS detector are read out independently. Out of these, two had high noise and one was located in the data-acquisition room, so only thirteen are used in this analysis. Table 1 lists the location and number of registered events (clusters) per sensor area and per unit integrated luminosity of these thirteen MPX devices.
The luminosity monitoring is based on the measurement of the integrated rate of particles interacting with the 300 m-thick silicon sensor (hit rate measurement in the so-called counting mode [5]). The hit rates per frame are converted into luminosity using a normalization factor for each MPX device. The integrated hit rate corresponds to the integrated luminosity reported by the reference ATLAS luminosity algorithm ( algorithm [21] using the Beam Conditions Monitor, BCM [29]), during an ATLAS run chosen as a reference (LHC fill 2649, 21 May 2012). The MPX devices operated reliably starting from 2008 even in places where the radiation level was high. The advantage of the devices is that they have 65,536 independent channels (pixels). Figure 21 shows an example of the hit luminosity measured with MPX01 and the ratio of the MPX luminosity with respect to the ATLAS BCM reference luminosity. The relative linearity of the MPX and BCM luminosity measurements is illustrated by Figure 22. In a run selected for covering a particularly wide span of bunch-luminosity values, the residual of a linear fit displays no systematic non-linearities down to the sub-percent level, for a bunch-averaged pile-up parameter varying from 8 to 26 inelastic interactions per bunch crossing. The purpose of the plot is to show that there is a linear relationship between the BCM and MPX luminosities. Since the luminosity range is limited, it is possible that the linearity is not perfect when extrapolating to zero luminosity.
In addition to the counting mode, devices with low cluster rates (MPX06 to MPX12) can also be operated in the so-called tracking mode [5], which allows recognition and categorization of different types of radiation by their characteristic track signature (cluster shape). This mode is used for luminosity measurements by counting thermal neutrons.
In the process of performing the luminosity determination with MPX devices, the activation of the ATLAS detector material has been investigated and found to have a negligible effect.
3.1. MPX Luminosity from Hit Counting with Respect to ATLAS Nominal
An advantage of the MPX network for luminosity measurements is that there are multiple independent devices at different locations installed in the ATLAS detector and in the cavern. This allows comparative studies to cross-check independent hit luminosity measurements by the thirteen MPX devices that were used for this analysis.
In order to ensure that the results do not depend on the analysis method used, three independent analyses have been performed and the results are compared. The MPX luminosity data are saved in a different time window (acquisition frame time) than the ATLAS luminosity. The basic time unit for storing ATLAS luminosity for physics use is the Luminosity Block (LB), which is typically one minute long. The three methods differ in the procedure and criteria for noisy pixel removal (a potential source of systematic uncertainty in hit-counting mode), and for scaling the raw hit counts from the exposure window of each MPX device to the duration of the matching ATLAS LB. The three methods are described in Section 2.1.
For long-term comparison, the MPX hit luminosities from the three methods were studied with respect to the BCM reference luminosity. About the same variations of the MPX/BCM luminosity ratio as a function of time were observed with the different methods.
In order to study the relative long-term stability of the luminosity measurements, the ratio of the MPX luminosity to the ATLAS reference luminosity, from May to November 2012, is shown in Figure 23, with a binning in 14 time periods. For this analysis, method 1 is taken as a baseline for hit counting.
The ratios measured by different MPX devices are divided into three groups. The devices shown in Figure 23a display an increase of about 2% over the 2012 running period, while the ratios in Figure 23b,c show an increase of 1% or less over the same period. The devices are listed in Table 1 together with their cluster rates, and although there is some indication that high rate devices show an increase while low rate devices do not, the picture is not conclusive. The slightly different time dependence of results from different MPX devices was previously not understood, and the conclusion was therefore that the long-term internal consistency of the MPX system was at the 2% level.
3.2. MPX Luminosity from Thermal Neutron Counting with Respect to ATLAS Nominal
The chosen acquisition times allow the measurement of the thermal neutron counts for MPX06 to MPX12, as for these devices, the total cluster occupancy per frame has a correctable overlap, i.e., at most a few hundred clusters per frame. A dedicated study was performed to determine the misidentification of heavy blobs that are lost due to the overlap with other clusters [5]. The resulting correction factors, which are specific to each MPX device, depend on the number of clusters per frame (i.e., on the luminosity and on the device location); they vary between one and about two. The precision of these correction factors was estimated to be below 1% using different data sets. These results were also confirmed by an independent analytic study, which calculated the cluster overlap probability for a simple cluster type and found very good agreement with the experimentally determined overlap probability.
Figure 24 shows the distribution of the number of heavy blobs per frame below the converter for MPX12. The results from MPX luminosity measurements using thermal neutron counting are shown in Figure 25 for the MPX06 to MPX12 devices.
There is no indication of a significant slope from the luminosity measured by the heavy blob analysis (thermal neutron counting) in any of the MPX devices, when normalized to the BCM measurement, although for some devices the statistical precision is not sufficient to test deviations at the percent level. We recall that MPX06 indicates a 2% slope for the luminosity from hit counting and the same device measured no slope for the luminosity from neutron counting. In the current analysis of the MPX data, the difference between the luminosity monitoring using hits and heavy blobs is noted, and further studies are required for an understanding of the underlying reason.
3.3. Internal Consistency of MPX and Other ATLAS Relative-Luminosity Measurements
The relative long-term stability of the MPX luminosity measurements is compared to that of other ATLAS luminometers (BCM, LUCID, FCal and Tile) [21] in Figure 26a. Both LUCID algorithms and the algorithm remain consistent, within about 1%, with the reference algorithm , as does the MPX-averaged neutron measurement (Figure 26b) and the MPX-hit luminosity reported by MPX11 (see also Figure 23c). In contrast, the calorimeter-based, bunch-averaged luminosity measurements display a systematic drift of about 2% with respect to the results of the reference algorithm over the 2012 running period, as do the MPX02 hit-luminosity measurements (Figure 23a). It is difficult to draw any clear conclusion since the full set of thirteen MPX devices analyzed in this note have slopes as a function of time that span the range of slopes observed in the other ATLAS luminosity detectors. Further analysis may identify specific features of these detectors that would explain the slope variations, but at that time, an overall uncertainty of about 2% appeared to be required to describe the data. Overall, the relative long-term stability of the MPX luminosity measurements was comparable to that of the other ATLAS luminometers.
3.4. MPX vdM Scans with Respect to ATLAS Nominal
vdM scans are used for absolute luminosity calibration at the LHC [21]. In studies of ATLAS vdM data with MPX devices, the focus is on the comparison of the ratio of MPX versus the BCM luminosity measurement in order to quantify the relative stability of the BCM and MPX luminosity calibrations, both from one vdM scan session to the next (April, July and November 2012), and between the low-luminosity regime of vdM scans and the high-luminosity regime of routine physics running. The beams are scanned transversely across each other in typically 25 scan steps as explained in Section 2.4.
The beam-separation dependence of the measured luminosity is reasonably well represented by the sum of a single Gaussian plus a constant for both the BCM data (Figure 27a) and the MPX data (Figure 27b). The data show that the sensitivity of the MPX01 device is sufficient to measure the luminosity down to about , four orders of magnitude smaller than the luminosity typical of routine physics running. The sensitivity of the hit method, therefore, potentially allows the MPX to be used to cross-check the calibration transfer of other luminometers (BCM, LUCID, Tile) from vdM scans to physics conditions.
Figure 28 demonstrates that, on average, the MPX response is a linear function of the ATLAS reference (BCM) luminosity down to very low luminosities (≈), albeit with fluctuations of up to 10% (at constant luminosity) that cannot be explained by statistical arguments. It has been established that the fluctuations arise from the MPX measurements rather than the BCM measurements by comparing scan-step-by-scan-step and by comparing the luminosity values reported by multiple BCM and LUCID algorithms which are consistent within a fraction of a percent. Similar fluctuations of the MPX response, also of apparently non-statistical origin, have been observed at much higher luminosity during routine physics running. These issues remain under study.
3.5. Results of Medipix Hit Counting Luminosity Performance with Respect to ATLAS Nominal
This section describes the initial application and comparison of MPX luminosity monitoring with respect to other ATLAS luminometers. In the initial study described in this section, it was demonstrated that the MPX network has an internal consistency of about 2% using different detectors and techniques for hit counting and heavy blob (thermal neutron) counting as measures of luminosity. This number was comparable to the preliminary discrepancy found in the long-term comparisons between other luminosity detectors in ATLAS in the same time period. In addition, the MPX network was used to study in detail the three vdM scan periods performed in 2012, in a regime where the luminosity is four orders of magnitude lower than during routine physics data-taking. Although not specifically designed for luminosity measurements in ATLAS, the MPX network gives reliable supplementary information for the overall ATLAS luminosity determination over a wide dynamic range (luminosities from about to ).
4. Medipix Neutron Counting Luminosity Performance with Respect to ATLAS Nominal
This section reviews the luminosity from thermal neutron counting with MPX detectors and the relation to the ATLAS reference luminosity. The ATLAS Collaboration published final TeV luminosity results. This made it possible to perform a detailed comparison and verify the potential of the thermal neutron counting as a novel method for luminosity measurements to supplement the well-established presently used procedures. This measurement is unique to the MPX network and has the advantage that the neutrons, which pass the MPX devices, cannot result from activation processes of material nearby. Good agreement is found between the MPX neutron counting results and the ATLAS reference luminosity. The differences between the ATLAS and MPX luminosity measurements are described by a Gaussian distribution with a width of 1.5%.
A comparison of ATLAS results and the luminosity measured with MPX devices was beyond the scope of the MPX paper [11]; however, results from MPX hit counting were included in the ATLAS publication [30]. In this section, the MPX luminosity measurement from thermal neutron counting is compared with the ATLAS results. Thermal neutron counting has not been used so far as a cross-check algorithm in ATLAS, owing to its high statistical uncertainty. The statistical sensitivity of thermal neutron counting improved with the TPX detectors installed in ATLAS [6] for LHC Run 2. Possible systematic uncertainties of thermal neutron counting are assessed by a detailed comparative study with ATLAS [30], for which the numerical luminosity information has been recently provided.
Any additional information on luminosity will to some extent improve the overall measurement by addressing different type of systematic uncertainty and reducing the statistical uncertainty. This comparison is thus highly motivated. It is novel and became possible only with the release of detailed ATLAS luminosity results in the time period overlapping with the MPX measurements.
Neutral particles need to be converted to charged particles before they can be detected. Therefore, a part of each silicon sensor is covered with a LiF converter for thermal neutron detection. Pulse height discriminators determine the input energy window and provide noise suppression.
The devices MPX07 to MPX12 are used for the presented analysis of the neutron counting luminosity. Their locations are given in Table 1, which also lists the respective count rates per unit sensor area and per unit integrated luminosity.
Section 4.1 describes the luminosity measurements from thermal neutron counting. A comparison of the MPX results with the results from the ATLAS luminosity measurement is given in Section 4.2.
4.1. MPX Luminosity from Thermal Neutron Counting
Thermal neutrons are detected by MPX devices via reactions in a converter layer with thickness of about 3 mg/cm on average [5] (Section 2.1). Further details are given in Section 2.2 and Section 3.2.
For the devices MPX07 to MPX12, the pixel matrix occupancy is sufficiently small for pattern recognition and to determine the HB (thermal neutron) count rate. A dedicated study was performed to determine the misidentification of heavy blobs that are lost due to the overlap with other clusters [5] (Section 2.2). The resulting correction factors, specific to each MPX device, depend on the number of clusters per frame (i.e., on the LHC collision rate, on the device location and on the exposure time). The precision of these correction factors was estimated to be better than 1% (Section 3.2).
The distribution of heavy blobs per frame recorded within the region covered with a converter is described well by a Poisson distribution, as demonstrated in [12] (Figure 24).
For the luminosity determination, the overlap-corrected number of heavy blobs (cHB) is used for each MPX device. The number of cHB per frame is converted into the number of cHBs per luminosity block (LB) [11]. Frames are selected that lie within the time window of the LB and the numbers of cHB of these frames are averaged. Only those LBs that are used for which all MPX devices (MPX07-12) were operational.
These LBs are grouped into time periods corresponding to an ATLAS run with varying length from about one to twelve hours. The precise time ranges of the ATLAS runs are used [30]. For each LB time interval, the number of cHBs is summed over all six MPX devices used in this analysis. The summed cHBs are converted into luminosity by using a normalization factor such that the luminosity ratio determined from MPX hits [11] and MPX clusters is unity for the data taken on 16 September 2012.
For each device and each time period, the statistical uncertainty is , where is the summed number of heavy blobs without applying the overlap correction factor. The statistical uncertainties are dominant in the analysis of HB counting in the LiF-covered detector region since the HB count rate is rather small (a few HB counts per frame).
4.2. Comparison of MPX and ATLAS Luminosity Measurements
The ATLAS luminosity measurements are based on several luminometers, and detailed studies led to an overall uncertainty of 1.9% [30]. For this comparative study of the MPX thermal neutron luminosity with the ATLAS luminosity measurements, the ATLAS run-by-run consistency is relevant. The relative ATLAS run-by-run uncertainty is 0.5% [30].
The ratio of the ATLAS reference luminosity [30] and the MPX luminosity measurements is shown in Figure 29 as a function of time. The data of each recorded run are combined, and the statistical uncertainty is indicated by the error bars. A few runs are very short (less than one hour), and thus the accumulated number of heavy blob clusters is small, leading to a large statistical uncertainty.
The relative differences between the MPX and ATLAS luminosity measurements are approximately described by a single Gaussian fit with width of % (Figure 30). The width is dominated by the statistical uncertainty of the MPX measurement.
The pull distribution is shown in Figure 31, assuming that the relative uncertainty is governed only by . The Gaussian fit of the pull distribution has a width (sigma) of . It demonstrates that the uncertainty of the neutron counting luminosity is close to the statistical expectation.
The thermal neutron analysis is independent of activation effects of materials near the MPX devices. This activation was observed in the MPX hit analysis [11]. Therefore, differently than in the hit counting luminosity measurement, this particular uncertainty is absent in the present analysis. A dedicated study on activation is reviewed in Section 6.2.
4.3. Results of Medipix Neutron Luminosity Versus ATLAS Nominal
An independent approach to determine the LHC luminosity is presented using thermal neutron counting. The results are compared with published ATLAS luminosity results. Good agreement is found within the statistical uncertainties. For a run-by-run analysis, the relative precision is 1.5%. There is complementarity of the cluster counting and the earlier published hit counting, and also a different set of MPX devices were used. While a hit luminosity analysis has high statistics and its uncertainty is dominated by systematic effects with a precision of 0.3%, the presented cluster analysis is dominated by statistical uncertainties owing to the limited cluster statistics. The neutron analysis is not affected by radioactive activation effects of material near the devices. A network of TPX devices (upgraded successors of the MPX devices) was installed as a replacement of the MPX network for the Run-2 LHC operation [6]. With this TPX network, higher cluster rates were recorded and it was anticipated that the statistical uncertainty in the thermal neutron luminosity analysis were reduced. This is discussed in the following sections.
5. Timepix Internal Luminosity Precision
This section addresses precision luminosity of LHC proton–proton collisions at 13 TeV using hit-counting with TPX pixel devices. A network of Timepix (TPX) devices installed in the ATLAS cavern measures the LHC luminosity as a function of time as a stand-alone system. The data were recorded from 13 TeV proton-proton collisions in 2015. Using two TPX devices, the number of hits created by particles passing the pixel matrices was counted. A vdM scan of the LHC beams was analyzed using bunch-integrated luminosity averages over the different bunch profiles for an approximate absolute luminosity normalization. It is demonstrated that the TPX network has the ability to measure the reduction of LHC luminosity with precision. Comparative studies were performed among four sensors (two sensors in each TPX device), and the relative short-term precision of the luminosity measurement was determined to be 0.1% for 10 s time intervals. The internal long-term time stability of the measurements was below 0.5% for the data-taking period.
A TPX detector network [6] of sixteen devices was installed in the ATLAS cavern at CERN. Each TPX device consists of two stacked hybrid silicon pixel sensors. The silicon sensors have a matrix of pixels of μm pitch, and thickness of μm (further indicated as layer 1) and μm (layer 2) [7]. The readout chips connected to these sensors have the original Timepix design [8]. The installation of the TPX devices took place during the LHC shutdown transition from Run-1 to Run-2 in 2013/2014. These double-layer TPX devices replaced the previously operational network that employed single-layer Medipix assemblies [5,31].
These devices measure the primary and secondary particle fluxes resulting from 13 TeV proton–proton collisions. The data were taken in 2015 during the first year of LHC Run-2 operation. Precision luminosity measurements are of particular importance for many physics analyses in high-energy physics.
The use of the TPX network for luminosity measurements has several advantages compared with the previous luminosity measurements [11] at LHC during Run-1 that used MPX devices. Regarding the luminosity monitoring, the two-layer hodoscope structure of the TPX devices doubles the measurement statistics and allows one to determine the precision and long-term time stability of individual TPX devices. The dead-time caused by the readout was reduced from about 6 s to 0.12 s, allowing a much higher data acquisition rate. Furthermore, the TPX devices are operated in three different modes [8]: (1) hit-counting; (2) time-over-threshold (energy deposits and cluster-counting); and (3) time-of-arrival (cluster-counting). Furthermore, the proton–proton collision energy increased from 8 TeV at LHC during Run-1 to 13 TeV at Run-2, which opened a new energy frontier for luminosity measurements in colliders.
The TPX network, like the MPX network, is self-sufficient for luminosity monitoring. It collects data independently of the ATLAS data-recording chain and provides independent measurements of the bunch-integrated LHC luminosity, in particular, vdM luminosity calibration.
The detection of charged particles in the TPX devices is based on the ionization energy deposited by particles passing through the silicon sensor. The signals are processed and digitized during an adjustable exposure time (frame acquisition time, from 1 ms to 1 s) for each pixel. Neutral particles, namely neutrons, however, need to be converted to charged particles before they can be detected. Therefore, a part of each silicon sensor is covered by LiF and polyethylene converters [7,32].
Thirteen out of the sixteen installed devices have been used for luminosity analysis. Two devices were found to be inoperational after the closing of the ATLAS detector, and one device was intentionally located far away from the interaction point, and therefore was unusable for luminosity measurements. The highest precision was obtained with TPX02 and TPX12. Figure 32 gives their location among the other TPX devices, and Table 12 lists the locations of these devices used in this analysis, and their numbers of registered passing particles (clusters), normalized to 100% acquisition time [15]. It is noted that the number of clusters for the μm sensor is about 20% larger compared with that for the μm sensor. This percentage is lower than might be expected from the 40% larger sensitive volume, because the extended clusters induced by a single particle count only “one” in the thin as well as in the thick sensor. The number of photon conversions and fast neutron interactions, however, will increase with the sensitive volume. The analysis described in this section is focused on the precision luminosity determination with the devices TPX02 and TPX12, which are operated with 1 s exposure time and analysed in hit-counting mode. As their positions are very similar in R and Z coordinates on opposite sides of the proton–proton interaction point, their count rates are very similar. During 2015, LHC proton–proton collisions’ typical luminosities were 3–5 3000–5000 μ, and the TPX count rate was a few hits/s per sensor.
Figure 33 shows an example of the luminosity from hit-counting measured with TPX02 layer 2 for LHC fill 4449, taken on 2–3 October 2015. All times are in GMT.
The TPX part is structured as follows. First, the concept of LHC luminosity monitoring from TPX hit-counting is introduced in Section 5.1. The vdM scan analysis based on hit-counting (Section 5.2) is summarized for an absolute luminosity calibration. In Section 5.3, the LHC luminosity curve is determined by using the concept of averaged interactions per bunch-crossing together with the TPX measurement precision. Section 5.4 describes the luminosity precision by evaluation of the difference between two layers of the same TPX device. The long-term luminosity precision is given in Section 5.5 from the comparison of layers 1 and 2 luminosity of the same TPX device. The long-term luminosity precision from different TPX devices is given in Section 5.6. Finally, results are given in Section 5.7.
5.1. LHC Luminosity from TPX Hit-Counting
The data from the TPX02 and TPX12 devices were used in hit-counting mode, both having similar count rates as specified in Table 12. The particle fluxes are normalized to 100% acquisition time. The devices measure the luminosity independently, and their measurements are cross-checked with each other. A constant exposure time of 1 s was used for the entire 2015 data-taking.
A small number of pixels becoming weak or noisy (e.g., due to radiation damage) could have a significant effect on the luminosity measurement. Therefore, pixels with a count rate that is at least away from the mean are excluded for each sensor region (uncovered and with converters) [14]. This requirement identifies about 7–13% of the pixels on layers 1 and 2 both for TPX02 and TPX12 per LHC fill, including 5–10% of pixels at the boundaries of the sensor regions and edges of the sensor matrix. Then, the logical OR of identified pixels per LHC fill was taken for all 2015 LHC fills to remove 19–22% of the total number of pixels of the sensors. The effect of the pixel removal on the analysis was also studied with and criteria, with the result that the analysis outcome regarding the LHC luminosity curve, measurement precision and long-term stability remained unchanged.
The hit rate for the four TPX sensors is normalized to units of luminosity by multiplying with a scaling factor, as given in Section 5.2.
The induced radioactivity of material in the ATLAS cavern has no significant effect on the high-luminosity determination as determined by a dedicated study in Section 6.2, which demonstrates the effect for low-luminosity runs (vdM scans).
In addition to the hit-counting, luminosity can be measured with the two other modes of TPX operation based on cluster-counting and summed energy deposits.
The relation between the number of hits and clusters (particles) is investigated in order to determine the statistical uncertainty of the luminosity measurement from hit-counting. The average ratio of hits per cluster is approximately , which was obtained with TPX data from a low-intensity LHC fill for which the clusters on the sensors were well separated. This factor is used for the statistical uncertainty determination in the following sections, assuming that one cluster corresponds to one independent particle passing the device [11].
5.2. TPX vdM Scans
As described in Section 2.4 for the MPX data analysis, vdM scans are also used for absolute luminosity calibration using the TPX devices. This scan technique pioneered by Simon van der Meer [24] allows one to determine the beam sizes in terms of the horizontal and vertical widths of the beams at the point of collision. These width measurements are then combined with information on the number of circulating protons, allowing the determination of an absolute luminosity scale. The vdM scan analysis is based on the data taken on 24–25 August 2015 using TPX02 and TPX12 layer 1 and layer 2.
The LHC beam separation dependence of the measured TPX luminosity is well represented by the sum of a single Gaussian and a constant (Figure 34). The absolute luminosity normalization is derived from the combination of the hit rate, the horizontal and vertical convoluted widths, and the average bunch currents.
The measurement uncertainty of the TPX devices can be determined with respect to the expected statistical uncertainty. For this study, the pull distributions, as defined by (data-fit)/, were determined, where , and . Figure 35 shows the pull distribution for the first horizontal vdM scan in August 2015, as seen by TPX02 layer 2. The sigma of the pull distribution averaged over TPX02 and TPX12, layers 1 and 2, for both horizontal and vertical scans is , which indicates that additional uncertainties are present beyond the determined statistical uncertainties or correlations in the statistical evaluation have a significant effect as discussed in Reference [11]. Furthermore, transverse proton-bunch profiles are not expected to be perfectly Gaussian; and even if they were, a scan curve summed over Gaussian bunches of different widths would not be strictly Gaussian. Therefore, non-Gaussian contributions to the vdM-scan curves may contribute, at some level, to the widening of the pull distribution.
For TPX02 layer 2, the widths of the beam sizes (horizontal and vertical nominal beam separations) and their statistical uncertainties are μm and μm, respectively.
The luminosity can be calculated as
where is the number of bunch crossings producing collisions per machine revolution, and are the average bunch populations (number of protons) in beam 1 and beam 2, respectively, f is the machine revolution frequency (11,245.5 Hz), and and are the convoluted horizontal and vertical beam sizes. The LHC parameters for fill 4266 are [25]:
- Number of bunches: ;
- Average number of protons (in units ) per bunch in beam 1 and in beam 2: and , respectively.
Thus, the resulting luminosity is .
The specific luminosity is defined as
Table 13 summarizes the scan results for the first pair of vdM scans (horizontal and vertical) registered with TPX02 and TPX12 for both their layers.
For TPX02 layer 2, the fits of horizontal and vertical scans provide and hits/s, respectively, at the peak above the background. The average number is () hits/s. Thus, the normalization factor between the TPX02 layer 2 hit rate and the instantaneous LHC luminosity is
The normalization factors for the other devices were calculated using the same procedure, and the results are summarized in Table 14.
As already noted for the previous LHC Run-1 vdM scan analysis using MPX devices [11], the normalization factor for the absolute luminosity is only approximate, since the TPX exposure time is much longer than the bunch spacing. Therefore, the bunch-integrated luminosity averages over the different bunch profiles. In order to estimate the resulting uncertainty, a simulation with 29 overlapping Gaussian distributions was performed [11], which led to an estimate of the resulting uncertainty on the normalization factor (from this source only) of about 1%.
Although further uncertainties could arise from non-Gaussian shapes, this study shows that the Gaussian approximation of the sum of Gaussians is quite robust with the TPX system and the luminosity approximation by bunch integration is a sensible approach. No attempt was made for a precise determination of the total uncertainty, which would require a dedicated study [21,30].
5.3. LHC Luminosity Curve and TPX Precision
The TPX network has the capability to study the LHC luminosity curve with precision. Six LHC fills of proton–proton collisions were investigated in detail. As an example, details are given for the LHC fill 4449, taken on 3 October 2015.
First, the TPX luminosity is calculated using the normalization factors from Table 14, and it is then converted to an average number of inelastic interactions per bunch crossing by
where colliding bunches, Hz, and the inelastic cross–section mb [33]. Accelerator simulations [34] have shown that under routine physics conditions (optical function m), elastic proton–proton scattering contributes negligibly to the particle-loss rate. This is because the typical scattering angle is so small compared with the natural angular divergence of the beam that the protons remain with the dynamic aperture of the ring.
5.3.1. Fitted LHC Luminosity Curve
The fit function Equation (8), as derived in Section 2.4 for the MPX analysis, is also used for the vdM scan analysis with TPX data.
The expected mean lifetime of inelastic beam–beam interactions is calculated from the LHC beam parameters, as given in Table 15, and used as a fixed parameter to determine . A simultaneous fit of and did not converge. As already noted in the previous LHC Run-1 analysis [11], and are strongly anticorrelated. Compared with the data-taking at Run-1, the Run-2 LHC luminosity curve is flatter, making the fit less sensitive to the fit parameters.
The mean lifetime from inelastic beam–beam interactions is given by [27]
where is the initial number of protons per bunch ( protons [25]). For LHC fill 4440, the initial luminosity is [25] and the number of high-luminosity experiments is (ATLAS [3] and CMS [28]). For the lifetime, is obtained, and thus
The value depends on the initial luminosity and the initial number of protons and thus on the starting value of for the first fit. Since , one can write . Thus, for the lower initial luminosity in the fit, a longer lifetime is expected from beam–beam interactions and therefore a smaller
The frequent LHC small-amplitude beam-separation scans for optimization of the luminosity made it necessary to adapt the fit function. Therefore, the data during the scans are removed, and the LHC luminosity curve is fitted with a function with the values of reduced by for each time period between the scans. The values are calculated for the starting values for each region between the scans, and is the value for the start of the LHC fill.
Six long LHC fills with large luminosity are investigated as given in Table 15. Figure 36 shows the fit of TPX02 layer 2 data for two of these LHC fills.
The fit results indicate that the LHC luminosity reduction is predominantly reduced by beam-beam interactions since a larger value of corresponds to a shorter lifetime. In order to determine the and its uncertainty, the fit is performed for the six LHC fills and the four sensors separately, resulting in a large single–bunch lifetime
where the average is taken over 24 measurements and the uncertainty is given as the square root of the variance.
5.3.2. Precision
In order to investigate the precision of the TPX luminosity measurements, the difference between the fit and the data are studied as a function of time. As an example, the data are analyzed from the last continuous LHC curve taken on 3 October 2015 for about 4.5 h starting at 0:45.
A precision of 0.35% was obtained with TPX02 layer 2 and similarly with other TPX sensors, as listed in Table 16. The given uncertainties result from statistical and systematic uncertainties by the TPX measurements convoluted with uncertainties arising from fluctuations in the proton–proton collision rates.
It is noted that the TPX measurement precision is statistically limited by the number of hits per frame. Therefore, 10, 20, 30, and 40 frames are grouped together. Consequently, the statistical precision significantly increases. Figure 37 shows the residuals for groups of 30 frames. The four distributions show no particular uniform structure and therefore no LHC luminosity variation at the 0.1% level. Table 16 lists the obtained precisions for TPX02 and TPX12 layers 1 and 2. The fit results using the data of the four sensors are consistent.
In order to increase the statistical significance of each TPX device, the luminosity measured by layers 1 and 2 is averaged and presented in Figure 38 for 10 frames combined. It shows the relative difference between the data and the fitted average number of interactions per bunch crossing as a function of time, seen by TPX02. The corresponding Gaussian fit is shown in Figure 39. Figure 40 shows the pull distribution assuming statistical uncertainties only. Table 17 lists the obtained uncertainties and the corresponding pull values for 1 frame, as well as for 10, 20, 30 and 40 frames combined. The resulting relative short-term luminosity measurement precision is 0.1% for 10 s time intervals. As a consistency check of the obtained precision, the data from 7 October 2015 (LHC fill 4467) from 5:30 to 10:00 was analyzed in the same way, reproducing the results on the precision. Thus, the resulting luminosity precision of the TPX system is higher compared with the previous MPX luminosity measurement precision (0.3% for a 60 s time interval) [11] for data taken at LHC during the Run-1 operation.
5.4. Short-Term Precision of Individual TPX Devices
In order to determine the short-term precision of individual TPX devices, for luminosity measurements, the relative difference in luminosity measured by layers 1 and 2 of the same TPX device is studied as a function of time. The statistical precision is increased by grouping 10, 20, 30 and 40 frames. Figure 41 shows the fit results for the 10 frames combined, while Figure 42 shows the corresponding precision as the width of the Gaussian fit. The resulting pull distribution is shown in Figure 43. For single frames, the width of the pull distribution is about unity, indicating that the statistical uncertainty is dominant. The width of the pull distribution is increasing as more frames are combined in order to decrease the statistical uncertainty, and the pull values indicate that systematic uncertainties are also present.
Table 18 lists the obtained precisions for TPX02 and TPX12. As the difference of two measurements (from layers 1 and 2) is calculated and the statistical significance of each measurement is about the same, the uncertainty of each measurement is about of overall uncertainty, thus leading to a measurement precision for each TPX device of approximately 0.1% for 10 s time intervals.
5.5. Long-Term Stability of Individual TPX Devices
The long-term time stability (internal stability) of the luminosity monitoring is determined for individual TPX devices by comparing the luminosity measured by the two separate sensitive layers of TPX02 and TPX12. For this analysis, the frames are grouped corresponding to time periods of the 2015 LHC fills with instantaneous luminosity above . A linear fit is applied to the (TPX layer 1)/(TPX layer 2) luminosity ratio versus time for the August to November 2015 data-taking period, as given in Figure 44. The slope of the linear fit is taken as a measure of time stability. The uncertainty is obtained from the fit. As the statistical uncertainty of the ratio measurements for the grouped frames is much less than the systematic uncertainties, each ratio is given equal weight in the fit. The obtained slope values and their uncertainties for TPX02 and TPX12 are summarized in Table 19. The slope shows that the luminosity ratio measured by layers 1 and 2 slightly decreases with time. This could indicate a small relative change in sensitivity with time between the thinner and thicker sensors. The time-stability of the luminosity measurements between individual layers is about 0.5% per 100 days.
In addition, a study of the internal calibration transfer was performed. As described in Section 5.2, the normalizations of the TPX sensors were performed with a vdM scan using LHC fill 4266 (24–25 August 2015) with a peak luminosity of . In the same LHC fill, the luminosity was kept constant after the vertical and horizontal scans for about 5 h. Using the data of this time period, the (TPX layer 1)/(TPX layer 2) luminosity ratio was determined with TPX02 and TPX12 and found to be in agreement with the ratios at high luminosity within 0.5% uncertainty.
5.6. Long-Term Stability of Different TPX Devices
The long-term time stability (internal stability) of the luminosity monitoring is determined for two TPX devices located about 7 m apart at opposite sides of the primary proton–proton interaction point. First, the frames are grouped into luminosity blocks of about one minute. This grouping of frames is necessary for a comparative study, as the start times of the frames are not synchronized between the TPX devices. Then, the luminosity blocks are grouped into time periods corresponding to the LHC fills with instantaneous luminosity above . The luminosity ratio measured by TPX02 and TPX12 is calculated, and a linear fit is applied for the August to November 2015 data-taking period, as given in Figure 45. The slope of the linear fit is taken as a measure of time stability. The obtained slope value and its uncertainty are summarized in Table 20. The uncertainty is obtained from the fit. As the statistical uncertainty of the ratio measurements for the grouped time intervals is much less than the systematic uncertainties, each ratio is given equal weight in the fit. The fluctuations are much larger than the slope of 0.02% per 100 days, and therefore, the largest fluctuations are used as an estimate of the long-term time stability. These fluctuation could either result from the TPX operation or from small variations in the complex LHC radiation field depending on small changes in the colliding beam optics. Thus, conservatively, the study of two different TPX devices indicates an internal time stability of the luminosity measurement below 0.5% per 100 days.
5.7. Results TPX Internal Luminosity Precision
The network of TPX devices installed in the ATLAS detector cavern has successfully taken data at LHC during Run-2 with 13 TeV proton–proton collisions. An approximate absolute luminosity calibration was determined from a vdM scan in 2015. The TPX network measured the LHC luminosity curve with precision, indicating that the luminosity reduction from single–bunch interactions was much less than from beam–beam interactions. The relative short-term precision of the TPX luminosity measurements was determined to be 0.1% for a 10 s time intervals, and the internal long-term stability of the TPX system for luminosity measurements was below 0.5% for the 2015 data-taking period.
6. Timepix Activation and Absolute Luminosity Measurements
This section reviews the precision measurements of induced radioactivity and absolute luminosity determination with TPX detectors in LHC proton–proton collisions at 13 TeV. The network of Timepix (TPX) devices installed in the ATLAS cavern measures the LHC luminosity as a stand-alone system. The data were recorded from 13 TeV proton–proton collisions in 2016. Using two TPX devices, the number of hits created by particles passing the pixel matrices was counted. Absolute luminosity is determined with the vdM scan technique by separating the LHC proton beams and measuring the widths of the beams in low-intensity LHC proton–proton collisions. The exact determination of the activation background contributes to the overall precision of the TPX luminosity measurements. The activation background varies in time due to induced radioactivity at the different positions of the TPX devices in the ATLAS cavern. The activation at a given time depends on the history of the LHC operation. A detailed study of induced radioactivity has been performed to reduce the uncertainty of both the relative and absolute luminosity measurements.
For this analysis, the same TPX detector network [6] of sixteen devices installed in the ATLAS cavern was used as described in Section 5.
In 2016, vdM scans were performed on 18 May and 27 May and recorded with the TPX detector network. Unlike in the 2015 vdM analysis [14], the two scan periods close in time allow a comparison of the absolute luminosity calibrations and thus contribute to the estimate of the luminosity uncertainty. These vdM scans serve for an absolute calibration of the TPX luminosity measurements. It is self-sufficient for luminosity monitoring and operates as an independent luminosity monitor.
Figure 32 illustrates the locations of all TPX devices, and Table 12 lists the locations of the devices TPX02 and TPX12 used in this analysis [14], and their numbers of registered passing particles (clusters), normalized to 100% acquisition time. The analysis described in this section is focused on the precision luminosity determination with the devices TPX02 and TPX12, which are operated with 1 s exposure time and analysed for hit-counting [14]. As their positions are very similar in R and Z coordinates on opposite sides of the proton–proton interaction point, their count rates are very similar. During 2016 LHC proton–proton collisions, typical luminosities at the beginning of the LHC fills were 5–10 5000–10,000 and the count rate was a few hits/s per TPX layer. The luminosity during the vdM scans was only about . The scans were taken on 18 and 27 May 2016 during LHC fills 4945 and 4954, respectively.
This section is structured as follows. First, the relevant concept of LHC luminosity monitoring from TPX hit-counting is reviewed in Section 6.1. The induced radioactivity (activation) and its effect on the luminosity determination is addressed in Section 6.2. Section 6.3 describes the vdM scan analyses for an absolute luminosity calibration. A summary is given in Section 6.4.
6.1. LHC Luminosity from TPX Hit-Counting
The data from the TPX02 and TPX12 devices were used in hit-counting mode (so-called Medipix mode, in which hits in the same pixel during the exposure time are added). Both TPX devices have similar count rates. The devices measure the luminosity independently, and their measurements are cross-checked with each other. A constant exposure time of 1 s was used for the entire 2016 data-taking period.
A small number of pixels becoming weak (having a significantly smaller count rate than the average of all pixels) or noisy (having a significantly larger count rate than the average of all pixels) could have a significant effect on the luminosity measurement. Therefore, pixels with a count rate that is more than away from the mean are excluded for each sensor region (uncovered and with converters [7]). This requirement identifies up to 8% of the pixels on layers 1 and 2 both for TPX02 and TPX12 per LHC fill, plus 5–10% of pixels at the boundaries of the sensor regions and at the edges of the sensor matrix. Then, identified pixels in at least one LHC fill were removed for all (about 200) 2016 LHC fills to remove 30–40% of the total number of pixels of the sensors. The effect of the pixel removal on the analysis was also studied with and criteria, with the result that the analysis outcome remains unchanged.
The hit rate for the TPX02 and TPX12 layers 1 and 2 sensors is normalized to units of luminosity by multiplying with a normalization factor as given in Section 6.3.
Compared to the 2015 data analysis, the 2016 data have a much higher statistics, and therefore in order to increase the precision of the luminosity determination, the induced radioactivity of material in the ATLAS cavern has been determined by a dedicated study. The induced radioactivity varies for each data-taking period and the activation count rate is subtracted from the total count rate before conversion to luminosity.
In addition to the hit-counting, luminosity can be measured with the two other modes of TPX operation based on cluster-counting and summed energy deposits. These luminosity measurements will be addressed in a separate publication.
The relation between the number of hits and clusters (particles) is investigated in order to determine the statistical uncertainty of the luminosity measurement from hit-counting. The average ratio of hits per cluster is approximately , which was obtained with TPX data from a low-intensity LHC fill for which the clusters on the sensors were well separated. This factor is used for the statistical uncertainty determination in the following sections, assuming that one cluster corresponds to one independent particle passing the device [11].
6.2. TPX Induced Radioactivity (Activation)
The high rate of head-on collisions of protons at high luminosity at the LHC yield large multiplicities of secondary particles such as pions, kaons, neutrons and protons. The interactions of primary and secondary particles with materials in the ATLAS environment produce large amounts of neutrons and material activation, including detectors and their electronics. The size and effective duration of the generated activation depends on incident fluxes, the activation cross-sections and the radionuclides half-lifes. The activation of material parts mainly depends on their geometry and location within the ATLAS environment and the types of nuclei. The activation is expected to grow with LHC luminosity and duration of LHC operations [5]. The activation contribution to the total count rate was already observed with the MPX detector network [5].
The TPX detectors become themselves activated as the result of the interaction of particles with the silicon layer, materials of microelectronics readout and duralumin box of the TPX detectors. Evaluation of the activation of a given TPX detector requires the precise knowledge of its material composition, and spectral flux distributions (high energy protons and neutrons) calculated using Monte Carlo transport code such as Fluka and GCalor [5].
The self-activation of the detectors was under experimental investigation. In the case of “inner” devices where TPX devices are surrounded by a large amount of material, the self-activation contribution is negligible. The self-activation of the TPX devices was measured during LHC shutdowns when there was the possibility to remove some devices from the ATLAS cavern [5].
Owing to their sensitivity to electrons and gamma rays, TPX detectors can measure radioactive decays. Activation is observed with most of TPX detectors at the end of the LHC fills, and for this precision determination, TPX02 and TPX12 are used, with layer 1 and layer 2.
The contribution of activations with different life times was determined iteratively in time periods right after the high-intensity proton–proton collisions, starting with the component of the shortest measurable life time, described by a single exponential function. The result of the fit was subtracted from the data, and the next component was fitted. Seven components were identified with their life times listed in Table 21.
The mean activation count rate at each given time depends on the history of the LHC operation. This is described by an iterative formula for the i-th time step
where n is the number of activated components, is the activation count rate at the beginning of a frame caused by the k-th component, is the total count rate at the beginning of a frame, the decay constant, is the time period between the end of the -th frame and the end of the i-th frame and is a normalization constant determined from the fit of the activation curve. At the end of the -th frame, the count rate has slightly changed from its beginning, giving the starting count rate for the i-th frame.
Figure 46 shows the measured count rate and the determined activation contribution on 18 May 2016, during which the first 2016 vdM scan was taken, and Figure 47 shows the corresponding distributions for 27 May 2016, during which the second 2016 vdM scan was taken. The activation contribution is clearly recognizable, and the count rates in the time periods between the proton–proton collisions are described well by the activation curve. Therefore, the activation count rate determined by the same function during the proton collision periods is described well. The activation contribution to the total count rate is about 1% during the high-intensity proton-proton collisions.
For the TPX luminosity measurement during the whole 2016 data-taking period, the activation count rate was subtracted from the total count rate before the TPX count rates were converted to luminosity. The effect on the relative luminosity measurements for different LHC fills is mostly due to the long lifetime components of the induced radioactivity as the additional hit rate depends on the history of the LHC operation. The absolute luminosity measurements profit from the exact determination of background rates, for example in calibration transfer studies, where the absolute luminosity normalization at low LHC intensity is transferred to regular high-intensity LHC operation to achieve a luminosity precision at the percent level. This study of activation constitutes an improvement in the precision luminosity determination compared to the previous study [14]. While in the study of the 2015 data, no significant effect of activation was observed [14] (a flat background correction was applied for each LHC fill), in this study of the 2016 data, with about nine times higher integrated particle fluxes, more detailed activation studies were performed and activation corrections were applied for individual frames. These frame-by-frame corrections were in particular useful in so-called calibration transfer studies, where the effects of extrapolating the calibrations taken at low-intensity LHC vdM fills to high-intensity regular LHC fills were investigated.
6.3. TPX vdM Scans
The vdM scans are used for an absolute luminosity calibration, based on the data taken on 18 and 27 May 2016.
The LHC beam separation dependence of the measured TPX luminosity is well represented by the sum of a single Gaussian and a constant. The constant describes the background including the count rate from activation, which is assumed to be constant in time during the short time periods when the LHC beams were separated in several steps up to about mm. Figure 48 shows the results of the scan on 18 May 2016. The absolute luminosity normalization is derived from the combination of the hit rate, the horizontal and vertical convoluted widths and the average bunch currents.
The measurement uncertainty of the TPX devices can be determined with respect to the expected statistical uncertainty. For this study, the pull distributions, defined as (data-fit)/, were determined, where , and . Figure 49 shows the pull distribution for the first vertical vdM scan on 18 May 2016, as seen by TPX02 layer 2. The sigma of the pull distribution averaged over TPX02 and TPX12, layers 1 and 2 for both horizontal and vertical scans is , which indicates that additional uncertainties are present beyond the determined statistical uncertainties. Furthermore, transverse proton-bunch profiles are not expected to be perfectly Gaussian; and even if they were, a scan curve summed over Gaussian bunches of different widths would not be strictly Gaussian. Therefore, non-Gaussian contributions to the vdM-scan curves may contribute, at some level, to the widening of the pull distribution.
For TPX02 layer 2 (27 May 2016 data), the bunch-averaged widths of the beam sizes (horizontal and vertical nominal beam separations) and their statistical uncertainties are m and m, respectively.
The luminosity can be calculated as
where is the number of bunch crossings producing collisions per machine revolution, and are the average bunch populations (number of protons) in beam-1 and beam-2, respectively, f is the machine revolution frequency (11,245.5 Hz), and and are the convoluted horizontal and vertical beam sizes. The LHC parameters for fill 4954 are [25]:
- Number of bunches:
- Average number of protons (in units ) per bunch in beam 1 and in beam 2:and , respectively.
Thus, the resulting luminosity is with a 0.6% uncertainty from the horizontal and vertical beam width measurements.
The corresponding specific luminosity is:
Table 22 and Table 23 summarize the scan results for the first pair of vdM scans (horizontal and vertical) registered with TPX02 and TPX12 with both their layers.
For TPX02 layer 2, the fits of horizontal and vertical scans provide and hits/s, respectively, at the peak above the background. The average number is () hits/s. Thus, the normalization factor between the TPX02 layer 2 hit rate and the instantaneous LHC luminosity is
The normalization factors for the other layers were calculated using the same procedure, and the results are summarized in Table 24 for the average of the 18 and 27 May 2016 scans. The table also lists the relative uncertainties between the normalization factors determined in both scans. Conservatively, the largest uncertainty of is assigned to all four normalization factors.
The normalization factor for the absolute luminosity is only approximate since the TPX exposure time is much longer than the bunch spacing. Therefore, the bunch-integrated luminosity averages over the different bunch profiles. In order to estimate the resulting uncertainty, a simulation with 29 overlapping Gaussian distributions was performed [11], which led to an estimate of the resulting uncertainty on the normalization factor (from this source only) of about 1%.
Although further uncertainties could arise from non-Gaussian shapes, this study shows that the Gaussian approximation of the sum of Gaussians is quite robust with the TPX system and the luminosity approximation by bunch integration is a sensible approach. No attempt was made for a precise determination of the total uncertainty, which would require a dedicated study [21,30].
6.4. Results Timepix Activation and Absolute Luminosity Measurements
Furthermore, in 2016, the network of TPX devices installed in the ATLAS detector cavern successfully took data at LHC during Run-2 with 13 TeV proton–proton collisions. The hit rates from induced radioactivity (activation) have been determined in-between and during LHC proton–proton collisions, which are taken into account in the TPX hit luminosity measurements. An approximate absolute luminosity calibration was determined from two vdM scans in 2016. Agreement of the normalization factors for the absolute luminosity determination between the two vdM scans is at .
7. Timepix Observation of Induced Radiation Effects
This section describes observations of radiation-induced effects in the operation of TPX detectors in the ATLAS cavern in LHC proton–proton collisions at 13 TeV. Radiation hardness is an important characteristic of pixel detectors in the operation of high-radiation environments. The LHC delivered proton–proton collisions at 13 TeV center-of-mass energy during 2015, 2016, 2017 and 2018. The resulting primary and secondary particle fluxes were recorded by the TPX detector network installed in the ATLAS cavern. Fifteen TPX detectors were exposed to largely varying particle fluxes. For this radiation hardness study, seven devices were analyzed which remained unchanged in the same position during the four years of data-taking. The detectors receiving the largest fluxes show increasing effects each year, which could be caused by radiation damage during the LHC operation. Evidence of self-healing effects during technical stops is also observed. The degradation in counting efficiency is quantified. These results could contribute to the future operation of the devices as radiation monitors in high-radiation environments.
A network of fifteen Timepix (TPX) devices was installed in the ATLAS experimental cavern [6]. A detailed comparison of the development of the count rates from different devices is used as an indication of radiation hardness. The count is largely influenced by noisy pixel or pixels with count rates significantly below the average. Those pixels are systematically removed for all devices by a dedicated method. For this study, seven devices were selected: four at a larger distance from the interaction point, and three exposed to larger particle fluxes near the interaction point. As a measure of the exposure to radiation, the particle flux per device and per delivered LHC luminosity is taken, together with the total luminosity per year (Table 25 [36]).
7.1. Data Preparation for Determination of Induced Radiation Effects
First, pixels with large fluctuations were removed in four regions (parts of the detector covered by different converters). The boundaries of each region were excluded, as they are not well determined. The edges of the sensor were excluded as well. For each LHC fill, the average number of hits was calculated, and all pixels showing a deviation of more than from the average were removed. A logical OR of the removed pixels over all fills was applied (any pixel excluded in at least one fill was removed from the analysis).
Figure 50 shows the fraction of excluded pixels for device TPX02 layer 1 as a function of time in 2016. The cumulated fraction is shown in Figure 51. The fraction drops in correspondence with LHC technical stops, when the operation of the collider was stopped for several days and no beams were circulating in the LHC.
7.2. Analysis of Induced Radiation Effects
The performance of the Timepix detectors is studied by comparing the luminosity ratios of different devices. Device TPX04, exposed to a low particle flux, is used as reference. The data of all devices are normalized to TPX04 (average of layers 1 and 2) in LHC fill 5163. In order to study the effect of radiation on the performance, three devices are selected with low particle fluxes (TPX05, TPX06, TPX14), and three are selected with high particle fluxes (TPX02, TPX12, TPX13). The particle fluxes at the positions of devices TPX02, TPX12 and TPX13 are very similar in size. Figure 52 shows the ratios of luminosity of the individual devices to TPX04 in each LHC fill. For the low-particle-flux devices, no significant slopes were observed, whereas for the high particle flux devices, the slopes are significant and similar in size. Low-rate devices and high-rate devices are shown in Figure 52. The results of the study are summarized in Table 26. For each device, the slopes are compared to the particle fluxes.
The apparent reduction in sensitivity of the highly exposed devices could be interpreted as an effect of radiation damage. The exposure particle flux was estimated to be about 3 × 10 particles per cm for the high particle flux devices for the 42.7 fb total delivered LHC luminosity in 2015 and 2016.
7.3. Results of Timepix Observation of Induced Radiation Effects
Even in the 2016 higher-intensity radiation field from the LHC proton–proton collisions, compared to the 2015 data-taking, the network of Timepix detectors operated successfully. Detailed luminosity studies with seven independently operated devices were performed. The three devices with the highest particle fluxes show a significant relative decrease of count rates during 2016 operation. This degradation could be interpreted as radiation damage. The reduction in sensitivity is similar for the three devices exposed to comparable high particle fluxes. Further studies are required to determine the reason for the observed effects.
8. Timepix Thermal Neutron Counting Luminosity
The determination of luminosity with thermal neutron counting is discussed using TPX detectors in the ATLAS cavern in LHC proton–proton collisions at 13 TeV. A network of Timepix (TPX) devices installed in the ATLAS cavern has the unique capability of measuring the luminosity with thermal neutron counting in LHC proton-proton collisions at 13 TeV. Compared with the hit-counting method, the method of thermal neutron counting has the advantage that it is not affected by induced radioactivity. The results of the luminosity determination are presented for several independently operated TPX detectors. The long-term time-stability measurements of the luminosity are presented for individual devices and between different devices. The high-statistics data sets allow a detailed comparison between neutron counting and hit-counting luminosity determinations.
In this section, the capabilities to contribute to the overall luminosity measurements with a completely different method as studied before [14] (hit counting), namely using thermal neutron counting, are explored. Any further information on the LHC luminosity is a valuable addition to the previously explored hit-counting luminosity [14] and would constitute an important advancement in the overall LHC luminosity determination. The neutron counting capabilities in the ATLAS cavern at CERN are unique to the TPX detector network. Each TPX device consists of two stacked hybrid silicon pixel sensors, as described in Section 5.
The analysis described in in this section is focused on the thermal neutron counting luminosity determination with all devices (Figure 32), except TPX02 and TPX12 (which were operated with 1 s exposure time at high particle fluxes, and thus had no possibility to identify clusters) [14]. During 2015 LHC proton-proton collisions, typical luminosities at the beginning of the LHC fills were 3–5 3000–5000.
Figure 53 shows an example of the luminosity measurement from thermal neutron counting determined with the TPX devices indicated in Table 27 for layers 1 and 2 combined. The LHC fill 4449 was taken on 2–3 October 2015, and times are in GMT. The normalization between neutron count rates and luminosity is based on the vdM scan using LHC fill 4266, determined with TPX hit-counting [14], as detailed in Section 8.1.
This section is structured as follows. First, the concept of LHC luminosity monitoring from TPX thermal neutron counting is introduced in Section 8.1. The long-term luminosity precision is given in Section 8.2 from the comparison of layers 1 and 2 results of the same TPX device. The long-term luminosity precision from different TPX devices is given in Section 8.3. A comparative study of thermal neutron and hit-counting luminosity is given in Section 8.4. Finally, results are given in Section 8.5.
8.1. TPX Luminosity from Thermal Neutron Counting
Thermal neutrons are detected by TPX devices via reactions in a converter layer of a () mg/cmLiF foil (Li enrichment: 89%) [7]. The tritons and alpha particles from the neutron conversion are registered by Si-sensors as large, round-shaped pixel clusters, so-called heavy blobs (HB). The typical detection efficiency for thermal neutrons is about 0.5%, determined from individual calibrations of the TPX devices in a thermal neutron field [7]. A background HB count rate resulting from charged particles with high stopping power was subtracted based on the HB count rate in region without the LiF converter. For example, TPX04 layer 1 has a 20% background rate. Hence, the background-corrected HB count rate is proportional to the number of neutrons passing the devices. It is used as a measure of instantaneous luminosity since neutrons are generated in the primary and secondary interactions from the proton–proton collisions. This method was pioneered with MPX devices for LHC Run-1 operation [13].
For the devices TPX01 to TPX15 (except for TPX02 and TPX12), the pixel matrix occupancy is sufficiently small for pattern recognition and to determine the HB (thermal neutron) count rate. This was achieved by different acquisition times of 1 ms to 1 s depending on the device. With the typical HB count rates of order one per frame, the possible misidentification of heavy blobs, which are lost due to the overlap with other clusters [5] (Section 2.2) is negligible.
The number of HBs per frame is converted into the number of HBs per luminosity block (LB) [11] of 60 s length. Frames are selected that lie within the time window of the LB, and the numbers of HB of these frames are averaged. The changes of acquisition time during the 2015 data-taking for individual devices are taken into account. TPX15 was then excluded in the analysis because of a too-small count rate.
These LBs are grouped into time periods corresponding to LHC fill time periods with varying length from about one to twenty hours (typically more than 6 h). For each LB time interval, the number of HBs is summed. This summed number of HBs is converted into luminosity by using a normalization factor determined from TPX hit-counting luminosity [14] based on the averaged luminosity measurement from TPX02 and TPX12 with layers 1 and 2. Figure 54 shows the linearity between HB counts per LB (for 100% acquisition time) and TPX hit-counting luminosity per LB [14]. The slope of the fit corresponds to the inverse normalization factor (). The normalization factors for all TPX devices used for thermal neutron counting are summarized in Table 28.
For each device and each time period, the relative statistical uncertainty is , where is the summed number of heavy blobs. The statistical uncertainties are dominant in the analysis of HB counting in the LiF-covered detector region since the HB count rate is rather small (up to a few 100 counts per LB and device layer).
8.2. Long-Term Stability of Individual TPX Devices
The long-term time stability (internal stability) of the luminosity monitoring is determined for individual TPX devices by comparing the luminosity between the two separate sensitive layers of the TPX devices. For this analysis, the LBs are grouped corresponding to time periods of the 2015 LHC fills. A linear fit is applied to the (layer 1)/(layer 2) luminosity ratio versus time for the September to November 2015 data-taking period, as given in Figure 55 for the examples of TPX04 and TPX14 devices, which are located at about opposite positions from the primary interaction point. The slopes of the linear fits are taken as a measure of time stability. The uncertainties on the slopes are obtained from the fits. As the statistical uncertainty of the ratio measurements for the grouped LB is much larger than possible systematic uncertainties, the fits take only the statistical uncertainties into account. The obtained slope values and their uncertainties for four TPX sensors are summarized in Table 29. The slopes show that the luminosity ratio measured by layers 1 and 2 has no significant variation with time. This indicates no significant relative change in sensitivity with time between the thinner and thicker sensors. The long-term stability of the luminosity measurements between individual layers is below 1% per 100 days.
8.3. Long-Term Stability of Different TPX Devices
The long-term time stability (internal stability) of the luminosity monitoring is determined for different TPX devices located up to about 7 m apart at opposite sides of the primary proton–proton interaction point. First, the frames are grouped into LBs of about one minute. This grouping of frames is necessary for a comparative study as the start times of the frames are not synchronized between the TPX devices. Then, the LBs are grouped into time periods corresponding to the LHC fills. The luminosity ratio of TPX04 and TPX14 is calculated as the average over layers 1 and 2, and a linear fit is applied for the September to November 2015 data-taking period, as given in Figure 56. The slope of the linear fit is taken as a measure of time stability. The uncertainty on the slope is obtained from the fit. As the statistical uncertainty of the ratio measurements for the grouped LB is much larger than possible systematic uncertainties, the fit takes only the statistical uncertainty into account. The obtained slope value and its uncertainty are summarized in Table 30. Some fluctuations around the slope of 0.27% per 100 days are observed. These fluctuations could either result from the TPX operation or from small variations in the complex LHC radiation field depending on small changes in the colliding beam optics. The study of the different TPX devices indicates an internal time stability of the luminosity measurement below 1% per 100 days.
8.4. Comparison of Thermal Neutron and Hit-Counting Luminosity Measurements
For this study of the relative neutron luminosity precision, the TPX thermal neutron luminosity and the TPX hit-counting luminosity measurements [14] are compared fill-by-fill. The relative TPX hit-counting fill-by-fill uncertainty was 0.5% [14].
The ratio of the TPX thermal neutron luminosity measurements and the TPX hit-counting reference luminosity [14] is shown in Figure 57 as a function of time. The LBs in each recorded LHC fill are combined, and the statistical uncertainty on the luminosity ratio is indicated by the error bars. LHC fills with less than 50 LBs are excluded.
The relative differences between the thermal neutron and the hit-counting luminosity measurements are approximately described by a single Gaussian fit with a width (sigma) of % (Figure 58). The width is dominated by the statistical uncertainty of the TPX thermal neutron measurements.
The pull distribution is shown in Figure 59, assuming that the relative uncertainty is governed only by . The Gaussian fit of the pull distribution has a width (sigma) of . This demonstrates that the uncertainty of the neutron counting luminosity is close to the statistical expectation.
The thermal neutron analysis is independent of activation effects of materials near the TPX devices. Although activation effects were observed in the TPX hit analysis from the production of light particles [11], the activation energy is too small to produce neutrons. Therefore, unlike in the hit-counting luminosity measurement [14], the uncertainty from the activation of detector material is absent in the present analysis.
8.5. Results of Timepix Thermal Neutron Counting Luminosity
An independent approach to determine the LHC luminosity is presented using thermal neutron counting. The internal long-term time-stability of the TPX luminosity measurements were determined for individual devices and between different devices to be below 1%. The thermal neutron luminosity measurements were compared with TPX hit-counting luminosity results. Good agreement is found within the statistical uncertainties. For an LHC fill-by-fill analysis, the relative precision is 1.0%. There is complementarity of the thermal neutron counting and the hit-counting, and also different sets of TPX devices were used. While a hit-luminosity analysis has high statistics and its uncertainty is dominated by systematic effects, the presented thermal neutron counting analysis is dominated by statistical uncertainties owing to the limited cluster statistics. Furthermore, the neutron analysis is not affected by activation effects of material near the devices. Thermal neutron counting luminosity measurements are a valuable addition to the overall luminosity measurements.
9. Timepix3 Luminosity Measurements
The Timepix3 luminosity determination of 13 TeV proton–proton collisions is reviewed. Medipix and Timepix devices, installed in the ATLAS cavern, have provided valuable complementary luminosity information. Results are presented from measurements with Timepix3 (TPX3) detectors. In contrast with previously employed frame-based data acquisition, the TPX3 detector continuously remains active, sending information on pixel hits as they occur. Hit- and cluster-counting methods were used for the luminosity determination of the LHC proton–proton collisions. The LHC luminosity versus time is determined using these two methods and fitted to a simple model, which incorporates luminosity reduction from single bunch and beam–beam interactions. The precision of the luminosity determination could be improved by counting the number of clusters, instead of just pixel hits. The internal precision and long-term stability of the TPX3 luminosity measurement are below 0.5%. TPX3, owing to its 1.56 ns time-tagging, is able to resolve the time structure of the luminosity due to the collisions of individual proton bunches when integrated over an LHC fill.
Precision luminosity measurements are of particular importance for many analyses in high-energy physics. Networks of hybrid active pixel detectors from the Medipix/Timepix family [6] installed in the ATLAS cavern [3] successfully demonstrated their potential to determine luminosity [11,14]. The latest generation of Timepix detectors, namely Timepix3 (TPX3) [9], were installed in the ATLAS cavern at CERN [10] and operated in 2017 and 2018. The TPX3 device closest to the LHC interaction point is used in this analysis to measure the primary and secondary particle fluxes originating from 13 TeV proton–proton collisions. The data were taken between April and October 2018 during the LHC Run-2 operation.
The use of the TPX3 device (with improved readout electronics) for luminosity measurements has several advantages, compared to the previous luminosity measurements at the LHC during Run-1 with Medipix devices [11], as reviewed in Section 2, Section 3 and Section 4, and Run-2 with Timepix (TPX) devices [14], as reviewed in Section 5, Section 6, Section 7 and Section 8.
The Possibility of (Quasi-) Continuous Operation.
The dead-time caused by the readout of the frames is about 6 s for MPX and 0.12 s for TPX devices, requiring a compromise between sensor occupancy and relative dead-time minimization. Cluster-counting with MPX and TPX devices is possible with high particle fluxes only when the exposure time is much shorter than the dead-time. Otherwise, overlapping clusters could not be separated. Therefore, hit-counting is necessarily used for previous high-rate luminosity analyses. Furthermore, the TPX devices can be operated in either of three modes: time-over-threshold (energy deposits, ToT), time-of-arrival (ToA), and counting (Medipix) mode; in contrast, the TPX3 device measures ToT and ToA information simultaneously. A novelty of TPX3 is the pixel-comparator-driven (event-driven) data transmission, which replaces the frame-based transmission of the TPX devices.
An Improved Cluster Separation.
In the previous MPX and TPX luminosity analyses, no cluster (particle) counting with high statistics was possible. Thus, to achieve statistically significant short-term luminosity measurements, a hit-counting method was applied. The devices were used in the Medipix mode, where each detector counts the number of pixel hits per frame. A source of statistical uncertainty arose from the large variance of hit counts per interacting particle. Owing to the precise pixel time-stamping of TPX3, cluster identification and separation could also be done in high flux conditions. This leads to a higher precision of the luminosity measurements. Furthermore in TPX3 data, clusters were defined by temporally and spatially concurrent hits on the sensor.
A Higher Time Resolution.
The previous MPX and TPX luminosity measurements were LHC bunch-integrated, as the exposure time was much longer than the bunch separation of 25 ns. As already demonstrated, with the time resolution of TPX3 and proper triggering, it was possible to resolve the bunch structure of the LHC beam [10]. This article provides a proof of principle, as it demonstrates the luminosity determination of individual colliding proton bunches when the data are integrated over an LHC fill.
In summary, an important innovation is that the TPX3 device allows for cluster counting up to high particle rates, since pixel data are digitized and read out as a stream rather than accumulated on-pixel until a full frame is transmitted. Additionally, if clusters partially overlap, they can be reconstructed separately using the time stamps in the pixels.
Moreover, the two-layer structure of the TPX3 device doubles the measurement statistics and, in this analysis, allows one to determine the internal precision and long-term time stability of individual TPX3 devices. Here, “internal” refers to the luminosity precision being determined only based on the TPX3 device and not with respect to other luminosity determination methods.
The ATLAS and CMS Collaborations have elaborate systems that measure luminosity, as described in [21,30,37] (ATLAS) and [22,35] (CMS).
The TPX3 part is structured as follows. First, the TPX3 device is described in Section 9.1, followed by an introduction to the concept of LHC luminosity monitoring by hit-counting and cluster-counting in Section 9.2. In Section 9.3, the LHC luminosity versus time is determined, and the internal TPX3 measurement precision is evaluated. Section 9.4 describes the internal precision of luminosity determination by computing the difference between two layers of the TPX3 device. The internal long-term luminosity precision is given in Section 9.5 as obtained from the comparison of layer 1 and layer 2 luminosity measurements. The long-term stability with respect to other ATLAS luminosity monitors is described in Section 9.6. As a proof of principle, the luminosity determination of individual LHC bunch crossings is described in Section 9.7, followed by a summary in Section 9.8.
9.1. TPX3 Device
The TPX3 device [9,10] used for this analysis has two stacked hybrid silicon pixel sensors, named layer 1 and layer 2. Two synchronized single-sensor TPX3 devices are placed together in a face-to-face geometry. The silicon sensors consist of a matrix of pixels of μm pitch and a thickness of μm (size 1.98 cm). The installation of this TPX3 device took place during the LHC winter shutdown 2017/2018 [10]. The TPX3 device is operated in addition to the previously installed network of double-layer Timepix (TPX) assemblies [5,31]. An external trigger is used to relate the TPX3 data to the LHC orbit timing [10]. A correction is applied for the so-called time-walk effect to compensate for a high signal leading to an earlier time than a low signal [38].
The detection of charged particles in the TPX3 devices is based on the ionization energy deposited by the particles passing through the silicon sensor, where the induced signals are processed and digitized. Neutral particles, namely neutrons, need to be converted to charged particles before they can be detected. Therefore, a part of the silicon sensor on layer 1, the layer farther from the interaction point (IP), is covered by LiF and polyethylene converters [7,32]. Photons are directly converted in the sensor.
The TPX3 device is self-sufficient for luminosity monitoring. It collects data independently of the ATLAS data-recording chain and provides independent measurements of bunch-integrated LHC luminosity, including individual colliding bunch luminosity. During 2018 LHC proton–proton collisions, the maximal peak luminosities for an LHC fill were about 2 20 [25]. The corresponding TPX3 pixel count rate was about 36 hits/ms for layer 1 (with neutron converter) and 34 hits/ms for layer 2, with about 2 clusters/ms in each layer. Figure 60 shows an example of the luminosity from hit-counting measured with TPX3 layer 1 for LHC fill 6677, taken on 13–14 May 2018.
9.2. LHC Luminosity from TPX3 Hit- and Cluster-Counting
The data from the TPX3 device are used in so-called hit-counting, as well as cluster-counting analyses. The layers of the device have similar count rates. Their average for cluster-counting is given in Table 31. Both layers measure the luminosity independently, and their measurements are cross-checked.
A small number of pixels becoming weak, unresponsive or noisy (most of them could be recovered by reloading the configuration) could have a significant effect on the luminosity measurement. Therefore, pixels of the TPX3 device with a count rate that is at least away from the mean are excluded. The width (defined throughout this article as sigma) and the mean are determined from Gaussian fits of the pixel hit count distribution, which were integrated over 3 h. In each 3 h time period, less than % of the pixels in layers 1 and 2 are excluded by this algorithm. This correction is taken into account for the clustering process as well as for the the effective sensor area.
The hit rates for the two TPX3 layers are normalized to units of luminosity by multiplication with scaling factors. These two scaling factors are determined from the known LHC peak instantaneous luminosity [25] and the corresponding count rates in layers 1 and 2, as summarized in Table 32. Normalization factors for cluster-counting are calculated using the same procedure and are given in Table 32 as well. All the normalization factors are only approximate, since the analysis focuses on the relative luminosity precision (not an absolute precision) during three time scales: LHC bunch-crossings of 25 ns, Luminosity Blocks (LBs) of 60 s, and long-term stability over months. On average, about 13 hits per cluster (particle) are observed.
9.3. LHC Luminosity Curve and TPX3 Precision
The TPX3 device has the capability to study the LHC luminosity curve with precision. In the following, LHC fill 6677 (proton–proton collisions) is analyzed, as recorded on 13–14 May 2018, spanning over 13 h.
9.3.1. Fitted LHC Luminosity Curve
The same fit function (Equation (8)) as derived in Section 2.5 for the MPX analysis, and also applied in Section 5.3.1 for the TPX analysis, was used for the TPX3 data analysis.
Figure 61 shows the fit of the LHC luminosity curve. The curve is proportional to and is fitted to TPX3 layer 1 data using cluster-counting, recorded in the time period from 13 May at 17:40 (UTC+2) to 14 May 2018 at 2:00 (UTC+2). This time range excludes the LHC emittance scans and also larger beam adjustments, as the simple model cannot account for beam optimizations. The data taken in the same time range are fitted for hit- and cluster-counting for layers 1 and 2.
The fit describes the LHC luminosity versus time quite well. For this analysis, the fit curve serves as a reference to determine the measurement precision.
9.3.2. Precision
In order to investigate the precision of the TPX3 luminosity measurements, the difference between the fit and the data is studied as a function of time. Figure 62 shows this difference using hit- and cluster-counting for layers 1 and 2. The four distributions show no particular common structure and therefore no LHC luminosity variation (sigma) beyond the 0.5% level using cluster-counting. The visible variations arise from statistical and systematic uncertainties (TPX3 measurements) being convoluted with uncertainties arising due to fluctuations in the proton–proton collision rates.
For the relative difference between data and the fitted luminosity curve (Figure 62), the corresponding Gaussian fit is shown in Figure 63 using cluster-counting. Relative internal precisions per LB are 0.86% (hit analysis) and 0.48% (cluster analysis), obtained with TPX3 layer 1. Similar precisions are obtained for layer 2, as given in Table 33.
Figure 64 shows the pull distribution assuming statistical uncertainties only. Additionally, Table 33 lists the corresponding widths of the Gaussian fits of the pull distributions. While these widths are approximately unity for the cluster analysis, they are much larger for the hit analysis. The reason is that one interacting particle creates on average many hits and thus the hits are correlated. Moreover, the widths for the cluster-counting indicate that statistical uncertainties are dominant.
The effect of the small-amplitude beam-separation scans on the residual width was studied. The residual width is used to derive the short-term luminosity precision. The small dips in the luminosity curve indicate the time of the scans. For the LHC Run 6677, the effect of the amplitude scans was found to be small, as quantified in Table 34.
In summary, the relative short-term luminosity measurement precision is less than 0.5% for the LB time interval using cluster-counting.
9.4. Short-Term Precision of TPX3 Device
In order to determine the internal short-term precision of the TPX3 device for luminosity measurements with a different technique, the relative difference in luminosities ( and ) measured by layers 1 and 2 is studied as a function of time using cluster-counting. Figure 65 shows the relative difference for LHC fill 6677, while Figure 66 shows the corresponding precision as the width of the Gaussian fit. The resulting pull distribution is shown in Figure 67. The width of the pull distribution is approximately unity, which indicates that the statistical uncertainty is dominant.
The obtained precision for the TPX3 luminosity determination is 0.56% with . Since the difference of two measurements (from layers 1 and 2) is calculated and the statistical significance of each measurement is about the same, the uncertainty of each measurement is about of the overall uncertainty, neglecting correlations. Thus, this leads to a measurement precision for each TPX3 device of approximately 0.4% per LB time interval, which is about the same value as obtained in Section 9.3.
9.5. Long-Term Stability of TPX3 Device
The internal long-term time stability of the luminosity monitoring is determined for the TPX3 device by comparing the luminosity measured by the two separate sensitive layers. For this analysis, the clusters are grouped corresponding to the time periods of the April to October 2018 LHC fills. A linear fit is applied to the difference in luminosity relative to the average luminosity versus time, as shown in Figure 68. The slope of the linear fit and the deviations per LHC fill are taken as a measure of time stability. The obtained slope value and its uncertainty is % per 100 days. The uncertainty is obtained from the fit. The luminosity measured by layers 1 and 2 is very consistent within the measurement uncertainty. Thus, the size of the maximum deviation per LHC fill (about 0.4%), shown in Figure 68, is taken as an approximation of the internal long-term time stability of the luminosity measurements.
9.6. TPX3 Long-Term Stability with Respect to Other ATLAS Luminometers
The relative long-term stability of TPX3 luminosity measurements is already compared to that of other ATLAS luminometers for 2017 data [37] (a single-layer TPX3 detector was operated during 2017 data-taking). The tracking [39], EMEC [40], FCal [41], TILE [42] and LUCID [43] detectors were used for alternative luminosity measurements. The luminometers have complementary capabilities and different systematic uncertainties [37]. For ATLAS LHC Run-2, the primary bunch-by-bunch luminosity measurement was provided by the LUCID Cherenkov detector [43]. This was complemented by bunch-by-bunch measurements from offline measurements of the multiplicity of reconstructed charged particles in randomly-selected bunch-crossings (track counting) [39]. The ATLAS calorimeters provided bunch-integrated measurements based on quantities proportional to instantaneous luminosity: liquid-argon (LAr) gap currents in the case of the endcap electromagnetic (EMEC) [40], and forward (FCal) calorimeters [41] and photomultiplier currents from the scintillating-tile hadronic calorimeter (TILE) [42].
Figure 69 [37] shows the fractional differences between the run-integrated luminosities measured from TPX3, track-counting, EMEC, FCal, and TILE devices with respect to the luminosity measured with the LUCID detector. The luminosity measurements from the other detectors are normalized to that of LUCID for a reference run. The values for each run are plotted as a function of the cumulative delivered luminosity fraction, ranging from zero at the start of the year to one at the end year. This results in an axis monotonically increasing in time. Short runs with less than about two hours data-taking are not shown. The run-to-run agreement between the various luminosity measurements is generally at the percentage level or better for the bulk of the data, with various short- and long-term trends being visible.
9.7. TPX3 LHC Luminosity of Individual Bunch Crossings
The TPX3 time resolution (time granularity 1.56 ns) [9,10] allows one to study the luminosity of individual LHC proton bunch crossings, which are 25 ns apart (bunch spacing). This is a novelty regarding the luminosity measurements with respect to the previous MPX and TPX luminosity evaluations. The TPX3 bunch-by-bunch luminosity determination was also made possible by using an external trigger [10] that relates the LHC orbit time to the TPX3 data. In previous luminosity analyses with MPX and TPX devices, the exposure times were necessarily much longer than the bunch spacing. As a proof of principle, the bunch structure of LHC fill 6694 (17 May 2018) was investigated with TPX3. The relative bunch luminosity measurement precision was determined using the data integrated over the entire LHC fill.
The LHC proton collisions occur when the bunches cross each other from opposite sides. The 26.7 km LHC ring has 3564 potential bunch slots, which are separated by 25 ns in time. Not all bunch slots are filled and paired for collision. For example, LHC fill 6694 has 2162 bunches colliding in the ATLAS cavern. In this LHC fill, there are 15 (3+4+4+4) so-called bunch trains with almost consecutive bunches filled and two isolated colliding bunches separated in time from the bunch trains. The bunch structure measured with layer 1 is shown in Figure 70. The 15 bunch trains and the two individual colliding bunches at 15,950 ns and 60,490 ns orbit times are visible. It is noted that the background level in the bunch trains increases during the first bunches. The reason could be that an exponential decrease in the signal peak per bunch crossing is observed with a decay time of about 30 ns, which is comparable in length with the bunch spacing of 25 ns.
A simple toy model is constructed to understand the background increase (arbitrary scale) during the bunch trains. For the toy model, the signal of a single bunch crossing is approximated with a Heaviside step function (constant amplitude) and an exponential decay. These signals are then summed according to the observed bunch structure. Figure 71 shows the modeled signal versus time for 10,800 ns to 16,800 ns orbit time, which resembles the measurement shown in Figure 70. The toy model illustrates that the increase in the background during the bunch trains results from the overlap of signals due to previous bunch collisions. Moreover, it shows that the increased background level is asymptotically reached after a few consecutive bunch crossings within a bunch train.
The luminosity of each bunch crossing is determined by counting the total number of clusters in a time interval of 25 ns (bunch spacing) around the peak. A constant background of about 400 clusters is subtracted, as determined from the time periods between the bunch trains. This background results mostly from collisions, since the background due to electronic noise and activation of long-lived isotopes is only about 20 clusters, as evaluated in a period when no beams are circulating in the LHC ring. In addition, the extrapolated cluster rate from the previous peak is subtracted as well, based on the toy model.
The internal precision of the luminosity measurement per bunch crossing for the entire LHC fill is determined by comparing the luminosity measurements of layer 1 and layer 2. Figure 72 shows the corresponding precision as the width of the Gaussian fit. The resulting pull distribution is shown in Figure 73. Good agreement between the luminosity measurements using layers 1 and 2 is obtained, and thus the luminosities determined by each layer are averaged. The absolute luminosity normalization is approximated based on the total integrated LHC fill luminosity [25]. Figure 74 shows that the precision of the relative luminosity measurement is about 5%, where the variation is defined as the width over mean of the Gaussian fit. This observed variation is the convolution of the TPX3 measurement precision (statistical and systematic) and the differences in the intensity of the individual LHC bunches. To date, in this study, the possibility to classify the observed cluster types is not exploited. These types are characteristic for different particles (electrons, hadrons, nuclear fragments, neutrons) as a function of their occurrence during the bunch crossing time interval of 25 ns.
9.8. Results of Timepix3 Luminosity Measurements
A double-layer TPX3 device installed in the ATLAS detector cavern has successfully taken data at the LHC during Run-2 13 TeV proton–proton collisions. The relative internal short-term precision of the TPX3 luminosity measurements was determined from the LHC luminosity curve to be less than 0.5% for 60 s time intervals. It was observed that cluster-counting improves the luminosity precision compared to hit-counting, since one particle typically corresponds to one cluster of hits. The internal short-term precision was determined in a complementary evaluation by studying the relative difference in luminosities measured by the two TPX3 sensor layers using cluster-counting, and a relative precision of 0.4% was observed. The deviation from the internal long-term time stability of the TPX3 device for luminosity measurements was below 0.5%. When integrated over an entire LHC fill, it was demonstrated that the TPX3 device used in this study even has the capability to determine the time structure of the luminosity due to the collisions of individual LHC proton bunches.
10. Conclusions
In conclusion, the Medipix-2 (MPX), Timepix (TPX) and Timepix3 (TPX3) hybrid-pixel detectors, developed and operated during the past decade, contributed significantly to the luminosity measurements at the LHC. The technology and the analysis method advanced in each generation of detector. Most notably, the relative internal bunch-integrated precision of luminosity measurements improved from initial MPX measurements (percent level) to 0.1% for TPX devices. TPX3 has proven measuring luminosities of individual bunches at 25 ns bunch spacing. There are several highlights of the luminosity measurements.
Regarding the MPX devices in LHC Run-1 (2008 to 2013), the data analysis demonstrated that the MPX network was well suited for luminosity monitoring. Internal long-term time-stability of the luminosity measurements both from the hit and heavy blob (thermal neutron) counting was below 1%. The uncertainties for the hit analysis were dominated by systematic effects, and for the heavy blob (thermal neutron) analysis by statistical fluctuations. The MPX network studied the underlying mechanisms of the LHC luminosity reduction with a precision better than 0.3% for one-minute intervals. MPX luminosity measurements can cope with a collision rate 1/1000 of typical physics data-taking, and thus low-luminosity van der Meer (vdM) scans were analyzed successfully. With respect to other ATLAS luminometers, the MPX network had an internal consistency of about 2% and provided reliable supplementary information for the overall ATLAS luminosity determination over a wide dynamic range (luminosities from about to ). MPX thermal neutron counting results showed good agreement within the statistical uncertainties with respect to other ATLAS luminosity results. For a run-by-run analysis, the relative precision was 1.5%.
The network of TPX devices operated successfully at LHC during Run-2 (2015–2018) with 13 TeV proton–proton collisions. vdM scans were analyzed in different years of operation for an approximate absolute luminosity calibration. The data analysis of the TPX network demonstrated that the luminosity reduction from single–bunch interactions was much less than from beam–beam interactions. The relative short-term precision was determined to be 0.1% for 10 s time intervals, and the internal long-term stability was better than 0.5% for the 2015 data-taking period. The hit rates from induced radioactivity (activation) were determined in between and during LHC proton–proton collisions. For the three devices with the highest particle fluxes, a significant relative decrease in count rates during 2016 operation was observed, which could be interpreted as radiation damage. The internal long-term time-stability of the TPX luminosity measurements was determined for individual devices and between different devices to be below 1%. The thermal neutron luminosity measurements were compared to TPX hit-counting luminosity results with good agreement within the statistical uncertainties, and a relative precision of 1.0% for LHC fill-by-fill data.
A double-layer TPX3 device installed in the ATLAS detector cavern successfully took data at the LHC during Run-2. Based on the measured LHC luminosity curve, the relative internal precision was determined to be less than 0.5% for 60 s time intervals. It was observed that cluster-counting improves the luminosity precision compared to hit-counting. Comparing the results from the two TPX3 sensor layers using cluster-counting, a relative precision of 0.4% was observed. The internal long-term time-stability of the TPX3 device for luminosity measurements was below 0.5%. The TPX3 device used in this study had the capability to determine the time structure of the luminosity due to the collisions of individual LHC proton bunches when integrated over an entire LHC fill.
Funding
This research received no external funding.
Acknowledgments
The author would like to thank the ATLAS Luminosity Group and the IEAP team for useful discussions and interactions, and the Medipix Collaboration for providing the assemblies.
Conflicts of Interest
The author declares no conflict of interest.
References
- ATLAS Collaboration. LHC Delivered Luminosities to the ATLAS Experiment. 2020. Available online: https://twiki.cern.ch/twiki/bin/view/AtlasPublic/LuminosityPublicResultsRun2 (accessed on 10 April 2021).
- CERN. European Laboratory for Particle Physics. 2020. Available online: https://home.cern (accessed on 10 April 2021).
- ATLAS Collaboration. The ATLAS Experiment at the CERN Large Hadron Collider. J. Instrum. 2008, 3, S08003. [Google Scholar]
- Medipix-2 Collaboration. Project Webpage. 2015. Available online: http://medipix.web.cern.ch/medipix (accessed on 10 April 2021).
- Campbell, M.; Heijne, E.; Leroy, C.; Martin, J.P.; Mornacchi, G.; Nessi, M.; Pospisil, S.; Solc, J.; Soueid, P.; Suk, M. Analysis of Radiation Field in ATLAS Using 2008-2011 Data from the ATLAS-MPX Network. ATL-GEN-PUB-2013-001. 2013. Available online: https://cds.cern.ch/record/1544435 (accessed on 10 April 2021).
- Leroy, C.; Pospisil, S.; Suk, M.; Vykydal, Z. Proposal to Measure Radiation Field Characteristics, Luminosity and Induced Radioactivity in ATLAS with TIMEPIX Devices. Project Proposal. 2014. Available online: http://cds.cern.ch/record/1646970 (accessed on 10 April 2021).
- Bergmann, B.; Caicedo, I.; Leroy, C.; Pospisil, S.; Vykydal, Z. ATLAS-TPX: A two-layer pixel detector setup for neutron detection and radiation field characterization. J. Instrum. 2016, 11, P10002. [Google Scholar] [CrossRef]
- Llopart, X.; Ballabriga, R.; Campbell, M.; Tlustos, L.; Wong, W. Timepix, a 65 k programmable pixel readout chip for arrival time, energy and/or photon counting measurements. Nucl. Instr. Meth. 2007, A581, 485–494, Erratum in 2008, A585, 106–108. [Google Scholar] [CrossRef]
- Poikela, T.; Plosila, J.; Westerlund, T.; Campbell, M.; De Gaspari, M.; Llopart, X.; Gromov, V.; Kluit, R.; van Beuzekom, M.; Zappon, F.; et al. Timepix3: A 65K channel hybrid pixel readout chip with simultaneous ToA/ToT and sparse readout. J. Instrum. 2014, 9, C05013. [Google Scholar] [CrossRef]
- Burian, P.; Broulim, P.; Bergmann, B.; Georgiev, V.; Pospisil, S.; Pusman, L.; Zich, J. Timepix3 detector network at ATLAS experiment. J. Instrum. 2018, 13, C11024. [Google Scholar] [CrossRef]
- Sopczak, A.; Ali, B.; Asbah, N.; Bergmann, B.; Bekhouche, K.; Caforio, D.; Campbell, M.; Heijne, E.; Leroy, C.; Lipniacka, A.; et al. MPX Detectors as LHC Luminosity Monitor. IEEE Trans. Nucl. Sci. 2015, 62, 3225–3241. [Google Scholar] [CrossRef]
- Sopczak, A. Luminosity Monitoring in ATLAS with MPX Detectors. J. Instrum. 2014, 9, C01027. [Google Scholar] [CrossRef] [Green Version]
- Sopczak, A.; Ali, B.; Asbah, N.; Bergmann, B.; Bekhouche, K.; Caforio, D.; Campbell, M.; Heijne, E.; Leroy, C.; Lipniacka, A.; et al. Luminosity from thermal neutron counting with MPX detectors and relation to ATLAS reference luminosity at = 8 TeV proton-proton collisions. J. Instrum. 2017, 12, P09010. [Google Scholar] [CrossRef] [Green Version]
- Sopczak, A.; Ali, B.; Asawatavonvanich, T.; Begera, J.; Bergmann, B.; Billoud, T.; Burian, P.; Caicedo, I.; Caforio, D.; Heijne, E.; et al. Precision Luminosity of LHC Proton-Proton Collisions at 13 TeV Using Hit-Counting with TPX Pixel Devices. IEEE Trans. Nucl. Sci. 2017, 64, 915. [Google Scholar] [CrossRef] [Green Version]
- Sopczak, A.; Ali, B.; Begera, J.; Bergmann, B.; Billoud, T.; Biskup, B.; Burian, P.; Caforio, D.; Heijne, E.; Janecek, J.; et al. Precision Measurements of Induced Radioactivity and Absolute Luminosity Determination with TPX Detectors in LHC Proton–Proton Collisions at 13 TeV. IEEE Trans. Nucl. Sci. 2018, 65, 1371–1377. [Google Scholar] [CrossRef] [Green Version]
- Caforio, D.; Ali, B.; Aoulmit, S.; Begera, J.; Bergmann, B.; Billoud, T.; Biskup, B.; Burian, P.; Heijne, E.; Janecek, J.; et al. Determination of Radiation Hardness in the Operation of TPX Detectors in the ATLAS Cavern in LHC Proton-Proton Collisions at 13 TeV. In Proceedings of the 2017 IEEE Nuclear Science Symposium and Medical Imaging Conference (NSS/MIC 2017), Atlanta, GA, USA, 21–28 October 2017. [Google Scholar]
- Sopczak, A.; Ali, B.; Begera, J.; Bergmann, B.; Billoud, T.; Biskup, B.; Burian, P.; Caforio, D.; Heijne, E.; Janecek, J.; et al. Determination of Luminosity with Thermal Neutron Counting Using TPX Detectors in the ATLAS Cavern in LHC Proton-Proton Collisions at 13 TeV. IEEE Trans. Nucl. Sci. 2018, 65, 1378–1383. [Google Scholar] [CrossRef] [Green Version]
- Sopczak, A. Timepix3 Luminosity Determination of 13-TeV Proton–Proton Collisions at the ATLAS Experiment. IEEE Trans. Nucl. Sci. 2020, 67, 609–616. [Google Scholar] [CrossRef]
- Medipix/Timepix Collaboration. In Proceedings of the 20th Anniversary Symposium on Medipix and Timepix, Zurich, Switzerland, 18 September 2019; Available online: https://indico.cern.ch/event/782801 (accessed on 10 April 2021).
- ALICE Collaboration. ALICE Luminosity Determination for pp Collisions at = 8 TeV. 2017. Available online: https://cds.cern.ch/record/2255216 (accessed on 10 April 2021).
- ATLAS Collaboration. Improved luminosity determination in pp collisions at = 7 TeV using the ATLAS detector at the LHC. Eur. Phys. J. 2013, 73, 2518–2547. [Google Scholar] [CrossRef] [Green Version]
- CMS Collaboration. Precision Luminosity Measurement in Proton-Proton Collisions at = 13 TeV in 2015 and 2016 at CMS; Technical Report; CERN: Geneva, Switzerland, 2021. Available online: http://xxx.lanl.gov/abs/2104.01927 (accessed on 10 April 2021).
- LHCb Collaboration. Precision Luminosity Measurements at LHCb. JINST 2014, 9, P12005. Available online: http://xxx.lanl.gov/abs/1410.0149 (accessed on 10 April 2021). [CrossRef]
- van der Meer, S. Calibration of the Effective Beam Height in the ISR; ISR-PO/68-31 CERN Report; Technical Report; CERN: Geneva, Switzerland, 1968. [Google Scholar]
- LHC. Performance and Statistics. 2015. Available online: http://lhc-statistics.web.cern.ch/LHC-Statistics (accessed on 10 April 2021).
- TOTEM Collaboration. Measurement of Proton-Proton Elastic Scattering and Total Cross-Section at = 7 TeV. EPL 2012, 101, 21002. [Google Scholar] [CrossRef]
- Eggert, K.; Honkavaara, K.; Morsch, A. Luminosity Considerations for the LHC; Technical Report; CERN-AT-94-04, LHC-NOTE-263; CERN: Geneva, Switzerland, 1994. [Google Scholar]
- CMS Collaboration. The CMS experiment at the CERN LHC. JINST 2008, 3, S08004. [Google Scholar]
- Cindro, V.; Dobos, D.; Dolenc, I.; Frais-Kölbl, H.; Gorisek, S.; Griesmayer, E.; Kagan, H.; Kramberger, G.; Macek, B.; Mandic, I.; et al. The ATLAS beam conditions monitor. J. Instrum. 2008, 3, P02004. [Google Scholar] [CrossRef] [Green Version]
- ATLAS Collaboration. Luminosity determination in pp collisions at = 8 TeV using the ATLAS detector at the LHC. Eur. Phys. J. 2016, 76, 653–698. [Google Scholar] [CrossRef] [PubMed] [Green Version]
- Vykydal, Z.; Bouchami, J.; Campbell, M.; Dolezal, Z.; Fiederle, M.; Greiffenberg, D.; Gutierrez, A.; Heijne, E.; Holy, T.; Idarraga, J.; et al. The Medipix2-based network for measurement of spectral characteristics and composition of radiation in ATLAS detector. Nucl. Instr. Meth. A 2009, 607, 35–37. [Google Scholar] [CrossRef]
- Vykydal, Z.; Bouchami, J.; Campbell, M.; Dolezal, Z.; Fiederle, M.; Greiffenberg, D.; Gutierrez, A.; Heijne, E.; Holy, T.; Idarraga, J.; et al. Evaluation of the ATLAS-MPX devices for neutron field spectral composition measurement in the ATLAS experiment. In Proceedings of the IEEE NSS–MIC 2008 Conference, Dresden, Germany, 19–25 October 2008; pp. 2353–2367. [Google Scholar]
- ATLAS Collaboration. Measurement of the Inelastic Proton-Proton Cross Section at = 13 TeV with the ATLAS Detector at the LHC. Phys. Rev. Lett. 2016, 117, 182002. [Google Scholar] [CrossRef] [PubMed] [Green Version]
- Antoniou, F.; Arduini, G.; Hostettler, M.; Lamont, M.; Papadopoulou, S.; Papaphilippou, Y.; Papotti, G.; Pojer, M.; Salvachua, B.; Wyszynski, M. LHC Luminosity Modeling for RUNII. In Proceedings of the 7th International Particle Accelerator Conference (IPAC 2016), Busan, Korea, 8–13 May 2016. [Google Scholar] [CrossRef]
- Ball, A.; Bell, A.; Butler, A.; Butler, P.; Hall-Wilton, R.; Hegeman, J.; Lansley, S.; Keen, G.; Krofcheck, D.; Mueller, S.; et al. Design, Implementation and First Measurements with the Medipix2-MXR Detector at the Compact Muon Solenoid Experiment. J. Instrum. 2011, 6, P08005. [Google Scholar] [CrossRef]
- Large Hadron Collider. Available online: https://home.cern/science/accelerators/large-hadron-collider (accessed on 10 April 2021).
- ATLAS Collaboration. Luminosity Determination in pp Collisions at = 13 TeV Using the ATLAS Detector. ATLAS Conference Note, ATLAS-CONF-2019-021. 2019. Available online: https://cds.cern.ch/record/2677054 (accessed on 10 April 2021).
- Bergmann, B.; Pichotka, M.; Pospisil, S.; Vycpalek, J.; Burian, P.; Broulim, P.; Jakubek, J. 3D track reconstruction capability of a silicon hybrid active pixel detector. Eur. Phys. J. 2017, 77, 421. [Google Scholar] [CrossRef] [Green Version]
- ATLAS Collaboration. Early Inner Detector Tracking Performance in the 2015 Data at = 13 TeV; Technical Report; ATL-PHYS-PUB-2015-051; CERN: Geneva, Switzerland, 2015. [Google Scholar]
- Aleksa, M.; Cleland, W.; Enari, Y.; Fincke-Keeler, M.; Hervas, L.; Lanni, F.; Cleland, W. ATLAS Liquid Argon Calorimeter Phase-I Upgrade Technical Design Report; Technical Report; CERN-LHCC-2013-017, ATLAS-TDR-022; CERN: Geneva, Switzerland, 2013. [Google Scholar]
- Artamonov, A.; Bailey, D.; Bélanger, G.; Cadabeschi, M.; Chen, T.Y.; Epshteyn, Y.; Gorbounov, P.; Joo, K.K.; Khakzad, M.; Khovanskiy, V.; et al. The ATLAS Forward Calorimeter. J. Instrum. 2008, 3, P02010. [Google Scholar] [CrossRef] [Green Version]
- ATLAS Collaboration. ATLAS Tile Calorimeter: Technical Design Report; Technical Report; CERN: Geneva, Switzerland, 1996. [Google Scholar]
- Avoni, G.; Bruschi, M.; Cabras, G.; Caforio, D.; Dehghanian, N.; Floderus, A.; Giacobbe, B.; Giannuzzi, F.; Giorgi, F.; Grafström, P.; et al. The new LUCID-2 detector for luminosity measurement and monitoring in ATLAS. J. Instrum. 2018, 13, P07017. [Google Scholar] [CrossRef]
Figure 1.
(a) Medipix device operated at LHC Run-1. (b) Schematic view of the functionality of the hybrid pixel detectors.
Figure 1.
(a) Medipix device operated at LHC Run-1. (b) Schematic view of the functionality of the hybrid pixel detectors.

Figure 2.
Timepix (TPX) hodoscope using two TPX sensors, operated at the Large Hadron Collider (LHC) Run-2. Distances are given in cm.
Figure 2.
Timepix (TPX) hodoscope using two TPX sensors, operated at the Large Hadron Collider (LHC) Run-2. Distances are given in cm.

Figure 3.
Timepix3 (TPX3) hodoscope using two TPX3 sensors, operated at LHC Run-2. The device was mounted in the ATLAS experiment cavern at CERN.
Figure 3.
Timepix3 (TPX3) hodoscope using two TPX3 sensors, operated at LHC Run-2. The device was mounted in the ATLAS experiment cavern at CERN.

Figure 4.
Overview of Medpix-2 (MPX) detector positions in the ATLAS detector (partial illustration) and in the ATLAS experiment cavern. The data of the devices MPX07 to MPX12 (indicated as M7 to M12) were used for the neutron counting luminosity measurement. Taken from Ref. [11].
Figure 4.
Overview of Medpix-2 (MPX) detector positions in the ATLAS detector (partial illustration) and in the ATLAS experiment cavern. The data of the devices MPX07 to MPX12 (indicated as M7 to M12) were used for the neutron counting luminosity measurement. Taken from Ref. [11].

Figure 5.
Luminosity ratio MPX/MPXav for two of the six MPX devices (MPX01 and MPX13) with highest particle flux (MPX01-05 and MPX13). The distributions are approximated by Gaussian fits. The width of the Gaussian is an estimate of the LB-by-LB uncertainties. LHC fills from June to November 2012. The “av” stays for “average”, and “LB” stays for “luminosty block”. Taken from Ref. [11].

Figure 6.
Time history of the luminosity ratio MPX/MPXav for two of the six MPX devices (MPX01 and MPX13) with highest particle flux (MPX01-05 and MPX13) used for hit counting. A linear fit is applied to determine the slopes. The 2012 data are divided into 14 time periods with an equal number of LBs. The data are scaled such that the value of the first bin is unity. The size of the statistical error bar is below the size of the data point. It is identical for every data point of the same device. The size of the error bar which would give is given in Table 3 for each MPX device. LHC fills from June to November 2012. The “ndf” stays for “number of degrees of freedom”. Taken from Ref. [11].

Figure 7.
Time history of the luminosity ratio MPX/MPXav for two of the six MPX devices with lowest particle flux (MPX07-12) used for heavy blob (thermal neutron) counting. A linear fit is applied to determine the slopes. The 2012 data are divided into 14 time periods with an equal number of LBs. The data are scaled such that the value of the first bin is unity. The statistical error bars are shown. LHC fills from May to November 2012. Taken from Ref. [11].

Figure 8.
Number of hits per cluster, combined for six cluster types. Data are taken by MPX01 and MPX13 during the last horizontal van der Meer (vdM) scan of November 2012 (LHC fill 3316). Taken from Ref. [11].
Figure 8.
Number of hits per cluster, combined for six cluster types. Data are taken by MPX01 and MPX13 during the last horizontal van der Meer (vdM) scan of November 2012 (LHC fill 3316). Taken from Ref. [11].

Figure 9.
Luminosity from hit counting as a function of nominal beam separation measured with MPX01 during the last horizontal vdM scan of November 2012. Each data point shows the measured instantaneous luminosity before background subtraction and averaged over one acquisition time. Because the acquisition time is significantly shorter than the duration of a scan step, there can be more than one MPX sampling per scan step. The MPX samplings that partially or totally overlap with non-quiescent scan steps (varying beam separation) are not shown. The fit function is the sum of a single Gaussian (representing the proper luminosity in this scan) and a constant term that accounts for instrumental noise and single-beam background. The MPX normalization uses this horizontal and a vertical beam width from LHC vdM fill 3316. Taken from Ref. [11].

Figure 10.
Pull distribution defined as (data-fit)/, where and the ratio (the number of hits per cluster), for MPX01. The data shown in Figure 9 is used. LHC fill 3316. Taken from Ref. [11].

Figure 11.
Average number of interactions per bunch crossing, , as a function of time seen by MPX devices with highest particle flux (MPX01 and MPX13). The distribution is approximately described by a function as given in the figure. The parameters are defined in the text. The statistical uncertainties per data point are indicated. They depend on the hit statistics scaled by a factor given in Table 5. In addition to the fit result described by the solid line, the dashed line shows the result of beam–gas interactions alone , with and obtained from the three-parameter fit. LHC fill 3236. See Section 2.5 for the details. Taken from Ref. [11].

Figure 12.
Relative difference between data and fitted average number of interactions per bunch crossing as a function of time seen by MPX01. The relative deviations between data and fit have an RMS of 0.3%. The statistical uncertainties per data point are indicated and vary from % to % where the factor is the averaged ratio of hits per interacting particle. The apparent structure is discussed in the text. LHC fill 3236. Taken from Ref. [11].

Figure 13.
Average number of interactions per bunch crossing as a function of time using combined data from MPX01-05 and MPX13. The distribution is approximately described by the function given in the figure. The parameters are defined in the text. In addition to the fit result described by the thin line, the dashed line shows the result of beam–gas interactions alone , with and obtained from the three-parameter fit. LHC fill 3236.Taken from Ref. [11].

Figure 14.
Contour curve of and , given at 68% CL, for the fit results of the average number of interactions per bunch crossing as a function of time using combined data from MPX01-05 and MPX13, shown in Figure 13. The dot in the center of the contour indicates the fit values. LHC fill 3236. Taken from [11].

Figure 15.
Pull distributions defined as (data-fit)/, where . The ratio is determined for each MPX device separately. LHC fill 3236. Taken from Ref. [11].
Figure 15.
Pull distributions defined as (data-fit)/, where . The ratio is determined for each MPX device separately. LHC fill 3236. Taken from Ref. [11].

Figure 16.
Pull distributions defined as (data-fit)/, where . The ratio is determined for each MPX device separately and takes into account the systematic uncertainty from the fluctuations not described by the fit function. LHC fill 3236. Taken from Ref. [11].
Figure 16.
Pull distributions defined as (data-fit)/, where . The ratio is determined for each MPX device separately and takes into account the systematic uncertainty from the fluctuations not described by the fit function. LHC fill 3236. Taken from Ref. [11].

Figure 17.
Contour curves of and , given at 68% CL, for the fit results of the average number of interactions per bunch crossing as a function of time seen by MPX01 and MPX13. The dot in the center of the contour indicates the fit values. The hit statistical uncertainties and systematic uncertainties from luminosity fluctuations not described by the fit function are added in quadrature, given in Table 9. The values are 528, 1811, 2666, 1415, 1720 and 1078, for MPX01-05 and MPX13 respectively, for 499 degrees of freedom. LHC fill 3236. Taken from Ref. [11].

Figure 18.
Contour curves of and , given at 68% CL, for the fit results of the average number of interactions per bunch crossing as a function of time seen by MPX01 and MPX13. The dot in the center of the contour indicates the fit values. The hit statistical uncertainties and systematic uncertainties from luminosity fluctuations not described by the fit function are added in quadrature, given in Table 9, and then scaled to yield . LHC fill 3236. Taken from Ref. [11].

Figure 19.
Contour curves of and , given at 68% CL, for the fit results of the average number of interactions per bunch crossing as a function of time seen by MPX01-05 and MPX13. The dots in the center of the contours indicate the fit values. The hit statistical uncertainties and systematic uncertainties from luminosity fluctuations not described by the fit function are added in quadrature, given in Table 9, and then scaled to yield . LHC fill 3236. Taken from Ref. [11].

Figure 20.
Deviations between data and the fit of the average number of interactions per bunch crossing as a function of time seen by MPX01. The relative deviations between data and fit have a root mean square RMS of 0.2%. The statistical uncertainties per data point are indicated and vary from about % to about %, where the factor is the averaged ratio of hits per interacting particle. The apparent structure is similar to the one previously discussed in the text. LHC fill 3249. Taken from Ref. [11].

Figure 21.
Time history of (a) the MPX luminosity and (b) the MPX/BCM luminosity ratio. The small luminosity dips apparent in (a) and the associated outliers in (b) correspond to times when the LHC operators perform small-amplitude beam-separation scans to optimize the luminosity. During these brief intervals, the luminosity varies more rapidly than can be sampled by the online luminosity and MPX data-taking infrastructure, resulting in unphysical variations in the apparent MPX/BCM luminosity ratio. Taken from Ref. [12].

Figure 22.
MPX01 hit luminosity vs. bunch-averaged number, , of inelastic interactions per crossing reported by the reference ATLAS luminosity algorithm (). This LHC fill was chosen because the data span a particularly wide range of values. The residual of a linear fit to the data is shown in the bottom frame. The outliers correspond to times when the LHC operators performed small amplitude beam-separation scans to optimize collisions, during which the luminosity varies more rapidly than can be reliably sampled by the online luminosity and MPX data-taking infrastructure. Taken from Ref. [12].

Figure 23.
Fractional deviation of the luminosity reported by different MPX devices from the ATLAS reference luminosity (BCM) as a function of time in 2012. The ratio is shown for 14 time periods. For each device, the time periods are chosen to have the same number of frames. The statistical uncertainties are comparable to or smaller than the size of the markers. The data are scaled such that the value of the first bin is unity. Taken from Ref. [12].

Figure 24.
Distribution of the number of heavy blobs per frame, recorded with MPX12 below a converter, during LHC collision periods in 2012. The line shows a histogram with a fitted Poisson distribution. Taken from Ref. [12].
Figure 24.
Distribution of the number of heavy blobs per frame, recorded with MPX12 below a converter, during LHC collision periods in 2012. The line shows a histogram with a fitted Poisson distribution. Taken from Ref. [12].

Figure 25.
Fractional deviation in the luminosity (thermal neutron counting mode) reported by the MPX06 to MPX12 devices from the ATLAS reference luminosity (BCM) as a function of time in 2012. The ratio is shown for 14 time periods. For each device, the time periods are chosen to have the same number of frames. The data are scaled such that the value of the first bin is unity [12].

Figure 26.
Fractional deviation in the number of interactions per bunch crossing (averaged over all colliding bunch pairs), obtained using (a) MPX results and (b) other ATLAS luminometers, with respect to the value [21] and as a function of time in 2012. Each point shows the mean deviation for a single run compared to a reference run taken on 27 October 2012. Statistical uncertainties are shown per point, but in most cases are negligible. The MPX hit luminosity from a device that gives a constant ratio (MPX11) as well as that of a device with one of the largest increases (MPX02) are shown together with the luminosity measured with the MPX from thermal neutron counting averaged over MPX06 to MPX12. Taken from Ref. [12].

Figure 27.
(a) BCM luminosity during the last horizontal November 2012 vdM scan summed over all bunches as a function of nominal beam separation. Each data point shows the measured instantaneous luminosity before background subtraction and averaged over the entire duration of a scan step. Data from the scan steps during which the beam separation is varied (non-quiescent beams) are not shown. The fit function is the sum of the proper luminosity that is well represented in this scan by a single Gaussian and of a constant term that accounts for instrumental noise and single-beam background. (b) MPX01 hit luminosity (uncorrected) during the last horizontal November 2012 vdM scan summed over all bunches as a function of nominal beam separation. Each data point shows the measured instantaneous luminosity before background subtraction and averaged over one sampling interval of the MPX01 device. The MPX samplings that partially or totally overlap with non-quiescent scan steps (varying beam separation) are not shown. The fit function is the sum of the proper luminosity that is represented in this scan by a single Gaussian and of a constant term that accounts for instrumental noise and single-beam background. Taken from Ref. [12].

Figure 28.
MPX01 hit luminosity vs. BCM luminosity for the last horizontal November 2012 vdM scan. The line is a linear fit to the data. The non-zero intercept corresponds to the difference in the MPX and BCM noise and background contributions. The bottom frame shows the fractional residual of the linear fit. Taken from Ref. [12].

Figure 29.
Evolution in time of the fractional difference in run-integrated luminosity between the MPX neutron-counting and the ATLAS reference luminosity. Each point shows the mean difference for a single run as defined in the text. The error bars are statistical only and convoluted with 0.5% relative uncertainty from the ATLAS reference measurement. The MPX neutron luminosity is normalized to the MPX hit luminosity [11] such that their ratio for the data taken on 16 September 2012 is unity. The data of the devices MPX07-MPX12 are combined. Taken from Ref. [13].

Figure 30.
Residual distributions defined as . A Gaussian fit is applied. The MPX neutron luminosity is normalized to the MPX hit luminosity [11] such that their ratio for the data (as defined in the text) taken on 16 September 2012 is unity. The data of the devices MPX07-MPX12 are combined. Taken from Ref. [13].

Figure 31.
Pull distribution , where is the statistical uncertainty on the thermal neutron counting, and the run-by-run uncertainty on the ATLAS reference luminosity. The relative ATLAS reference uncertainty is 0.5%. A Gaussian fit is applied. The MPX neutron luminosity is normalized to the MPX hit luminosity [11] such that their ratio for the data (as defined in the text) taken on 16 September 2012 is unity. The data of the devices MPX07-MPX12 are combined. Taken from Ref. [13].

Figure 32.
Overview of TPX detector positions in the ATLAS detector (partial illustration) and in the ATLAS cavern. The devices TPX01 to TPX16 are indicated as T1 to T16. Taken from Ref. [14].
Figure 32.
Overview of TPX detector positions in the ATLAS detector (partial illustration) and in the ATLAS cavern. The devices TPX01 to TPX16 are indicated as T1 to T16. Taken from Ref. [14].

Figure 33.
Time history of the TPX luminosity. The small dips, visible as variations from the descending curve, correspond to the times when the LHC operators performed small-amplitude beam-separation scans to optimize the luminosity. The normalization between hit rate and luminosity is based on vdM scans using LHC fill 4266, as detailed in Section 5.2. Taken from Ref. [14].

Figure 34.
Luminosity from hit-counting as a function of nominal beam separation measured with TPX02 layer 2 during the first horizontal vdM scan in August 2015. Each data point shows the measured instantaneous luminosity before background subtraction. Because the exposure time is significantly shorter than the duration of a scan step, the TPX samplings are averaged per scan step. The TPX samplings that partially or totally overlap with non-quiescent scan steps (varying beam separation) are not shown. The fit function is the sum of a single Gaussian (representing the proper luminosity in this scan) and a constant term that accounts for instrumental noise and single-beam background. The TPX normalization uses this horizontal and a vertical beam width from LHC vdM fill 4266. Taken from Ref. [14].

Figure 35.
Pull distribution defined as (data-fit)/, where , with for TPX02 layer 2. The data shown in Figure 34 are used. LHC fill 4266. Taken from Ref. [14].

Figure 36.
Average number of interactions per bunch crossing as a function of time, seen by TPX02 layer 2 in hit-counting mode. The distribution is approximately described by a function as given in the figure. The parameters are defined in the text. The statistical uncertainties per data point are indicated. They depend on the hit statistics scaled by a factor . For the first time intervals, the is calculated analytically from the LHC parameters, and for the subsequent time intervals, is scaled with , where the index corresponds to the time period. Taken from Ref. [14].

Figure 37.
Relative difference between the data and the fitted average number of interactions per bunch crossing as a function of time, seen by TPX02 and TPX12 for layers 1 and 2. The data are shown for 30 frames (1 s each) combined in order to decrease the statistical uncertainty. LHC fill 4449. Taken from Ref. [14].

Figure 38.
Relative difference between the data and the fitted average number of interactions per bunch crossing as a function of time, seen by TPX02 averaged over layers 1 and 2. The data are shown for 10 frames (1 s each) combined in order to decrease the statistical uncertainty. LHC fill 4449. Taken from Ref. [14].

Figure 39.
Gaussian fit of the relative difference between the data and the fitted average number of interactions per bunch crossing as a function of time, seen by TPX02 averaged over layers 1 and 2. The data are shown for 10 frames (1 s each) combined in order to decrease the statistical uncertainty. LHC fill 4449. Taken from Ref. [14].

Figure 40.
Pull distribution defined as (data-fit)/, where , with . The data are averaged over layers 1 and 2 for TPX02 and TPX12 with 10 frames (1 s each) combined. The data shown in Figure 39 are used. LHC fill 4449. Taken from Ref. [14].

Figure 41.
Relative difference between the average number of interactions per bunch crossing measured by layers 1 and 2 of TPX02 as a function of time. The data are shown for 10 frames (1 s each) combined in order to decrease the statistical uncertainty. LHC fill 4449. Taken from Ref. [14].
Figure 41.
Relative difference between the average number of interactions per bunch crossing measured by layers 1 and 2 of TPX02 as a function of time. The data are shown for 10 frames (1 s each) combined in order to decrease the statistical uncertainty. LHC fill 4449. Taken from Ref. [14].

Figure 42.
Gaussian fit of the relative difference between the average number of interactions per bunch crossing measured by layers 1 and 2 of TPX02 and TPX12 as a function of time. The data are shown for 10 frames (1 s each) combined in order to decrease the statistical uncertainty. LHC fill 4449. Taken from Ref. [14].

Figure 43.
Pull distribution defined as , where , with for TPX02. The data shown in Figure 42 are used. LHC fill 4449. Taken from Ref. [14].

Figure 44.
Time history of the luminosity ratio measured by layers 1 and 2 for TPX02 and TPX12. The 2015 TPX data are divided into luminosity blocks of typically one minute length and then grouped into LHC fill time periods. The size of the statistical error bar is below the size of the data point. A linear fit is applied to determine the slope. LHC fills from August to November 2015. Taken from Ref. [14].

Figure 45.
Time history of the luminosity ratio measured by the TPX02 and TPX12 devices averaged over the data taken by layers 1 and 2. The 2015 TPX data are divided into luminosity blocks of typically one minute length and then grouped into LHC fill time periods. The size of the statistical error bar is below the size of the data point. A linear fit is applied to determine the slope. LHC fills from August to November 2015. Taken from Ref. [14].

Figure 46.
Hit rate measured with TPX02 layers 1 and 2 before and after the vdM scan on 18 May 2016 as a function of time. Each data point shows the count rate of a 1 s frame. Initially, a small background rate is observed. Then, at about 5:00, high-intensity LHC proton beams are filled in the accelerator and a small increase in count rate is observed. Subsequently, high-intensity proton collisions take place with count rate above . After the high-intensity proton collisions, the falling activation curve is clearly recognizable. The vdM scan with low-intensity LHC proton beams starts around 16:00. The figure shows also the determined total activation rate and six components with different life times. During the high-intensity collisions, the activation contribution to the total count rate is at the percent level. The ratio of determined activation and data rates minus one is well centered around zero for the time periods between the proton–proton collisions, indicating a good description of the activation count rate. LHC vdM fill 4945. Taken from Ref. [15].

Figure 47.
Hit rate measured with with TPX02 layers 1 and 2 before and after the vdM scan on 27 May 2016 as a function of time, as described in Figure 46. LHC vdM fill 4954. Taken from Ref. [15].

Figure 48.
Luminosity from hit-counting as a function of nominal beam separation measured with TPX02 layer 2 during the first horizontal and vertical vdM scan on 18 May 2016. Each data point shows the measured instantaneous luminosity before background subtraction. Because the exposure time is significantly shorter than the duration of a scan step, the TPX samplings are averaged per scan step. The TPX samplings that partially or totally overlap with non-quiescent scan steps (varying beam separation) are not shown. The fit function is the sum of a single Gaussian (representing the proper luminosity in this scan) and a constant term that accounts for induced radioactivity (activation), instrumental noise and single-beam induced background. The TPX normalization uses the horizontal and the vertical beam width. LHC vdM fill 4945. Taken from Ref. [15].

Figure 49.
Pull distribution defined as (data-fit)/, where with for TPX02 layer 2. The data shown in Figure 48 are used. LHC fill 4945. Taken from Ref. [15].

Figure 50.
Fraction of excluded pixels for device TPX02 layer 1 as a function of time. The fractions of pixels with a rate below are shown in red, whereas the fractions of pixels with a rate above are shown in blue. Taken from Ref. [16].
Figure 50.
Fraction of excluded pixels for device TPX02 layer 1 as a function of time. The fractions of pixels with a rate below are shown in red, whereas the fractions of pixels with a rate above are shown in blue. Taken from Ref. [16].

Figure 51.
Cumulated fraction of excluded pixels for device TPX02 layer 1 as a function of time. The cumulated fractions of pixels with a rate below are shown in red, whereas the cumulated fractions of pixels with a rate above are shown in blue. Taken from Ref. [16].
Figure 51.
Cumulated fraction of excluded pixels for device TPX02 layer 1 as a function of time. The cumulated fractions of pixels with a rate below are shown in red, whereas the cumulated fractions of pixels with a rate above are shown in blue. Taken from Ref. [16].

Figure 52.
Low-rate devices: (a) Luminosity ratio of devices TPX05 and TPX04 for each LHC fill. (b) Luminosity ratio of devices TPX06 and TPX04 for each LHC fill. (c) Luminosity ratio of devices TPX14 and TPX04 for each LHC fill. High-rate devices: (d) Luminosity ratio of devices TPX02 and TPX04 for each LHC fill. (e) Luminosity ratio of devices TPX12 and TPX04 for each LHC fill. (f) Luminosity ratio of devices TPX13 and TPX04 for each LHC fill. Taken from Ref. [16].

Figure 53.
Time history of the TPX luminosity using thermal neutron counting. The descending LHC luminosity curve is clearly visible. The error bars give the statistical uncertainty. The normalization between hit rate and luminosity is based on the vdM scan using LHC fill 4266, determined with the TPX hit-counting [14], and details are given in the text and in Figure 54. The small dip at 0:30, visible as variation from the descending curve, corresponds to the time when the LHC operators performed small-amplitude beam separation scans to optimize the luminosity. Taken from Ref. [17].

Figure 54.
Thermal neutron (HB) rate per LB (for 100% acquisition time) versus TPX hit-counting luminosity per LB [14] for TPX04 layer 1. The slope of the linear fit gives the normalization factor between count rate and thermal neutron luminosity. The scatter of the points is larger than purely statistical with . Taken from Ref. [17].

Figure 55.
Time history of the luminosity ratio measured by layers 1 and 2 for TPX04 and TPX14. The 2015 TPX data are divided into luminosity blocks of typically one minute length and then grouped into LHC fill time periods. The statistical error bars are given. A linear fit is applied to determine the slope. The LHC fills from September to November 2015 are shown. Taken from Ref. [17].

Figure 56.
Time history of the luminosity ratio measured by TPX04 and TPX14. The measurements are averaged over the data recorded by layers 1 and 2. The 2015 TPX data are divided into luminosity blocks of typically one minute length and then grouped into LHC fill time periods. The statistical error bars are given. A linear fit is applied to determine the slope. The LHC fills from September to November 2015 are shown. Taken from Ref. [17].

Figure 57.
Evolution in time of the fractional difference in fill-integrated luminosity between the TPX neutron-counting and the TPX hit-counting reference luminosity. Each point shows the mean difference for a single LHC fill as defined in the text. The error bars are statistical only, and convoluted with 0.5% relative uncertainty from the TPX hit-counting reference measurement. The TPX neutron luminosity is normalized to the TPX hit-counting luminosity [14]. The data of the devices TPX04 and TPX14, layers 1 and 2, are combined. Taken from Ref. [17].

Figure 58.
Residual distributions defined as . A Gaussian fit is applied. The TPX neutron luminosity is normalized to the TPX hit-counting luminosity [14]. The data of the devices TPX04 and TPX14, layers 1 and 2, are combined. Taken from Ref. [17].

Figure 59.
Pull distribution , where is the statistical uncertainty on the thermal neutron counting, and the fill-by-fill uncertainty on the TPX hit-counting reference luminosity. The relative TPX hit-counting reference uncertainty is 0.5% [14]. A Gaussian fit is applied. The TPX neutron luminosity is normalized to the TPX hit-counting luminosity [14]. The data of the devices TPX04 and TPX14, layers 1 and 2, are combined. Taken from Ref. [17].

Figure 60.
Time history of the TPX3 luminosity, as seen by TPX3 layer 1 using hit-counting in LHC fill 6677. The small dips, visible as variations from the descending curve, correspond to the times when the LHC operators performed small-amplitude beam-separation scans to optimize or increase the luminosity. A larger beam adjustment took place at about 15:30 (UTC+2). LHC emittance scans were performed at the beginning 14:30 (UTC+2) and at the end 2:10 (UTC+2) of the fill. The approximate normalization between hit rate and luminosity is based on the peak instantaneous luminosity [25]. Taken from Ref. [18].

Figure 61.
Time history of the LHC luminosity, as seen by TPX3 layer 1 using cluster-counting in LHC Run 6677. The small dips, visible as variations from the descending curve, correspond to the times when the LHC operators performed small-amplitude beam-separation scans to optimize or increase the luminosity. The solid line shows the fit to the data by the function given in Equation (2). Taken from Ref. [18].

Figure 62.
Relative difference between data and fitted luminosity curve as a function of time, seen by TPX3 for layers 1 and 2, in hit- and cluster-counting analyses in LHC fill 6677. The statistical uncertainties are given, which in the hit-counting analysis are much smaller than in the cluster analysis. The cluster analysis takes the correlations into account, resulting from the fact that one particle typically creates many hits. The TPX3 data are grouped into LB time periods of typically 60 s. Taken from Ref. [18].

Figure 63.
Gaussian fit of the relative difference between data and fitted luminosity curve using cluster-counting for layer 1 in LHC fill 6677. Taken from Ref. [18].
Figure 63.
Gaussian fit of the relative difference between data and fitted luminosity curve using cluster-counting for layer 1 in LHC fill 6677. Taken from Ref. [18].

Figure 64.
Pull distribution defined as (data-fit)/ where is the uncertainty from the cluster statistics. The data shown in Figure 63 are used (LHC fill 6677). Taken from Ref. [18].

Figure 65.
Relative difference between the luminosities measured by layers 1 and 2 of the TPX3 device as a function of time, using cluster-counting in LHC fill 6677. The TPX3 data are grouped into LB time periods of typically 60 s. Statistical error bars are shown. Taken from Ref. [18].
Figure 65.
Relative difference between the luminosities measured by layers 1 and 2 of the TPX3 device as a function of time, using cluster-counting in LHC fill 6677. The TPX3 data are grouped into LB time periods of typically 60 s. Statistical error bars are shown. Taken from Ref. [18].

Figure 66.
Gaussian fit of the relative difference between the luminosities measured by layers 1 and 2 of the TPX3 device as a function of time, using cluster-counting in LHC fill 6677. Taken from Ref. [18].
Figure 66.
Gaussian fit of the relative difference between the luminosities measured by layers 1 and 2 of the TPX3 device as a function of time, using cluster-counting in LHC fill 6677. Taken from Ref. [18].

Figure 67.
Pull distribution defined as , where is the luminosity uncertainty from the cluster statistics for layer i. The data shown in Figure 66 are used (LHC fill 6677). Taken from Ref. [18].

Figure 68.
Relative difference between the luminosities measured by layers 1 and 2 of the TPX3 device as a function of time, using cluster-counting. The 2018 TPX3 data are grouped into LHC fill time periods. The size of the statistical error bar is below the size of the data point. A linear fit is applied to determine the slope. LHC fills from April to October 2018. Taken from Ref. [18].

Figure 69.
Fractional differences in run-integrated luminosity between the LUCID BiHitOR algorithm and the TPX3, track-counting, EMEC, FCal and TILE measurements, plotted as a function of the cumulative delivered luminosity normalised to the 2017 total. The luminosity measurements from the other detectors are normalized to that of LUCID in the reference run indicated by the arrow. The assigned % long-term stability uncertainty is shown by the yellow band [37]. Taken from [18].

Figure 70.
Bunch structure of individual bunch collisions observed with TPX3 for layer 1. Left: 15 LHC bunch trains are visible, as well as two isolated colliding bunches at 15,950 ns and 60,490 ns orbit times. Right: details for the orbit time range from 10,800 ns to 16,800 ns are shown. In this time range, one bunch train with two short gaps and one isolated colliding bunch are observed. The data are integrated over LHC fill 6694. Taken from Ref. [18].

Figure 71.
Illustration of the background increase during LHC bunch trains using a toy model, as described in the text. The increase in the background asymptotically reaches a constant level as observed in the data. The orbit time range from 10,800 ns to 16,800 ns corresponds to the LHC fill 6694. In this time range, one bunch train with two short gaps and one isolated bunch collision are modeled. Taken from Ref. [18].

Figure 72.
Gaussian fit of the relative difference between the TPX3 luminosities per bunch crossing measured by layers 1 and 2. The data are integrated over LHC fill 6694. Taken from Ref. [18].
Figure 72.
Gaussian fit of the relative difference between the TPX3 luminosities per bunch crossing measured by layers 1 and 2. The data are integrated over LHC fill 6694. Taken from Ref. [18].

Figure 73.
Pull distribution defined as , where is the luminosity uncertainty from the cluster statistics for layer i. The data shown in Figure 72 are used (LHC fill 6694). Taken from Ref. [18].

Figure 74.
Variation in measured LHC luminosity per colliding bunch. The variation is defined as width over mean of the Gaussian fit to the data. The luminosity is averaged from the measurements of TPX3 layers 1 and 2. The observed variation (asymmetry) is due to the convolution of the TPX3 measurement precision and the differences in the (non-Gaussian) intensities of the individual LHC bunches. The data are integrated over LHC fill 6694. Taken from Ref. [18].


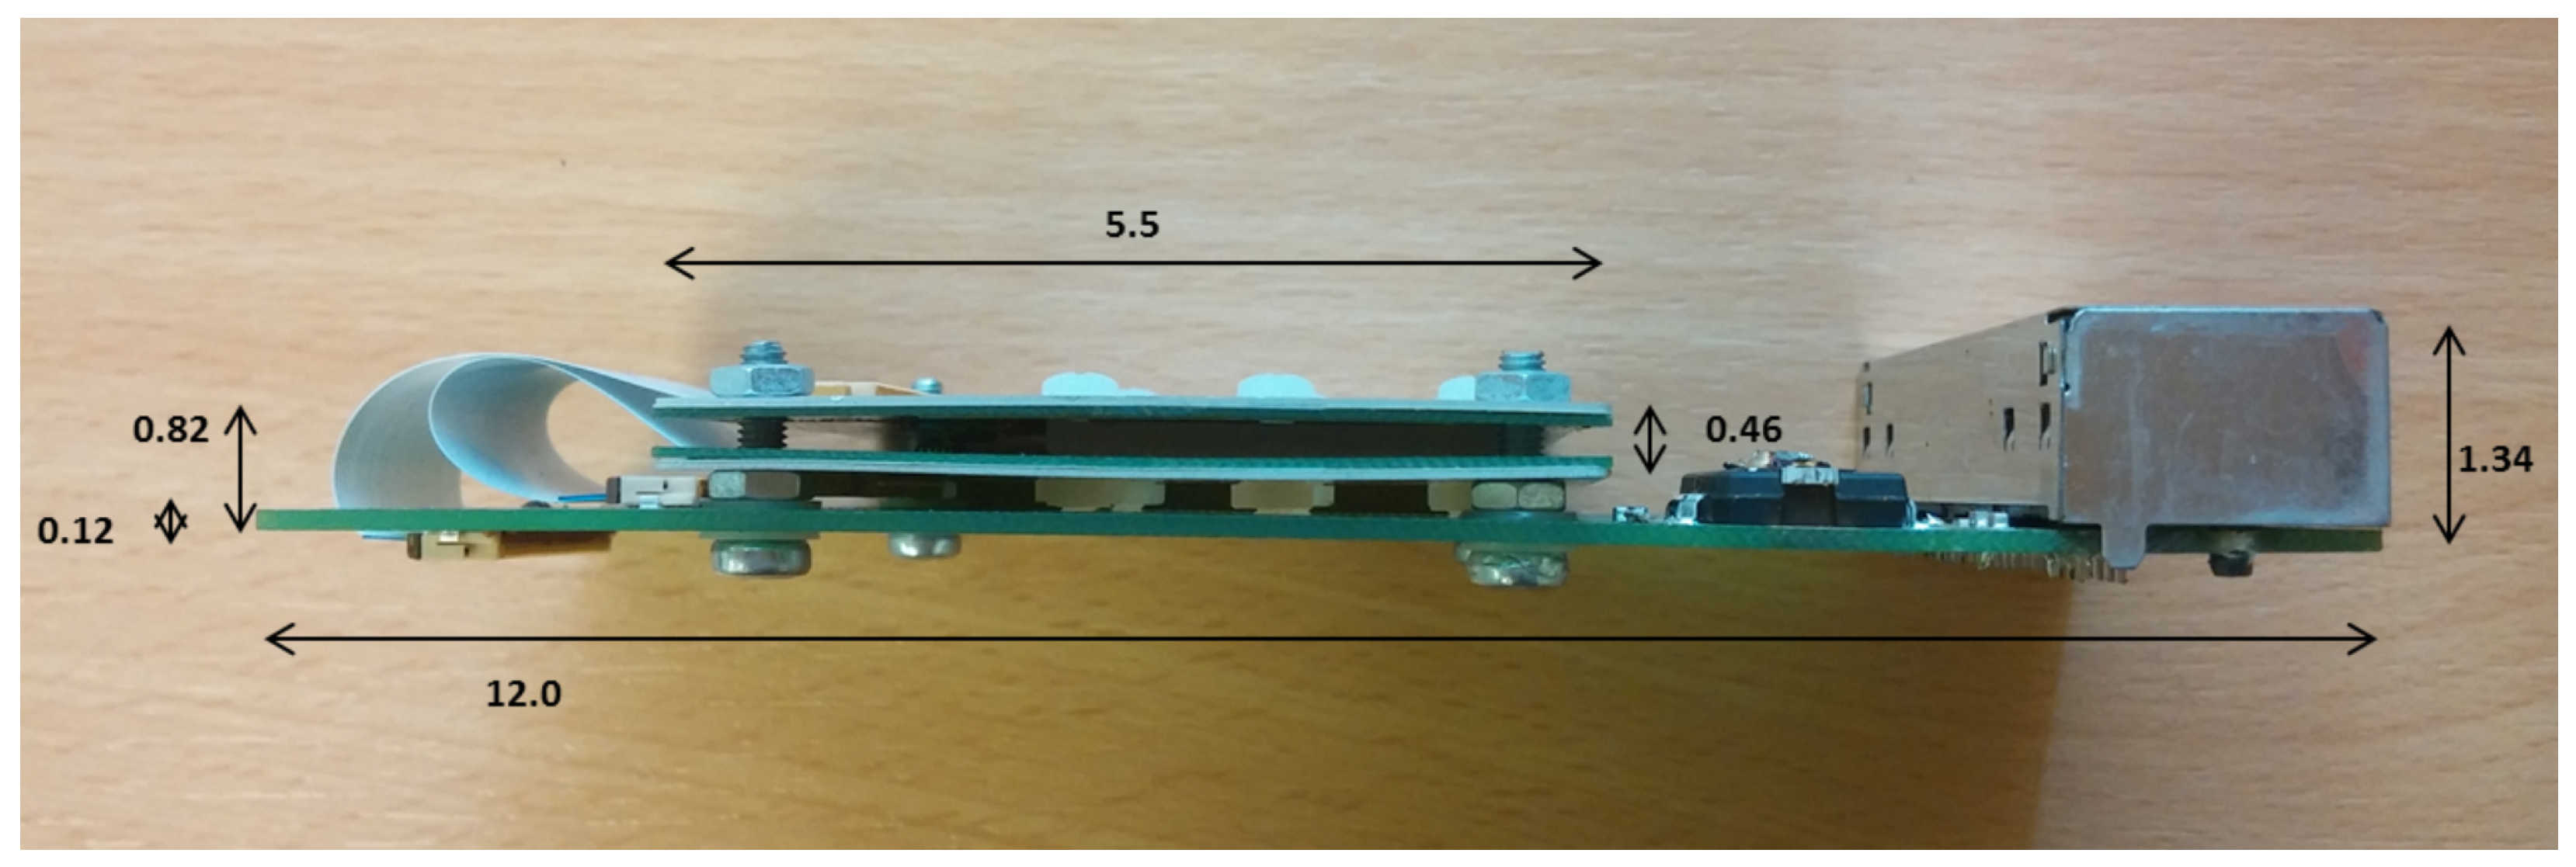
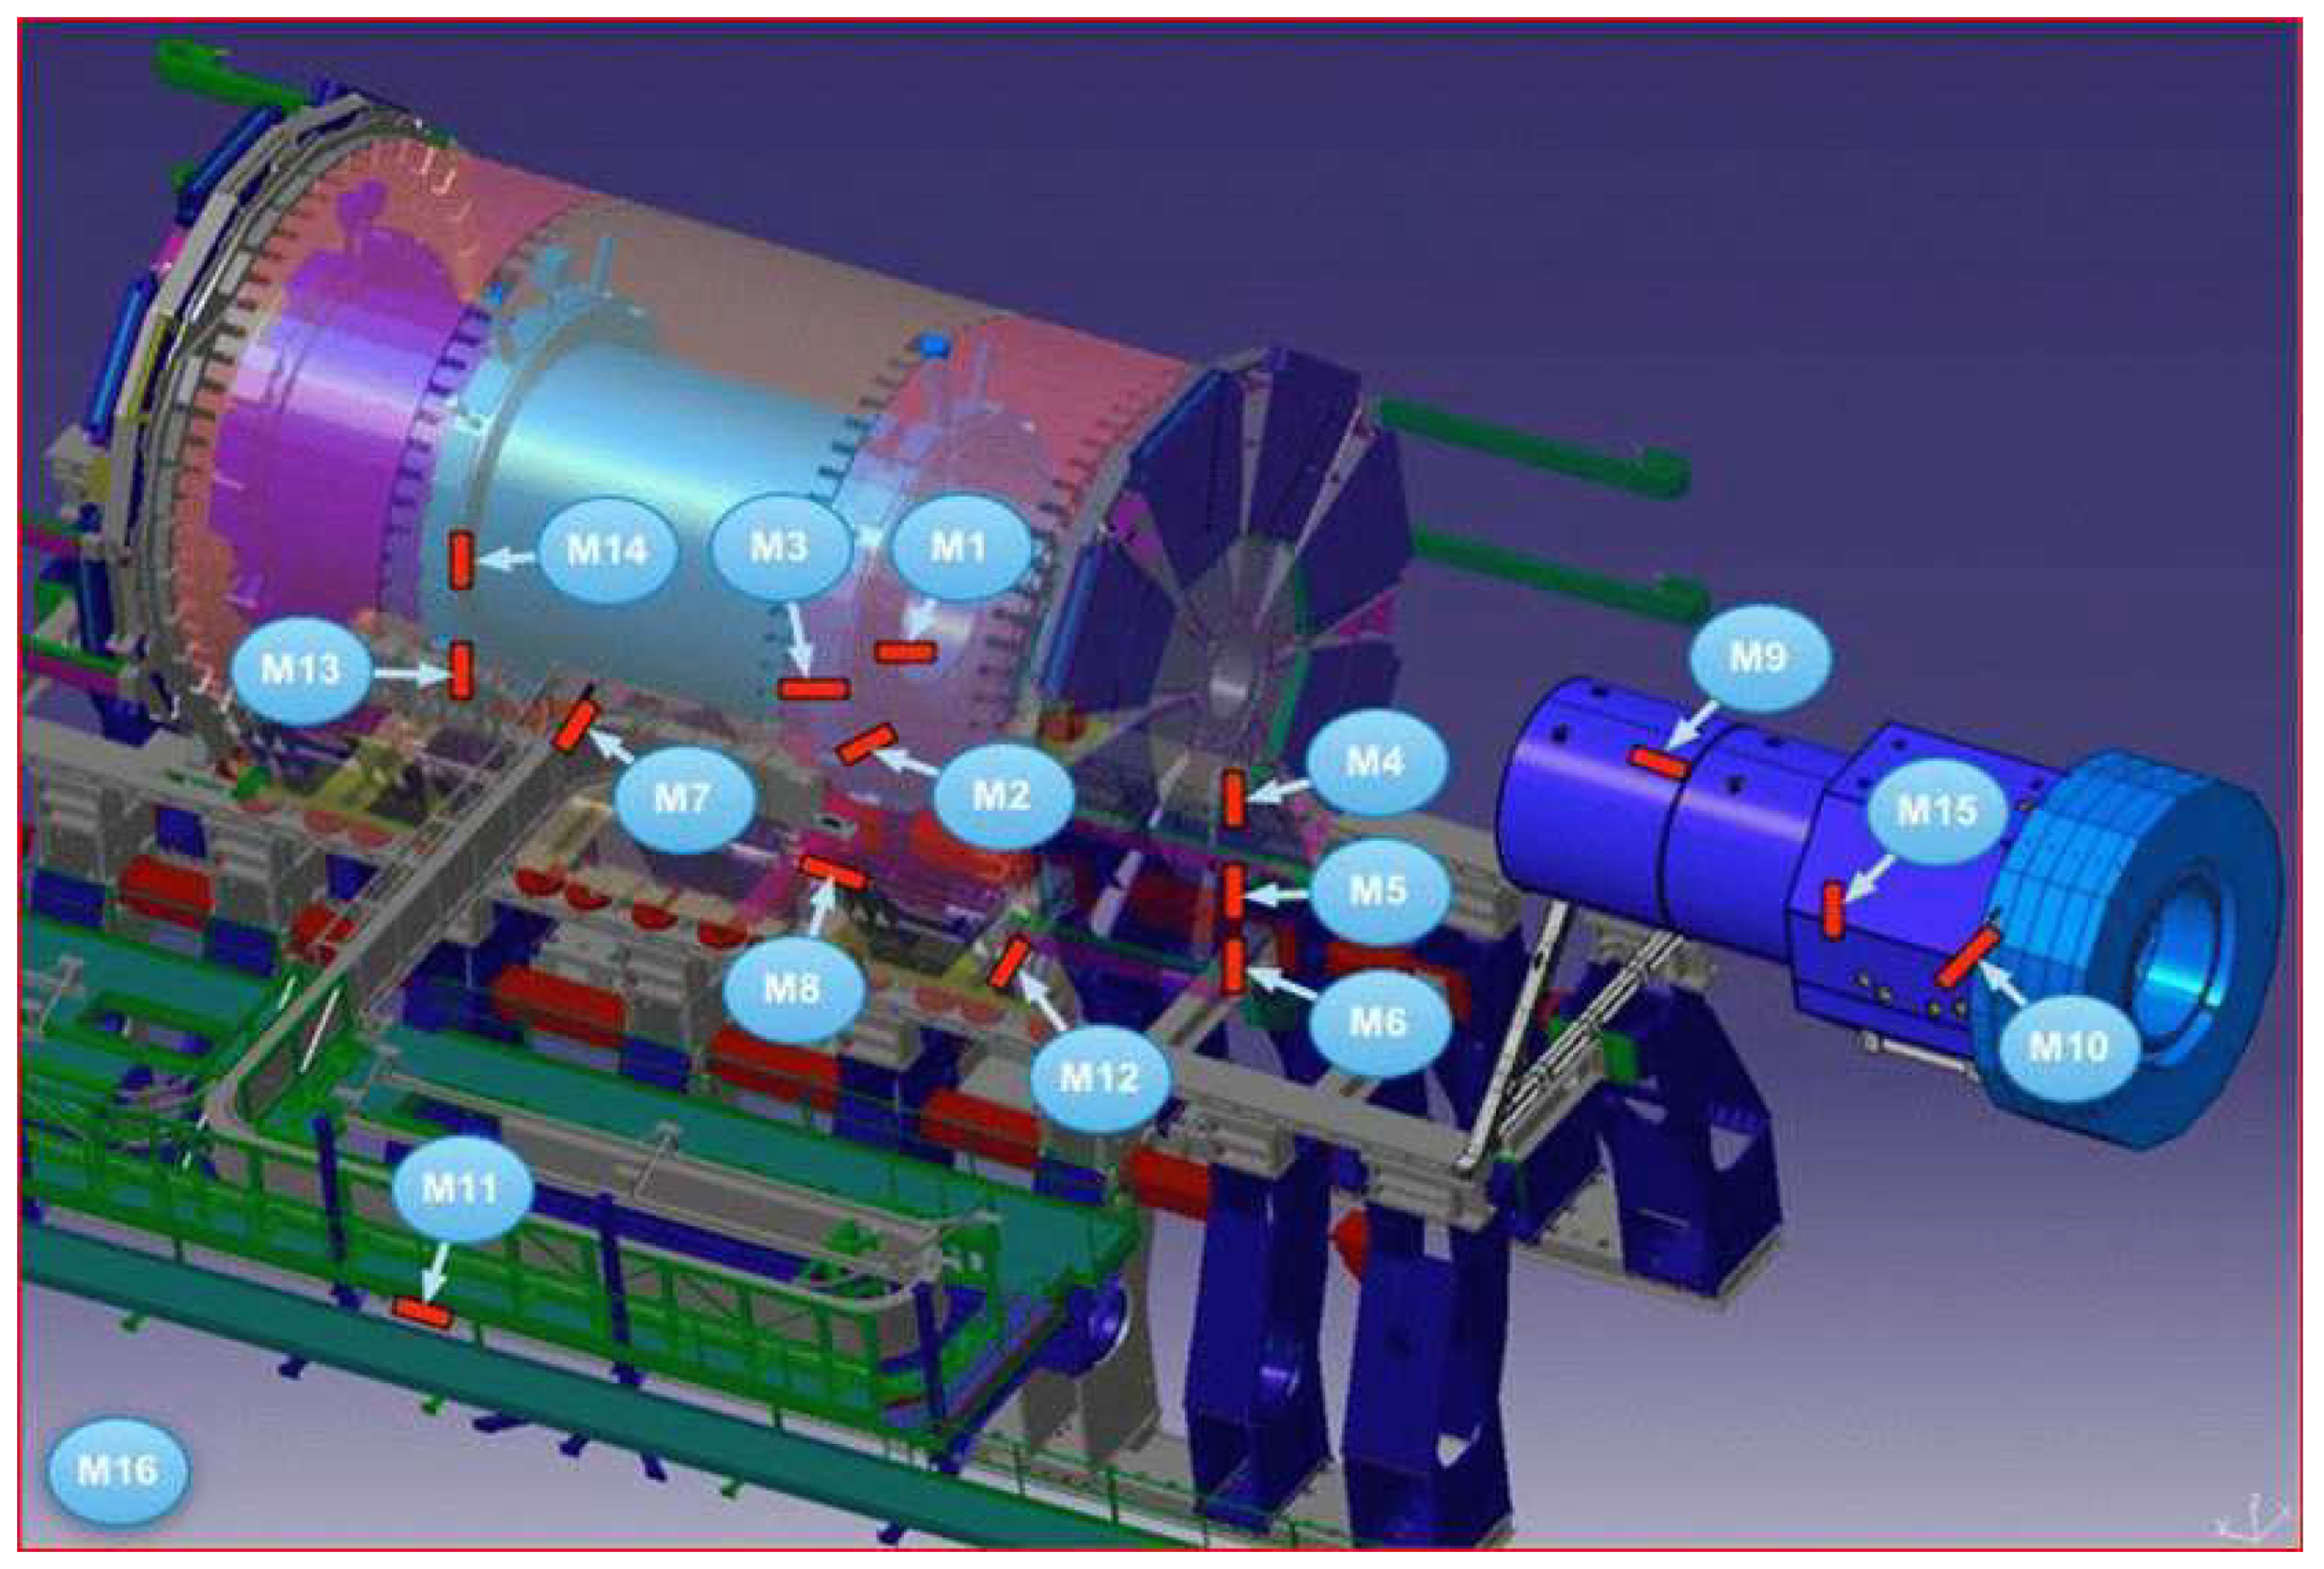
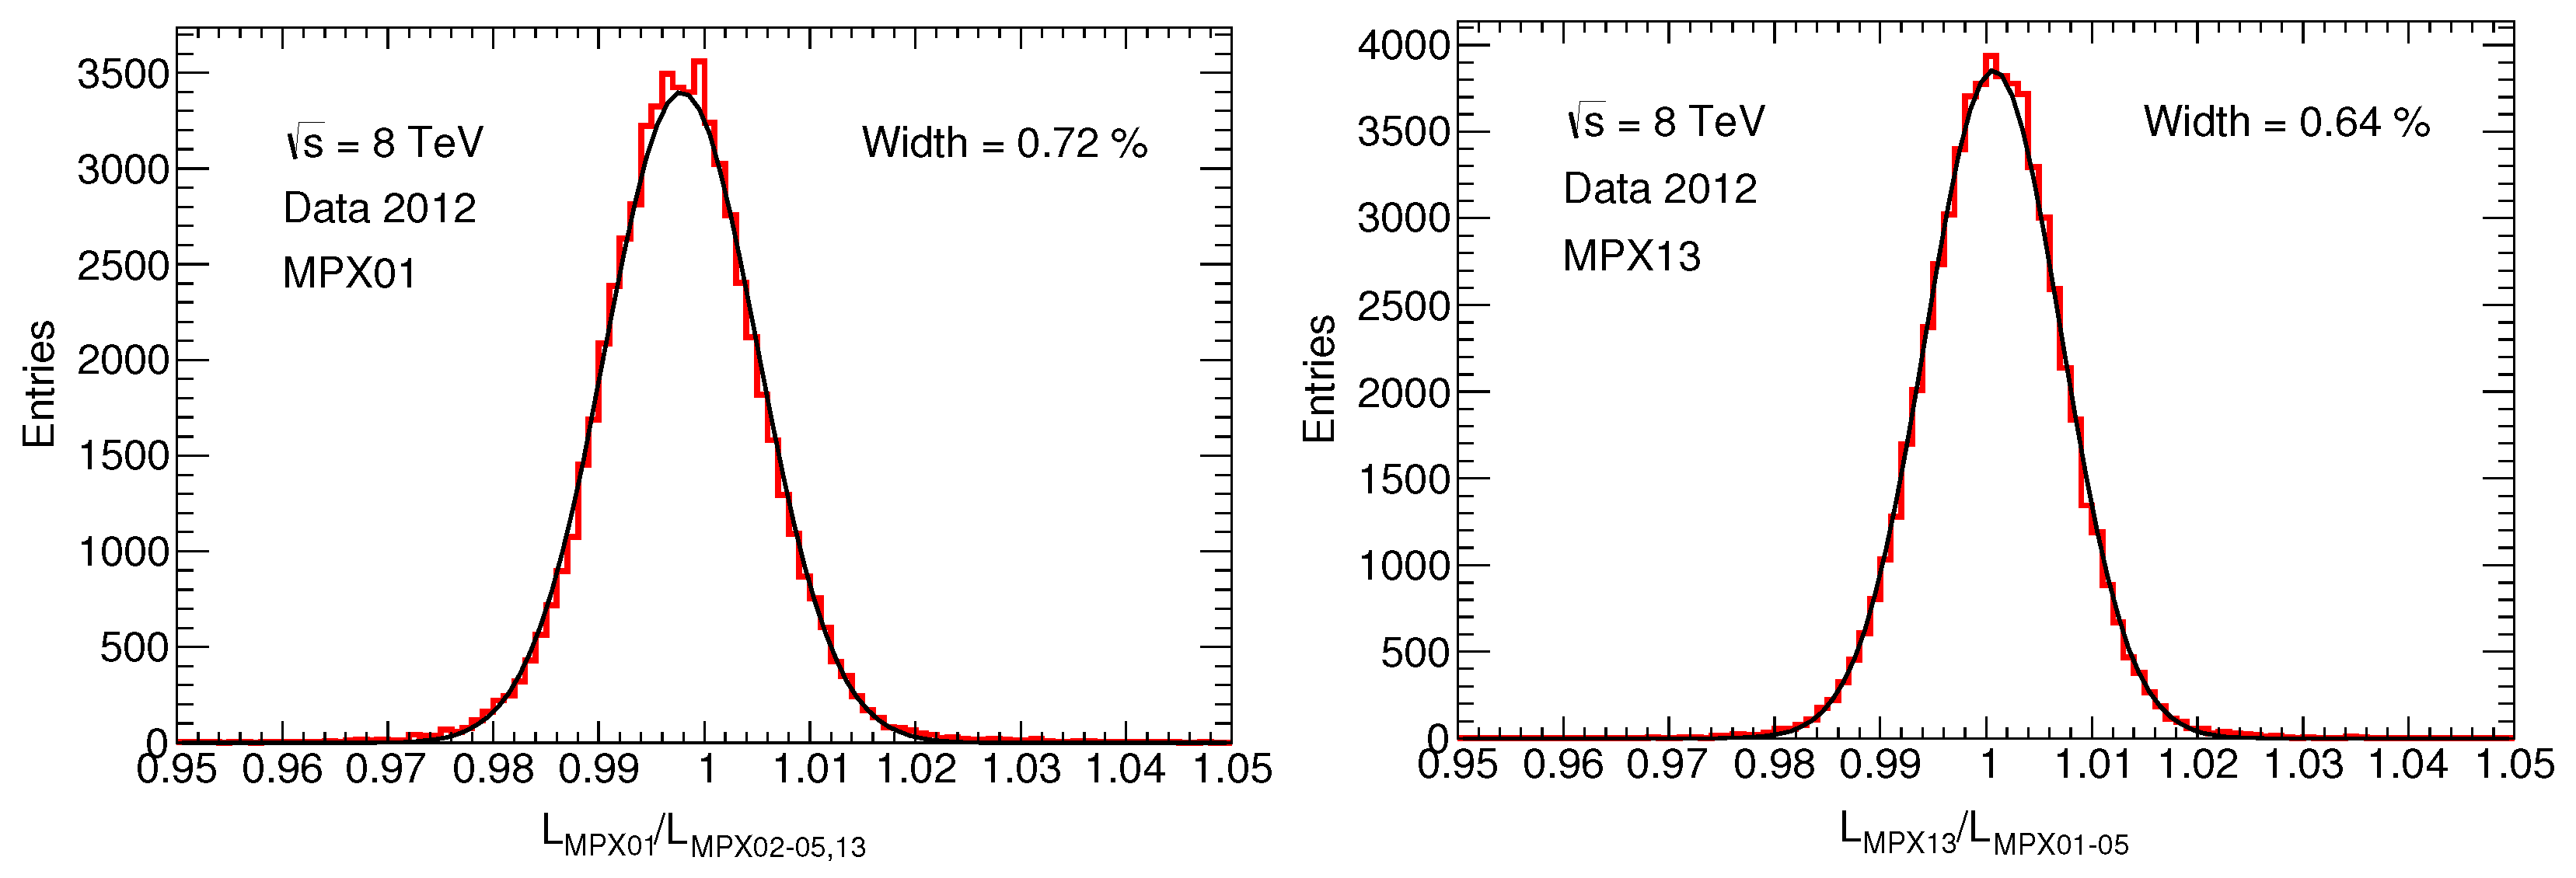
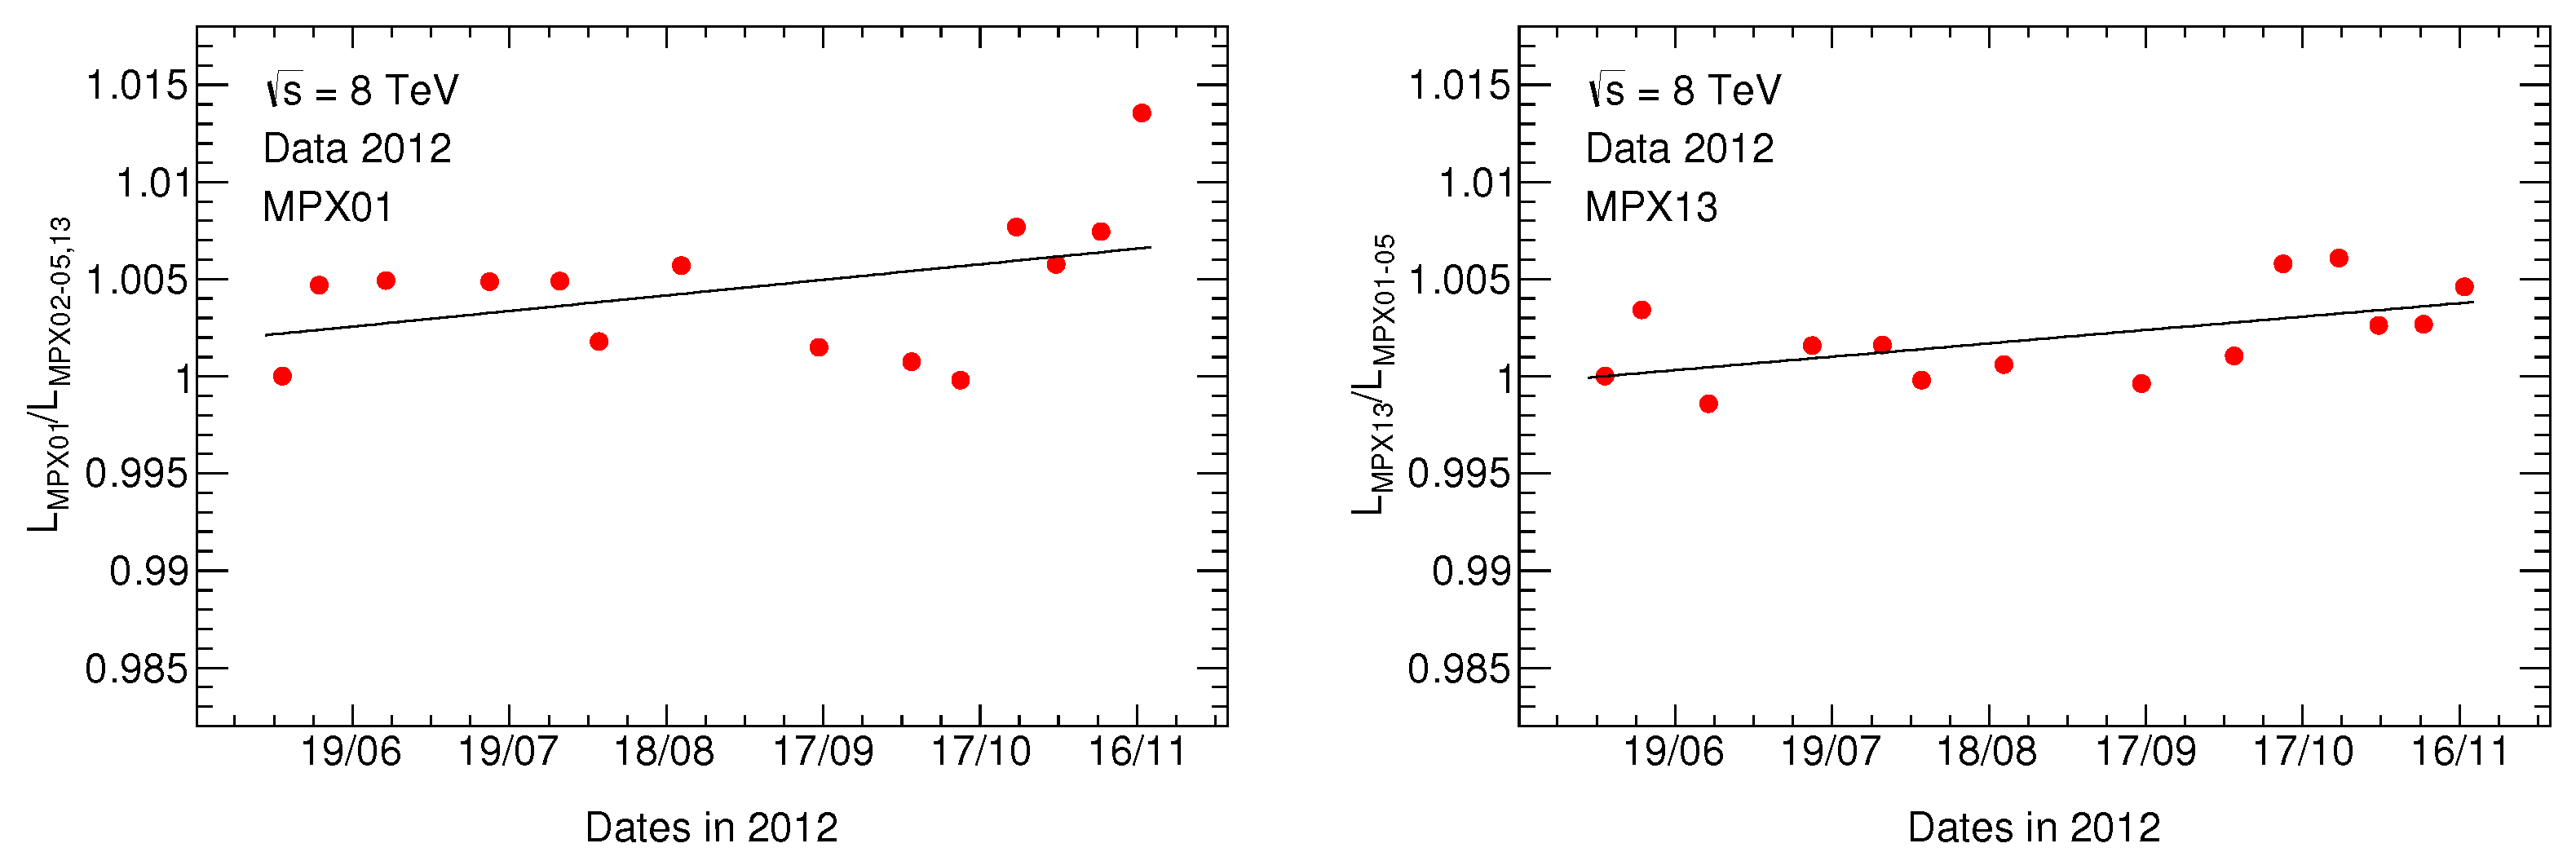
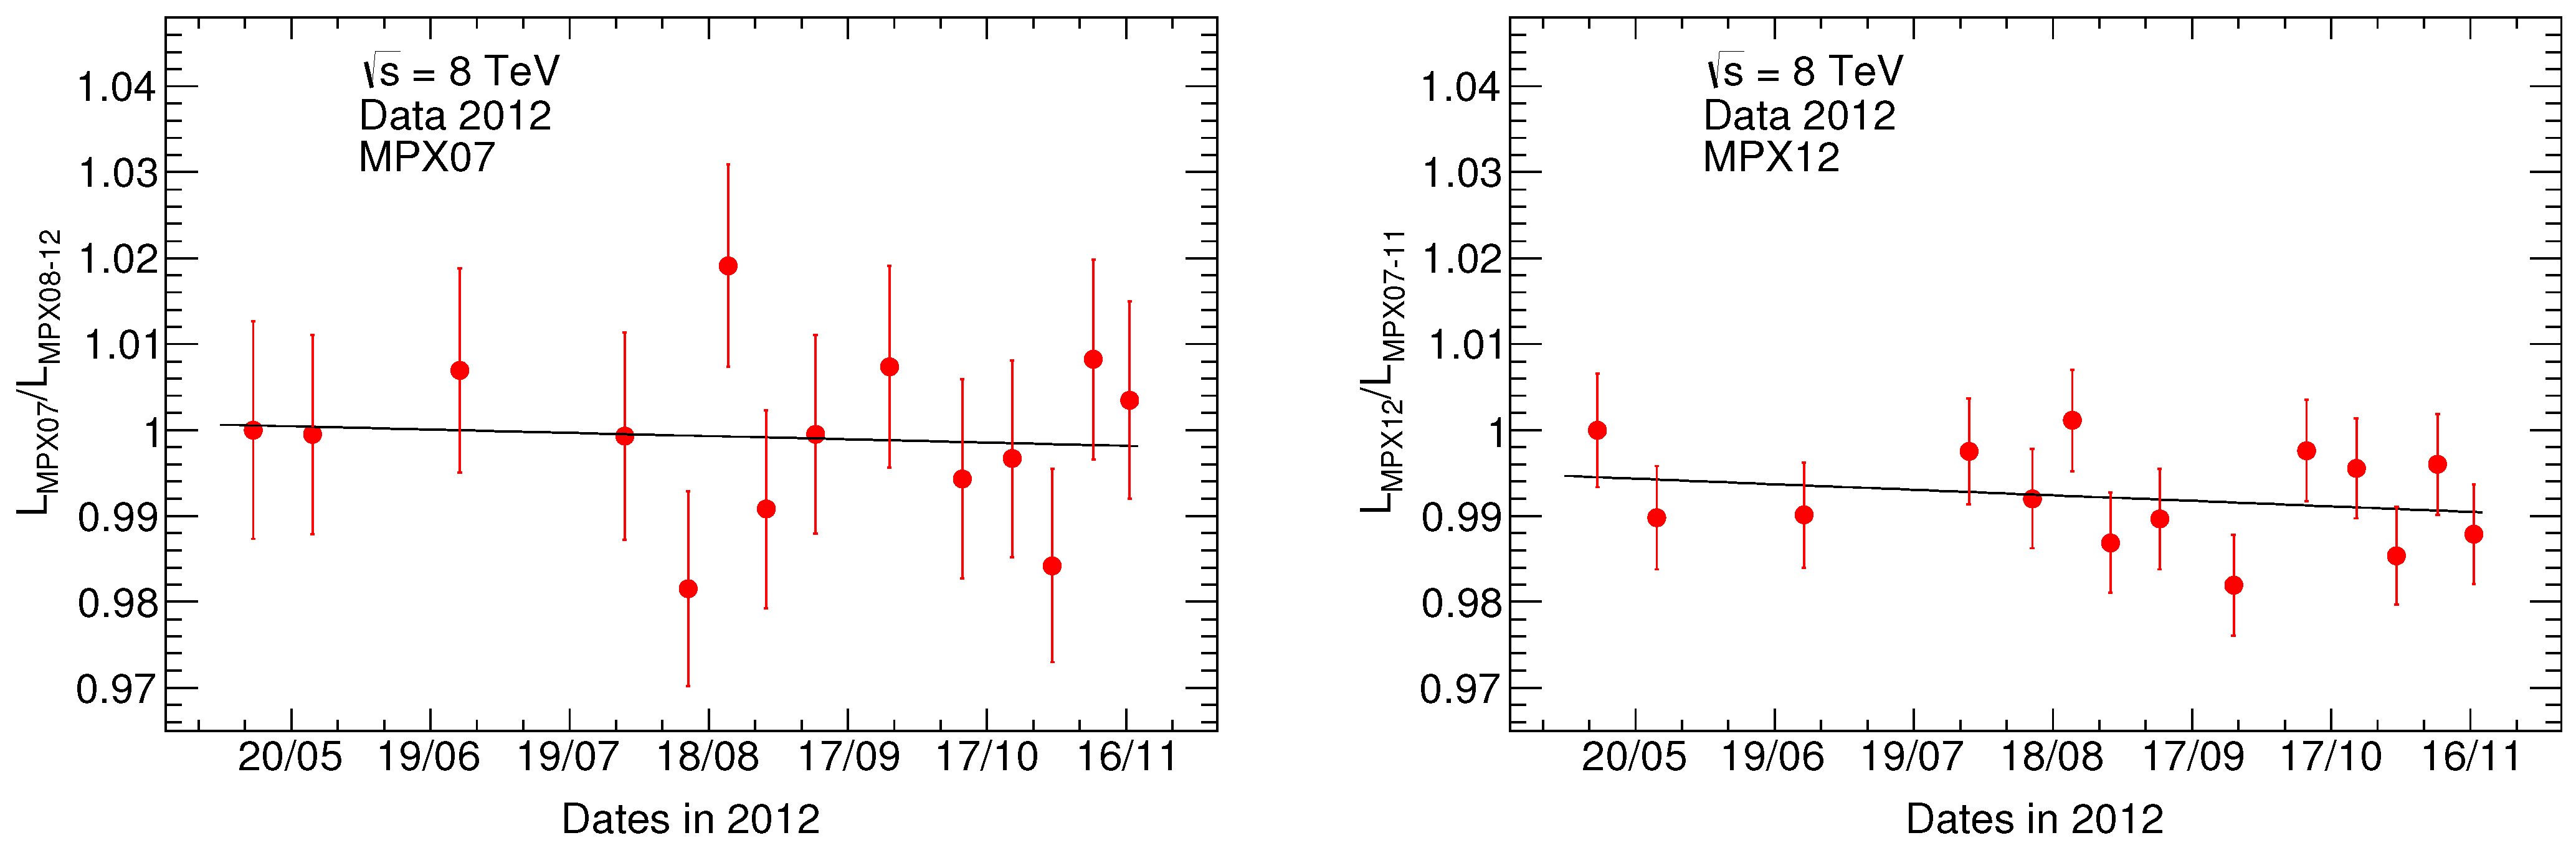
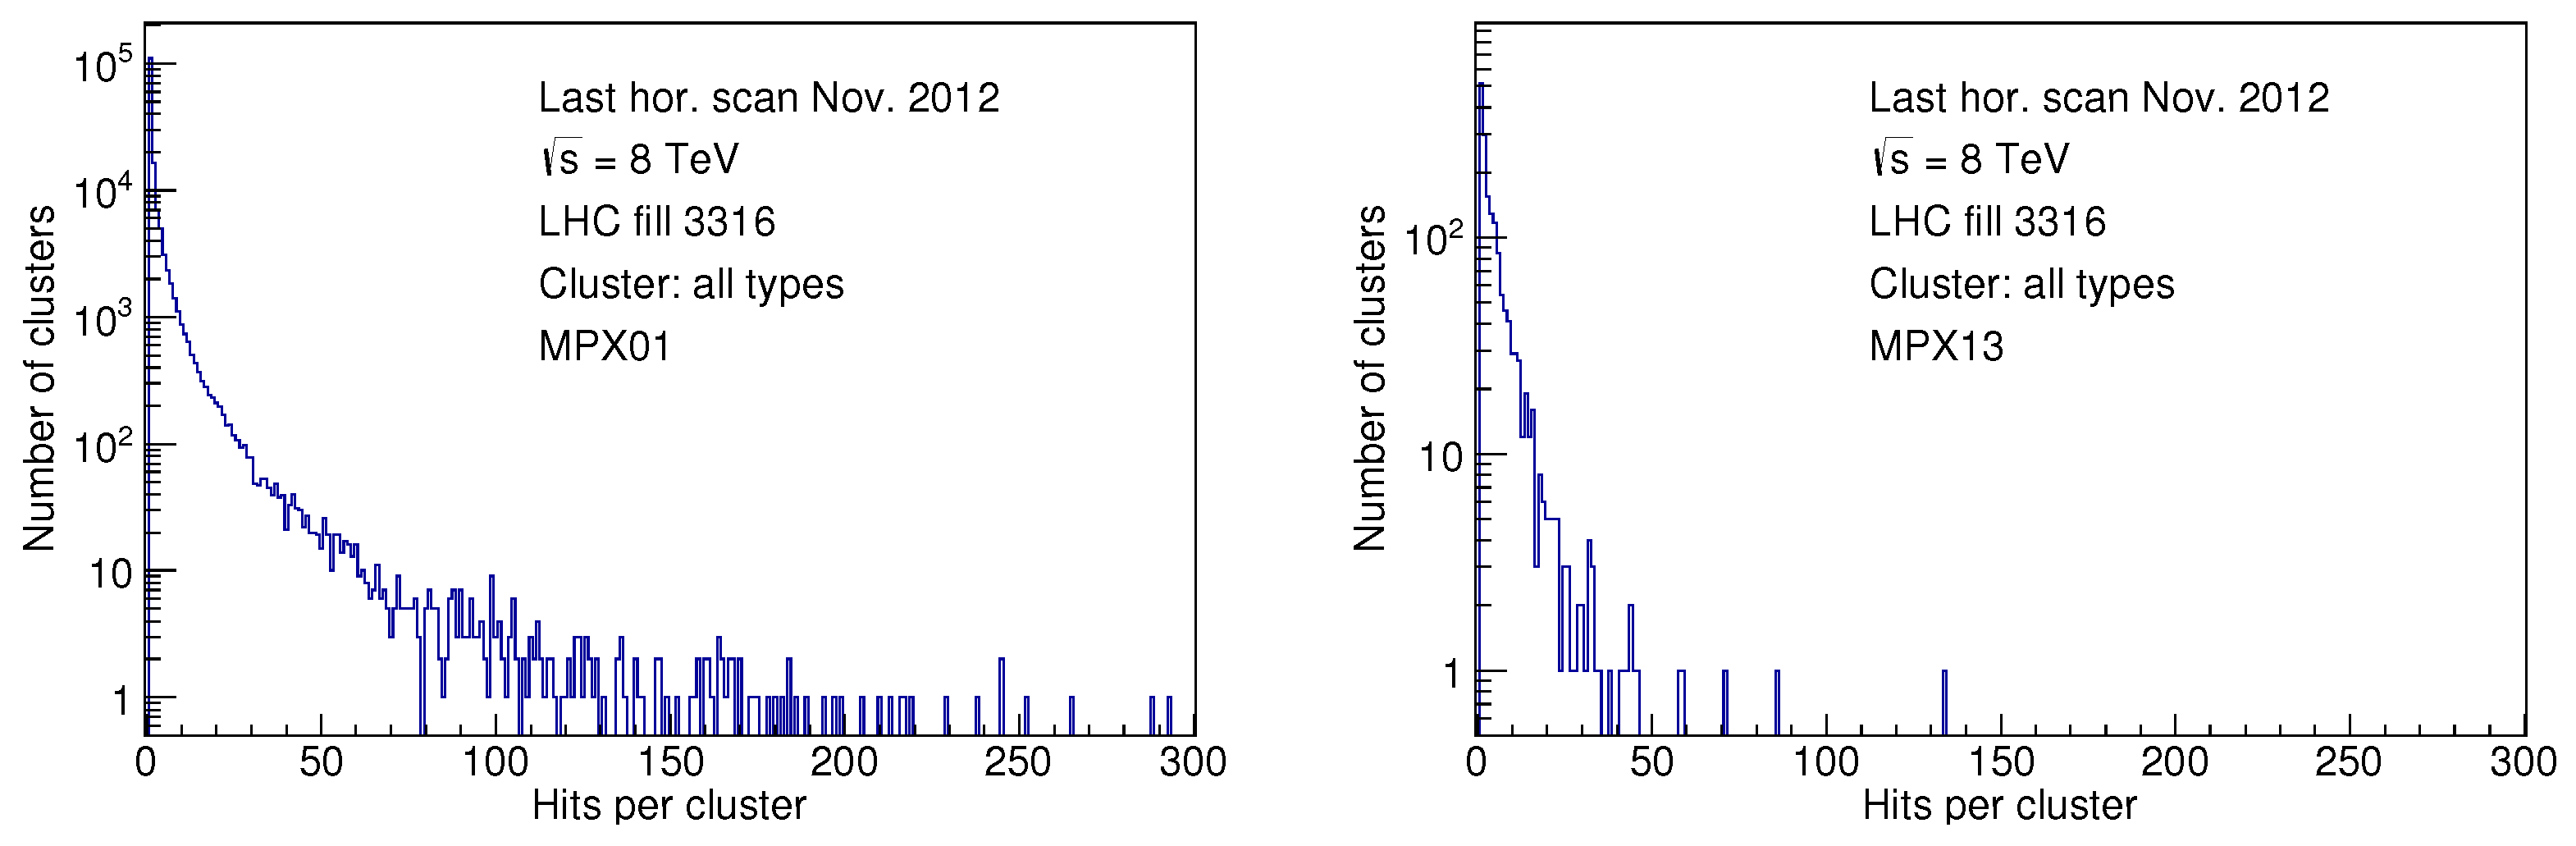
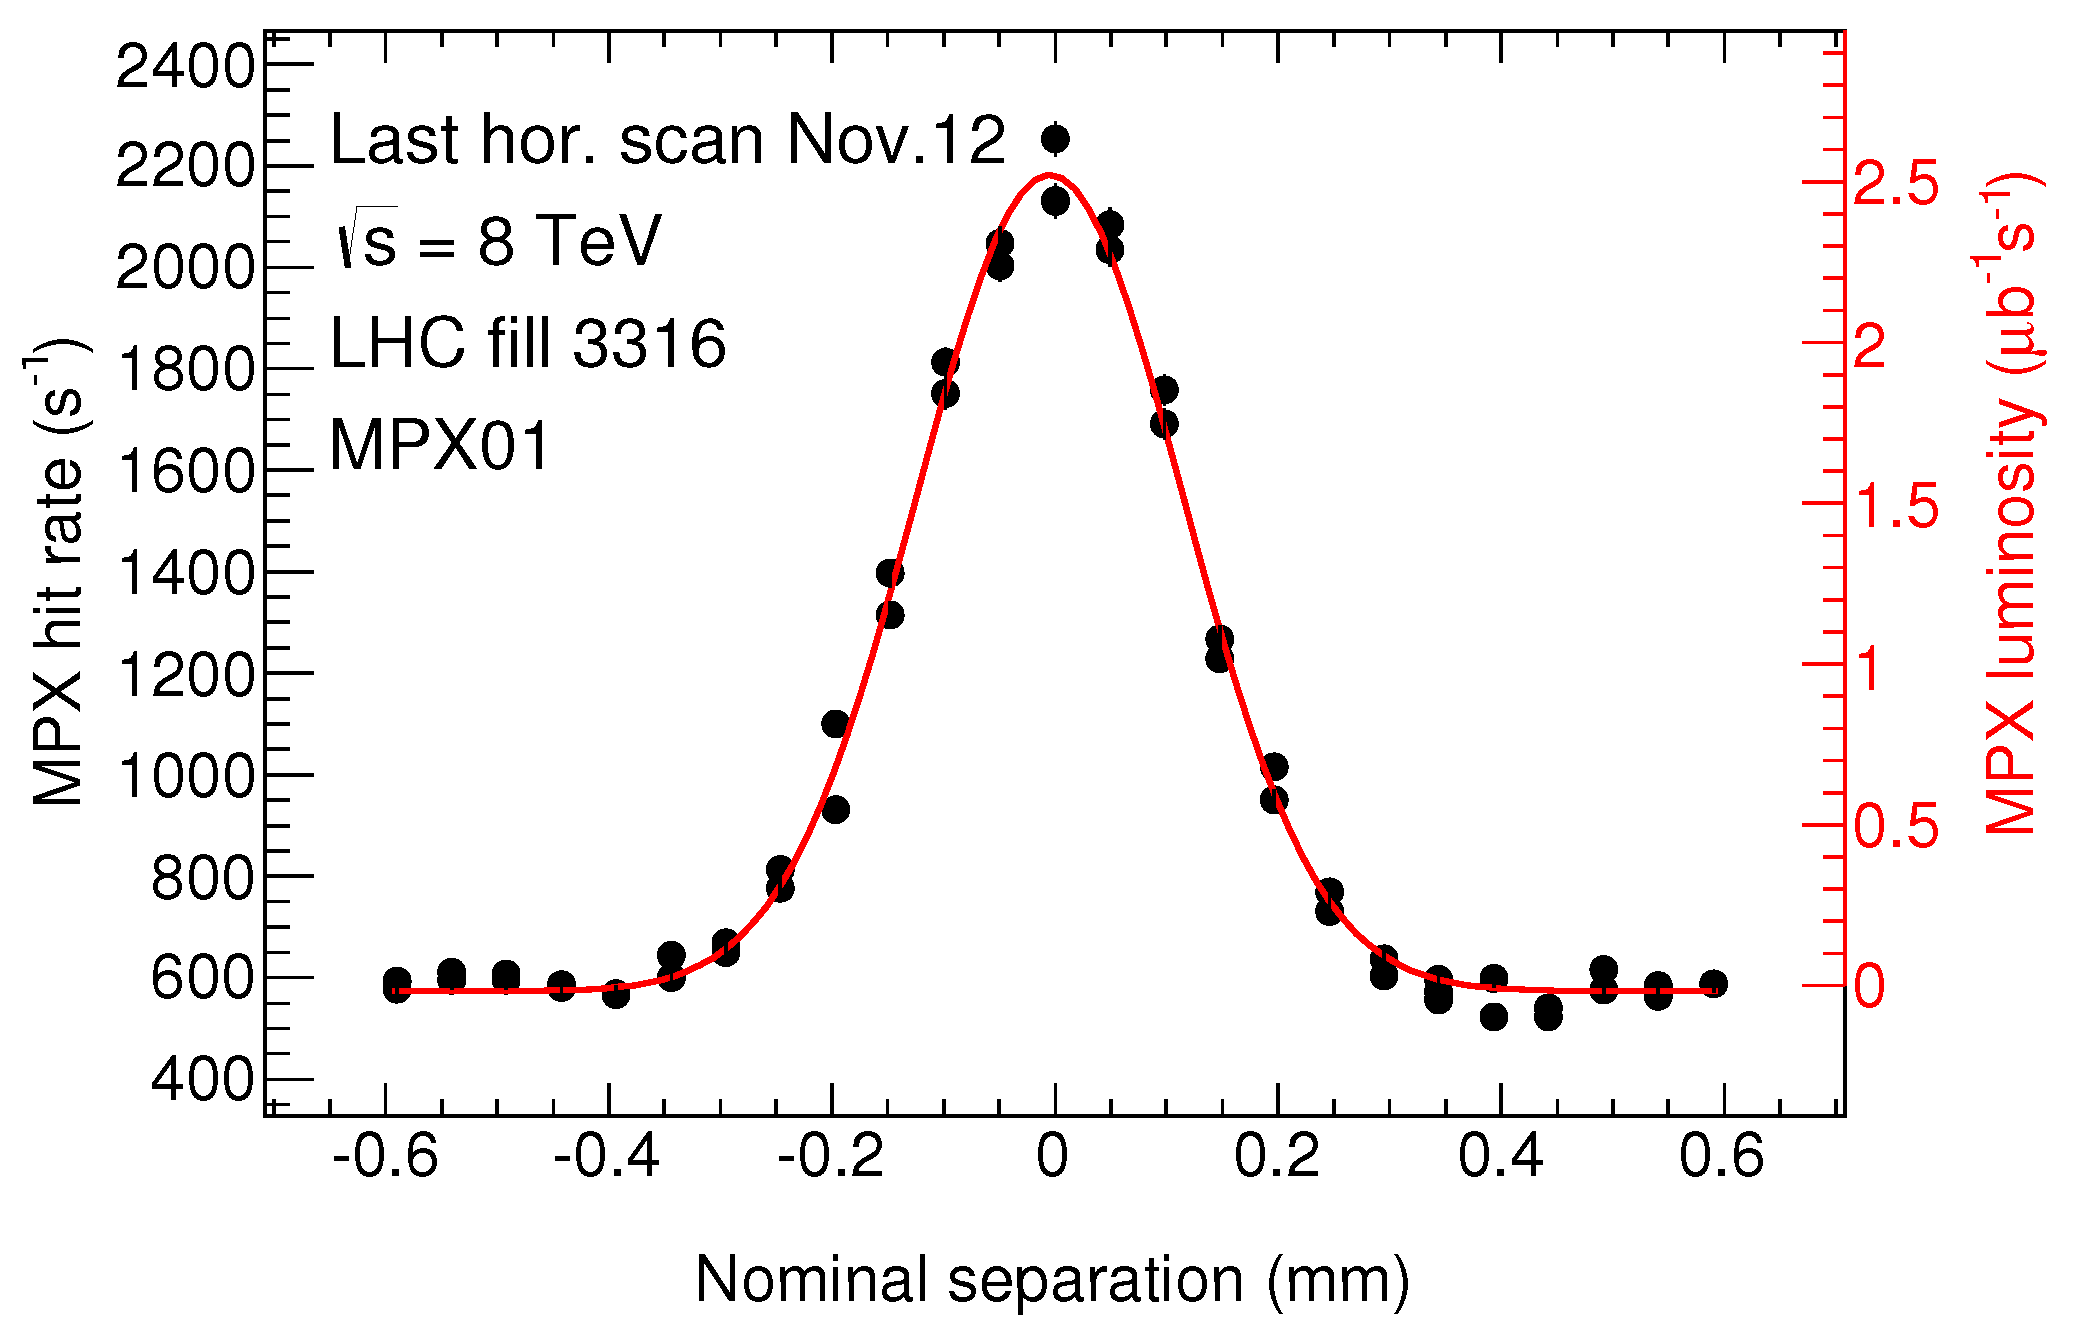
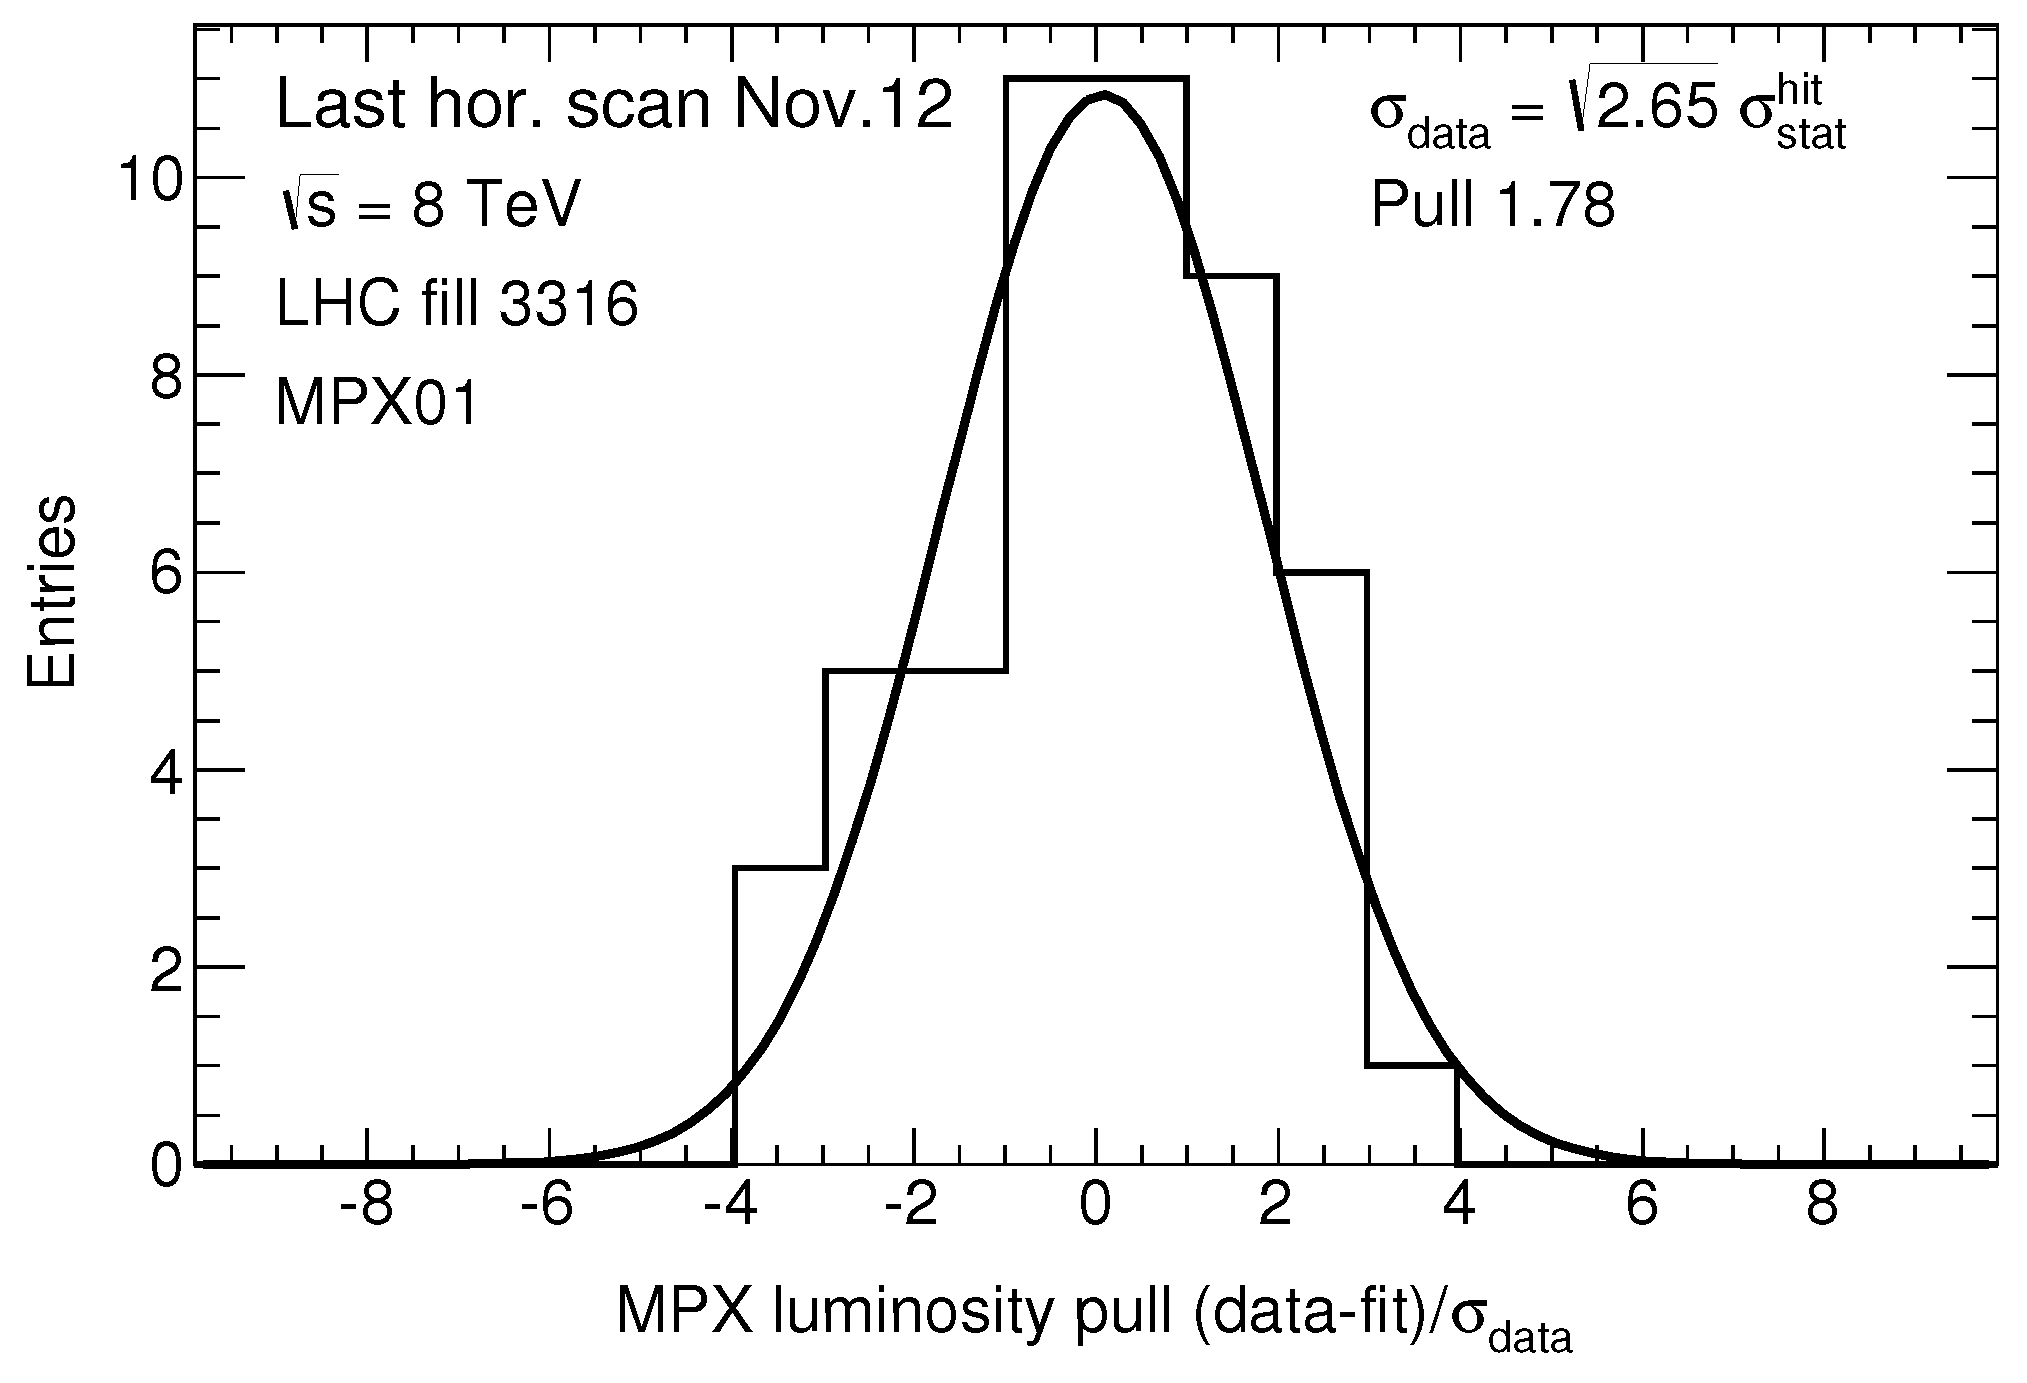
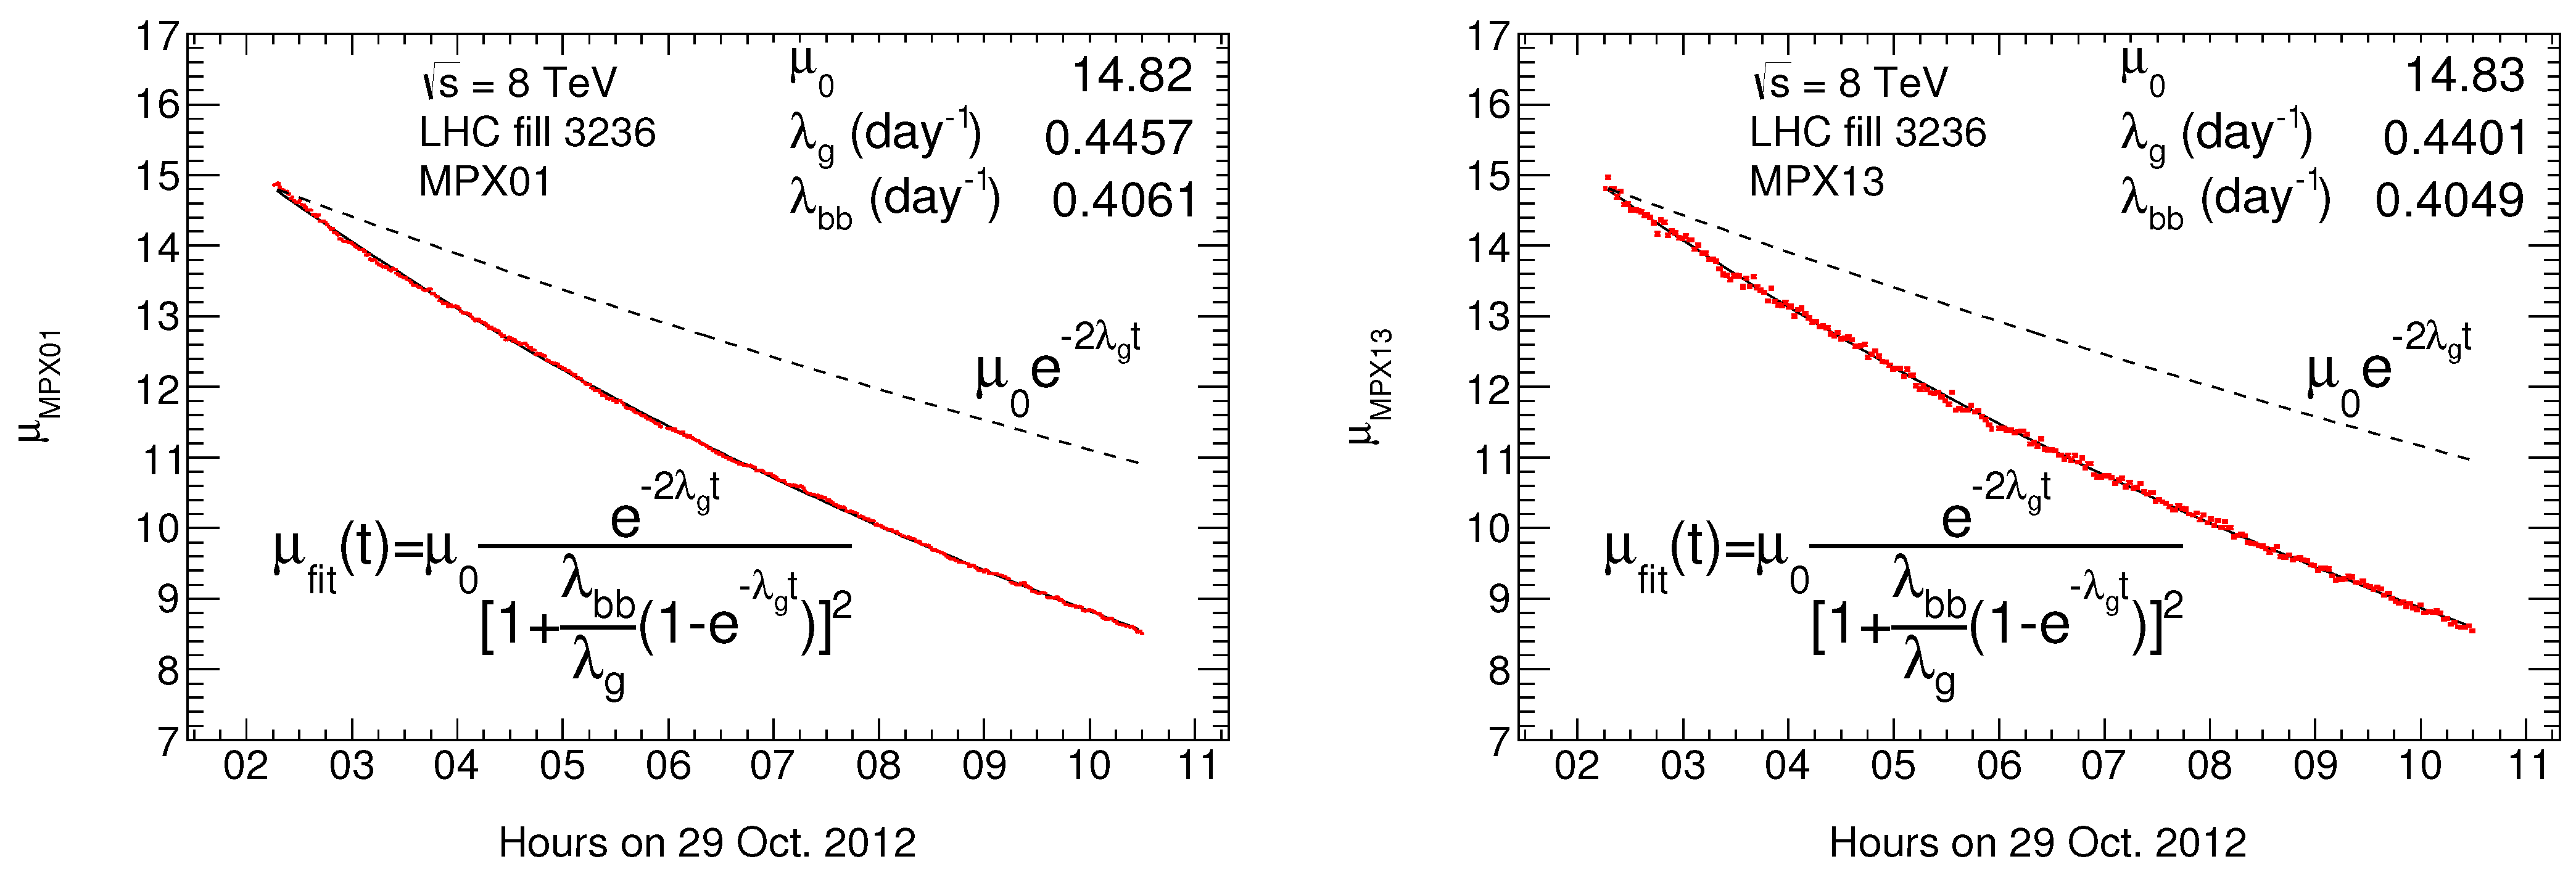
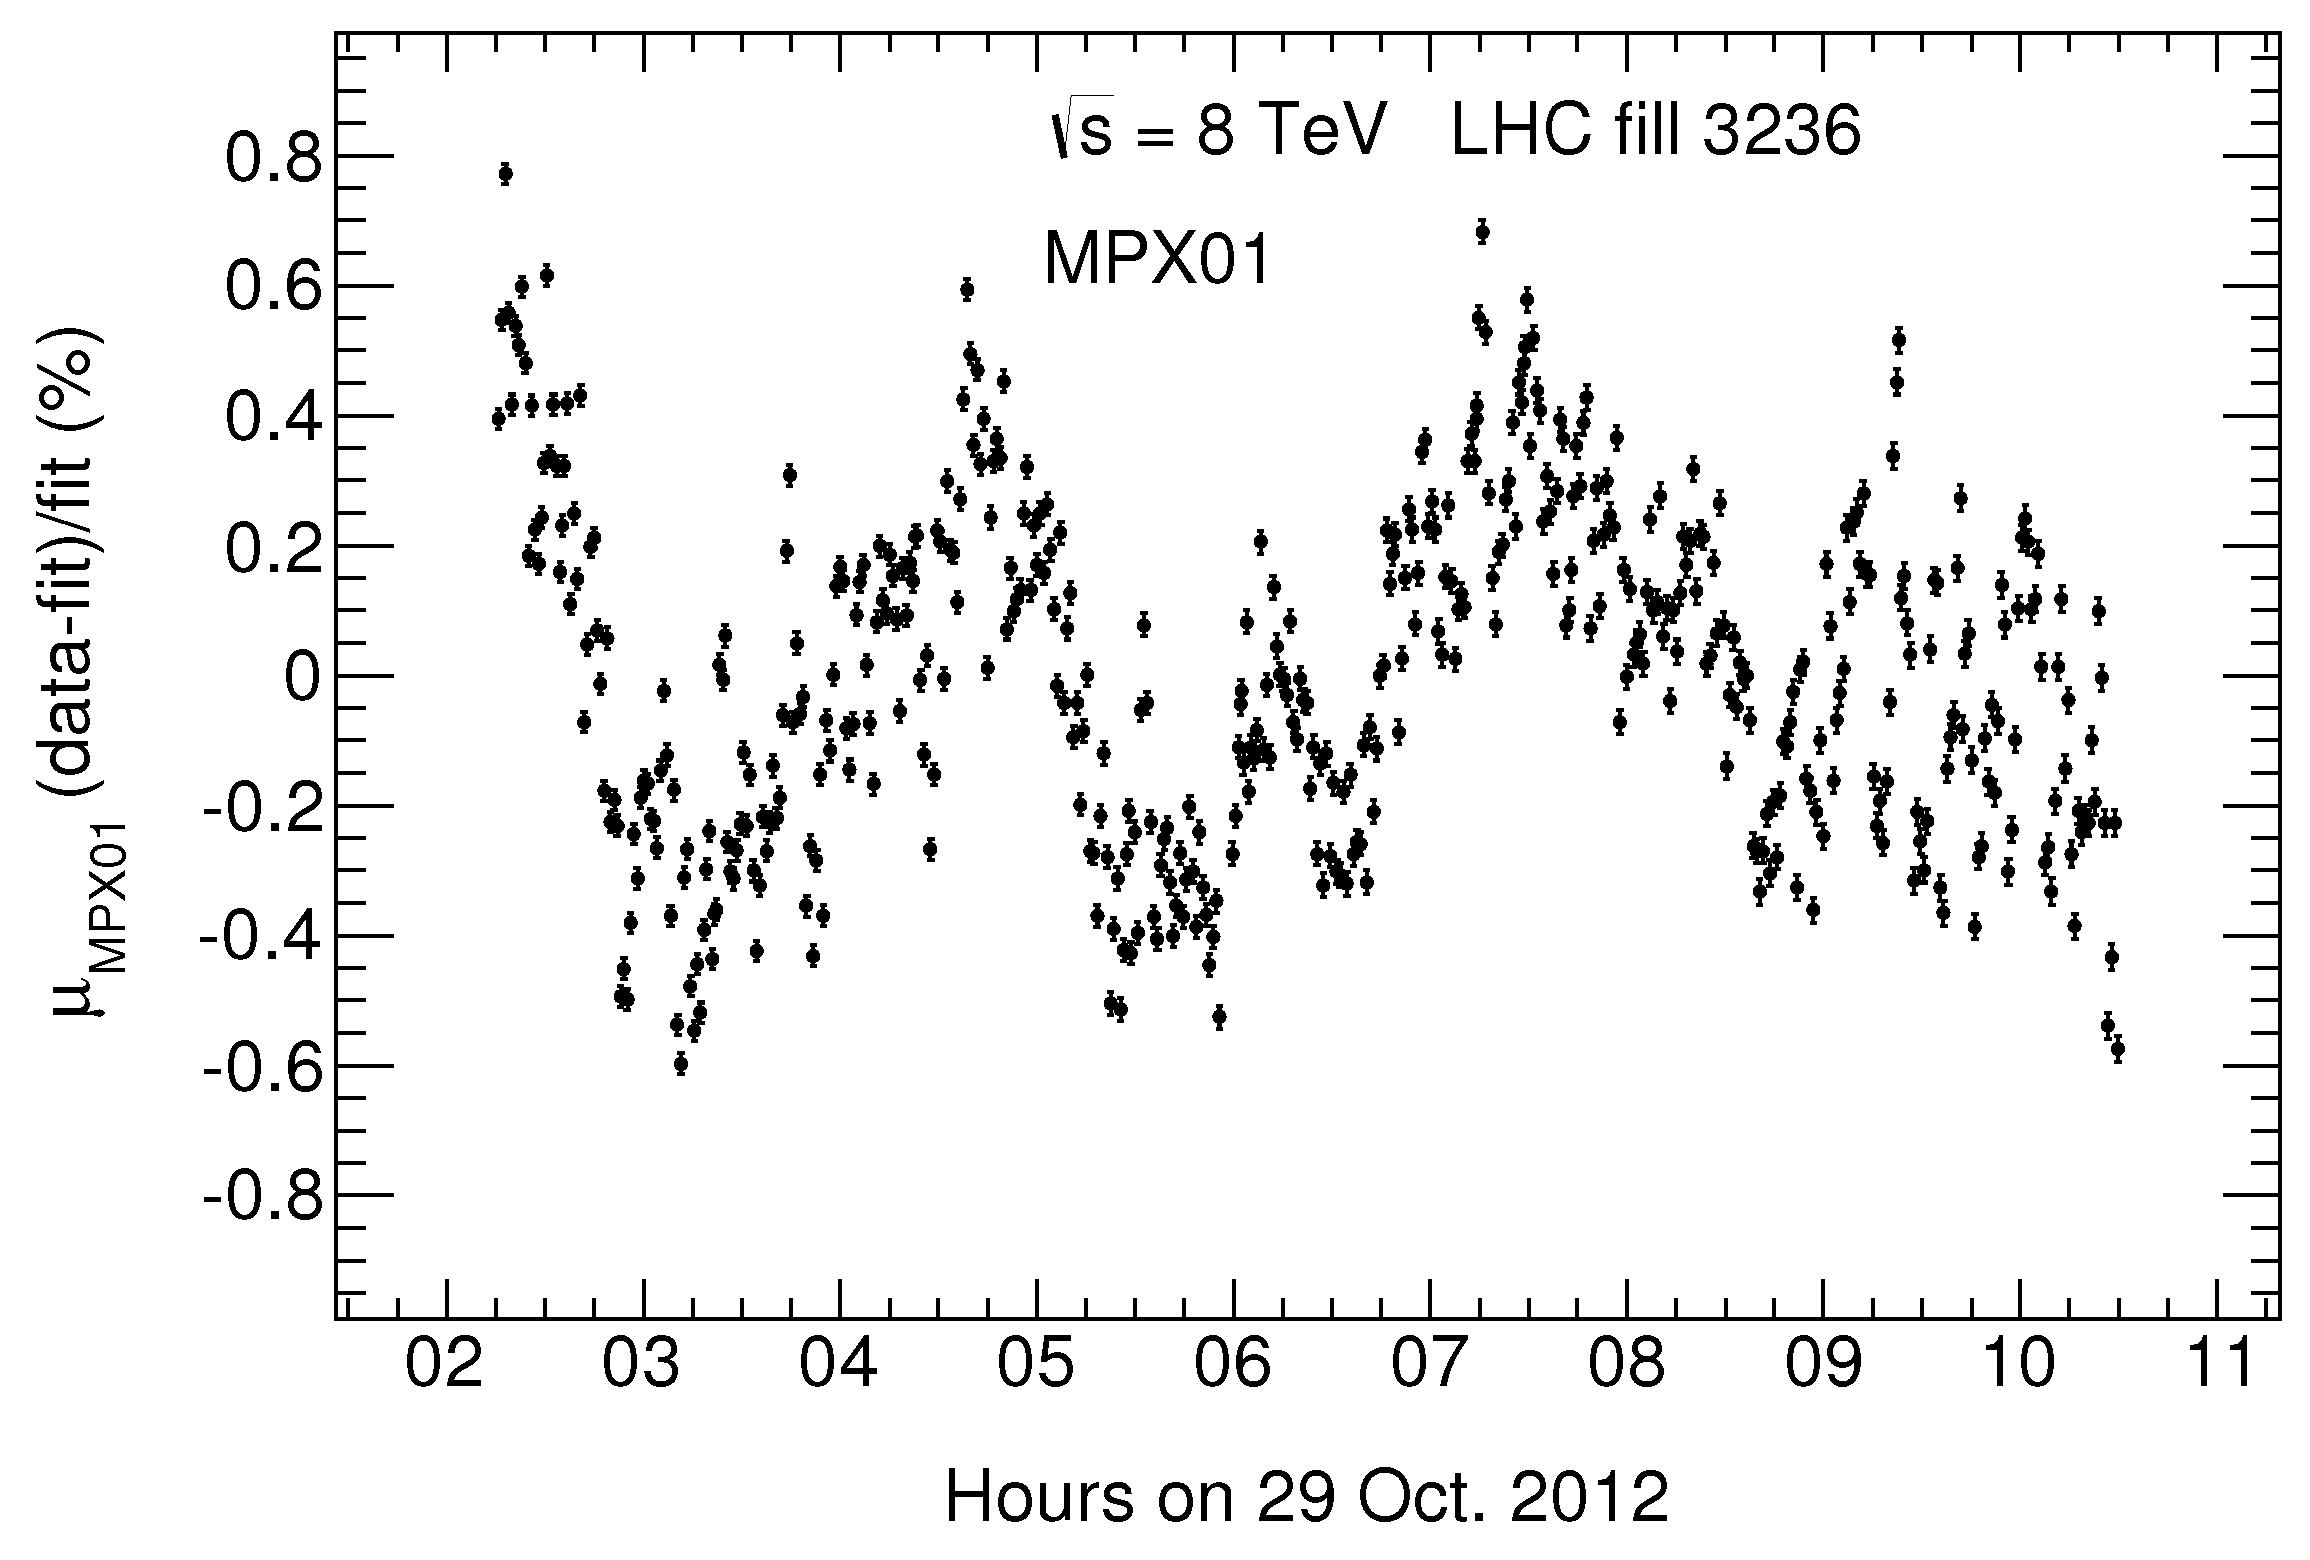
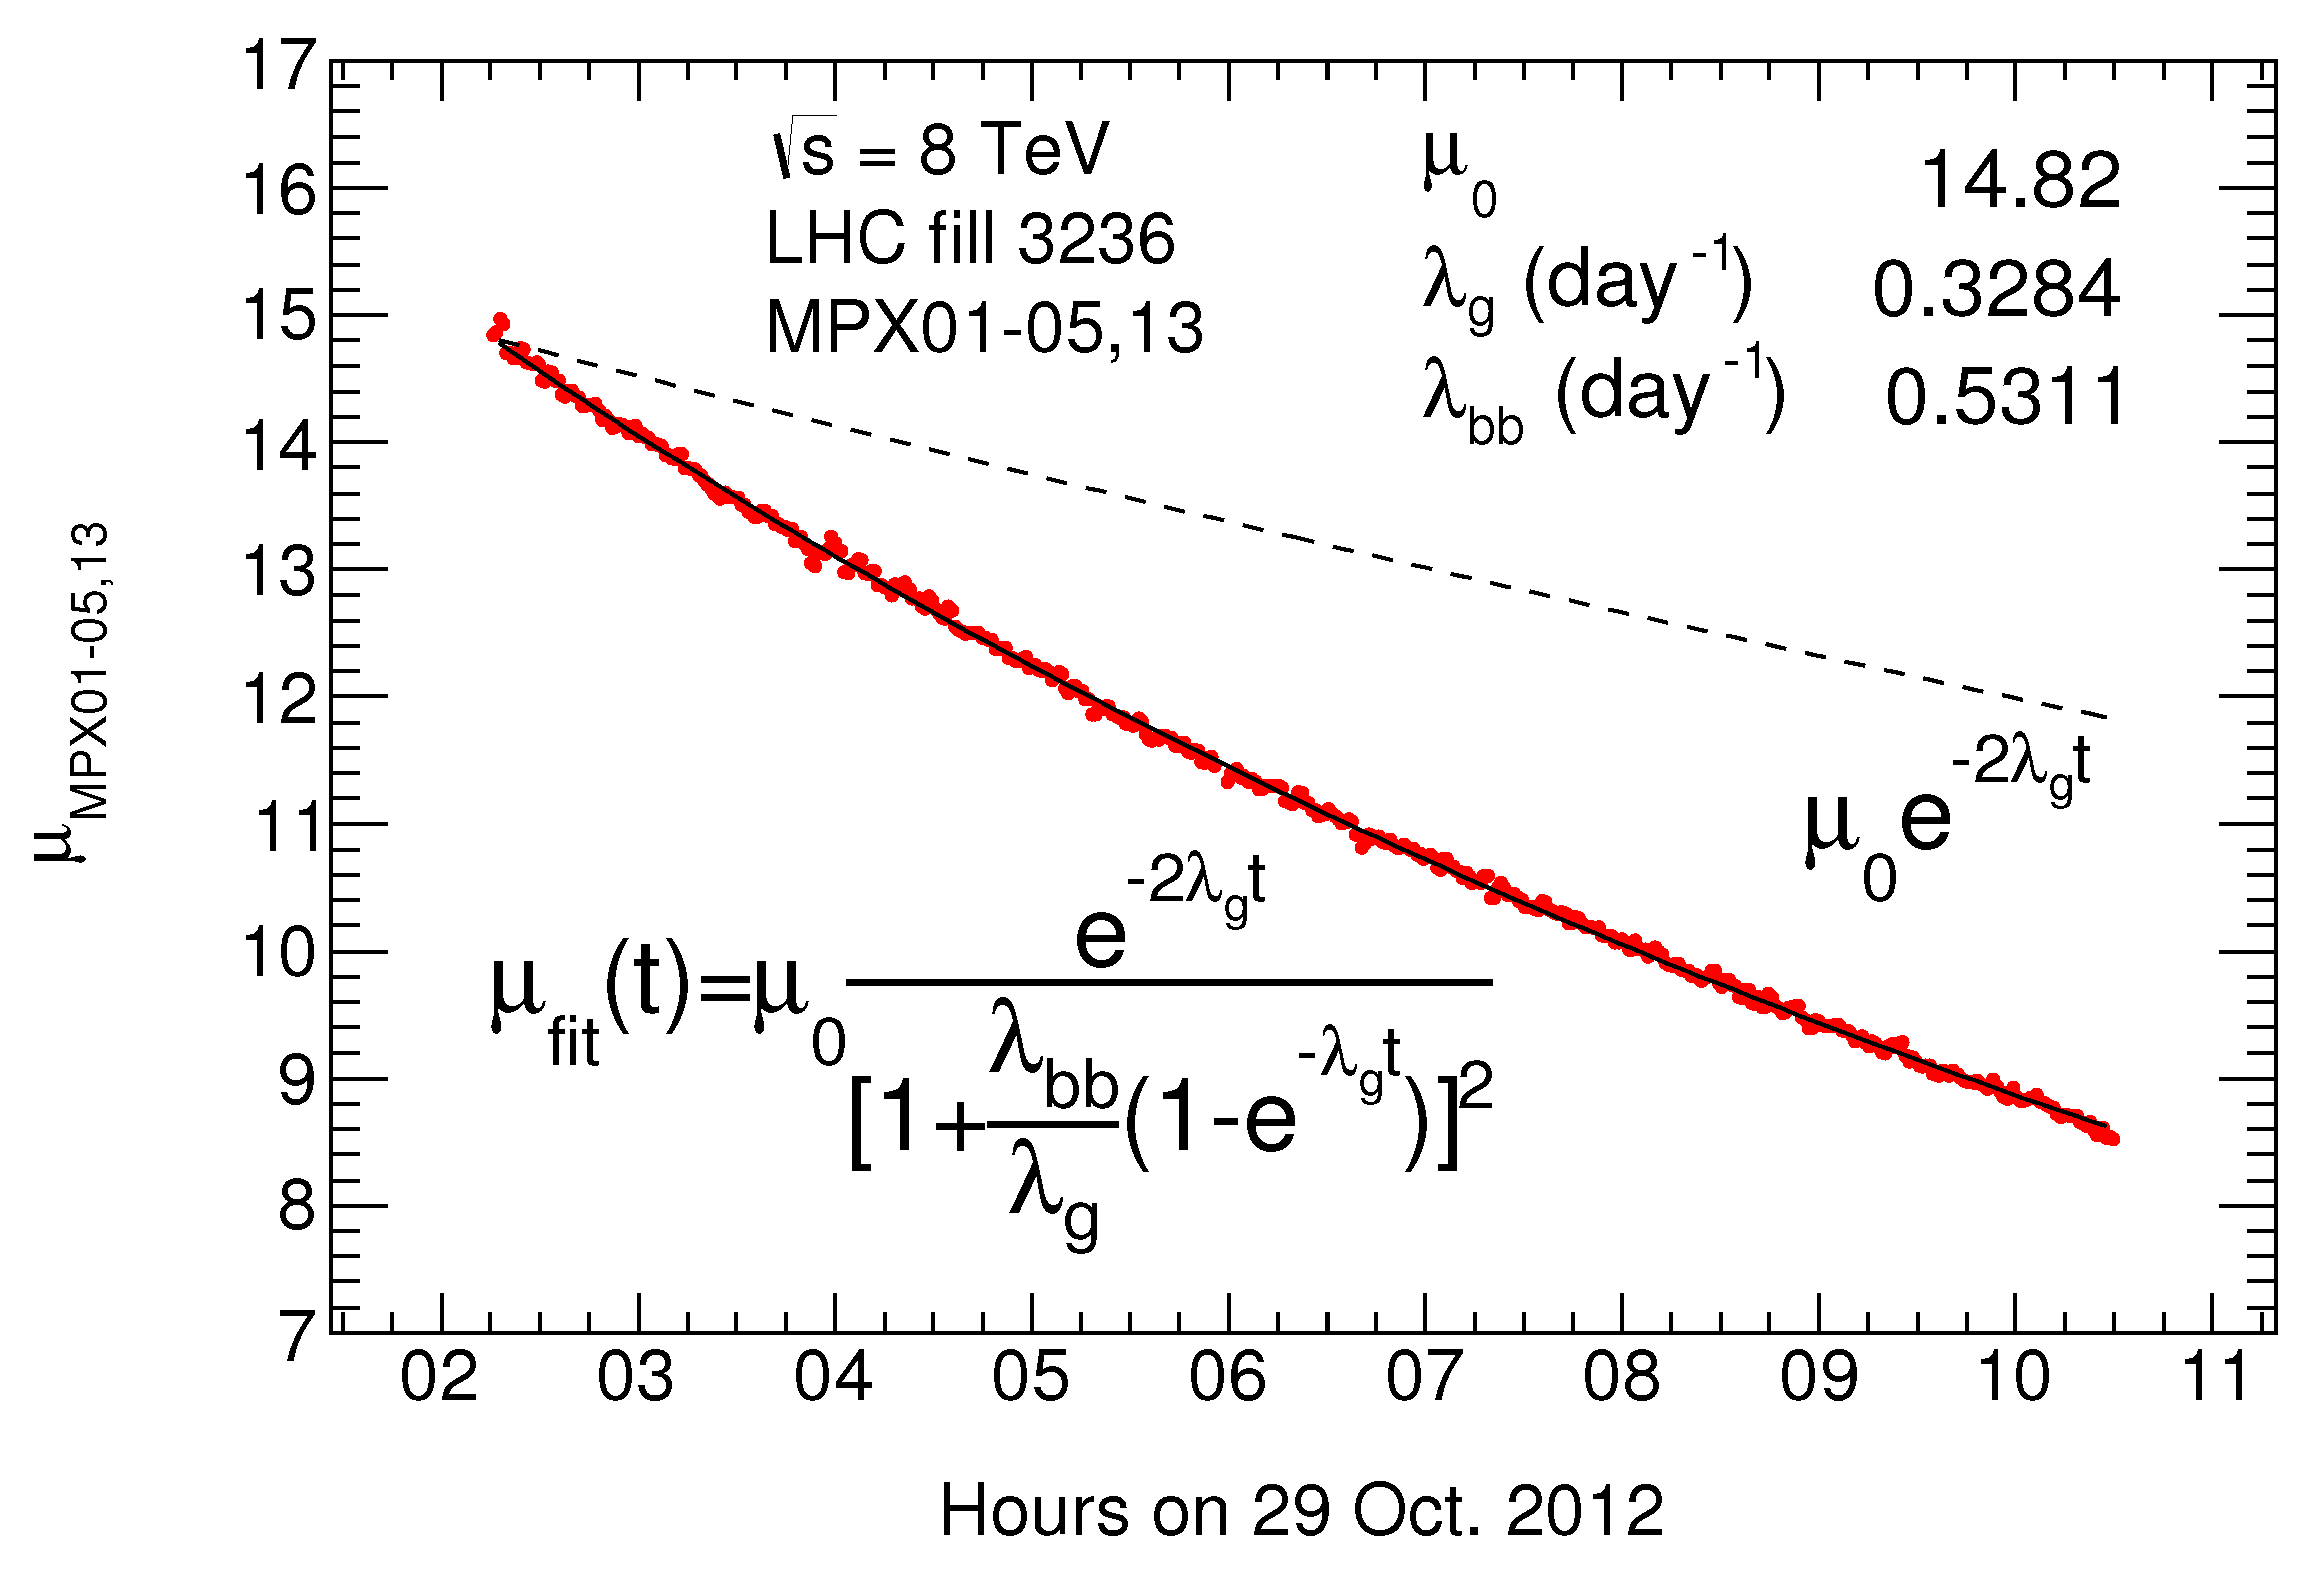
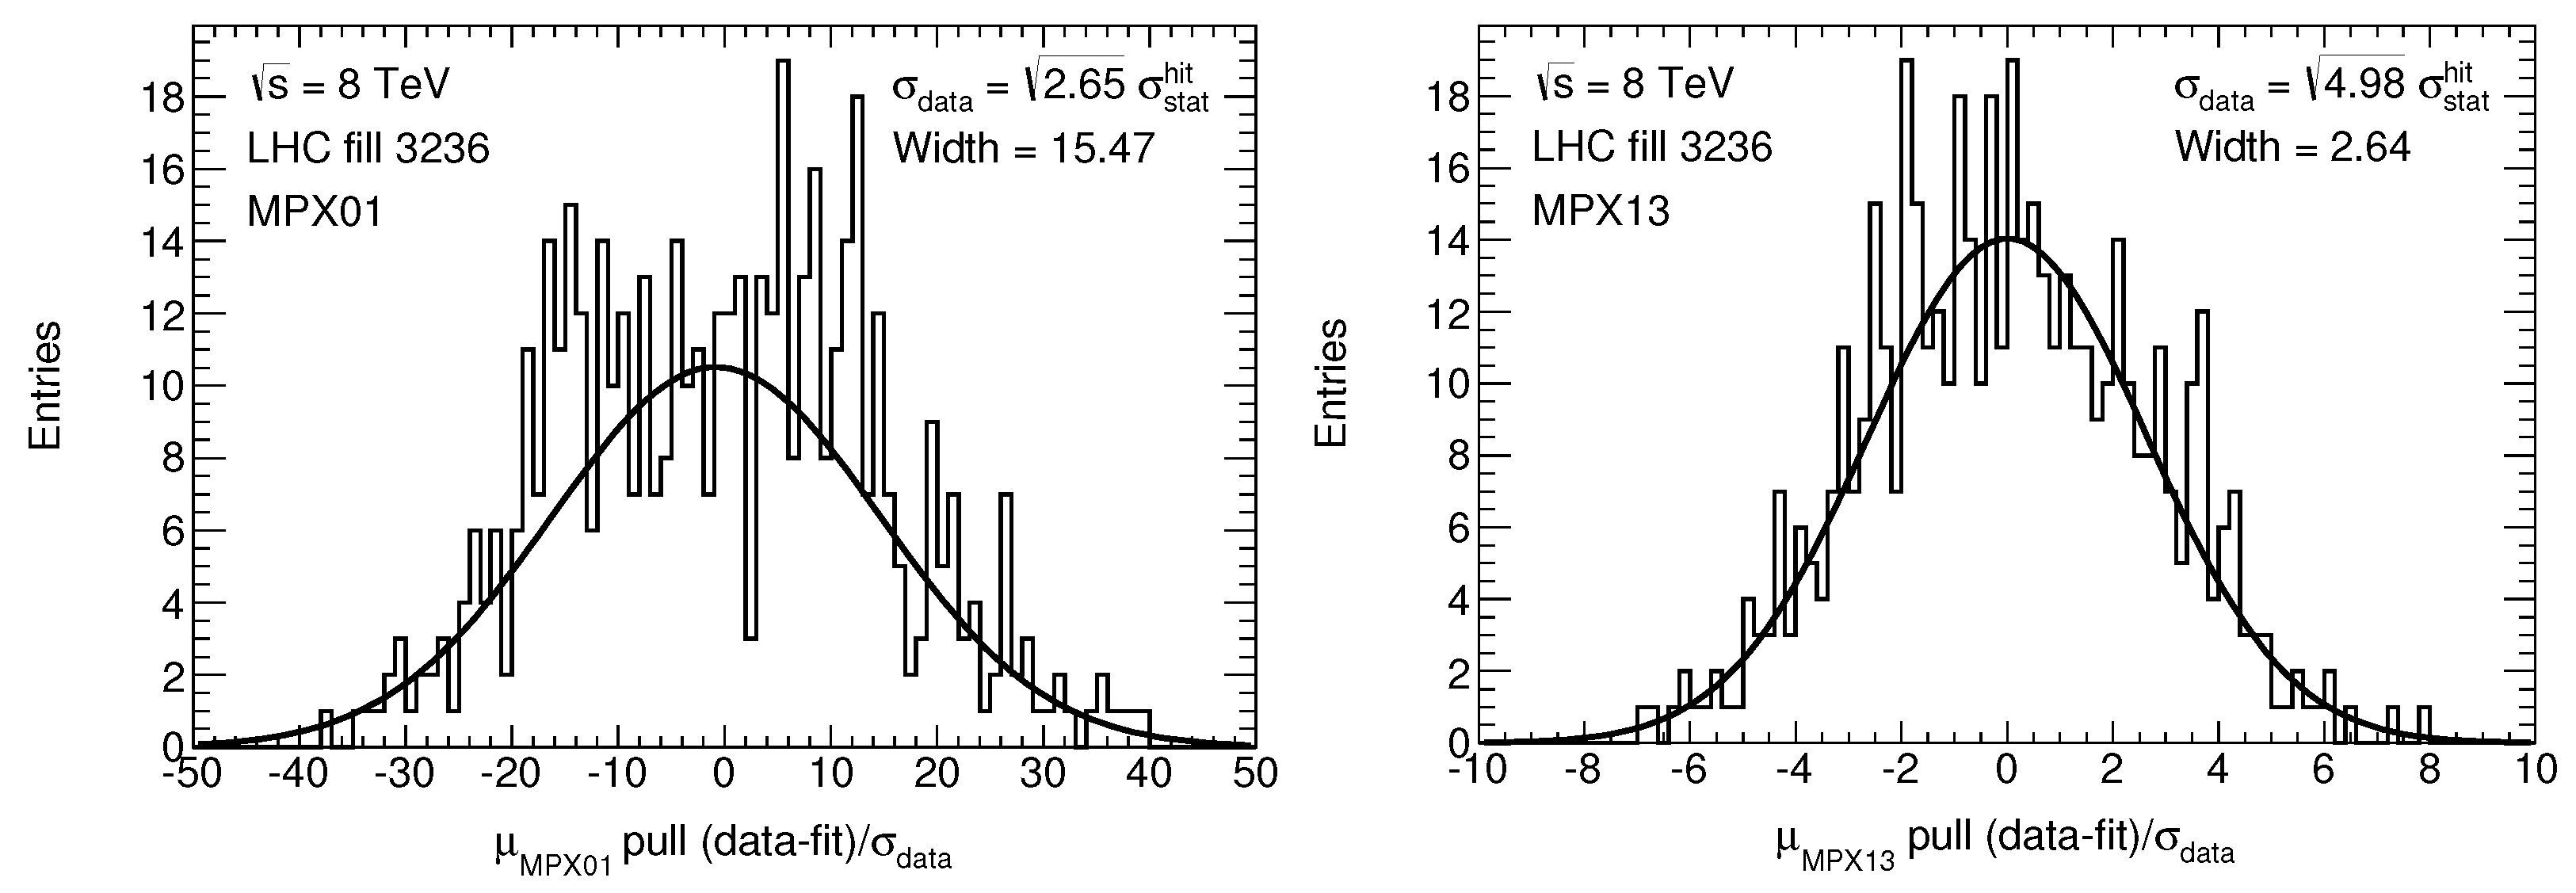
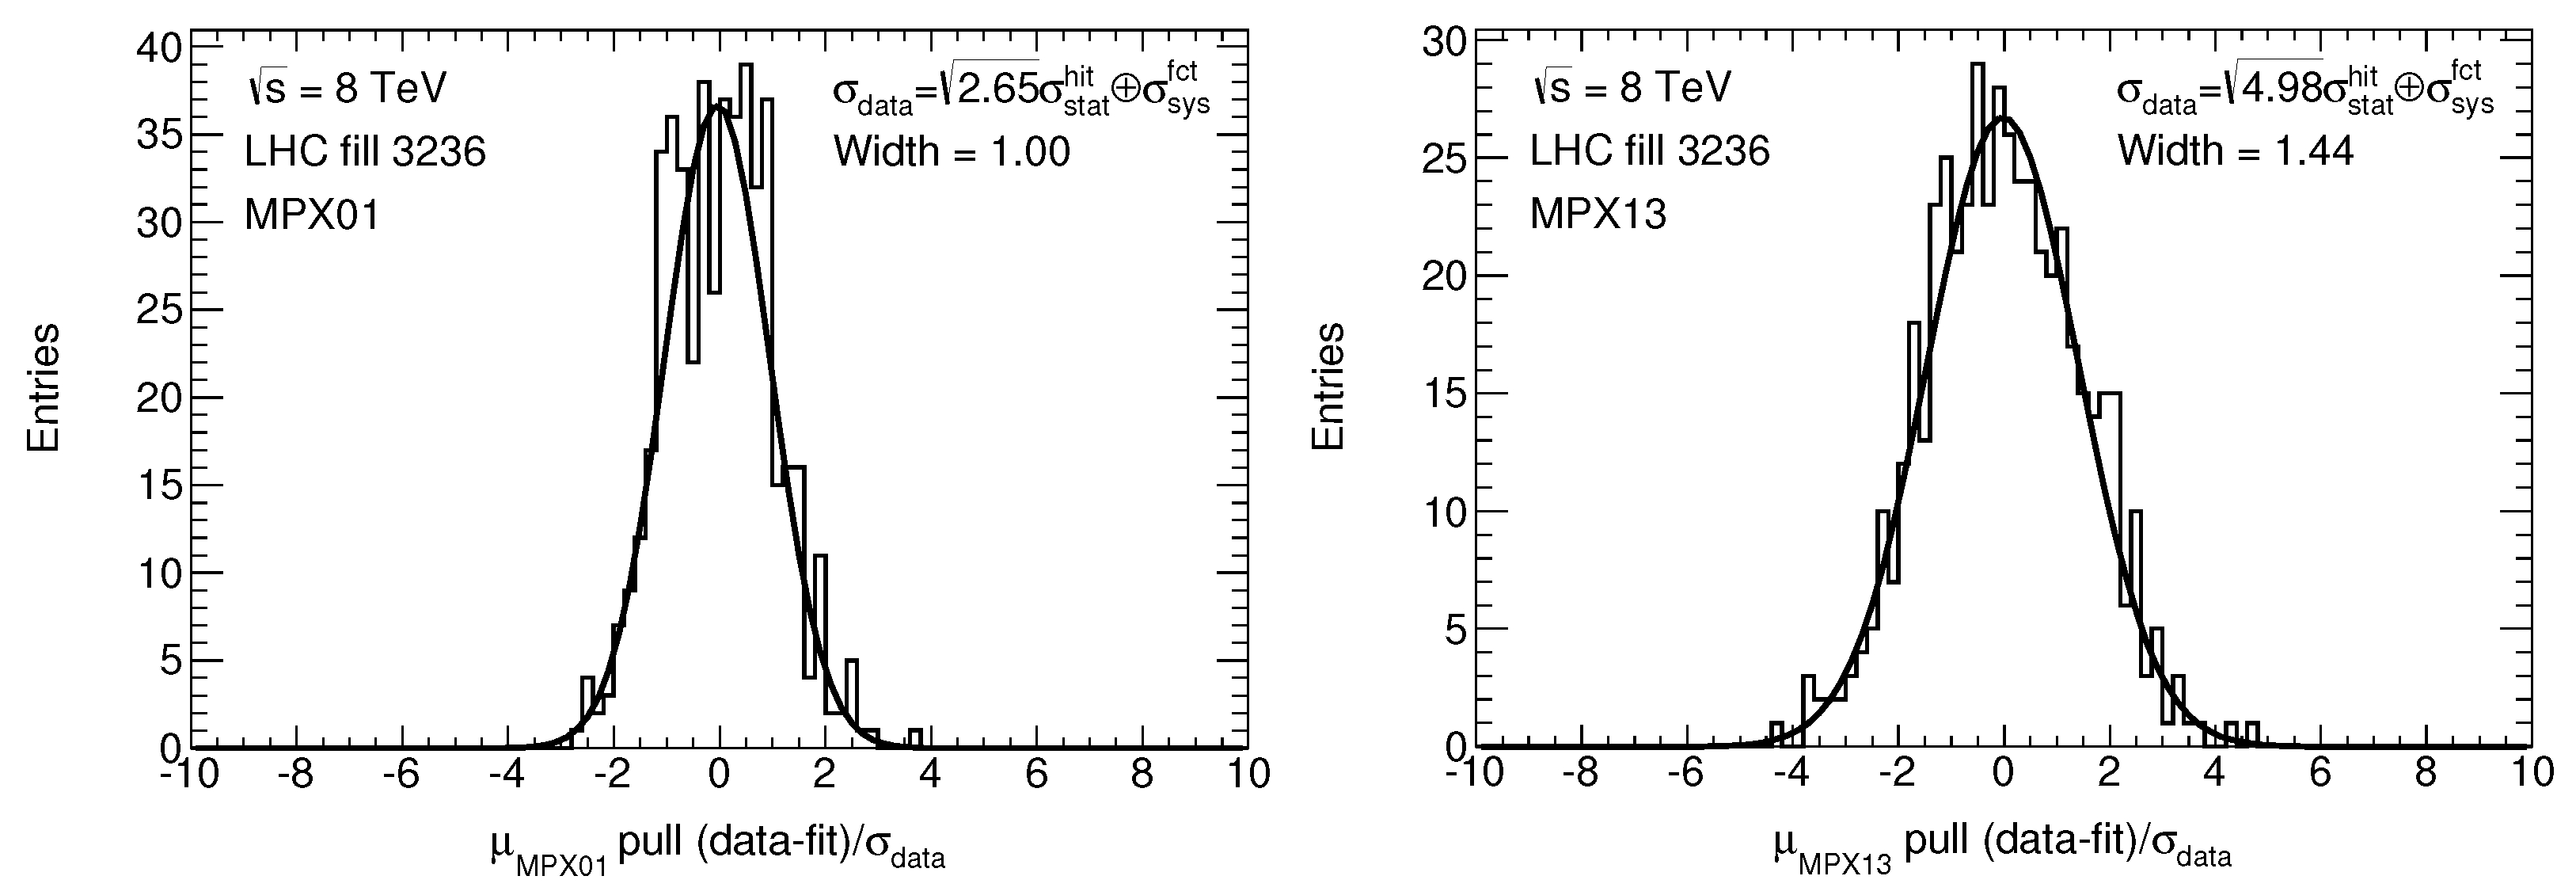
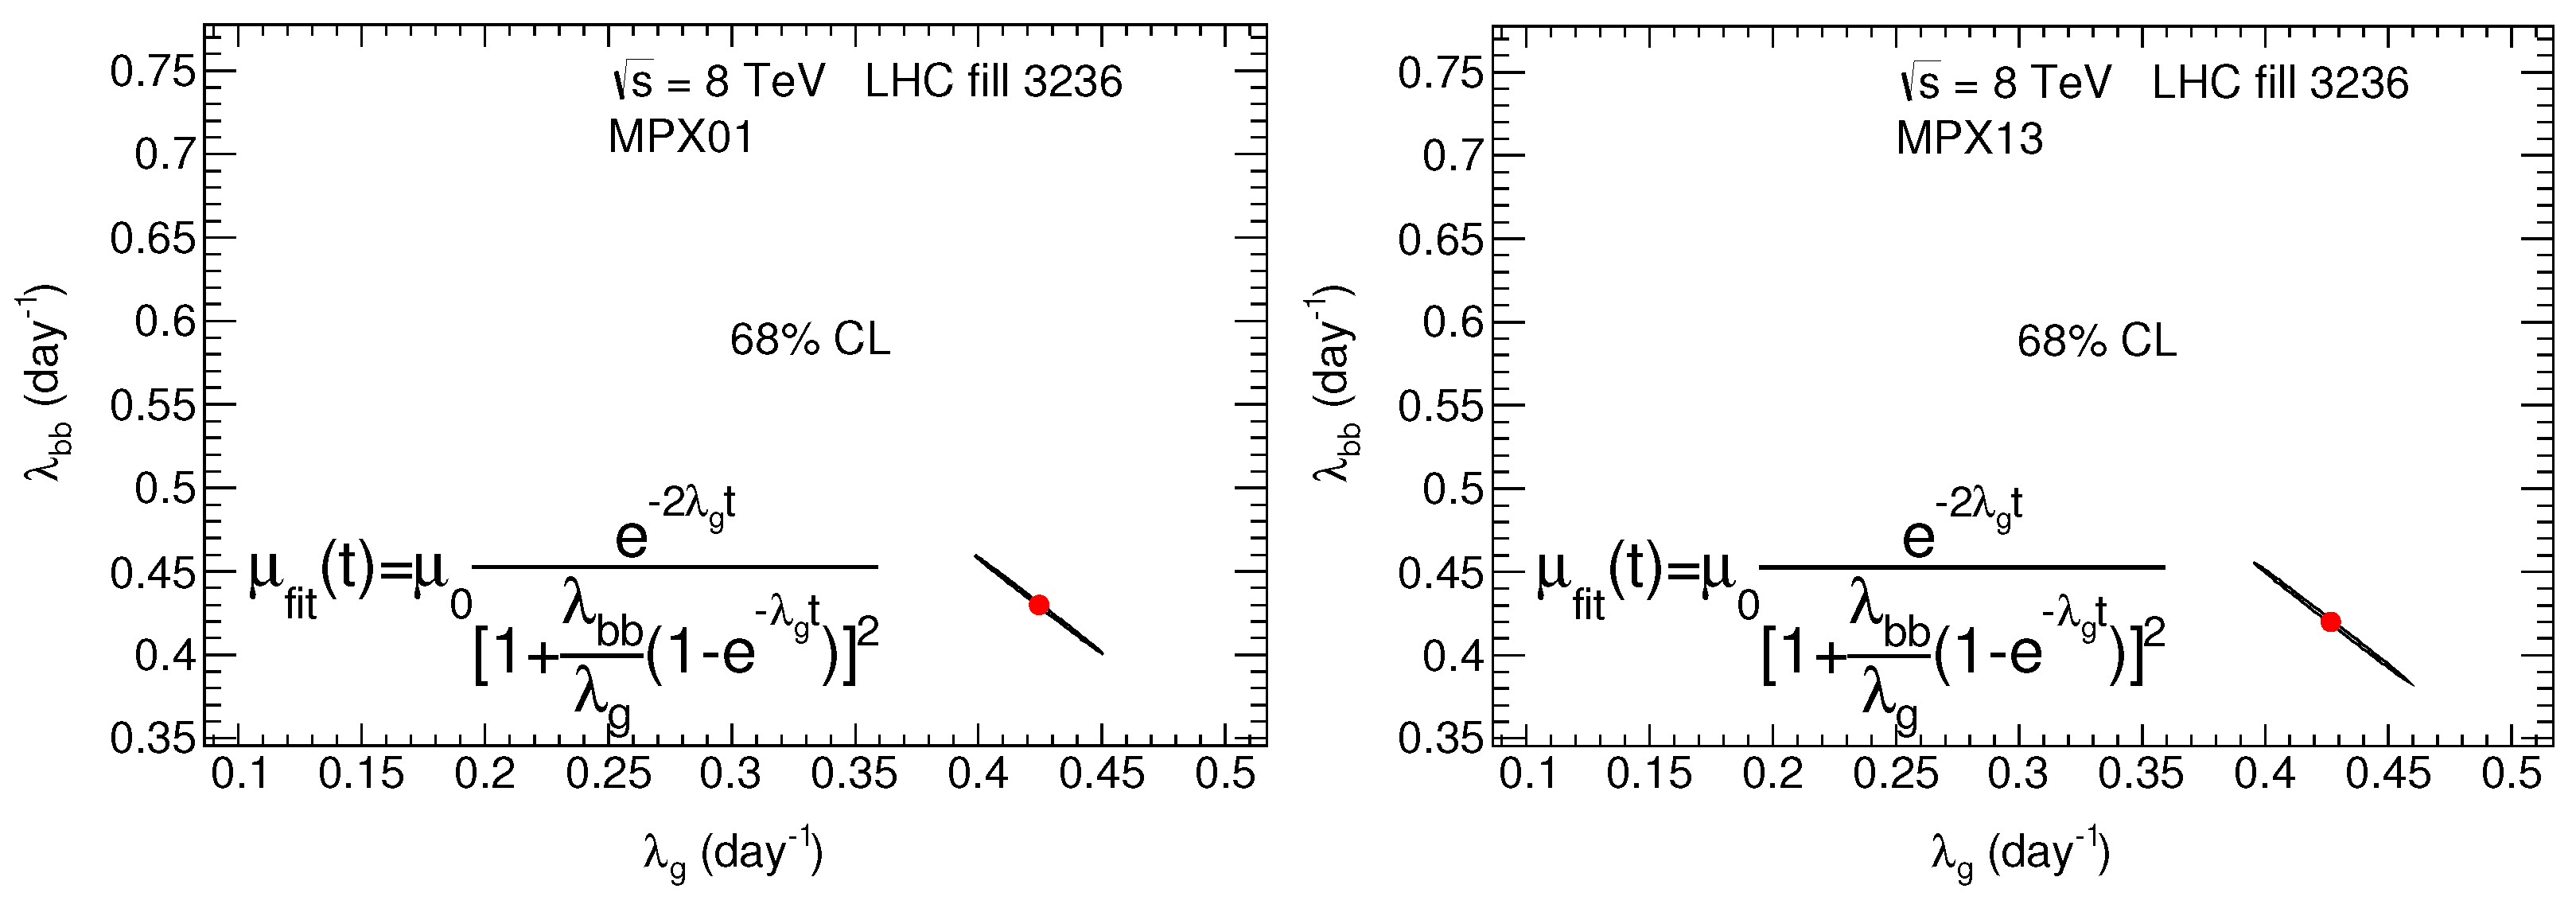
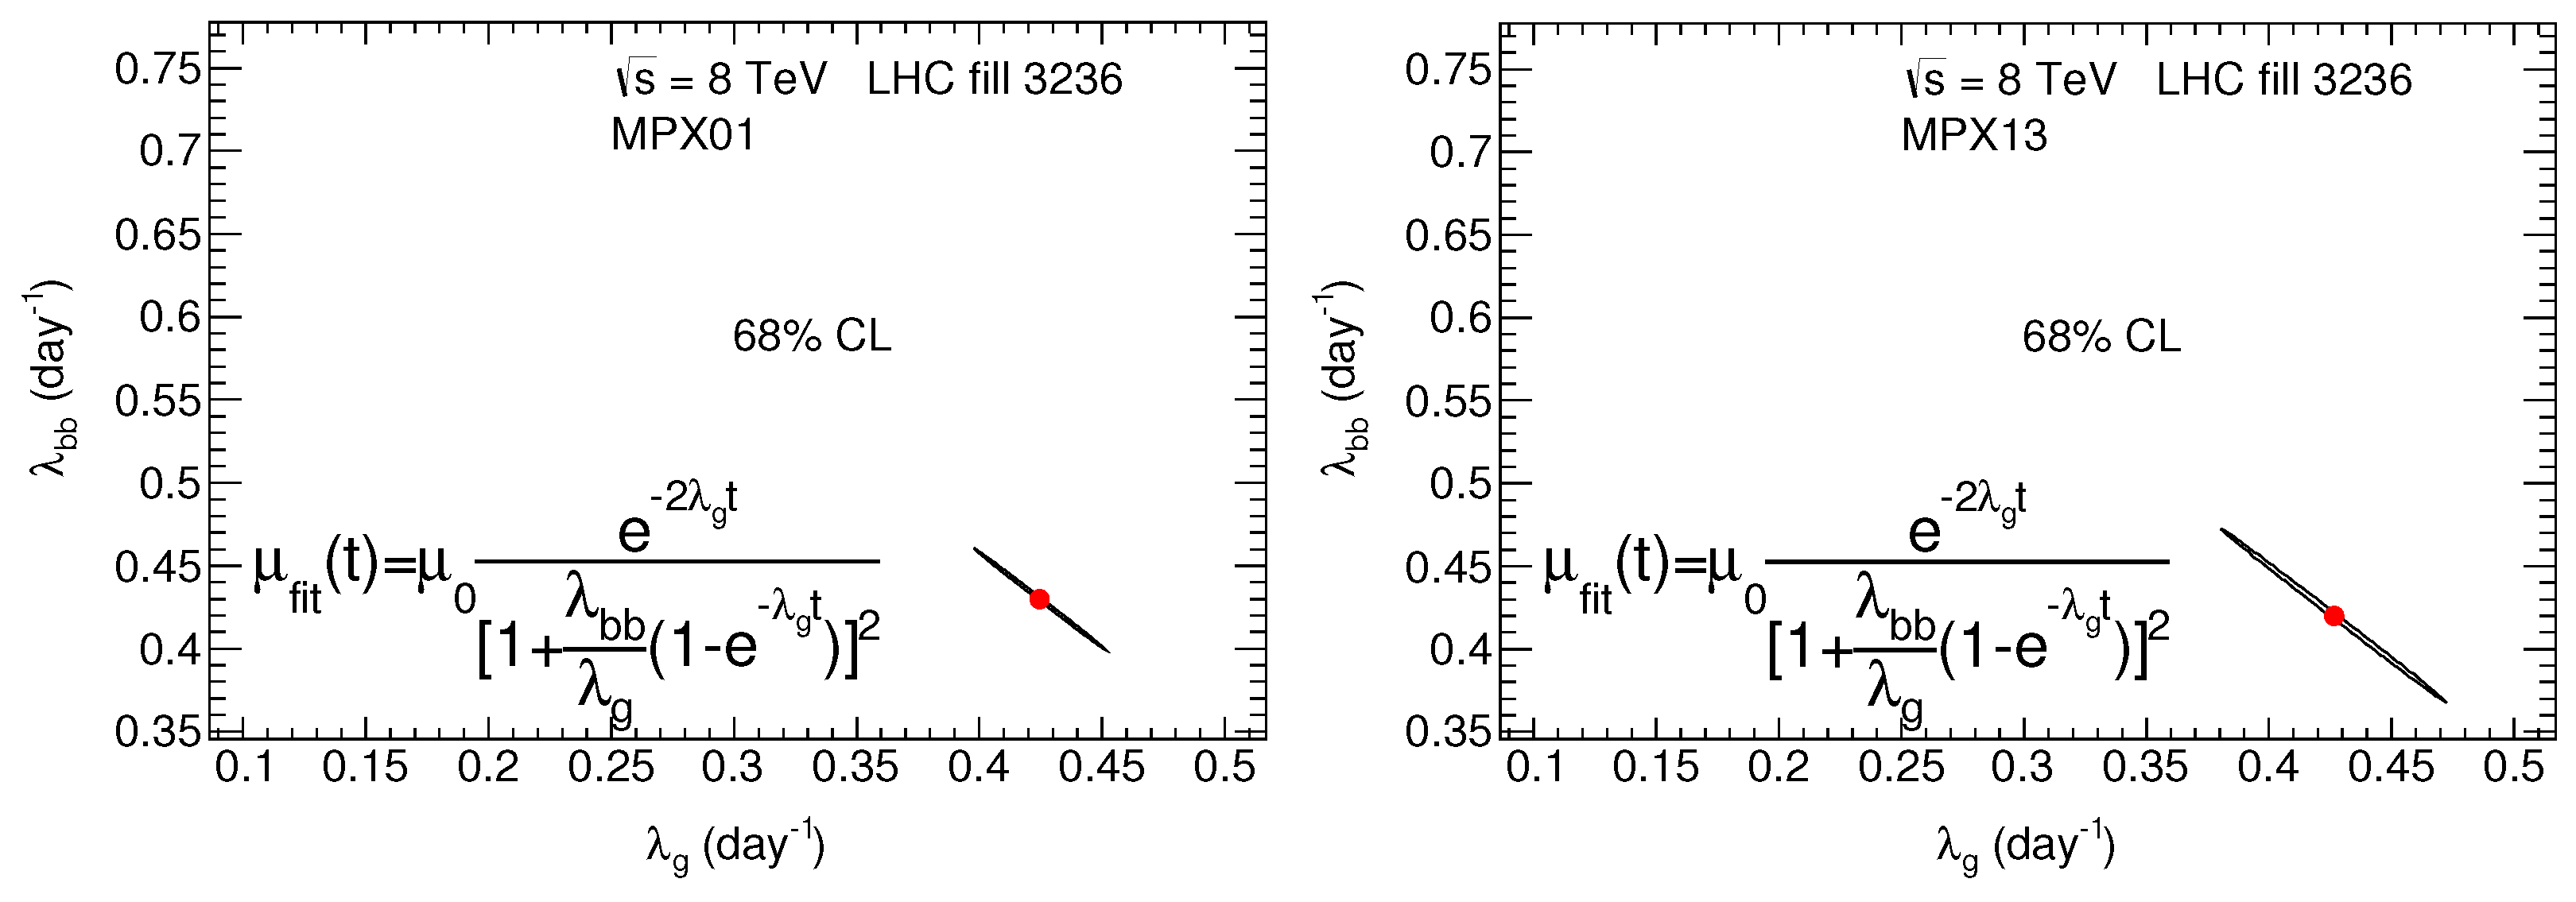
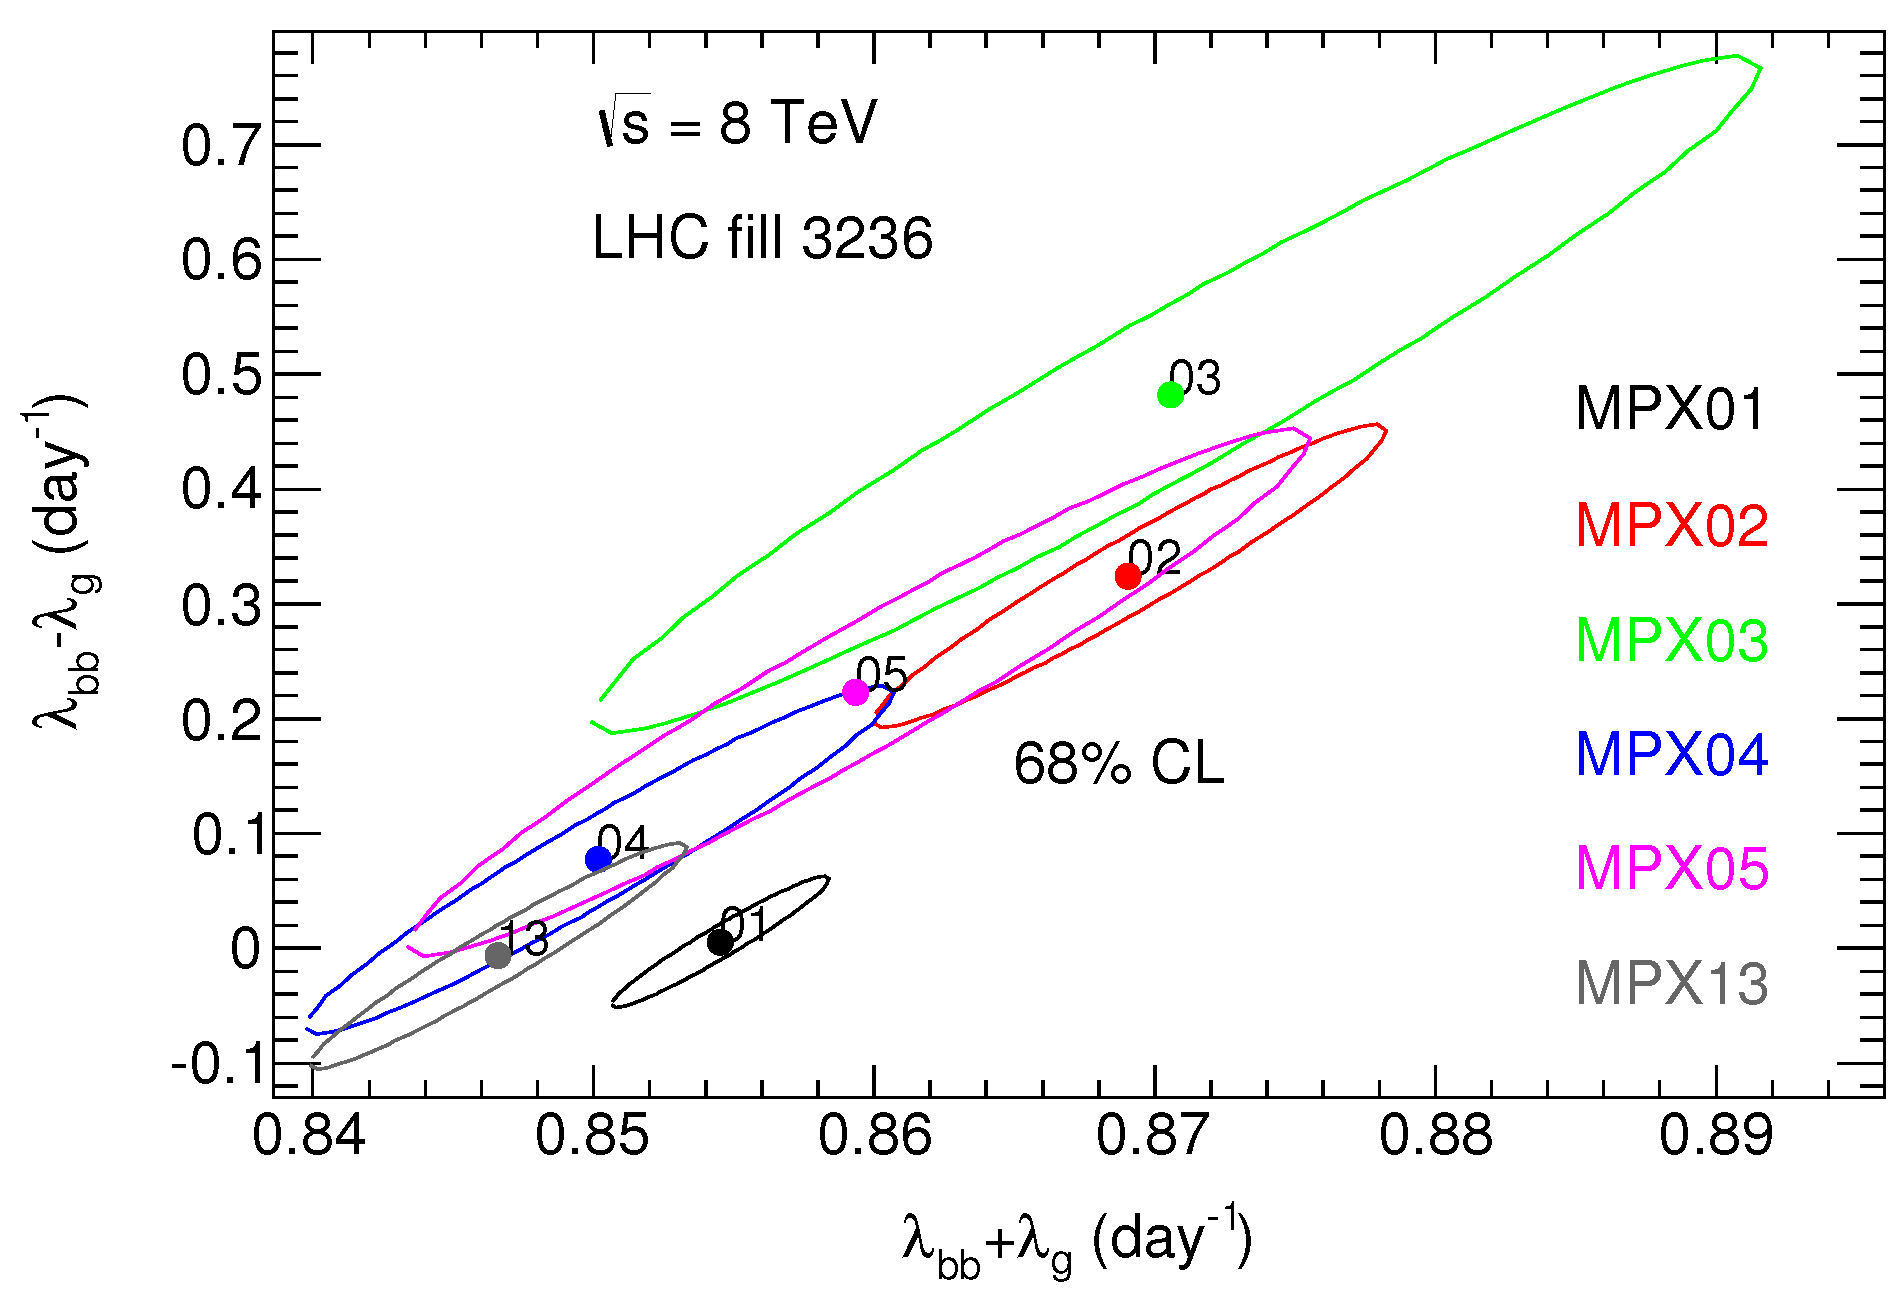
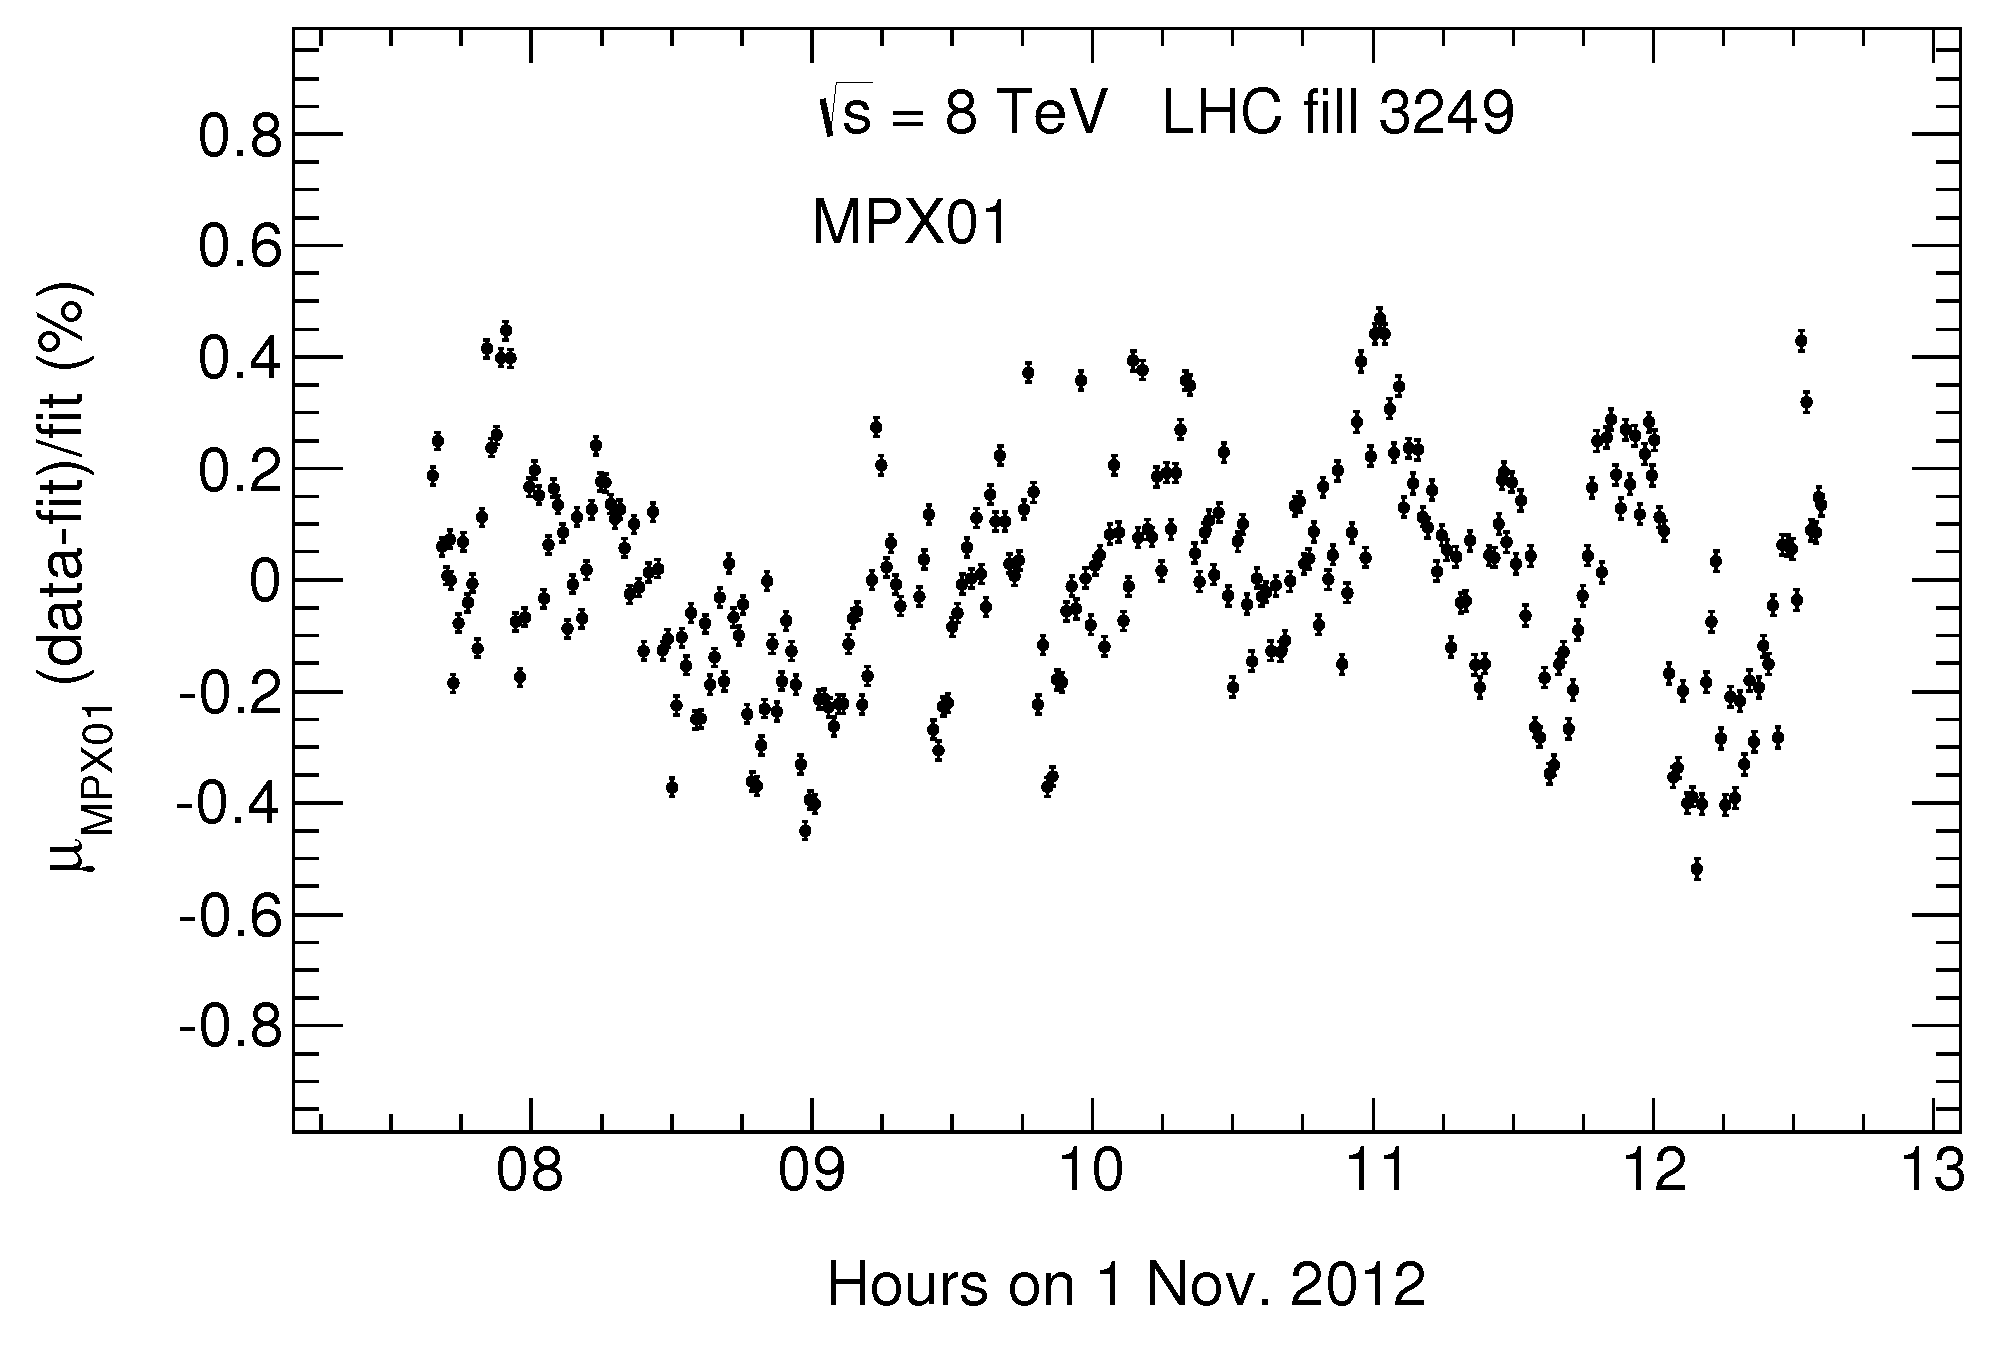
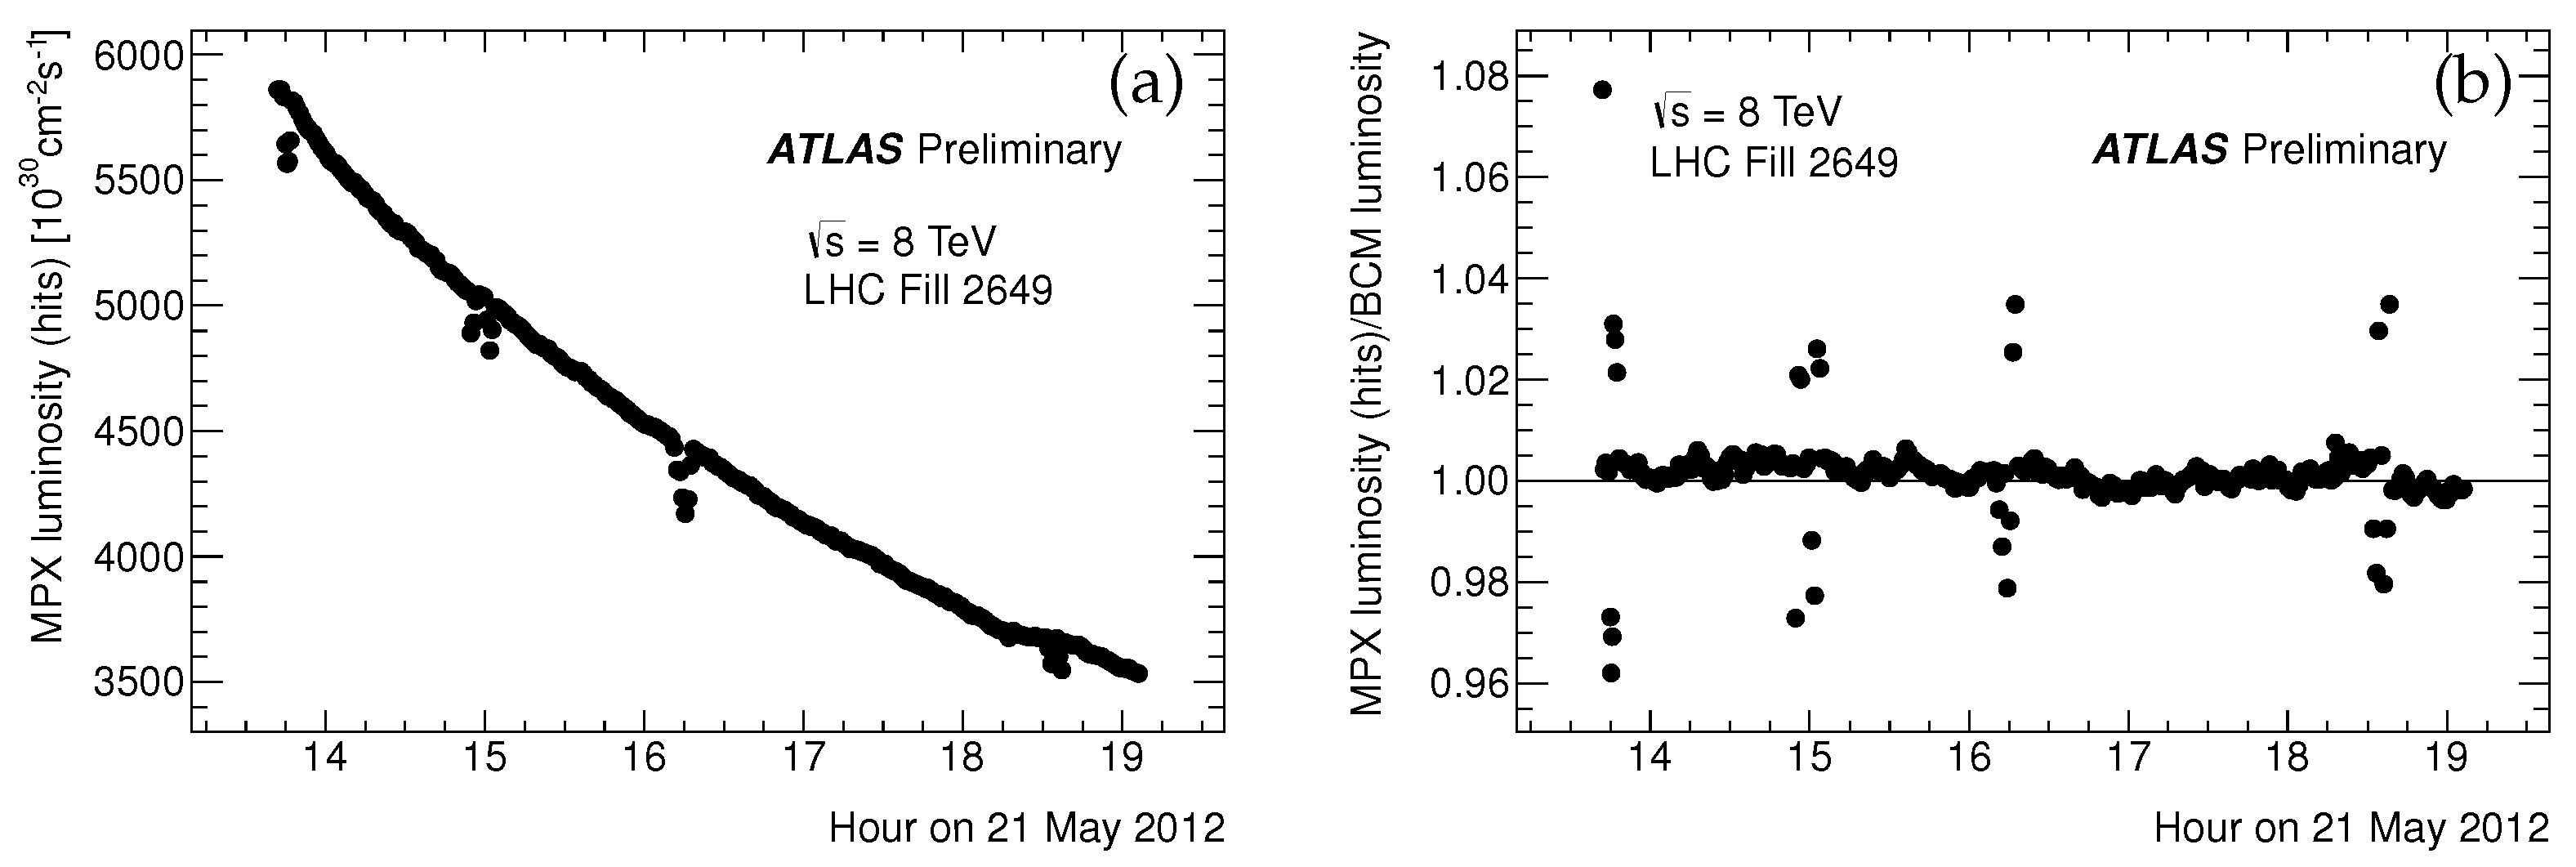
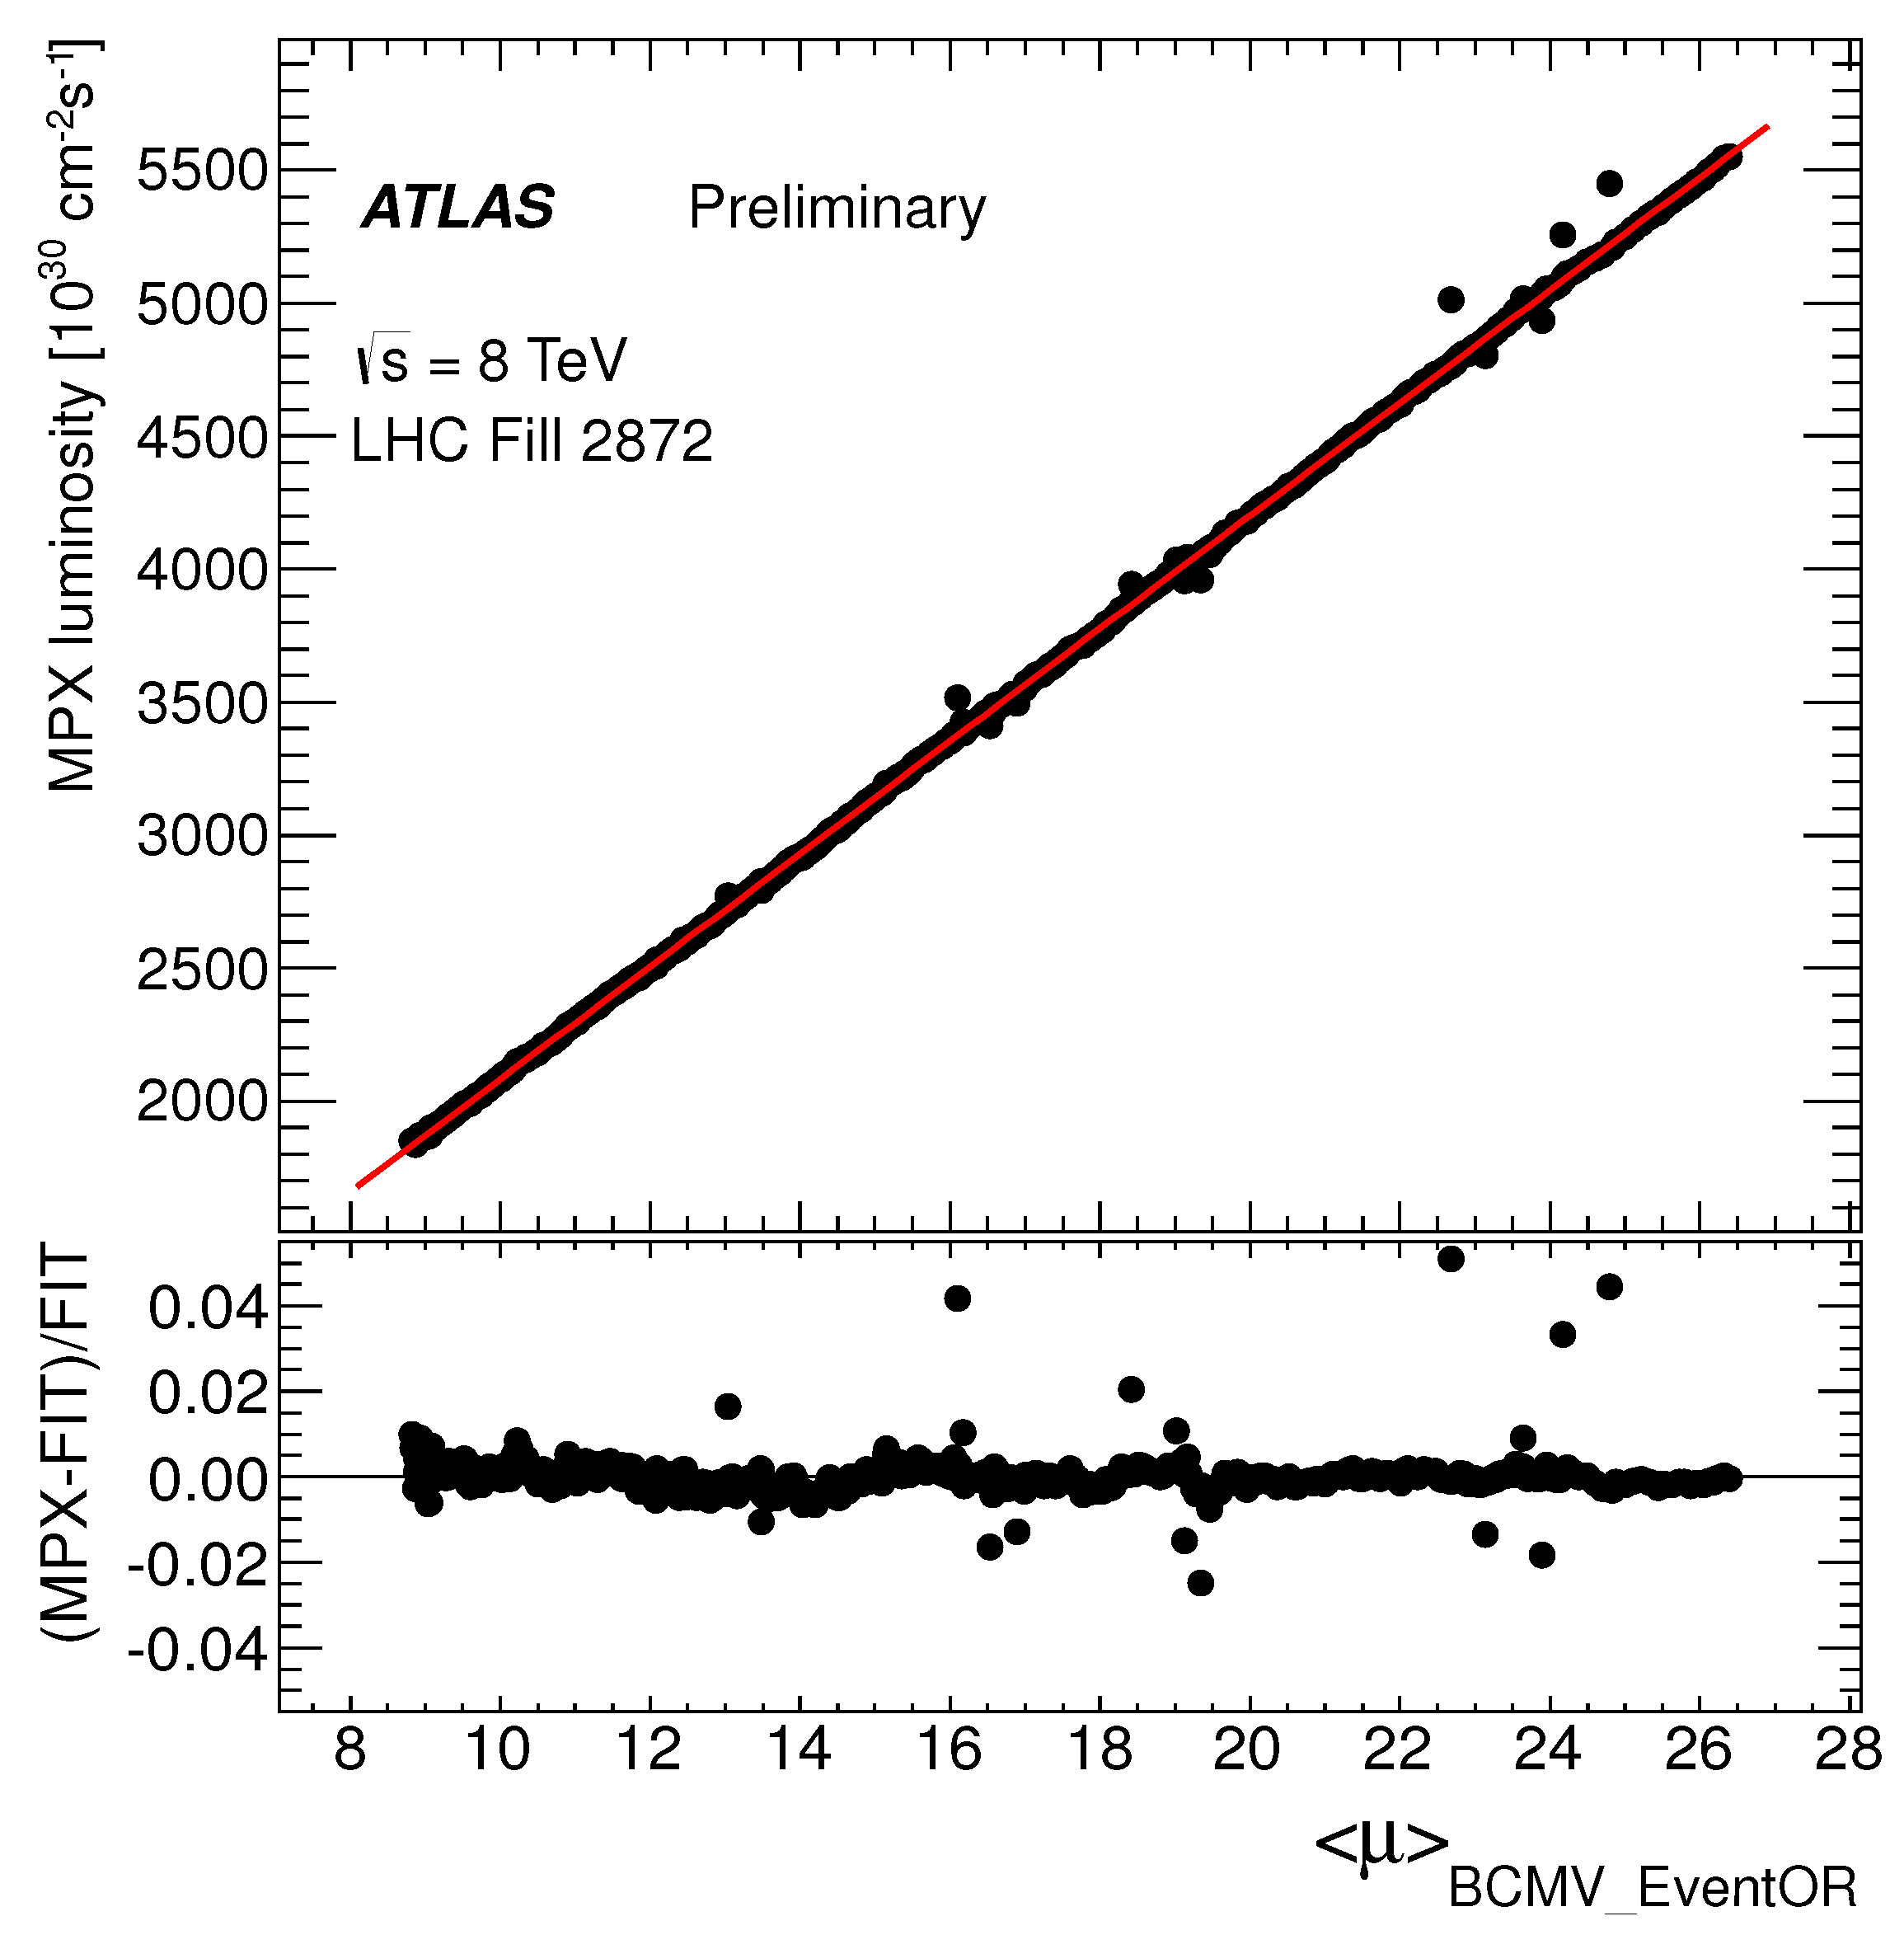
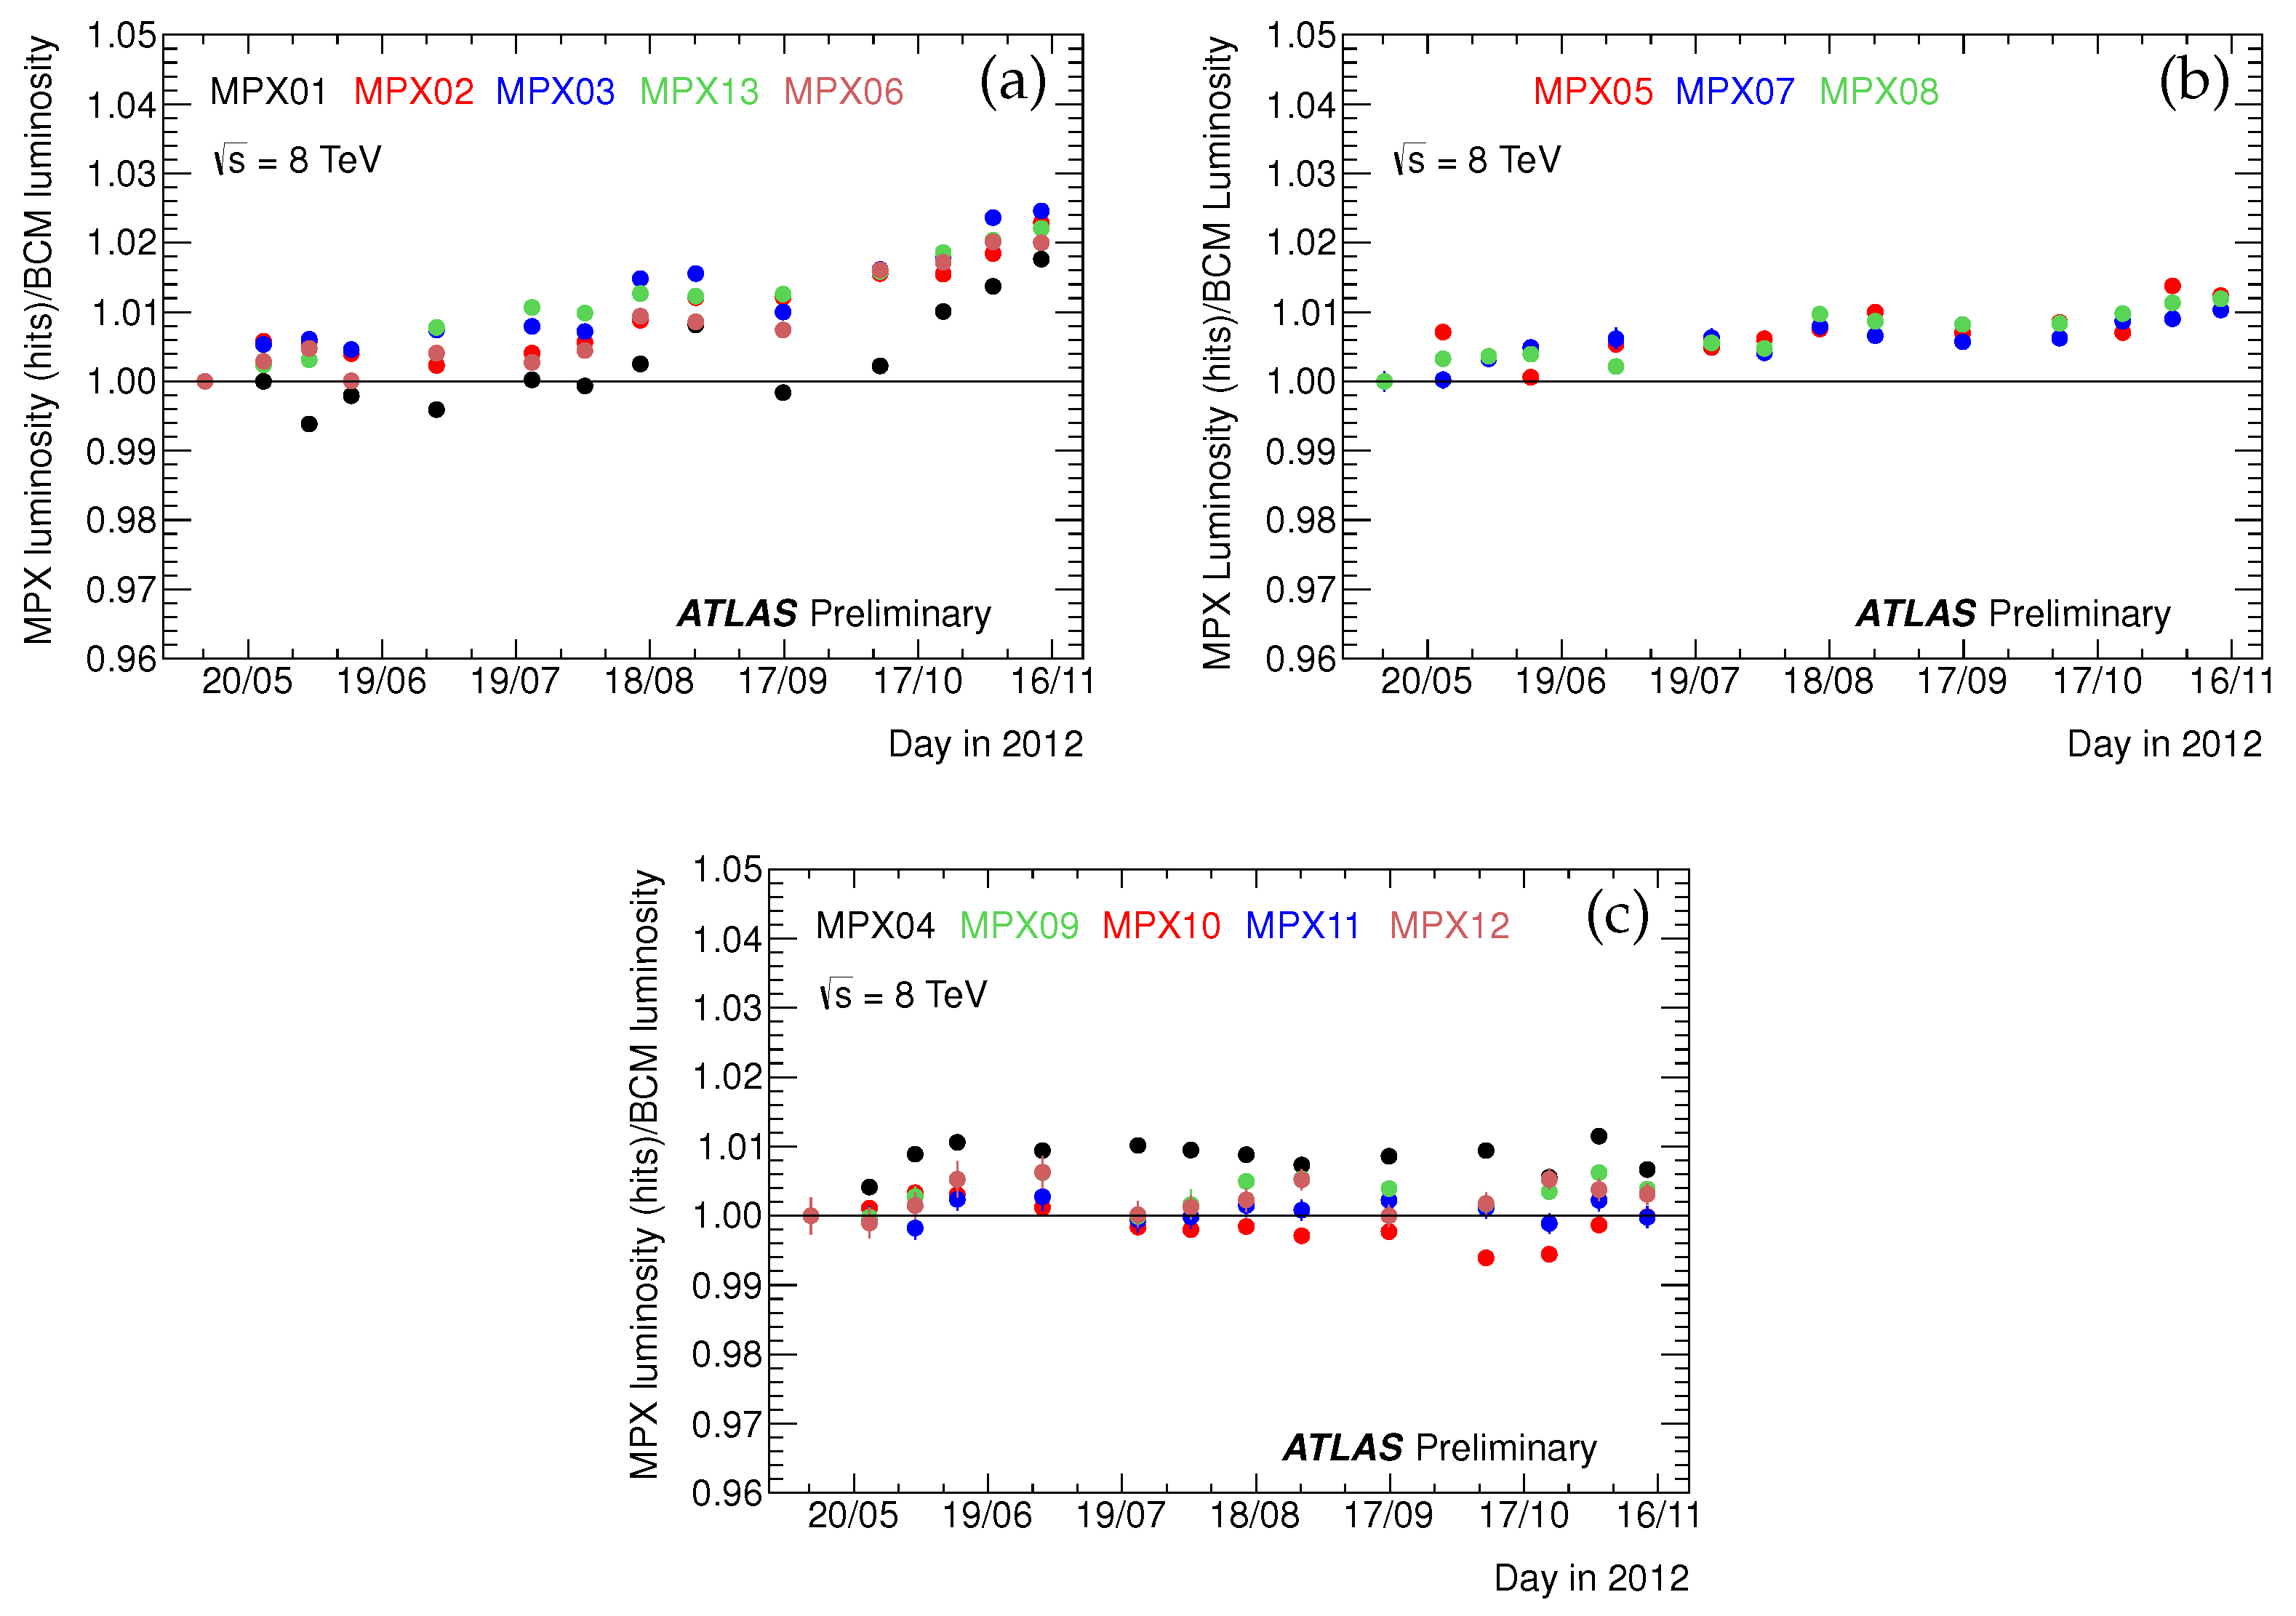
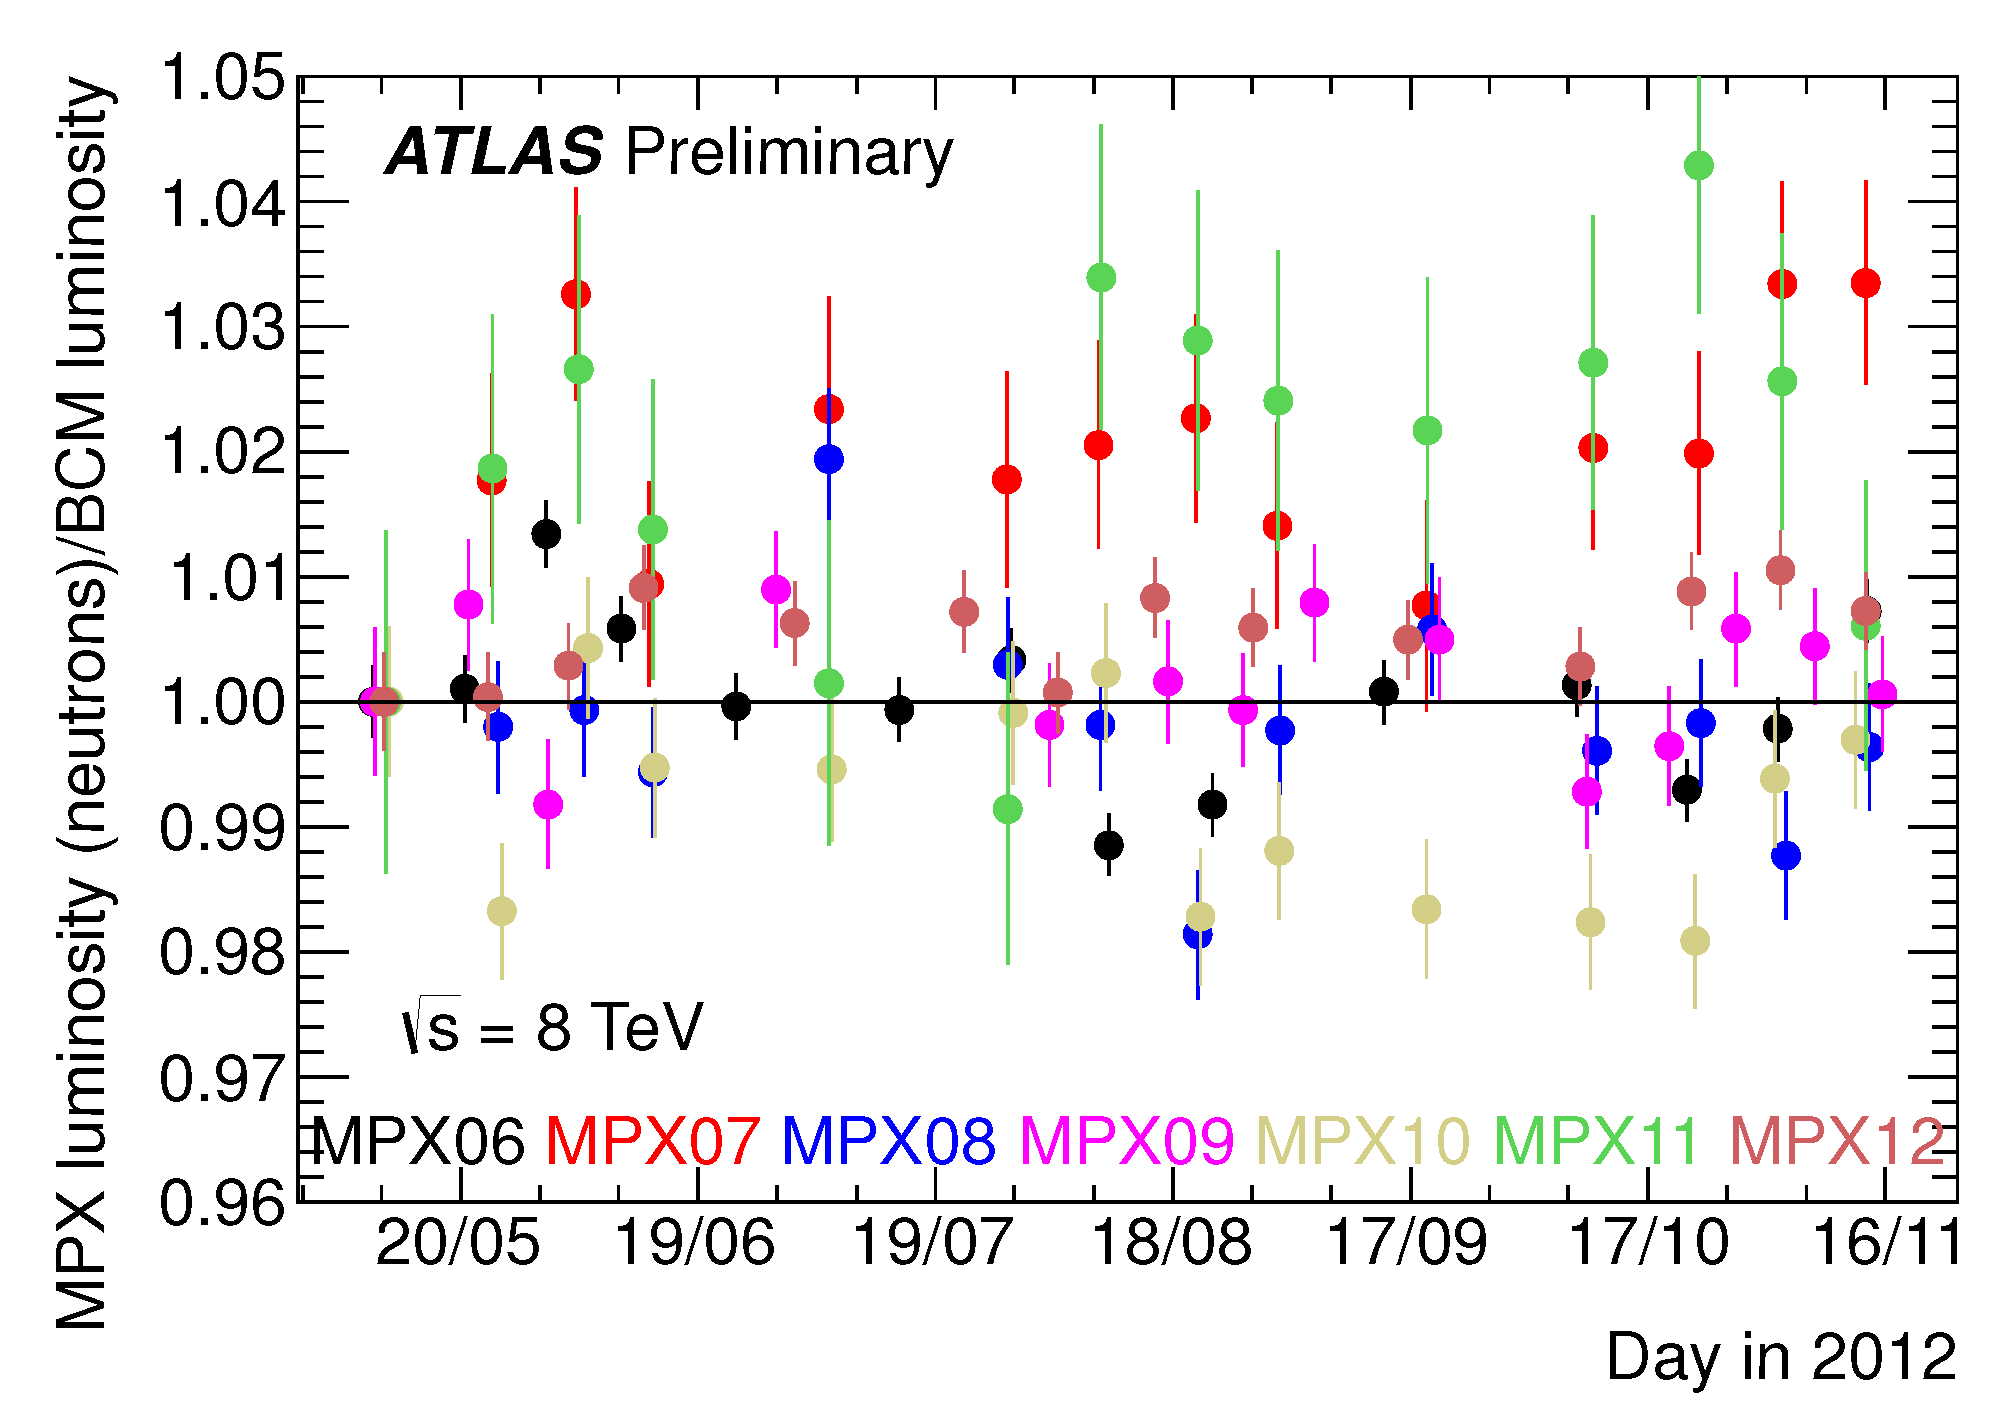
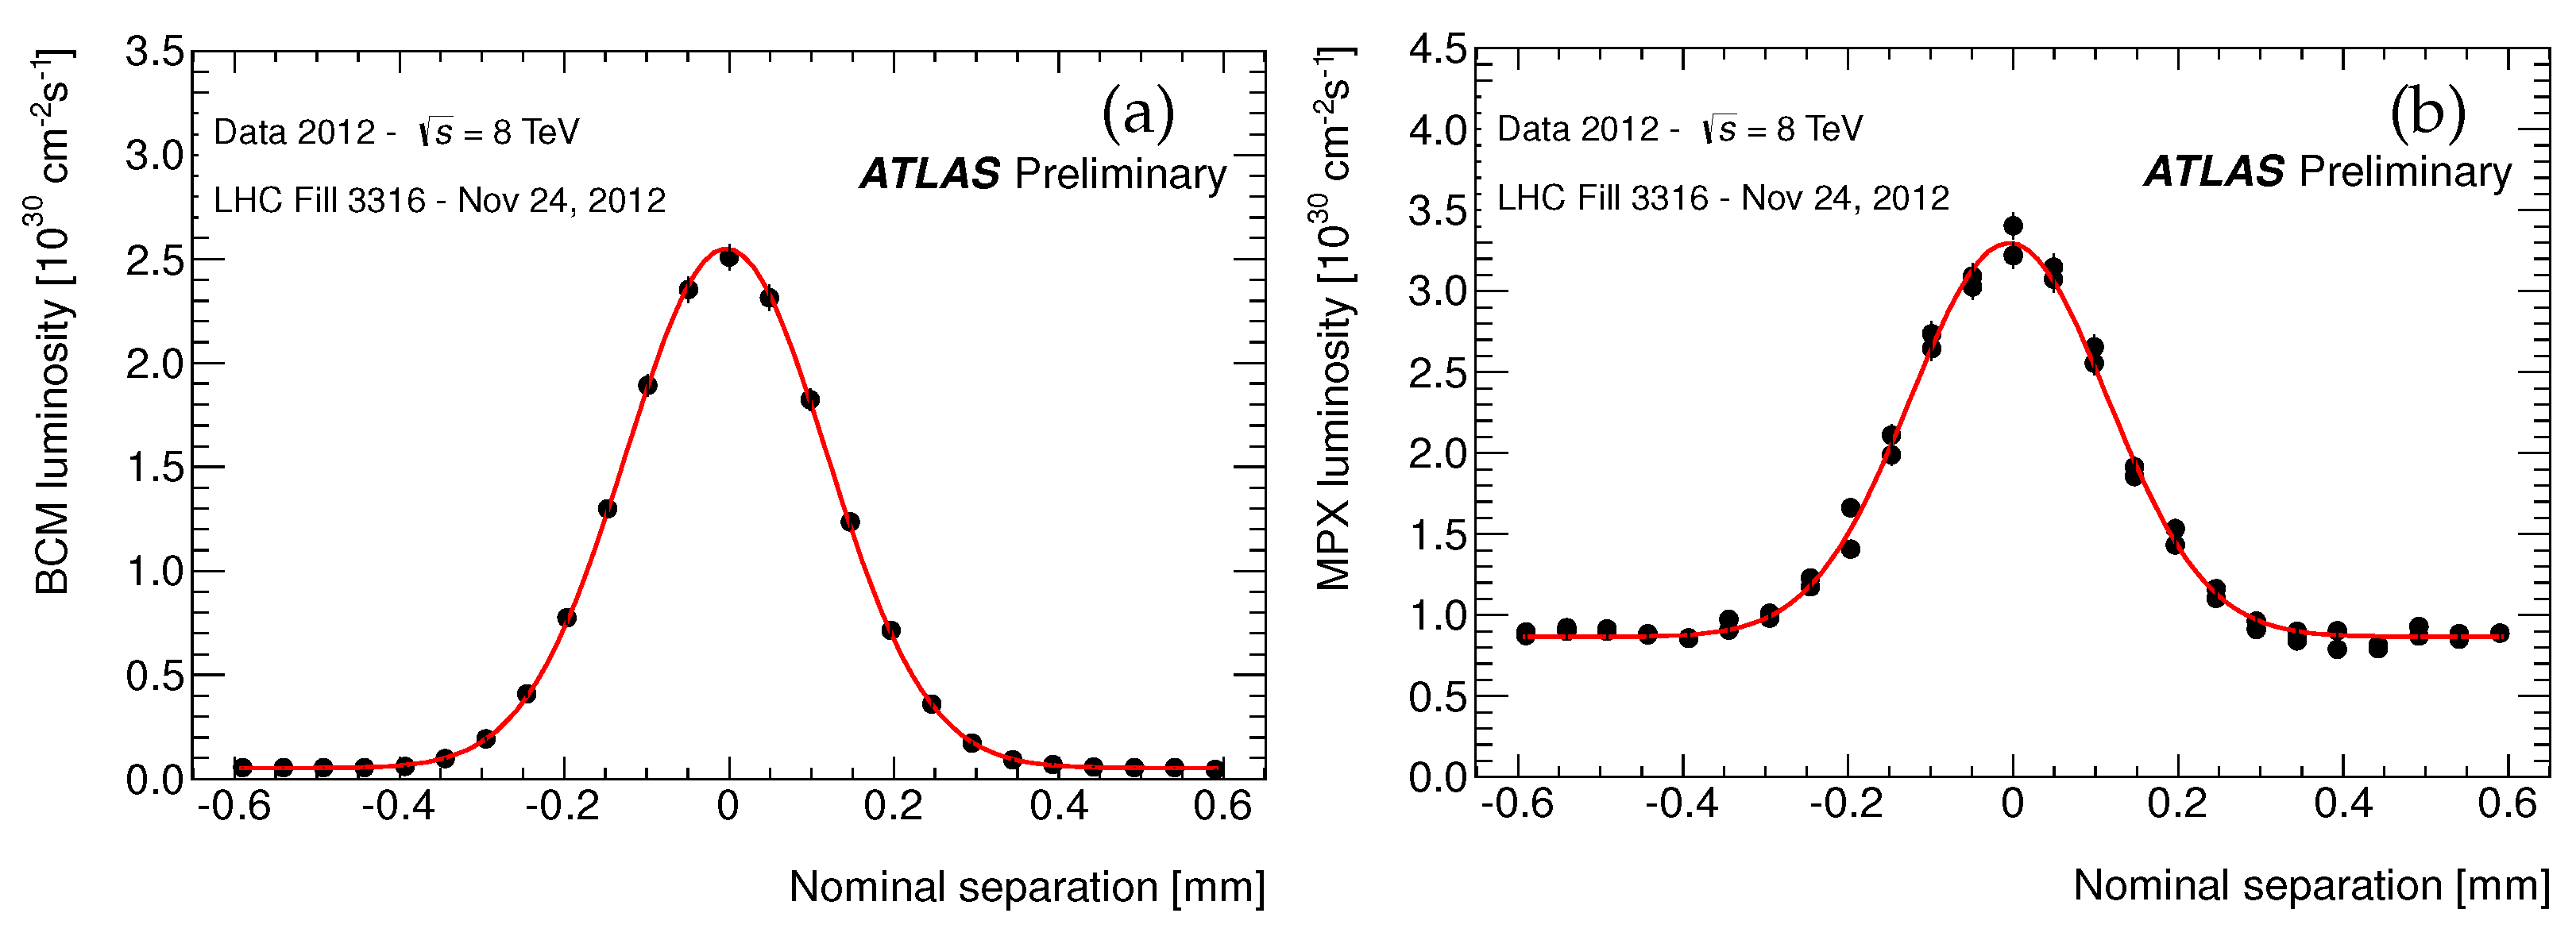
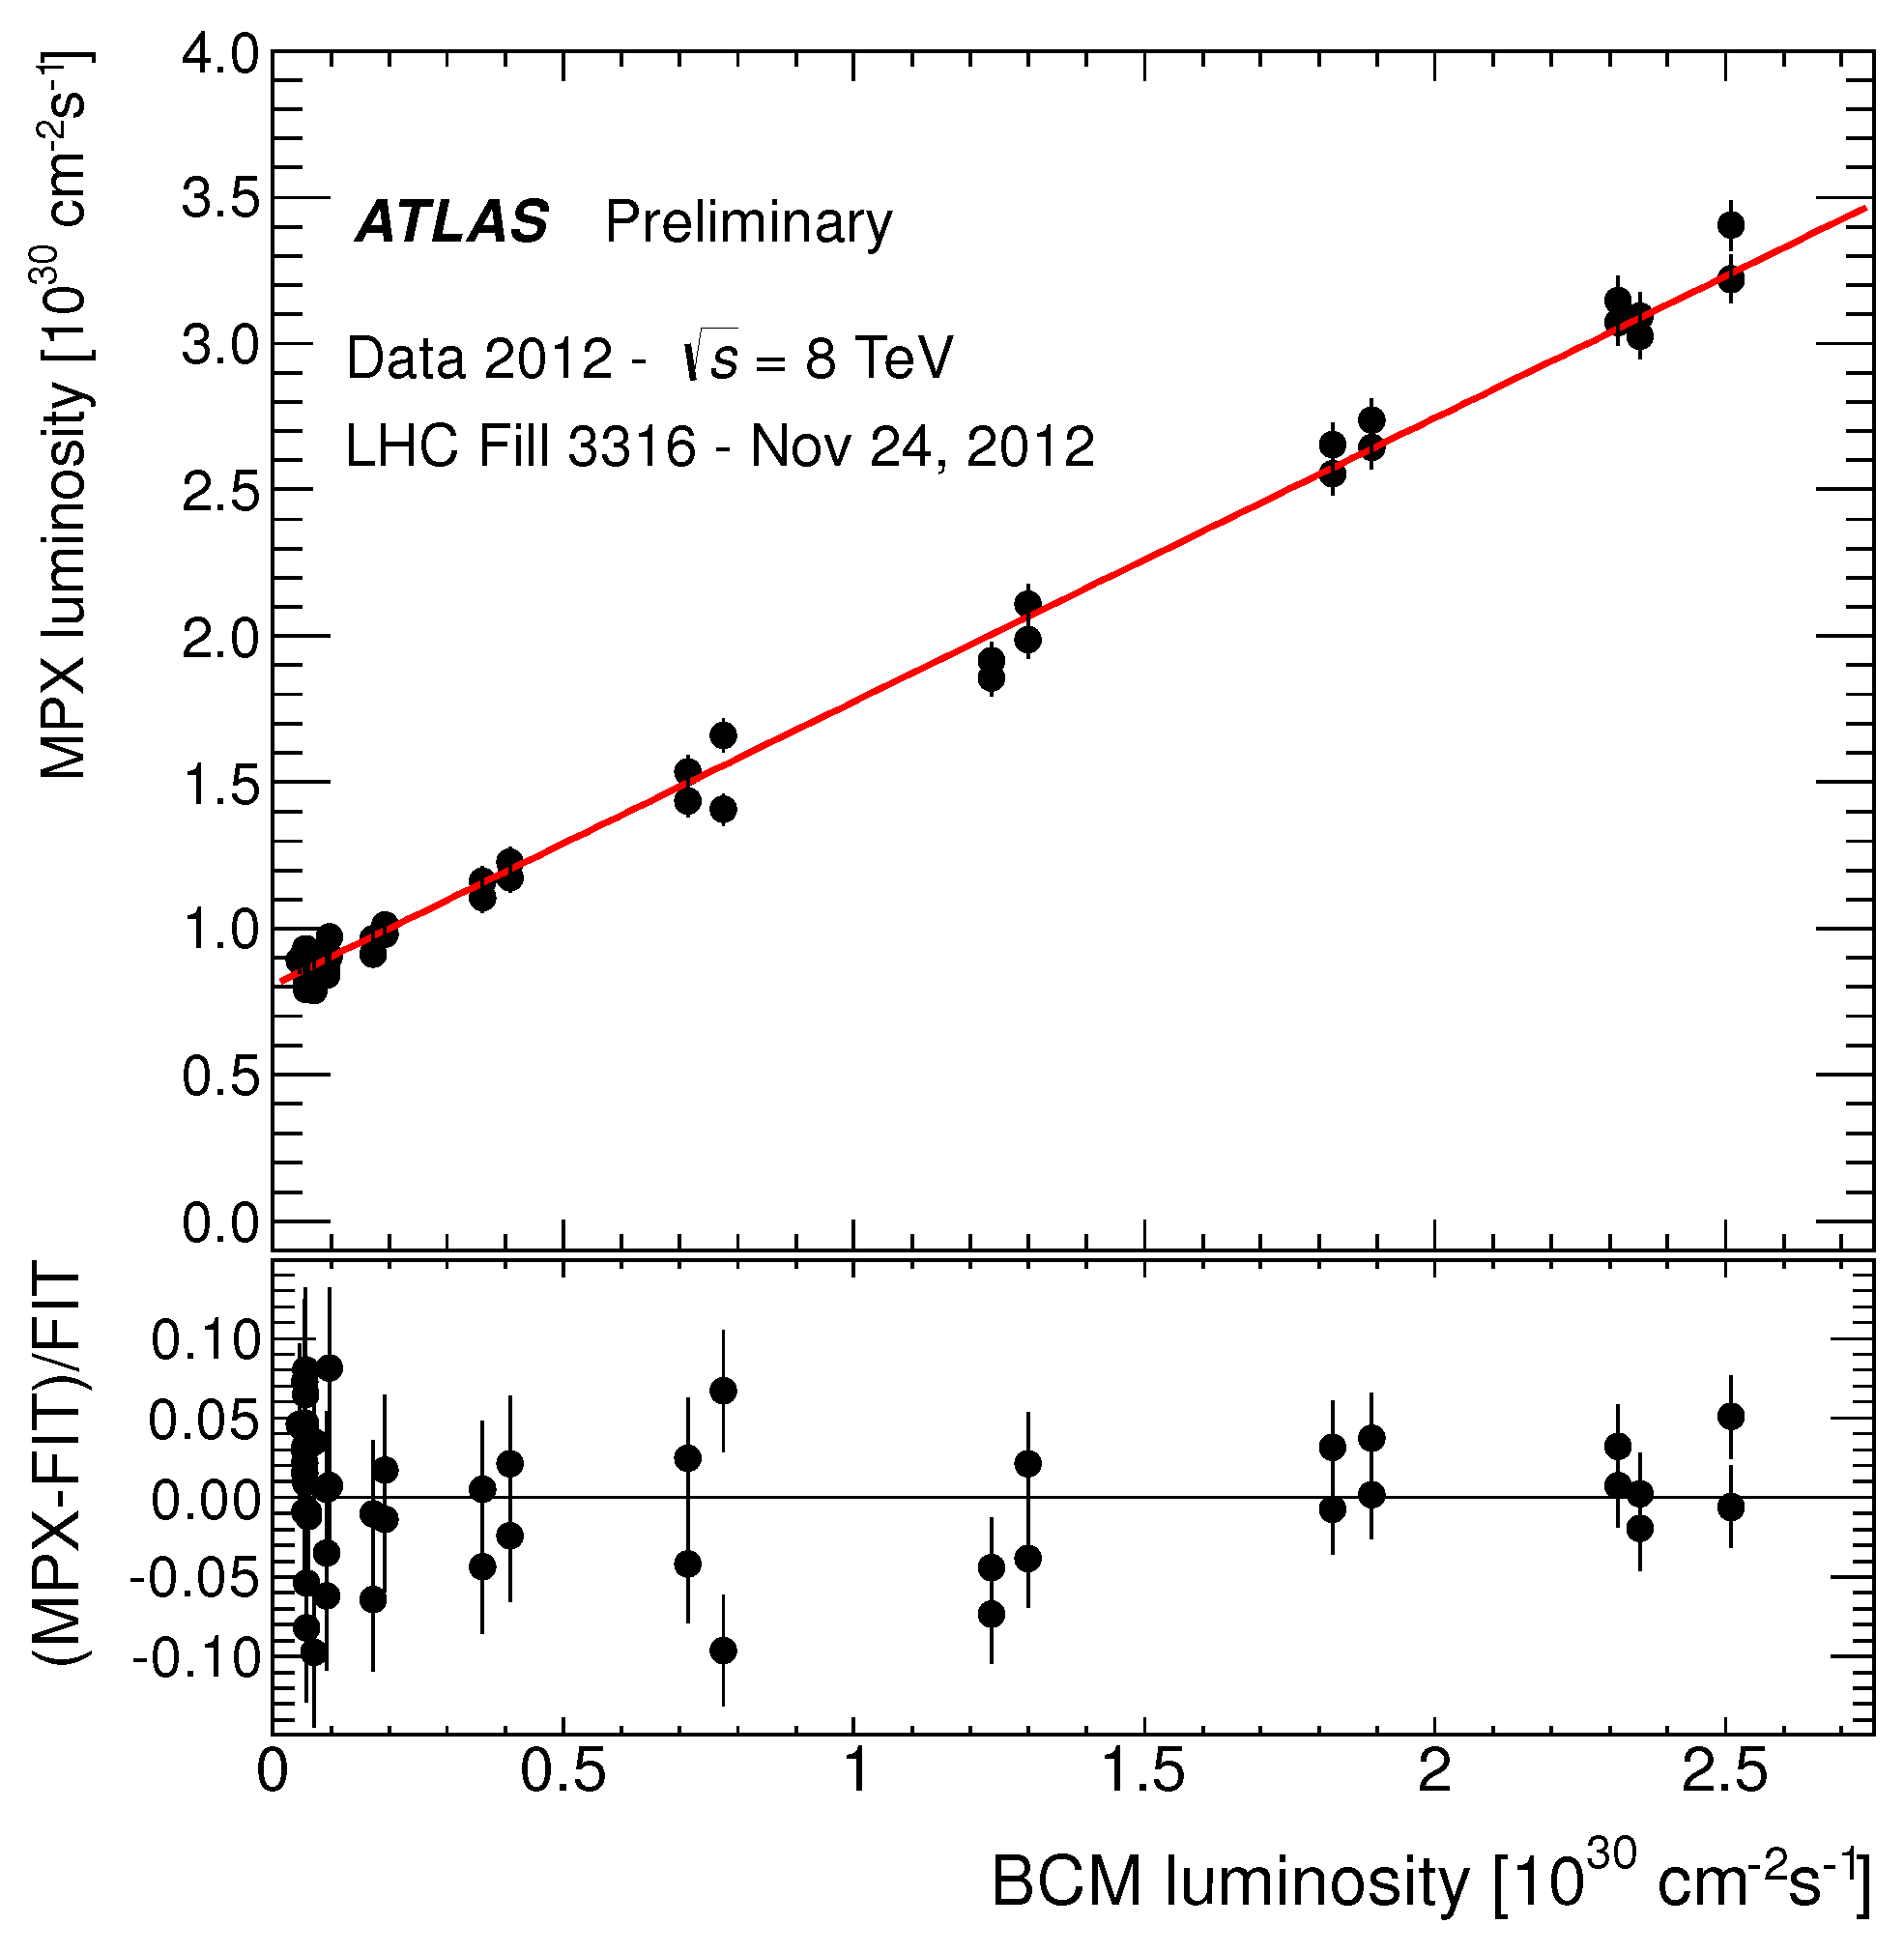
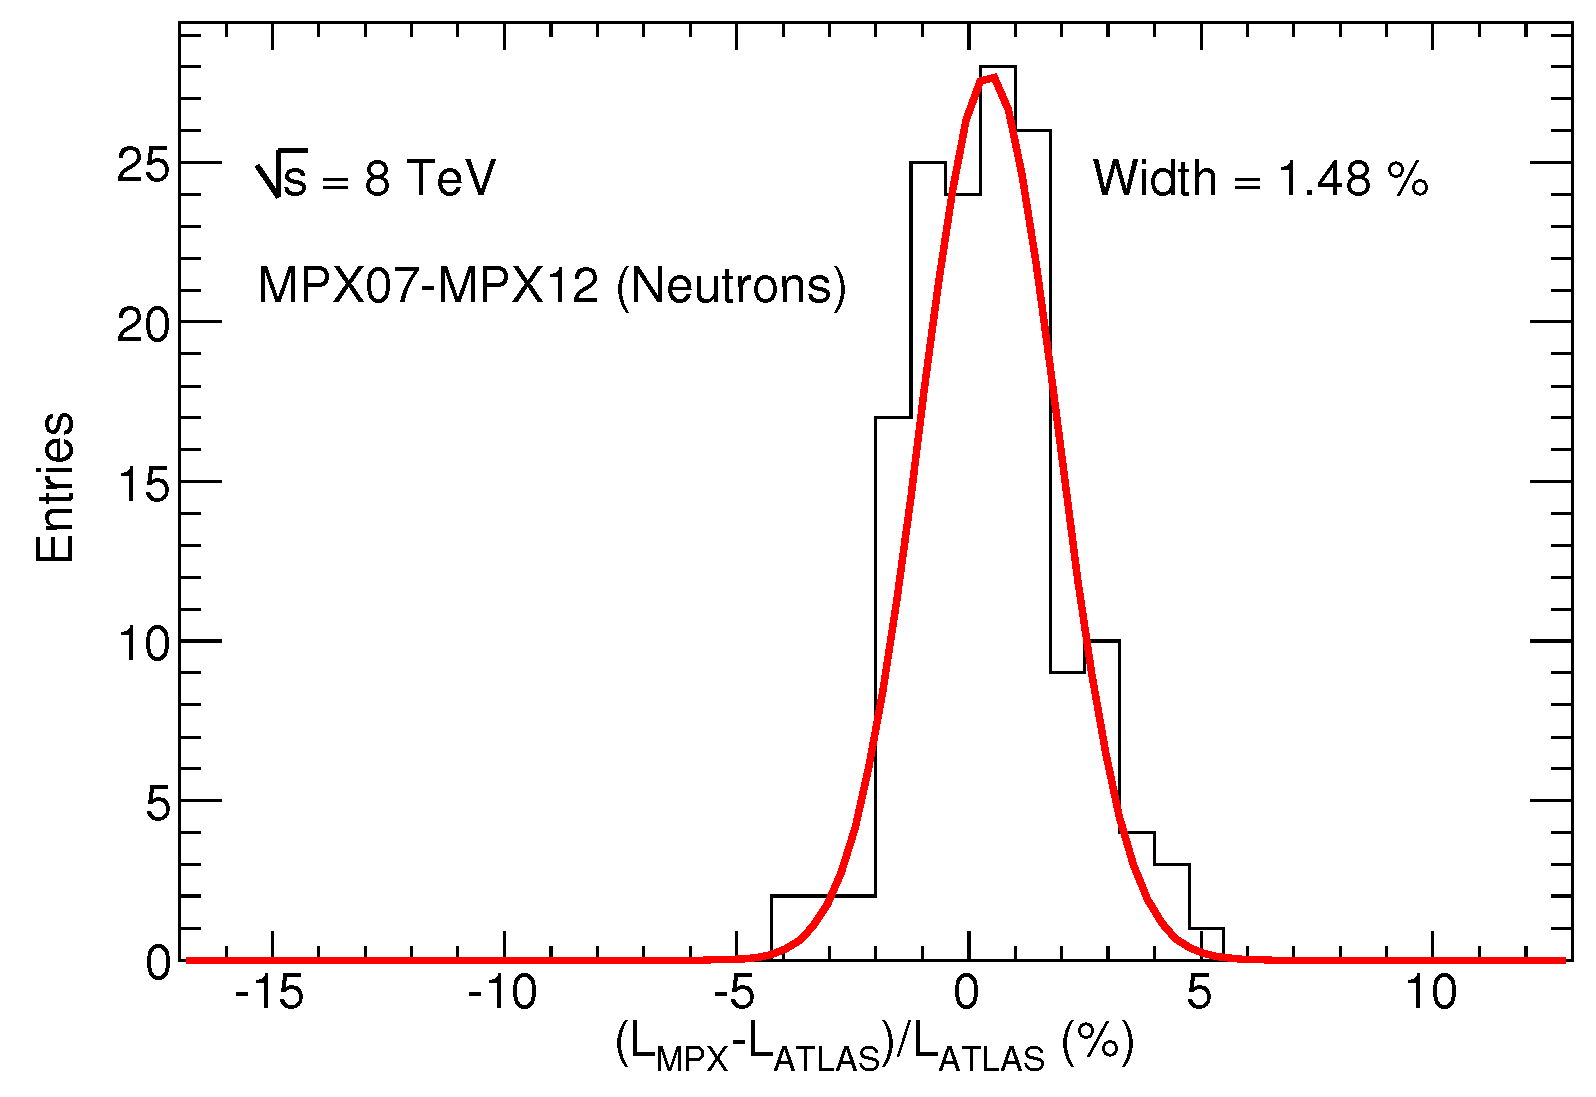
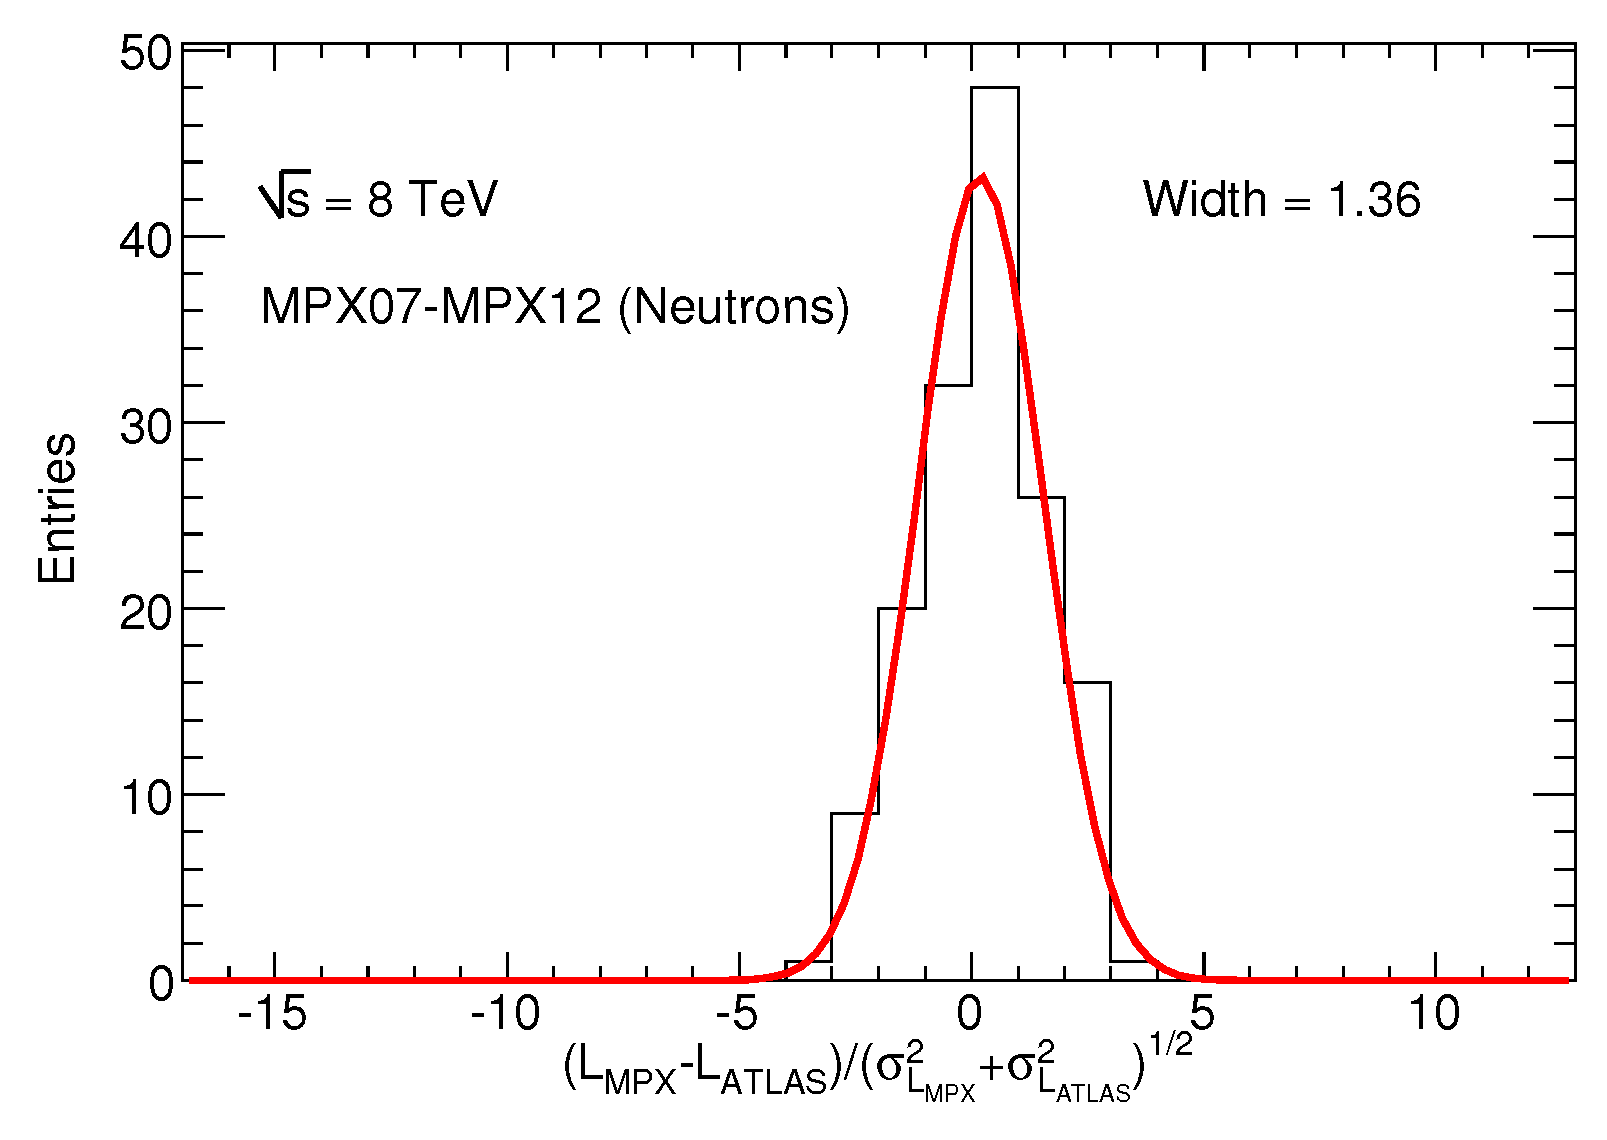
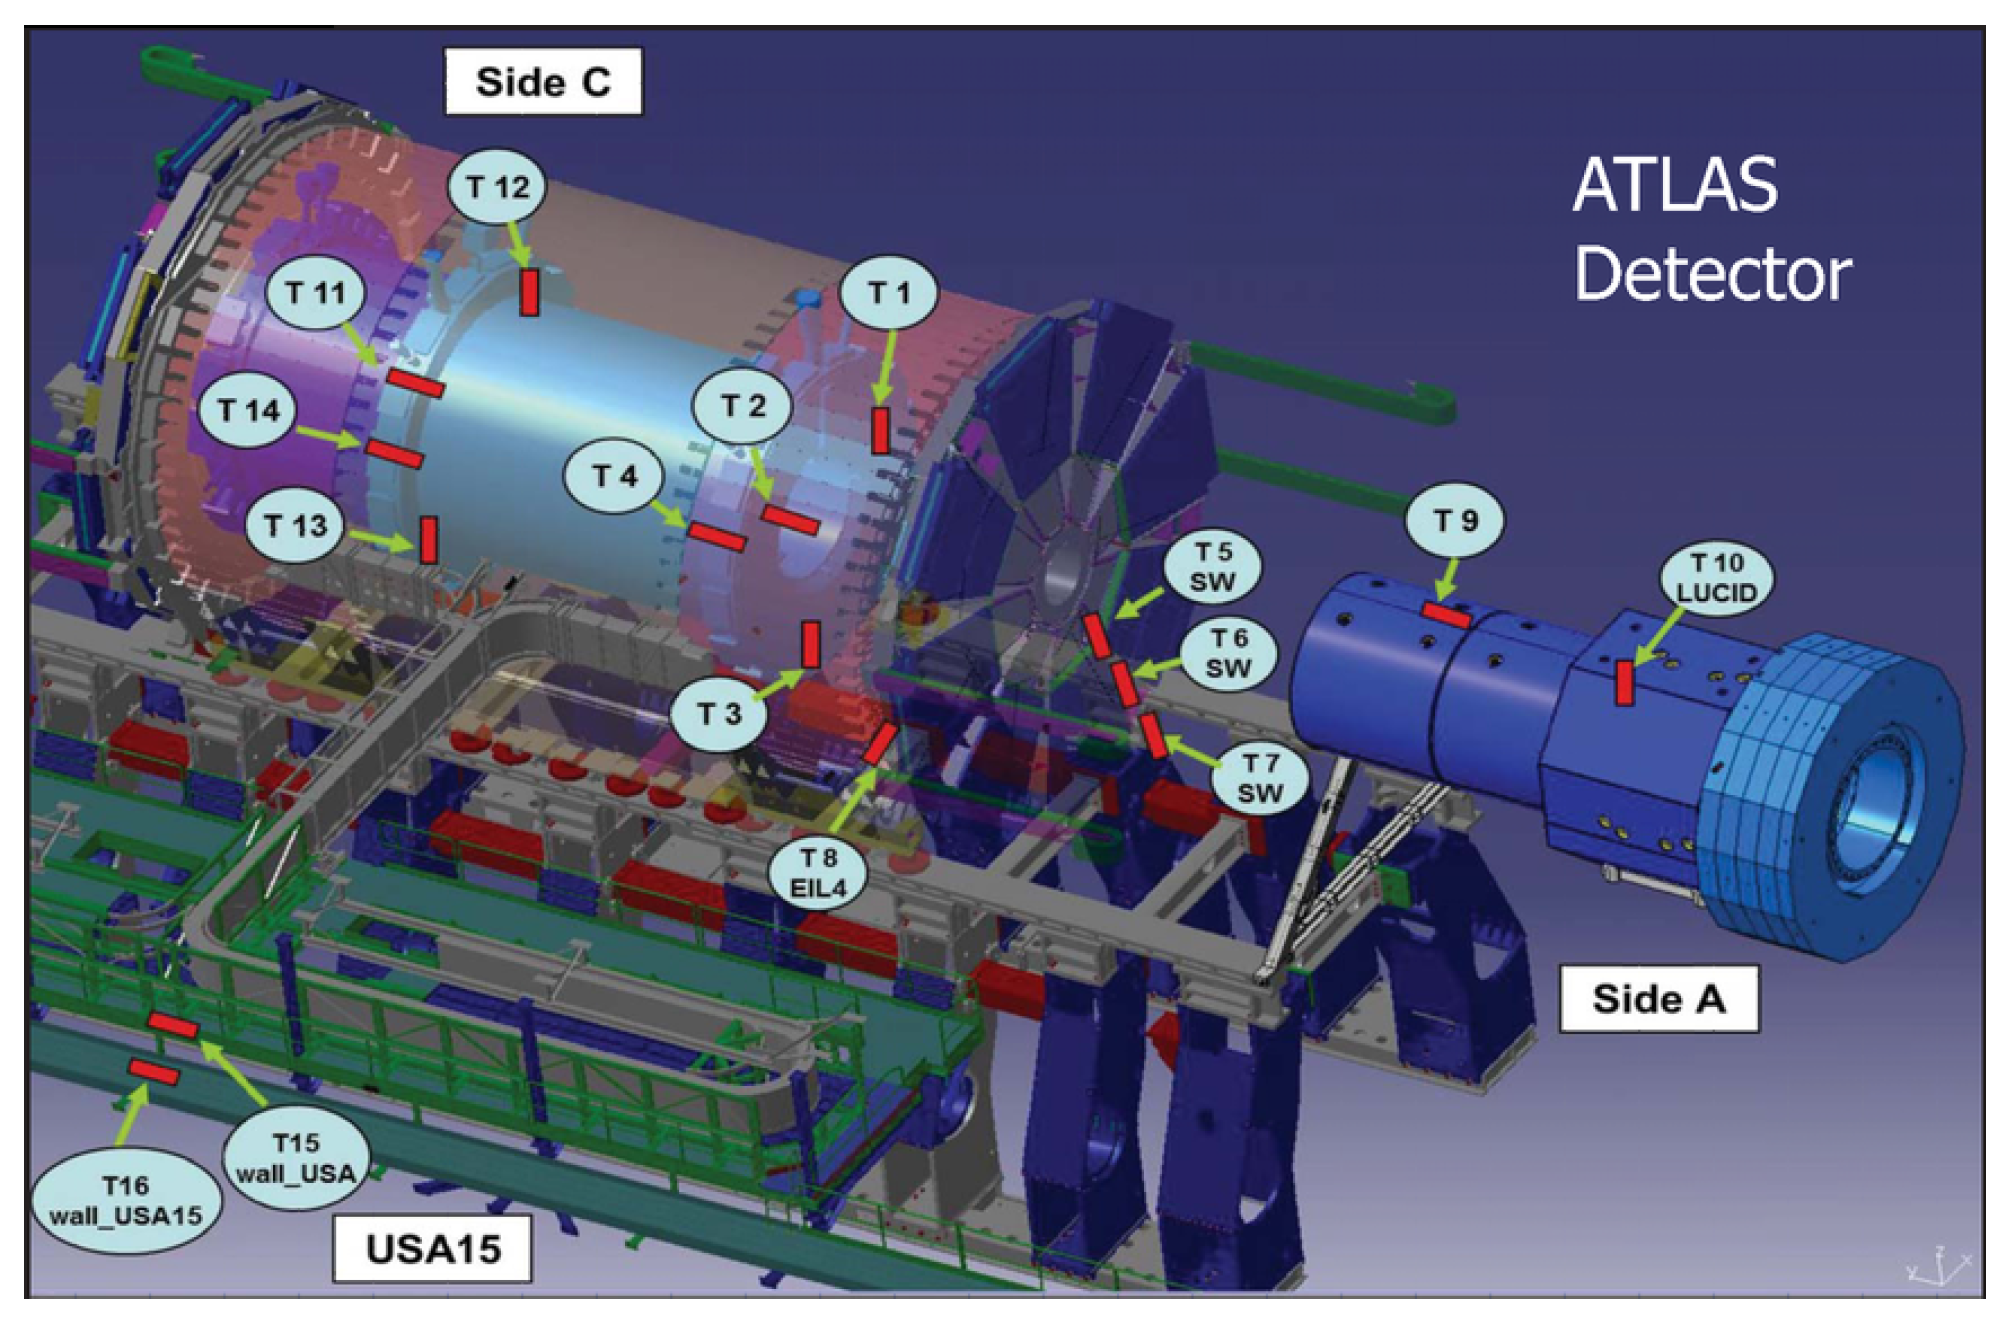
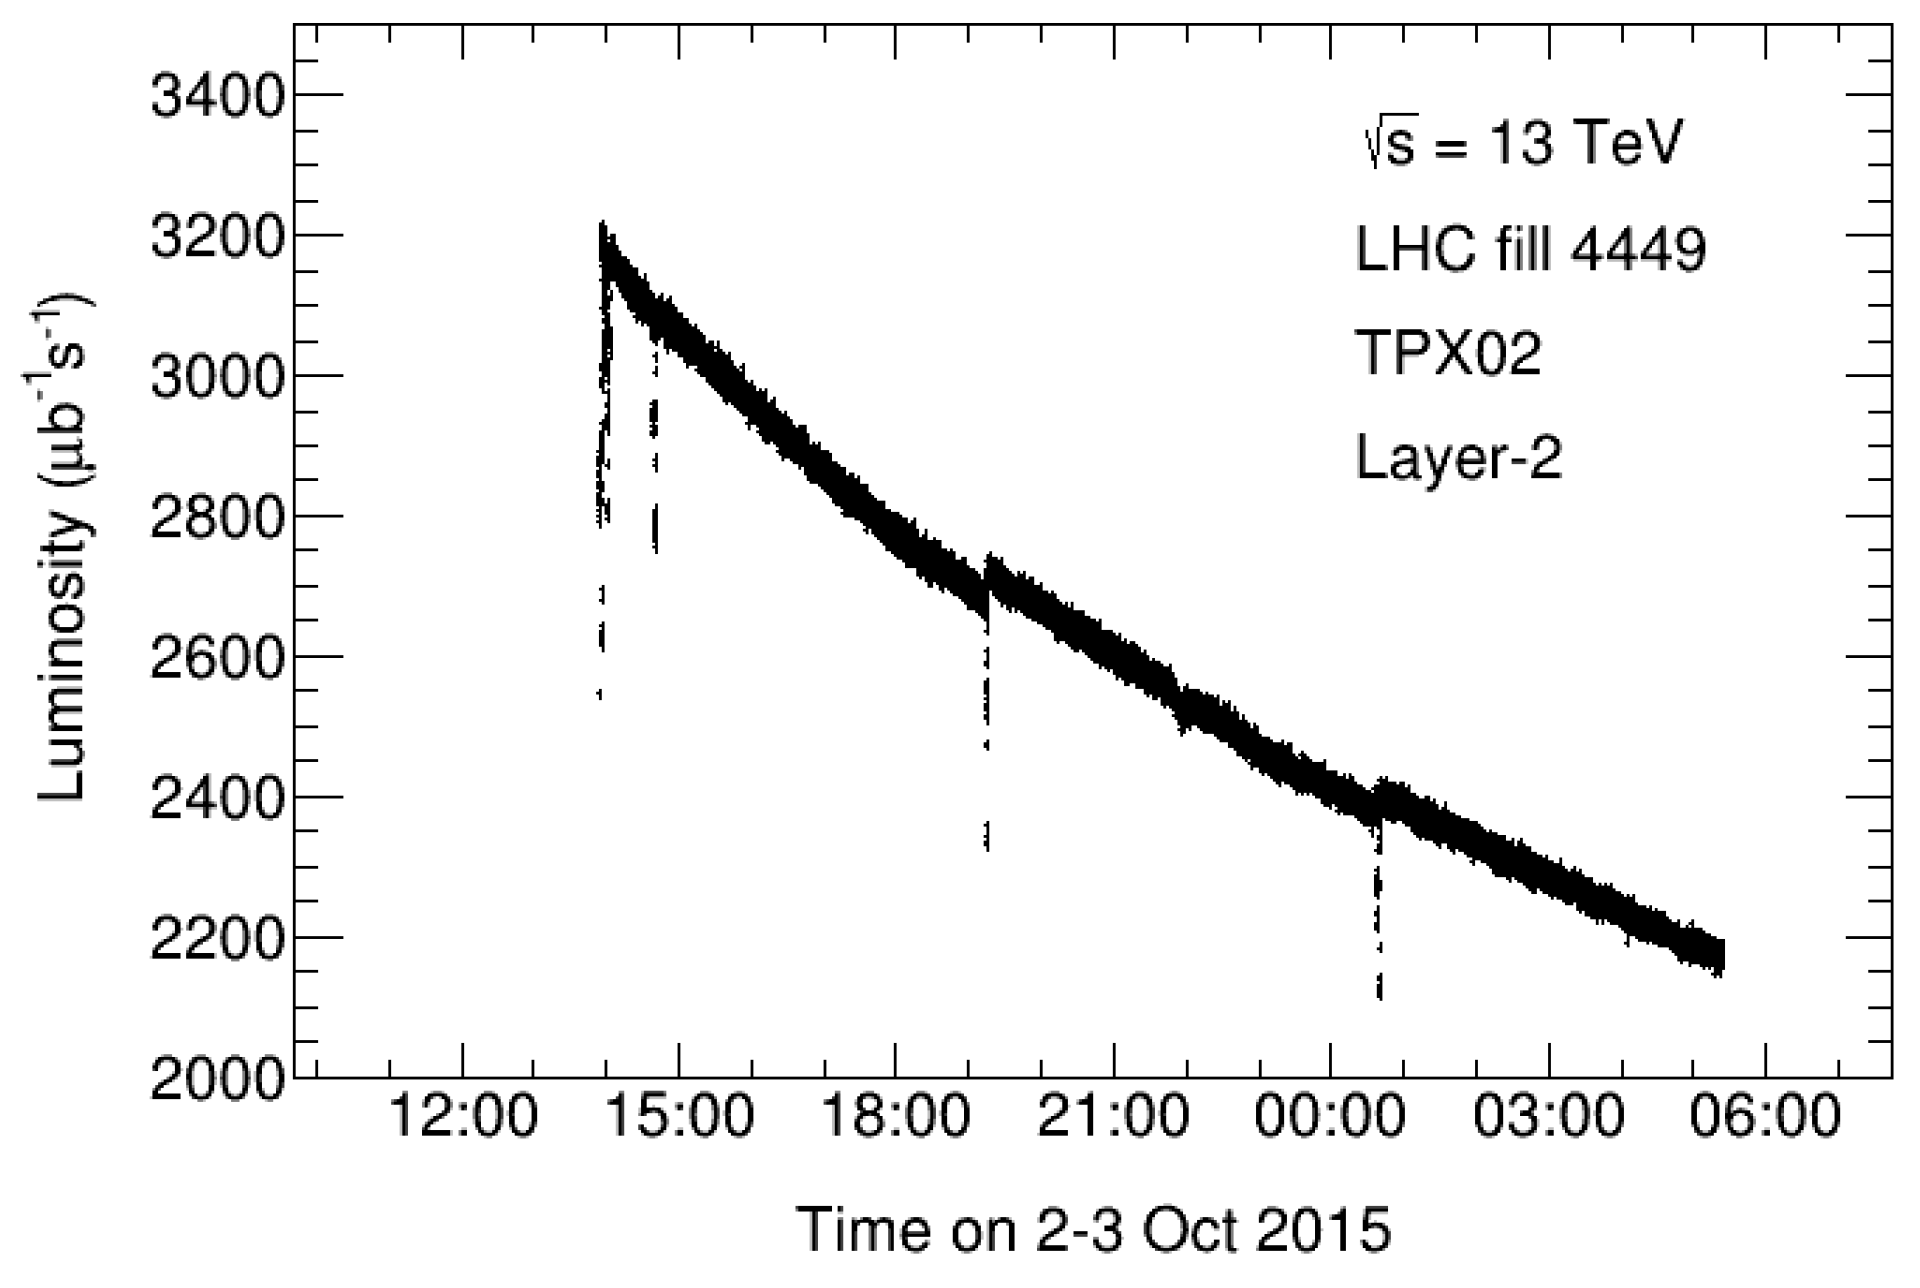
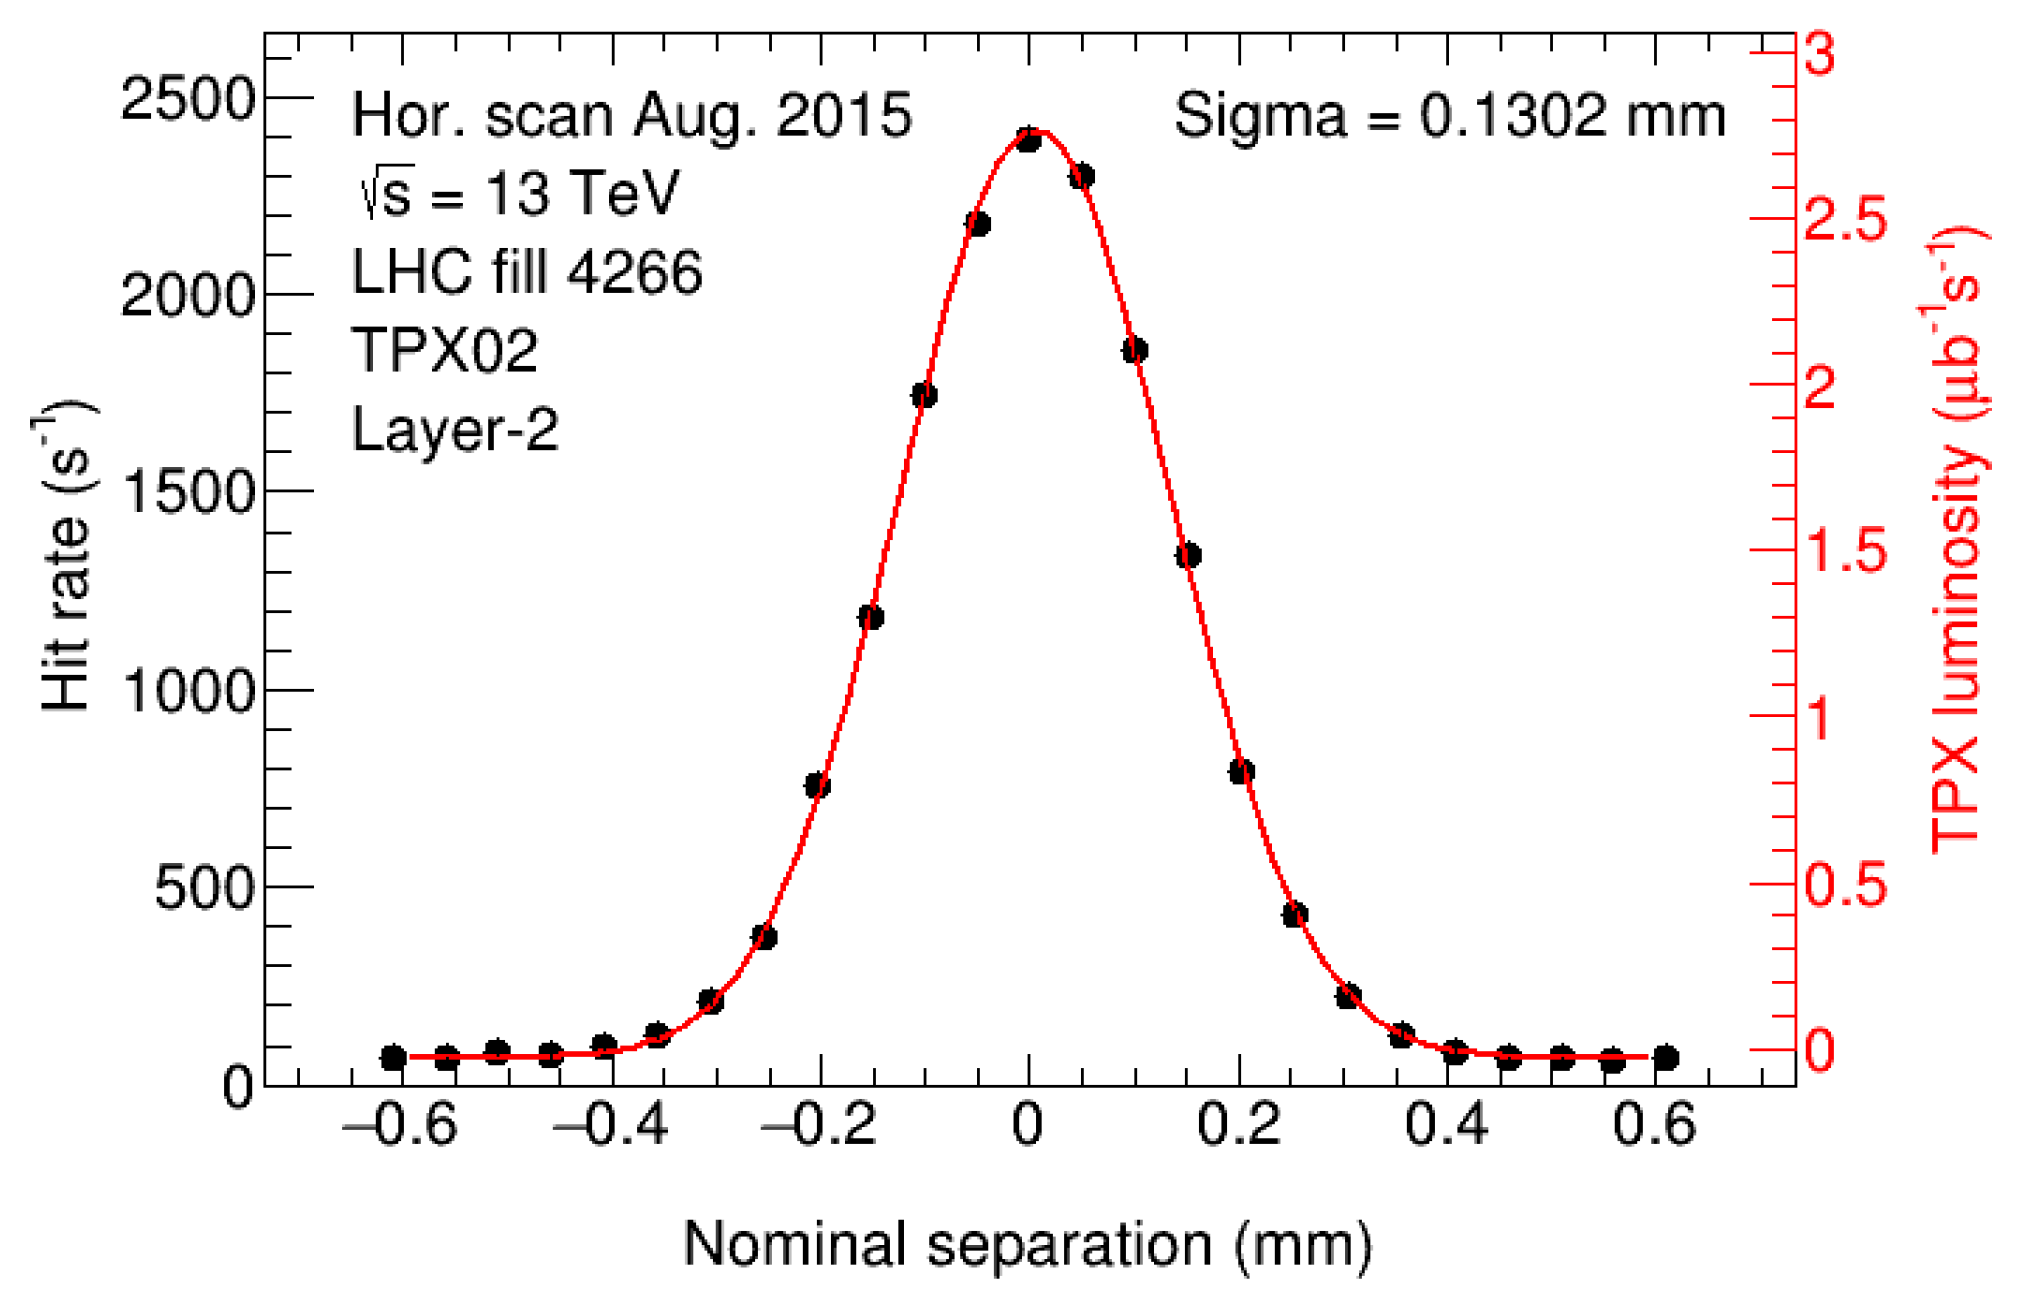
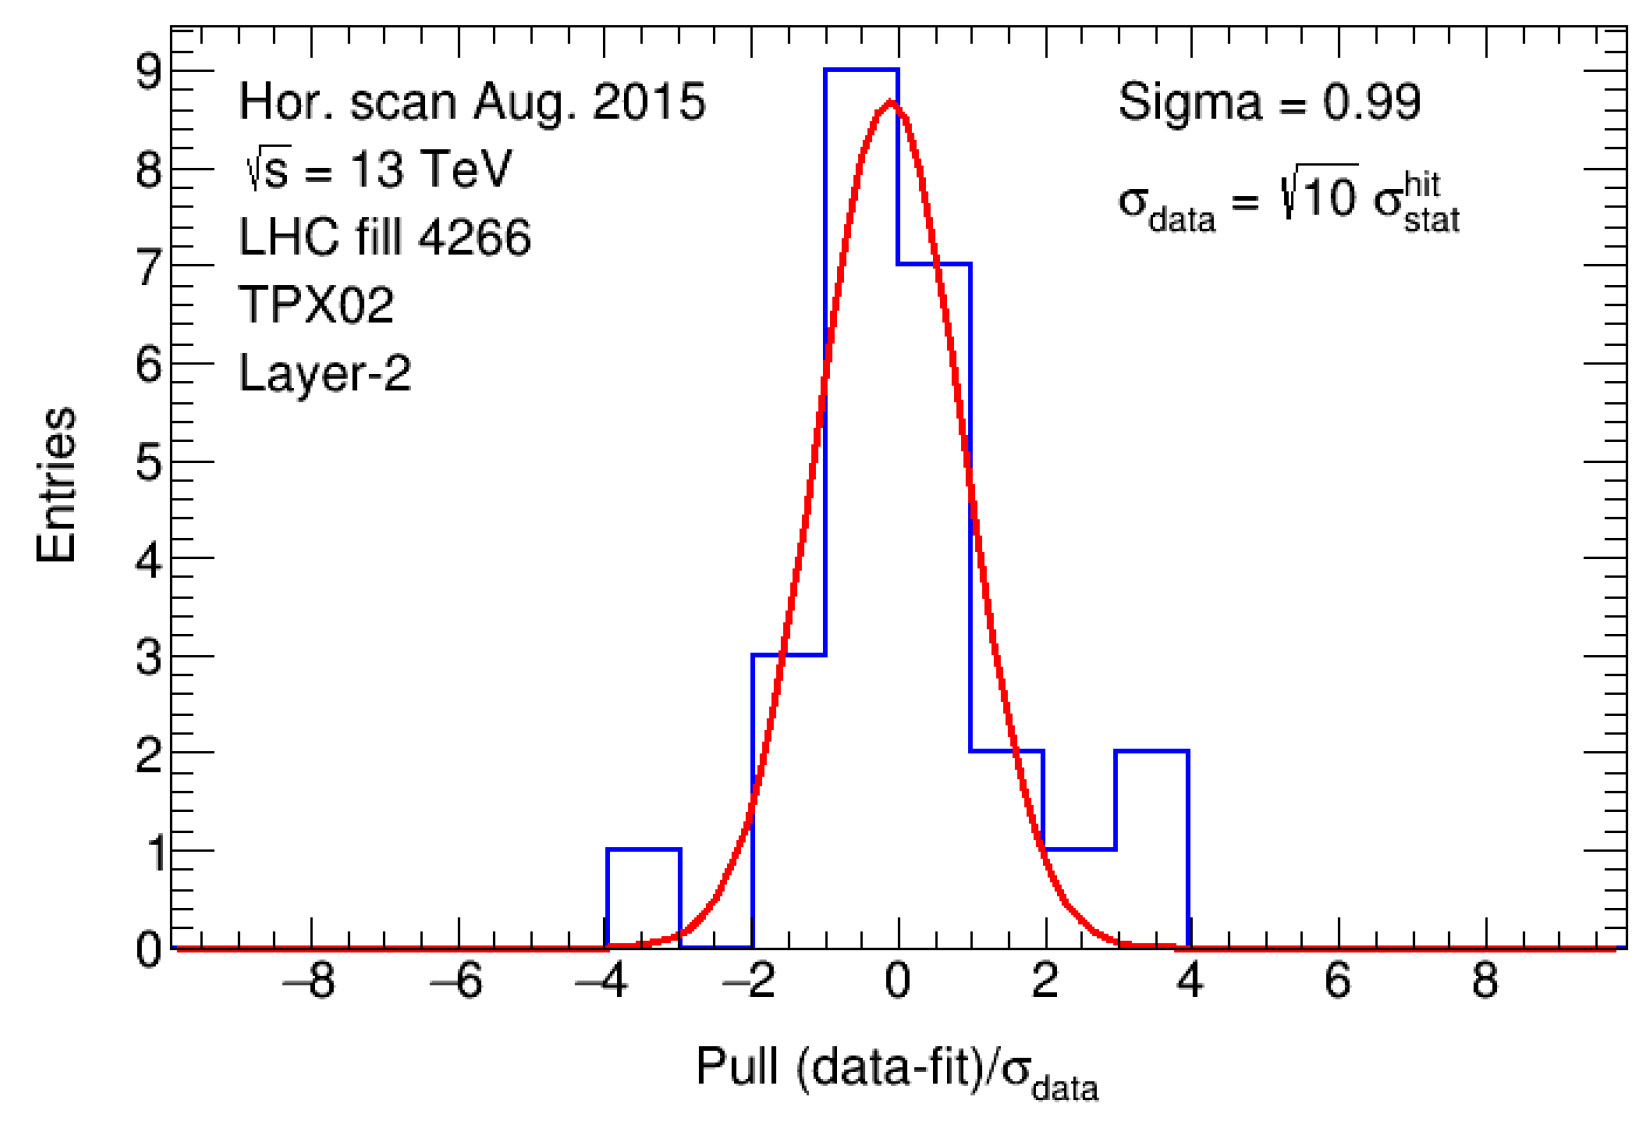
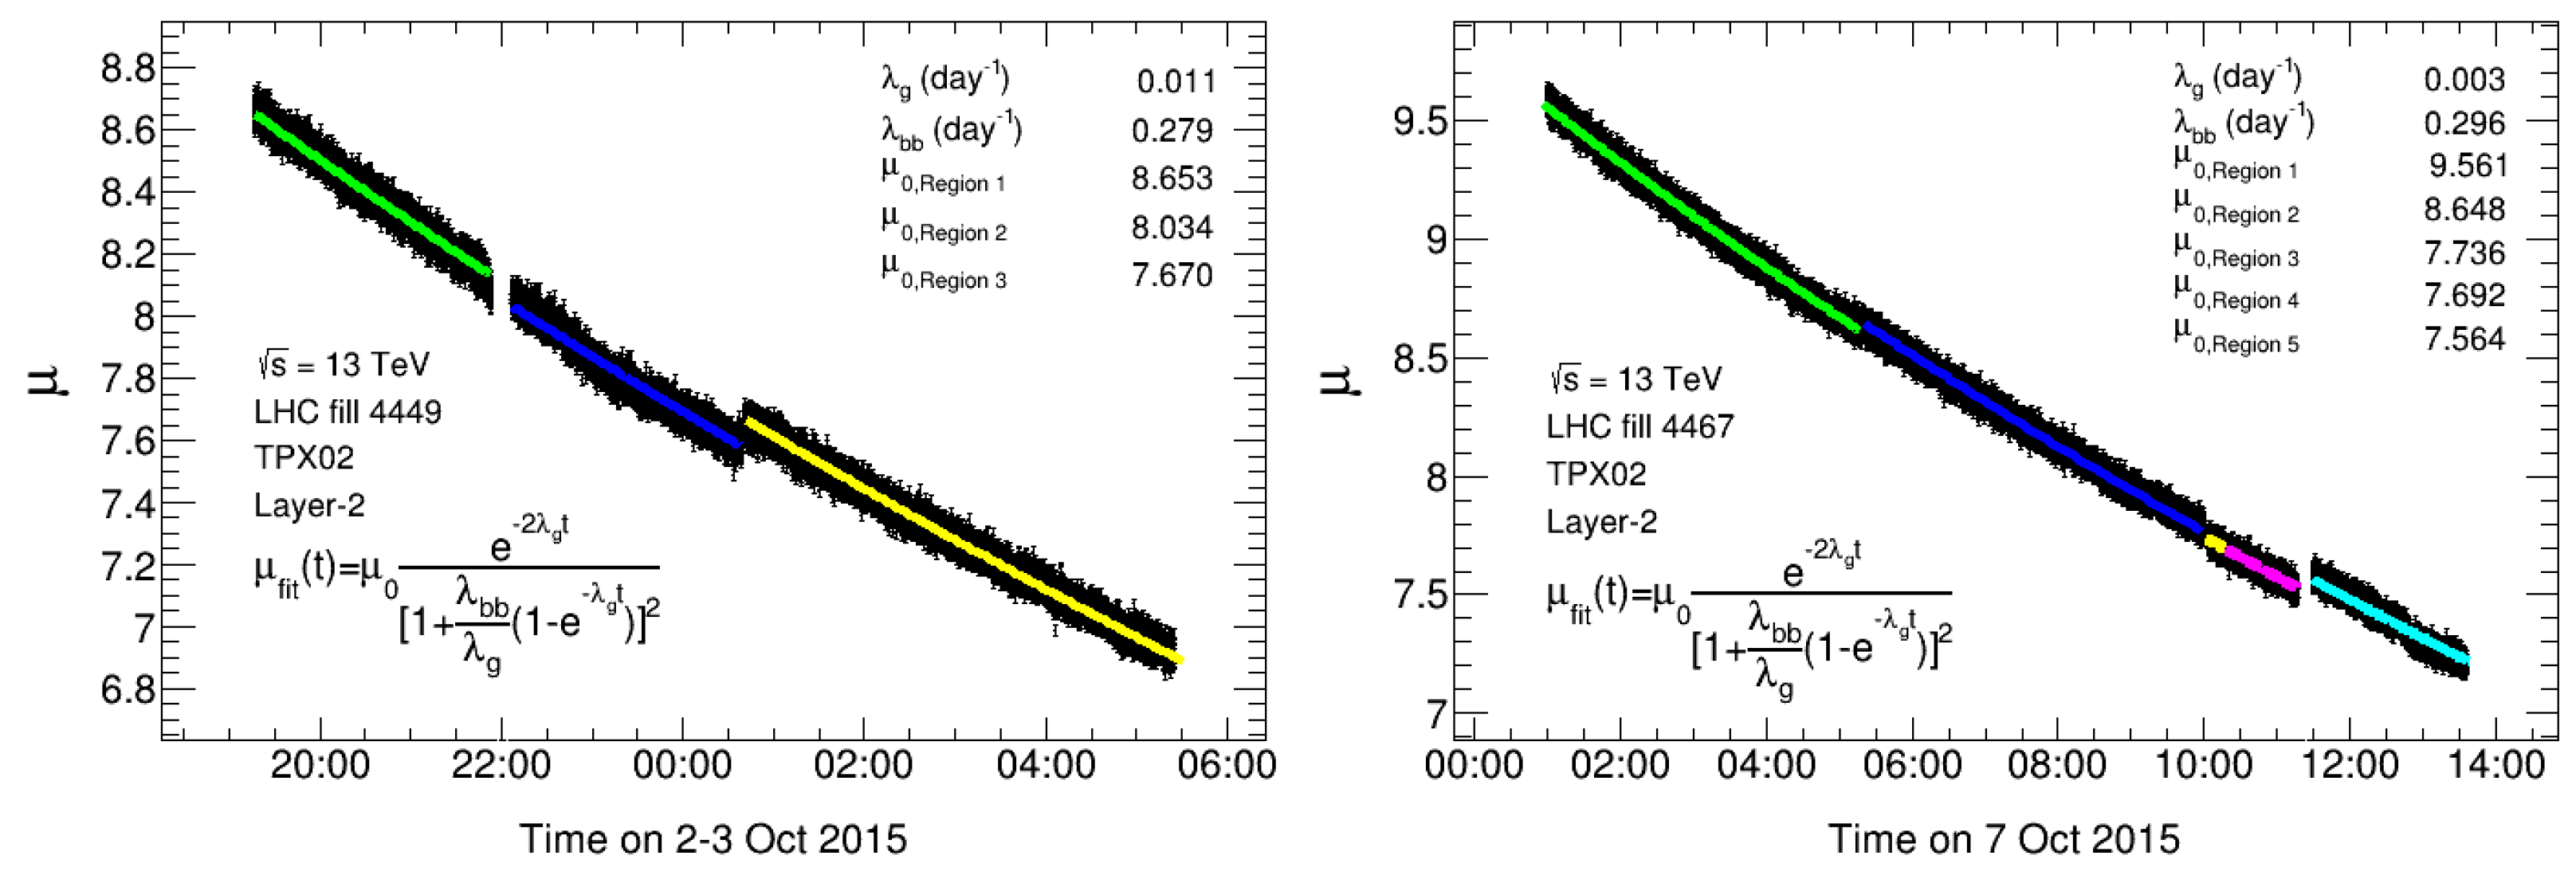
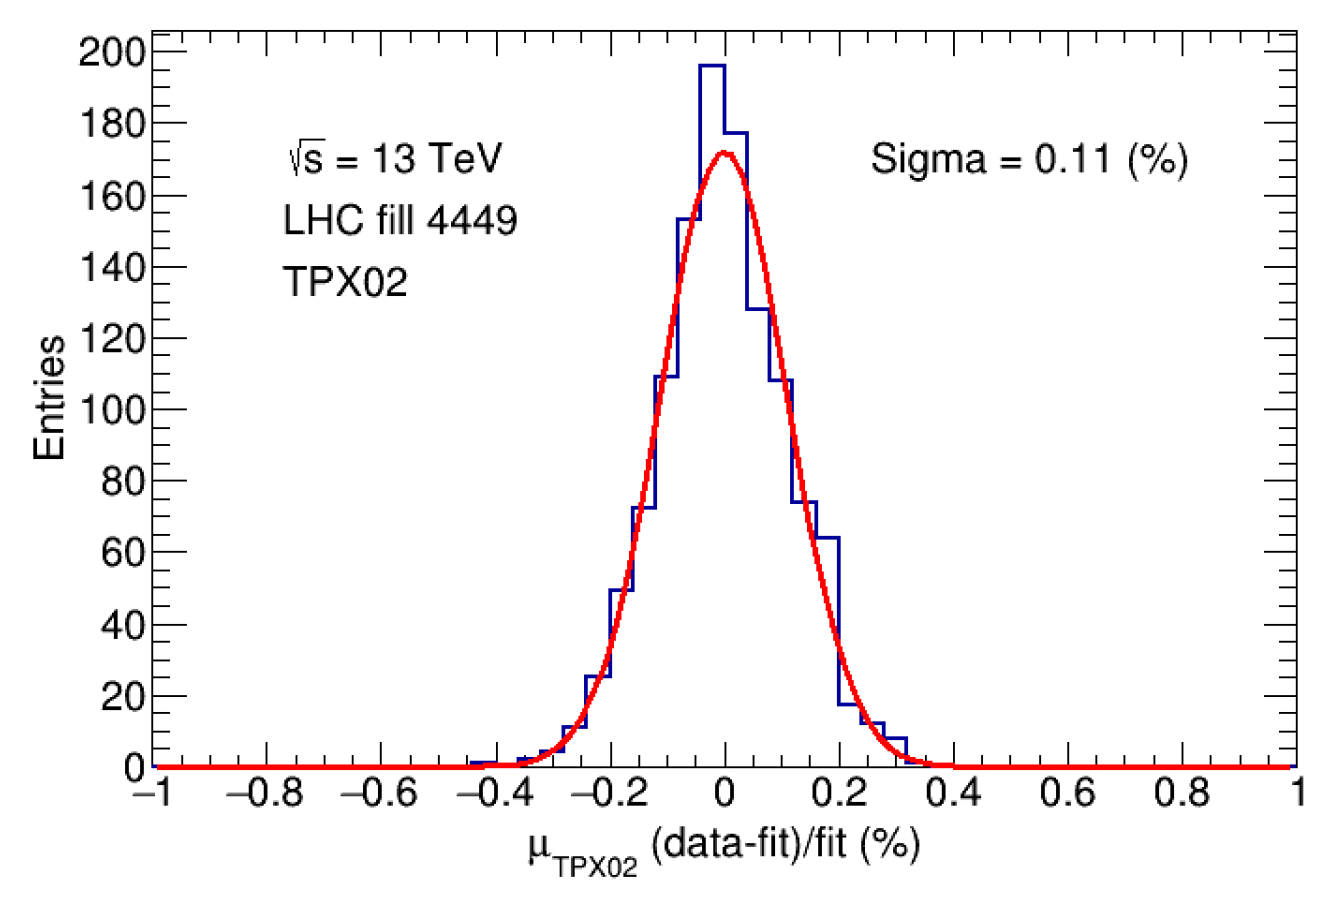
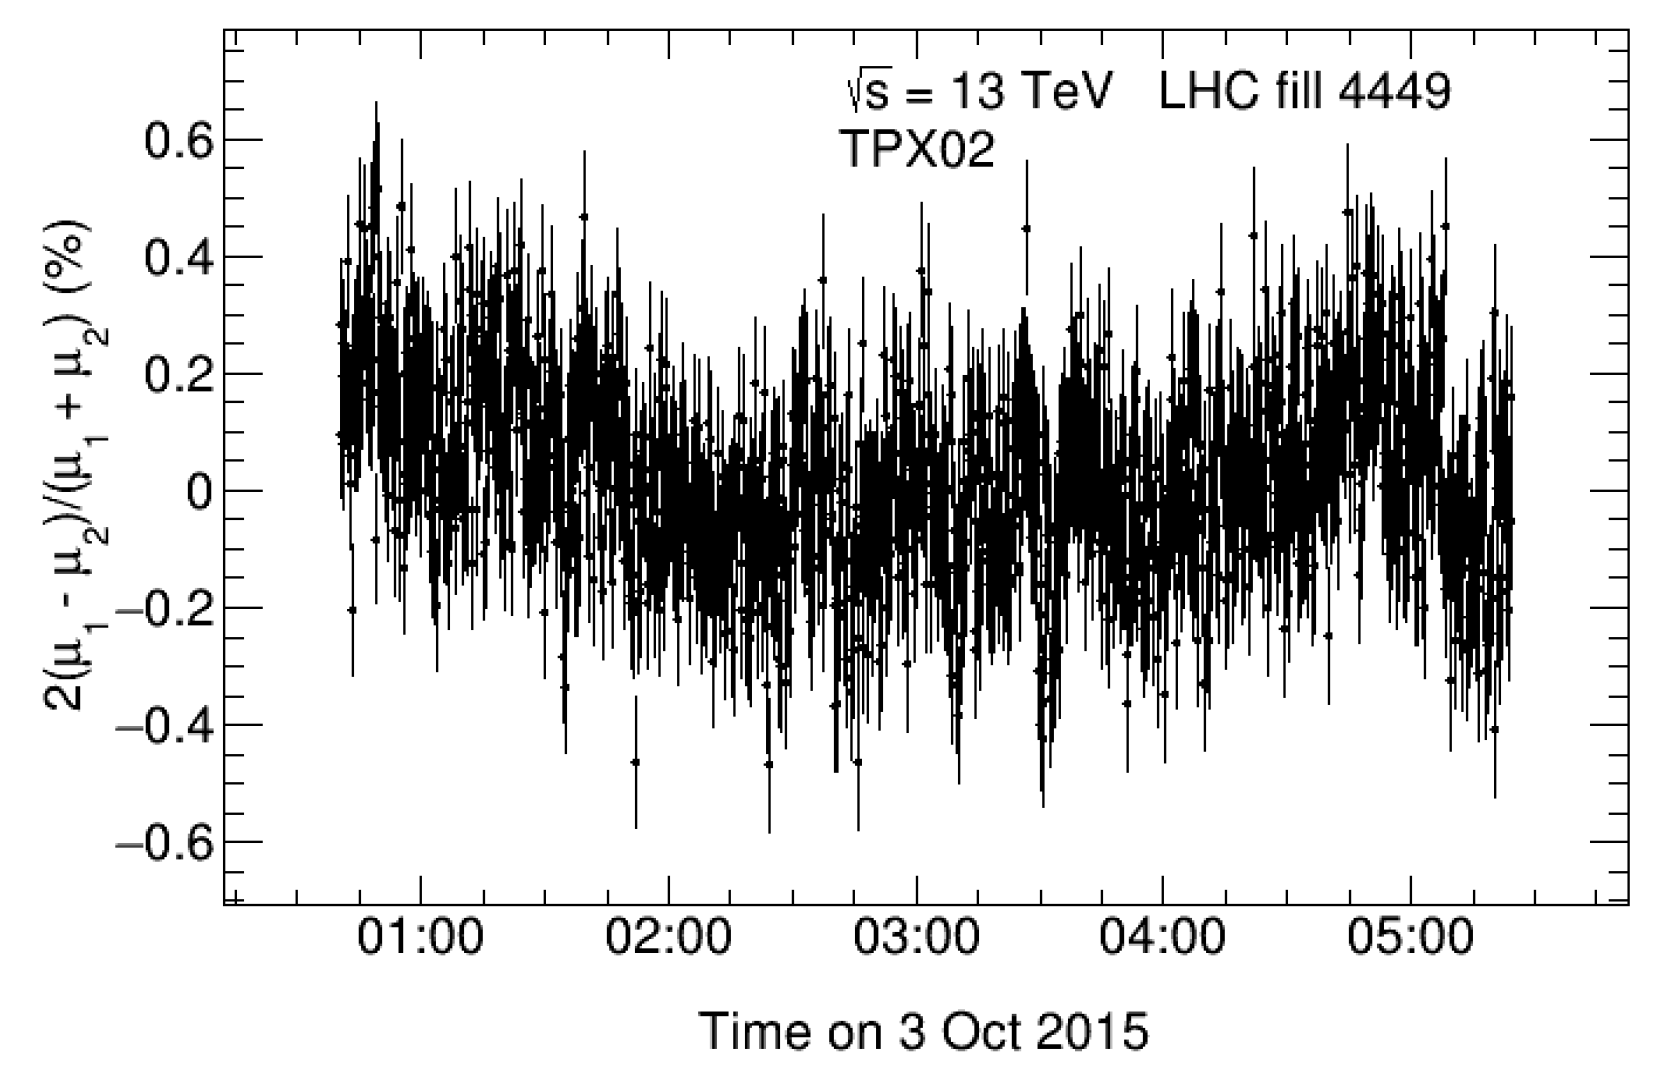
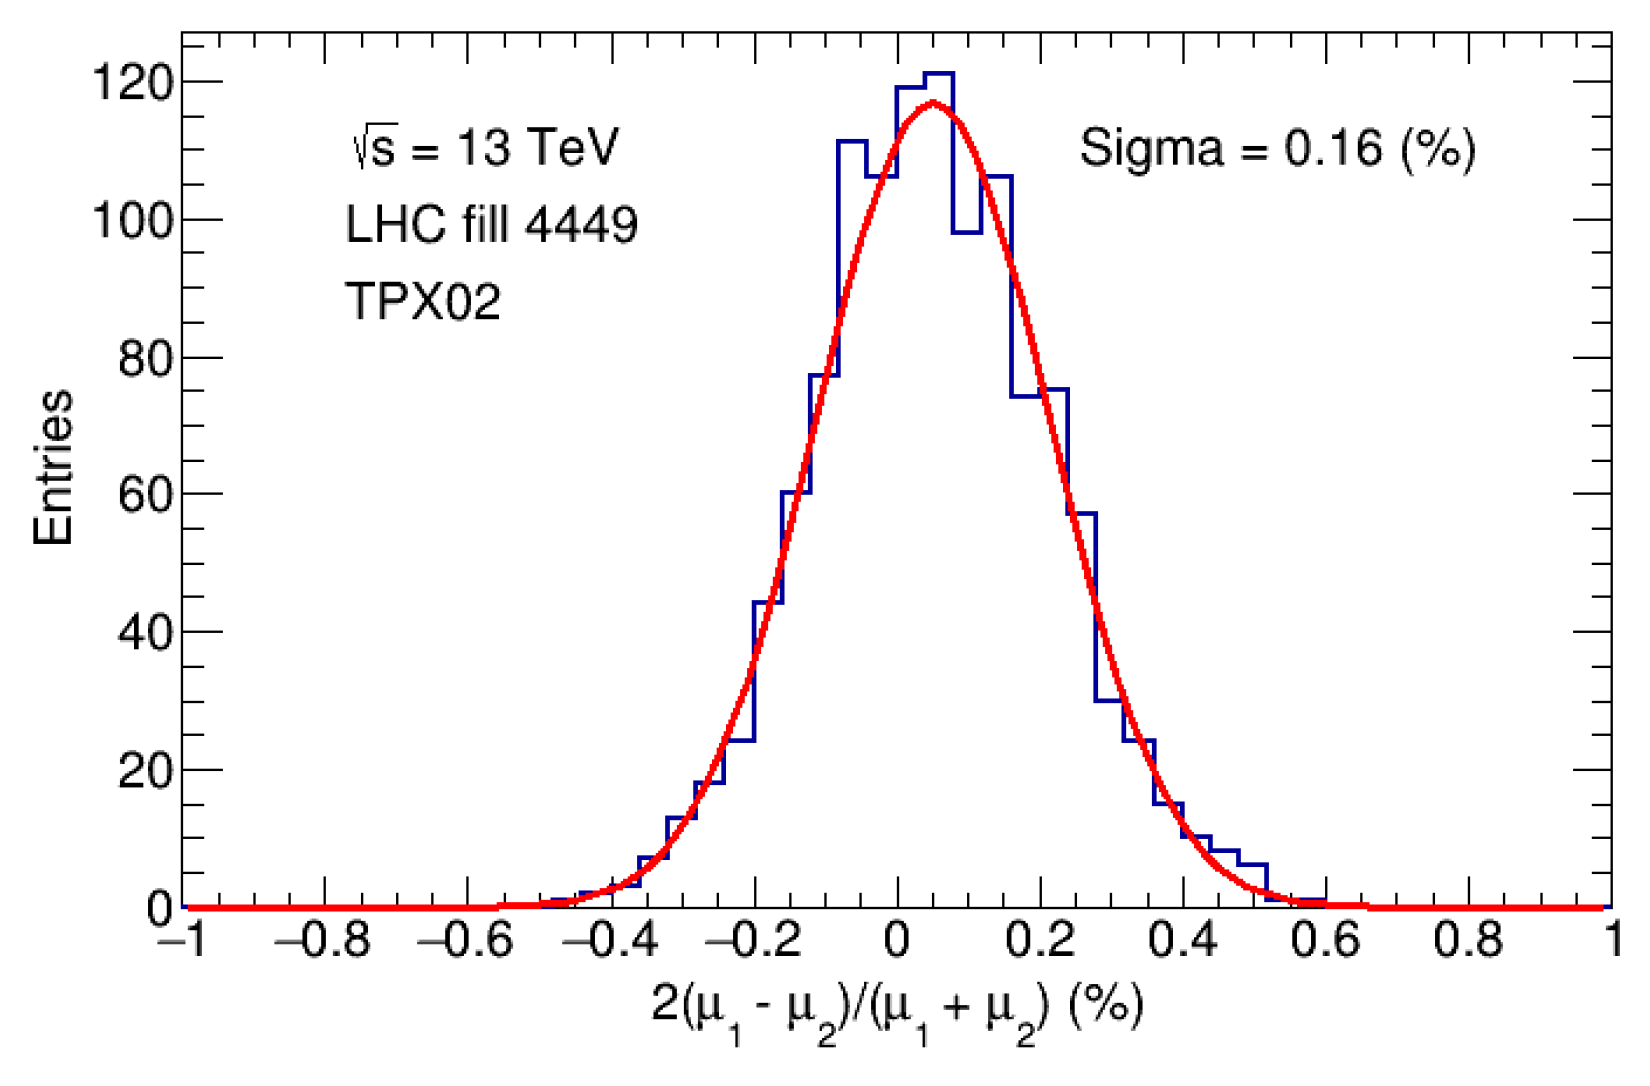
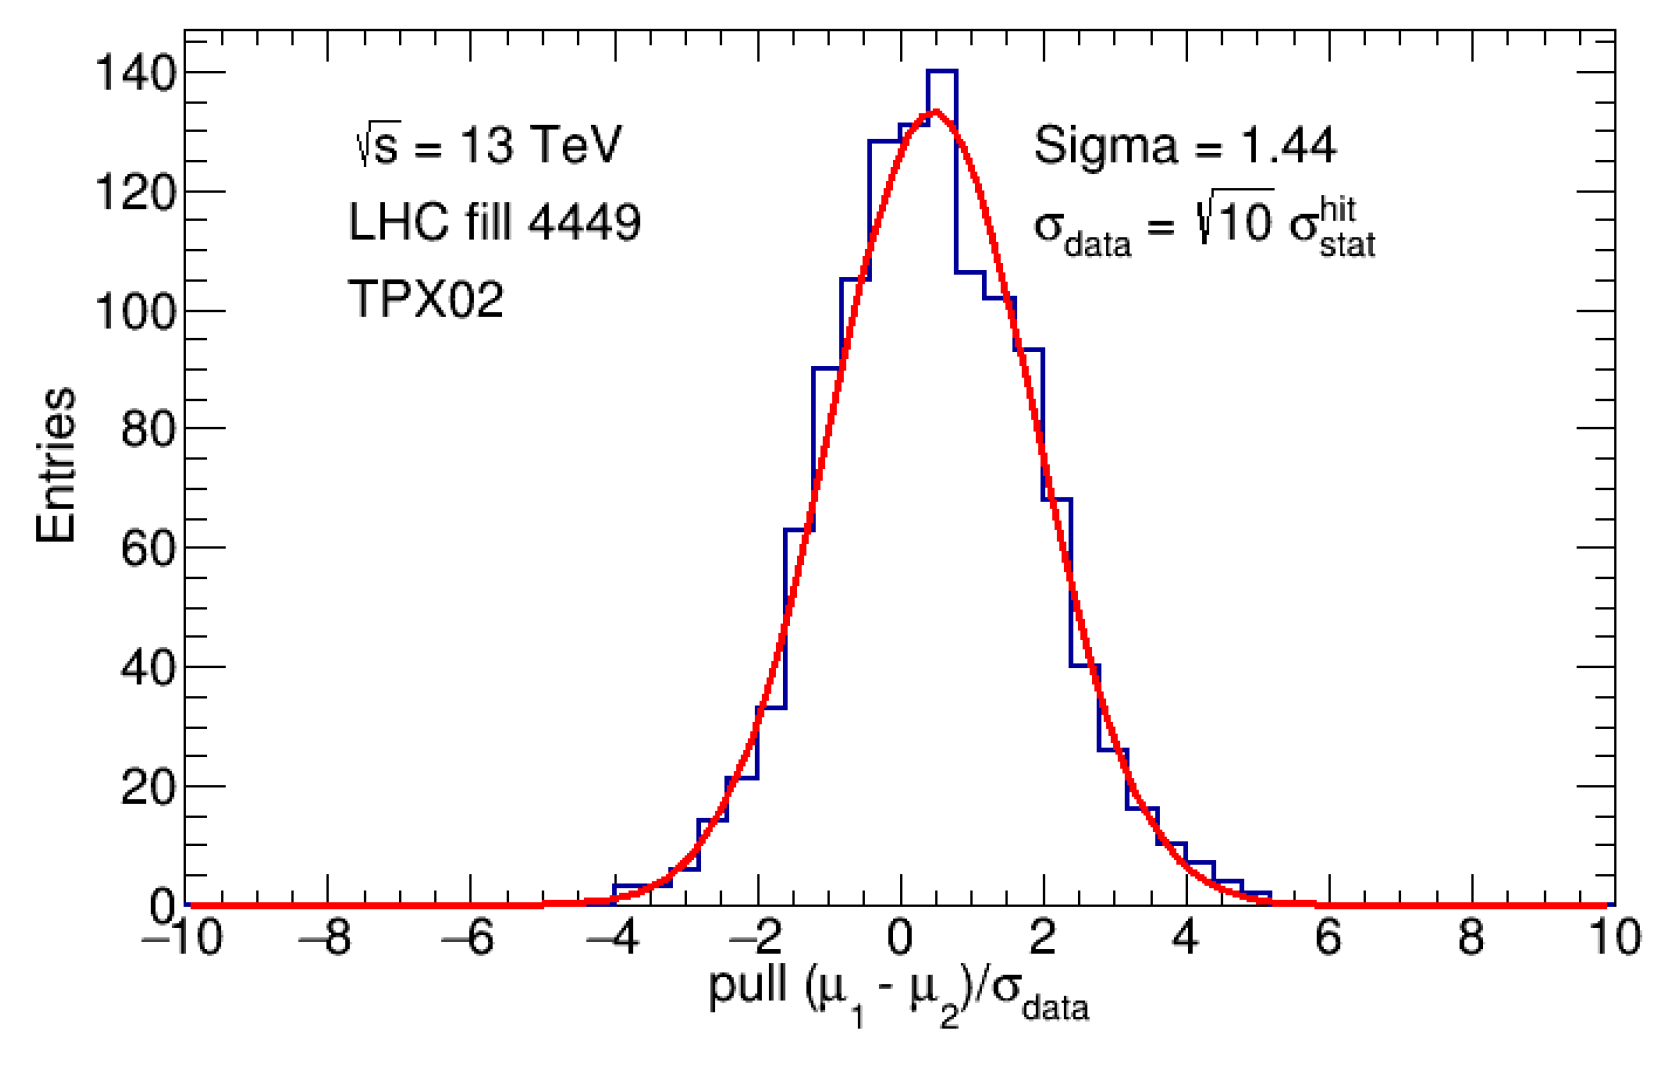
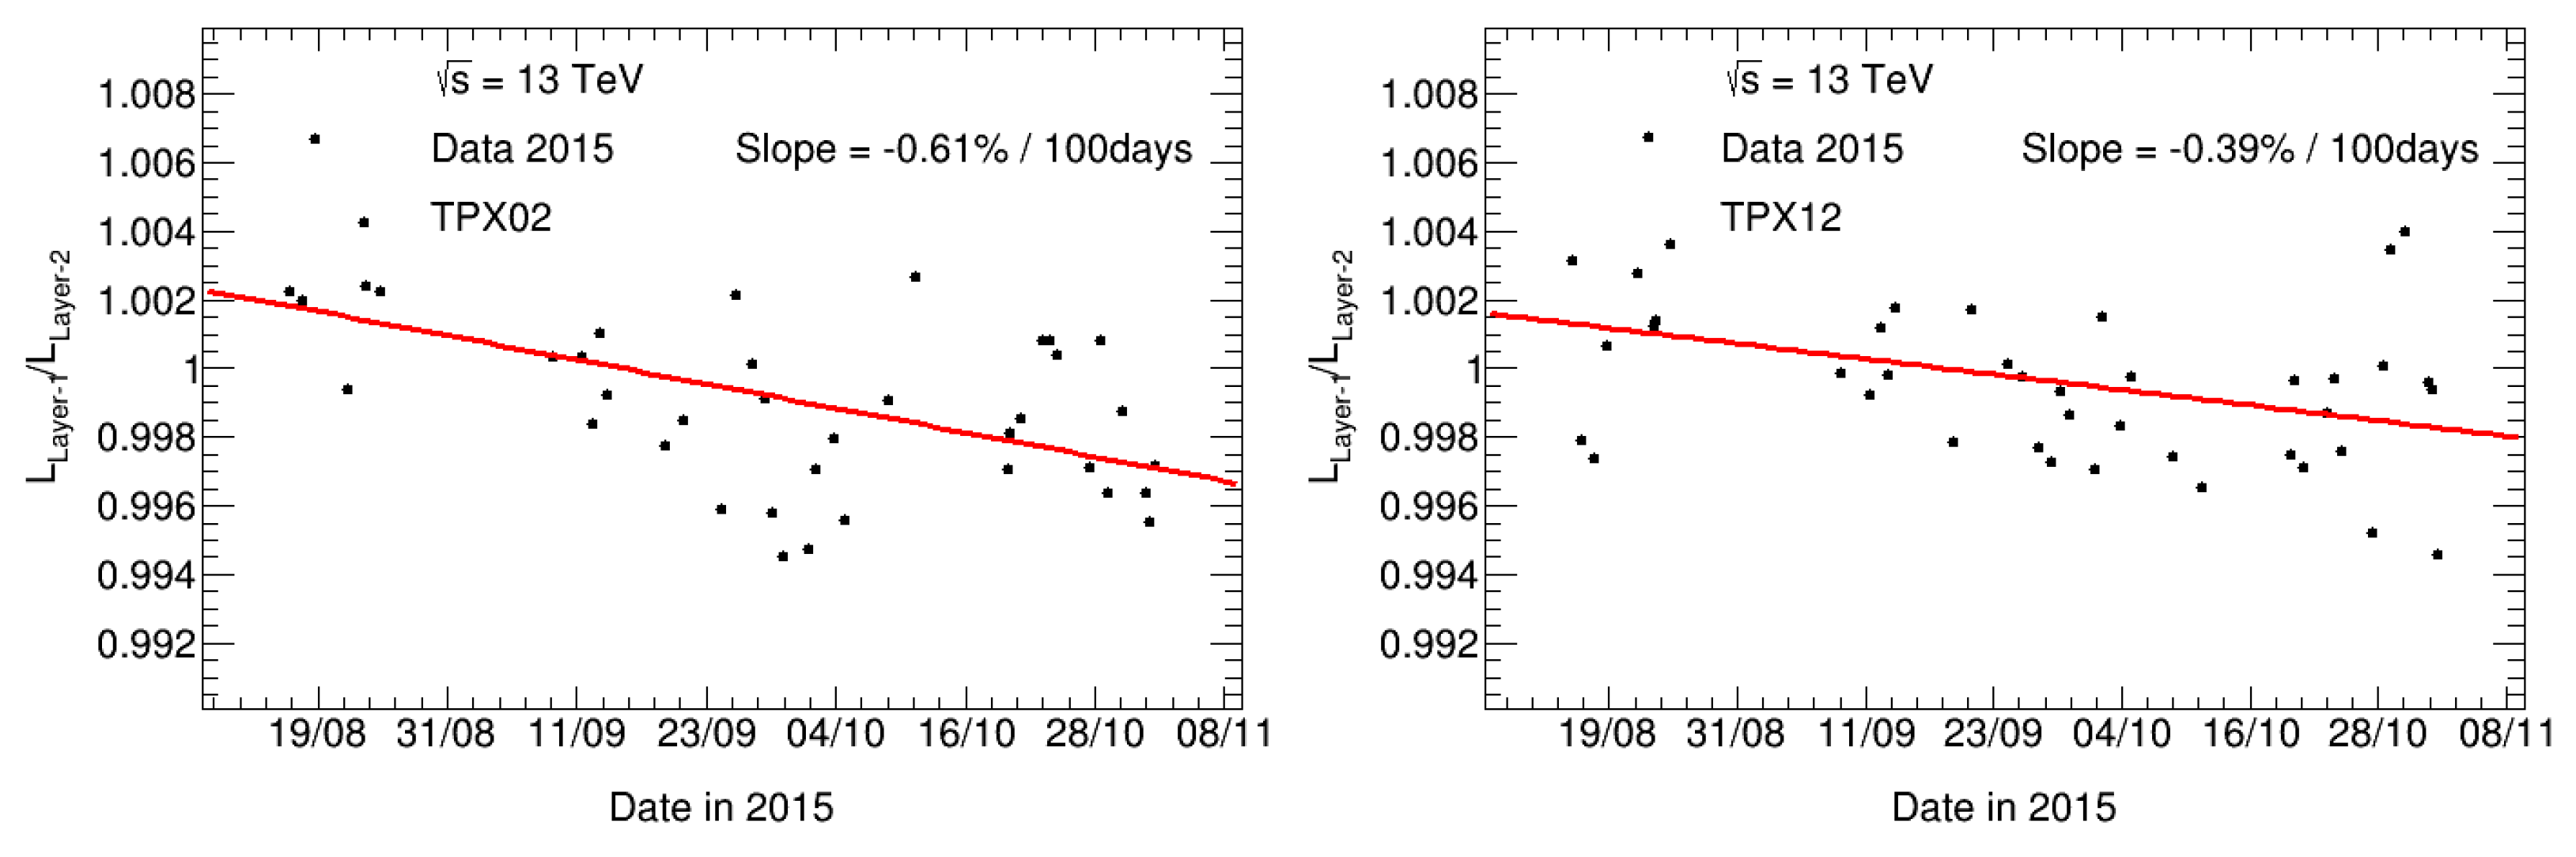
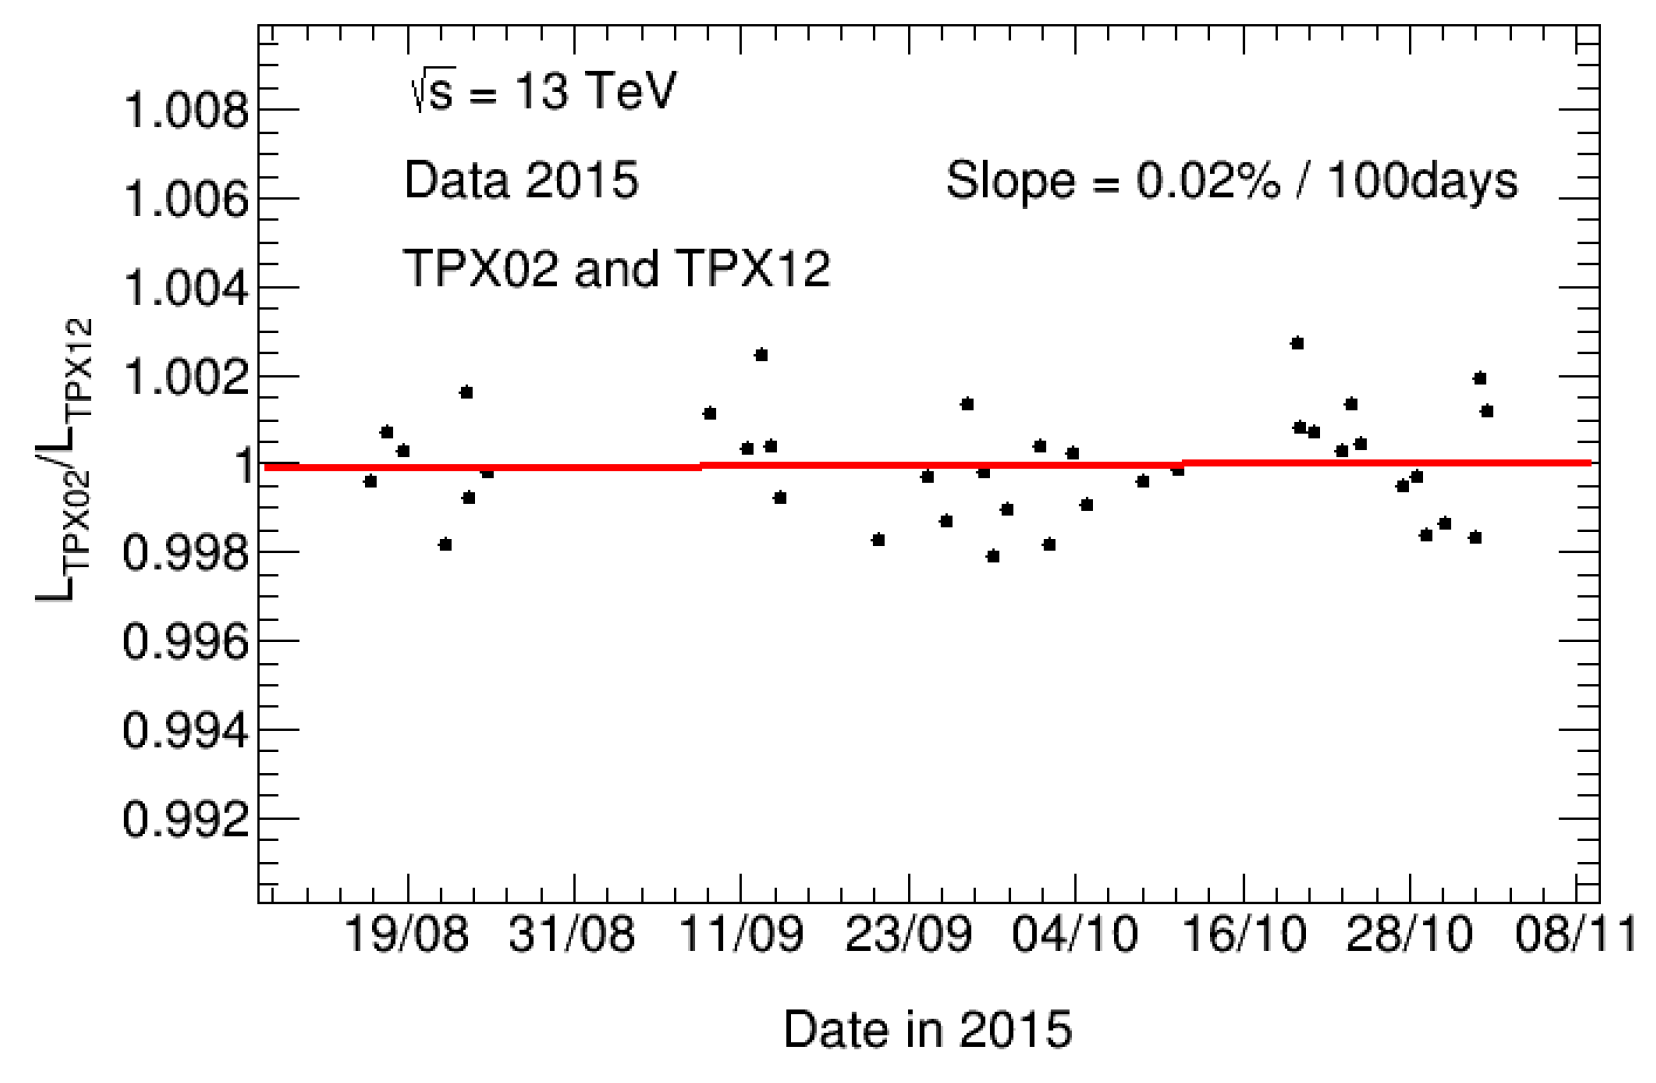
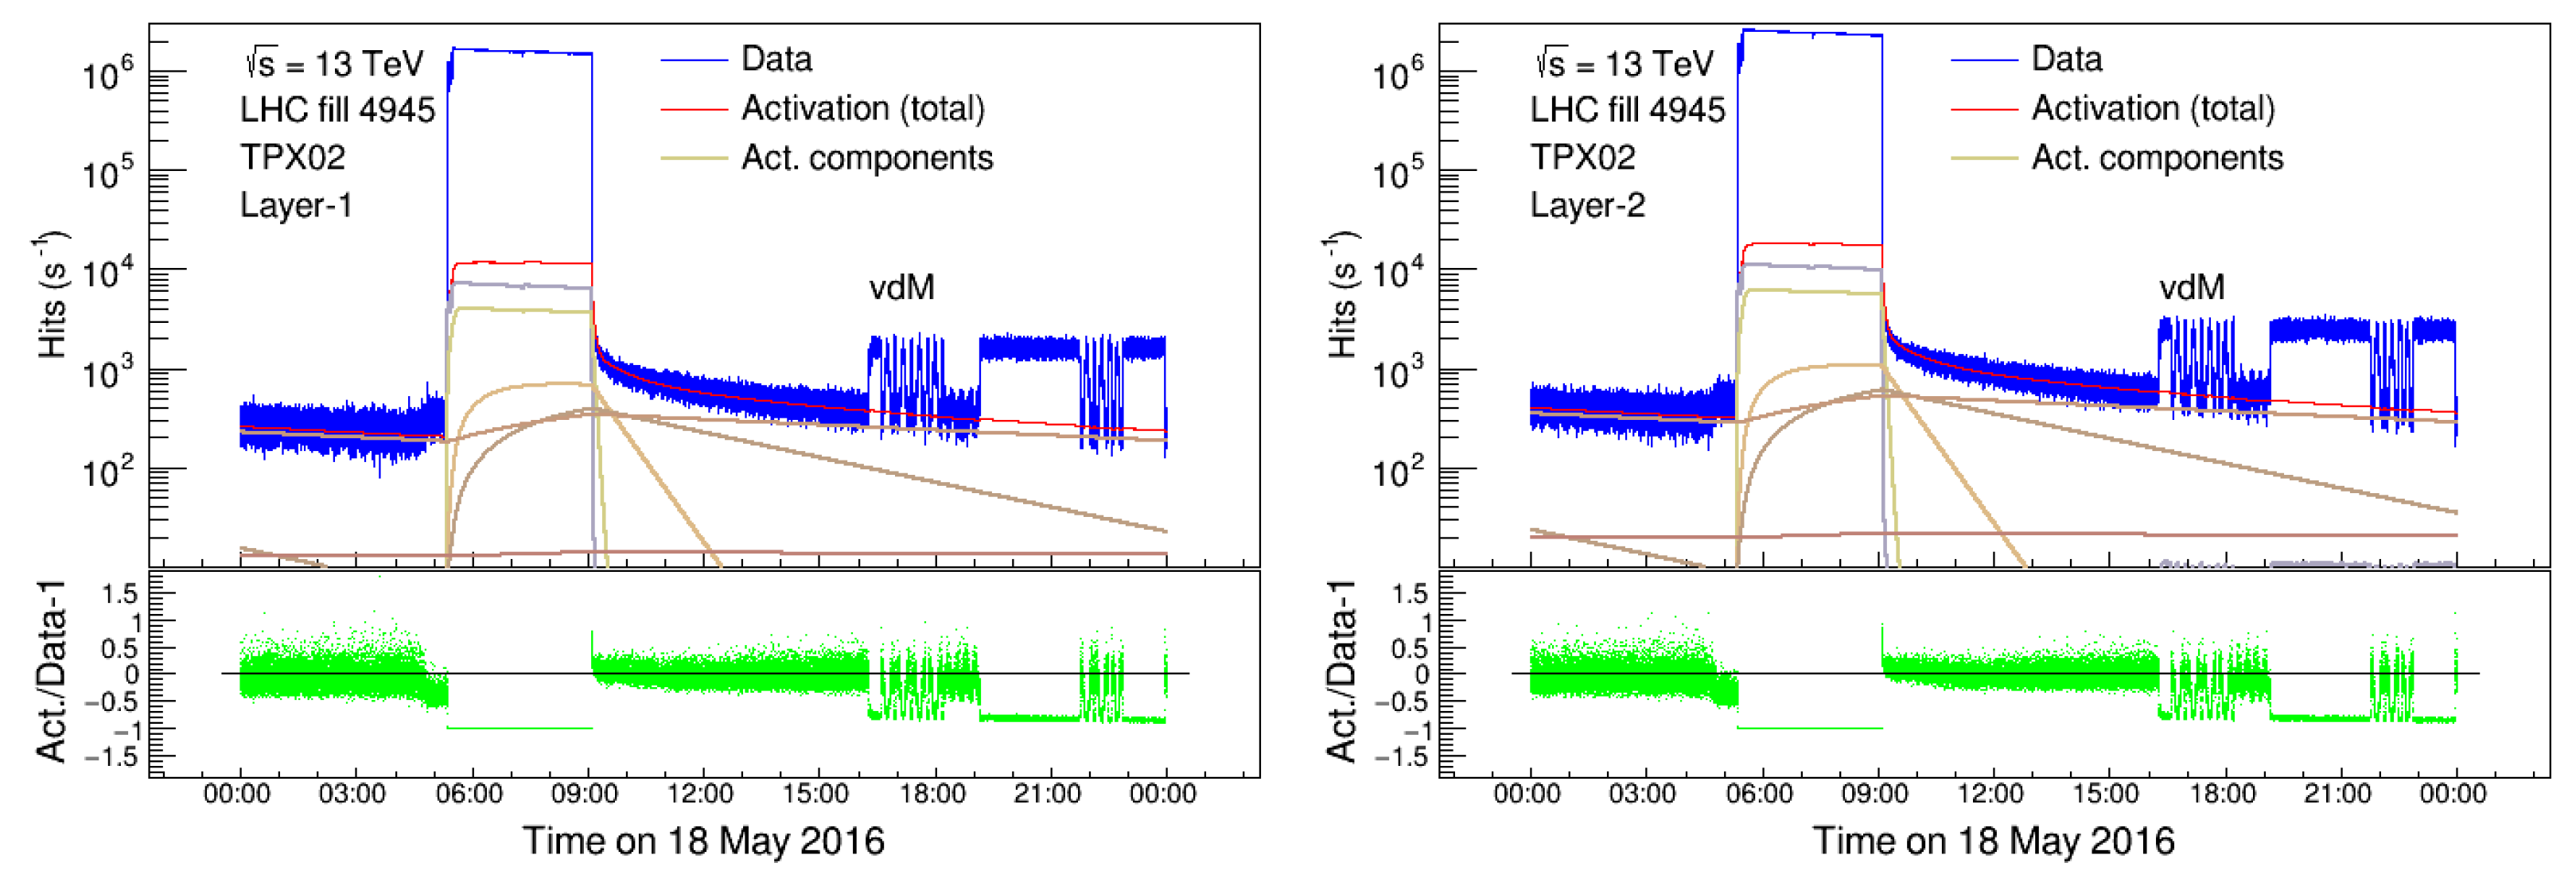
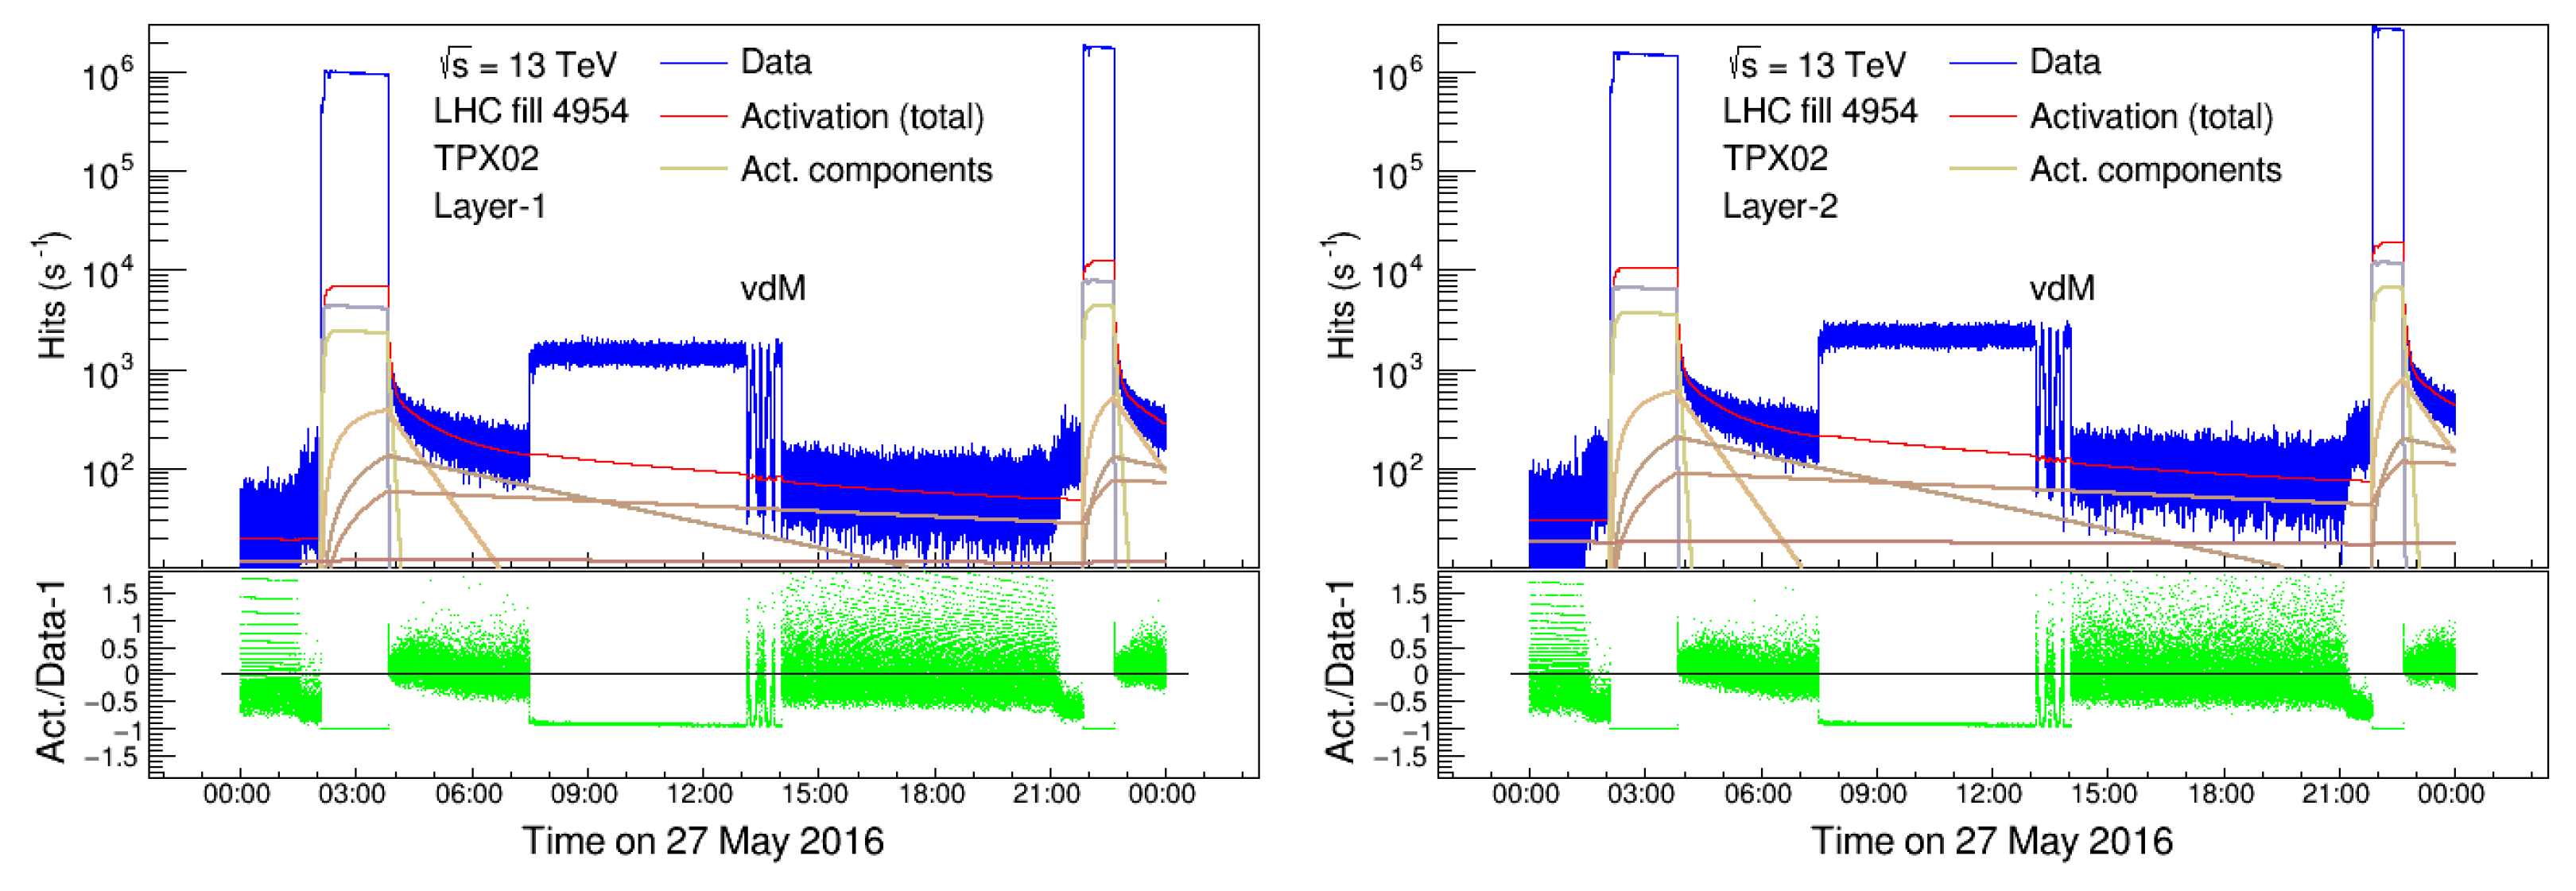
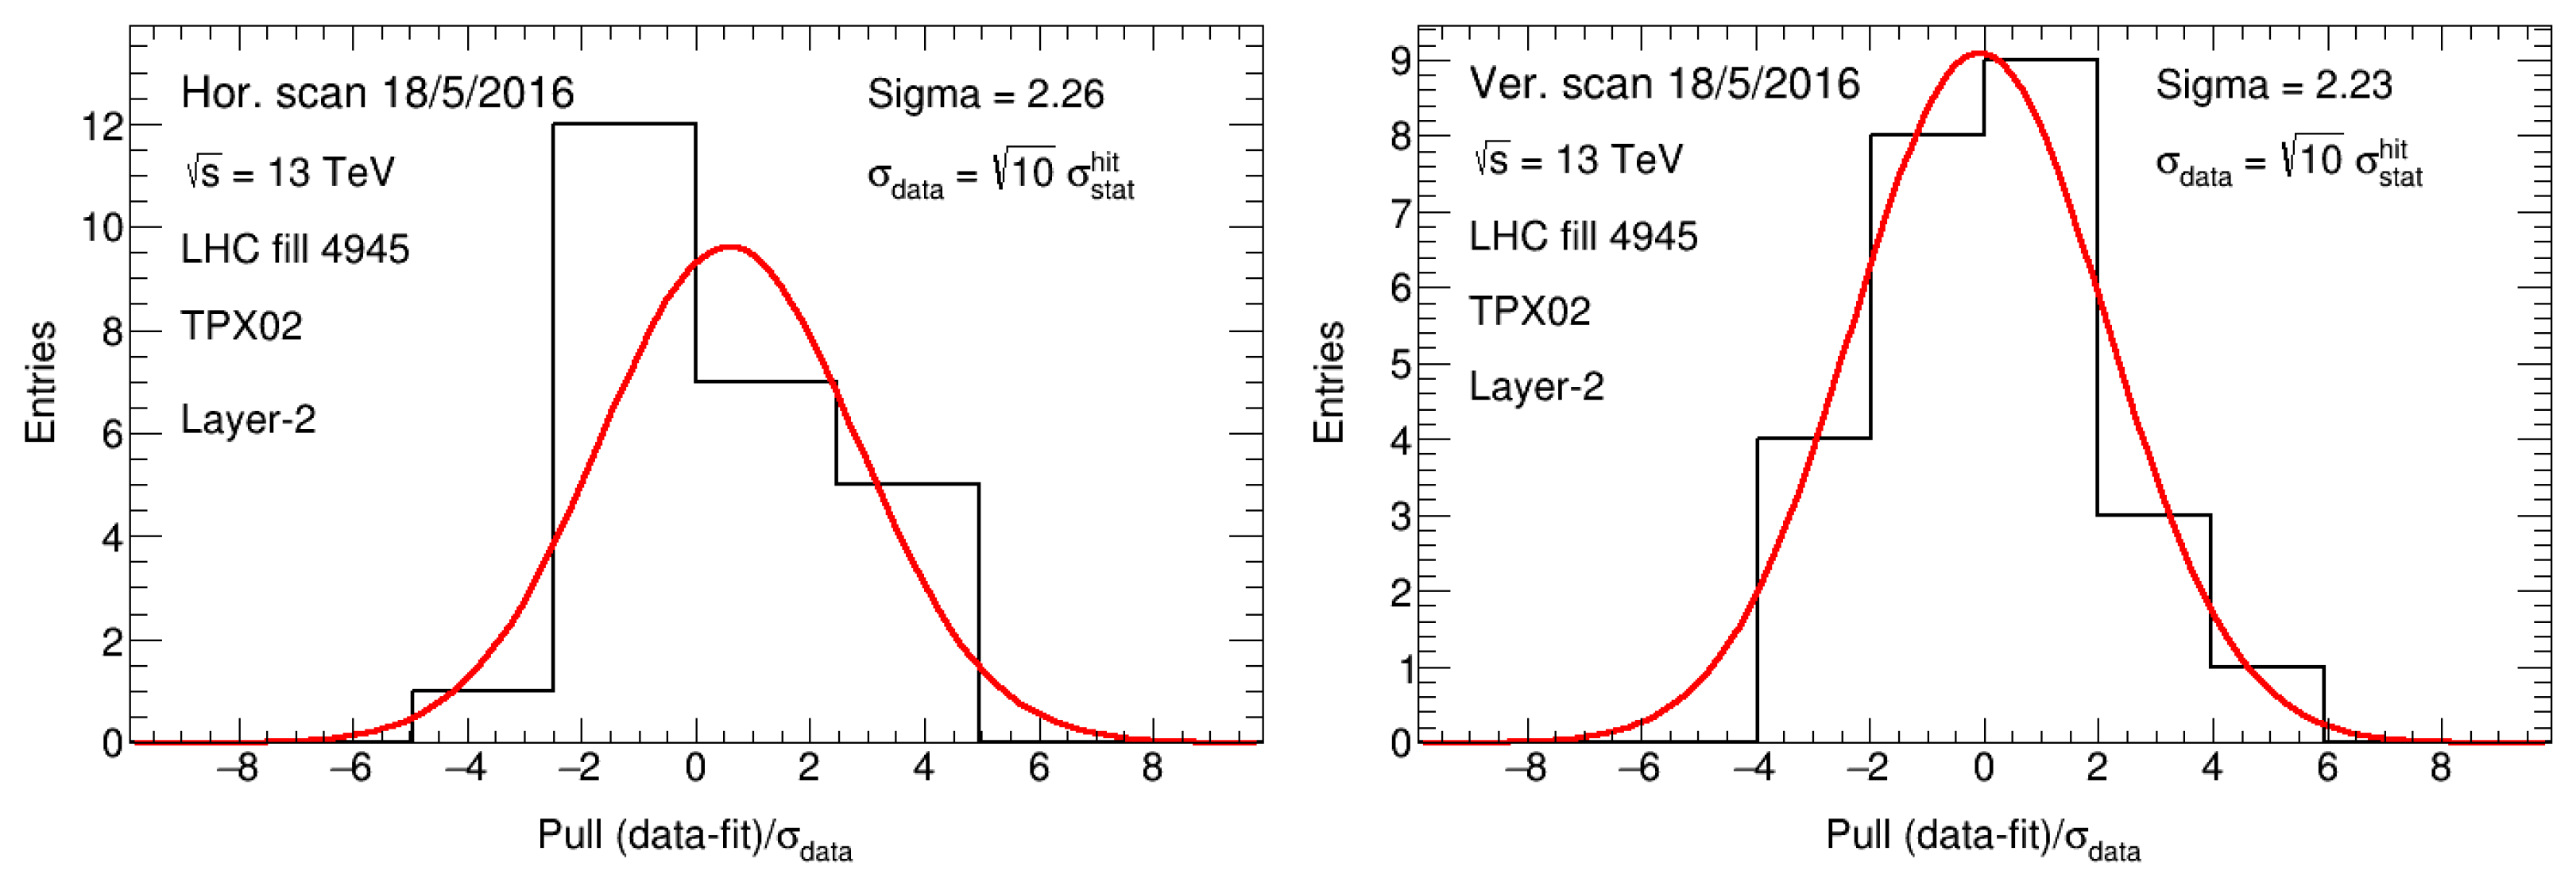
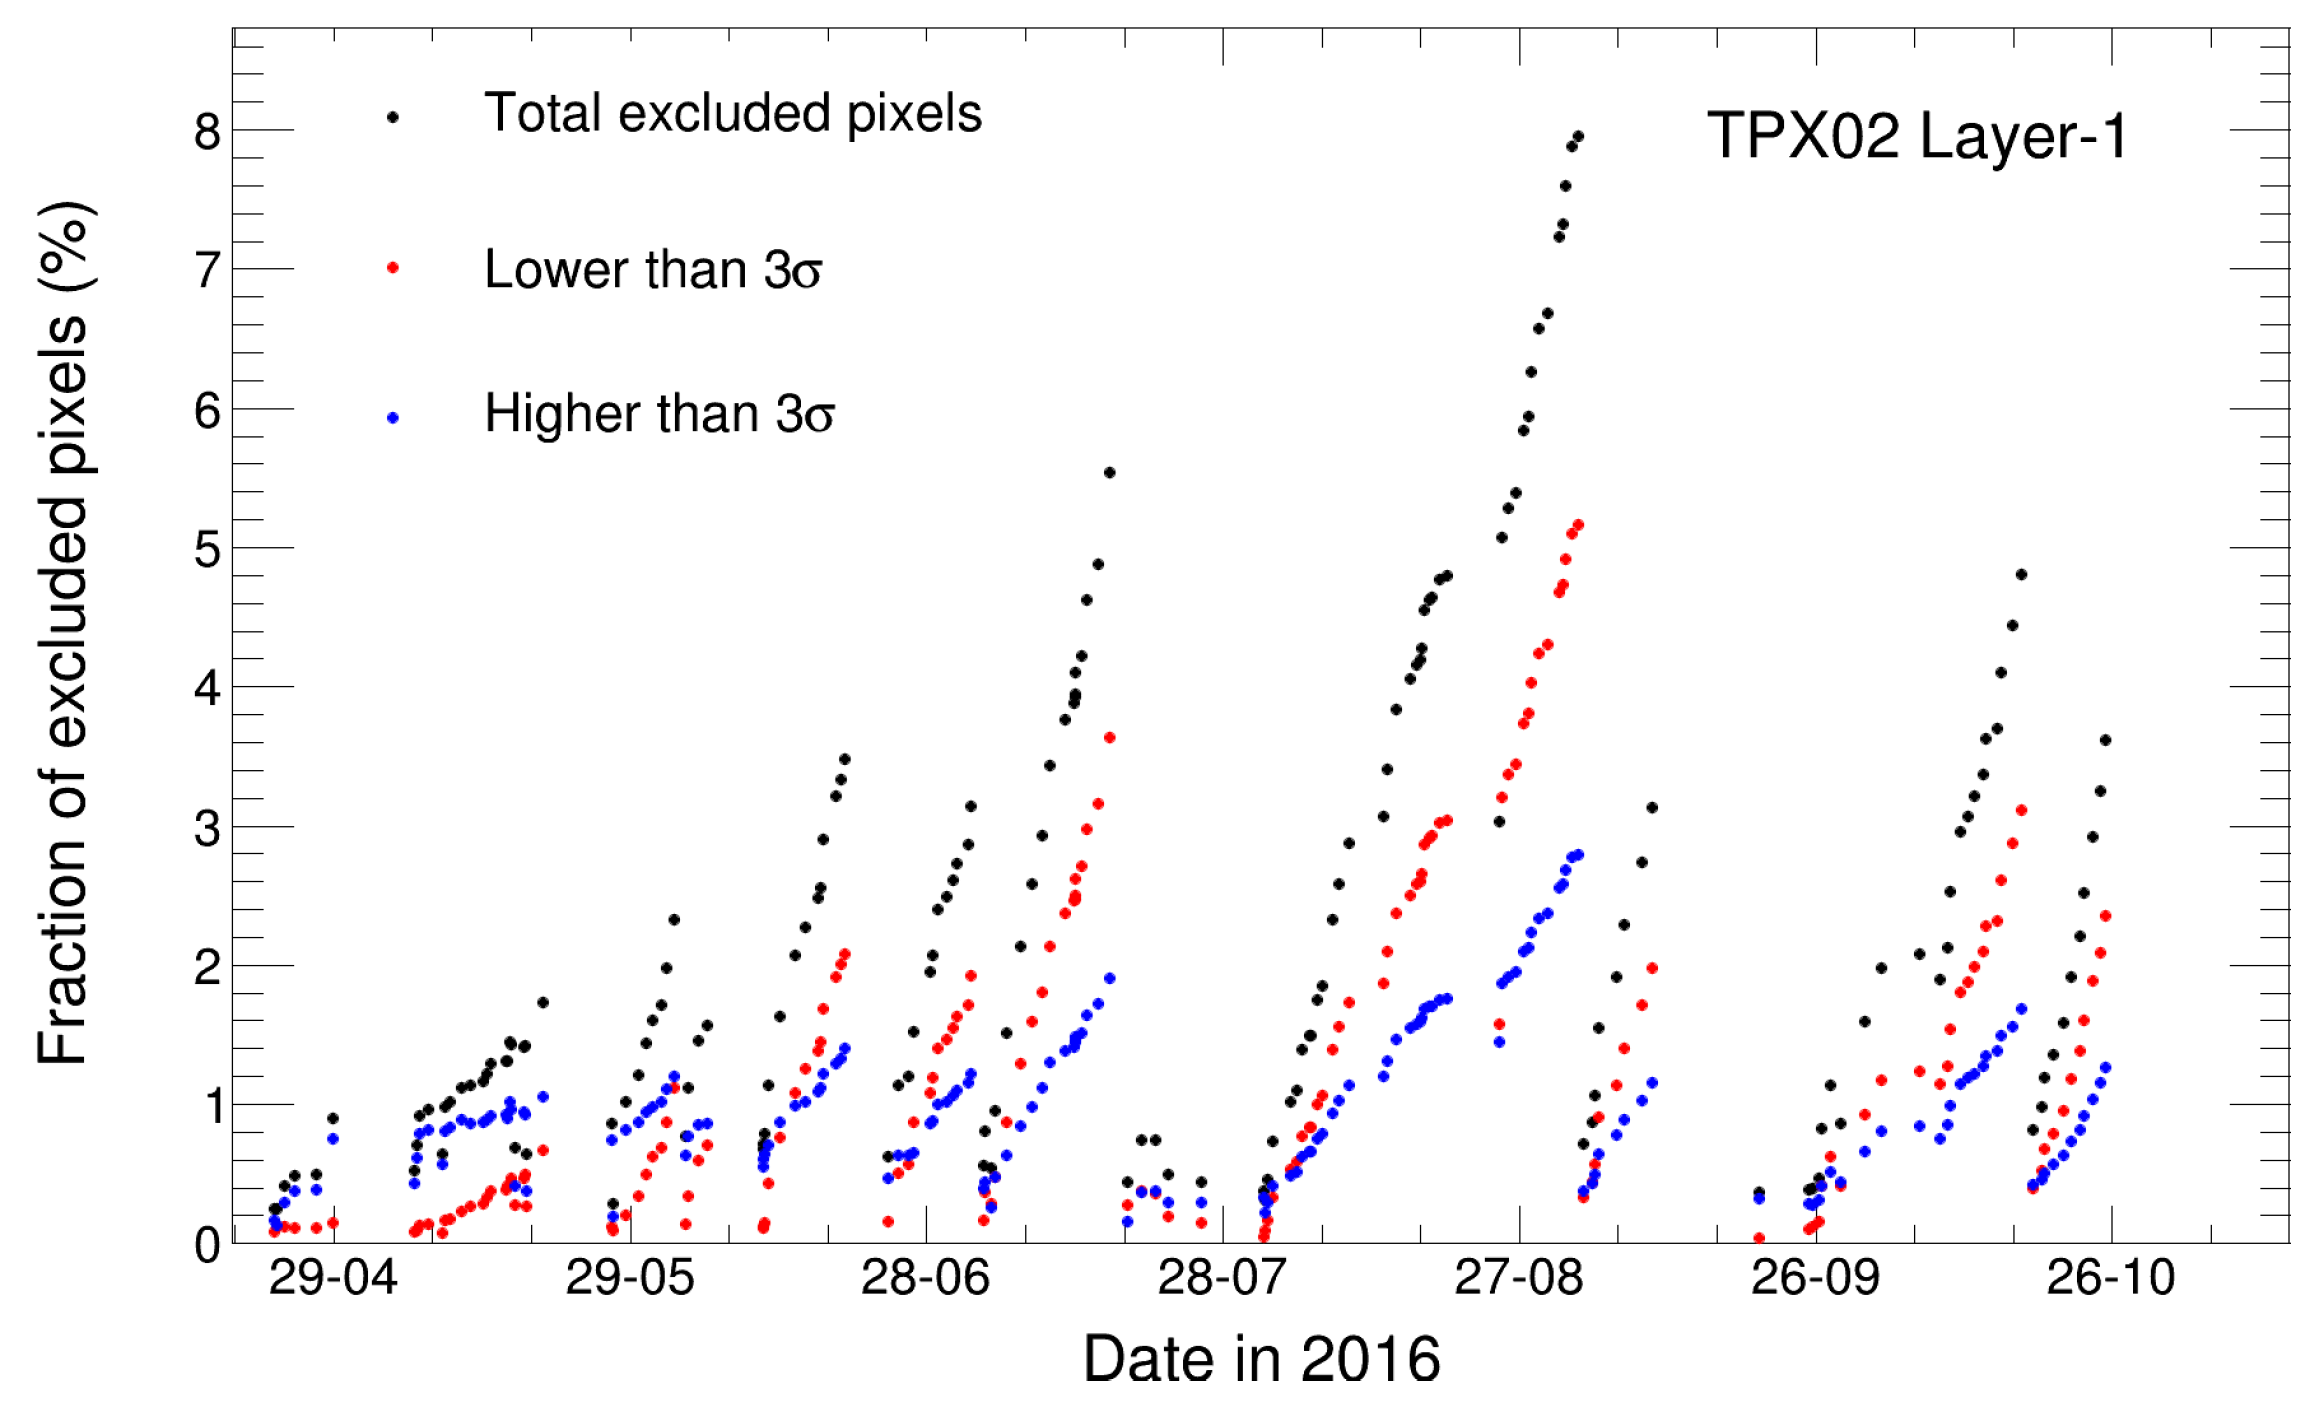
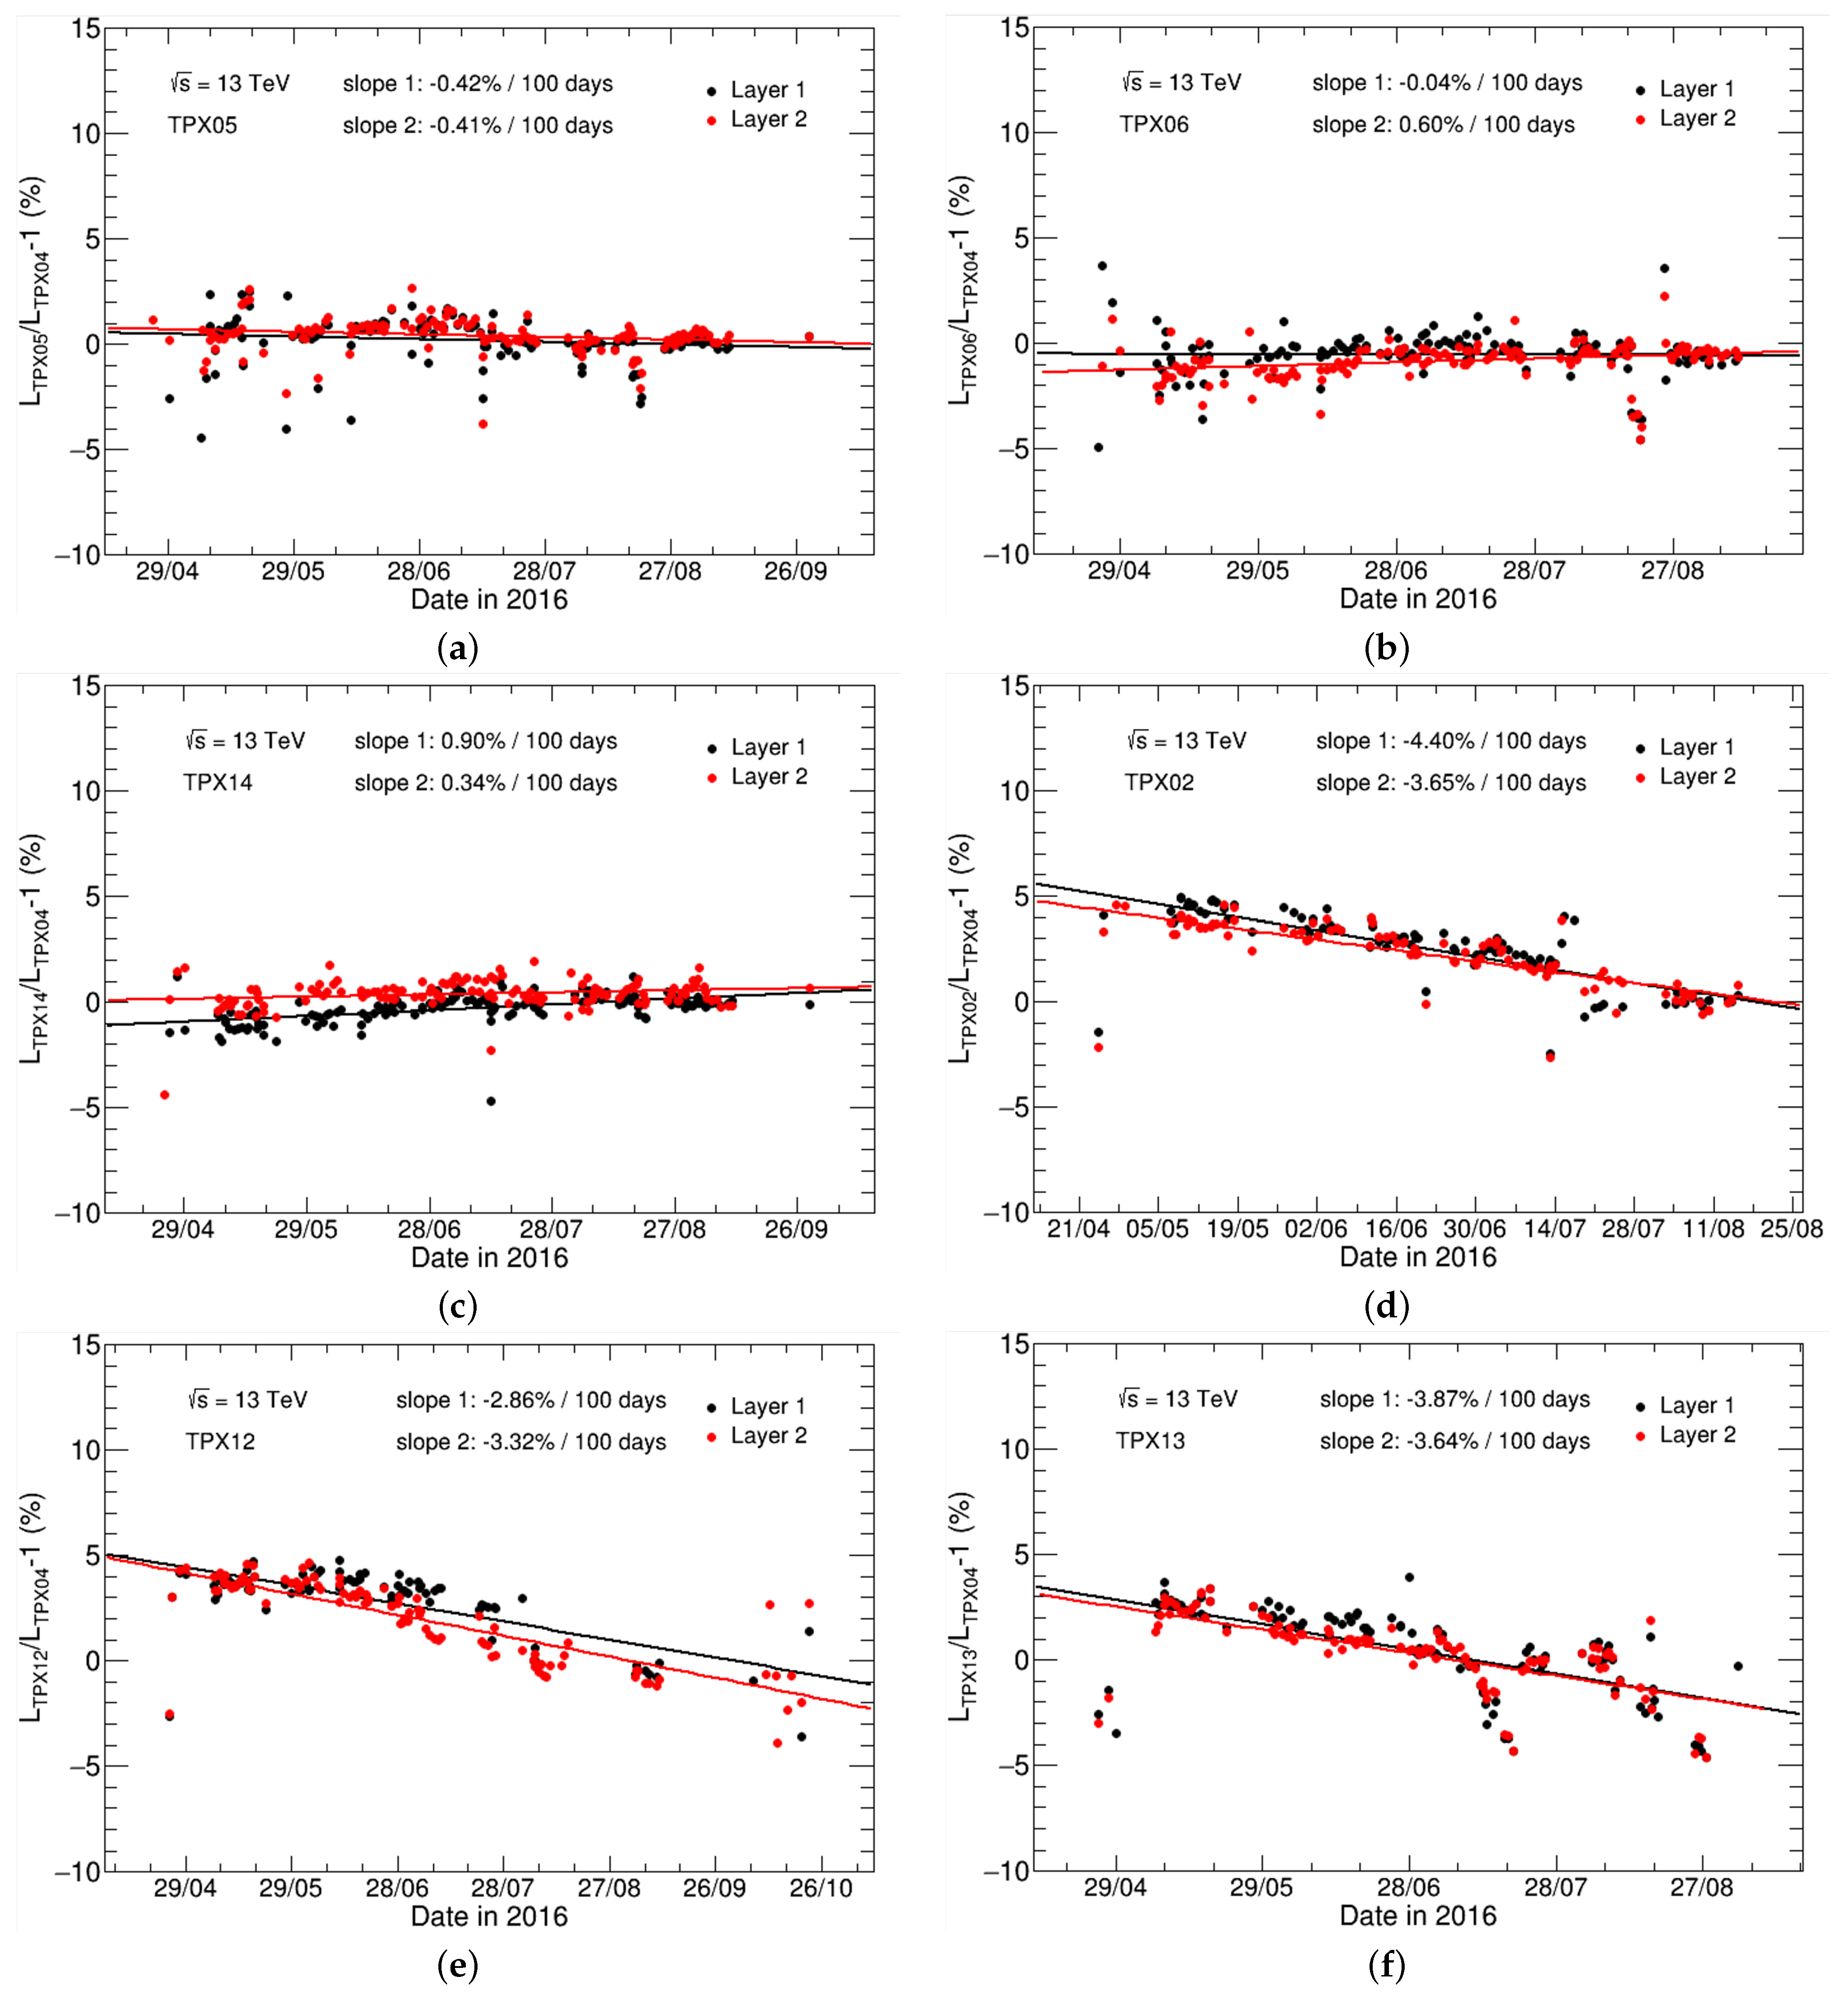
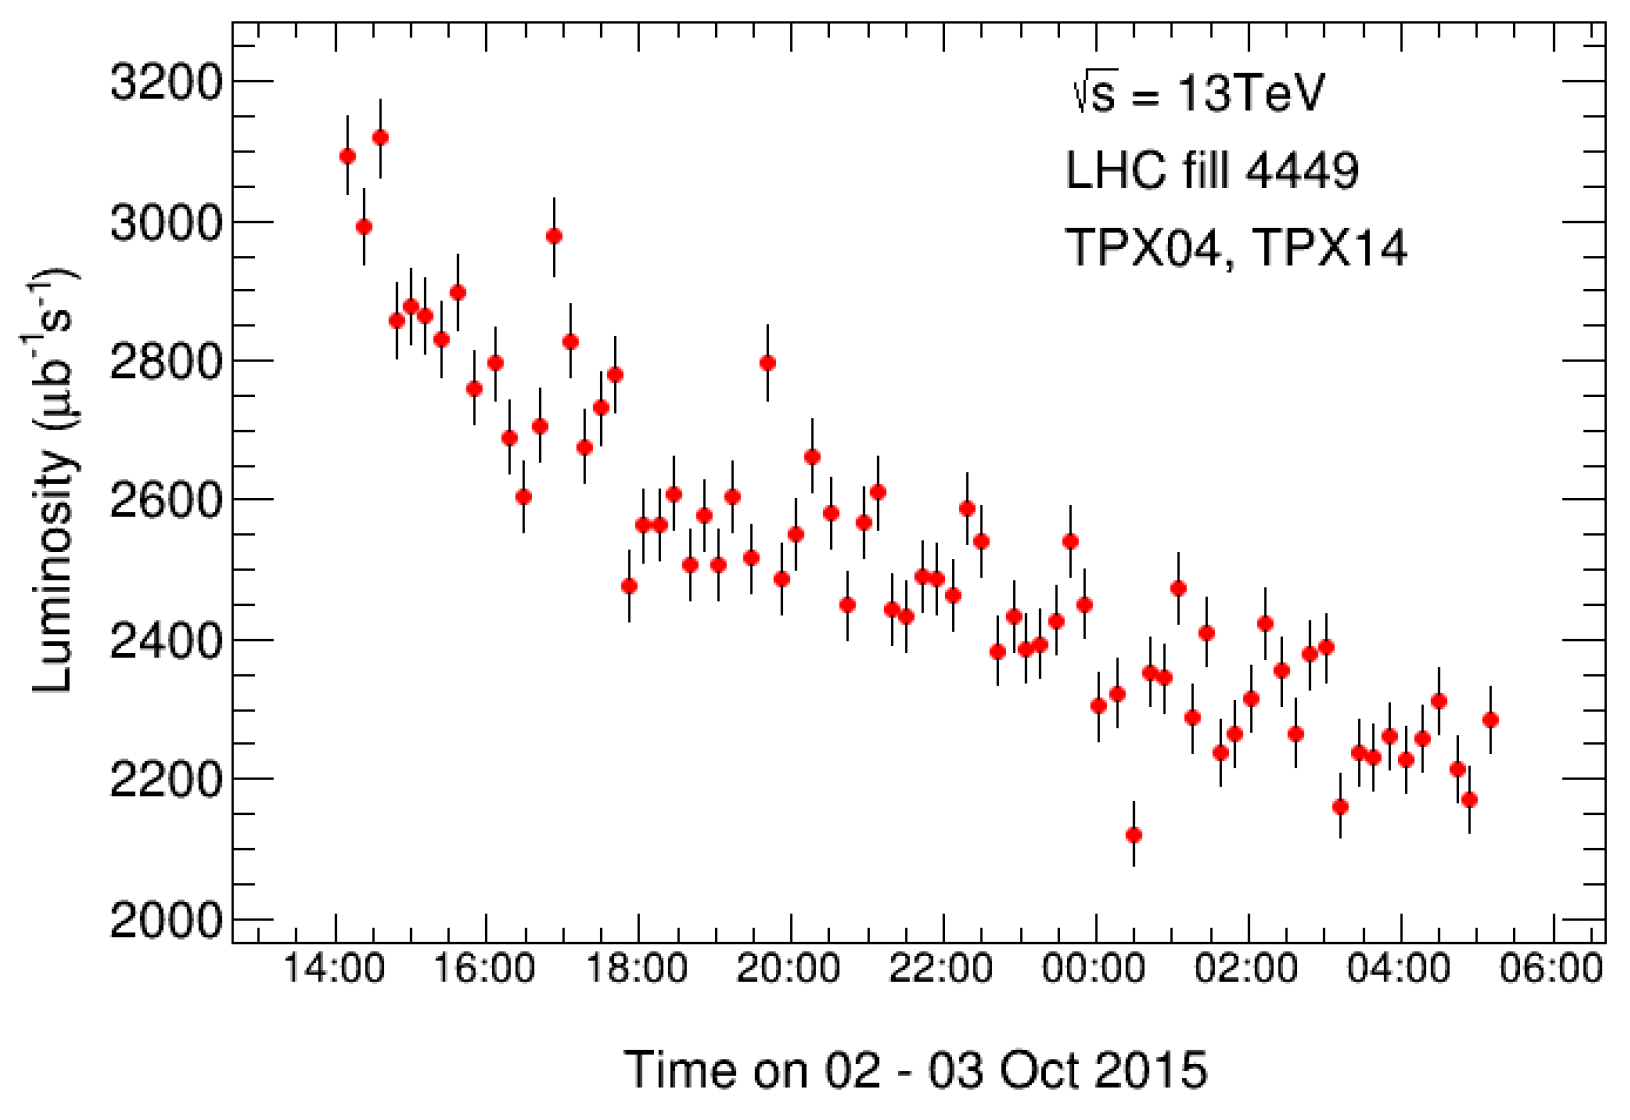
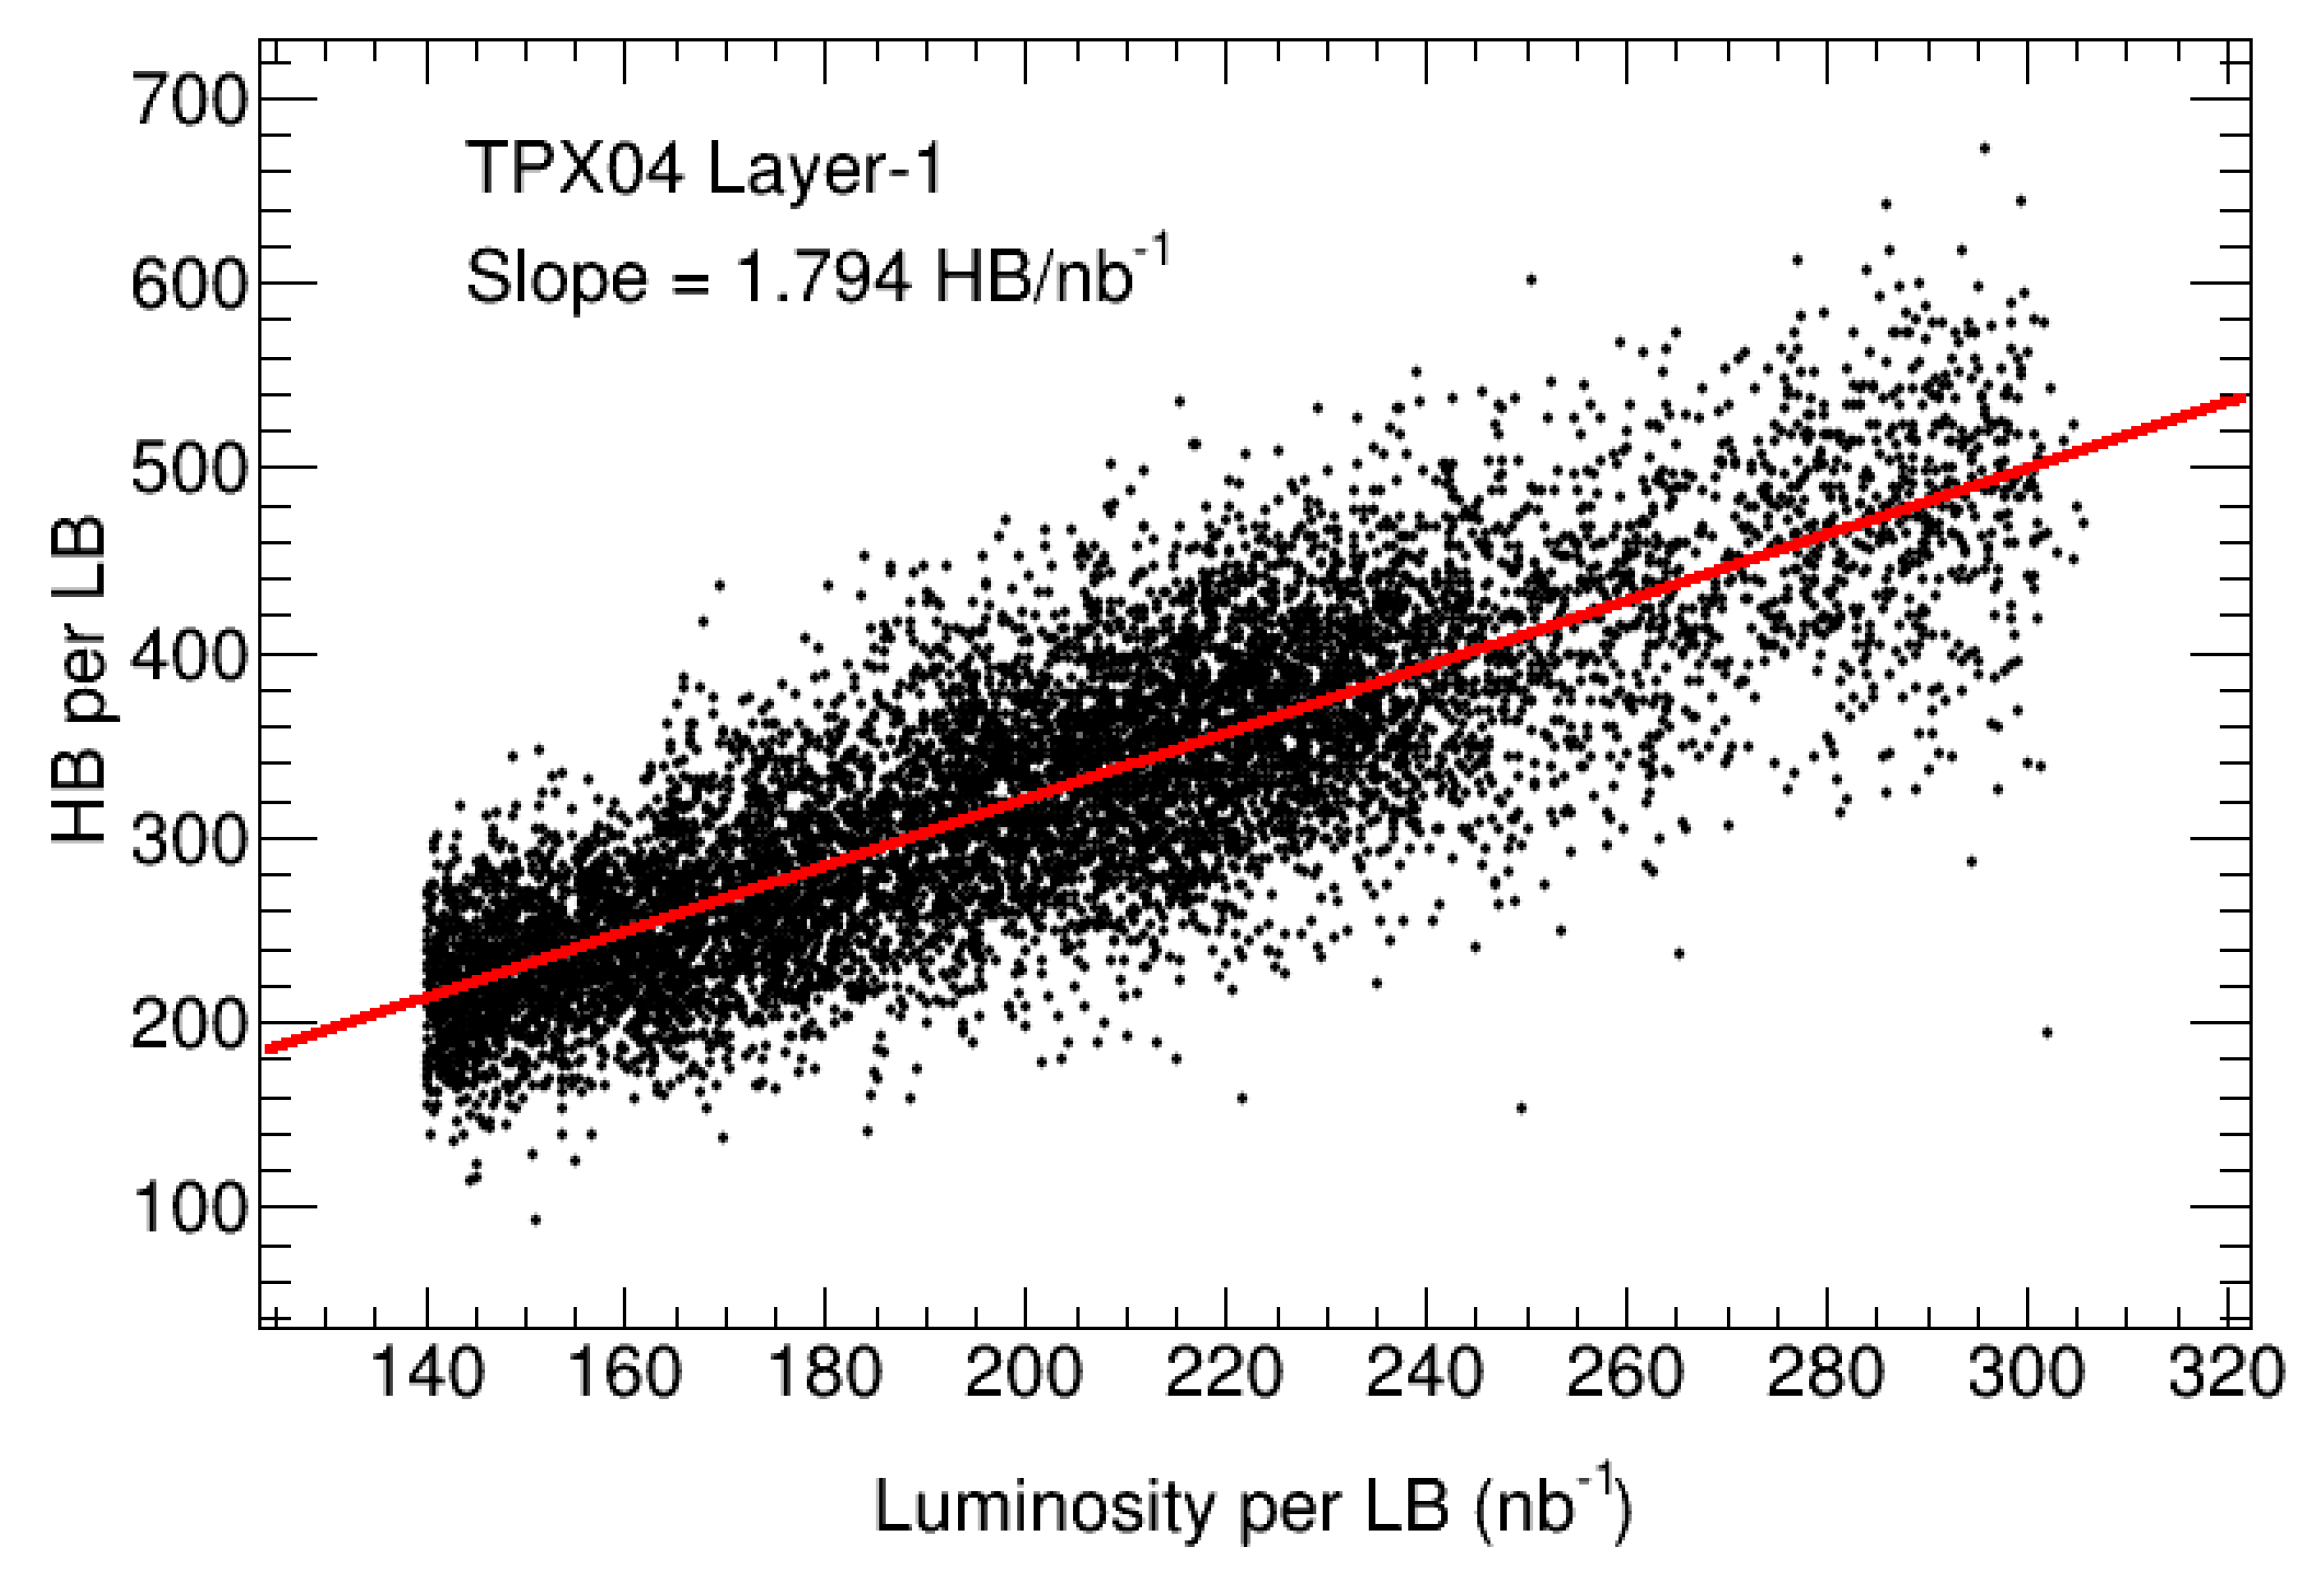
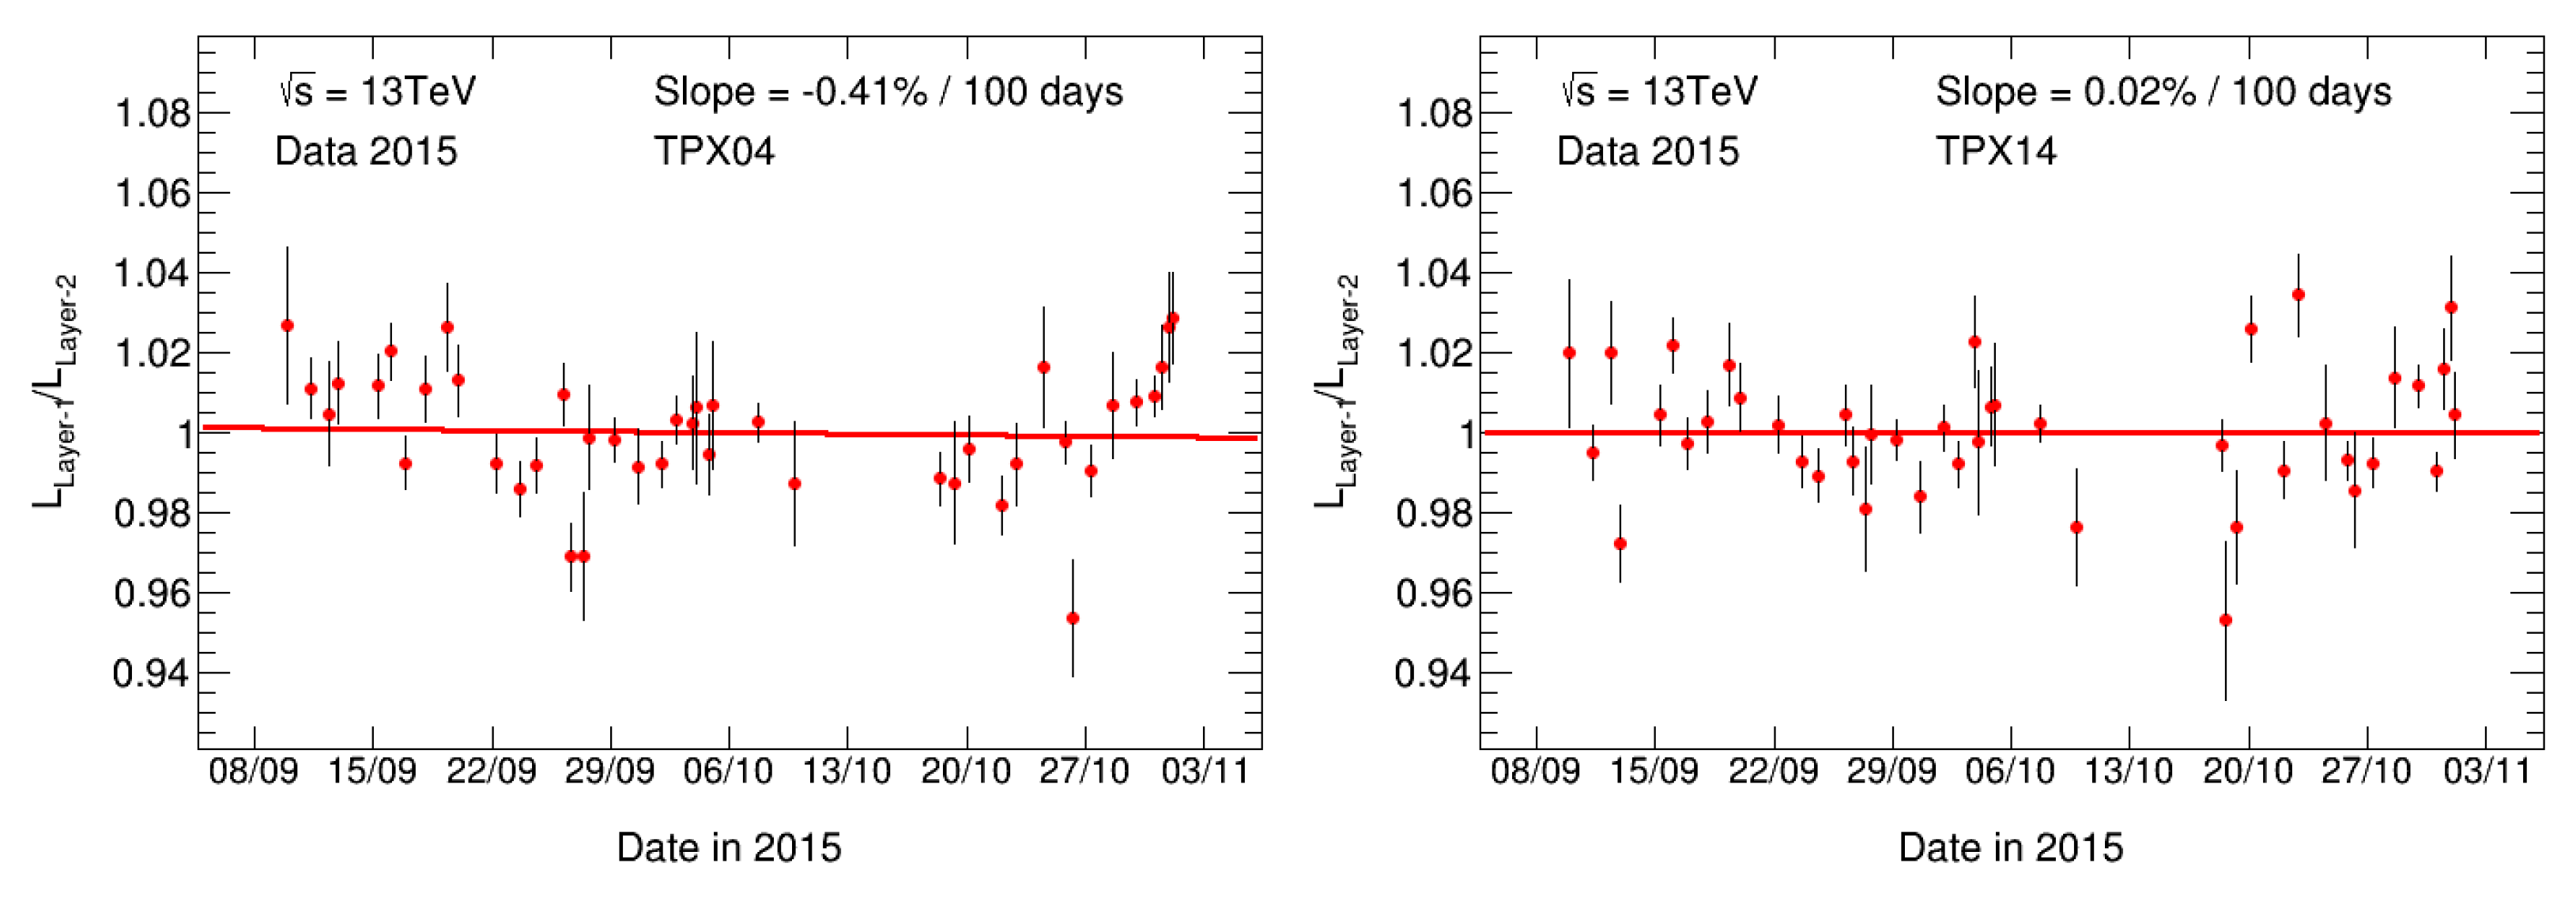
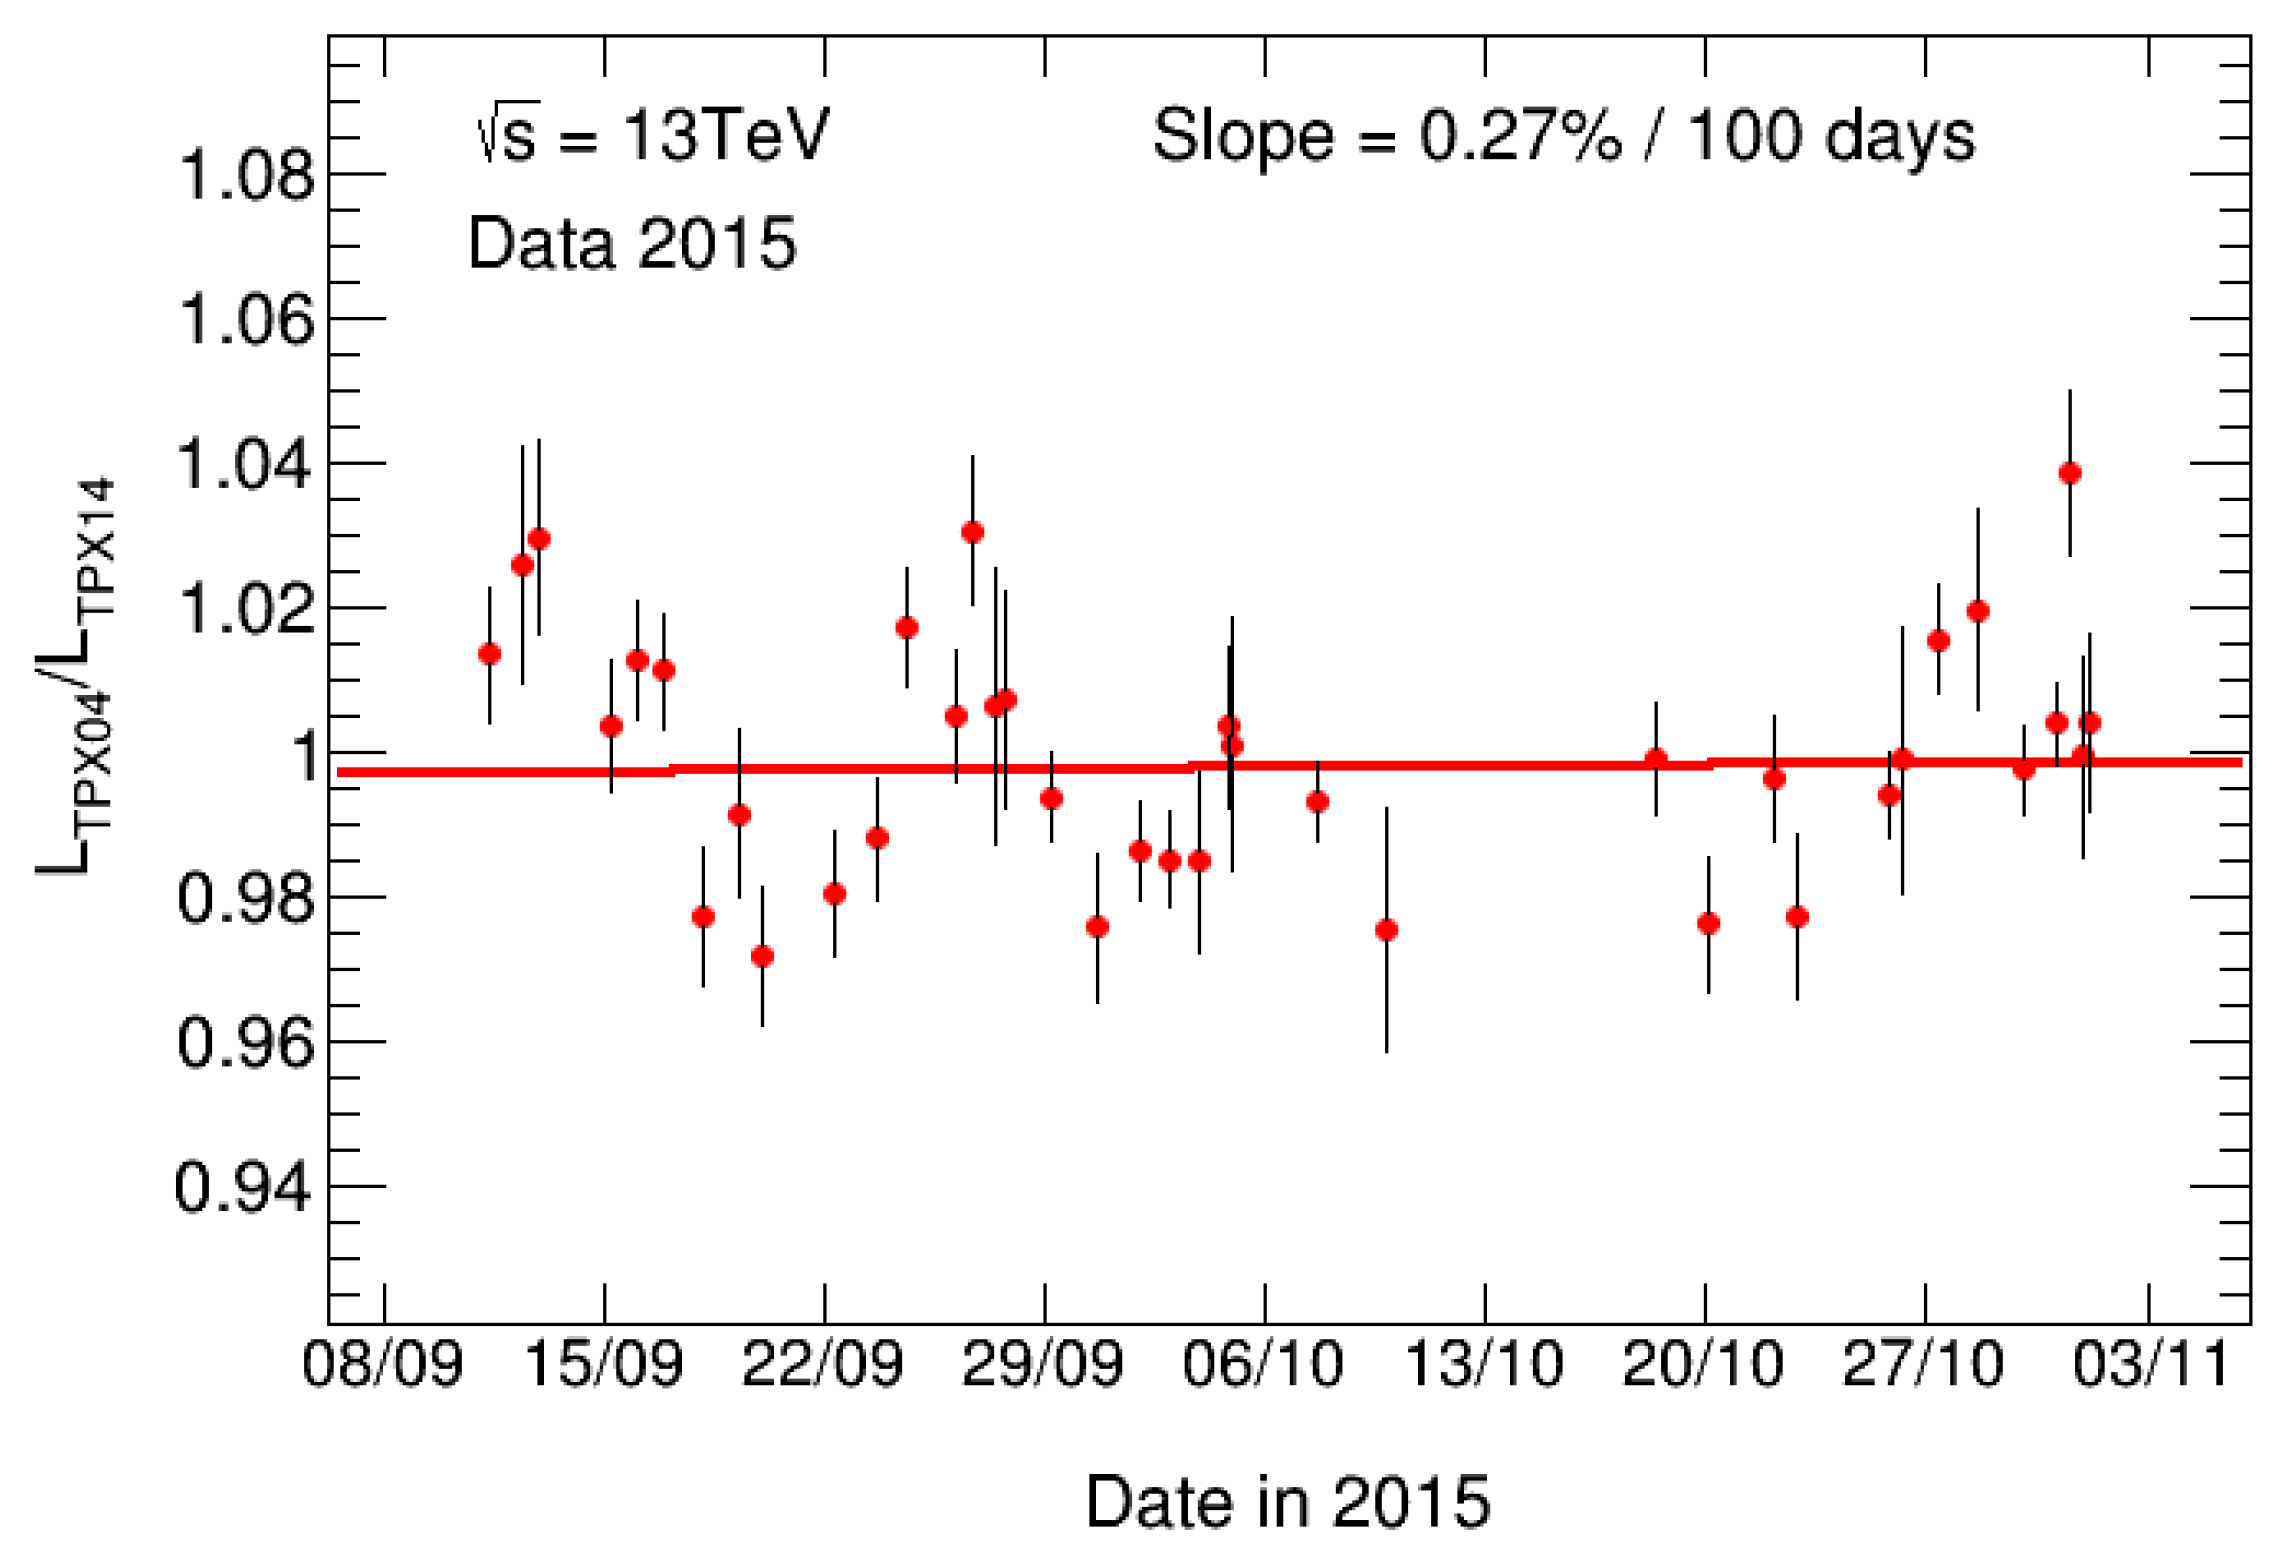
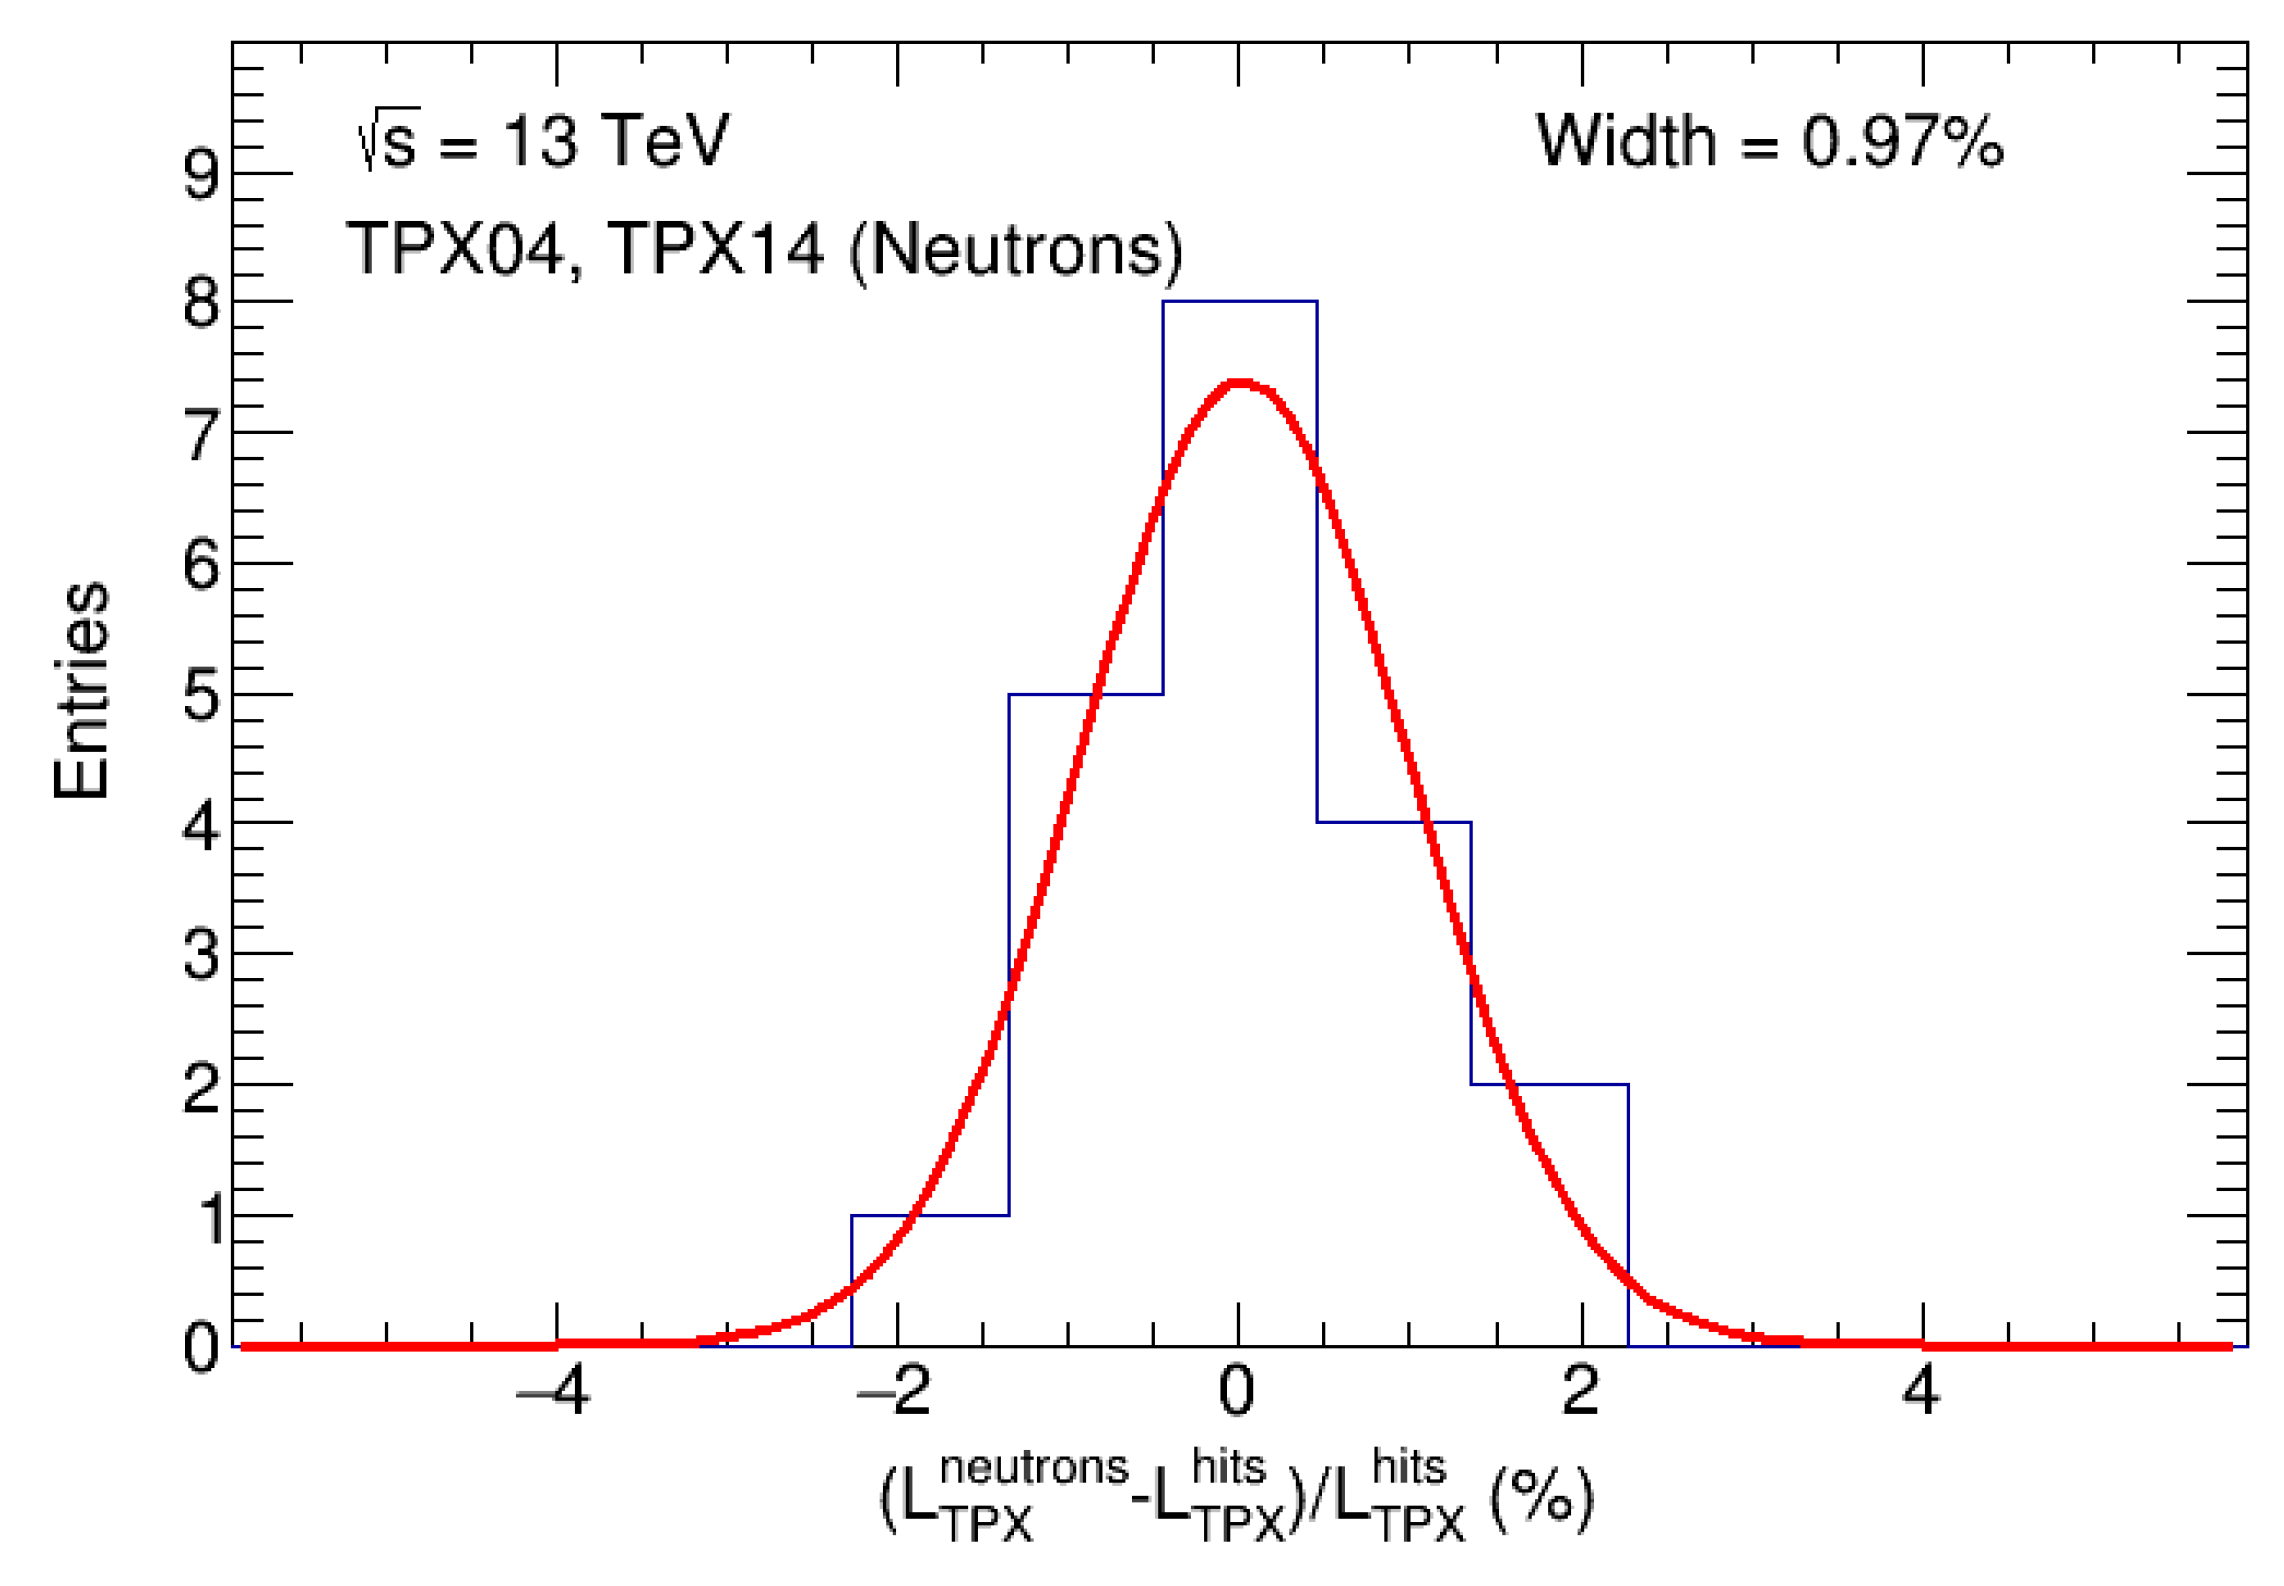
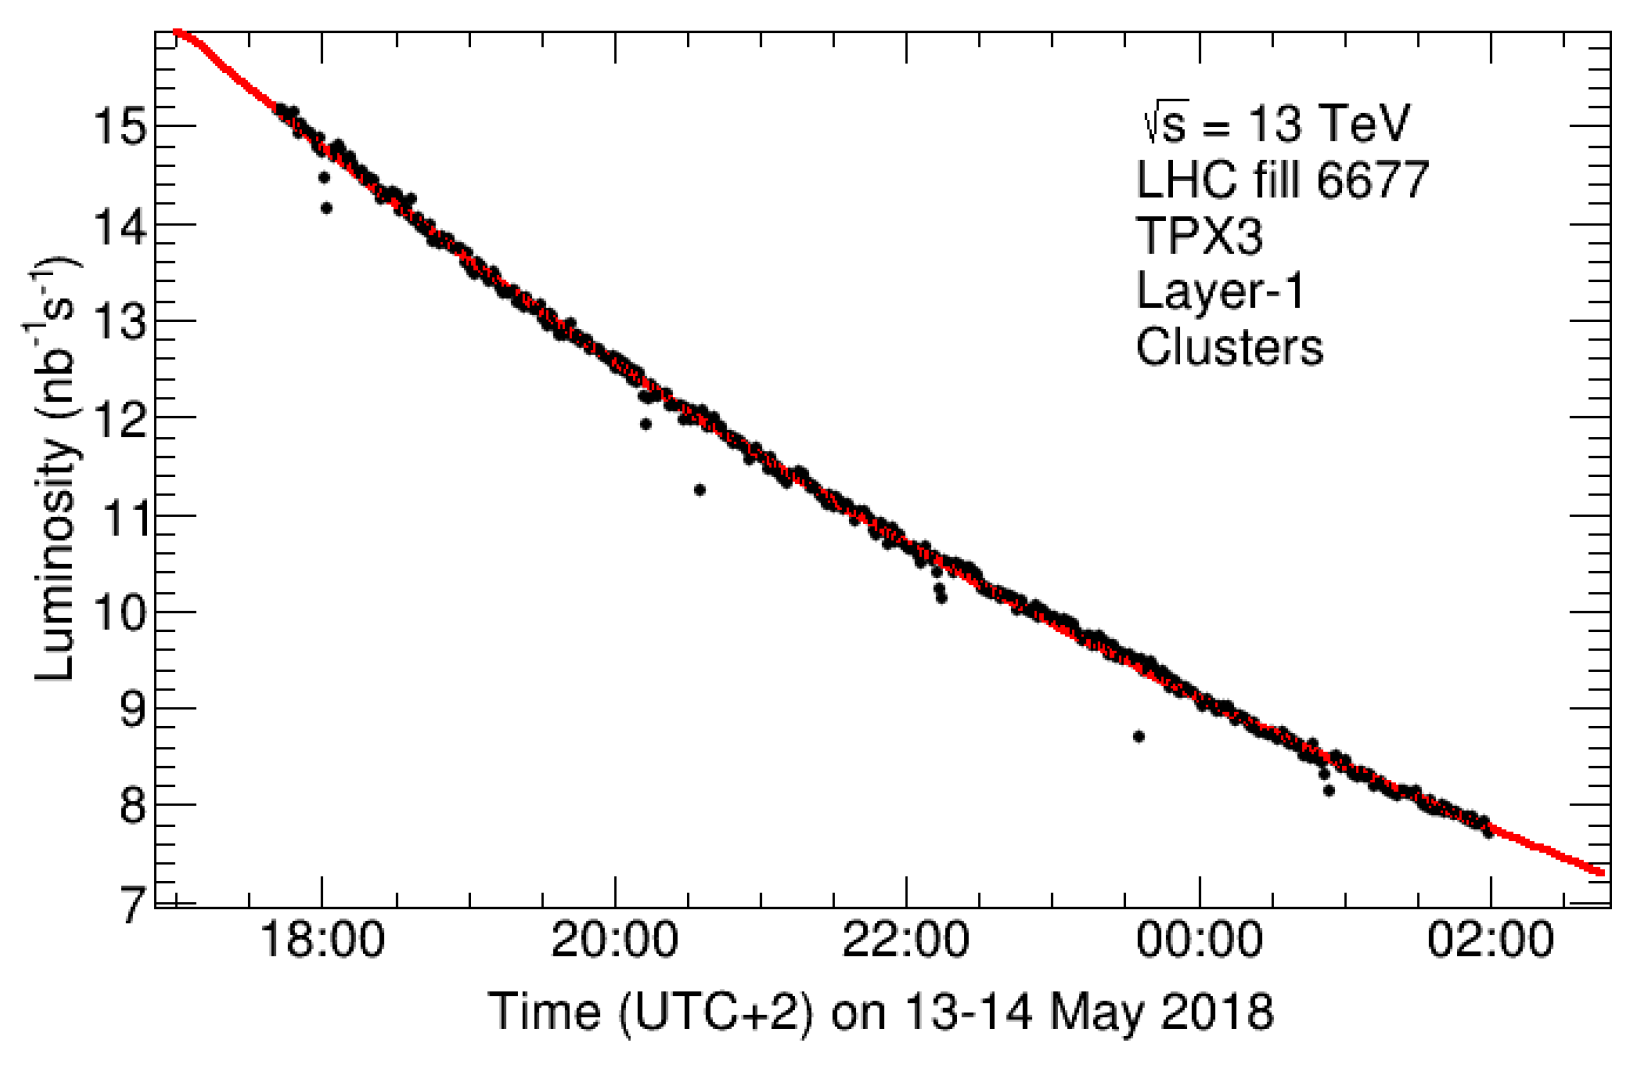
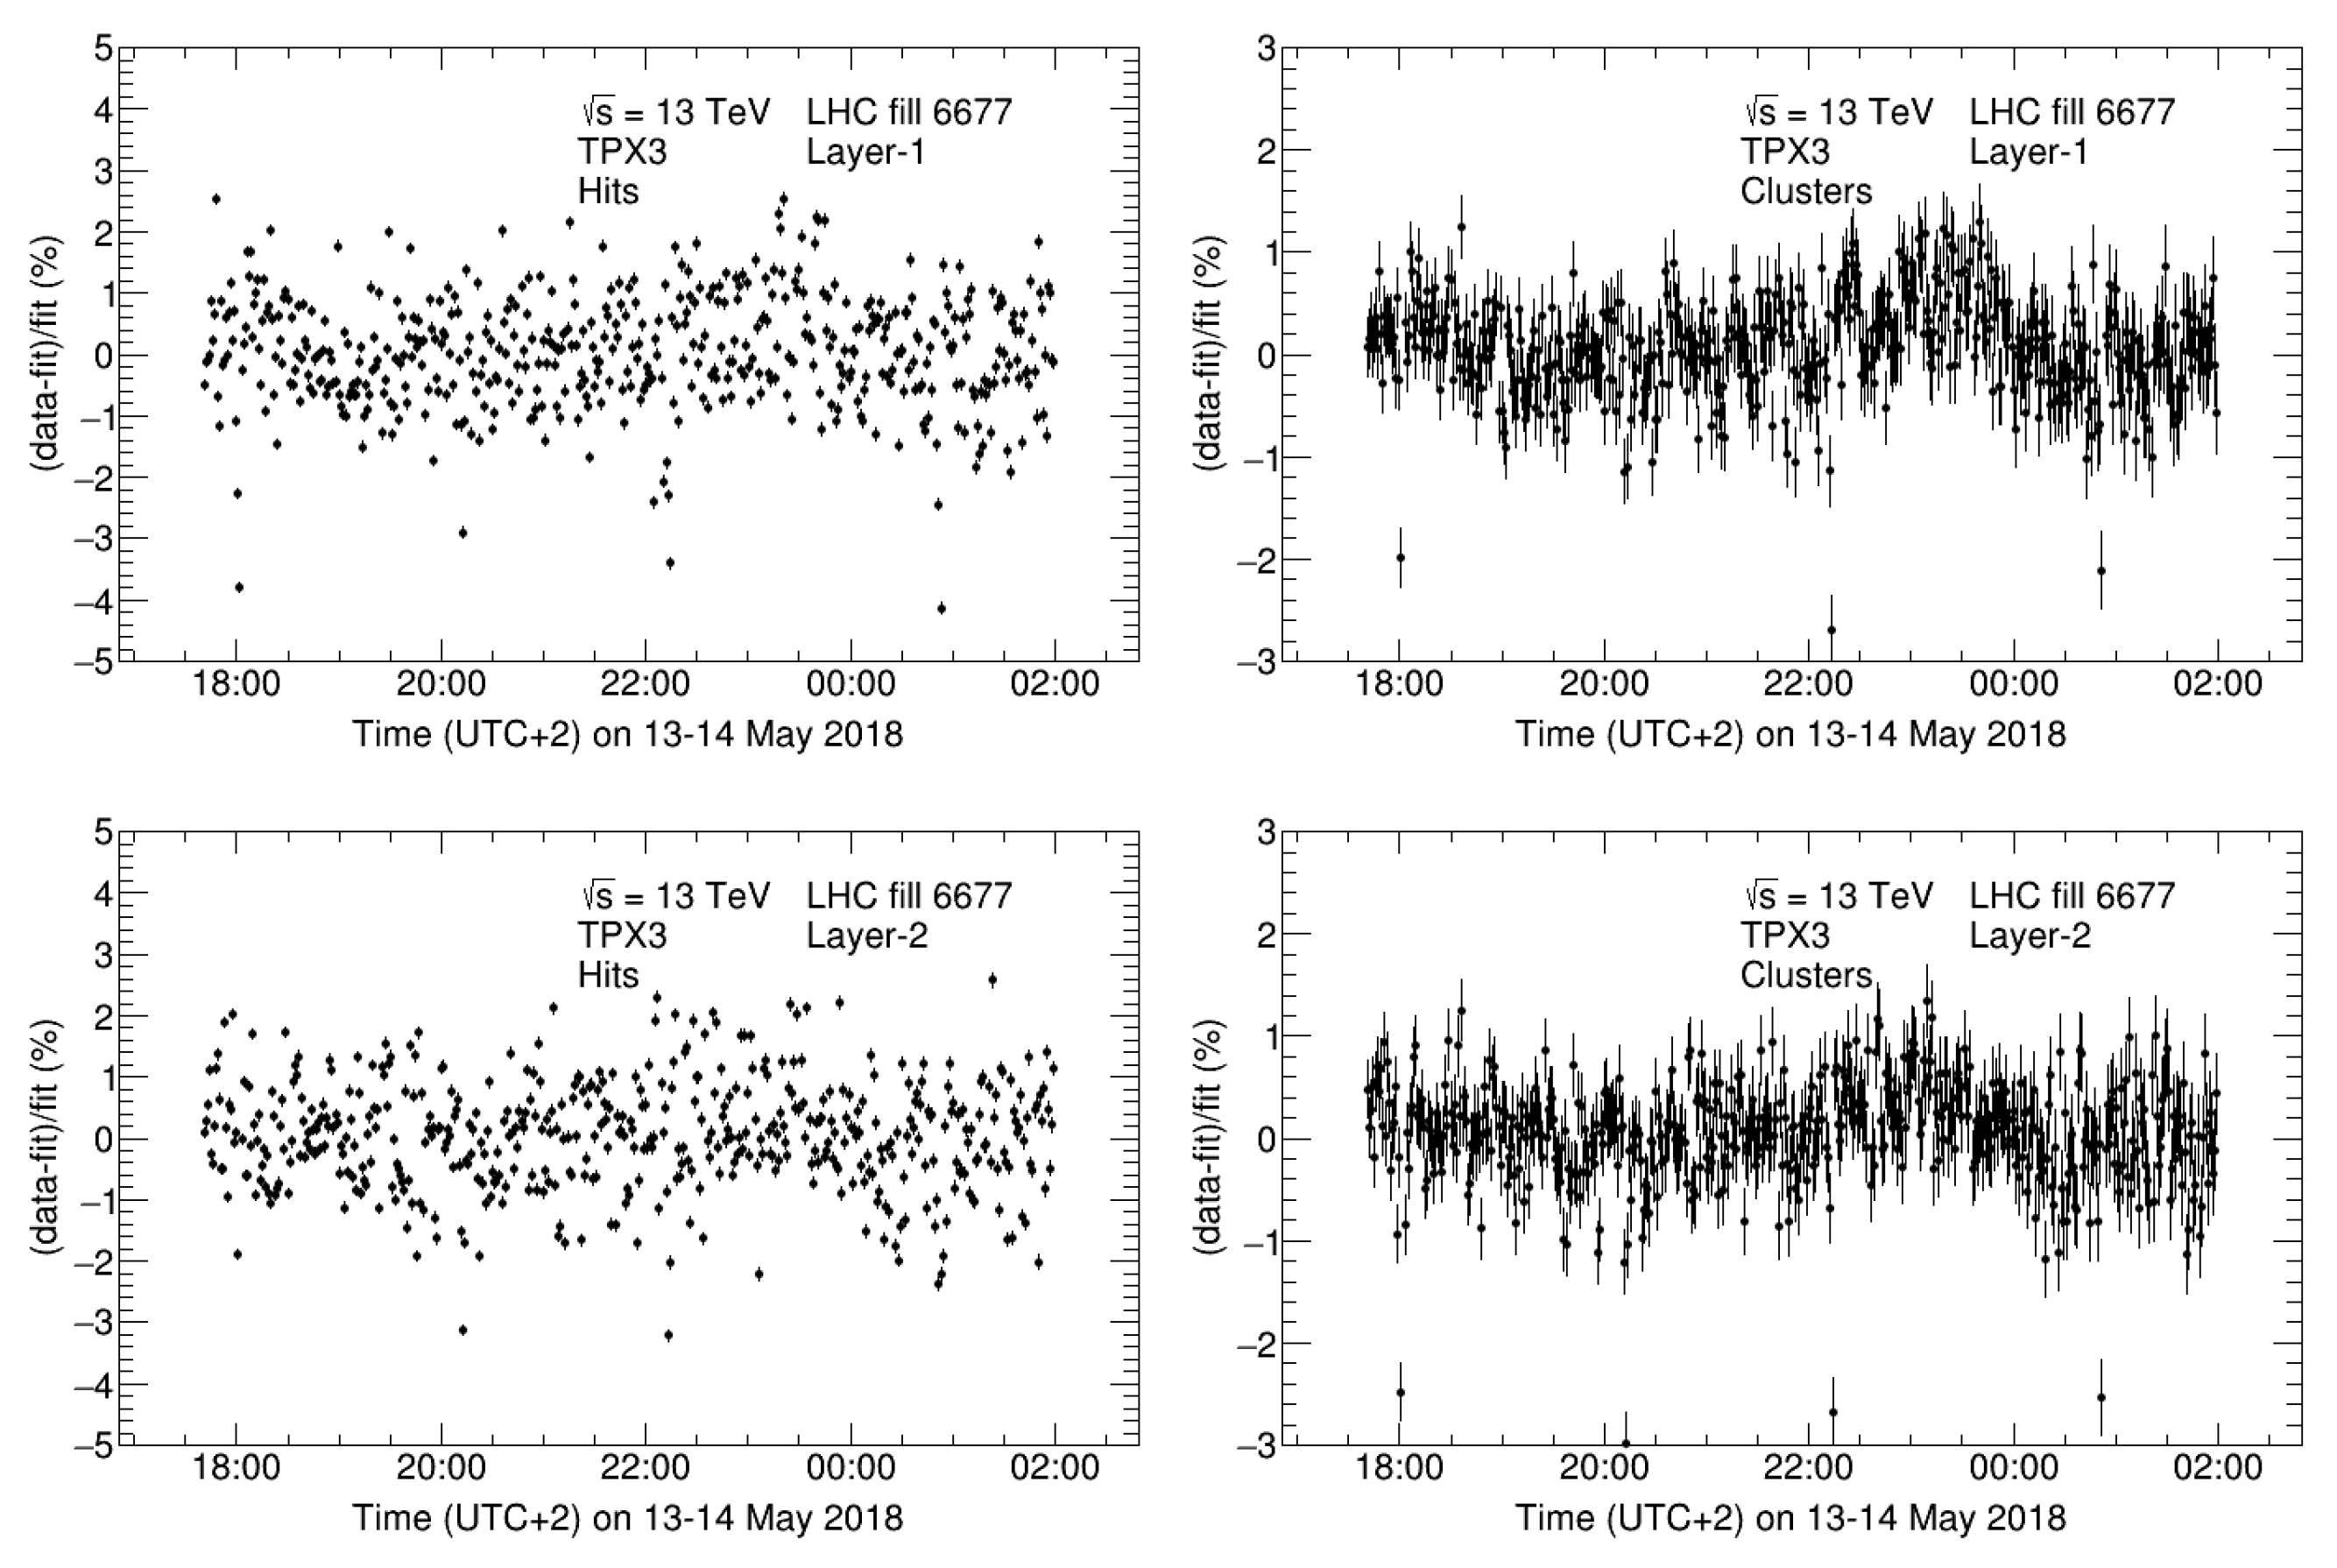
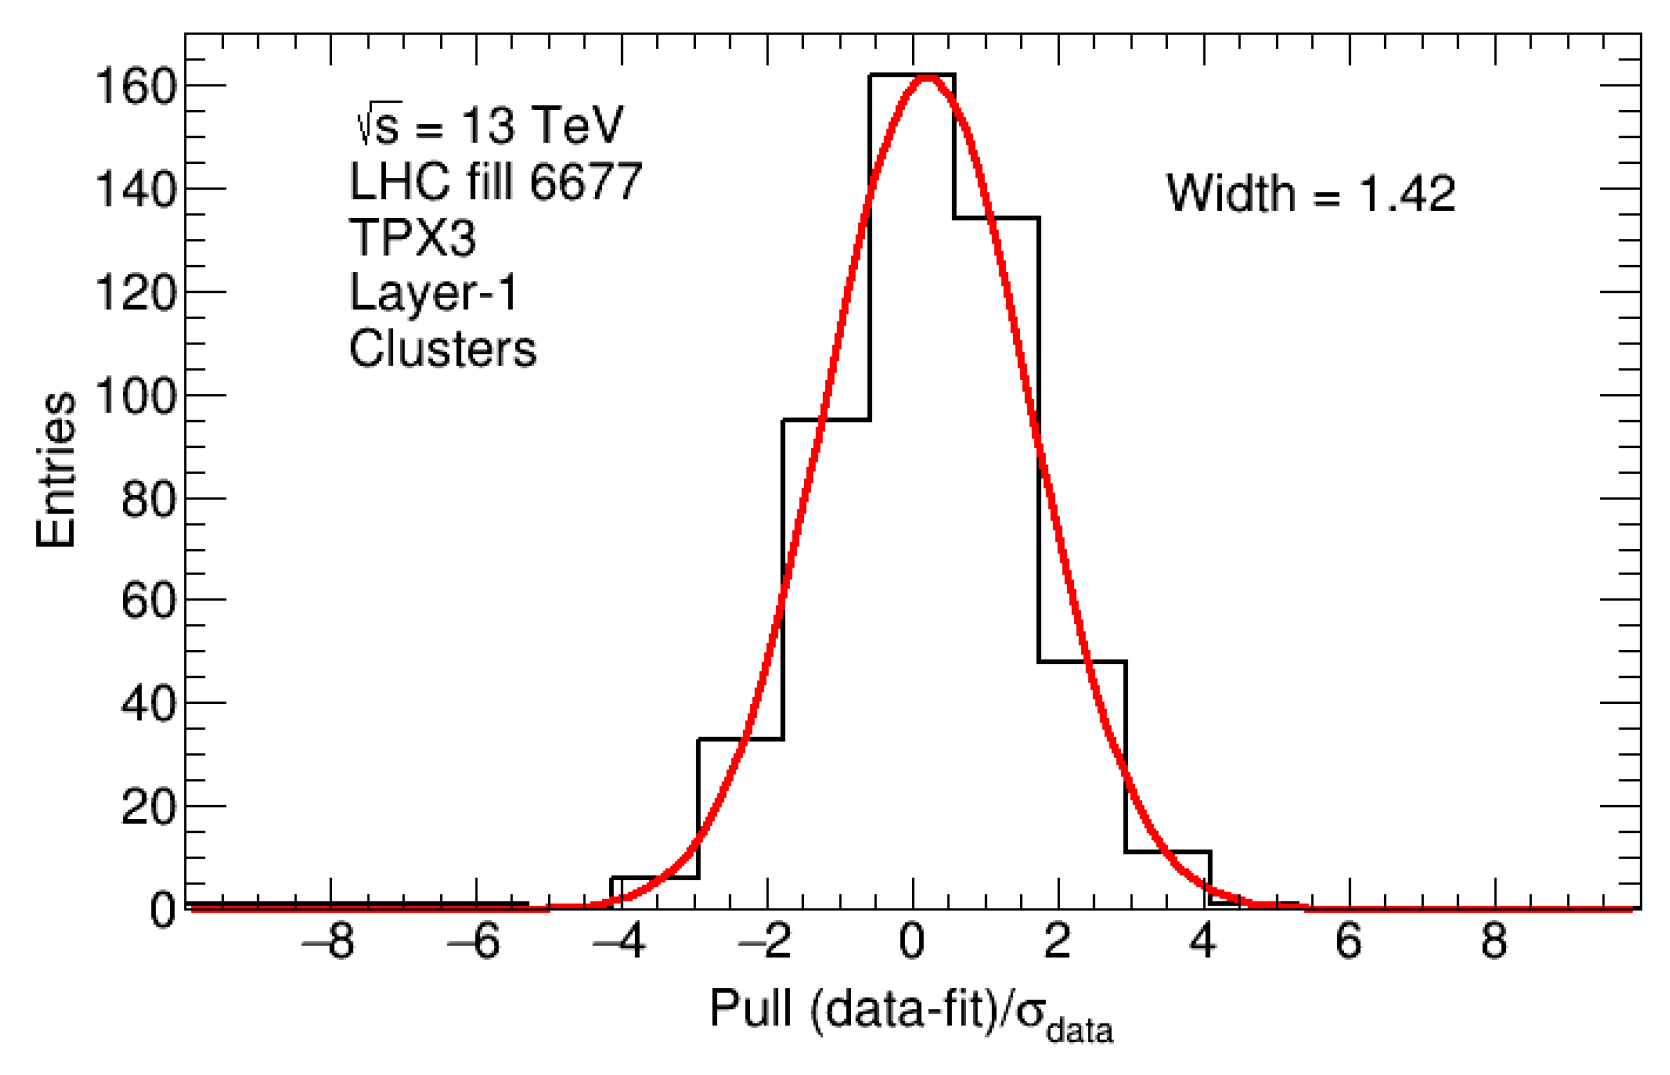
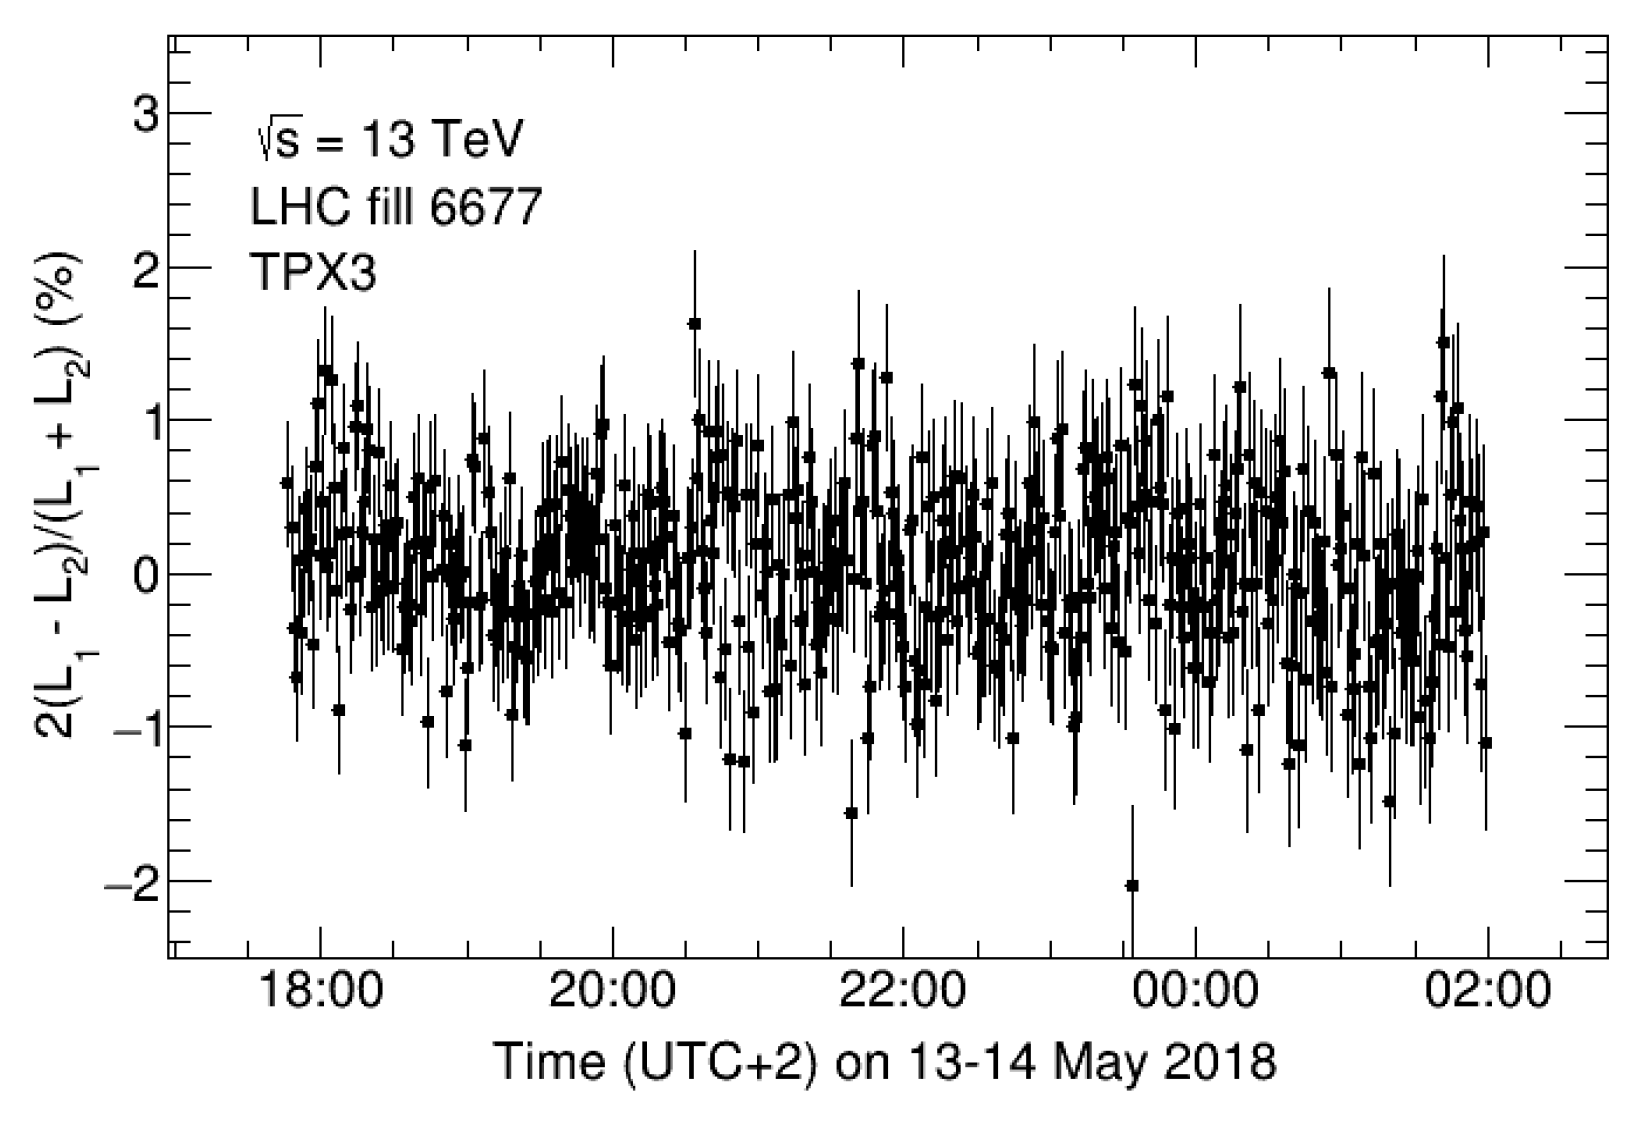
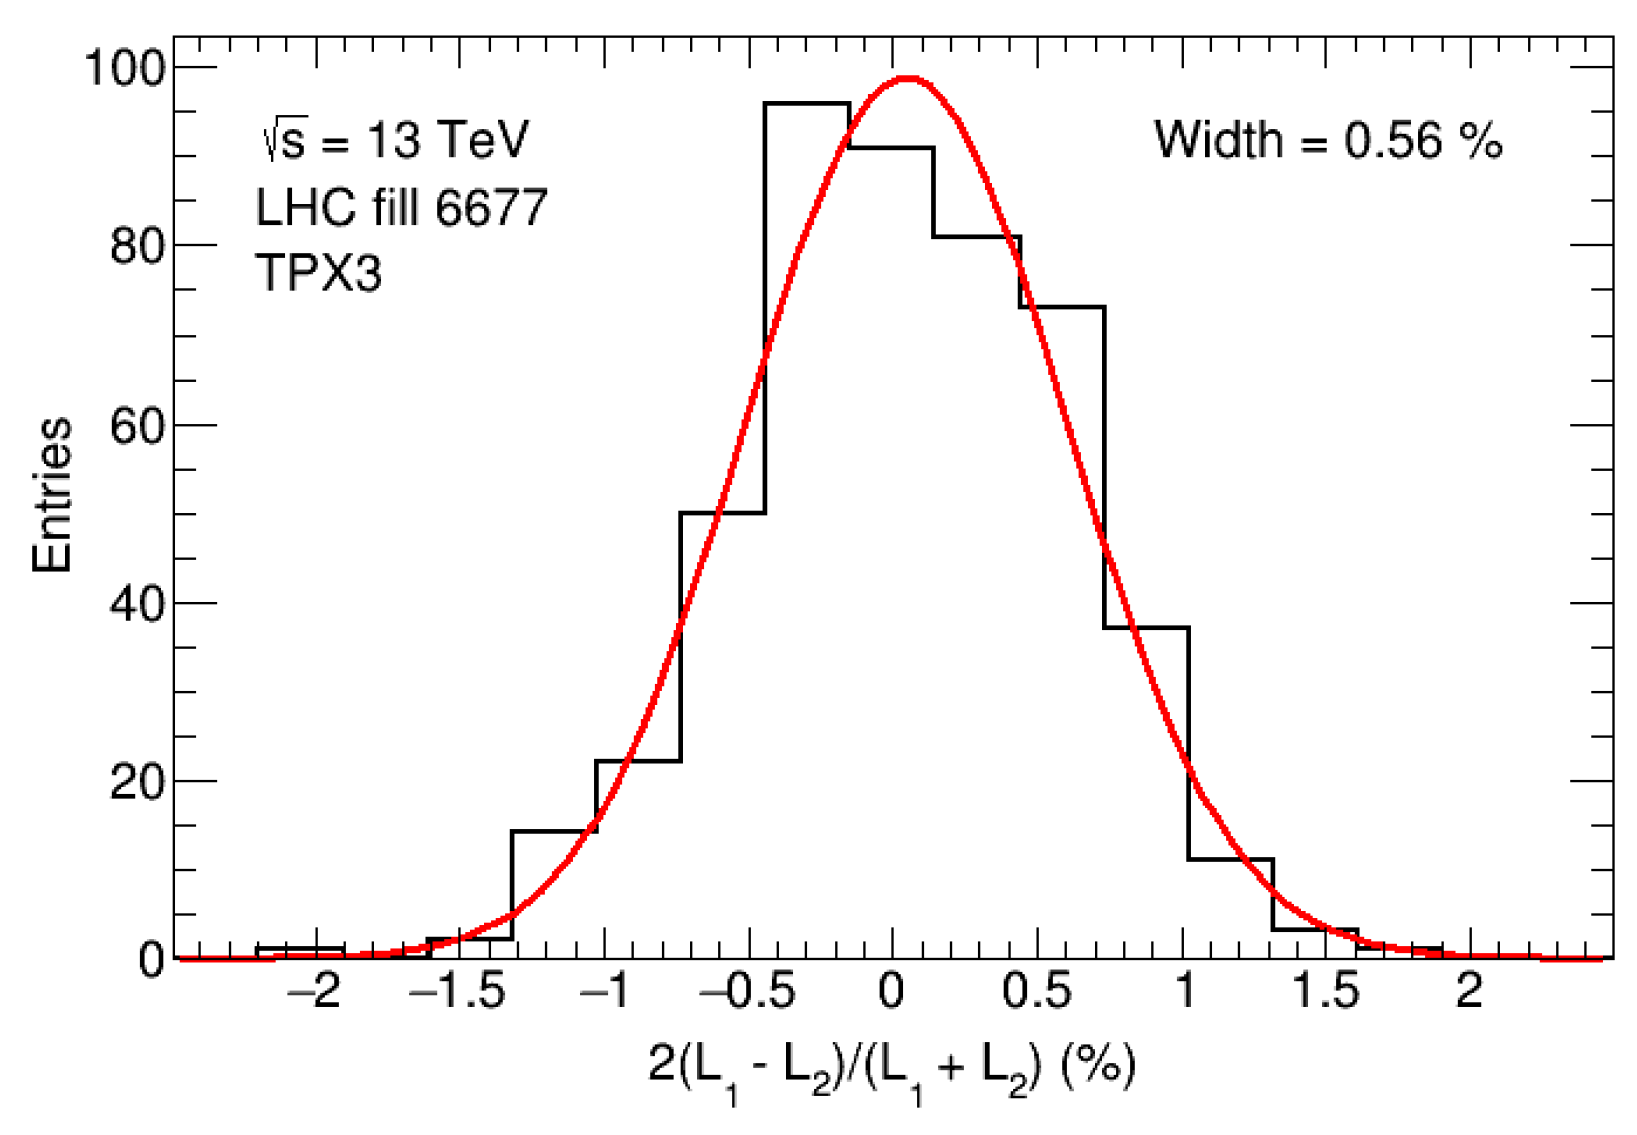
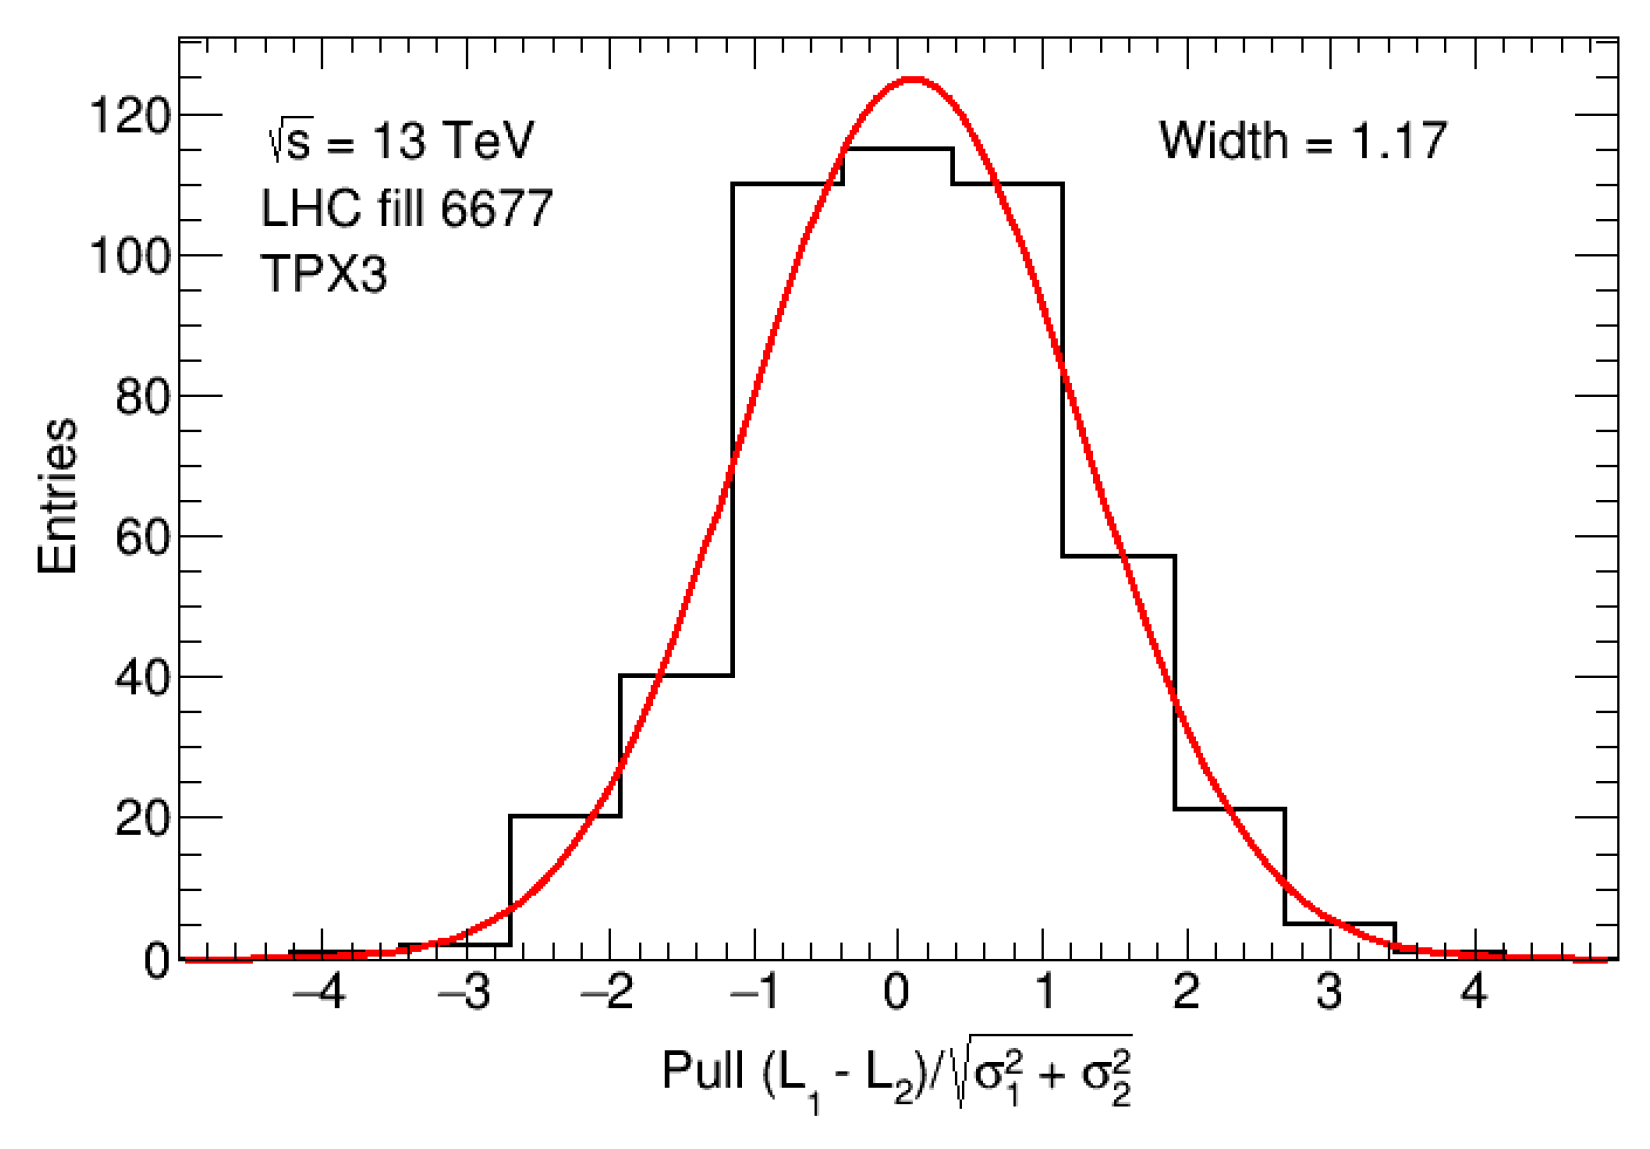
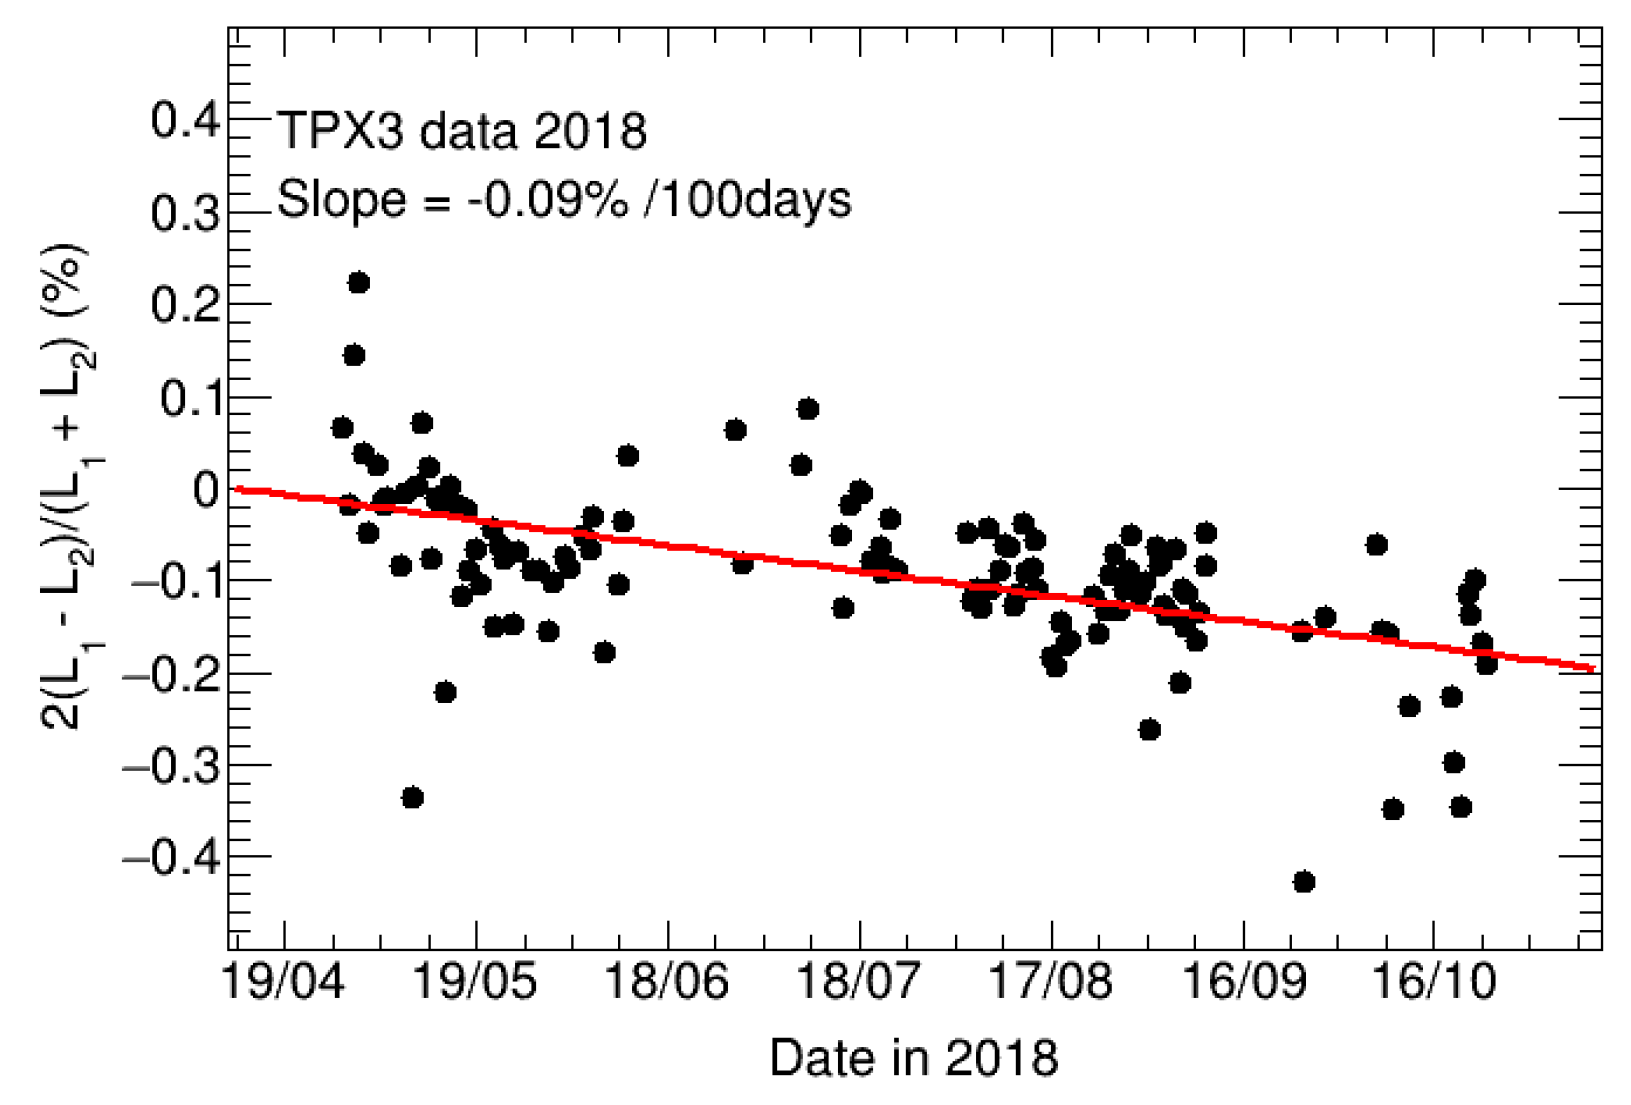
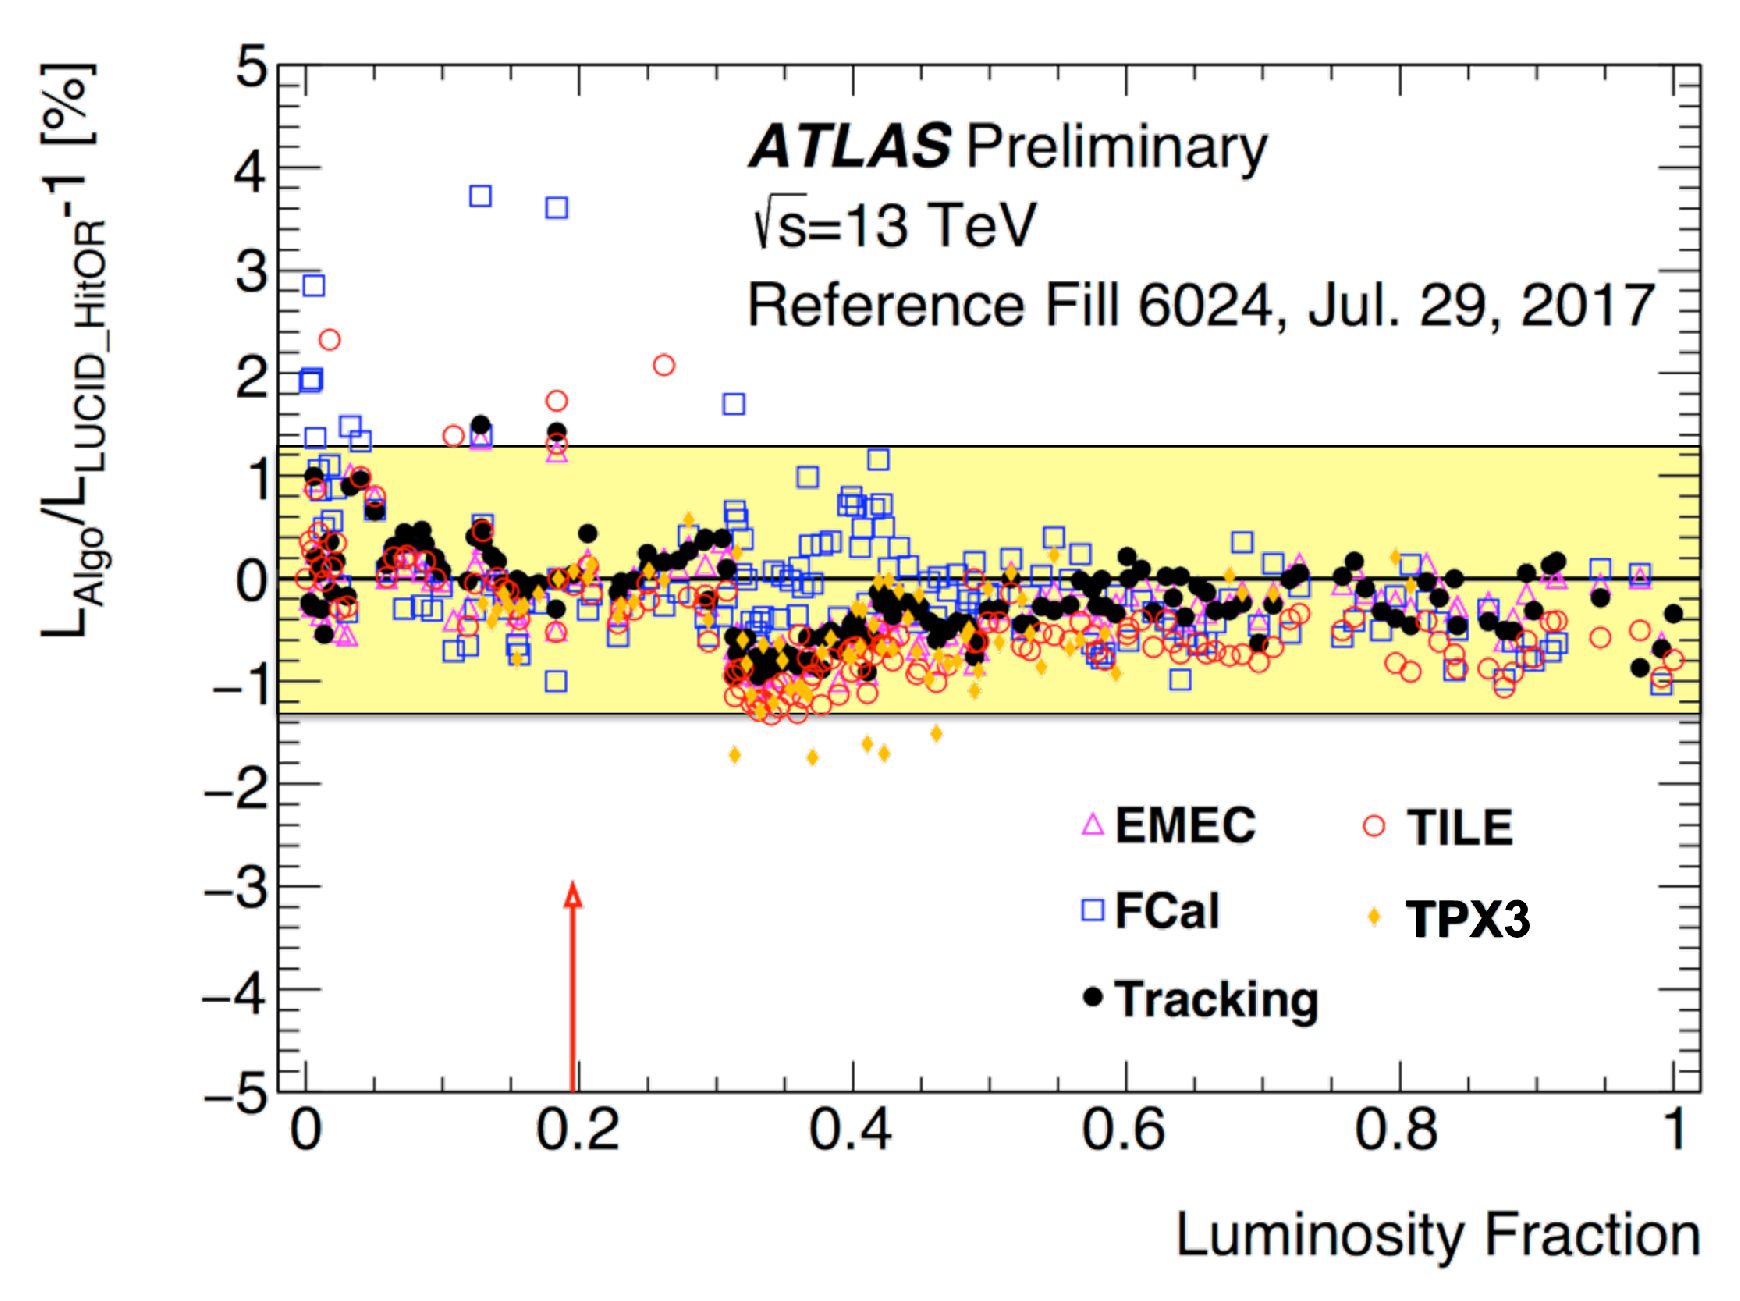
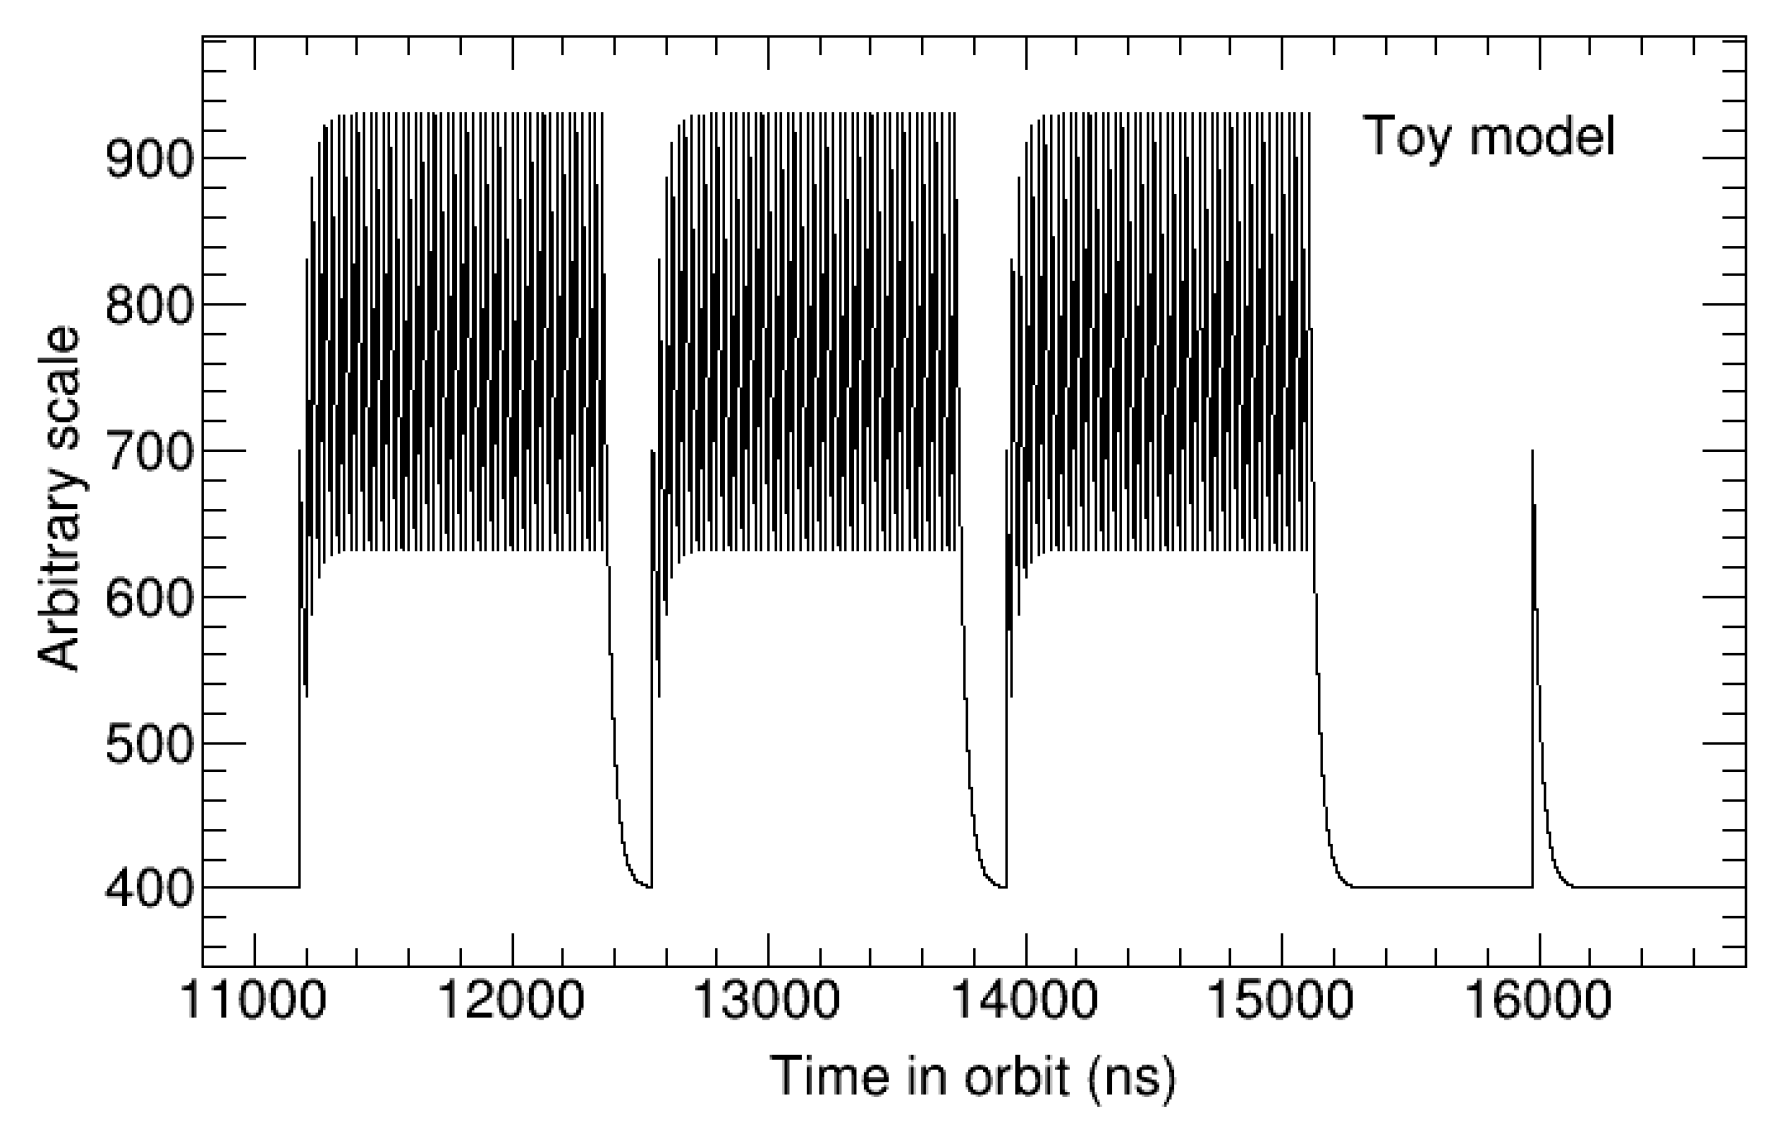
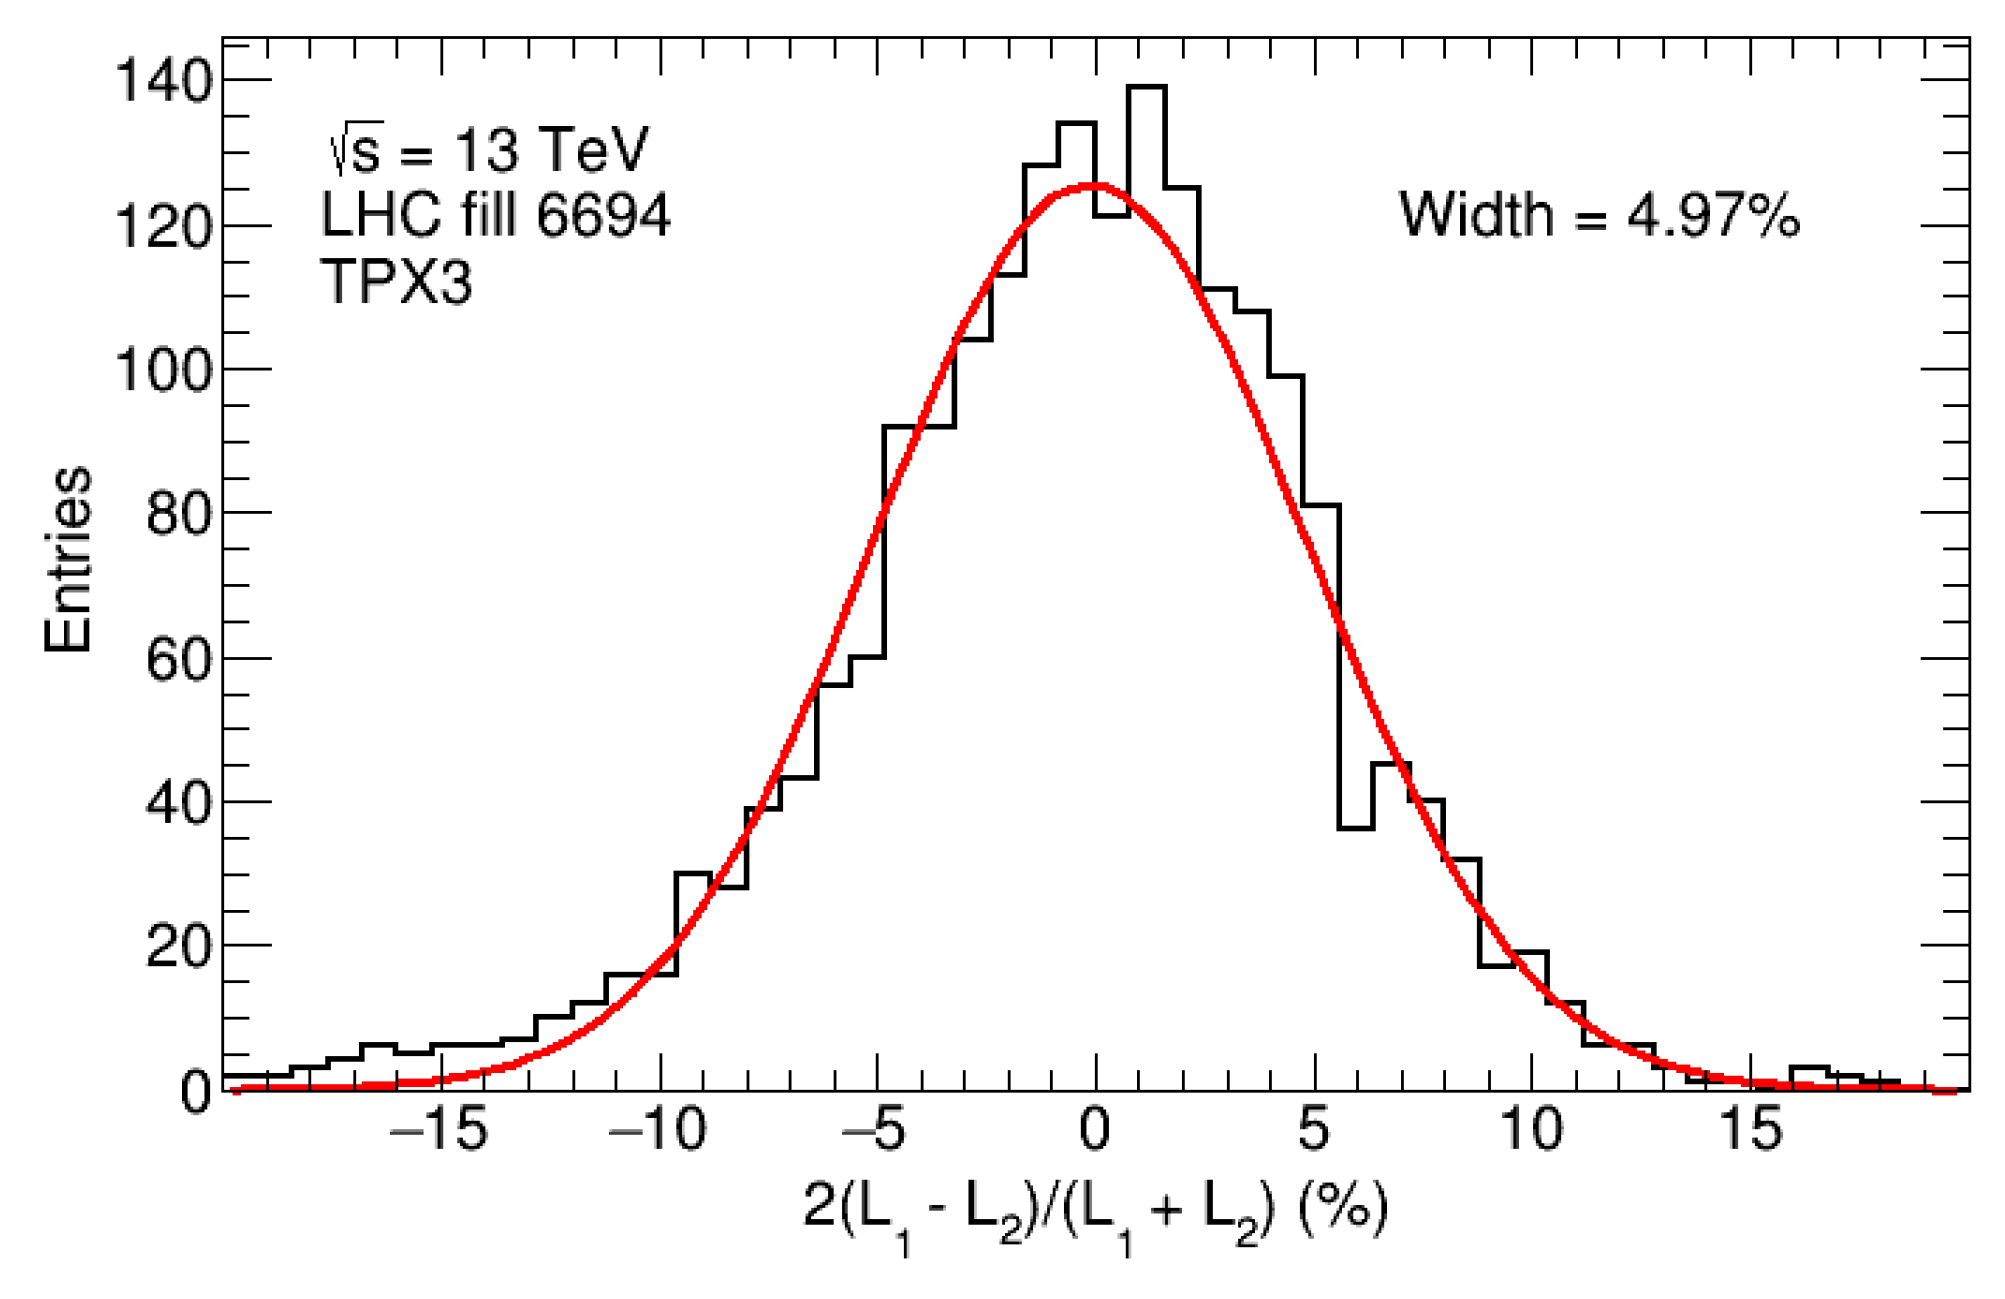
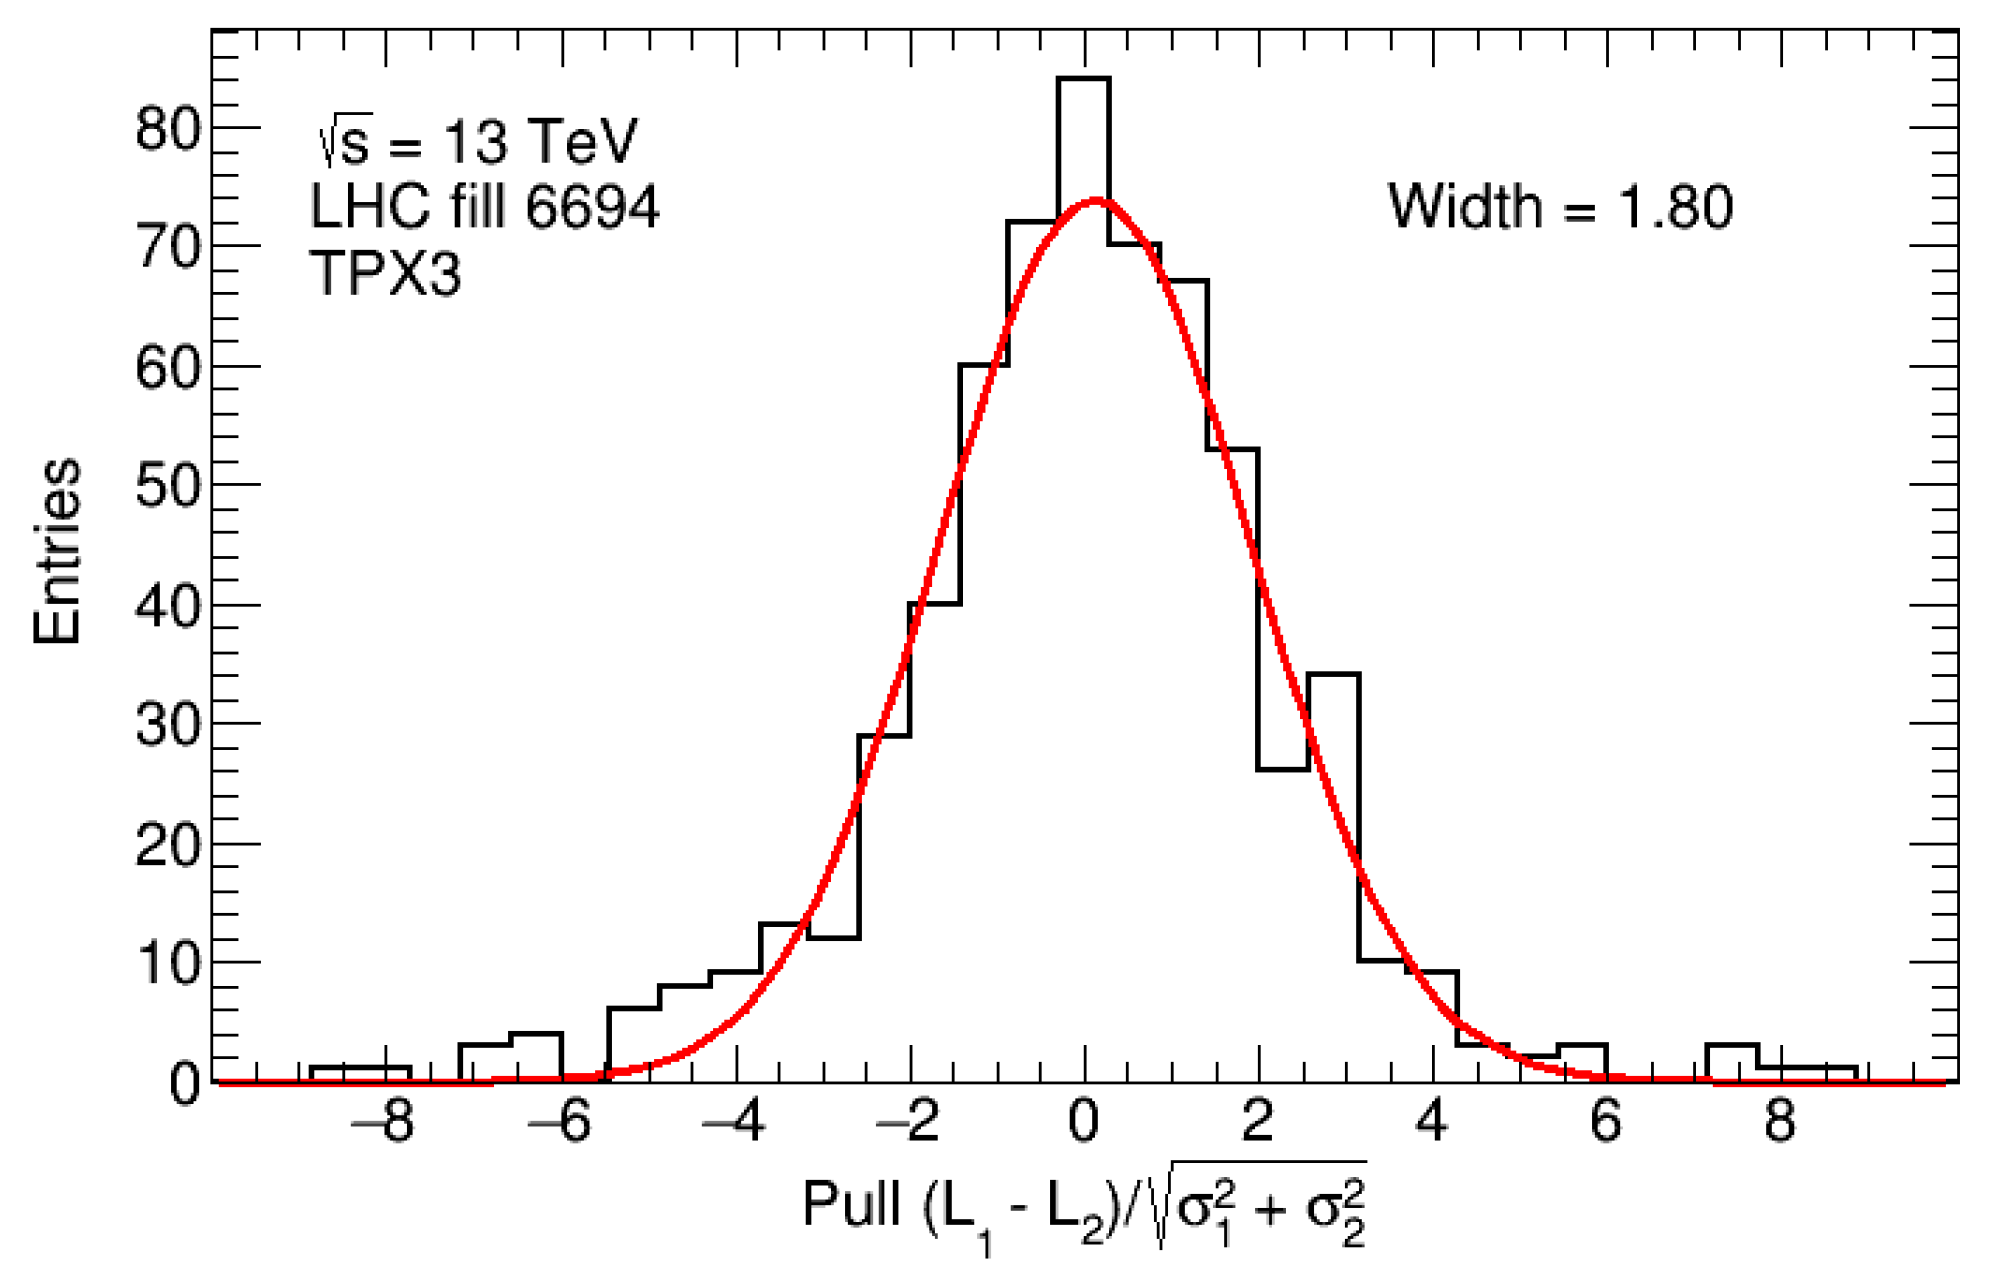
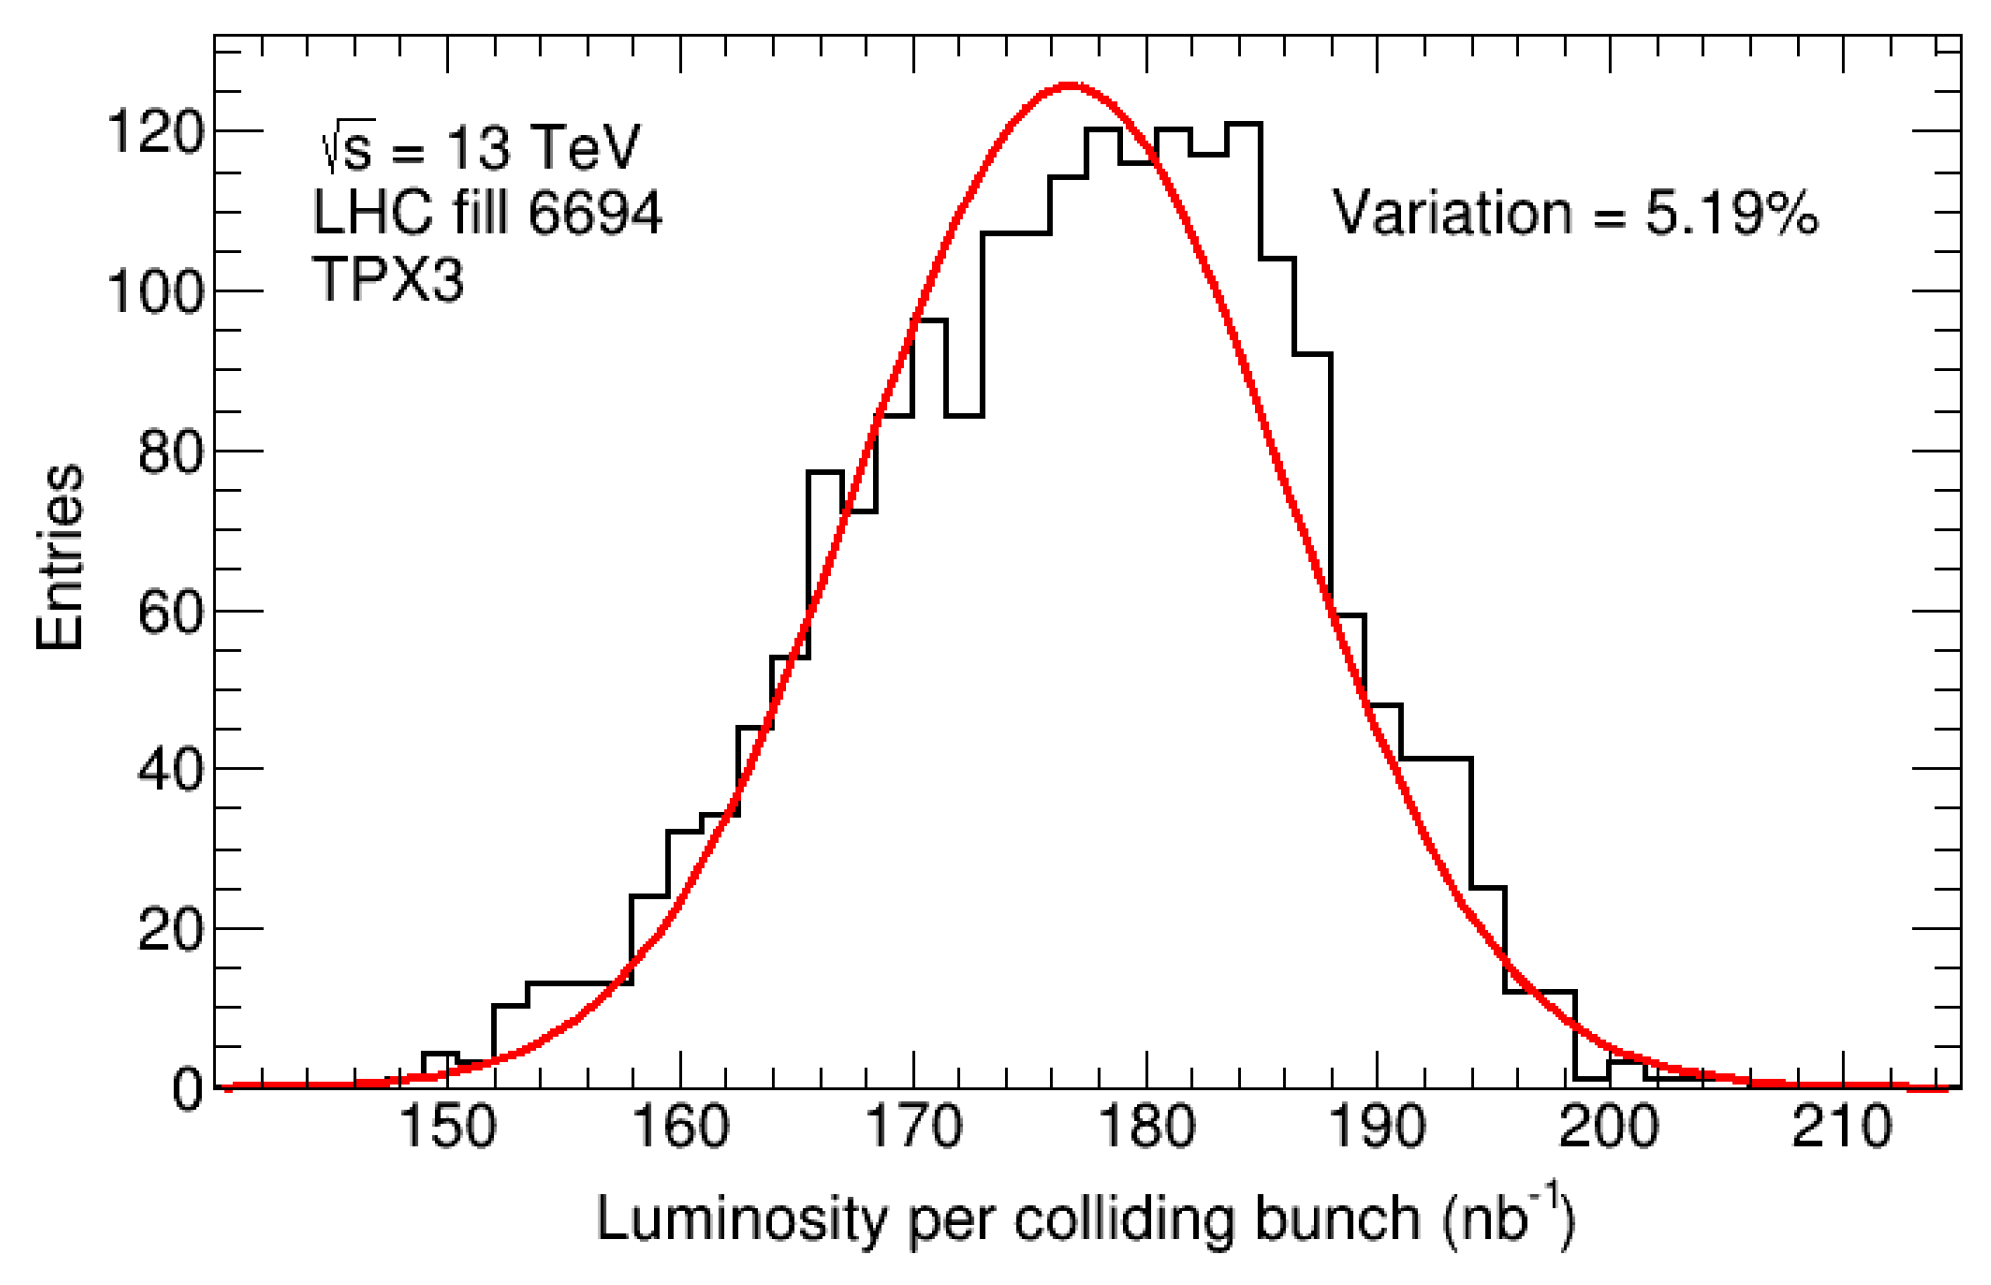
Table 1.
Medpix-2 (MPX) device locations with respect to the interaction point. Z is the longitudinal distance from the interaction point and R is the distance from the beam axis. Only devices with low cluster rates are used for the heavy blob (thermal neutron) counting analysis as indicated. Ordering in the table is given with decreasing particle flux. The asterisk symbol * indicates the device which was rejected during analysis (Section 2.2). Taken from Ref. [11].
| Device | Z (m) | R (m) | Measured MPX Clusters per Unit Sensor Area and per Unit Luminosity | Used for th. Neutron Analysis |
|---|---|---|---|---|
| MPX01 | 3.42 | 0.77 | 55,000 | No |
| MPX13 | 2.44 | 380 | No | |
| MPX02 | 3.42 | 2.50 | 230 | No |
| MPX04 | 7.12 | 1.30 | 110 | No |
| MPX05 | 7.20 | 2.36 | 47 | No |
| MPX03 | 2.94 | 3.57 | 31 | No |
| MPX06 | 7.20 | 3.36 | 20 | Yes * |
| MPX09 | 15.39 | 1.56 | 5.8 | Yes |
| MPX12 | 7.23 | 6.25 | 3.9 | Yes |
| MPX08 | 4.02 | 4.40 | 1.2 | Yes |
| MPX10 | 22.88 | 5.19 | 1.0 | Yes |
| MPX07 | 0.35 | 4.59 | 0.45 | Yes |
| MPX11 | 4.86 | 16.69 | 0.30 | Yes |
Table 2.
Normalization factor, , width of Gaussian fits of luminosity ratio MPX/MPXav for the six MPX devices (MPX01-05 and MPX13), shown in Figure 5. The values indicate that, in addition to the statistical uncertainties, some systematic uncertainties are present. For a realistic width uncertainty determination of an individual device, the errors are scaled to obtain . The “av” stays for “average”, and “ndf” stays for “number of degrees of freedom”. Taken from Ref. [11].
| MPX | () | (%) | (%) | ||
|---|---|---|---|---|---|
| 01 | 639.88 | 0.7221 | 0.0024 | 596/97 | 0.0058 |
| 02 | 4.0393 | 0.6912 | 0.0021 | 238/97 | 0.0034 |
| 03 | 0.5079 | 1.1599 | 0.0038 | 398/97 | 0.0076 |
| 04 | 1.3106 | 0.8638 | 0.0028 | 461/97 | 0.0061 |
| 05 | 0.5534 | 1.0839 | 0.0035 | 662/97 | 0.0091 |
| 13 | 5.8902 | 0.6394 | 0.0020 | 360/97 | 0.0038 |
Table 3.
Slope of time history of the luminosity ratio MPX/MPXav for the six MPX devices with highest particle flux (MPX01-05 and MPX13) used for hit counting. The slope values and the uncertainties are given per second, and in percentage for 200 days. For a realistic slope uncertainty determination of an individual device, the errors are scaled to obtain . is the size of the error bars which are the same for each data point (Figure 6). Taken from Ref. [11].
| MPX | Slope | Slope | Slope | Slope | |
|---|---|---|---|---|---|
| () | () | (%/200 d) | (%/200 d) | ||
| 01 | 3.09 | 1.94 | 0.534 | 0.336 | 0.00349 |
| 02 | 2.10 | 1.08 | 0.364 | 0.187 | 0.00194 |
| 03 | 3.24 | 1.19 | 0.559 | 0.205 | 0.00214 |
| 04 | 1.36 | 0.235 | 0.00245 | ||
| 05 | 1.30 | 0.225 | 0.00234 | ||
| 13 | 2.66 | 1.10 | 0.459 | 0.191 | 0.00198 |
Table 4.
Slope of time history of the luminosity ratio MPX/MPXav for the six MPX devices with lowest particle flux (MPX07-12) used for heavy blob (thermal neutron) counting. The -slope value results from the statistical uncertainty per time period. The values of the linear fits from Figure 7 are also shown. is the summed number of heavy blobs without applying the overlap correction factor. Taken from Ref. [11].
| MPX | Slope | Slope | Slope | Slope | |
|---|---|---|---|---|---|
| () | () | (%/200 d) | (%/200 d) | ||
| 07 | −1.45 | 6.27 | −0.251 | 1.078 | 9.42/12 |
| 08 | 4.93 | 4.22 | 0.851 | 0.726 | 17.0/12 |
| 09 | −3.10 | 3.77 | −0.536 | 0.648 | 11.3/12 |
| 10 | 4.57 | 4.40 | 0.789 | 0.757 | 7.57/12 |
| 11 | 1.87 | 9.15 | 0.324 | 1.573 | 19.5/12 |
| 12 | −2.48 | 3.22 | −0.429 | 0.553 | 11.7/12 |
Table 5.
Number of clusters, , average ratio of hits per cluster, , and root mean square (RMS) values of the hits per cluster distributions, shown in Figure 8. Data are taken by MPX01-05 and MPX13 during the last horizontal van der Meer (vdM) scan of November 2012 (LHC fill 3316). For comparison, the corresponding values are given for one of the vertical vdM scans of July 2012 (LHC fill 2855). In this study, no noisy pixels are removed for the hit counting or cluster counting, and the smaller ratio in November for MPX01 can be explained by the increase in the number of noisy pixels during the year. Taken from Ref. [11].
| MPX | 01 | 02 | 03 | 04 | 05 | 13 | |
|---|---|---|---|---|---|---|---|
| 155,822 | 817 | 170 | 1294 | 285 | 1658 | ||
| NOV. | 2.65 | 4.13 | 4.04 | 4.08 | 4.20 | 4.98 | |
| RMS | 6.72 | 5.05 | 4.24 | 4.22 | 4.64 | 7.32 | |
| 61,068 | 811 | 160 | 1191 | 310 | 1470 | ||
| JULY | 5.04 | 4.95 | 4.65 | 4.08 | 3.51 | 4.67 | |
| RMS | 11.35 | 6.54 | 5.89 | 4.27 | 3.72 | 6.12 |
Table 6.
MPX01 vdM scan results for 2012 data. The fit results for the bunch-averaged horizontal, , and vertical, , convoluted beam sizes are given. The units of the specific luminosity, , are . Taken from Ref. [11].
Table 6.
MPX01 vdM scan results for 2012 data. The fit results for the bunch-averaged horizontal, , and vertical, , convoluted beam sizes are given. The units of the specific luminosity, , are . Taken from Ref. [11].
| Fill Number | Scan | (µm) | (µm) | ||
|---|---|---|---|---|---|
| APRIL | 2520 | 1 | 25.94 | 33.07 | 2086 |
| 2 | 26.04 | 32.65 | 2105 | ||
| 3 | 26.70 | 33.64 | 1992 | ||
| JULY | 2855 | 4 | 120.5 | 127.6 | 116 |
| 5 | 124.7 | 127.9 | 112 | ||
| 6 | 123.8 | 128.2 | 112 | ||
| 8 | 120.6 | 127.1 | 116 | ||
| NOVEMBER | 3311, 3316 | 10 | 121.4 | 128.2 | 114 |
| 11 | 129.3 | 129.6 | 106 | ||
| 14 | 139.9 | 131.0 | 97 | ||
| 15 | 119.3 | 133.6 | 112 |
Table 7.
Fit values of , and for the MPX devices with highest particle flux for statistical uncertainties only, and for systematic uncertainties only, constant in time, such that . LHC fill 3236. See Section 2.5 for the details. Taken from Ref. [11].
Table 7.
Fit values of , and for the MPX devices with highest particle flux for statistical uncertainties only, and for systematic uncertainties only, constant in time, such that . LHC fill 3236. See Section 2.5 for the details. Taken from Ref. [11].
| MPX | 01 | 02 | 03 | 04 | 05 | 13 | Mean | Standard Deviation |
|---|---|---|---|---|---|---|---|---|
| Statistical uncertainties only | ||||||||
| 14.82 | 14.81 | 14.84 | 14.79 | 14.81 | 14.83 | 14.82 | 0.02 | |
| (s) | 4.70 | 6.72 | 7.72 | 5.33 | 6.23 | 4.68 | 5.89 | 1.18 |
| (s) | 5.16 | 3.32 | 2.34 | 4.50 | 3.71 | 5.09 | 4.02 | 1.10 |
| Systematic uncertainties only | ||||||||
| 14.82 | 14.81 | 14.85 | 14.79 | 14.82 | 14.83 | 14.82 | 0.02 | |
| (s) | 4.98 | 7.00 | 8.22 | 5.41 | 6.37 | 4.94 | 6.15 | 1.30 |
| (s) | 4.91 | 3.06 | 1.91 | 4.44 | 3.59 | 4.87 | 3.80 | 1.18 |
Table 8.
Widths of the Gaussian fits to the pull distributions for MPX01-05 and MPX13. The widths are given for uncertainties resulting from the number of hits scaled by a factor for each MPX device, given in Table 5. The widths are also given for statistical and systematic uncertainties added in quadrature. The systematic uncertainties result from luminosity fluctuations not described by the fit function. Table 9 indicates the sizes of the uncertainty applied. LHC fill 3236. Taken from Ref. [11].
| MPX | 01 | 02 | 03 | 04 | 05 | 13 |
|---|---|---|---|---|---|---|
| Width pull stat. uncert. | 15.47 | 3.05 | 2.42 | 2.18 | 1.96 | 2.64 |
| Width pull total uncert. (0.03 sys.) | 1.00 | 1.68 | 2.10 | 1.64 | 1.82 | 1.44 |
Table 9.
Statistical uncertainty ranges for the data points in Figure 11. The uncertainty resulting from the number of hits is scaled by a factor , given in Table 5. The values are given for the beginning and end of the fit range. Shown also are the total uncertainties calculated adding in quadrature the statistical and systematic uncertainties, where the systematic uncertainties result from luminosity fluctuations not described by the fit function (), shown in Figure 12. LHC fill 3236. Taken from Ref. [11].
| MPX | 01 | 02 | 03 | 04 | 05 | 13 |
|---|---|---|---|---|---|---|
| stat. | 0.0023–0.0017 | 0.0249–0.0190 | 0.0702–0.0524 | 0.0435–0.0333 | 0.0679–0.0514 | 0.0229–0.0175 |
| total (0.03 sys.) | 0.0301–0.0300 | 0.0390–0.0355 | 0.0763–0.0604 | 0.0529–0.0448 | 0.0742–0.0595 | 0.0378–0.0347 |
Table 10.
Same as Table 9, but for LHC fill 3249. The systematic uncertainties result from luminosity fluctuations not described by the fit function (taking and 0.03), shown in Figure 20. LHC fill 3249. Taken from Ref. [11].
| MPX | 01 | 02 | 03 | 04 | 05 | 13 |
|---|---|---|---|---|---|---|
| stat. | 0.0022–0.0019 | 0.0237–0.0204 | 0.0668–0.0570 | 0.0419–0.0354 | 0.0653–0.0556 | 0.0220–0.0187 |
| total (0.02 sys.) | 0.0201–0.0201 | 0.0310–0.0286 | 0.0607–0.0604 | 0.0464–0.0407 | 0.0682–0.0591 | 0.0297–0.0274 |
| total (0.03 sys.) | 0.0301–0.0301 | 0.0383–0.0363 | 0.0732–0.0644 | 0.0515–0.0464 | 0.0652–0.0632 | 0.0372–0.0353 |
Table 11.
Widths of the Gaussian fits to the pull distributions for MPX01-05 and MPX13. The widths are given for uncertainties resulting from the number of hits scaled by a factor for each MPX device, given in Table 5. The widths are also given for statistical and systematic uncertainties added in quadrature, where the systematic uncertainties result from luminosity fluctuations not described by the fit function (taking 0.02 and 0.03). Table 10 indicates the sizes of the uncertainty applied. LHC fill 3249. Taken from Ref. [11].
| MPX | 01 | 02 | 03 | 04 | 05 | 13 |
|---|---|---|---|---|---|---|
| Width pull stat. uncert. | 12.69 | 2.76 | 2.74 | 2.08 | 2.06 | 2.90 |
| Width pull total uncert. (0.02 sys.) | 1.24 | 2.07 | 2.57 | 1.78 | 1.93 | 1.96 |
| Width pull total uncert. (0.03 sys.) | 0.80 | 1.54 | 2.42 | 1.67 | 1.81 | 1.53 |
Table 12.
TPX device locations with respect to the interaction point. Z is the longitudinal distance from the interaction point, and R is the distance from the beam axis. Their uncertainty is about 10 mm. The particle fluxes, normalized to 100% acquisition time, are listed. Taken from Ref. [14].
Table 12.
TPX device locations with respect to the interaction point. Z is the longitudinal distance from the interaction point, and R is the distance from the beam axis. Their uncertainty is about 10 mm. The particle fluxes, normalized to 100% acquisition time, are listed. Taken from Ref. [14].
| Device | Z (mm) | R (mm) | TPX Clusters per Unit Sensor Area and per Unit Luminosity | |
|---|---|---|---|---|
| Layer 1 | Layer 2 | |||
| TPX02 | 3540 | 1115 | 67,900 | 77,900 |
| TPX12 | −3540 | 1146 | 63,800 | 72,300 |
Table 13.
vdM scan results for 2015 data. The scan was performed on 24–25 August (LHC fill 4266) and the first horizontal and vertical scans were used. The fit results for the first bunch-averaged horizontal. , and vertical, , convoluted beam sizes are given, as well as the specific luminosity. The hit rate at the peak is averaged over the horizontal and vertical scans. Taken from Ref. [14].
| TPX | Layer | ||||
|---|---|---|---|---|---|
| (μm) | (μm) | (μ) | () | ||
| 02 | 1 | 130.2 | 117.7 | 116.8 | 1495 |
| 02 | 2 | 130.2 | 118.6 | 115.9 | 2386 |
| 12 | 1 | 128.7 | 118.1 | 117.8 | 1386 |
| 12 | 2 | 128.3 | 118.7 | 117.5 | 2298 |
Table 14.
Normalization () to convert hit rates to luminosities. The larger values are for the thicker sensor layer. Taken from Ref. [14].
Table 14.
Normalization () to convert hit rates to luminosities. The larger values are for the thicker sensor layer. Taken from Ref. [14].
| Device | Layer | 1/nf (Hits/μ) |
|---|---|---|
| TPX02 | 1 | 544.8 |
| TPX02 | 2 | 876.1 |
| TPX12 | 1 | 500.9 |
| TPX12 | 2 | 832.2 |
Table 15.
Parameters of the LHC proton–proton collisions for the 2015 fills analyzed with TPX02 and TPX12 in the fitting of LHC luminosity reduction curve. is the luminosity, and is the average number of interactions per bunch crossing at the start of the LHC fill. The is given for the start of the LHC fill, and is given at the start time of the fit for the first time period. Taken from Ref. [14].
| Date in 2015 | Fill | Start Time | Colliding Bunches | |||||
|---|---|---|---|---|---|---|---|---|
| (Unix Time) | ||||||||
| 29 September | 4440 | 1443525360 | 1650 | 3360 | 24.8 | 1453 | 0.2815 | 0.1833 |
| 2–3 October | 4449 | 1443785520 | 1607 | 3240 | 26.0 | 1453 | 0.2787 | 0.1615 |
| 6–7 October | 4467 | 1444149360 | 1729 | 3700 | 24.1 | 1596 | 0.2958 | 0.1873 |
| 9–11 October | 4479 | 1444427640 | 1950 | 4240 | 24.6 | 1813 | 0.3006 | 0.2194 |
| 30–31 October | 4557 | 1446221040 | 2388 | 4450 | 24.7 | 2232 | 0.2576 | 0.1840 |
| 31 October–1 November | 4560 | 1446311100 | 2610 | 5020 | 24.5 | 2232 | 0.2659 | 0.1859 |
Table 16.
Precision of TPX02 and TPX12 luminosity measurements for the average of layers 1 and 2. The precision is given for 1 frame and for 10, 20, 30 and 40 frames combined. The width of the Gaussian fit gives the precision of the measurement, and gives the width of the fit of the pull distribution with statistical uncertainties only. LHC fill 4449. Taken from Ref. [14].
| Frames Used | (%) | |||||||
|---|---|---|---|---|---|---|---|---|
| TPX02 | TPX12 | TPX02 | TPX12 | |||||
| Layer 1 | Layer 2 | Layer 1 | Layer 2 | Layer 1 | Layer 2 | Layer 1 | Layer 2 | |
| 1 | 0.36 | 0.35 | 0.37 | 0.36 | 1.27 | 1.58 | 1.28 | 1.57 |
| 10 | 0.13 | 0.13 | 0.15 | 0.13 | 1.47 | 1.87 | 1.61 | 1.82 |
| 20 | 0.11 | 0.10 | 0.13 | 0.11 | 1.71 | 2.04 | 1.96 | 2.12 |
| 30 | 0.10 | 0.09 | 0.11 | 0.10 | 1.96 | 2.18 | 2.17 | 2.40 |
| 40 | 0.09 | 0.08 | 0.11 | 0.09 | 2.13 | 2.39 | 2.24 | 2.56 |
Table 17.
Precision of TPX02 and TPX12 luminosity measurements with respect to the fitted curve for the average of layers 1 and 2. The precision is given for 1 frame and for 10, 20, 30 and 40 frames combined. The width of the Gaussian fit gives the precision of the measurement and gives the width of the fit of the pull distribution with statistical uncertainties only. LHC fill 4449. Taken from Ref. [14].
| Frames Used | (%) | |||
|---|---|---|---|---|
| TPX02 | TPX12 | TPX02 | TPX12 | |
| 1 | 0.30 | 0.30 | 1.50 | 1.57 |
| 10 | 0.11 | 0.12 | 1.76 | 1.94 |
| 20 | 0.09 | 0.10 | 1.96 | 2.36 |
| 30 | 0.08 | 0.09 | 2.21 | 2.56 |
| 40 | 0.08 | 0.09 | 2.35 | 2.88 |
Table 18.
Precision of TPX02 and TPX12 luminosity measurements between layers 1 and 2. The precision is given for 1 frame and for 10, 20, 30, and 40 frames combined. The width of the Gaussian fit gives the precision of the measurement and gives the width of the fit of the pull distribution with statistical uncertainties only. LHC fill 4449. Taken from Ref. [14].
| Frames Used | (%) | |||
|---|---|---|---|---|
| TPX02 | TPX12 | TPX02 | TPX12 | |
| 1 | 0.41 | 0.41 | 1.15 | 1.12 |
| 10 | 0.16 | 0.17 | 1.44 | 1.45 |
| 20 | 0.14 | 0.14 | 1.66 | 1.66 |
| 30 | 0.12 | 0.13 | 1.89 | 2.04 |
| 40 | 0.11 | 0.13 | 1.95 | 2.09 |
Table 19.
Slope of time history of the luminosity ratio measured by layers 1 and 2 for TPX02 and TPX12. The slope values and the uncertainties are given per second and in percentage per 100 days. Taken from Ref. [14].
Table 19.
Slope of time history of the luminosity ratio measured by layers 1 and 2 for TPX02 and TPX12. The slope values and the uncertainties are given per second and in percentage per 100 days. Taken from Ref. [14].
| TPX | Slope | Slope | Slope | Slope |
|---|---|---|---|---|
| () | () | (%/100 d) | (%/100 d) | |
| 02 | 1.71 | 0.15 | ||
| 12 | 1.62 | 0.14 |
Table 20.
Slope of time history of the luminosity ratio measured by TPX02 and TPX12 averaged over the data recorded by layers 1 and 2. The slope values and the uncertainties are given per second and in percent per 100 days. Taken from Ref. [14].
Table 20.
Slope of time history of the luminosity ratio measured by TPX02 and TPX12 averaged over the data recorded by layers 1 and 2. The slope values and the uncertainties are given per second and in percent per 100 days. Taken from Ref. [14].
| TPX | Slope | Slope | Slope | Slope |
|---|---|---|---|---|
| () | () | (%/100 d) | (%/100 d) | |
| 02/12 | 0.25 | 0.89 | 0.02 | 0.08 |
Table 21.
Life times of components from activation contributions to the total TPX count rates. Taken from Ref. [15].
Table 21.
Life times of components from activation contributions to the total TPX count rates. Taken from Ref. [15].
| Components | 1 | 2 | 3 | 4 | 5 | 6 | 7 |
|---|---|---|---|---|---|---|---|
| Life times | 25.7 | 2.82 | 33.0 | 3.58 | 16.8 | 6.94 | 102 |
| (s) | (min) | (min) | (h) | (h) | (d) | (d) |
Table 22.
vdM scan results for 2016 data. The scan was performed on 18 May (LHC fill 4945) and the first horizontal and vertical scans were used. The fit results for the first bunch-averaged horizontal and vertical convoluted beam sizes are given, as well as the specific luminosity. The peak luminosity takes the LHC operation parameters into account. The hit rate at the peak is averaged over the horizontal and vertical scans. Normalization factors () convert hit rates to luminosities. The larger values are for the thicker sensor layer. Taken from Ref. [15].
| Device | Layer | ||||||
|---|---|---|---|---|---|---|---|
| (μm) | (μm) | (μ) | (μ) | (hits/s) | (hits/μ) | ||
| TPX02 | 1 | 132.2 | 128.6 | 105.3 | 2.512 | 1020 | 405.8 |
| TPX02 | 2 | 133.3 | 128.4 | 104.6 | 2.485 | 1602 | 639.0 |
| TPX12 | 1 | 131.6 | 127.1 | 107.0 | 2.554 | 905.4 | 357.2 |
| TPX12 | 2 | 134.1 | 129.0 | 103.5 | 2.469 | 1564 | 634.2 |
Table 23.
vdM scan results for 2016 data. The scan was performed on 27 May (LHC fill 4954) and the first horizontal and vertical scans were used. The fit results for the first bunch-averaged horizontal and vertical convoluted beam sizes are given, as well as the specific luminosity. The peak luminosity takes the LHC operation parameters into account. The hit rate at the peak is averaged over the horizontal and vertical scans. Normalization factors () convert hit rates to luminosities. The larger values are for the thicker sensor layer. Taken from Ref. [15].
| Device | Layer | ||||||
|---|---|---|---|---|---|---|---|
| (μm) | (μm) | (μ) | (μ) | (hits/s) | (hits/μ) | ||
| TPX02 | 1 | 133.2 | 119.4 | 112.5 | 2.659 | 1082 | 406.9 |
| TPX02 | 2 | 134.1 | 120.9 | 110.5 | 2.611 | 1648 | 631.7 |
| TPX12 | 1 | 133.5 | 121.2 | 110.6 | 2.614 | 940.5 | 359.8 |
| TPX12 | 2 | 132.2 | 121.3 | 111.6 | 2.638 | 1566 | 615.4 |
Table 24.
Normalization () to convert hit rates to luminosities. The larger values are for the thicker sensor layer. The relative uncertainties with respect to the 18 and 27 May 2016 measurements are also listed. Taken from Ref. [15].
Table 24.
Normalization () to convert hit rates to luminosities. The larger values are for the thicker sensor layer. The relative uncertainties with respect to the 18 and 27 May 2016 measurements are also listed. Taken from Ref. [15].
| Device | Layer | Uncertainty | |
|---|---|---|---|
| (hits/μ) | (in %) | ||
| TPX02 | 1 | 406.3 | |
| TPX02 | 2 | 635.3 | |
| TPX12 | 1 | 358.5 | |
| TPX12 | 2 | 624.8 |
Table 25.
LHC-delivered luminosities in Run-2 during 2015 to 2018 operation. Taken from Ref. [36].
Table 25.
LHC-delivered luminosities in Run-2 during 2015 to 2018 operation. Taken from Ref. [36].
| Year | 2015 | 2016 | 2017 | 2018 |
|---|---|---|---|---|
| L (fb) | 4.2 | 38.5 | 50.2 | 63.3 |
Table 26.
Summary of 2016 long-term stability. Z is the distance from the IP along the beam-pipe, and R is the distance from the beam-pipe. High-rate devices are in bold. Taken from Ref. [16].
Table 26.
Summary of 2016 long-term stability. Z is the distance from the IP along the beam-pipe, and R is the distance from the beam-pipe. High-rate devices are in bold. Taken from Ref. [16].
| TPX | Z (m) | R (m) | Clusters per Unit Sensor Area and Luminosity (cm/nb) | Slope (%/100 d) | ||
|---|---|---|---|---|---|---|
| Layer 1 | Layer 2 | Layer 1 | Layer 2 | |||
| 04 | 2.83 | 3.71 | 43.6 | 50.6 | ref | ref |
| 05 | 7.83 | 1.41 | 71.9 | 83.9 | ± 0.26 | −0.41 ± 0.18 |
| 06 | 7.83 | 2.58 | 19.0 | 22.2 | ± 0.24 | 0.60 ± 0.20 |
| 14 | 3.71 | 42.4 | 48.7 | 0.90 ± 0.14 | 0.34 ± 0.15 | |
| 02 | 3.54 | 1.12 | 67,900 | 77,900 | ||
| 12 | 1.15 | 63,800 | 72,300 | |||
| 13 | 1.11 | 66,600 | 76,200 | |||
Table 27.
TPX device locations with respect to the interaction point. Z is the longitudinal distance from the interaction point, and R is the distance from the beam axis. Their uncertainty is about 10 mm. The ordering in the table is given with decreasing particle fluxes, normalized to 100% acquisition time. Only devices operated for cluster counting throughout the year 2015 are used for the heavy blob (thermal neutron) analysis, as indicated. * Rejected during analysis because of a too small count rate. Taken from Ref. [17].
| Device | Z (mm) | R (mm) | TPX Clusters per Unit Sensor Area and Luminosity | Used for th. Neutron Analysis | |
|---|---|---|---|---|---|
| Layer 1 | Layer 2 | ||||
| TPX01 | 3540 | 1106 | 68,600 | 78,700 | Yes |
| TPX11 | 1116 | 68,500 | 77,500 | Yes | |
| TPX02 | 3540 | 1115 | 67,900 | 77,900 | No |
| TPX12 | 1146 | 63,800 | 72,300 | No | |
| TPX03 | 3540 | 1140 | 62,400 | 72,300 | Yes |
| TPX05 | 7830 | 1409 | 71.9 | 83.9 | Yes |
| TPX04 | 2830 | 3709 | 43.6 | 50.6 | Yes |
| TPX14 | 3709 | 42.4 | 48.7 | Yes | |
| TPX06 | 7830 | 2584 | 19.0 | 22.2 | Yes |
| TPX07 | 7830 | 3663 | 7.70 | 9.56 | Yes |
| TPX09 | 15,390 | 1560 | 6.06 | 7.31 | Yes |
| TPX08 | 7220 | 6140 | 1.76 | 2.12 | Yes |
| TPX15 | 5020 | 16,690 | 0.24 | 0.30 | No * |
Table 28.
Inverse normalization factors () to convert HB rates to luminosities. Taken from Ref. [17].
Table 28.
Inverse normalization factors () to convert HB rates to luminosities. Taken from Ref. [17].
| Device | (HB/) | |
|---|---|---|
| Layer 1 | Layer 2 | |
| TPX01 | 138.7 | 57.51 |
| TPX03 | 142.7 | 101.2 |
| TPX04 | 1.794 | 1.658 |
| TPX05 | 2.357 | 2.987 |
| TPX06 | 0.7693 | 0.6960 |
| TPX07 | 0.1397 | 0.1359 |
| TPX08 | 0.01446 | 0.01158 |
| TPX09 | 0.06091 | 0.04994 |
| TPX11 | 162.8 | 103.2 |
| TPX14 | 1.876 | 1.922 |
Table 29.
Slope of time history of the luminosity ratio measured by layers 1 and 2 for TPX04 and TPX14. The slope values and the uncertainties are given per second and in percent per 100 days. Taken from Ref. [17].
Table 29.
Slope of time history of the luminosity ratio measured by layers 1 and 2 for TPX04 and TPX14. The slope values and the uncertainties are given per second and in percent per 100 days. Taken from Ref. [17].
| TPX | Slope | Slope | ||
|---|---|---|---|---|
| () | () | (%/100 d) | (%/100 d) | |
| 04 | 8.63 | 0.75 | ||
| 14 | 14.67 | 1.27 |
Table 30.
Slope of time history of the luminosity ratio measured by TPX04 and TPX14. The measurements are averaged over the data recorded by layers 1 and 2. The slope values and the uncertainties are given per second and in percent per 100 days. Taken from Ref. [17].
Table 30.
Slope of time history of the luminosity ratio measured by TPX04 and TPX14. The measurements are averaged over the data recorded by layers 1 and 2. The slope values and the uncertainties are given per second and in percent per 100 days. Taken from Ref. [17].
| TPX | Slope | Slope | ||
|---|---|---|---|---|
| () | () | (%/100 d) | (%/100 d) | |
| 04/14 | 10.20 | 0.88 |
Table 31.
TPX3 device location with respect to the interaction point. Z is the longitudinal distance from the interaction point along the beam axis and R is the distance from the beam axis. Their uncertainty is about 10 mm. The approximate particle flux is given as an average of detector layers 1 and 2. Taken from Ref. [18].
| Device | Z (mm) | R (mm) | Cluster Rate per Unit Sensor Area and per Unit Luminosity |
|---|---|---|---|
| TPX3 | 2830 | 3700 | 68 |
Table 32.
Approximate normalization () to convert hit and cluster rates to luminosities. Taken from Ref. [18].
Table 32.
Approximate normalization () to convert hit and cluster rates to luminosities. Taken from Ref. [18].
| Layer | ||
|---|---|---|
| (hits/) | (clusters/) | |
| 1 | 1795 | 134 |
| 2 | 1680 | 136 |
Table 33.
Precision of TPX3 luminosity measurements for layers 1 and 2 for hit- and cluster-counting in LHC fill 6677. The width of the Gaussian fit gives the precision of the measurement, and gives the width of the pull distribution fit with statistical uncertainties only. Taken from Ref. [18].
Table 33.
Precision of TPX3 luminosity measurements for layers 1 and 2 for hit- and cluster-counting in LHC fill 6677. The width of the Gaussian fit gives the precision of the measurement, and gives the width of the pull distribution fit with statistical uncertainties only. Taken from Ref. [18].
| Method | (%) | |||
|---|---|---|---|---|
| Layer 1 | Layer 2 | Layer 1 | Layer 2 | |
| hit-counting | 0.86 | 0.87 | 8.73 | 8.97 |
| cluster-counting | 0.48 | 0.47 | 1.42 | 1.37 |
Table 34.
Effect of LHC small-amplitude beam-separation scans on the precision of TPX3 luminosity measurements for layer 1 cluster-counting in LHC fill 6677. The width of the Gaussian fit gives the precision of the measurement, and gives the width of the pull distribution fit with statistical uncertainties only. Three cases are under consideration: (1) fitting the LHC luminosity curve while ignoring the amplitude scans, (2) fitting the LHC luminosity curve with a separate luminosity amplitude after each scan, and (3) fitting the LHC luminosity curve with a separate luminosity amplitude, and after each scan. Taken from Ref. [18].
| Case | (%) | |
|---|---|---|
| ine 1 | 0.48 | 1.42 |
| 2 | 0.43 | 1.22 |
| 3 | 0.40 | 1.15 |
Publisher’s Note: MDPI stays neutral with regard to jurisdictional claims in published maps and institutional affiliations. |
© 2021 by the author. Licensee MDPI, Basel, Switzerland. This article is an open access article distributed under the terms and conditions of the Creative Commons Attribution (CC BY) license (https://creativecommons.org/licenses/by/4.0/).
Share and Cite
MDPI and ACS Style
Sopczak, A. Luminosity Measurements at the LHC at CERN Using Medipix, Timepix and Timepix3 Devices. Physics 2021, 3, 579-654. https://0-doi-org.brum.beds.ac.uk/10.3390/physics3030037
AMA Style
Sopczak A. Luminosity Measurements at the LHC at CERN Using Medipix, Timepix and Timepix3 Devices. Physics. 2021; 3(3):579-654. https://0-doi-org.brum.beds.ac.uk/10.3390/physics3030037
Chicago/Turabian StyleSopczak, André. 2021. "Luminosity Measurements at the LHC at CERN Using Medipix, Timepix and Timepix3 Devices" Physics 3, no. 3: 579-654. https://0-doi-org.brum.beds.ac.uk/10.3390/physics3030037