1. Introduction
Composites filled with ferromagnetic inclusions possess a combination of promising magnetic, electrical, optical, and mechanical properties. High-frequency magnetic properties of the composites are useful in the development of various microwave devices [
1,
2,
3,
4,
5]. The performance of microwave devices is dependent on both the material properties (such as the saturation magnetization and the permeability) and the demagnetization effects [
6,
7,
8,
9].
The microwave spectrum of permeability of composites may have a complicated shape comprising several magnetic loss peaks. The reliable techniques for the interpretation of the peaks are not found in the archived literature. The standard ferromagnetic resonance (FMR) technique [
10,
11,
12] makes it possible to find the magnetic characteristics of materials, but the observed peaks may not be interpreted. Moreover, extraneous resonances can be observed in addition to FMR, the appearance of which is difficult to explain [
13].
Many studies concerned with developments in microwave electronics insist on the important role played by the demagnetizing effects on devices [
6,
7,
8,
9]. In the case of composites, the influence of demagnetization effects depends not only on the shape of the device but also on the concentration of the ferromagnetic inclusions in the composite. The effect of demagnetization on composites was studied in [
14,
15,
16].
Thus, for the use of composites in microwave devices, knowledge of both demagnetizing effects and the physical mechanisms resulting in the appearance of the magnetic loss peaks is important.
The technique proposed in [
17,
18] may be used to study demagnetization effects, to interpret the magnetic loss peaks, and to determine the saturation magnetization. The technique represents the coaxial measurements of complex permeability depending both on frequency,
f, and on external field,
H:
μ(
f,
H) = Re[μ (
f,
H)] + i·Im[μ(
f,
H)]. The measuring coaxial cell is placed inside a coil that creates magnetic bias parallel to the coaxial axis.
The measurements under various permanent magnetic fields provide an opportunity to compare the magnetic characteristics of a sample in both the demagnetized and magnetized states, determine the physical mechanisms responsible for different peaks of magnetic loss, and find the magnetic characteristics of the material.
The aim of the paper is to study the effect of demagnetization on the microwave permeability of composites and to interpret observed magnetic loss peaks by this technique. The samples under study are composites filled with flake-shaped sendust (Al0.054Si0.096Fe0.85) particles.
It is found that the magnetic loss peak of isotropic composite is split under external fields of more than 1.5 kOe. To search for the reasons for the peak splitting, the demagnetizing effects are studied on the samples with different thicknesses and samples with an anisotropic distribution of inclusions. Measurements of the samples with an anisotropic orientation of particles may provide important data on the features of the demagnetization of composite materials.
2. Materials and Methods
The samples under study are composites with a paraffin wax matrix filled with flake-shaped sendust (Al
0.054Si
0.096Fe
0.85) particles. The flake particles were obtained by spraying a molten sendust alloy and grinding the resulting particles with a ball mill. Particles with a size of 40 to 63 μm were obtained by sieving. The thickness of the particles was about 1–2 μm. SEM (scanning electron microscope) microphotos of the particles and the curve of particle size distribution are presented in [
19]. The samples were made by mixing sendust powder and melted paraffin wax. Mixing was continued until the solidification of the mixture. The resulting mixture was pressed into the coaxial sample with an outer diameter of 7 mm and an inner diameter of 3 mm. The samples with a volume concentration of inclusions of 2 to 12 vol.% were made. The concentration of inclusions was found from the thickness of the sample and the masses of paraffin, filler, and the obtained sample. The volume concentration of air pores was less than 3%.
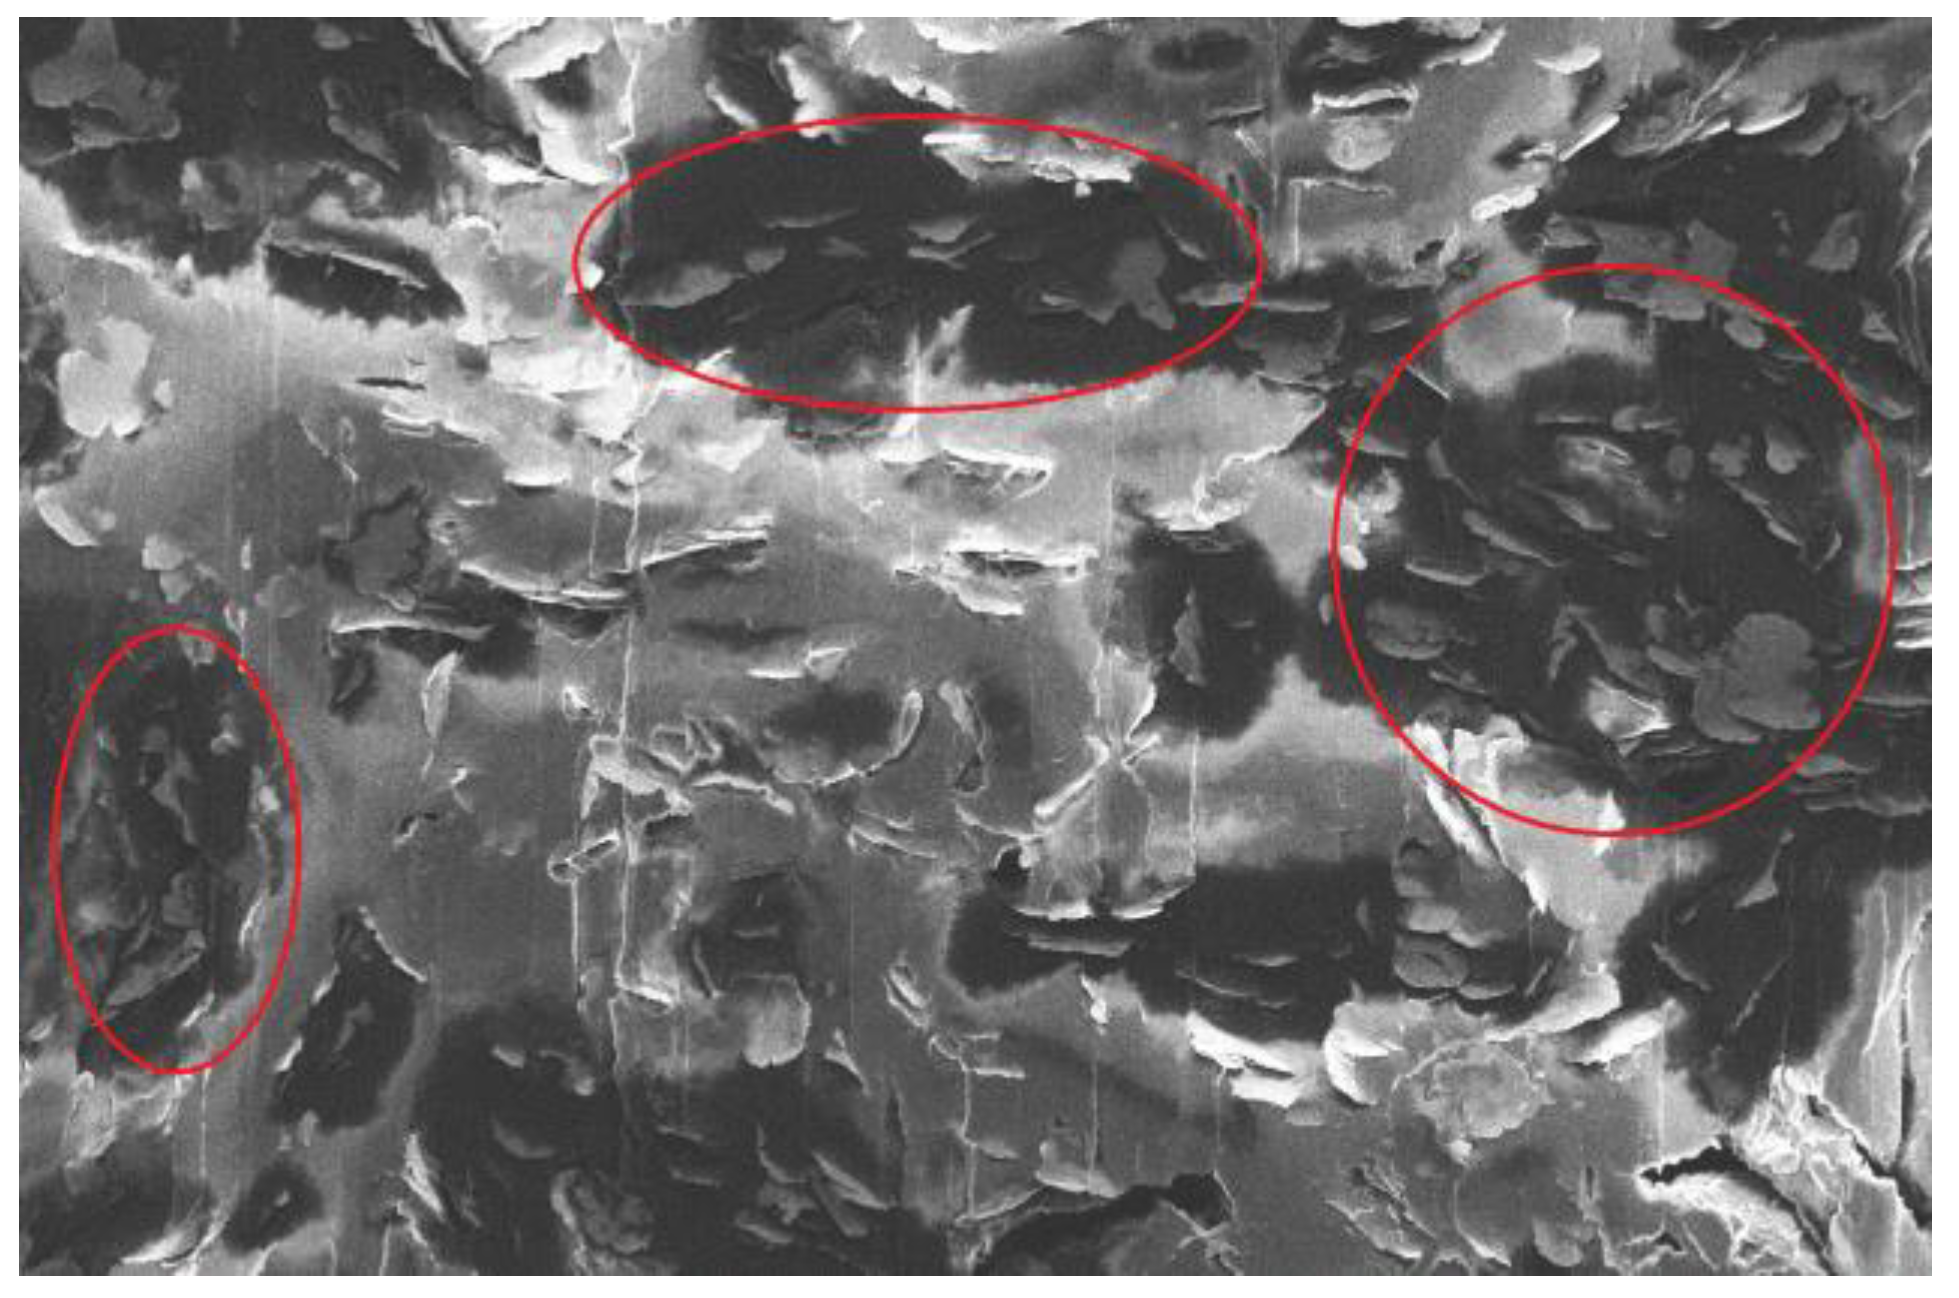
An SEM microphoto of the sample with 4% volume fraction of inclusions is shown in
Figure 1. The sample contains clusters of particles. They are marked in red in the figure. It is seen that the inclusions are randomly distributed in all directions and the sample may be considered isotropic.
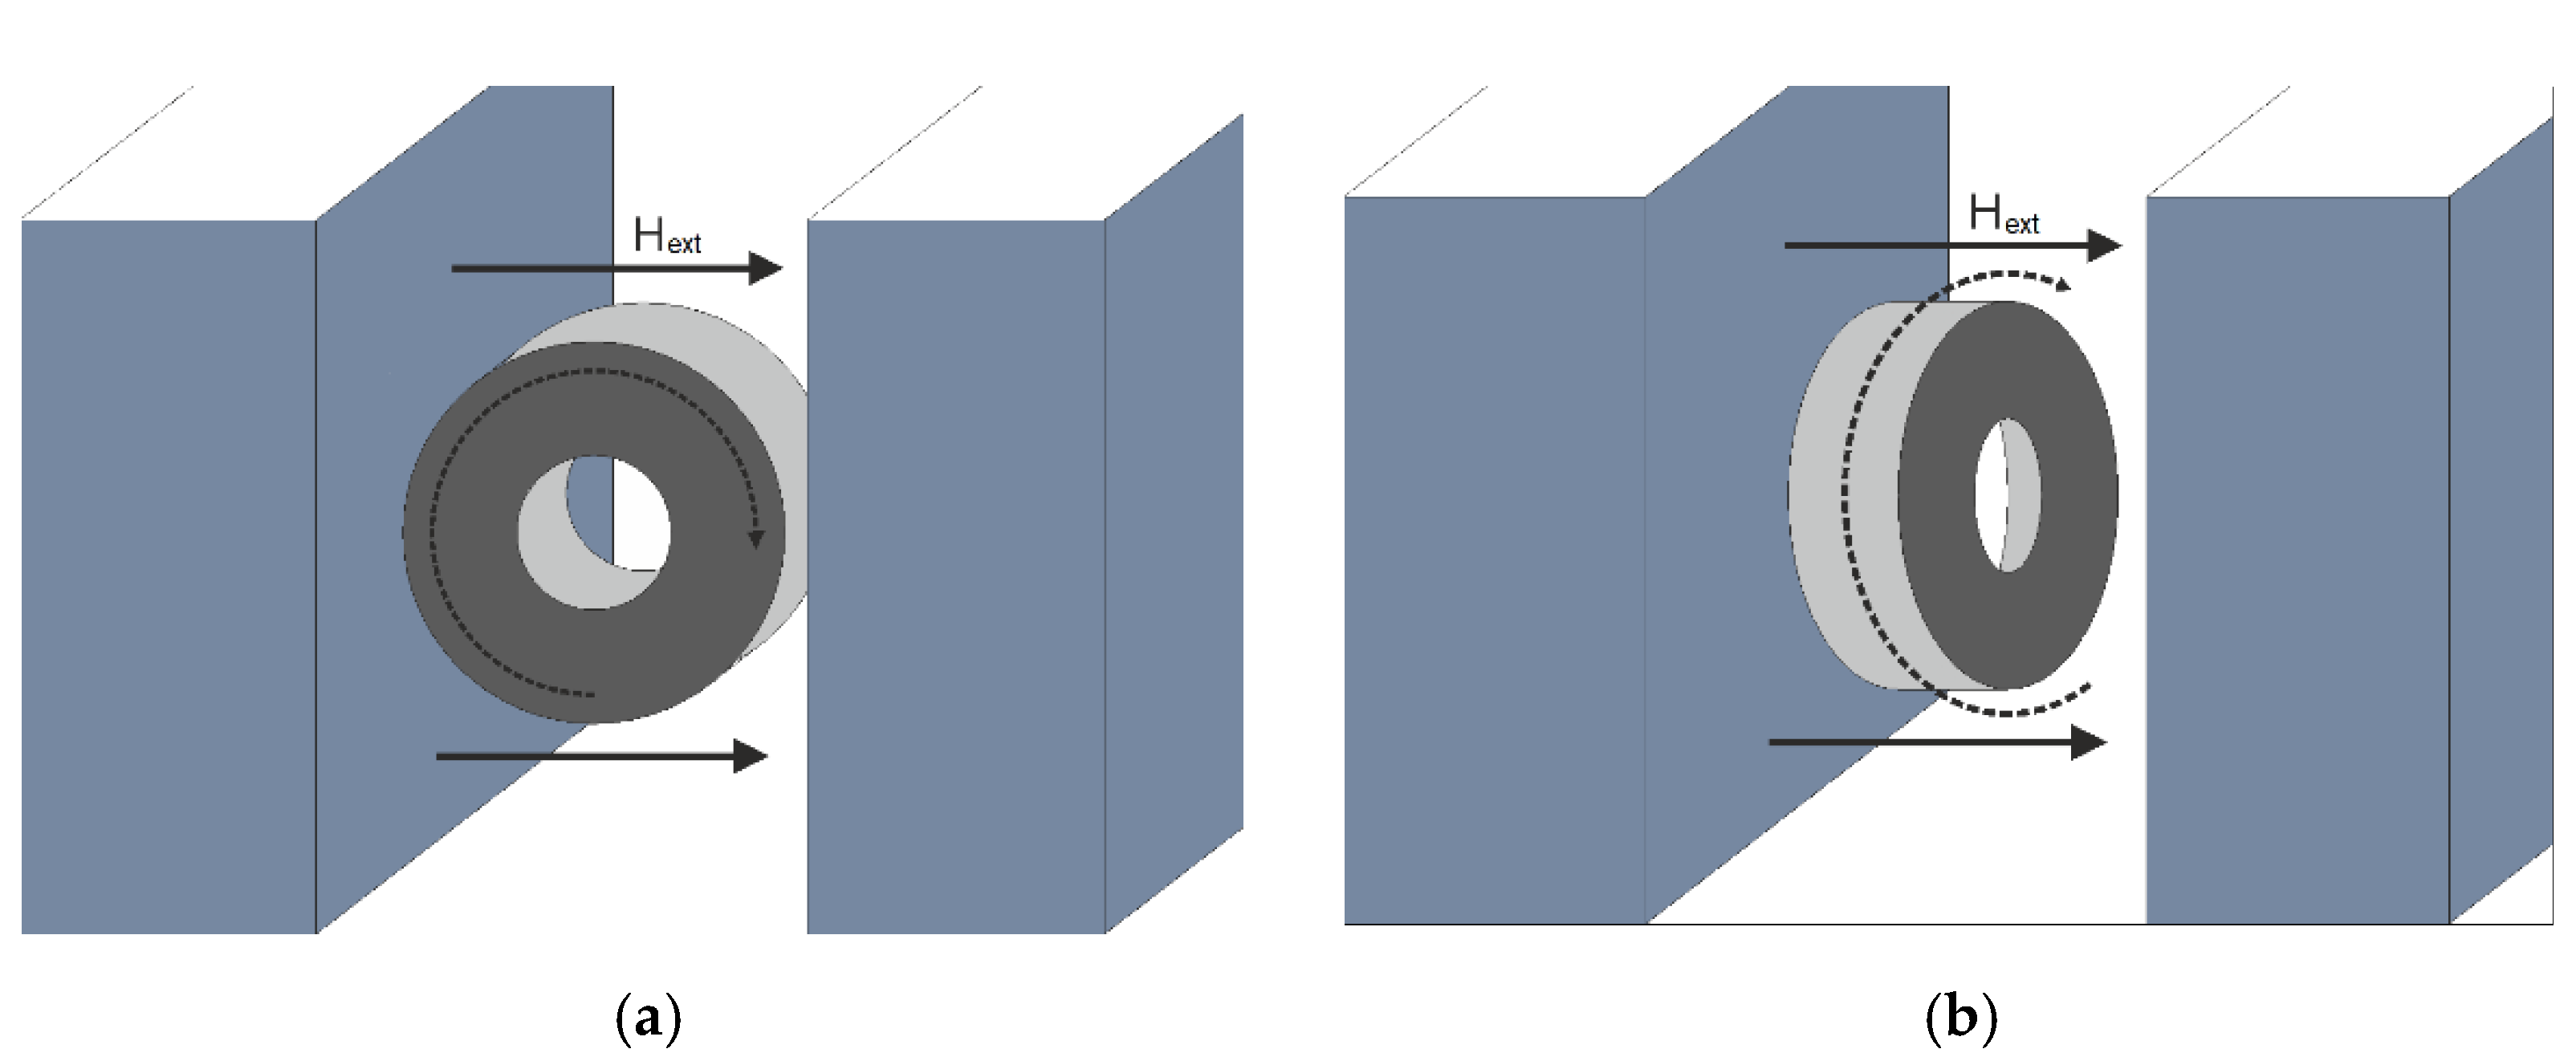
Anisotropic composites were made from isotropic samples with a 4% volume fraction of inclusions. The isotropic samples were placed in a sealed coaxial mold. The mold with the sample was heated to 100 °C for one minute until the paraffin wax melts. During the heating process, the mold was slowly rotated to avoid the formation of particle clusters due to the influence of gravity. Then, the mold with the molten sample was placed inside the electromagnet, and the magnetic field Hext was increased up to 10 kOe. The mold was also rotated inside the electromagnet for five minutes until the paraffin solidified in the sample.
Two anisotropic samples with different particle distributions were prepared. The first sample was placed and rotated in the electromagnet as shown in
Figure 2a. With this orientation of the sample, the external field is perpendicular to the coaxial axis, and the flake-shaped particles in the sample are oriented in the plane perpendicular to the coaxial axis. The position of the second sample in the electromagnet is shown in
Figure 2b: the magnetic field is directed along the coaxial axis; rotation was also carried out around this axis. In this case, planar particles can be oriented in all planes parallel to the coaxial axis. In both samples, the volume fraction of inclusions is 4%.
The frequency dependencies of microwave permittivity and permeability of the samples were measured by the Nicolson–Ross–Weir [
19,
20] (NRW) technique in a 7/3 coaxial line in the frequency range of 0.1 to 20 GHz by a vector network analyzer. The measurement cell was placed inside a coil producing a static magnetic field H
bias up to 2400 Oe. The permanent magnetic field was directed parallel to the coaxial axis and perpendicular to the microwave magnetic field. Each sample was additionally pressed in the measuring cell in order to reduce the gaps between the sample and the walls of the cell. This allowed the error in the measured permittivity to be diminished.
3. Theoretical Background
In the absence of an external magnetic field, the magnetic moments of the ferromagnetic particles of the composites are oriented along the anisotropy fields, which are randomly distributed in directions. An increase in the external magnetic field leads to the disappearance of the domain structure, the rotation of the magnetization vectors in the direction of the external field, and a decrease in the inhomogeneous distribution of magnetization vectors in the material. If the sample is magnetized to saturation (the magnetic moments of all particles are directed along the external field), the permeability obeys the theory of Landau–Lifshitz–Gilbert (LLG) [
21,
22] and Kittel [
23]. It is expected that only the magnetic loss peak associated with the uniform ferromagnetic resonance remains. This behavior was observed both in thin ferromagnetic films [
24,
25] and in composite materials [
26]. The resonance frequency of platelet particles and thin ferromagnetic films depends on the external field according to Kittel’s law:
where
γ is the gyromagnetic ratio,
Hk is the anisotropy field,
Hbias is the external magnetic field, 4π
M0 is the saturation magnetization, and
fres is the resonant frequency. The anisotropy field and the saturation magnetization are often found by the FMR technique and Kittel’s law (1) [
27,
28]. Measurements of the microwave permeability under a magnetic field can also be used to determine these magnetic characteristics [
17].
The permeability associated with the ferromagnetic resonance is described by the LLG dispersion law [
29]. In the case of thin films and platelet inclusions, the difference between LLG and Lorentzian dispersion laws is insignificant [
21]. The LLG parameters may be obtained from the parameters of Lorentzian law [
29]. Therefore, one describes the microwave permeability by the Lorentzian law [
30,
31,
32]:
where
μ∞ is the optical permeability equal to unity in most magnetic materials,
μst is the static permeability,
frel is the relaxation frequency,
fres is the resonant frequency, and
n is the number of resonances.
4. Results and Discussion
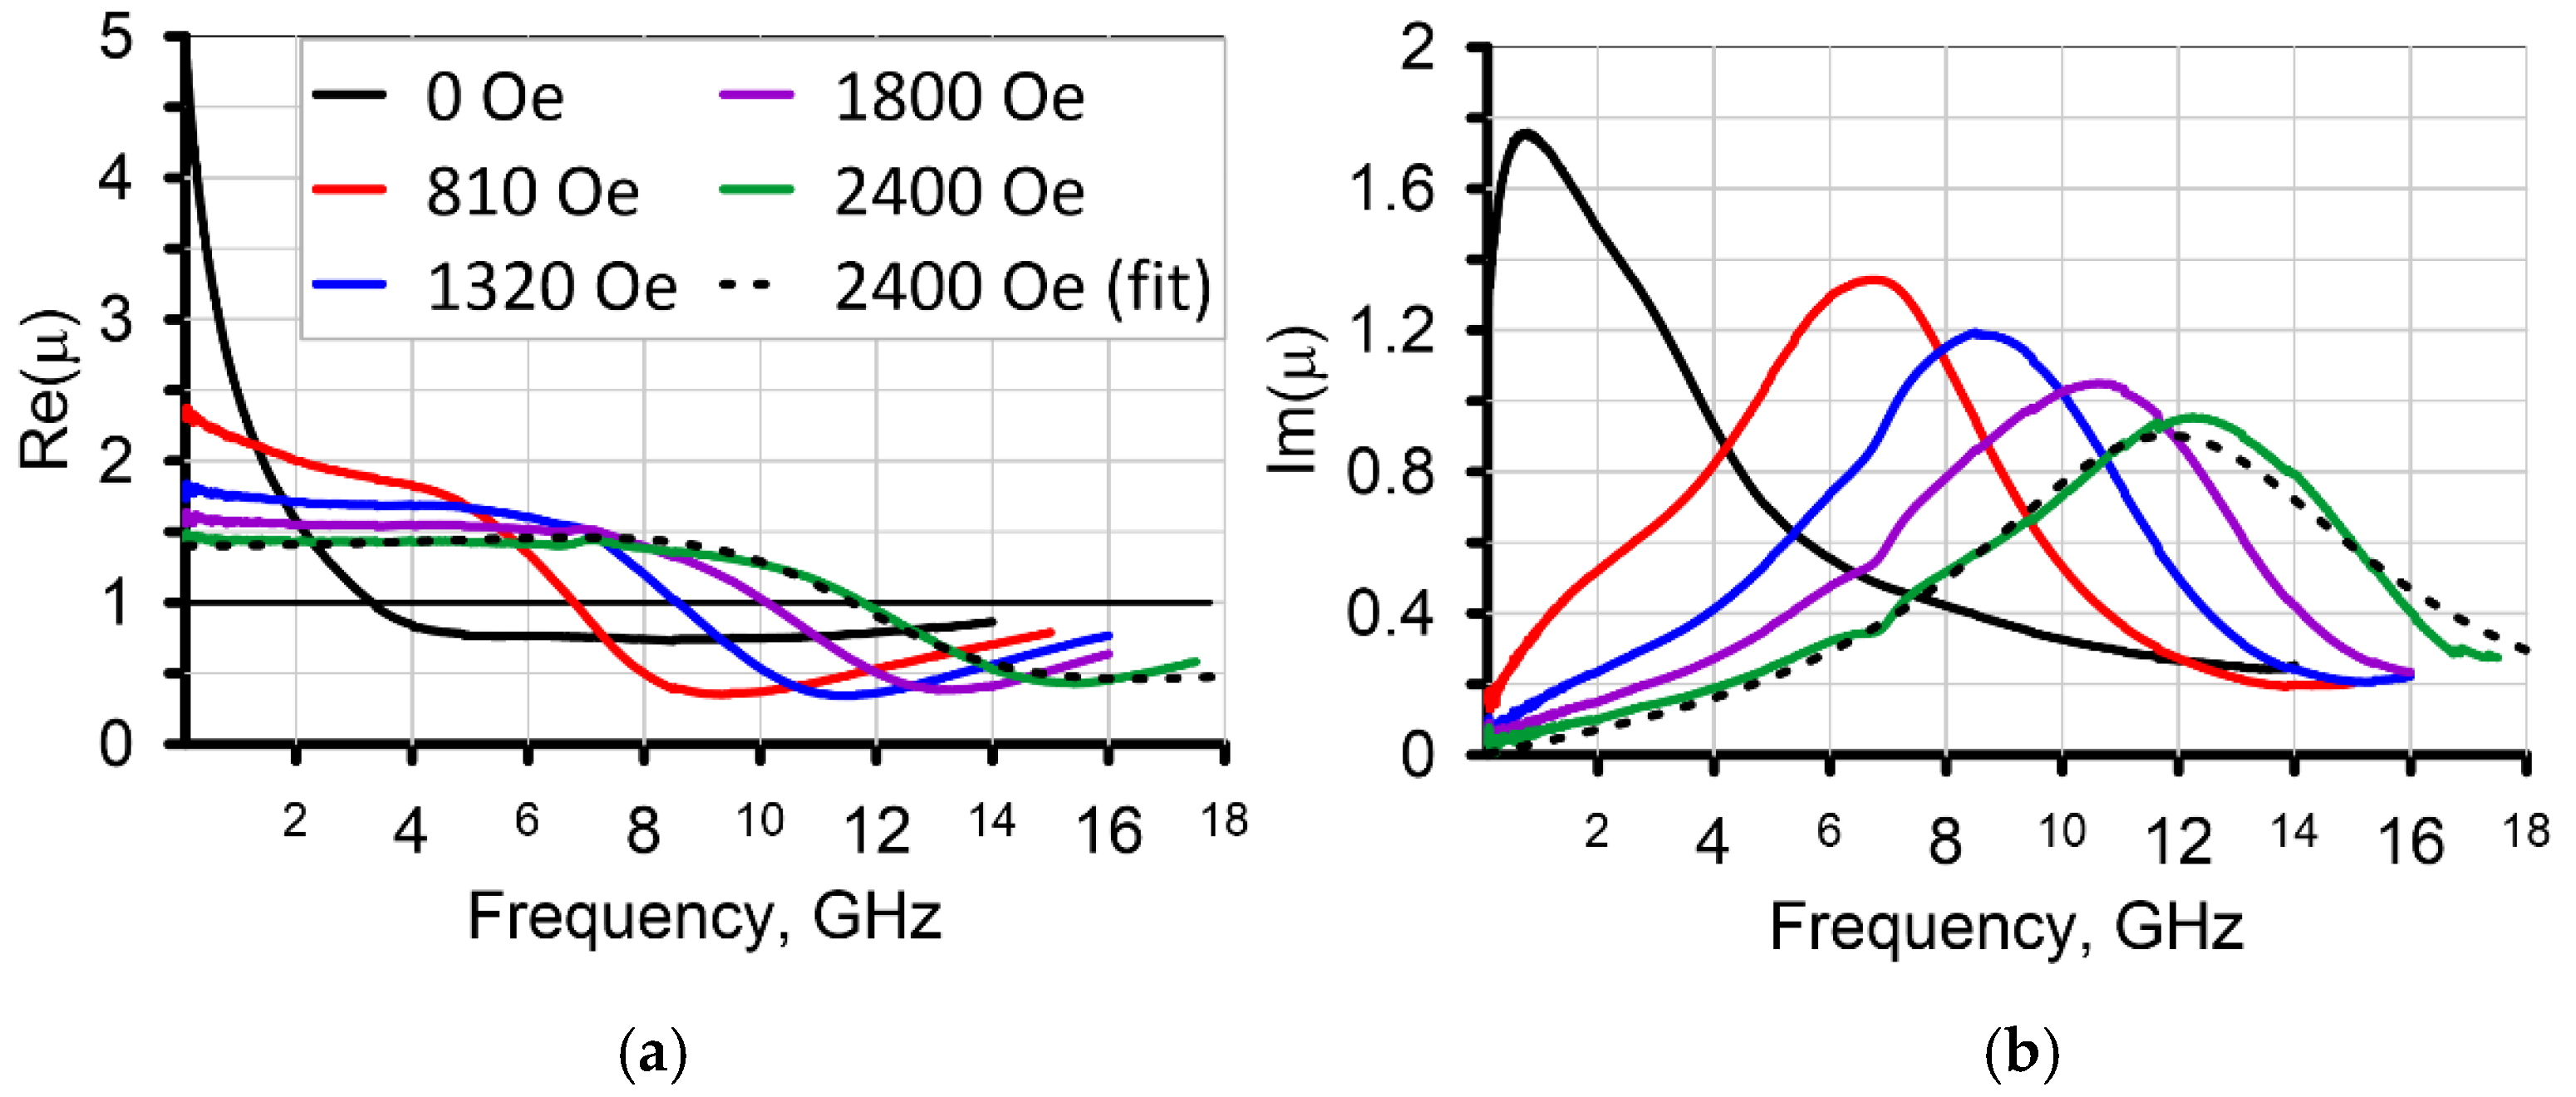
The measured permeability of the composite sample with 7% volume fraction of inclusions under an external magnetic field up to 2400 Oe is shown in
Figure 3. The resonant frequency increases and the static permeability decreases with increasing external field. The dependences are fitted by the LLG and Lorentzian dispersion laws. The fitting curves are almost identical, and the figure shows only the dependences with Lorentzian fitting. One can see that the magnetic loss peak has a Lorentzian form: the permeability is fitted by the dispersion law with high accuracy.
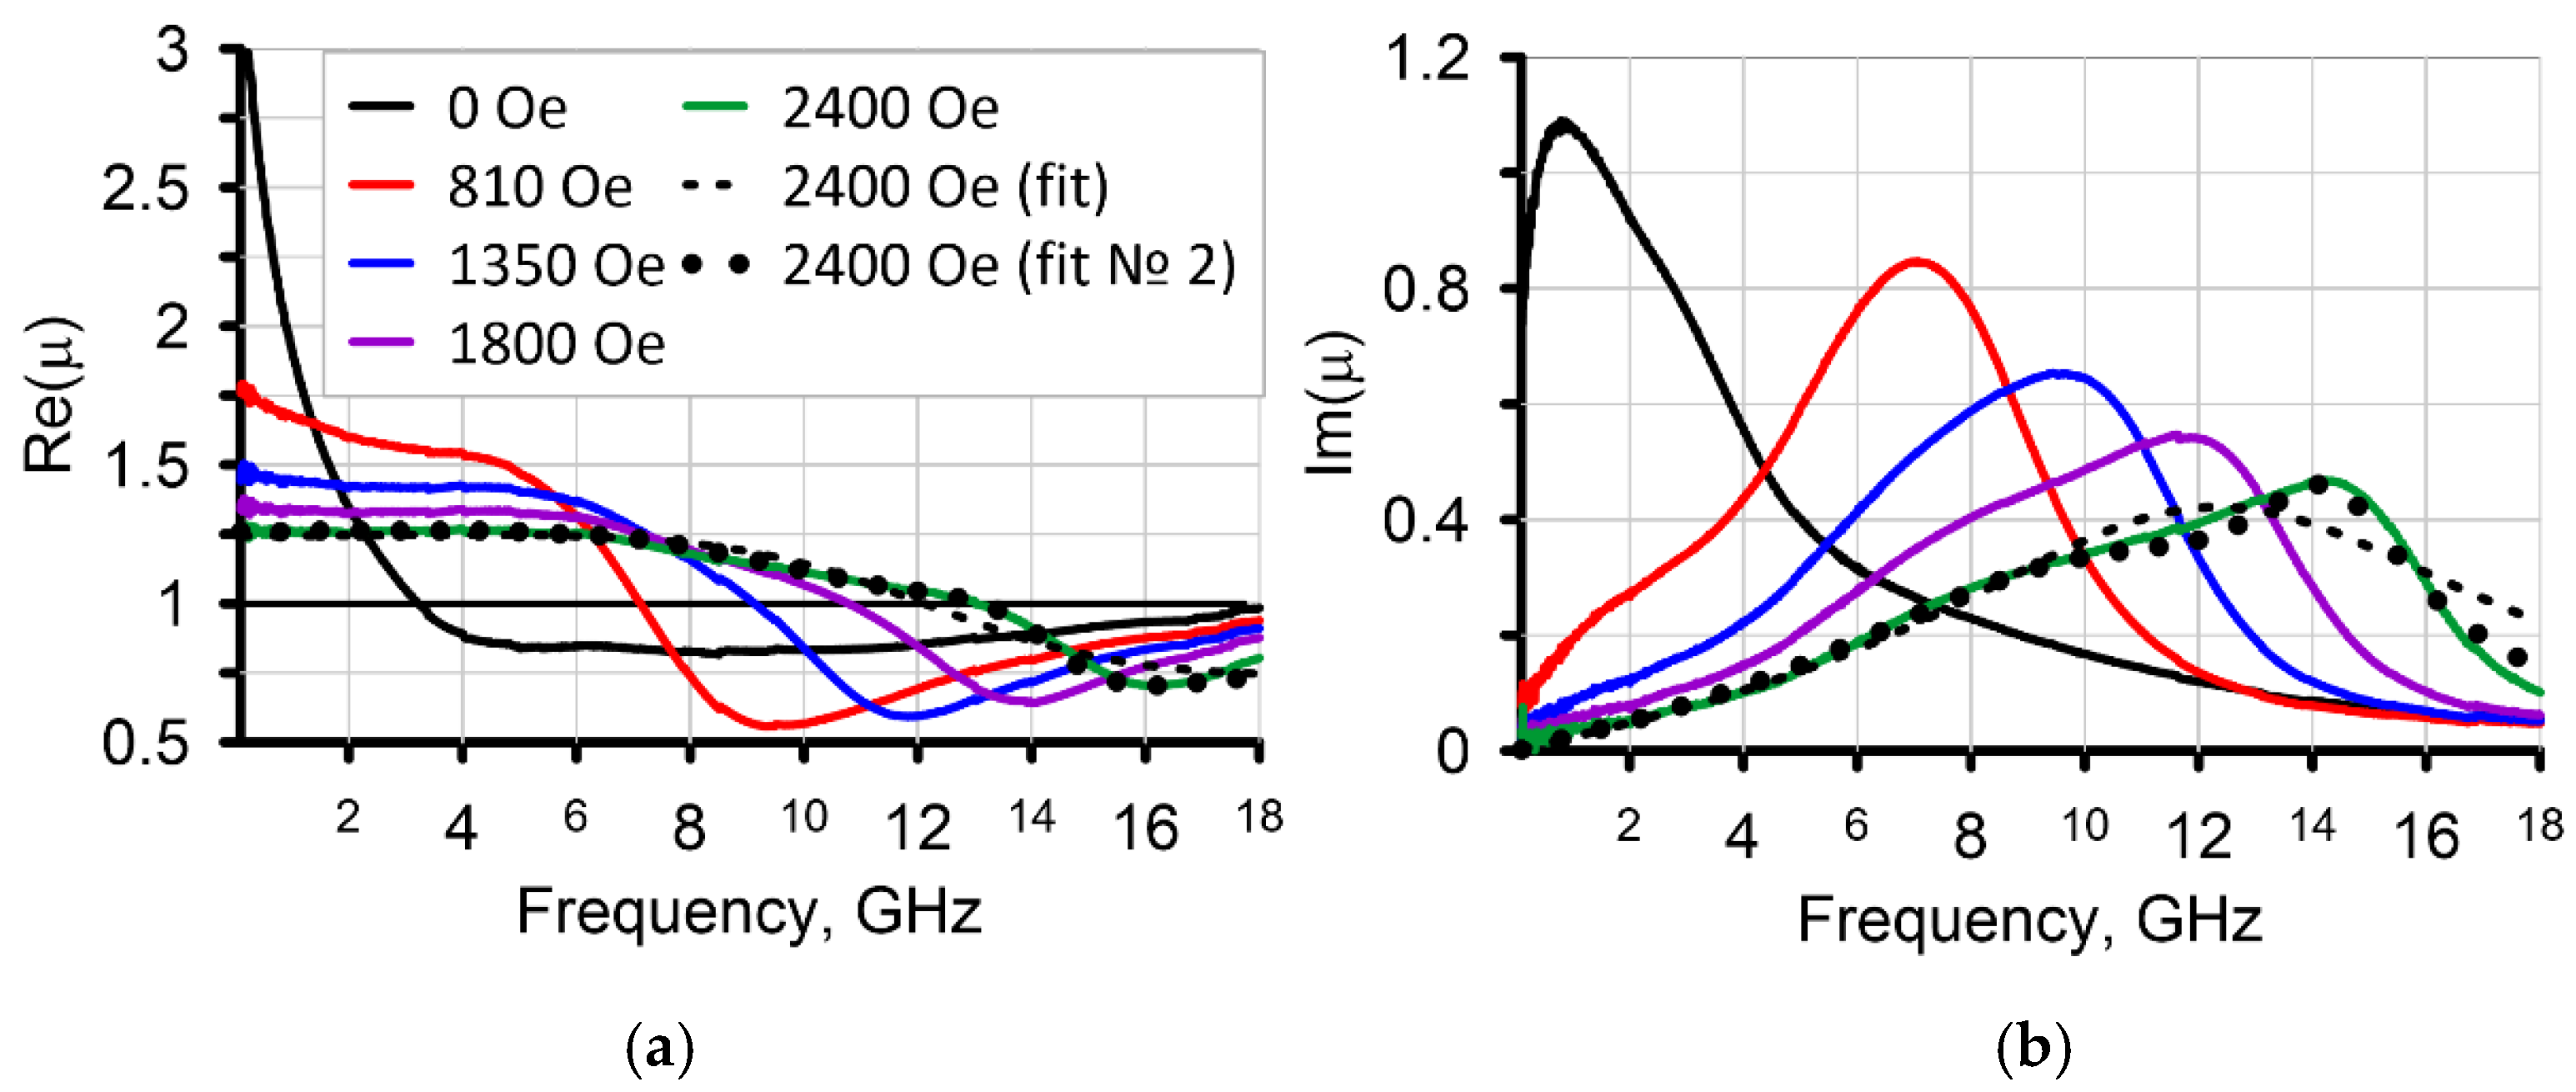
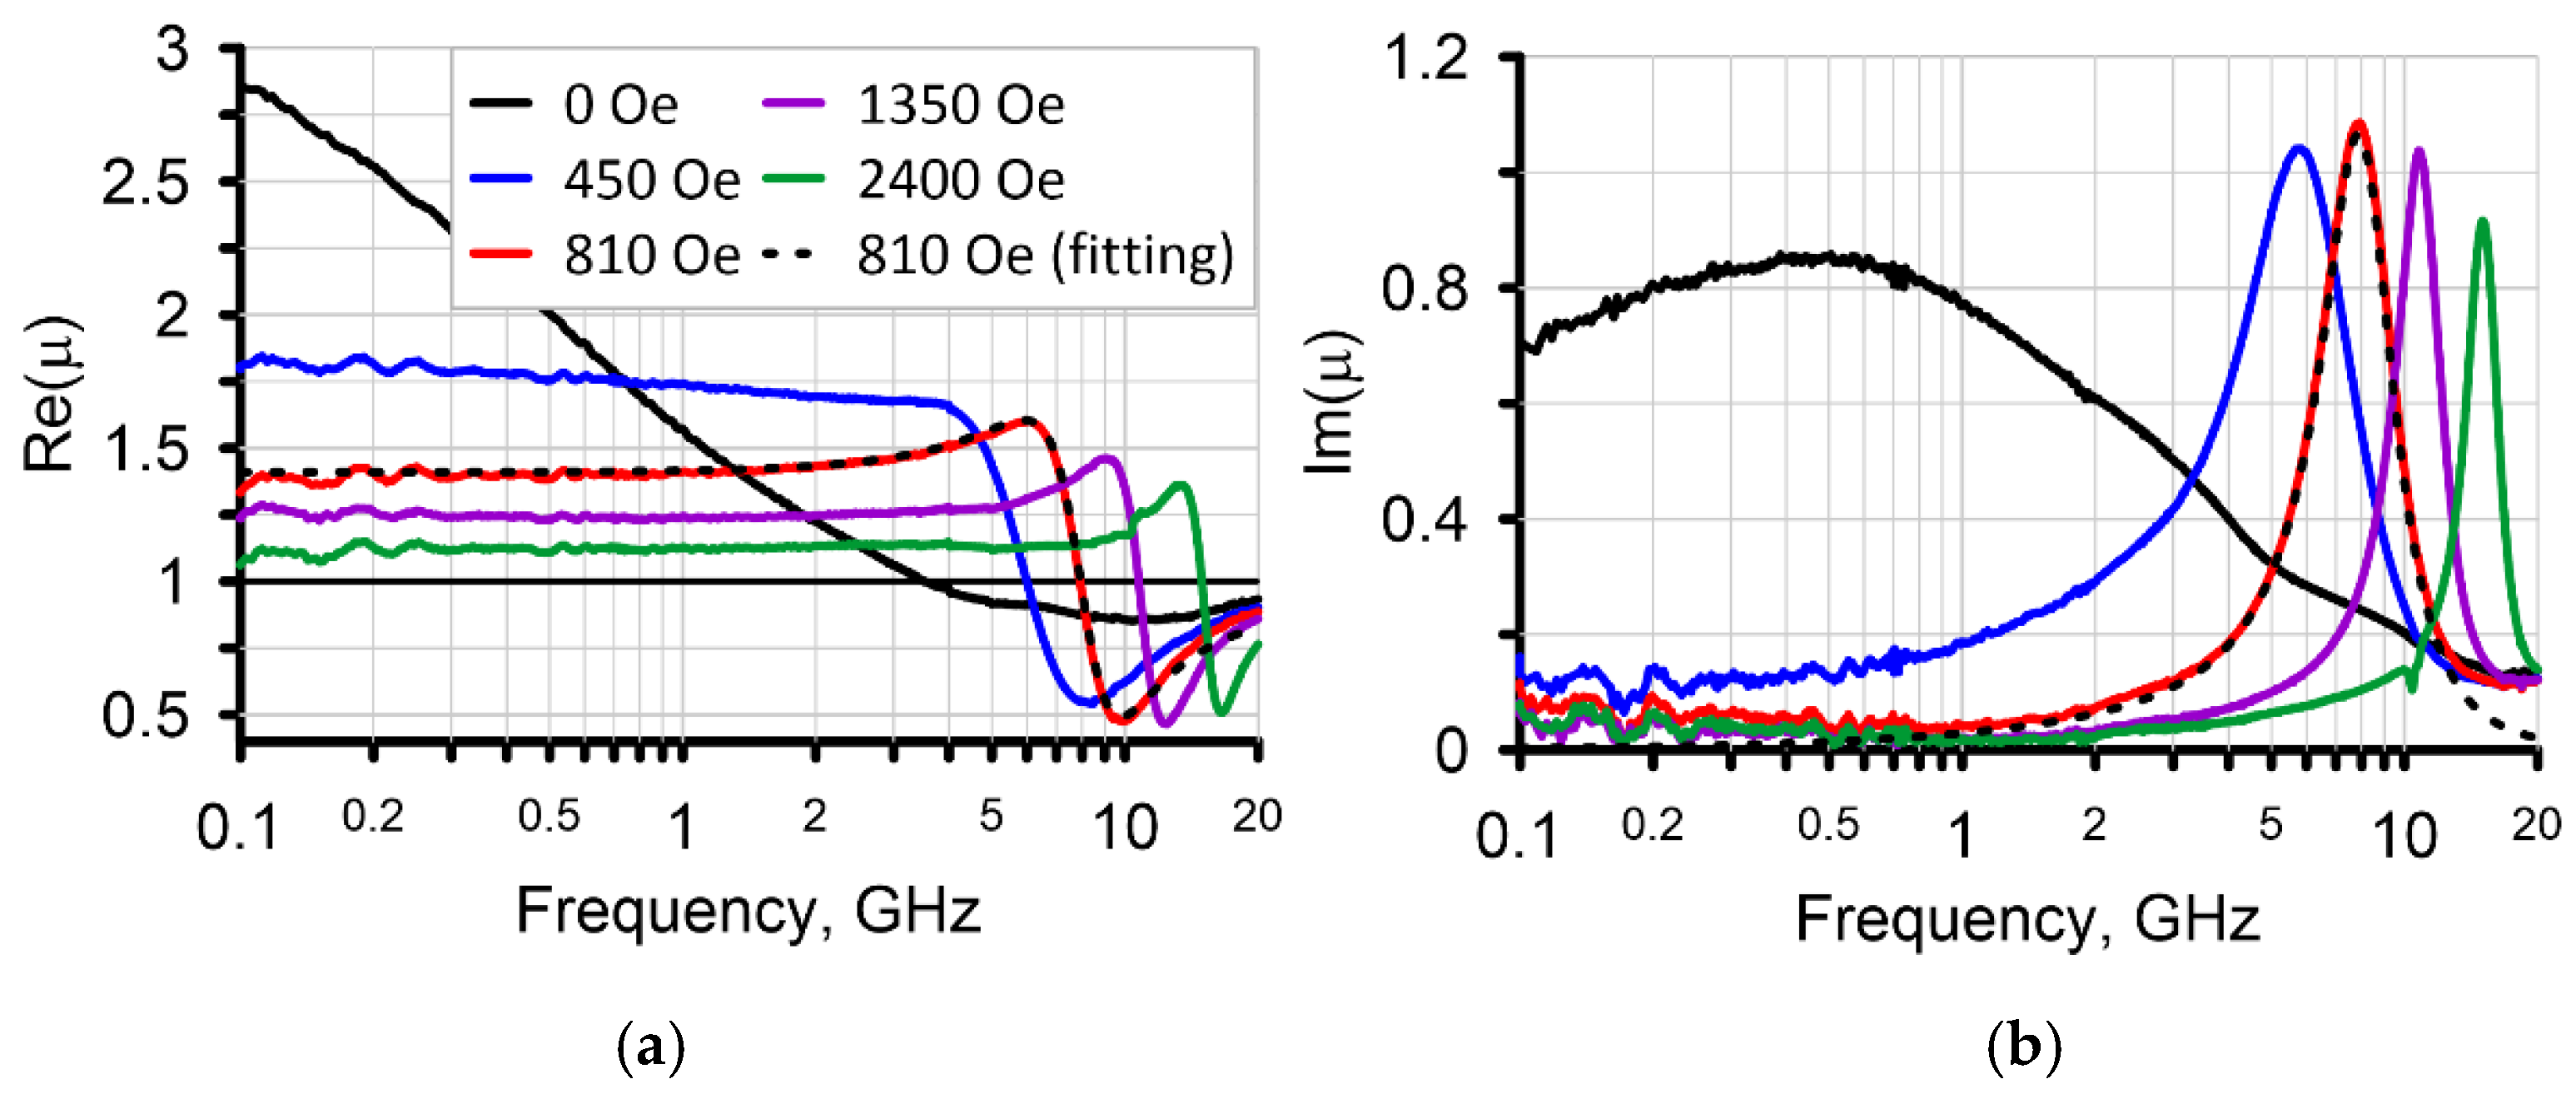
The measured permeability of the composite sample with a lower volume fraction of inclusions (4%) under an external magnetic field up to 2400 Oe is shown in
Figure 4. It is seen that the peak becomes asymmetric under external field of more than 1350 Oe. The fitting of the permeability (dashed line in
Figure 4) shows that the peak is not described by either the Lorentzian or LLG dispersion laws. However, the measured permeability is fitted by two Lorentzian curves (dotted line in
Figure 4) with high accuracy. An increase in the external magnetic field leads to a divergence of these peaks. Therefore, the magnetic loss peak is split in the magnetic field. A similar splitting is also observed in the permeability of the samples with 2% and 3% fractions of inclusions.
The nature of these peaks and the physical mechanisms leading to the splitting are unknown. It is incorrect to find the magnetic characteristics of these peaks using Kittel’s law (1). It is known that the skin effect may lead to the splitting of the magnetic loss peaks [
33], but it is unclear why the splitting disappears with an increase in the fraction of inclusions.
The reason for the splitting of the magnetic loss peak under an external magnetic field may be the different magnetization of particles with various orientations in the sample. Demagnetization leads to a decrease in the external magnetic field inside the particle and is described by [
14]:
where
H is the value of the external field decreased due to the demagnetization,
μst is the static permeability in the direction of the external field, and
N is the demagnetization factor of the particle in the direction of the external field. In the cases of a platelet particle and thin film, the demagnetization factor in the direction perpendicular to the plane is close to unity, and the other two factors are close to zero. Demagnetization has a stronger effect on particles oriented perpendicular to the external field. The magnetic field required to magnetize such particles is much greater than for the particles oriented along the field. In the composites under study, particles are distributed isotropically and differently oriented particles are magnetized variously. The FMR peak should broaden with the increasing external field. At high fractions of inclusions, the particles are located closer to each other, and the external field is demagnetized not on individual particles but on the whole sample. Therefore, the effect of peak splitting disappears at high fractions of inclusions in composites. It was shown in [
15] that the demagnetization factor has a percolative behavior in composites. If the fraction of inclusions is greater than a certain value, the external field is demagnetized on the bulk sample.
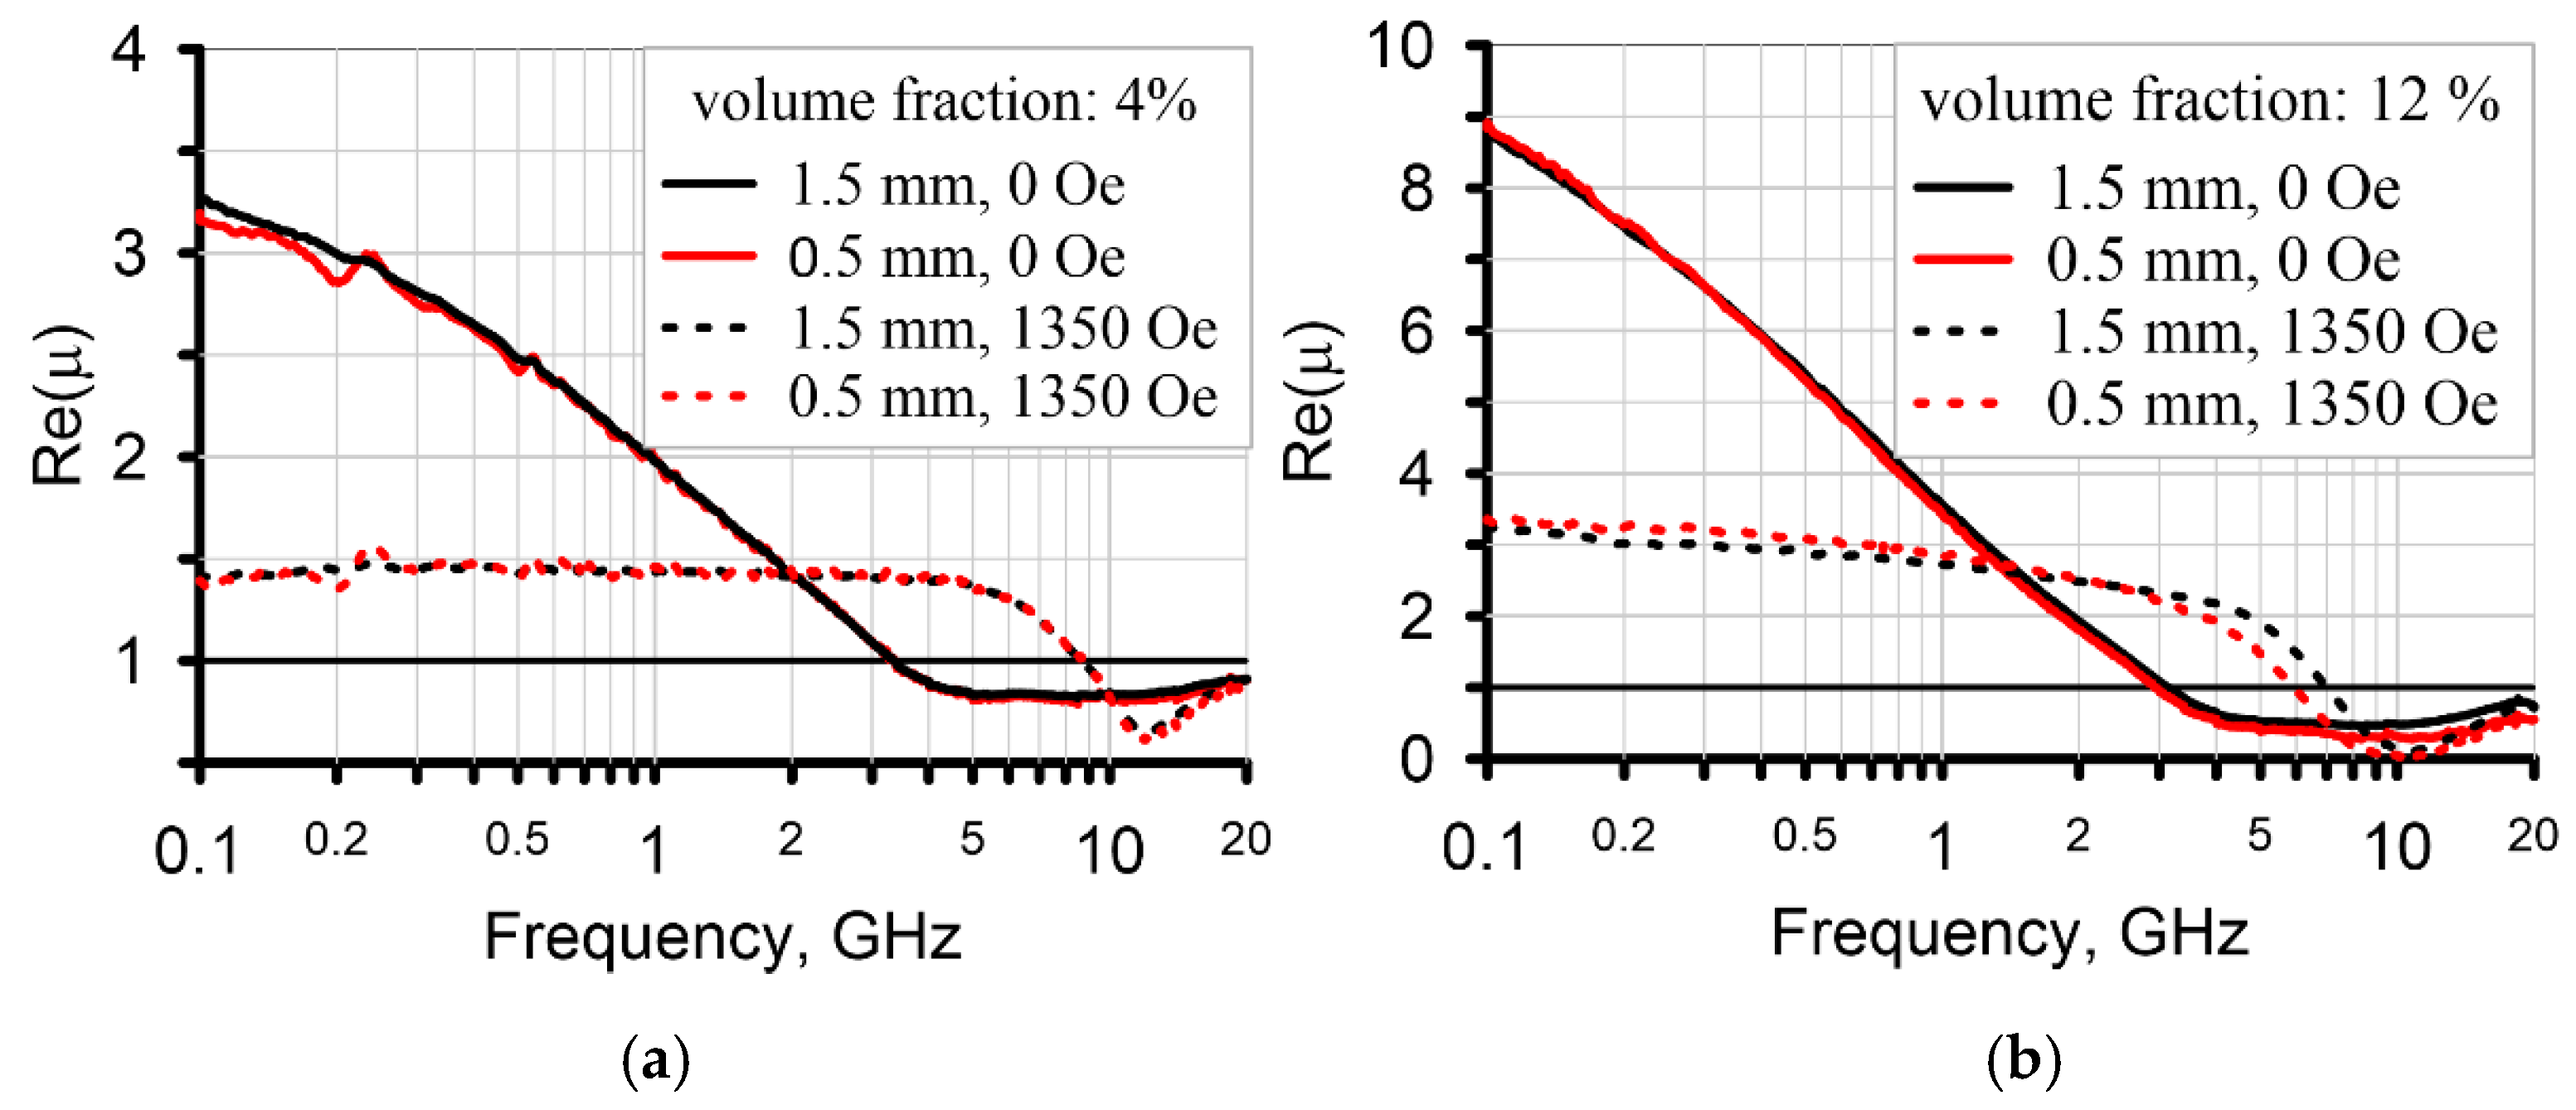
The effect of the demagnetization is studied on the isotropic samples with various thicknesses. The measured permeability of samples with different thicknesses and fractions of inclusion is shown in
Figure 5. The permeability of the samples with a 4% fraction of inclusions does not depend on the thickness of the samples, see
Figure 5a. The permeability of the samples with a 7% fraction of inclusions is also the same for different thicknesses. Samples with 9%, 10%, and 12% fraction of inclusions were used. A noticeable discrepancy in the permeability under external field is observed at 12% samples, see dashed curves in
Figure 5b. The measurement technique is sensitive to the thickness and permeability of the samples. In the case of thin samples, the measurement sensitivity may be poor, and they are also difficult to make. The measurement results of samples with a large thickness are strongly distorted by higher-order modes [
34]. Therefore, the samples of only two thicknesses are shown.
Thus, the permanent magnetic field is demagnetized on the individual particles at a small fraction of inclusions. An increase in the fraction leads to a decrease in the average distance between inclusions, and the external field is demagnetized on the whole sample. According to Equation (3), thicker samples are more strongly magnetized because they have a lower demagnetization factor. In the fraction range of 7% to 12%, demagnetization may occur on clusters of inclusions. The obtained results may be quantitatively different for other shapes and materials of inclusions in the composite. Previously, a qualitatively similar behavior was observed in [
15].
The samples with anisotropic particle distribution are prepared to test this hypothesis. The technique for the manufacture of anisotropic samples was described in
Section 2. In the first and second anisotropic samples, the particles are oriented perpendicular and parallel to the coaxial axis, respectively. The constitutive parameters of the manufactured anisotropic samples are measured by the NRW technique under an external magnetic field of up to 2400 Oe.
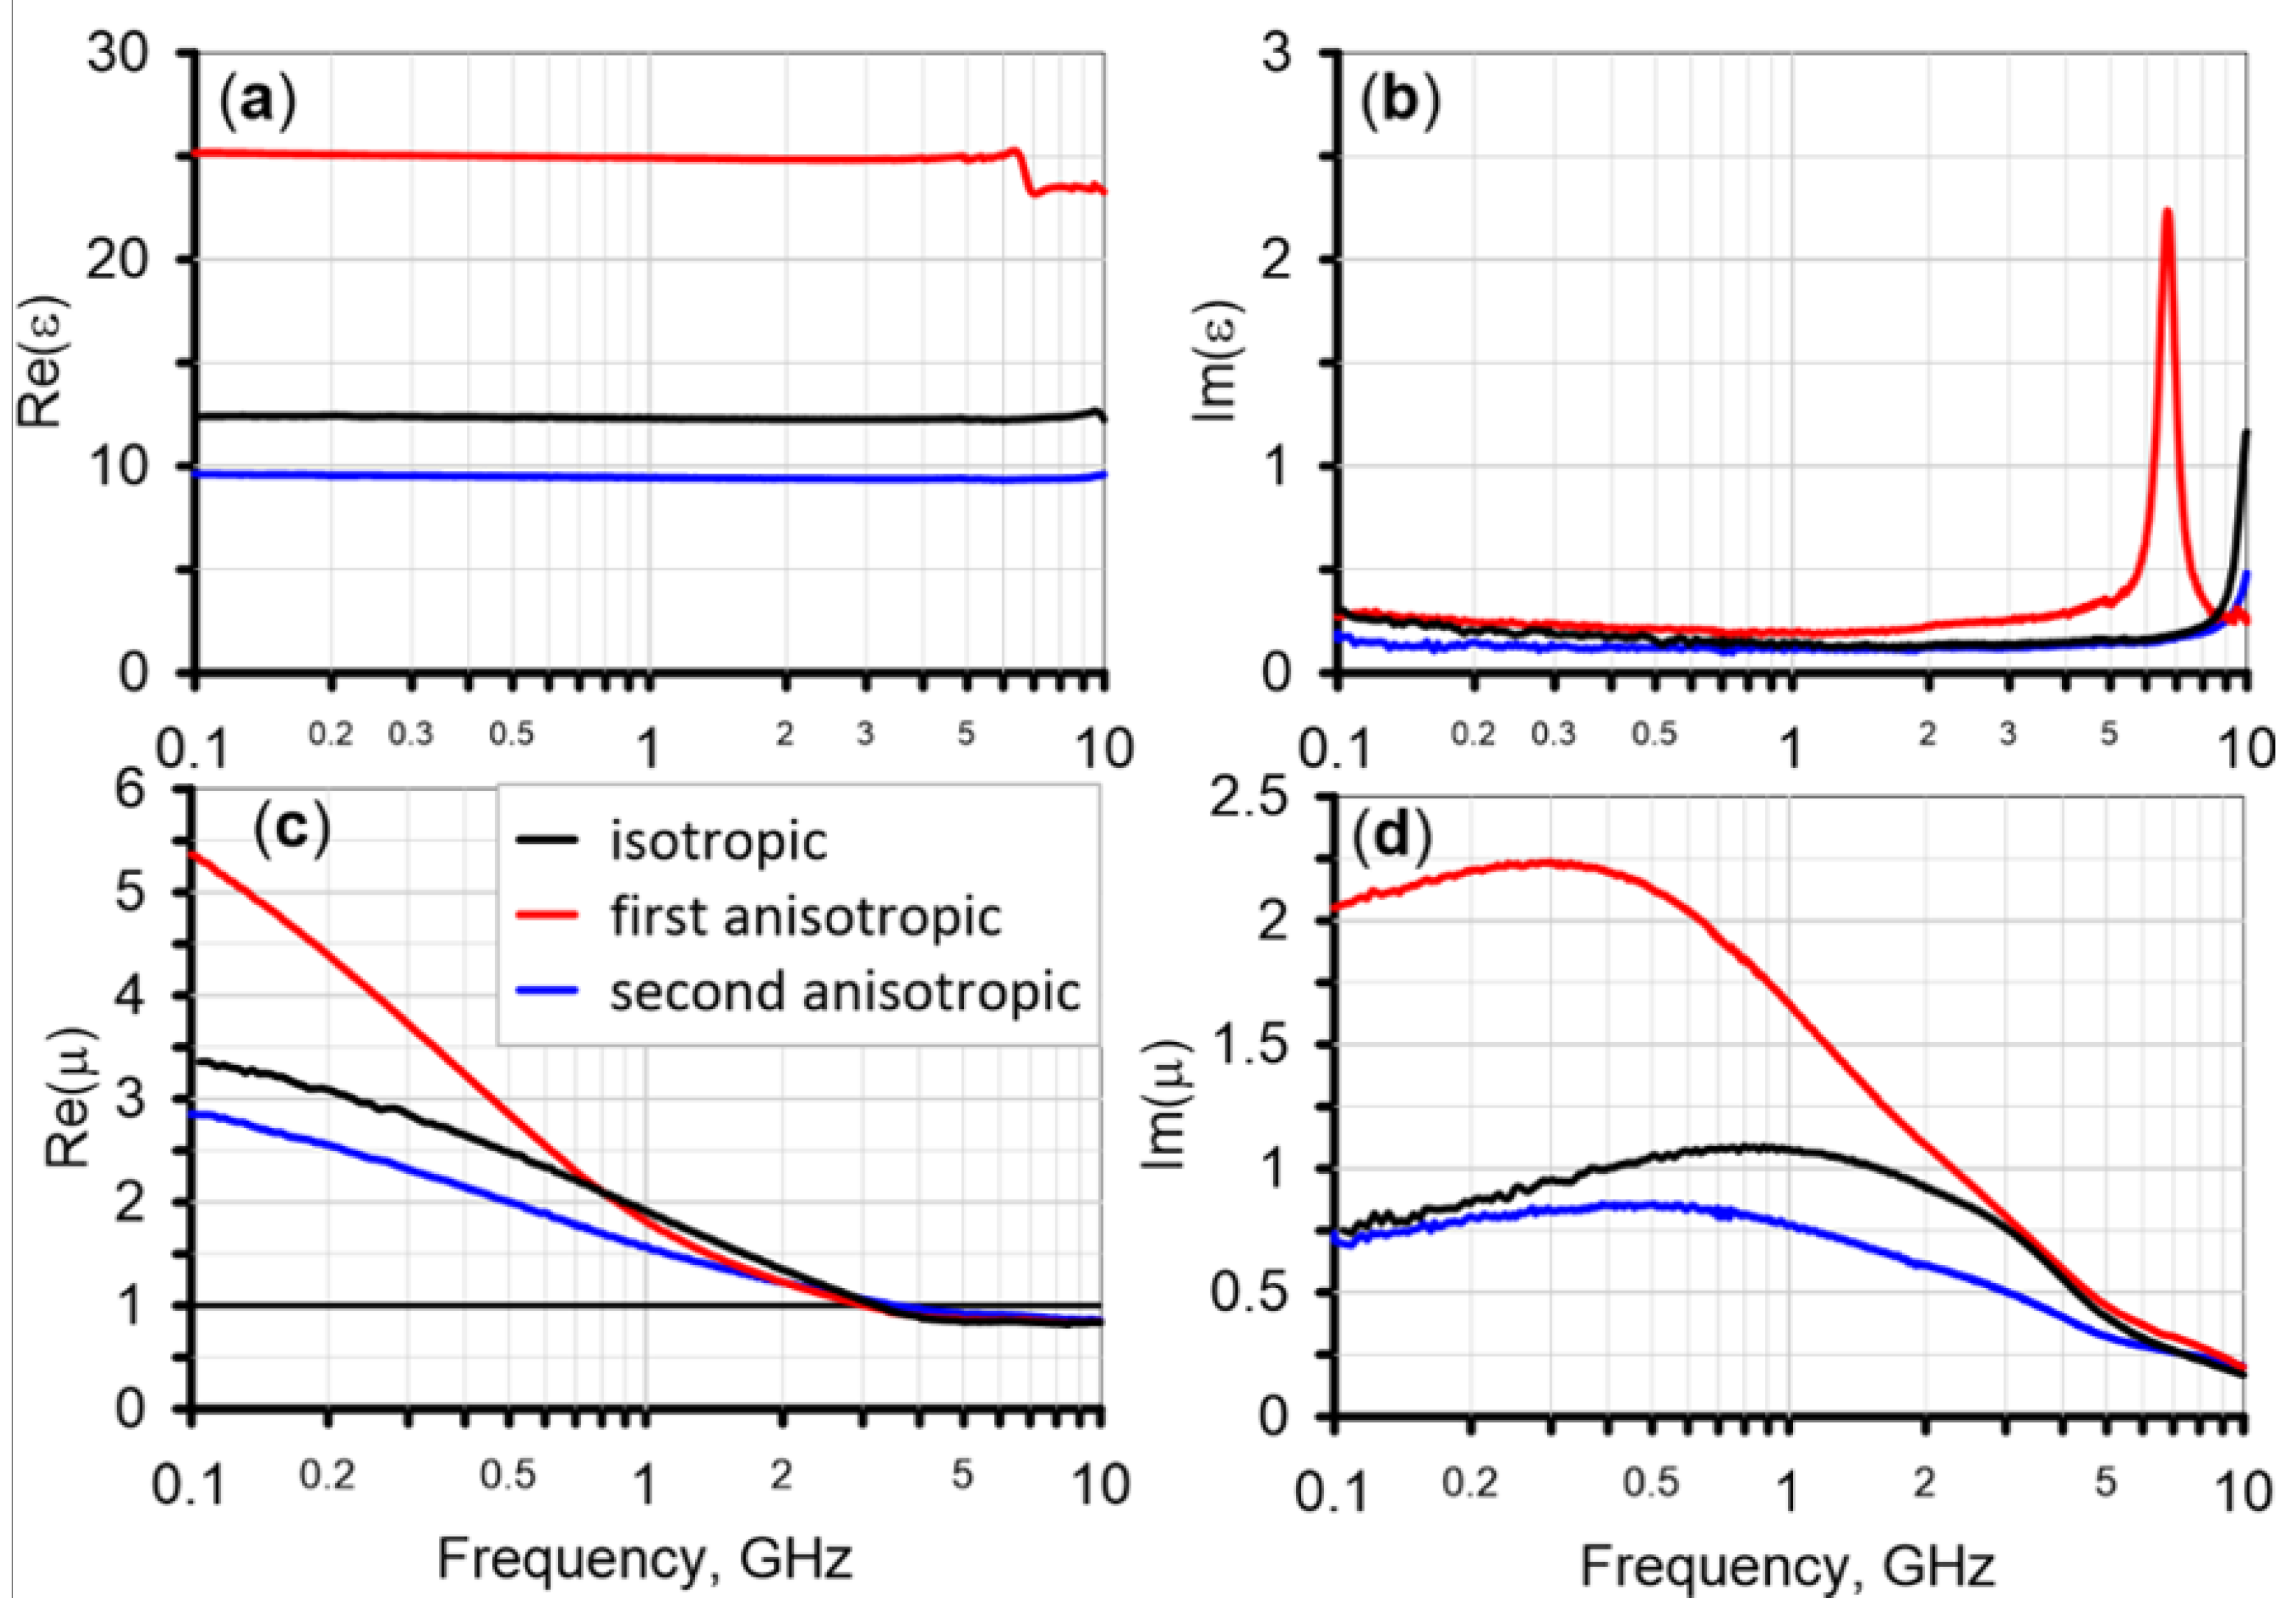
Figure 6 shows the frequency dependences of the permittivity and permeability of anisotropic and isotropic samples with the same volume fraction of inclusions of 4% under zero external field. The measured permittivity at high frequencies is distorted due to the influence of higher-order modes [
34].
The largest contribution to the measured permittivity is made by platelet particles oriented perpendicular to the coaxial axis. The fraction of such particles in the isotropic sample may be estimated as k = 2/3, in the first anisotropic sample as k = 1, and in the second as k = 1/2.
If the easy axes of magnetization are oriented in the plane of the particles, only one of the three components contributes to the measured permeability. For isotropic distribution of magnetic moments in space,
k = 1/3, and for isotropic distribution in the plane,
k = 1/2 [
35]. For the second anisotropic sample,
k = 1/4. In the multidomain particles, the values of
k are the same as for the permittivity.
It is seen that the maximum of magnetic loss in the anisotropic samples is shifted to low frequencies. The reason for shifting may be explained by the following factors: incomplete anisotropy of the samples, an increase in the interaction between inclusions, and clustering due to inhomogeneity of the magnetic field.
The first anisotropic sample has large permittivity and permeability in comparison with the isotropic sample. The second sample has lower constitutive parameters. The observed behavior of the constitutive parameters is in qualitative agreement with the theory. Note that the use of composites with anisotropic particle distribution may be useful for practical applications [
36]. The first anisotropic sample has higher values of microwave magnetic loss and static permeability compared to the isotropic sample with the same weight.
The measured permeability of the first anisotropic sample under an external field is shown in
Figure 7, and the permeability of the second sample is shown in
Figure 8. The demagnetization factor of the particles of the first sample in the direction of the external field is close to the unity. Because of this, the first anisotropic sample is magnetized weaker than the isotropic one. In the second anisotropic sample, in contrast, the demagnetization factor of the particles is close to zero, and the sample is magnetized more strongly than the isotropic one. The splitting of the magnetic loss peak observed for the isotropic sample is absent for the anisotropic samples. Note that the first anisotropic sample may not be magnetized to such a state that a noticeable splitting of the peak is observed.
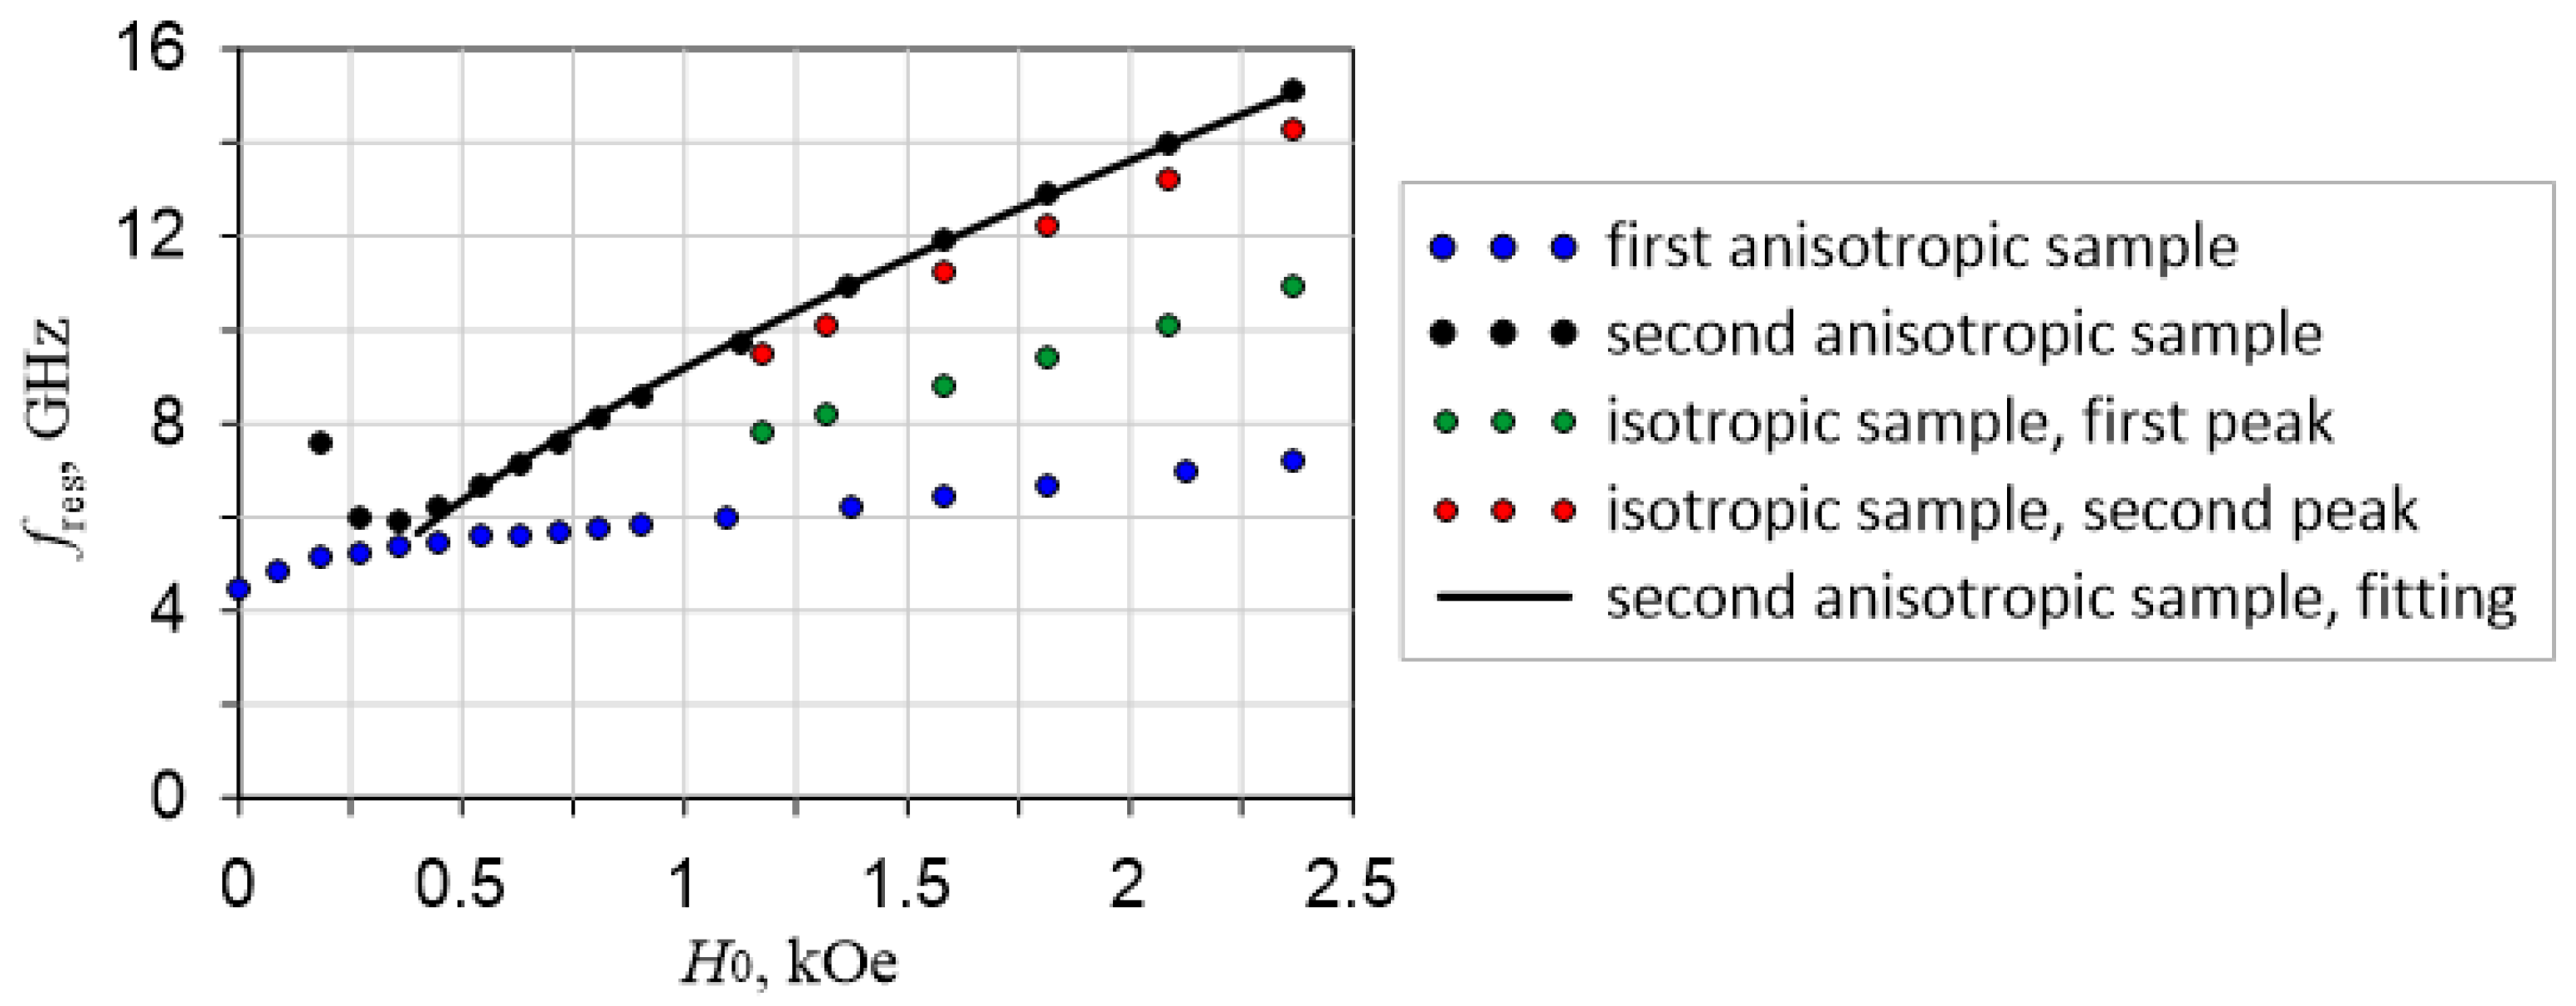
Thus, the influence of demagnetizing fields on the first anisotropic sample is maximal, and on the second sample, it is minimal. In the isotropic sample, the effect of demagnetizing fields is different depending on the orientation of a particular inclusion. This effect leads to the observed splitting of the peak. The frequency dependences of the permeability of the isotropic sample are fitted by the Lorentzian dispersion law with two terms. The dependences of the resonant frequencies on the applied field obtained from this fitting are shown in
Figure 9 by red and green circles. The dependences for the first and the second anisotropic samples are also shown in
Figure 9 by blue and black circles, respectively. It is seen that the frequencies of the isotropic sample are between the frequencies of the anisotropic ones. This behavior is associated with the random orientation of the particles in the isotropic sample.
The second anisotropic sample has a lower saturation field due to the small demagnetization factor. Kittel’s rule may be used to find the magnetic characteristics of the material. The magnetic loss peak of the second anisotropic sample has a Lorentzian shape at fields more than 800 Oe (the dashed line in
Figure 8). The dependence of the resonant frequency on the external field is shown in
Figure 9 by the black circles. The dependence is fitted by Kittel’s law (1), from which the saturation magnetization and the anisotropy field are found. The discrepancy between the fitting and the measured data is observed because the sample is not saturated at low fields. The found saturation magnetization is 4
πM0 = 0.9 T and is close to the values from the archived literature (1.0 T). Although the particles in the sample are ordered, the anisotropy fields are randomly oriented in the particles’ plane. Because of this, the average value of the anisotropy field is close to zero. Therefore, the found value of the anisotropy field (5.8 Oe) is small. The accordance of the permeability to Kittel’s theory and the equality of the found magnetic characteristics with the reference values confirms that the magnetic loss peak is associated with FMR and the demagnetizing effects do not influence the measurements.

 ,
, 


