A Novel Feature of Valence Quark Distributions in Hadrons

Department of Physics, Florida International University, Miami, FL 33199, USA
*
Author to whom correspondence should be addressed.
Physics 2021, 3(4), 913-923; https://0-doi-org.brum.beds.ac.uk/10.3390/physics3040057
Submission received: 16 August 2021
/
Accepted: 9 September 2021
/
Published: 9 October 2021
(This article belongs to the Section High Energy Physics)
Abstract
:Examining the evolution of the maximum of valence quark distribution, , weighted by Bjorken x, , it is observed that at the peak becomes a one-parameter function; , where is the position of the peak, , and is the resolution scale. This observation is used to derive a new model-independent relation which connects the partial derivative of the valence parton distribution functions (PDFs) in to the quantum chromodynamics (QCD) evolution equation through the derivative of the logarithm of the function . A numerical analysis of this relation using empirical PDFs results in an observation of the exponential form of the for leading to next-to-next leading order approximations of PDFs for the range of , covering four orders in magnitude. The exponent, D, of the observed “height-position” correlation function converges with the increase in the order of approximation. This result holds for all the PDF sets considered. A similar relation is observed also for the pion valence quark distribution, indicating that the obtained relation may be universal for any non-singlet partonic distribution. The observed “height-position” correlation is used also to indicate that no finite number of exchanges can describe the analytic behavior of the valence quark distribution at the position of the peak at fixed .
1. Introduction
Valence quarks play a unique role in the quatum chromodynamics (QCD) structure of hadrons. These quarks define the baryonic number of the nucleons and represent “effective” fermions with complex interactions among themselves and with the hadronic interior. One important property of valence quarks is that the number of the valence quarks is conserved and hadrons can be considered as systems with a fixed number of effective (valence) fermions. The continuing progress in experimental extraction of valence quark distributions in a wide range of the momentum fraction x and the emerging possibilities for probing these distributions in semi-inclusive and exclusive deep-inelastic processes create a new motivation for theoretical modeling of the valence quark dynamics. Such modeling is important as when successful, one gains a new level of understanding of the QCD dynamics in the hadrons. Even if lattice calculations can reproduce the major characteristics of valence quark distributions, these calculations do not necessarily result in a qualitative understanding of the underlying processes. In this respect, observation of new properties and relations in valence quark distributions is significant since it allows one to constrain models aimed at describing the dynamics of QCD interaction.
The possibility of considering nucleons as a system of effective fermions, whose number is conserved opens a new venue in the exploration of the dynamics of the valence quarks from the point of view of universal properties of two-component (spin or isospin) Fermi systems with a conserved number of constituents. This approach is analogous to the recent study of the ultra-cold two-component Fermi atomic systems and atomic nuclei for which, despite twenty orders of magnitude difference in the density, a similar analytic form for the high-momentum tail of the momentum distribution was found [1] based on the universal properties of the Fermi system. A similar logic is followed here in studying the QCD structure of hadrons. The focus of the present study is on one of the most distinguishable characteristics of valence quarks, which is the distribution, , of valence quarks weighted by momentum fraction x, exhibits a clear peak. This peak is a hallmark for the bound system of conserved number fermions (no such peak exists for sea quark distribution) and is characterized by the height, , and the position, , both of which evolve with the resolution scale, . Since this peak is a product of the magnitude of x and the strength of the valence quark distribution, one expects that its position and height are -dependent due to the QCD evolution of the valence quark distribution, , whose strength shifts towards smaller x with increasing . As a result, one expects both the position of the peak, , and the height, , to be a function of ; hereafter the variable is used.
2. “Height-Position” Correlation of the Peak of the Functions
As Figure 1 shows, the height of the peak and the position for valence PDFs in the nucleon diminishes with an increase in as one expects from the QCD evolution that moves the strength of PDFs towards small x. If now one assumes that both the height and the position of the peak of the function evolve due to the evolution of the strong coupling, then these dimensionless quantities can be expressed as:
where and are constants, and is the strong interaction coupling constant evaluated at t.
Equation (1) is a single variable function of , continuously differentiable with non zero derivate. Thus, in general, it is an invertible function. This allows us to combine Equations (1) and (2) representing the height, , as an one-parametric function of :
where is a function of variable only.
In what follows, the implications that Equation (3) may have on partonic distributions of valence quarks is explored.
3. New Relations for Valence PDFs
In general, PDFs depend on the two independent variables of x and t (or ). The relation (3) indicates that at the peak, the x-weighted PDFs depend analytically only on one variable, , and the t-dependence is expressed through the ’s dependence on t. This situation results in specific relations for valence PDFs at peak values.
Starting with the relation,
let us first consider the full t-derivative using the right hand side of the Equation (4), resulting to:
The above equation is rather unique since it allows one to relate the partial t-derivative of the valence quark PDFs, which can be evaluated through the QCD evolution, to the partial derivative of the same distribution.
Using various PDF sets (see, e.g., [2,3,4]), which have been fitted to high energy data such as deep inelastic scattering, Drell–Yan processes, etc., one can calculate numerically the left-hand side (l.h.s.) of Equation (8) and thus evaluate the correlation function as a function of t or .
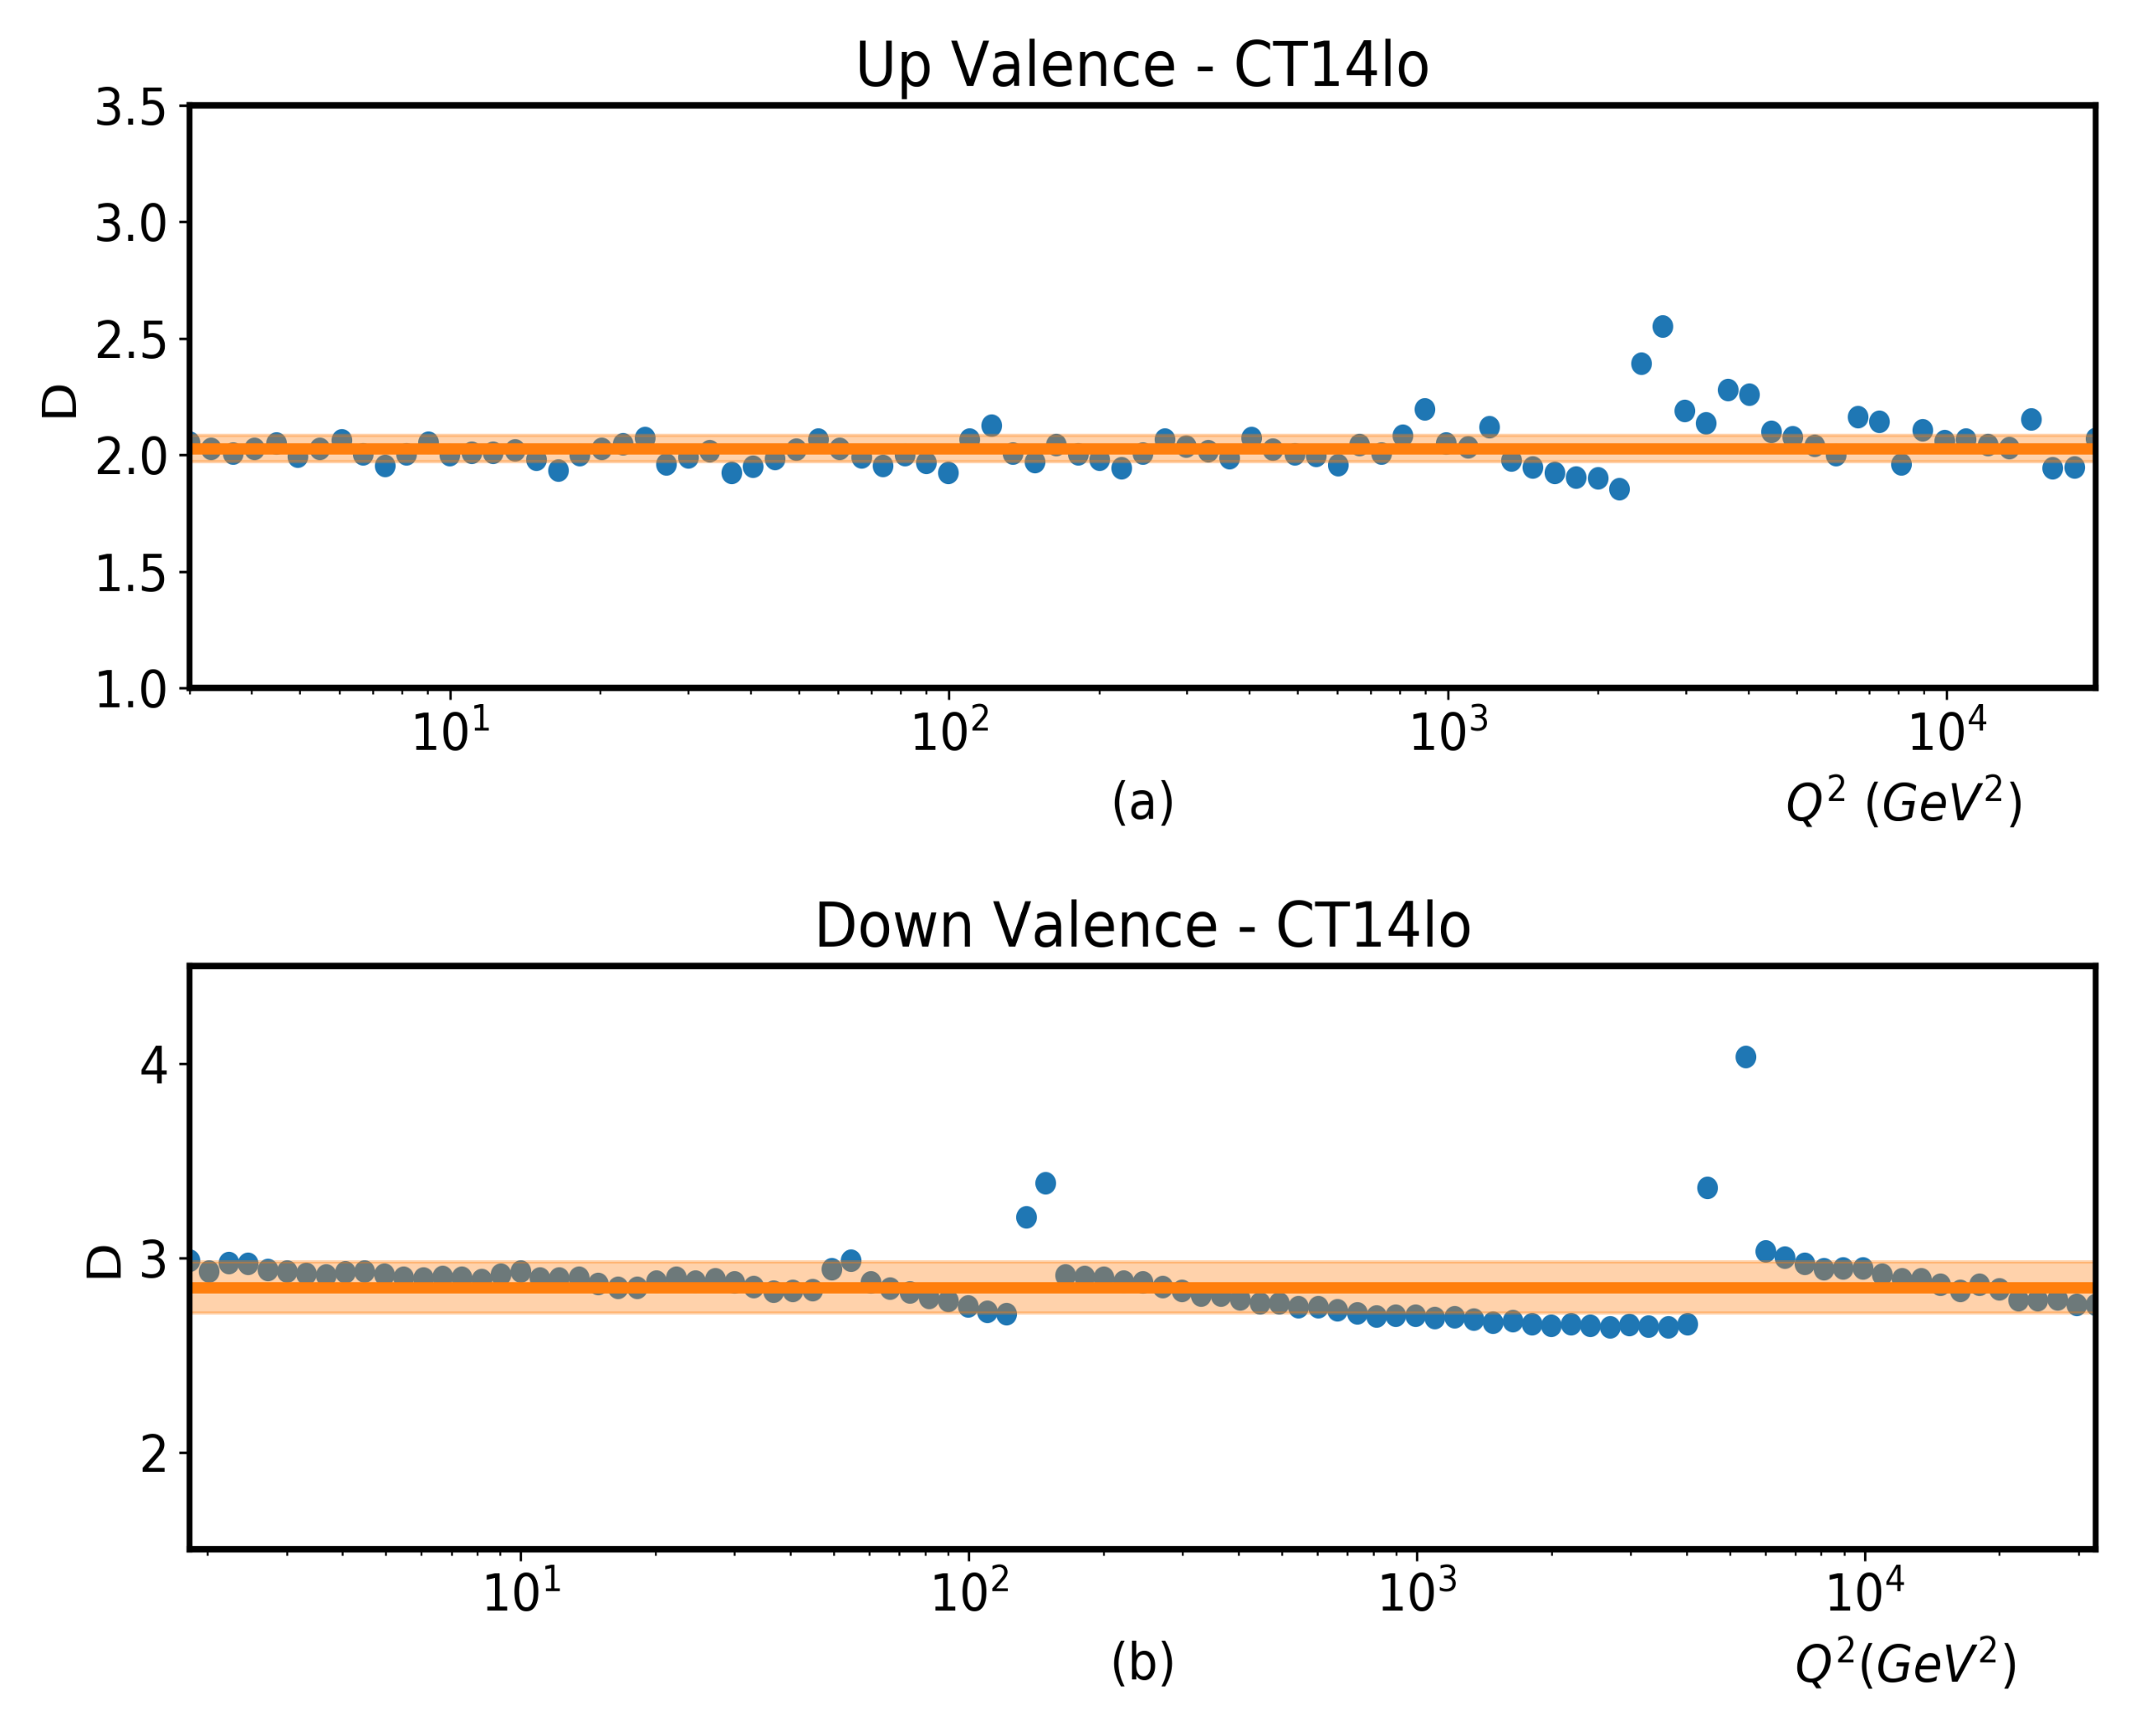
Figure 2 shows the calculation of the l.h.s. of Equation (8) using the CT14 PDF set [3] at leading-order (LO) in , accessed via the LHAPDF library [5]. Here, the QCD evolution equation to leading order is used to calculate term:
while and are calculated numerically using valence d-quark and u-quark distributions at LO [3].
As Figure 2 shows, the l.h.s of Equation (8) is practically constant for the range of , covering four orders of magnitude: GeV to GeV. This indicates that .
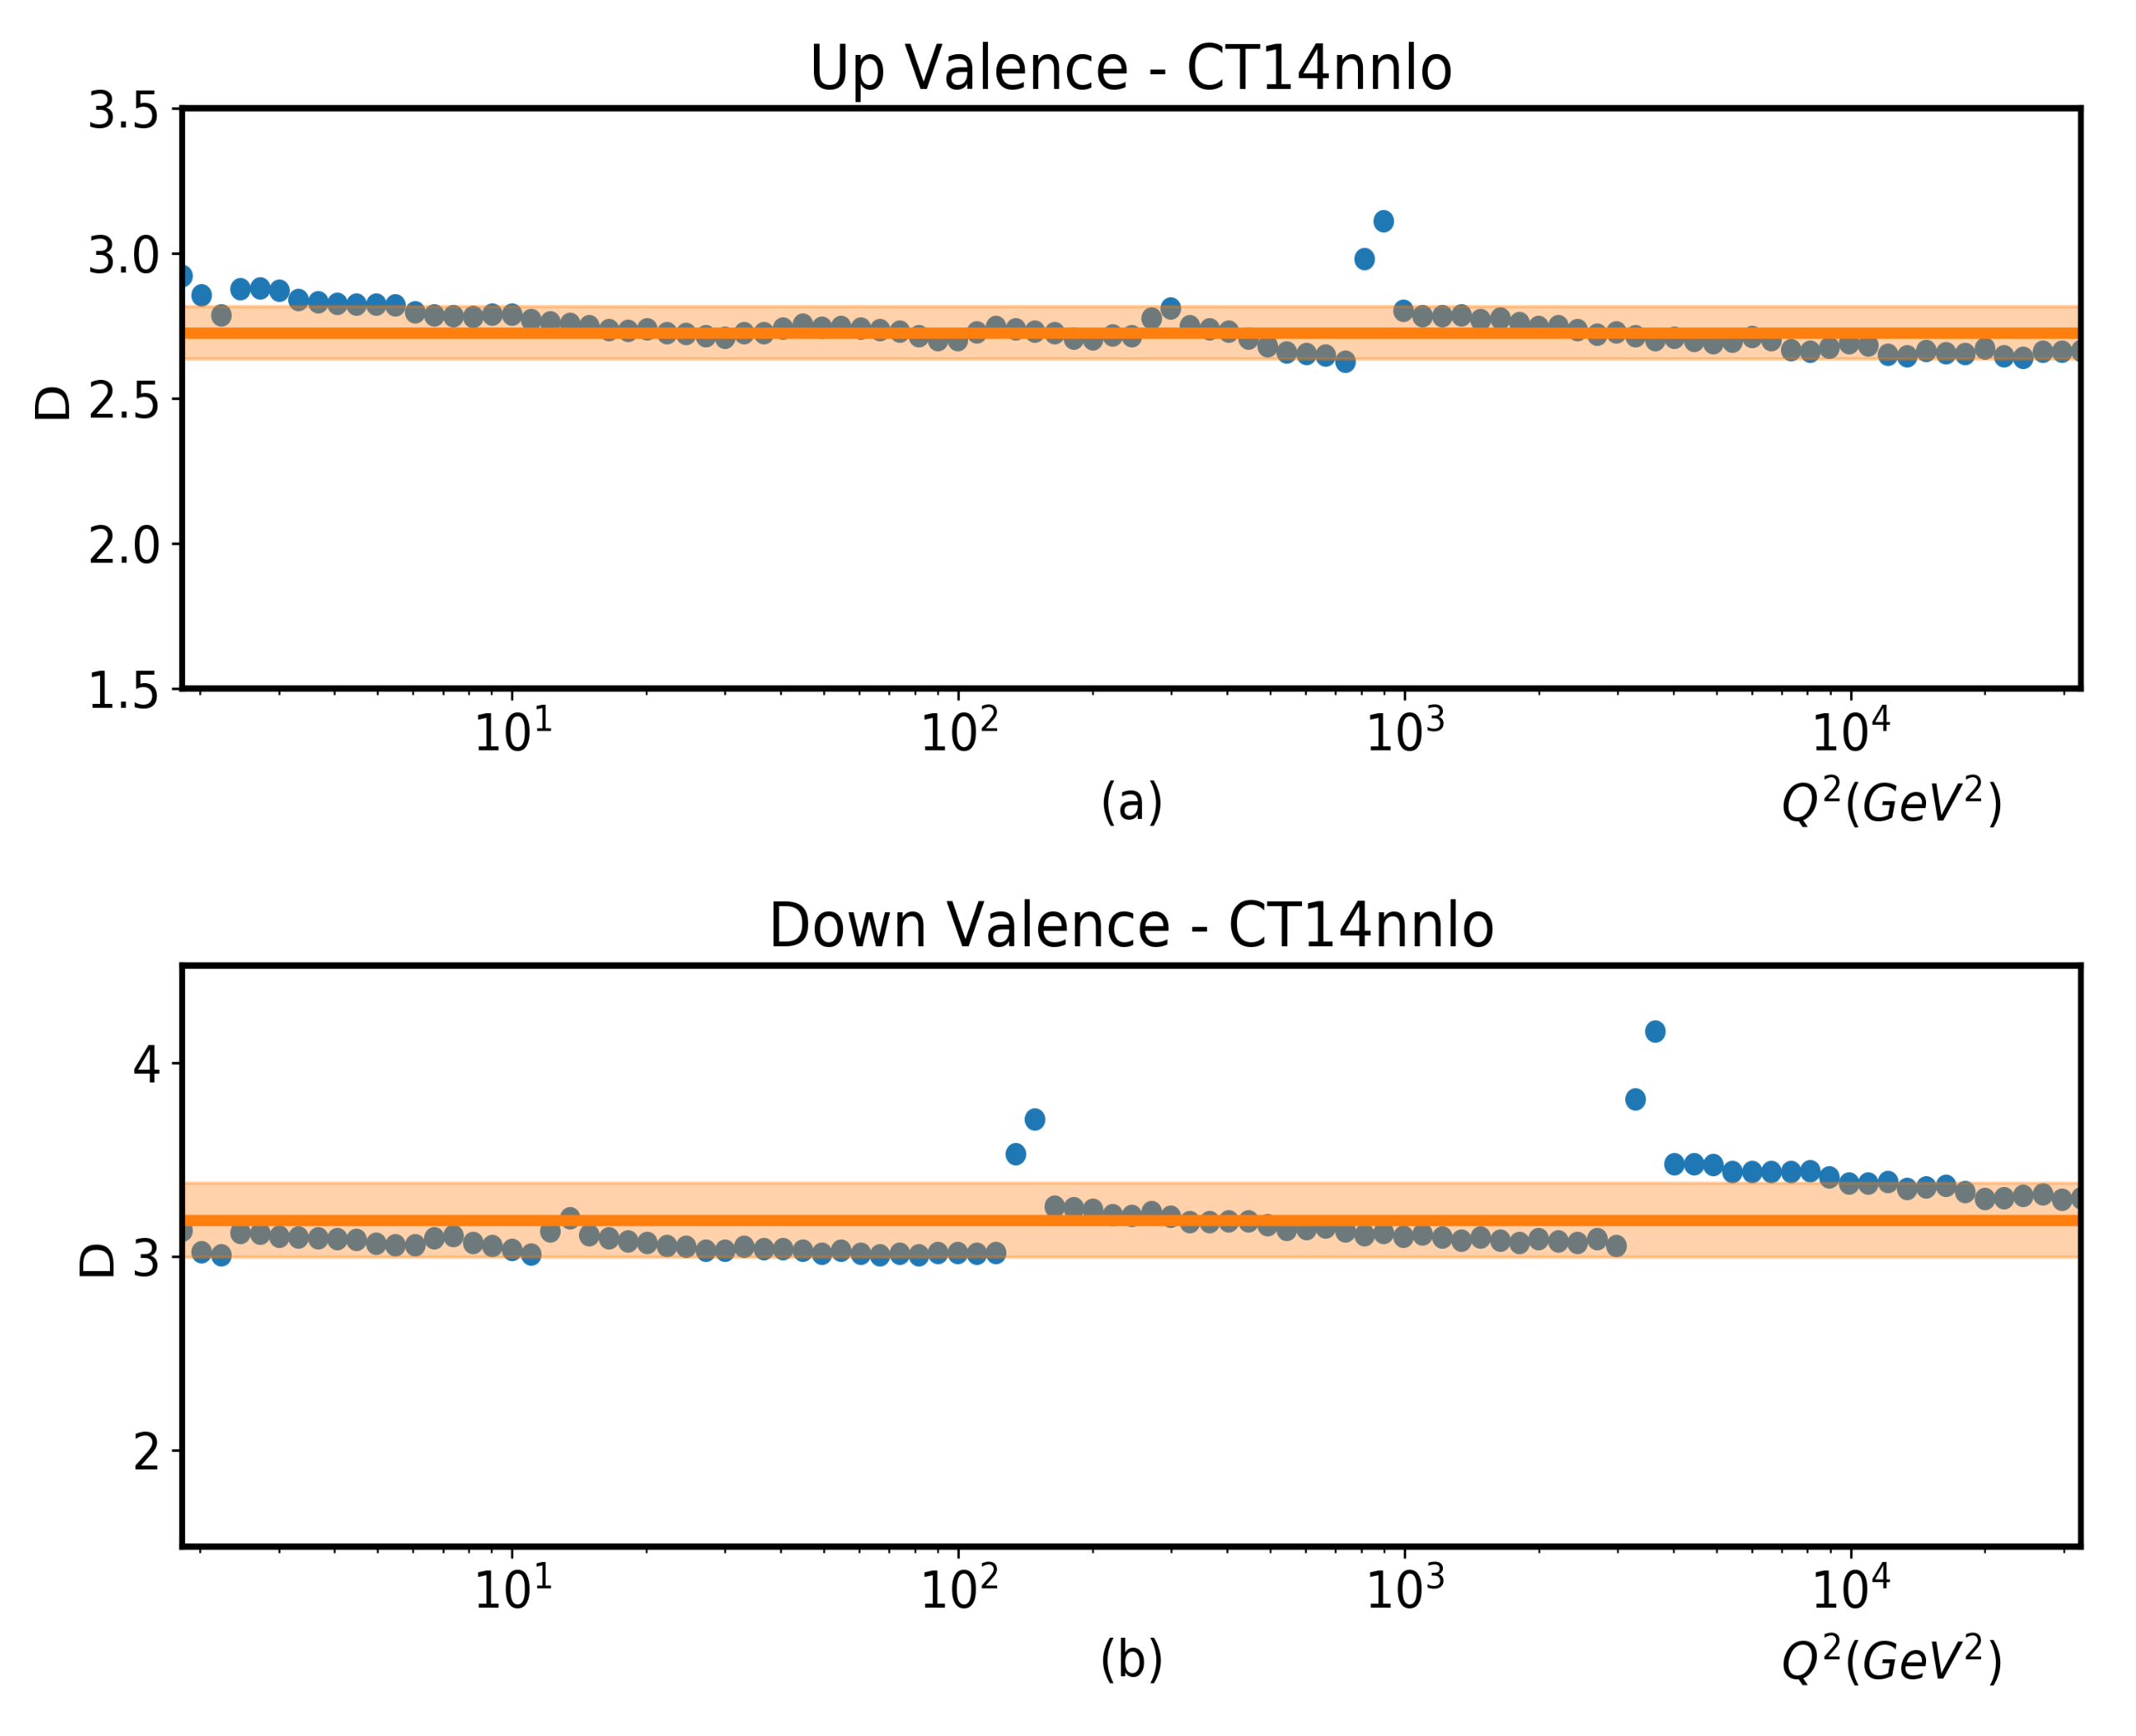
Figure 3 shows a similar evaluation for the l.h.s of Equation (8) but for next-to-next-to-leading order (NNLO) approximation. As Figure 3 shows, the l.h.s part again produces an almost constant behavior for the entire range of . This suggests again that Overall, Figure 2 and Figure 3 show that the condition of is approximately independent on the order of approximation in the QCD evolution.
The above observation of indicates that the correlation function, has an exponential form:
which is universal with respect to the order of approximation in the QCD evolution equation, with differing exponents D and overall factors C. The values of C and D constants for d and u valence quarks in LO, NLO and NNLO approximations are given in Table 1, which suggests that the magnitude of these constants converge with the increase in approximation in the QCD evolution equation. Note that the LHAPDF gives PDF values by using spline interpolation between grid points. This leads to instabilities when calculating PDF derivatives numerically [6], hence the discontinuities and kinks in Figure 2 and Figure 3.
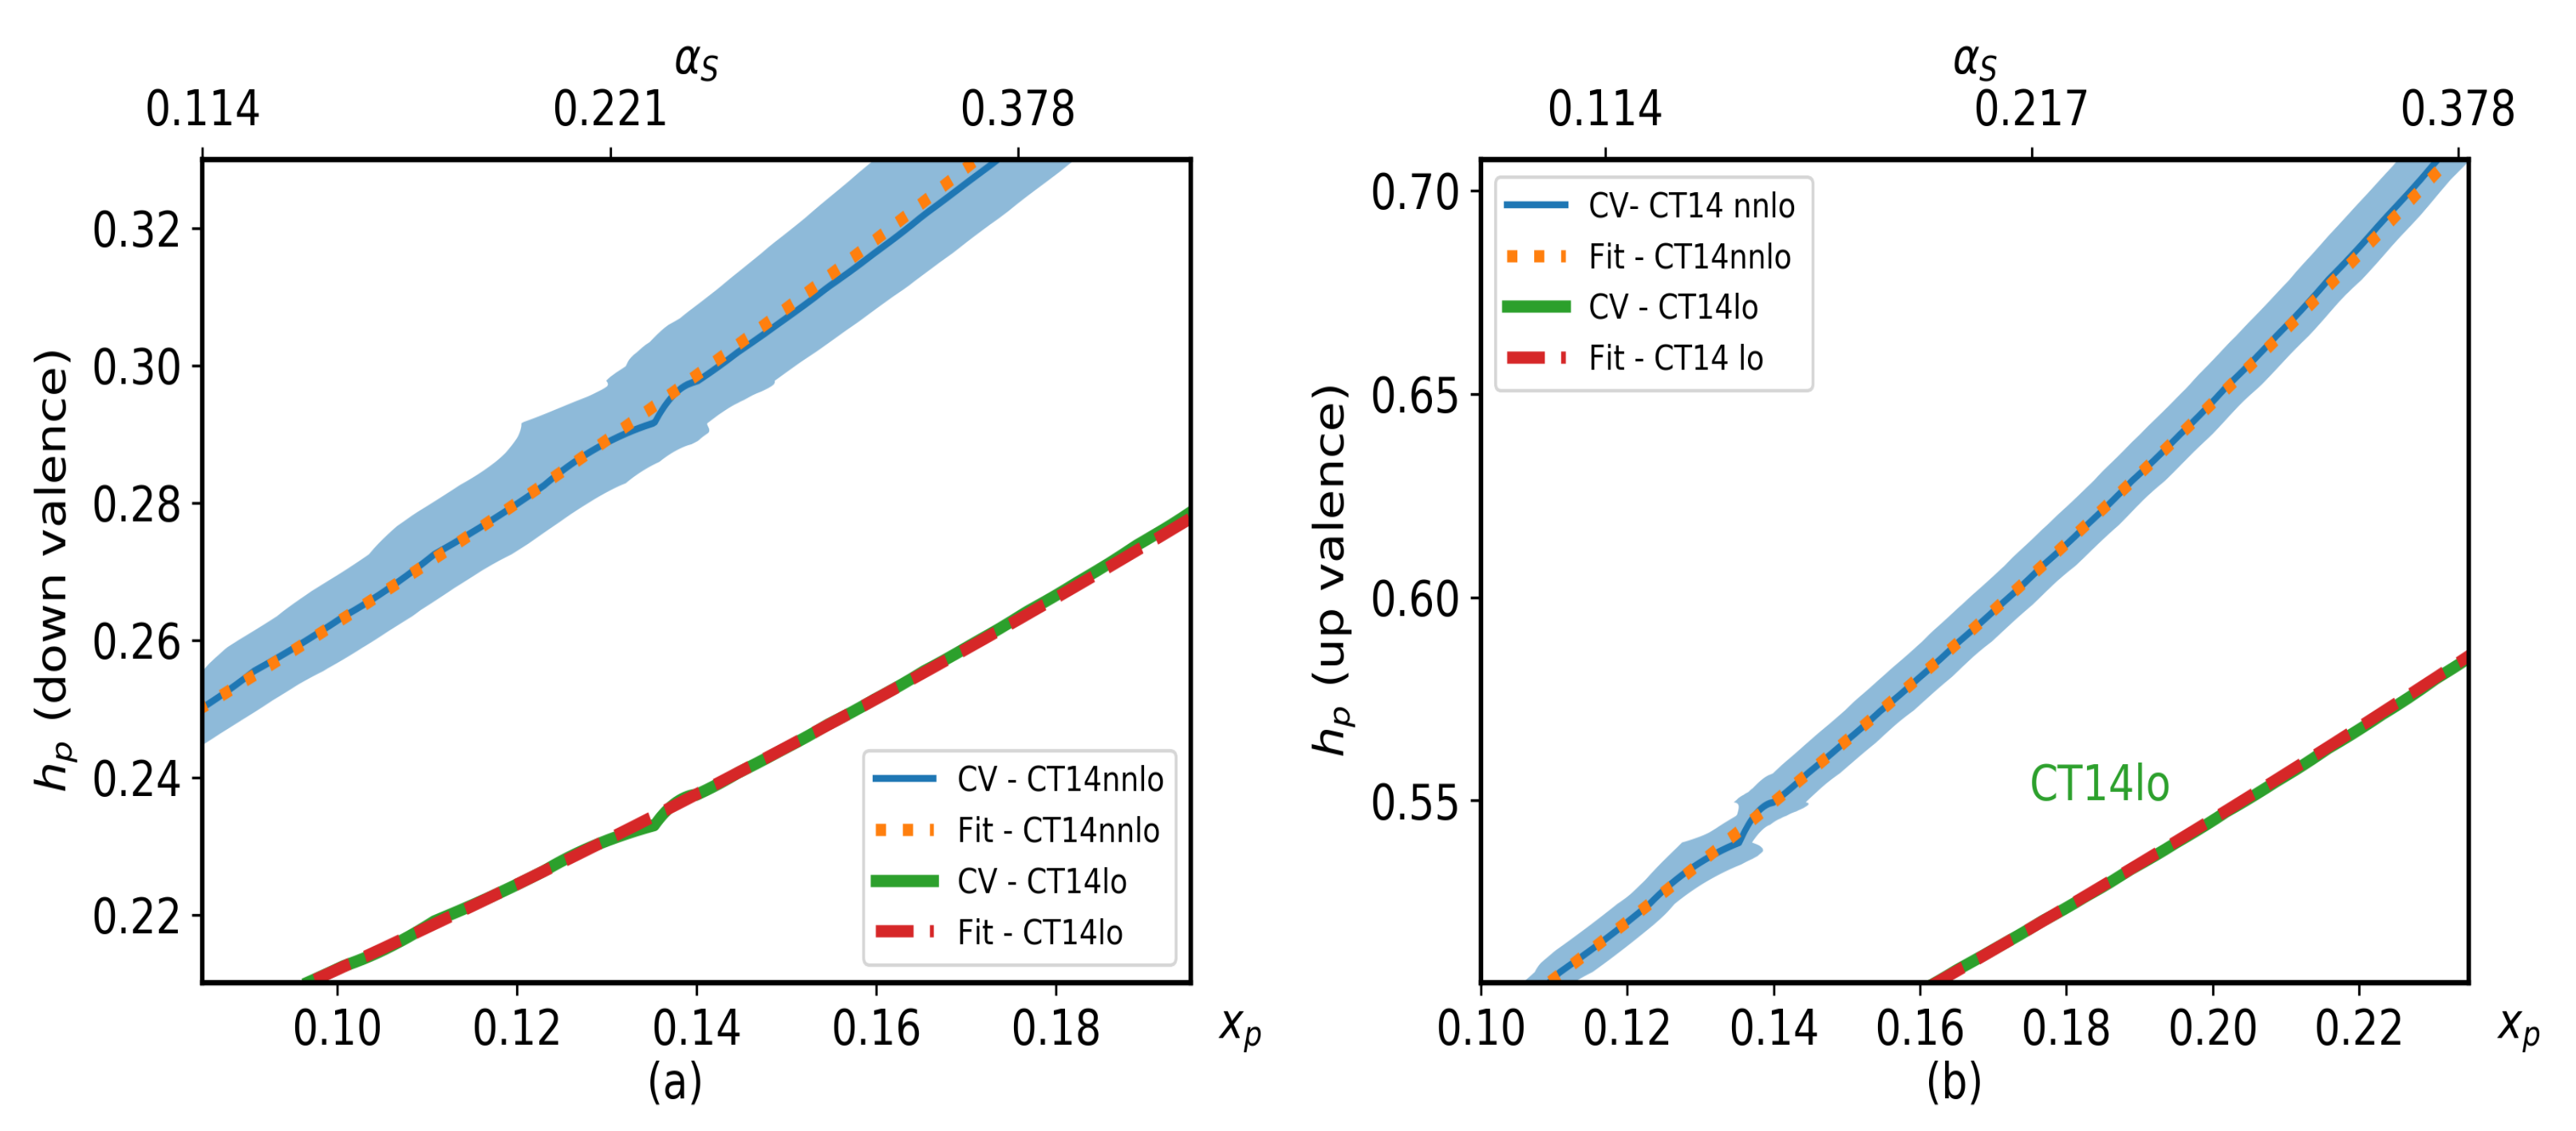
In Figure 4, the parameters of Table 1 are used to compare the function of Equation (10) with the -dependence of for down and up valence quarks in the proton in the LO and NNLO approximations for the CT14 parameterization [3]. Figure 4 shows that indeed the – correlation follows almost ideally an exponential form. It is worth mentioning that other modern PDF parameterizations using different ansatzs, renormalization and factorization schemes for PDFs give similar results (see Section 6).
Summarizing this Section, one concludes that a new empirical relation is found for valence PDFs, according to which the specific combination of the partial t and derivatives of PDFs results in a constant value for the range of considered:
where the constant D depends on the flavor of the valence quark and on the order of the approximation in QCD evolution.
4. Origin of the Exponential Form of the Height-Position Correlation
The observation of the exponential form of Equation (10) in the current study is purely empirical. Existing PDF sets in the given approximation are used and the estimation of the expression in Equation (8) is found to result in a constant number, D. It is an interesting problem to understand the origin of the observed exponential form of height-position correlation. To this end, let us note that, while nonperturbative dynamics defines the initial shape of the valence PDFs, the change with and, therefore, the height-position correlation are associated with QCD evolution, and the baryonic sum rules the valence quarks satisfy. Thus, the changes in the height of the peak of function and in the position are associated with perturbative dynamics.
To understand the origin of the exponential form of the “height-position” correlation Equation (10), one needs to consider the simultaneous solutions of evolution equations for and functions at the given approximation together with the condition of the maximum, . The latter leads to the relation:
where for the term one can derive an evolution equation. For example, in the LO approximation:
The complexity of the above equations (especially in NLO and NNLO approximations) makes it difficult to find an analytic solution in the form of Equation (10). To understand the origin of such a correlation, the above equations can be studied numerically in different approximations, using different ansatzs for PDFs that describe experimental distributions at fixed . These studies (to be presented elsewhere) indicate specific properties of the evolution equation whose solutions furnish the correlation function in the form of Equation (10).
5. The -Dependence of at the Vicinity of the Peak
Given that , from Equation (10), one observes that in the vicinity of :
where C and D are constants, defined in Equation (10), and e is the Euler’s number. It can be checked that the above function peaks at and its peak value corresponds to the terms of the Taylor expansion of Equation (10) in up to . It is interesting that even though the constant D is due to dynamics of QCD evolution, it also defines the valence PDF in the vicinity of the peak position, .
Following from Equation (14), the exponent of the term, , is defined by the position of the peak . The latter, as it is discussed above, changes continuously with t due to QCD evolution. However as it follows from Figure 1, at starting , before the onset of QCD evolution, the peak-positions are different for valence d and u quarks, resulting in different x-dependences of PDFs at the vicinity of the peak for d and u quarks. The fact that the exponent of term is flavor-dependent indicates a more complex dynamics in the generation of valence PDFs at than one expects, for example, from the mechanism of a fixed number gluon exchanges between valence quarks. For a fixed number of exchanges, one obtains a constant exponent proportional to the number of exchanged particles [7,8], which are same for valence u and d quarks. On the other hand, flavor-dependent exponent can be obtained by considering an effective interacting potential [9,10] in Weinberg type equations for relativistic bound states [11]. Thus, one may expect that valence PDFs at at fixed are generated by mean-field-type interactions rather than by a combination of a finite number of exchanges between valence quarks.
Note that only when moving away from towards , the mechanism of quark–quark interaction through a hard gluon exchange is expected to become important. Indeed the asymptotics of empirical PDFs indicate that the exponent of the part of the distribution approaches the same constant value for valence d and u quarks at 0.7–0.8; within PDF uncertainties, see, e.g., [3,6].
In this respect, the partonic dynamics for the valence sector can be similar to that in nuclear physics, with mean field and short-range correlations dominating at different internal momentum regions of the constituents (see, e.g., [12]).
6. Other PDFs and Hadrons
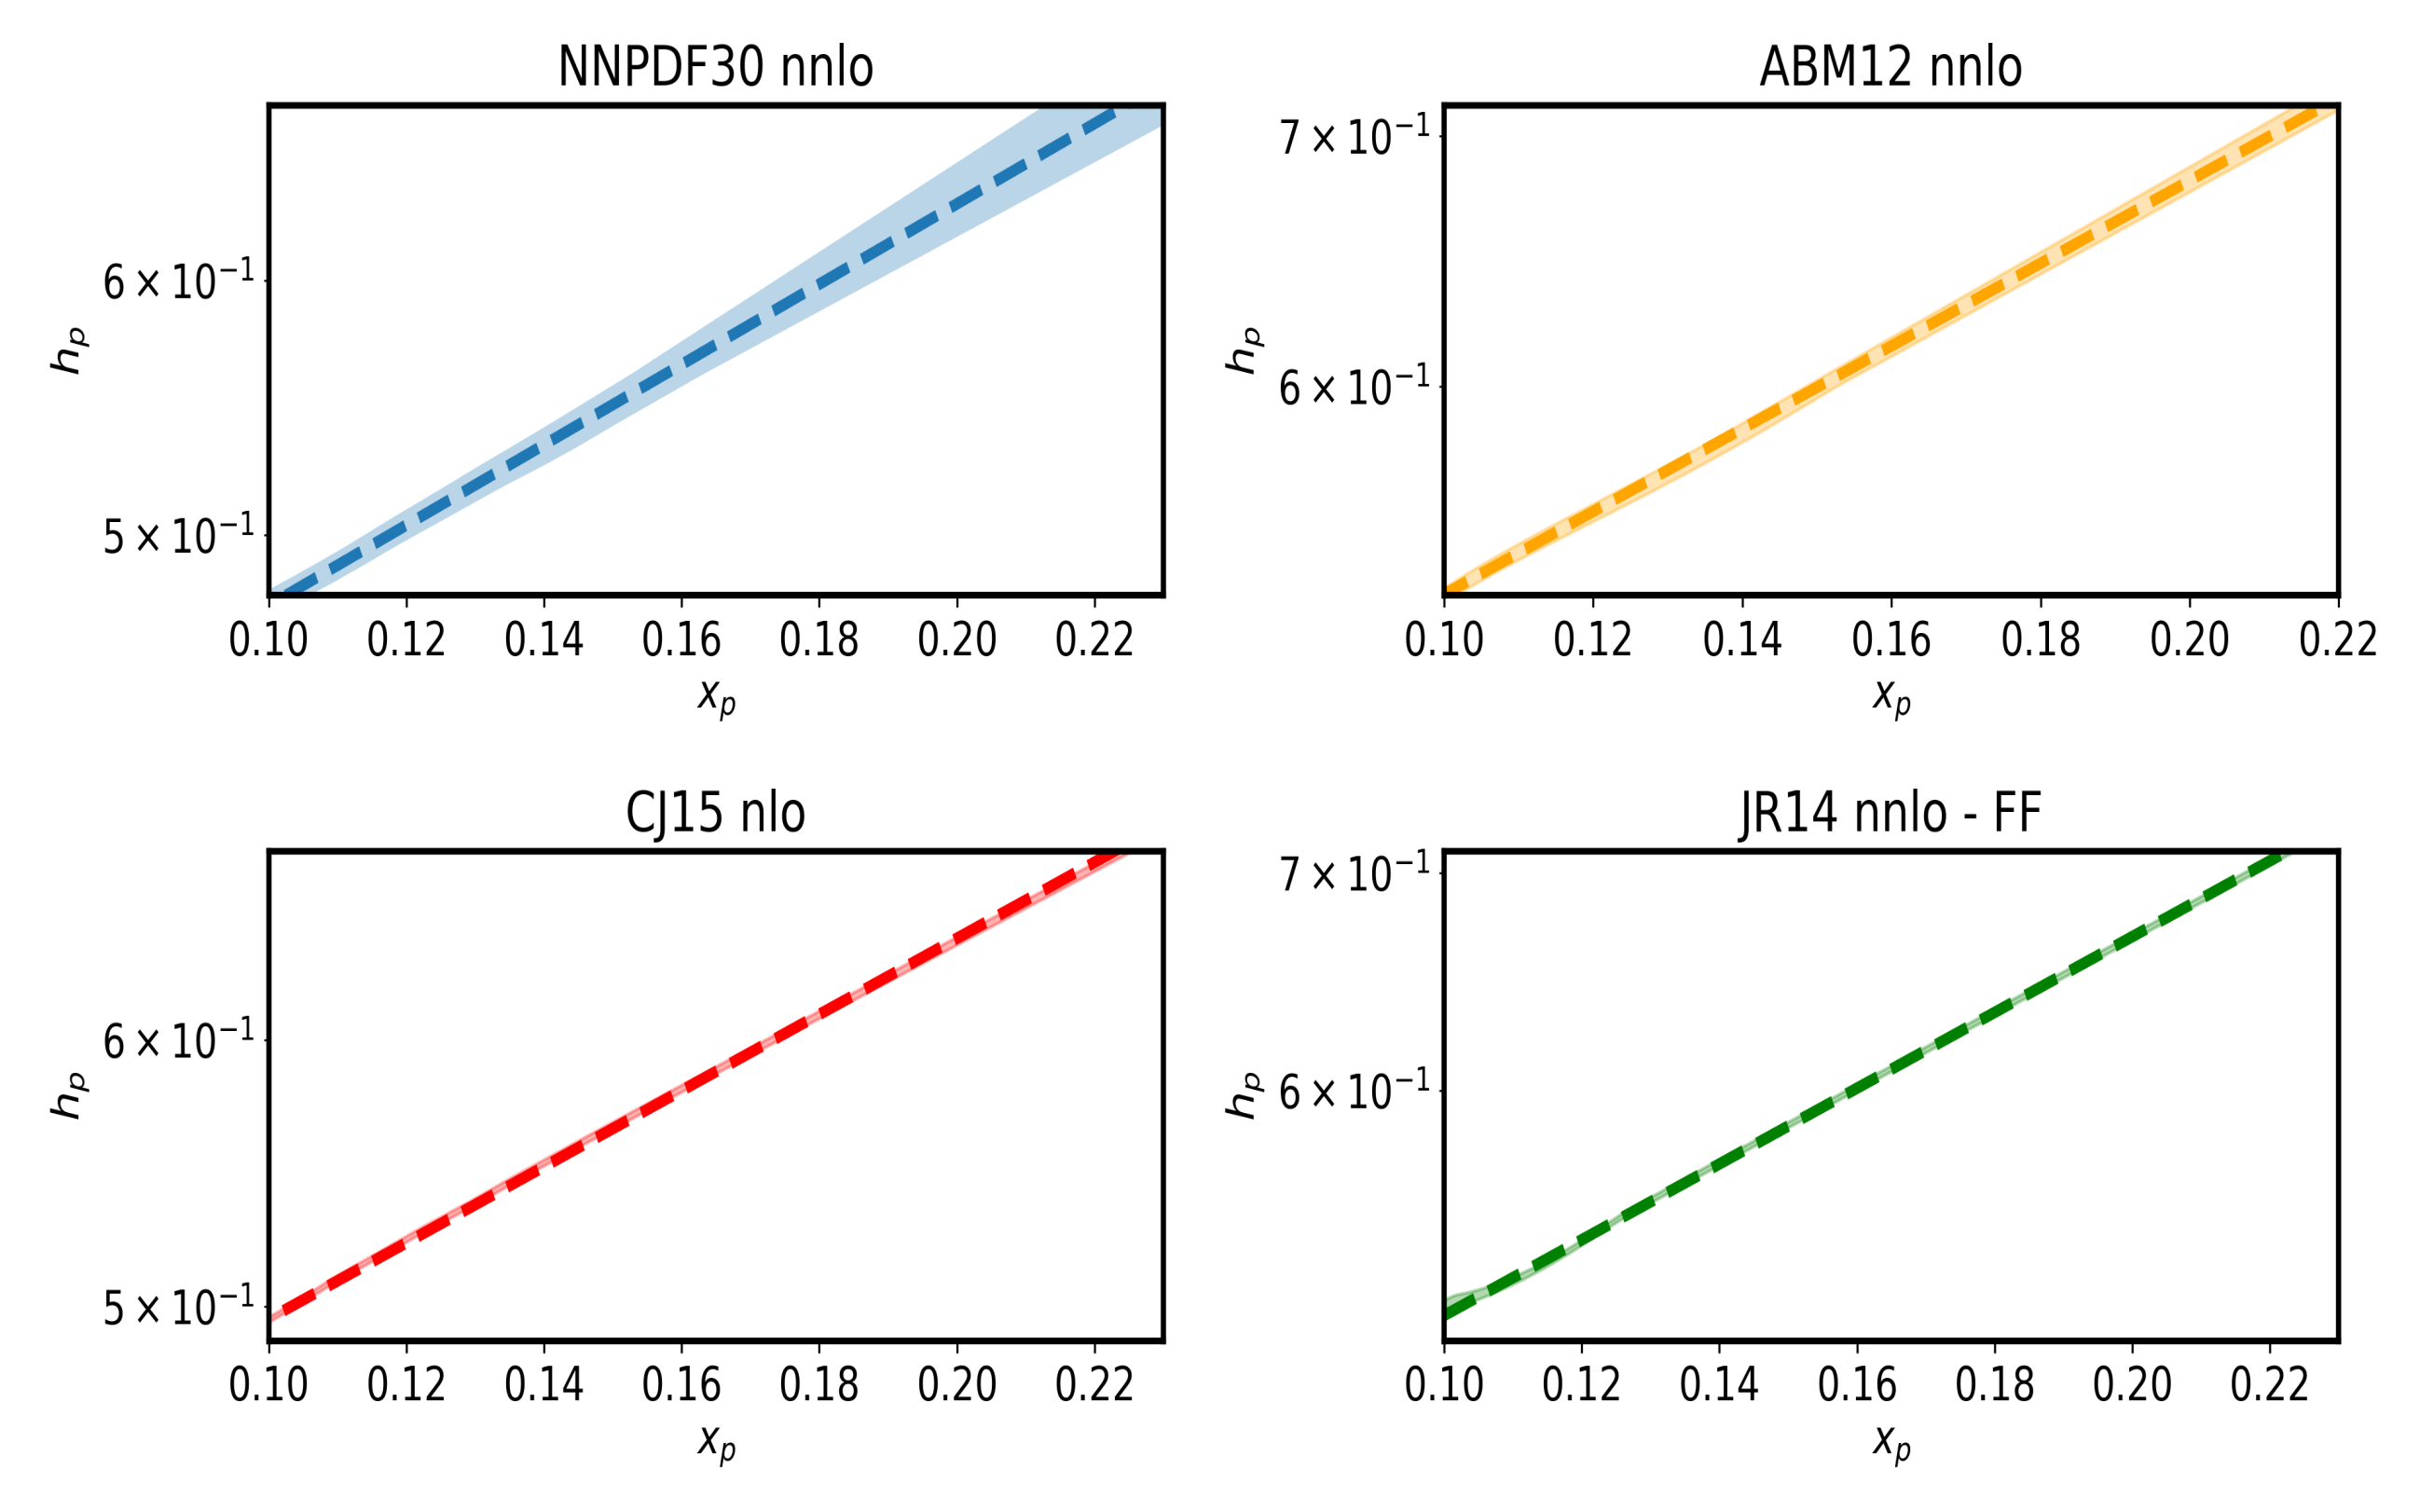
The observed “height-position” correlation of the peak of the function in the nucleon is a combination of two effects: the dynamics that generate the partonic distribution of valence quarks at given and the QCD evolution that shifts the strength of the distribution towards smaller x. The relation found is robust for all the different PDF sets in leading order, which reinforces the expectation that the effect is due to QCD evolution. For the next-to-next leading orders, the PDF depends on factorization schemes, thus it is interesting to check whether the correlation of Equation (10) persists in higher-order approximations using different schemes. Since all modern PDF parameterizations employ the scheme [13], let us first check the validity of correlation for these sets of PDFs. As can be seen in Figure 5, the PDF sets NNPDF 30 nnlo [14], ABM12 nnlo [15], CJ15 nlo [4] and JR14 nnlo-FF [16]—all showed an exponential relation between the and for the up valence PDF. In addition, the extracted C and D parameters were all similar to the one obtained from CT14 nlo and nnlo case. This is despite the fact that these sets use different orders of approximation and prescriptions. While the scheme is used in the evolution equatons, the renormalization and factorization schemes used to deal with the heavy quark (which ends up impacting the light quark distributions via the momentum sum rule) differ. NNPDF [14] uses the on-shell renormalization scheme for the heavy quarks and FONLL-C [17] for factorization, ABM12 nnlo [15] and JR14 nnlo-FF [16] both use for renormalization(with the number of flavors, ) for factorization, while CJ15 nlo uses the on-shell prescription and SACOT for factorization [18]. These parametrizations also differ in the initial ansatz, with NNPDF using neural networks and starting at GeV, while ABM12 nnlo, CJ15 nlo, and JR14 nnlo-FF used simpler functional forms and started at and GeV, respectively.
In Figure 6, one compares available PDFs which are obtained using both the and DIS [19] schemes in the next-to-leading-order for CTEQ6 parameterization [20]. Here again, one observes the exponential form of correlation for both schemes, in which the results for the DIS scheme are somewhat closer to that of leading order approximation. However, it is worth noticing that total uncertainty for CTEQ6 parametrization [20] is larger than the uncertainties for modern parameterizations (see, e.g., [3]).
From the above comparisons, one might expect that correlation of type of Equation (10) to be universal for valence PDFs describing “experimental” distributions, and satisfying specific sum rules, such as baryonic number sum rule for nucleons.
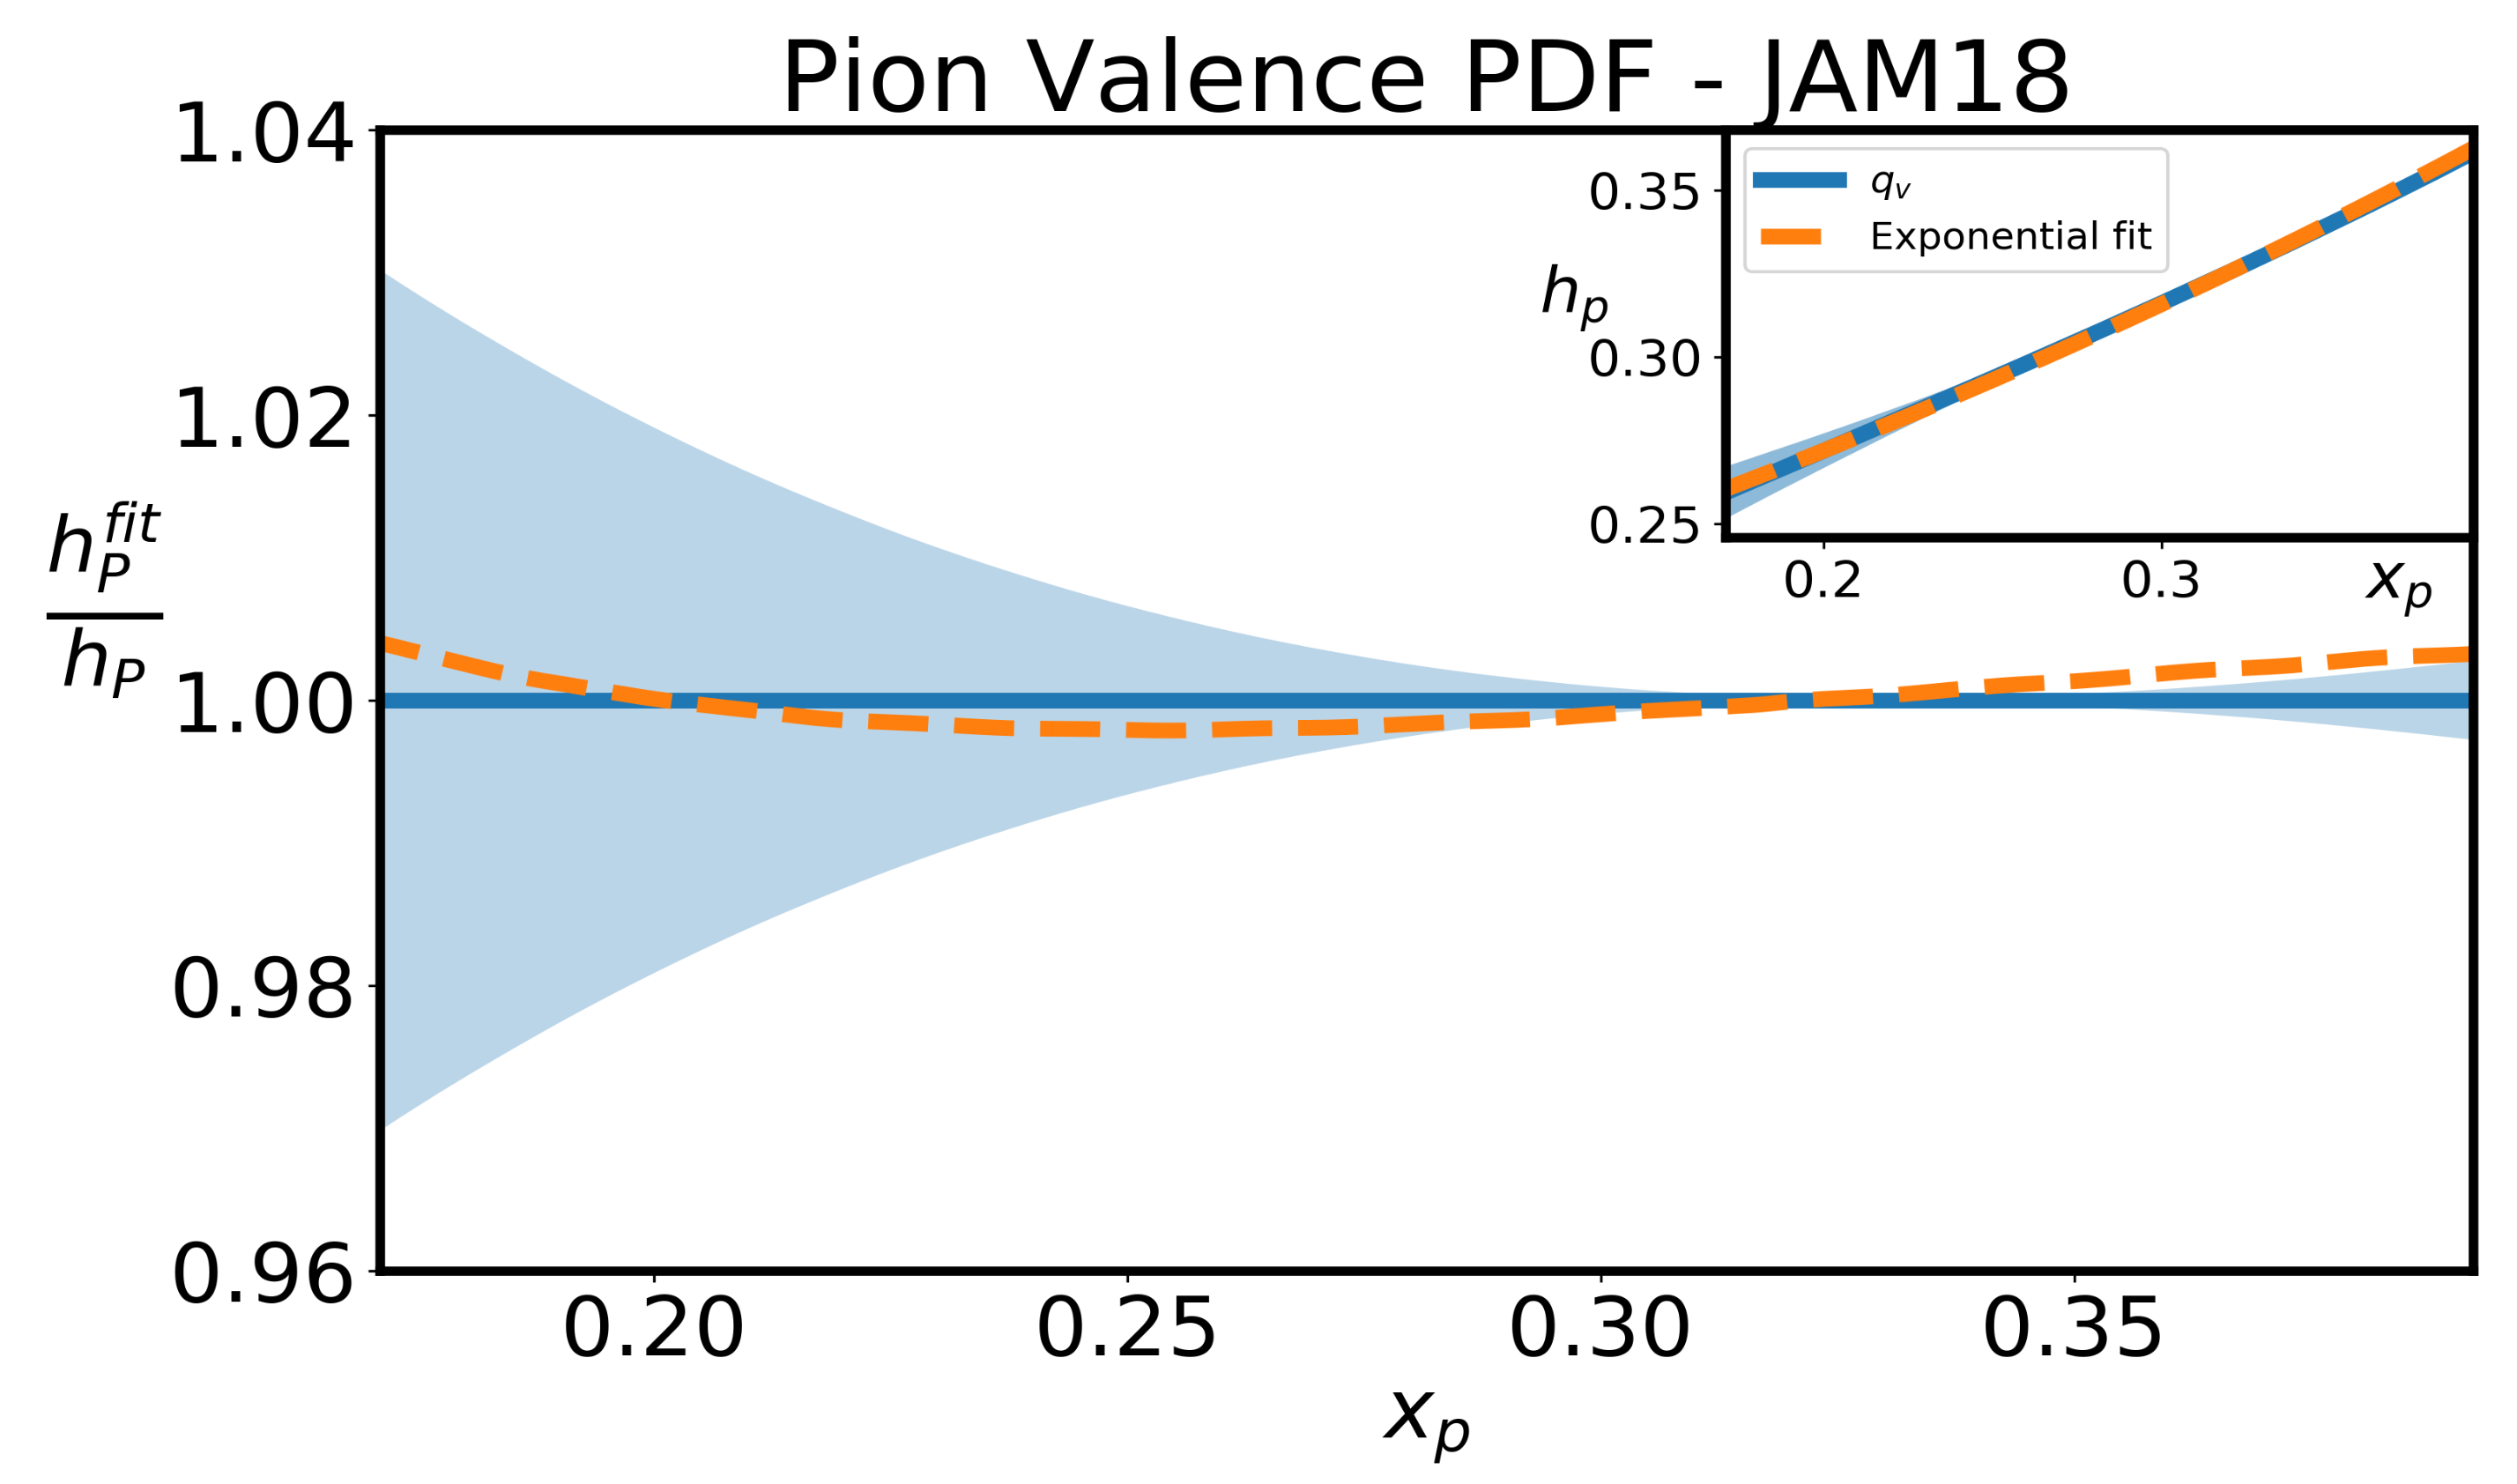
It is interesting to explore the possibility of similar correlations also for mesons extending it to the sector of strange and charm quarks. As an initial result, let us present in Figure 7 the -dependence of the x-weighted valence quark distribution in the -meson calculated based on the recently obtained PDF parameterization [21]. Detailed analysis of pion PDFs to be given elsewhere.
7. Discussion and Conclusions
Recapitulating, let us emphasize that the exponential form of the “height-position” correlation is a result of the specific relation between and t derivatives of valence PDFs Equation (11), which results in a constant value D for the range of that PDFs are considered. The verification of this relation with PDF parameterizations obtained in LO, NLO and NNLO approximations (e.g., Figure 2 and Figure 3) indicates that it is valid for any order of QCD coupling constant, , based on the scheme of factorization. Despite large uncertainties, current study also indicates that Equation (10) is valid also for the other (DIS) scheme of factorization. Such universality of the exponential form of the correlation, in our view, is due to the dynamics of QCD evolution, which can in principle be studied as a separate analytical problem as discussed in Section 4.
It is interesting to verify the existence of relation (11) for nuclear PDFs as well as for semi-inclusive DIS processes sensitive to the valence quark distributions. Relation (11) can be used in the calculation of valence PDFs using lattice QCD, not just for the proton but for other hadrons whose PDFs are not well constrained by experiment.
Finally, one expects similar effects to be observed also for fragmentation functions, since evolution equations, at least in LO, have similar splitting functions. In fact, gluon fragmentation functions at small x exhibit features reminiscent to that discussed in this paper (see, e.g., [22,23] and references therein).
Overall, establishing the universality of Equation (11) allows using it to constrain evolution of more complex processes in higher-order approximations.
Author Contributions
Conceptualization, C.L., M.M.S. and F.V.; methodology and derivations, C.L. and M.M.S.; data analysis, C.L, M.M.S. and F.V. Authors equally contributed in the writing of the paper. All authors have read and agreed to the published version of the manuscript.
Funding
This work is supported by U.S. DOE grant under contract DE-FG02-01ER41172.
Data Availability Statement
The data that support the findings of this study are openly available in LHAPDF library that can be accessed at https://lhapdf.hepforge.org/, accessed on 8 Septermber 2021.
Conflicts of Interest
The authors declare no conflict of interest.
References
- Hen, O.; Weinstein, L.B.; Piasetzky, E.; Miller, G.A.; Sargsian, M.M.; Sagi, Y. Correlated fermions in nuclei and ultracold atomic gases. Phys. Rev. C 2015, 92, 045205. [Google Scholar] [CrossRef] [Green Version]
- Hou, T.J.; Gao, J.; Hobbs, T.J.; Xie, K.; Dulat, S.; Guzzi, M.; Huston, J.; Nadolsky, P.; Pumplin, J.; Schmidt, C.; et al. New CTEQ global analysis of quantum chromodynamics with high-precision data from the LHC. Phys. Rev. D 2021, 103, 014013. [Google Scholar] [CrossRef]
- Dulat, S.; Hou, T.J.; Gao, J.; Guzzi, M.; Huston, J.; Nadolsky, P.; Pumplin, J.; Schmidt, C.; Stump, D.; Yuan, C.P. New parton distribution functions from a global analysis of quantum chromodynamics. Phys. Rev. D 2016, 93, 033006. [Google Scholar] [CrossRef] [Green Version]
- Accardi, A.; Brady, L.T.; Melnitchouk, W.; Owens, J.F.; Sato, N. Constraints on large-x parton distributions from new weak boson production and deep-inelastic scattering data. Phys. Rev. D 2016, 93, 114017. [Google Scholar] [CrossRef] [Green Version]
- Buckley, A.; Ferrando, J.; Lloyd, S.; Nordström, K.; Page, B.; Rüfenacht, M.; Schönherr, M.; Watt, G. LHAPDF6: Parton density access in the LHC precision era. Eur. Phys. J. C 2015, 75, 132. [Google Scholar] [CrossRef] [Green Version]
- Ball, R.D.; Nocera, E.R.; Rojo, J. The asymptotic behaviour of parton distributions at small and large x. Eur. Phys. J. C 2016, 76, 383. [Google Scholar] [CrossRef] [Green Version]
- Lepage, G.P.; Brodsky, S.J. Exclusive processes in perturbative quantum chromodynamics. Phys. Rev. D 1980, 22, 2157. [Google Scholar] [CrossRef] [Green Version]
- Gunion, J.F.; Nason, P.; Blankenbecler, R. Power suppressed contributions to deep inelastic processes. Phys. Rev. D 1984, 29, 2491. [Google Scholar] [CrossRef]
- Leon, C.; Sargsian, M. A non-perturbative model of mean field valence quarks. PoS 2020, LC2019, 056. [Google Scholar] [CrossRef]
- Leon, C.; Sargsian, M. Residual mean field model of valence quarks in the nucleon. arXiv 2012, arXiv:2012.14030. [Google Scholar]
- Weinberg, S. Dynamics at infinite momentum. Phys. Rev. 1966, 150, 1313–1318. [Google Scholar] [CrossRef]
- Sargsian, M.M. New properties of the high-momentum distribution of nucleons in asymmetric nuclei. Phys. Rev. C 2014, 89, 034305. [Google Scholar] [CrossRef] [Green Version]
- Zyla, P.A.; Barnett, R.M.; Beringer, J.; Dahl, O.; Dwyer, D.A.; Groom, D.E.; Lin, C.J.; Lugovsky, K.S.; Pianori, E.; Robinson, D.J.; et al. Review of Particle Physics. PTEP 2020, 2020, 083C01. [Google Scholar] [CrossRef]
- Ball, R.D.; Bertone, V.; Carrazza, S.; Deans, C.S.; Del Debbio, L.; Forte, S.; Guffanti, A.; Hartland, N.P.; Latorre, J.I.; Rojo, J.; et al. Parton distributions for the LHC Run II. JHEP 2015, 04, 040. [Google Scholar] [CrossRef] [Green Version]
- Alekhin, S.; Blumlein, J.; Moch, S. The ABM parton distributions tuned to LHC data. Phys. Rev. D 2014, 89, 054028. [Google Scholar] [CrossRef] [Green Version]
- Jimenez-Delgado, P.; Reya, E. Delineating parton distributions and the strong coupling. Phys. Rev. D 2014, 89, 074049. [Google Scholar] [CrossRef] [Green Version]
- Ball, R.D.; Bonvini, M.; Rottoli, L. Charm in Deep-Inelastic Scattering. JHEP 2015, 11, 122. [Google Scholar] [CrossRef] [Green Version]
- Accardi, A.; Alekhin, S.; Blümlein, J.; Garzelli, M.V.; Lipka, K.; Melnitchouk, W.; Moch, S.; Owens, J.F.; Plačakytė, R.; Reya, E.; et al. A critical appraisal and evaluation of modern PDFs. Eur. Phys. J. C 2016, 76, 471. [Google Scholar] [CrossRef] [Green Version]
- Altarelli, G.; Ellis, R.K.; Martinelli, G. Leptoproduction and Drell-Yan processes beyond the leading approximation in chromodynamics. Nucl. Phys. B 1978, 143, 521. [Google Scholar] [CrossRef]
- Pumplin, J.; Stump, D.R.; Huston, J.; Lai, H.L.; Nadolsky, P.M.; Tung, W.K. New generation of parton distributions with uncertainties from global QCD analysis. JHEP 2002, 07, 012. [Google Scholar] [CrossRef]
- Barry, P.C.; Sato, N.; Melnitchouk, W.; Ji, C.R. First Monte Carlo global QCD analysis of pion parton distributions. Phys. Rev. Lett. 2018, 121, 152001. [Google Scholar] [CrossRef] [PubMed] [Green Version]
- Dokshitzer, Y.L.; Khoze, V.A.; Mueller, A.H.; Troian, S. Basics of Perturbative QCD; Editions Frontieres: Gif-sur-Yvette, France, 1991. [Google Scholar]
- Ellis, R.K.; Stirling, W.J.; Webber, B.R. QCD and Collider Physics; Cambridge University Press: Cambridge, UK, 1996. [Google Scholar] [CrossRef]
Figure 1.
The momentum fraction x-dependence of the x-weighted distributions of the valence quarks, , at different values of the resolution scale for down (a) and up (b) valence quarks in proton. Peaks at different are connected by solid line to visualize the correlation between the position and the height of the peak. The shaded area is the Hessian error at 68% confidence level.

Figure 2.
The data points are evaluations of left-hand side of Equation (8) using CT14 lo parton distribution functions (PDFs) [3] for valence u-quark (a) and d-quark (b) distributions in the proton. The factor D is the average value of evaluations of Equation (8) with shaded area representing the standard deviation of calculated points.

Figure 3.
Same as Figure 2 but for next-to-next leading order approximation for CT14 PDFs [3] for valence u-quark (a) and d-quark (b) distributions. The thick orange line is the D obtained from averaging all the D for the central value curve, while the shaded orange region shows the region within of the average. Table 1 contains the PDF propagated errors.

Figure 4.
A comparison of the calculations (dotted lines) of Equation (10) with the actual CT14 PDFs [3] for valence d-quark (a) and u-quark (b) distributions. Parameters C and D are given in Table 1. Solid lines represent the central values (CV) and shaded area is the Hessian error at 68% confidence level of the CT14nnlo parameterization. Only the central value is shown for CT14lo. The top abscissa axis shows the next-to-next-to-leading order (NNLO) strong coupling , evaluated at the same as the corresponding valence-quark-distribution peak position of the bottom abscissa axis.

Figure 5.
The peak position-height correlation for the PDF sets NNPDF 30 nnlo [14], ABM12 nnlo [15], CJ15 nlo [4] and JR14 nnlo-FF [16], as indicated, for valence u-quark. The shaded regions show the uncertainty at 68% confidence level while the dashed curves represent exponential fits for each PDF set.

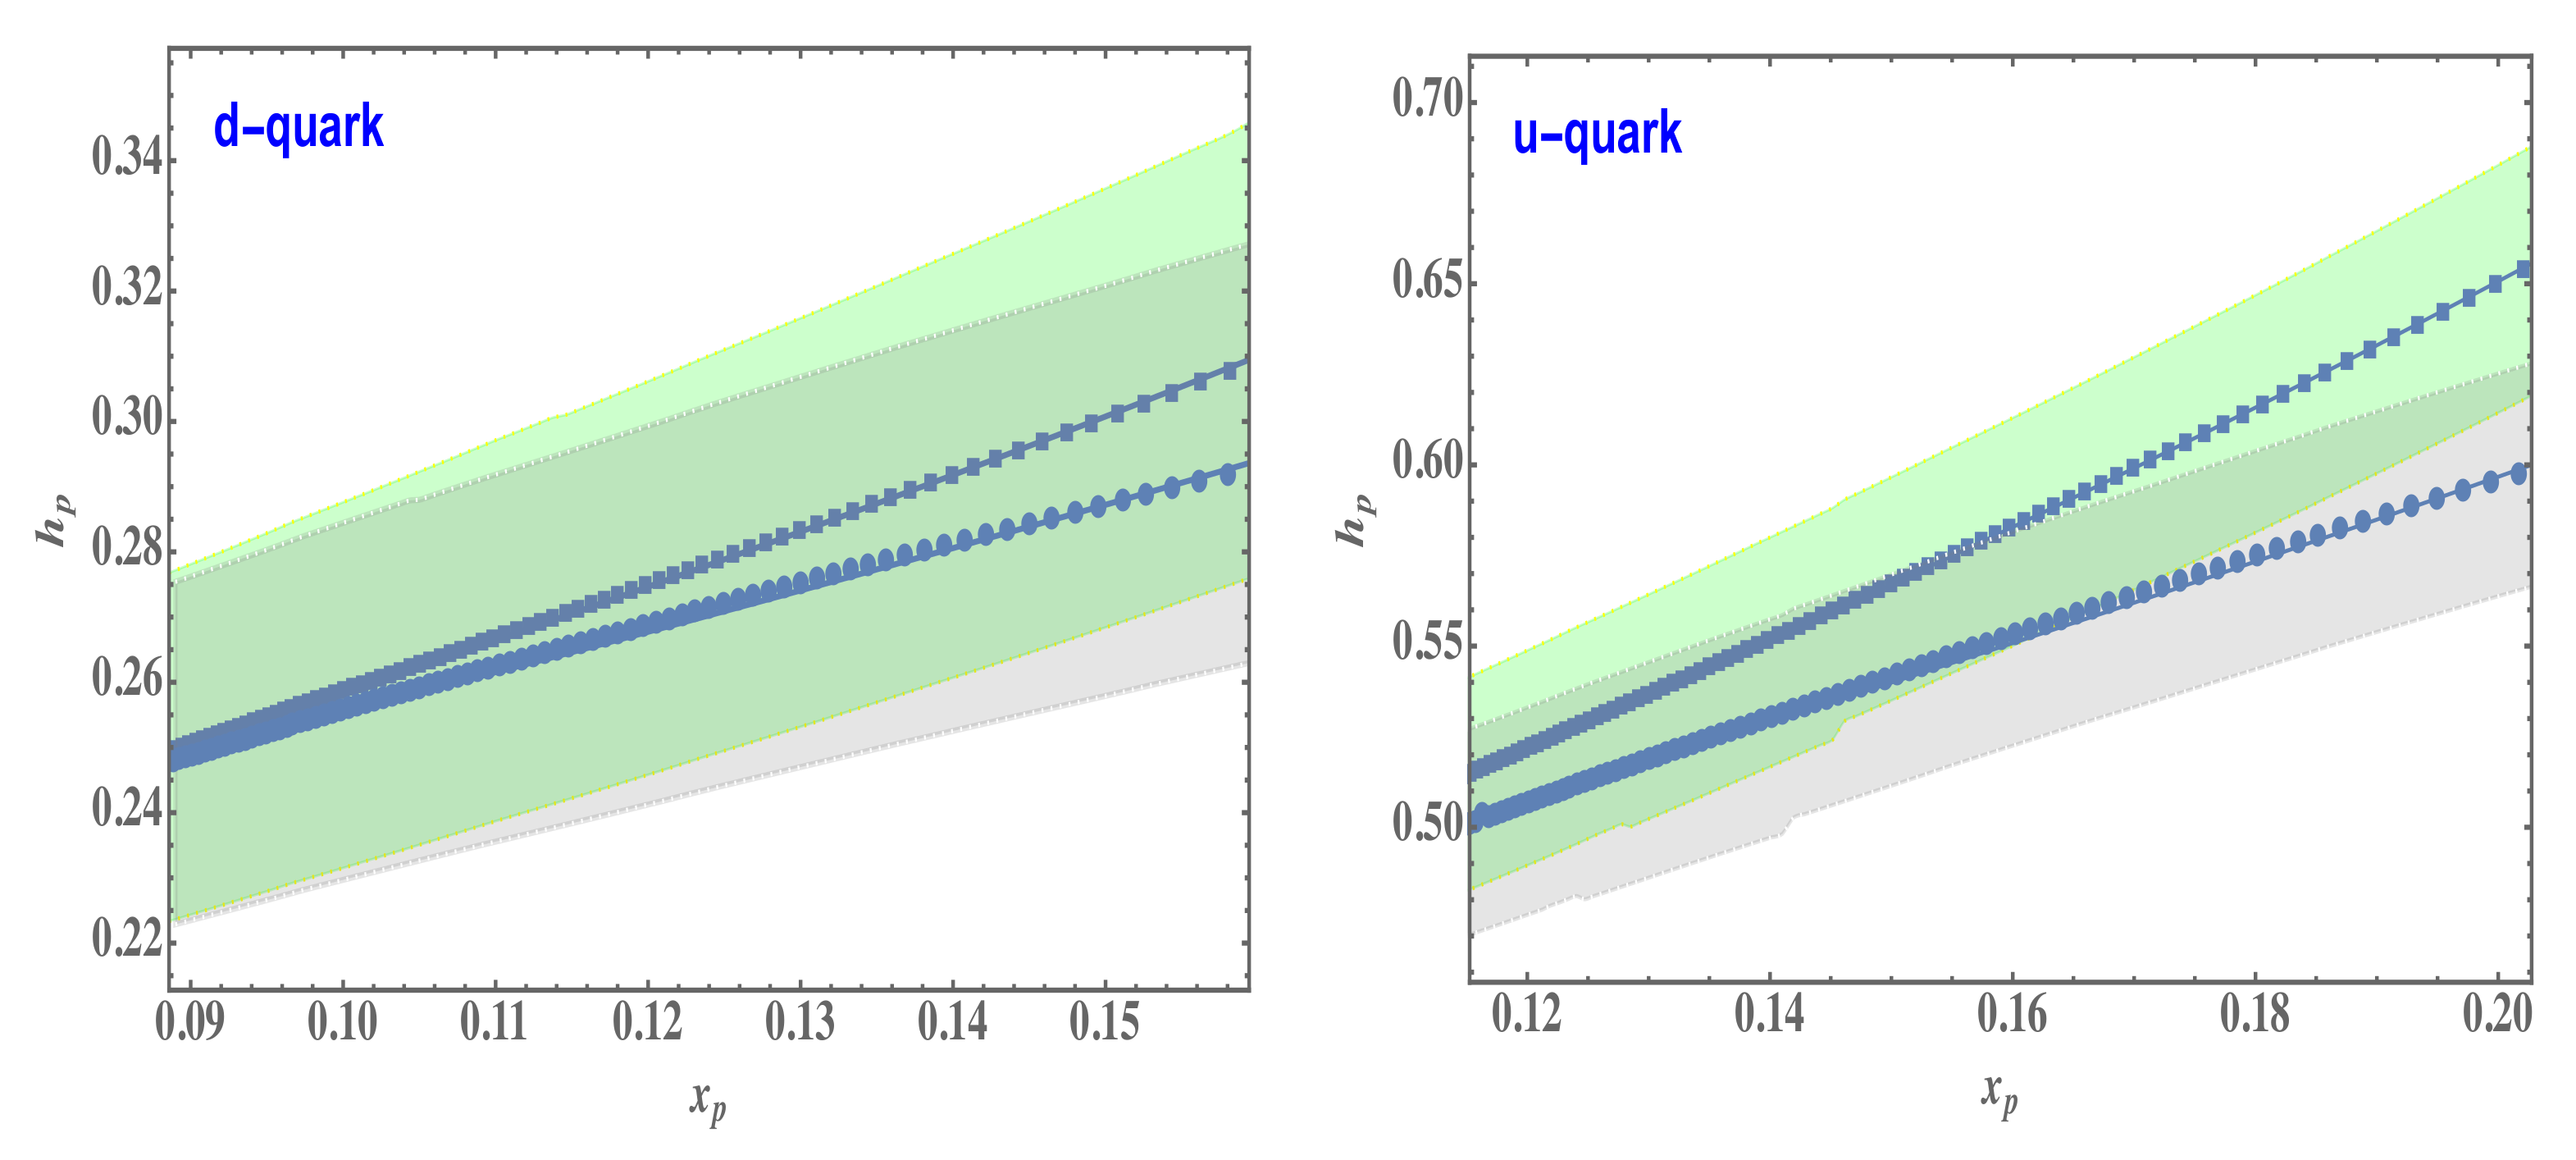
Figure 6.
The peak position-height correlation for the PDF sets of CTEQ6 parameterization [20] for valence d-quark (left panel) and u-quark (right panel) distributions. Solid squares indicate NLO parameterization based on the scheme and solid circles, NLO based on the DIS scheme [19]. The curves are results of the fits according to Equation (10). The shaded regions show the uncertainties evaluated by using error sets in Hessian representation [20].

Figure 7.
Ratio of exponential fit of the -dependence of function using the parameterization of [21]. Dashed line is the fit according to Equation (10), solid line shows the central values and shaded area represents the error at 68% confidence level of parameterization. The insert shows the PDF function vs as well as the fit.


Table 1.
A pair of parameters (C, D) of Equation (10) for valence d-quark and u-quark distributions in the proton. Uncertainties (last digit in the parentheses) represent the 68% confidence level are obtained through (where appropriate) the parton distribution function’s Hessian eigenvector set., There are no uncertainties available for the CT14lo set.
| Distribution | CT14lo | CT14nlo | CT14nnlo |
|---|---|---|---|
| 0.16, 2.8 | 0.19(1), 3.1(1) | 0.193(6), 3.1(2) | |
| 0.36, 2.02 | 0.37(1), 2.71(9) | 0.37(1), 2.7(1) |
Publisher’s Note: MDPI stays neutral with regard to jurisdictional claims in published maps and institutional affiliations. |
© 2021 by the authors. Licensee MDPI, Basel, Switzerland. This article is an open access article distributed under the terms and conditions of the Creative Commons Attribution (CC BY) license (https://creativecommons.org/licenses/by/4.0/).
Share and Cite
MDPI and ACS Style
Leon, C.; Sargsian, M.M.; Vera, F. A Novel Feature of Valence Quark Distributions in Hadrons. Physics 2021, 3, 913-923. https://0-doi-org.brum.beds.ac.uk/10.3390/physics3040057
AMA Style
Leon C, Sargsian MM, Vera F. A Novel Feature of Valence Quark Distributions in Hadrons. Physics. 2021; 3(4):913-923. https://0-doi-org.brum.beds.ac.uk/10.3390/physics3040057
Chicago/Turabian StyleLeon, Christopher, Misak M. Sargsian, and Frank Vera. 2021. "A Novel Feature of Valence Quark Distributions in Hadrons" Physics 3, no. 4: 913-923. https://0-doi-org.brum.beds.ac.uk/10.3390/physics3040057