
Candidate Genes and Quantitative Trait Loci for Grain Yield and Seed Size in Durum Wheat
by
 , ,
, ,
Giacomo Mangini
1,2,* ,
,
Antonio Blanco
2, 
Domenica Nigro
2,
Massimo Antonio Signorile
2 and
Rosanna Simeone
2 1
Institute of Biosciences and Bioresources, National Research Council, Via Amendola 165/A, 70126 Bari, Italy
2
Department of Soil, Plant and Food Sciences, Genetics and Plant Breeding Section, University of Bari Aldo Moro, Via Amendola 165/A, 70126 Bari, Italy
*
Author to whom correspondence should be addressed.
Plants 2021, 10(2), 312; https://0-doi-org.brum.beds.ac.uk/10.3390/plants10020312
Submission received: 28 December 2020
/
Revised: 2 February 2021
/
Accepted: 3 February 2021
/
Published: 5 February 2021
(This article belongs to the Special Issue Cereal Physiology and Breeding)
Abstract
:Grain yield (YLD) is affected by thousand kernel weight (TKW) which reflects the combination of grain length (GL), grain width (GW) and grain area (AREA). Grain weight is also influenced by heading time (HT) and plant height (PH). To detect candidate genes and quantitative trait loci (QTL) of yield components, a durum wheat recombinant inbred line (RIL) population was evaluated in three field trials. The RIL was genotyped with a 90K single nucleotide polymorphism (SNP) array and a high-density genetic linkage map with 5134 markers was obtained. A total of 30 QTL were detected including 23 QTL grouped in clusters on 1B, 2A, 3A, 4B and 6B chromosomes. A QTL cluster on 2A chromosome included a major QTL for HT co-located with QTL for YLD, TKW, GL, GW and AREA, respectively. The photoperiod sensitivity (Ppd-A1) gene was found in the physical position of this cluster. Serine carboxypeptidase, Big grain 1 and β-fructofuranosidase candidate genes were mapped in clusters containing QTL for seed size. This study showed that yield components and phenological traits had higher inheritances than grain yield, allowing an accurate QTL cluster detection. This was a requisite to physically map QTL on durum genome and to identify candidate genes affecting grain yield.
1. Introduction
Durum wheat (Triticum turgidum L. ssp. durum) is grown on about 17 million hectares of land worldwide [1]. The Mediterranean Basin is the main durum wheat producing area, as well as its most significant import market and its largest consumer, being durum wheat primarily used for pasta, couscous, bulgur and farik production. The world’s projected population growth will result in a higher production demand, thus increasing grain yield per unit area will be of great importance to face this mounting challenge [2]. The rate of wheat production has been increasing by 0.9% per year, which is much less than the required 1.8%, suggesting that the improvement of wheat yield must be further increased [3]. Grain yield is conventionally expressed as the product of a different number of sub-traits named “yield components”, covering two main parameters: number of spikes per area and grain yield per spike. Grain yield per spike comprises grain number per spike and grain weight, usually expressed as thousand kernel weight (TKW). Grain weight is mainly and tightly underpinned by grain morphology including grain area, grain length and grain width. In the domestication process and breeding history, grain size has been a major selection and breeding target, thus being widely selected and manipulated to increase grain yield [4].
Understanding the genetic and molecular determinants of grain size might provide valuable information on the markers to be used for improving grain yield. As extensively reviewed by Nadolska-Orczyk et al. [5], the major genes determining yield-related traits can be classified in several groups. Among these, there are: transcription factors, which can affect grain number by regulating spike development; genes involved in metabolism or signaling of growth regulators, affecting plant architecture; genes determining cell division and proliferation, related to grain size; floral regulators, which regulate inflorescence architecture and seed number; and genes involved in carbohydrate metabolism, affecting plant architecture and grain yield.
The most advanced knowledge on the genetic factors controlling grain size were detected in rice. Indeed, quantitative genetic studies and map-based cloning have allowed several genes associated with grain size and weight in rice to be isolated [6]. OsGW2 was found to affect both grain weight and width [7], as well as its wheat orthologue, TaGW2, which was mapped on chromosome 6A [8] and found to be related to grain weight, grain width and grain length [9]. Similarly, allelic variation at TaGS-D1, the wheat orthologue of rice GS3 [10], showed main effects on grain weight and kernel size [11]. Genes involved in starch and sucrose metabolism pathways were also shown to affect grain weight, such as TaSus1 and TaSus2 [12,13] and TaCwi-A1 [14]. In addition, major phenology loci can exhibit pleiotropic effects on spike and kernel traits. These include the locus Rht1, which have been intensively used since the Green Revolution in breeding programs worldwide, and the major photoperiod sensitivity locus Ppd1, which is known to affect heading time as well as a range of other traits [15]. Ppd1 genes play an important role in wheat growth and development regulation by affecting the accumulation and distribution of dry matter within the plant and modifying source-sink equilibrium [16,17]. Indeed, it has been estimated that up to 35% of wheat grain yield increment observed in Europe can be attributed to photoperiod insensitivity [18].
In the last decade, single nucleotide polymorphism (SNP) markers have become fundamental for both genetic studies and breeding programs, and the development of wheat high-density SNP array [19] provided the most innovative tool for candidate genes searching by quantitative trait loci (QTL) mapping or genome wide association (GWAS) studies. Moreover, the recently released common and durum wheat genome could provide valuable information to decipher complex marker-traits associations and simplify the searching and discovery of genes underlying important agronomic traits [20].
In the present study, a high-density genetic linkage map based on iSelect 90K SNP markers was developed using the durum wheat Liberdur x Anco Marzio recombinant inbred line (RIL) population that was evaluated to detect QTL controlling grain yield components and grain size. Furthermore, the availability of a full reference durum wheat genome [21], allowed the physical projection of the identified QTL genetic intervals on the reference Svevo genome, as well as the detection of candidate genes involved in the phenotypic control of grain yield and grain size.
2. Results
2.1. Phenotypic Characterization
The two parental lines, Liberdur and Anco Marzio, and the RILs mapping population were evaluated for yield components and grain size traits (grain yield (YLD), plant height (PH), heading time (HT), thousand kernel weight (TKW), grain length (GL), grain width (GW) and grain area (AREA)) for three growing seasons (2016, 2017 and 2018) in southern Italy (Valenzano, Bari, Italy). Analysis of variance revealed highly significant differences among RILs for all traits in each year, while the combined analysis across years revealed significant effects of RILs, years and genotype × year interaction (Table 1 and Table S1). However, although the strong season effect, the genotype variability was higher than genotype × year component for all traits apart from YLD.
Mean values of Liberdur, Anco Marzio, and RILs in single season and across the three field trials are reported in Table 2. The two parents showed significant differences for HT, PH, AREA in all three seasons, and for TKW, GL and GW in two trials. In particular, Anco Marzio has generally larger grains compared to those of Liberdur.
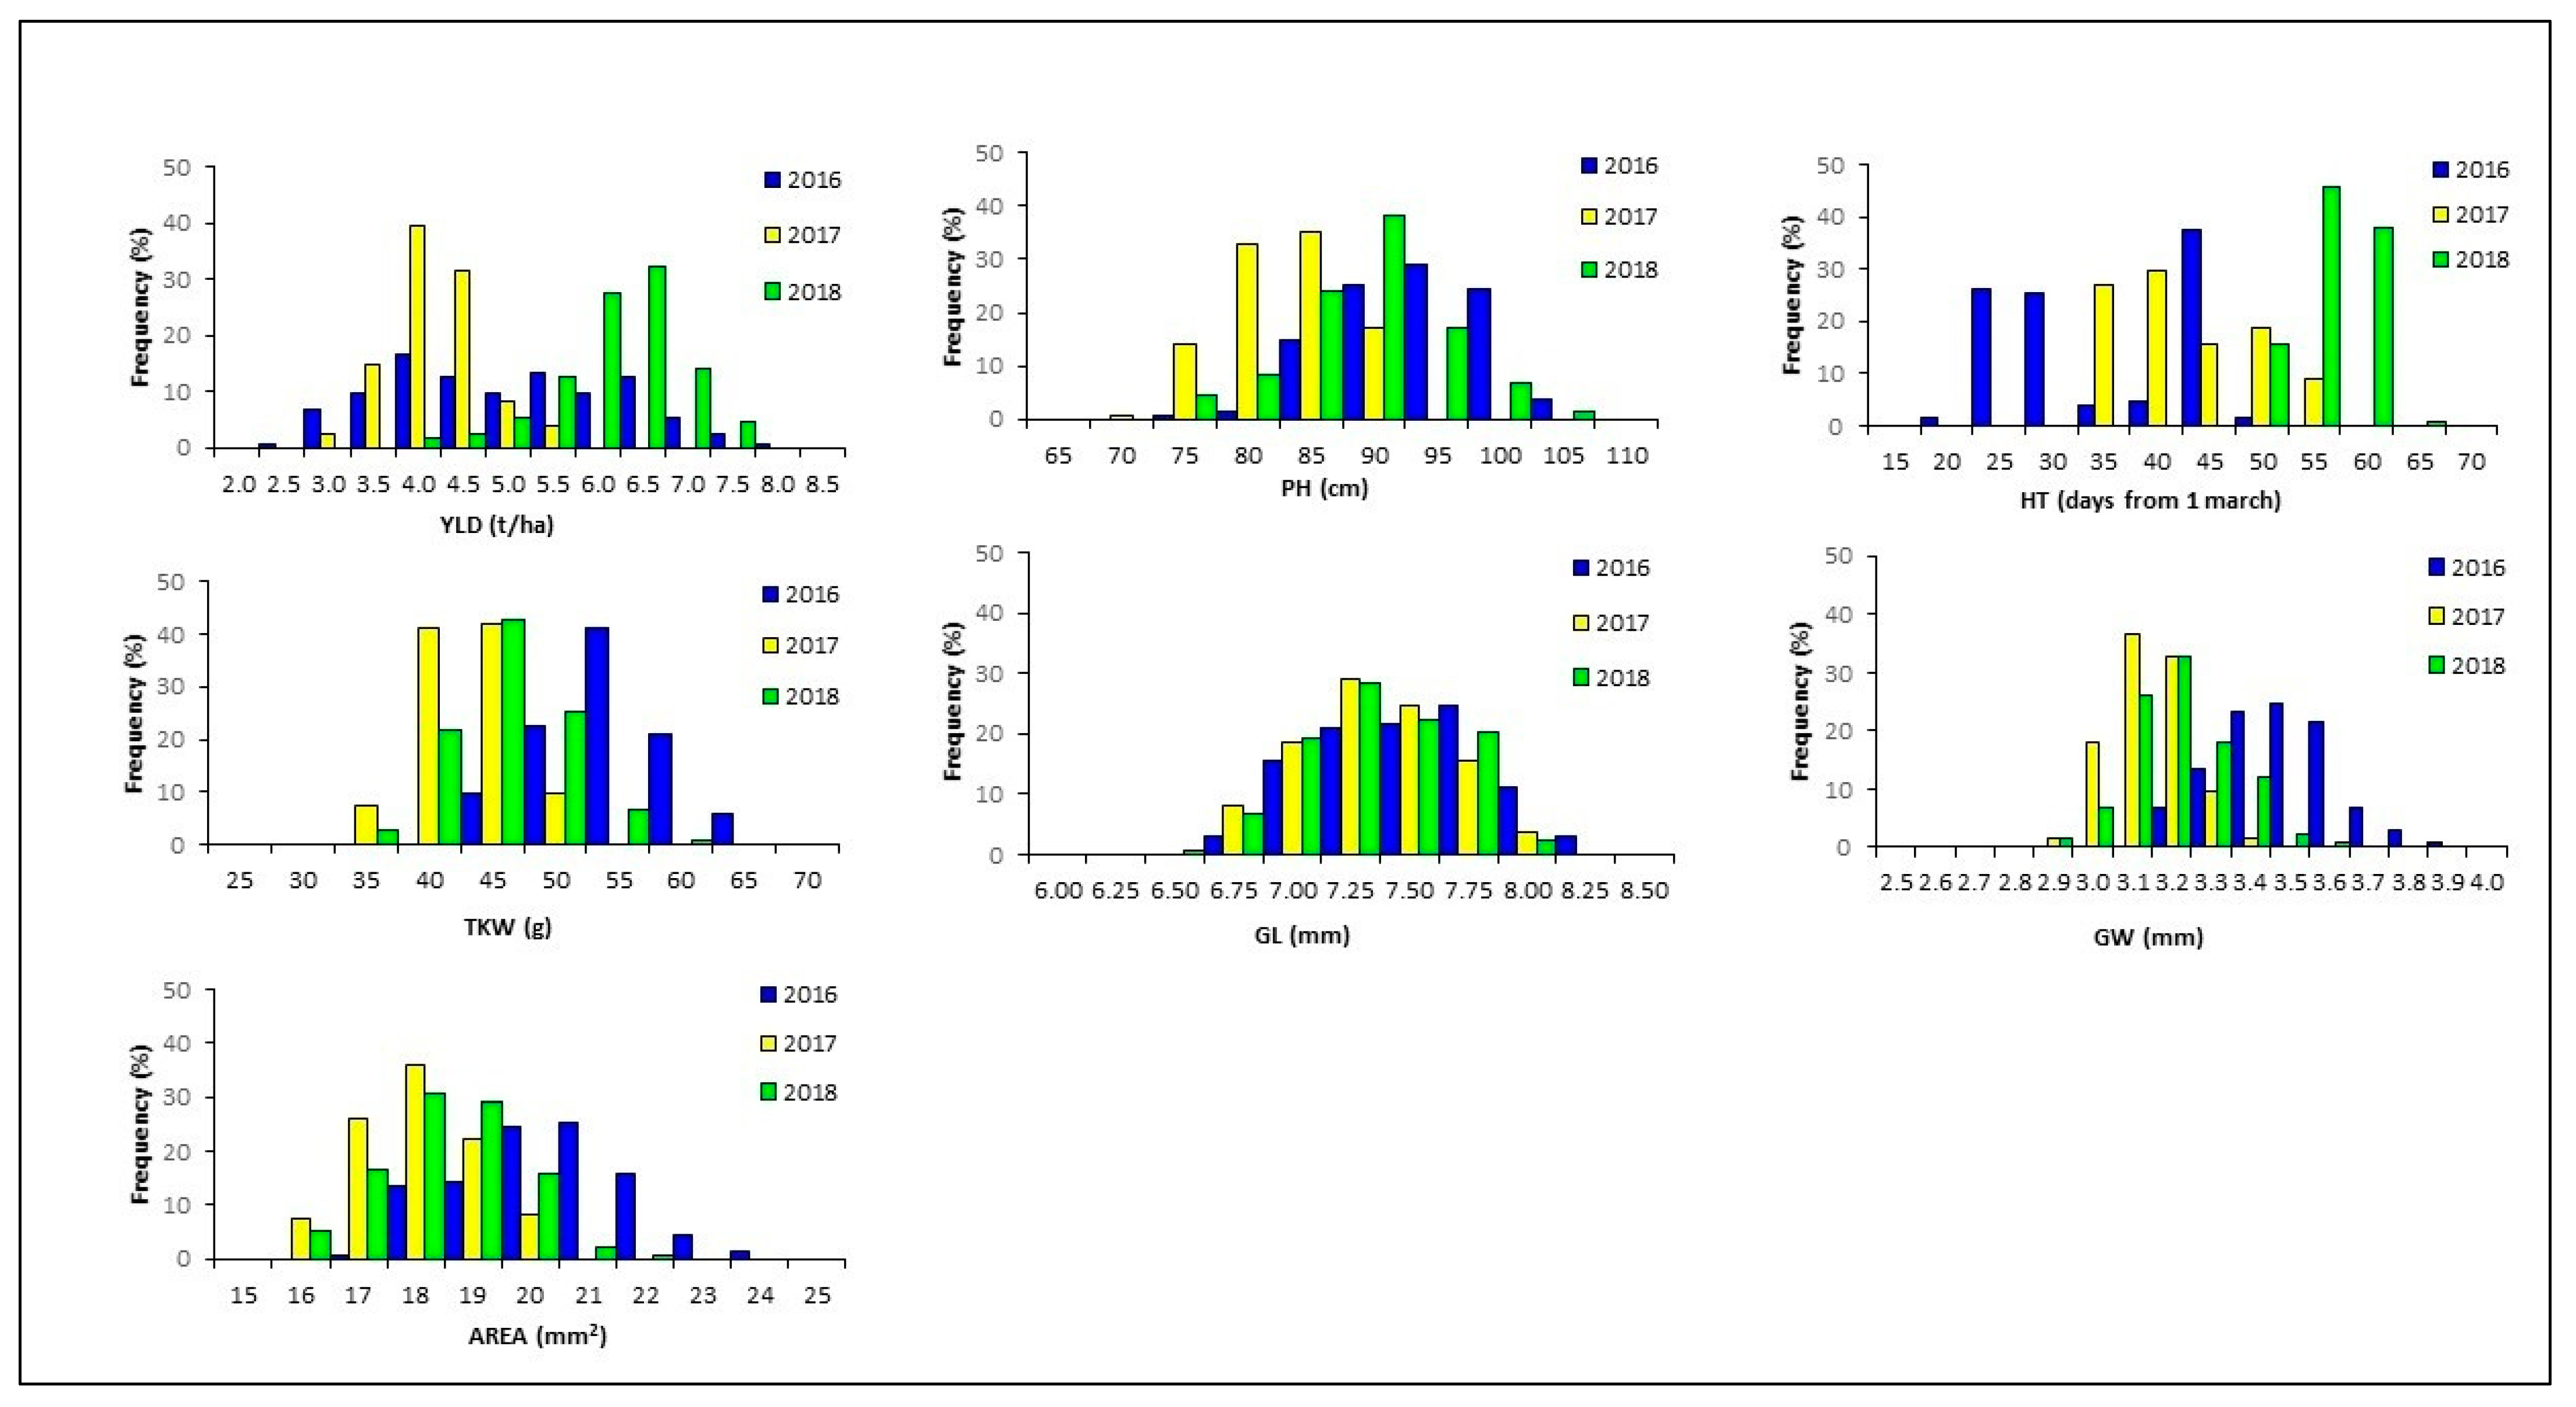
Analysis of the frequency distribution of traits in the RIL population was performed to have a preliminary idea of the genetic basis for each trait. A bimodal distribution was observed for HT indicating a single locus segregating in the RIL mapping population (Figure 1). The normal distribution obtained for YLD, PH, TKW and grain size parameters indicated that several loci, each contributing to a small proportion of the total variation, control the examined traits. High transgressive segregation was recorded for all traits suggesting the presence of superior alleles for grain yield components in both parental lines. Low values of broad sense heritability were estimated for YLD, confirming that the trait was strongly affected by environmental conditions and genotype × year interaction. High heritability values, exceeding 0.55, were found for HT, GL and AREA while TKW heritability values ranged from 0.45 to 0.72 (Table 2).
Phenotypic correlation among the traits in each year and across the three years are reported in Table 3. As expected, GL, GW and AREA were inherently correlated in each year and across years. TKW showed a high positive correlation with grain size traits.
2.2. Genetic Linkage Map
Out of 81,587 SNP markers assayed, 5,543 (6.8%) resulted as failed and 67,999 (83.3%) were monomorphic in the mapping population. The remaining 8045 (9.86%) markers were polymorphic; however, 2686 that had more than 10% missing data and 225 with distorted segregation (at p ≥ 0.05 value) were excluded from further analysis. Hence, 5134 (6.29%) markers were used for the genetic map construction. The 5134 loci were grouped in 21 linkage groups when using a LOD score 5. Linkage groups were assigned to the A and B genome chromosomes using the durum consensus map [22]. Eight chromosomes (1B, 2A, 3B, 4B, 6A, 6B, 7A and 7B) were assembled in a single linkage group (Table 4). Twenty-tree loci assembled in a linkage group of 4A chromosome resulted to be coincident in the same position and therefore discarded from the QTL analysis. A total of 2085 markers were localized on the A genome with a total length of 1145.3 cM, whereas 3049 were mapped on the B genome (total length 1062.7 cM). The entire map covered 2207.9 cM with an average chromosome length of 157.7 cM. The lengths of individual chromosomes varied from 73.3 cM (chromosome 5B) to 197.2 cM (chromosome 7A). The SNP markers were generally well distributed throughout the genome, although some chromosomes exhibited higher densities. The overall SNP density was 2.3 markers/cM, with a maximum of 3.8 for chromosome 1B and a minimum of 1.2 for chromosome 4A.
2.3. Quantitative Trait Loci (QTL) Detection
A total of 30 putative QTL were detected on 10 chromosomes in the durum wheat Liberdur x Anco Marzio mapping population (Table 5). Two QTL for YLD were detected on chromosomes 2A in 2016 and on chromosome 7B in 2018, each explaining 67.9% and 11.9% of the phenotypic variance, respectively. QYLD.mgb-2A, showed a positive additive effect provided by the parental line Liberdur (Figure 2), while QYLD.mgb-7B displayed the positive additive effect conferred by Anco Marzio. The higher GxA interaction variance than genotype effect prevented the QTL analysis for YLD across years.
Two QTL for HT were detected on chromosomes 2A and 7A, accounting for 2.4 to 85.7% of the explained phenotypic variance (R2). The −log10(P) scores of QHT.mgb-2A ranged from 44.6 to 69.7 and explained over 70% of the phenotypic variance in each year. This locus was stably detected in three years and across years, resulting as a major QTL, with additive effect contributed by Liberdur.
Four QTL were found to be significantly associated with PH on chromosomes 2B, 3A, 6B and 7A, accounting for 7.8% to 17.5% of the phenotypic variance. QPH.mgb-3A and QPH.mgb-6B were stably detected in two field trials and across years. The additive effects at QPH.mgb-3A and QPH.mgb-6B were provided by Liberdur and Anco Marzio, respectively.
Five TKW QTL were detected on chromosomes 1A, 2A, 3A and 6B, which accounted for 2.9% to 35.8% of the phenotypic variance. Of them, two stable QTL were mapped on chromosome 2A, delimited by genetic intervals 35.6–36.4 cM (QTKW.mgb-2A.1) and 87.5–89.6 cM (QTKW.mbg-2A.2), respectively. QTKW.mbg-2A.1 and QTKW.mbg-2A.2 additive effects were conferred by Anco Marzio and Liberdur, respectively.
Six QTL were found to be significantly associated with GL on 1B, 2A (2 QTL), 5A and 6B (2 QTL). Among them, QGL.mgb-2A.2 was declared in all years accounting for 39.1–53.8% of the phenotypic variance, thus resulting as a stable QTL. Additive effect at this locus derived from Liberdur. The QGL.mgb-1B and QGL.mgb-5A were declared in two years (both 2016 and 2018), while the remaining three QTL (QGL.mgb-2A.1, QGL.mgb-6B.1 and QGL.mgb-6B.2) were detected in a single year. For these five QTL, the alleles for longer grain were carried by the parental line Anco Marzio.
Six QTL were found to be significantly associated with GW on 1B, 2A (2 QTL), 4B, 6B and 7B chromosomes. The QGW.mgb-1B and QGW.mgb-2A.2 were stably detected and accounted for 8.4–16.3% of phenotypic variance. Both QTL showed the additive effect of Liberdur allele. The QGW.mgb-2A.1 explained a large phenotypic variation (42%), although it was detected in a single year and across years.
Five QTL were identified for AREA on 2A (2 QTL), 3A, 4B and 7B. The QAREA.mgb-2A.2 was found in all years and across years accounting for 25.8–47.8% of the phenotypic variance, resulting to be a stable QTL. QAREA.mgb-4B was found in two years (2017 and 2018) while the other three QTL (QAREA.mgb-2A.1, QAREA.mgb-3A and QAREA.mgb-7B) were identified in a single year. Liberdur carried the allele for larger area for all QTL, except for QAREA.mgb-2A.1.
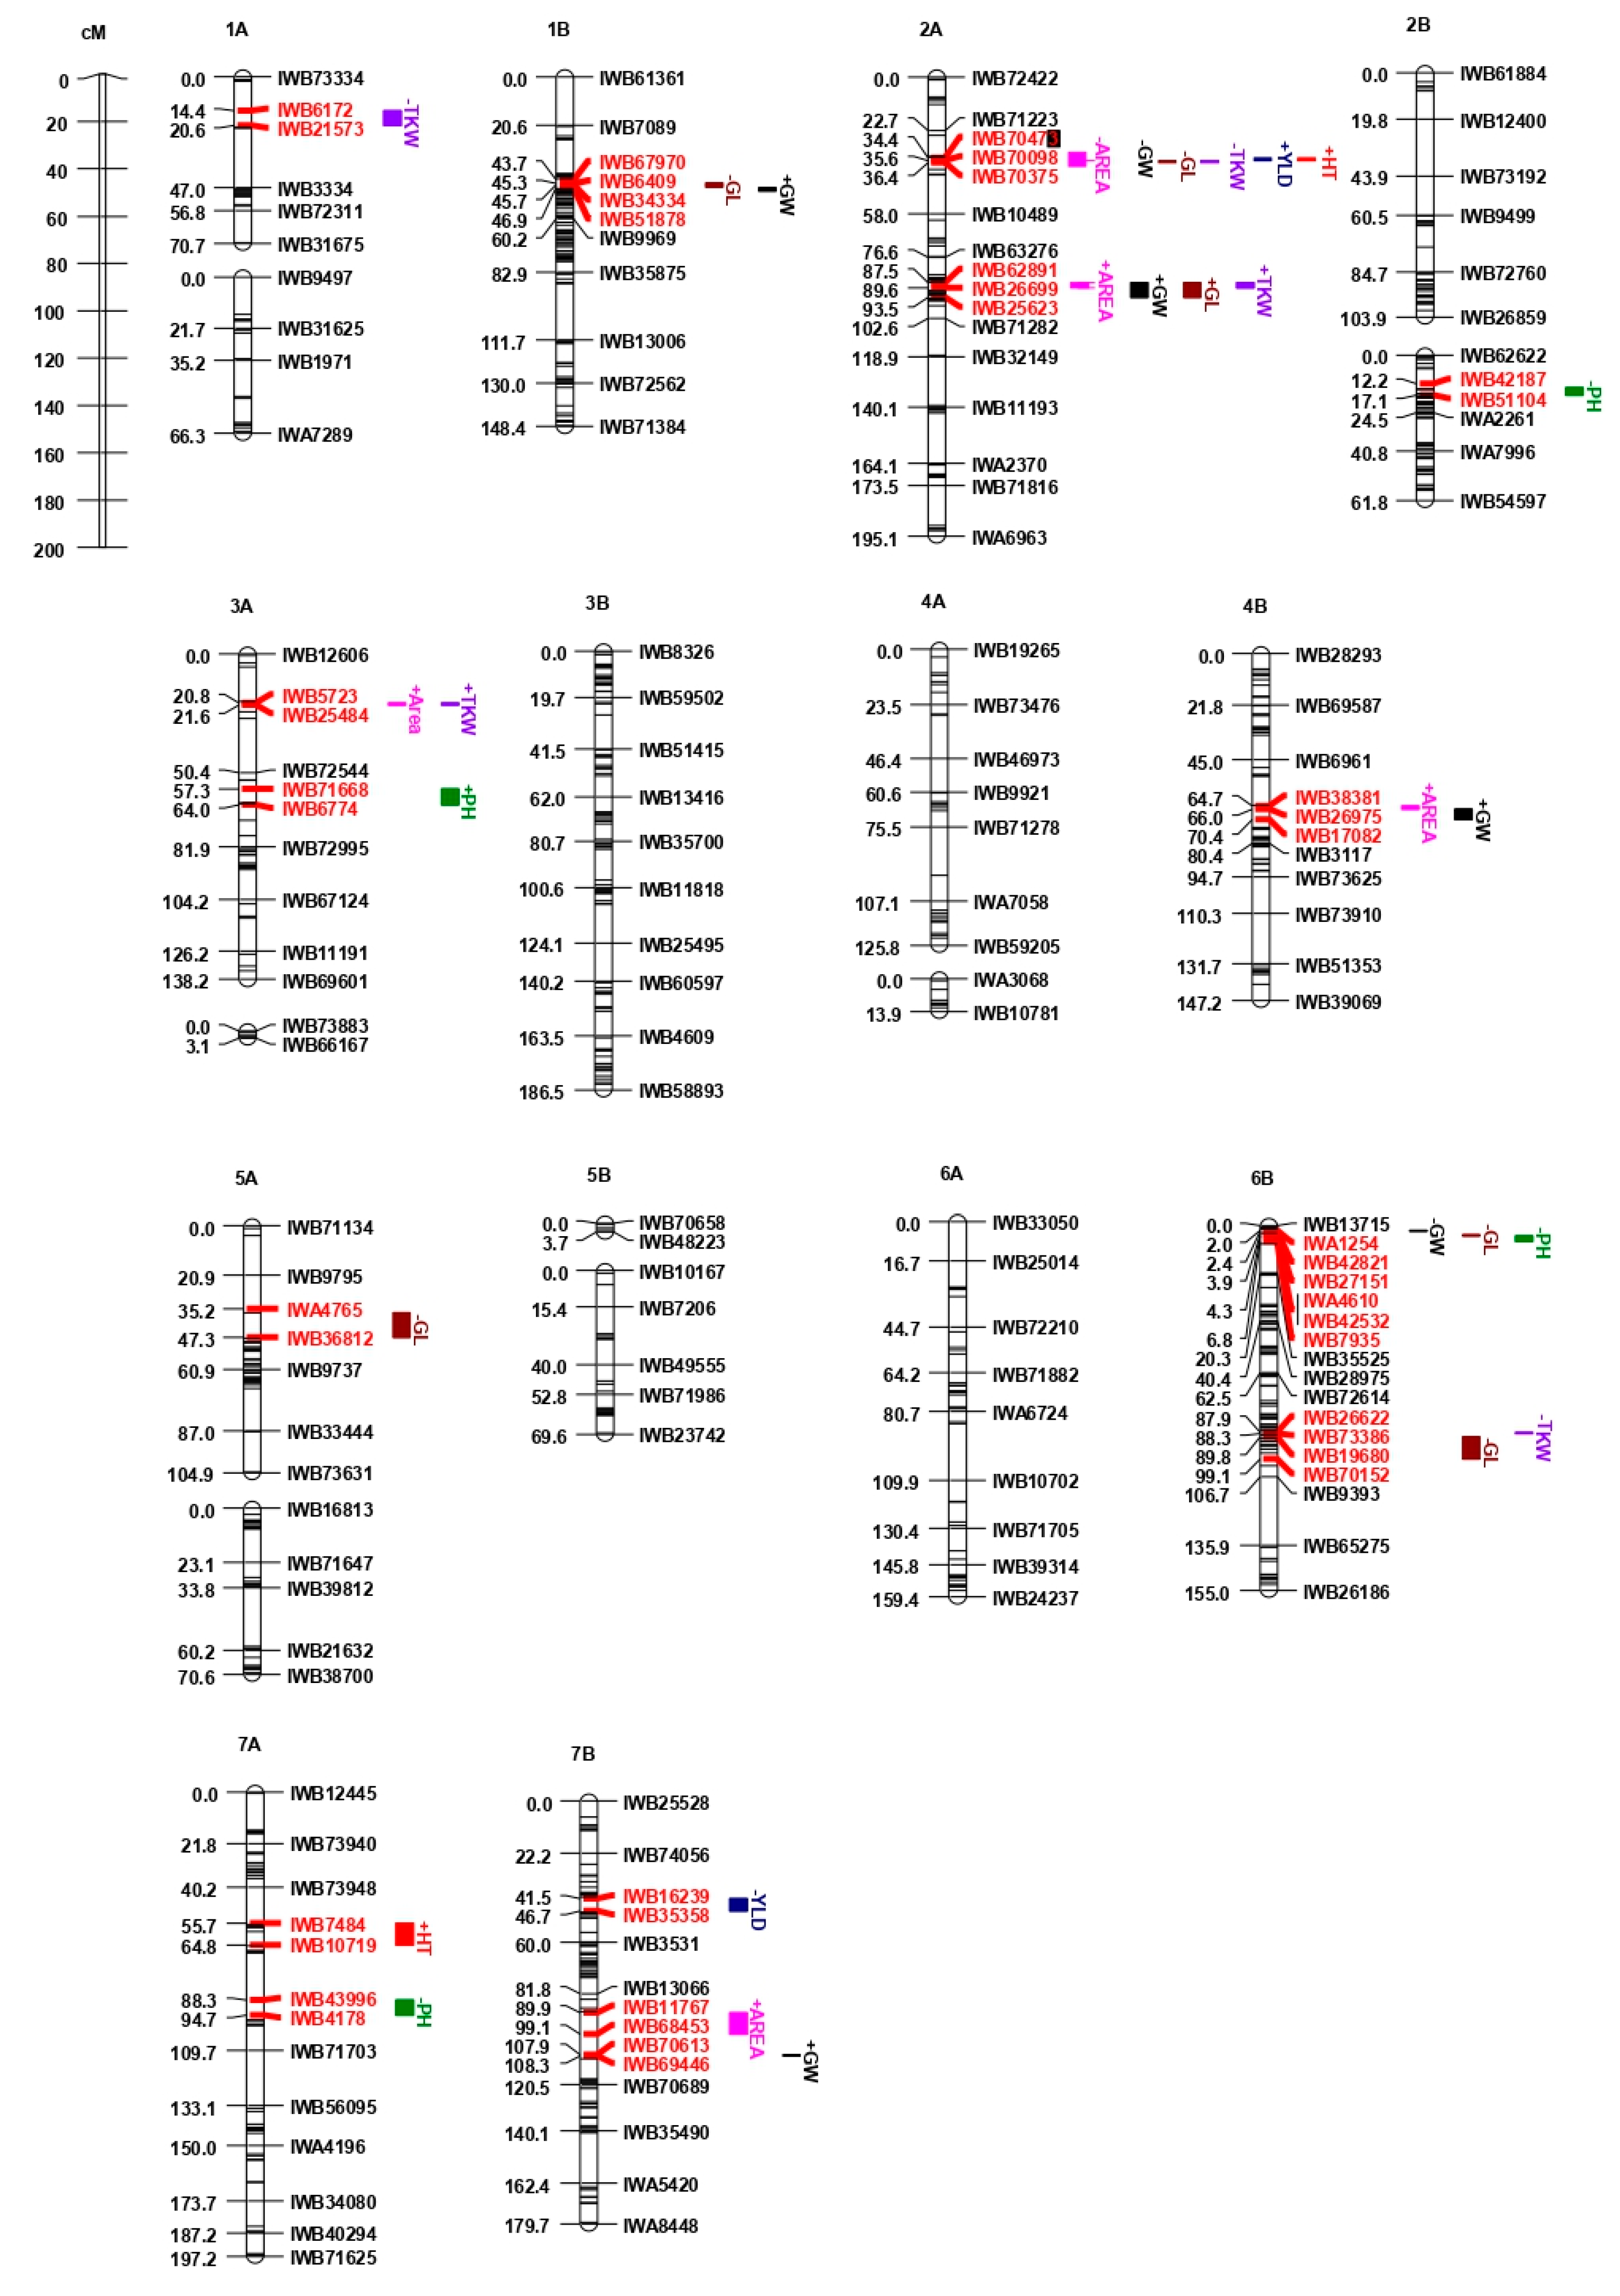
Out of the 30 detected QTL, 10 were co-located in two different regions of chromosome 2A (Figure 2). The first region included six QTL (QYLD.mgb-2A, QHT.mgb-2A, QTKW.mgb-2A.1, QGL.mgb-2A.1, QGW.mgb-2A.1 and QAREA.mgb-2A.1) in the genetic interval between 34.4 and 36.4 cM, while the second comprised four stable QTL (QTKW.mgb-2A.2, QGL.mgb-2A.2, QGW.mgb-2A.2 and QAREA.mgb-2A.2) in the interval between 87.5 and 89.6 cM. Interestingly, among the five QTL for TKW, two co-located together with QTL for GL, GW and AREA on chromosome 2A (both regions), and two co-located with QTL for GL or AREA on chromosomes 3A and 6B, respectively. Four out of 6 QTL for GL co-located with QTL for GW on chromosomes 1B, 2A (two QTL) and 6B. QTL for AREA always co-located with grain traits QTL (TKW, GL, and GW) on chromosomes 2A (2 QTL), 3A, 4B and 7B.
2.4. Candidate Genes Involved in Grain Yield-Related Traits
To identify candidate genes in the physical regions underlying the detected QTL, each region was projected on the recently released reference durum wheat genome of cv. Svevo [21]. Regions with two or more co-locating QTL were considered as a QTL cluster (Table 6), and the sequences of flanking markers of each of them were anchored to their physical position on the durum genome. A total of eight QTL clusters were detected with size ranging from 0.4 Mbp (on chromosome 3A, where two QTL for TKW and AREA co-located) to 57.1 Mbp (on chromosome 6B, with a QTL for TKW and a GL co-locating). In the QTL clusters, 1772 annotated high-confidence (HC) genes were found, ranging from 12 (on cluster 4) to 605 (on cluster 6). Among them, only those which annotations indicated a possible involvement in seed development were retrieved [5,23]. Table 6 reports the most likely candidate genes found in each QTL cluster, based on their potential involvement in grain yield.
Among the several candidate genes localized within the QTL cluster regions, four genes were particularly noteworthy, as previously reported to be directly involved in grain yield: TRITD2Av1G019250, encoding a Pseudo-response regulator (Ppd-A1) [24] in the 2A cluster that included QHT.mgb-2A (Table 5); TRITD4Bv1G171270, encoding a Big grain 1 protein [25] in the 4B cluster, and two candidate genes encoding an acid β-fructofuranosidase (TRITD6Bv1G005370 and TRITD6Bv1G005450), paralogues of the cell wall invertase gene [26], both in the 6B cluster containing QTL for GL, GW and PH.
Specific protein classes were frequently observed, such as proteins involved in ubiquitination processes, including E3 ubiquitin-protein ligase and RING U-box superfamily proteins (identified in six QTL clusters), cytochrome P450 (identified in four QTL clusters) and thioredoxins (identified in two QTL clusters), as well as serine carboxypeptidase proteins (identified in two QTL clusters).
Interestingly, in all clusters in which a QTL for AREA was detected, genes involved in auxin metabolism were found, strengthening their chances of being considered candidates for this trait: TRITD1Bv1G118820, TRITD2Av1G189400, TRITD7Bv1G173200, encoding protein involved in auxin response; TRITD4Bv1G175480, involved in auxin signaling, and TRITD3Av1G012070, a paralog gene of the YUC family encoding a flavin-containing monooxygenase directly involved in auxin biosynthesis. Similarly, except for one cluster on the 2A chromosome, in all QTL clusters in which the QTL for GW were co-located, genes encoding cytochrome P450 monooxygenases (CYPs) were found, suggesting this family as candidate for GW. The CYPs are a superfamily involved in several plant metabolism including biosynthesis of hormones, cell wall components, and defence compounds [27]. Recently, the TaCYP78A3 and TaCYP72A genes were found to affect seed size showing the role of these genes in seed development [28,29].
3. Discussion
Grain yield is a typical quantitative trait controlled by a complex genetic system and strongly influenced by both environmental factors and agronomic management. Grain yield reflects the combination of kernel weight and grain number per area. Besides being one of the key components of grain yield, thousand kernel weight is often used as standard parameter for flour-milling yield and marketing standard. Thousand kernel weight is mainly and tightly underpinned by grain morphology including grain length, grain width and grain area. Grain yield can be maximized by growing varieties whose heading time allows the crop to avoid stresses during the grain-filling phase [17]. Indeed, heading time is a critical stage delimiting the duration of spike formation and marking the transition into the grain-filling period, during which grain per spike and grain weight are both defined. In the last century, grain yield improvement was obtained through increased harvest index and straw strength with the introduction of major genes conferring reduced plant height [1,5,30].
In this study, YLD, TKW, morphology grain traits (GL, GW and AREA), HT and PH were investigated by using an RILs mapping population consisting of 133 lines derived by crossing the elite durum wheat cultivars Liberdur and Anco Marzio. Plant materials were evaluated in field trials for three years.
A total of 30 QTL were identified and localized on 10 out of 14 durum wheat chromosomes. Among them, nine stable QTL for TKW (2 QTL), GL, GW (2 QTL), AREA, HT and PH (2 QTL), distributed on 1B, 2A, 3A and 6B chromosomes, detected at −log10(P) > 3.0 in at least two years and across years (Table 5). Interestingly, 6 out of 9 stable QTL were co-located in QTL clusters on chromosome 2A, while the other three were detected on 1B, 3A and 6B chromosomes (Figure 2). Furthermore, 4 out of 8 QTL clusters were mapped on 2A and 6B chromosomes, and the remaining ones on 1B, 3A, 4B and 7B.
The first QTL cluster on chromosome 2A, delimited by genetic interval 35.6–36.4 cM, included two stable QTL (QHT.mgb-2A and QTKW.mgb-2A.1) along with the QTL for YLD, GL, GW and AREA detected in a single year (2016). In this region, QHT.mgb-2A can be considered a major QTL involved in the phenotypic control of HT as it was declared in each field trial with a −log10(P) ranging from 44.0 to 69.7, and a R2 from 74.3 to 85.7, respectively. The candidate genes analysis detected a pseudo-response regulator protein (TRITD2Av1G019250), corresponding to a photoperiod sensitivity gene (Ppd-A1), within the physical position of this QTL. Wilhelm et al. [24] found two large deletions within the Ppd-A1 gene in durum wheat (1027 and 1117 bp deletion designated as alleles ‘GS-100’ and ‘GS-105’, respectively), which remove a common region from the wild-type sequence. Our results suggested that the parental lines Liberdur and Anco Marzio could be different for the alleles at Ppd-A1 locus. Similar conclusions were reported by Maccaferri et al. [31], who identified a QTL reducing heading date associated with Ppd-A1 in a RILs population derived from the cross ‘Kofa’ (‘GS-100’ allele) × ‘Svevo’ (‘GS-105’ allele), thus indicating that these alleles decrease photoperiod sensitivity at different degrees. The QTL cluster with the Ppd-A1 gene included the QTL for YLD and grain size detected in 2016. The first half of April 2016 was characterized by a severe temperature decrease compromising grain filling of early spiked RILs while later ones escaped cold damage resulting in more grain yield but with small grain. In fact, HT was significantly positively correlated with YLD (r = 0.85) and negatively with grain size traits in 2016 (r values ranging from −0.70 to −0.28). In addition, the QTL for HT (QHT.mgb-2A) and YLD (QYLD.mgb-2A) were associated to significant QTL with opposite effects on TKW (QTkw.mgb-2A.1, QTKW.mgb-2A.1) and grain size (QGL.mbg-2A.1, QGW.mgb-2A.1, QAREA.mgb-2A.1). These results suggested that Ppd-A1 had negative pleiotropic effects on TKW and grain size, but positively affected others yield components such as grain number per unit area [32].
The second QTL cluster on chromosome 2A included four stable QTL (QTKW.mgb-2A.2, QGL.mgb-2A.2, QGW.mgb-2A.2, QAREA.mgb-2A.2) declared in three years and across years. The positive additive effect was provided by the parental line Liberdur for all four QTL. As shown by correlation data, TKW was always positively and significantly correlated to GL, GW and AREA. These results suggested that TKW improvement could be due to the grain size increase. A QTL for TKW was previously detected in this region by a genome-wide association study on a tetraploid wheat collection [33], thus validating the presence of a metaQTL regardless of the identification approach. Six putative candidate genes were included in this QTL cluster and, among them, a serine carboxypeptidase protein. Previous studies have shown that serine carboxypeptidase enzymes are involved in several biological processes, including development of plant organs [34,35], cell division [36] and cell elongation [37]. Indeed, by promoting cell division, these enzymes determine larger grain size due to an increased cell number [36]. Our result was not unexpected considering that other studies on dissecting grain size also detected a strong relation with serine carboxypeptidase proteins [38,39].
A QTL cluster on 6B chromosome included the stable QTL QPH.mgb-6B, which was detected in the same region where QTL for PH were already reported by Canè et al. [40] and Soriano et al. [41]. Two additional QTL co-localized in this cluster, QGL.mgb-6B.1 and QGW.mgb-6B, where Canè et al. [40] detected a QTL for test weight, a trait which is known to be affected by grain size [42]. Therefore, it could be supposed that high values of test weight might be determined by increasing GL and GW. The co-localization of QTL affecting different traits such as PH, GL and GW, implies closely linked genes involved in different biological processes related to yield [43]. In this QTL cluster, two candidate genes (TRITD6Bv1G005370 and TRITD6Bv1G005450) encoding the acid β-fructofuranosidase enzyme were found. These two genes have 22 paralogues in the B genome of wheat, which probably diverged from a common ancestral gene and evolved by duplication. More interesting is the fact that these genes are paralogues of cell wall invertase genes. β-fructofuranosidase (EC 3.2.1.26) is indeed commonly known as invertase in plants. These genes are involved in the carbohydrate metabolic process and have a common molecular function, as invertase/fructofuranosidase belong to the glycoside hydrolase family 32 [26]. Ma et al. [14] reported an association between a cell wall invertase gene (TaCwi-A1) and TKW, useful to improve grain yield. Li et al. [44] showed that expression of the cell wall invertase genes significantly improved shoot growth, grain yield and starch content in transgenic maize plants, and specifically increased both grain size and grain number.
QTKW.mgb-6B and QGL.mgb-6B.2 were co-located on the second QTL cluster on 6B, suggesting that TKW improvement could be due to GL increase. In the same region, Elouafi and Nachit [45] reported a QTL for TKW using a linkage mapping population. Notably, the positive additive effect of the five QTL co-locating in the QTL clusters on 6B chromosome, was provided by the parental line Anco Marzio, indicating that this durum cultivar has potentially useful alleles for grain yield improvement.
Two QTL for grain size (QGW.mgb-4B, QAREA.mgb-4B) were found to co-localize on 4B chromosome. No QTL for grain size has been previously mapped in this region, indicating that it could be considered a new QTL cluster associated to grain size. The positive additive effect was provided by the parental line Liberdur. Among the candidate genes identified within the 4B cluster, one was particularly noticeable, a Big grain 1 protein (TRITD4Bv1G171270), which has been annotated as a positive regulator of auxin response and transport, as well as a regulator of grain size. The rice orthologue gene was characterized well by Liu et al. [25], who showed how its activation significantly improved grain size. This protein, localized in the plasma membrane, is induced by auxin treatment and its expression in vascular tissues could improve plant productivity, the most significant change being observed for increased grain size and grain weight.
The QTL cluster located on 1B was reported for the first time in this study, as no previous QTL for GW and GL have been reported in this region. Nevertheless, the positive additive effect of the GW QTL negatively affected the GL, suggesting that linked and/or pleiotropic genes for grain size map in this region.
QTL clusters on 3A and 7B chromosomes included a QTL for AREA, which co-localized with a TKW and a GW QTL, respectively, confirming the positive and highly significant correlation among TKW and grain size.
Searching for candidate genes highlighted two more interesting regions on 3A and 5A chromosomes, coincident with a PH QTL and a GL QTL, respectively (Figure 2). Indeed, the candidate gene screening on 3A chromosome identified a serine carboxypepdidase, TRITD3Av1G187020, and a NADH-dependent glutamate synthase (NADH-GOGAT), TRITD3Av1G177110, confirming their involvement in grain yield [38,39,46]. Additionally, an interesting gene was found in the GL QTL region on 5A chromosome, TRITD5Av1G037950, encoding for an expansin protein, a paralogue of TRITD2Av1G019110 gene, reported in the first 2A QTL cluster, which belong to a gene family previously found related to both grain size and yield [47,48].
4. Materials and Methods
4.1. Genetic Materials and Phenotypic Analysis
The mapping population used in this study consists of 133 recombinant inbred lines (RILs) developed from a cross between two durum wheat cultivars, Liberdur and Anco Marzio, differing for yield-related traits, by advancing random individual F2 plants to the F7 generation by the single seed descent procedure. The RILs population was evaluated in open-field conditions over three consecutive growing seasons (2016, 2017, 2018) at Valenzano (Bari, Italy). The experimental design was a complete randomized block design with three replicates with each experimental unit consisting of a 5 m2 plot. Sowing density was always 350 seeds m2. The field experiments were supplied with 45 kg/ha N and 115 Kg/ha P2O5 in pre-sowing and 85 kg/ha N in top dressing each year.
Heading time (HT) was recorded in each field trial as the number of days from 1 March to 50% ear-emergence, corresponding to stage 55 on the Zadoks et al. [49] scale. Plant height (PH) was measured at complete maturity of plants, and grain yield (YLD) per plot was measured after harvesting and expressed in t/ha. The morphometric grain related traits were determined by digital imaging analysis. For each replication of each line, 10 g of kernels were scanned using high-resolution scanner-based image analysis. The images were processed using the Image-Pro Plus 7.0 software (Media Cybernetics, USA). Grain length (GL), grain width (GW), grain area (AREA), and kernels number were measured. The kernels number was used to calculate the thousand kernel weight (TKW).
4.2. Single Nucleotide Polymorphism (SNP) Genotyping and Linkage Map Construction
Genomic DNA from each RIL and parental line (Liberdur and Anco Marzio) was diluted to 50 ng/μL and further analyzed with the wheat 90K iSelect array [19]. Genotyping was performed by TraitGenetics GmbH [50] following the manufacturer’s recommendations as described in Akhunov et al. [51]. The genotyping assays were carried out using the Illumina iScan reader and performed using GenomeStudio software version 2011.1 (Illumina, San Diego, CA, USA).
Chi-squared tests were used to determine the goodness-of-fit at p > 0.001 of segregation ratios to expected 1:1 ratio for each SNP. All markers with more than 10% missing data or segregating as presence/absence in the mapping population were excluded from further analysis. Linkage analysis between markers and determination of the linear order of loci was performed by QTL IciMapping 4.1 using the BIN and MAP functions [52]. Grouping was performed using the independence LOD parameter, with groups showing a LOD 5. The Kosambi mapping function was used to calculate map distances. SNPs data from the durum consensus map [22] were used as anchor loci and for assigning linkage groups to specific chromosomes. Linkage groups were named according to the wheat chromosome nomenclature followed by a number when two or more linkage groups were found for one chromosome.
4.3. Statistical Analysis and QTL Detection
Analysis of variance (ANOVA) was performed to test the significance of differences among the RILs and replications, using the MSTAT-C 2.0 software [53]. The effects of replicates and genotypes were considered in the model in each year. Combined analysis across three years was carried out for all grain yield components and grain size traits.
Genetic variance (σ2G), environmental variance (σ2Ɛ), and variance due to genotypic x year interaction (σ2GY) were obtained by using the combined analysis of variance. Broad-sense heritability (h2B) was estimated by the ratio σ2G /σ2P, where σ2P, is phenotypic variance (σ2P = σ2G + σ2GY + σ2Ɛ) as reported by Singh and Ceccarelli [54]. Pearson phenotypic correlation coefficients (r) were calculated for all the traits across the years [55]. Mean of parental lines and RIL population, range, coefficient of variation (C.V.), were calculated for each field trials and across years.
The phenotypic mean values of each field trial (2016, 2017 and 2018) and the mean across trials were used for QTL analysis. An inclusive composite interval mapping (ICIM) method was employed for QTL mapping using IciMapping 4.1 software [52]. A threshold P value of 0.001 (−log10(P) ≥ 3.0) was used for QTL detection, P value frequently used for many agronomical important quantitative traits [56,57,58]; suggestive QTL were considered at the sub-threshold 2.5 < −log10(P) < 3.0 when declared at least in one year. A QTL was considered stable when detected at −log10(P) ≥ 3.0 in at least two years [41,58,59,60]. The phenotypic variation (PVE = R2) and additive effect were estimated for each detected QTL. Positive or negative additive effect indicates the increasing or decreasing effect of the parental line Liberdur. QTL were named according to the rules of International Rules of Genetic Nomenclature [61]. The QTL name combined the traits evaluated (‘YLD’, ‘PH’, ‘HT’, ‘TKW’, ‘GL’, ‘GW’, and ‘AREA’) and the Research Department (Genetics and Plant Breeding Section, University of Bari, ‘mgb’) that carried out the experiments. Graphical representation of linkage groups and QTL was carried out using MapChart 2.2 software [62].
4.4. Statistical Analysis and QTL Detection
QTL intervals detected on genetic map were physically mapped on the durum wheat reference genome Svevo [63]. Left and right flanking markers of each confidence interval were first searched in the durum consensus map [21], and then projected on Svevo genome. When the marker on the RIL mapping population was not mapped on the consensus map, the closest one was chosen.
The projected flanking markers were searched and positioned on the durum reference genome, and the annotated genes within each interval were screened based on their confidence and functional annotation. Candidate genes potentially involved in yield related traits were further investigated by analyzing the relation of synteny with other Triticeae as well as an orthologous search in other grass species [64].
5. Conclusions
This study showed how yield improvement could be pursued considering yield components (TKW, GL, GW and AREA), as well as phenology-related traits (PH and HT). These yield sub-components showed higher inheritance than grain yield, allowing a more accurate and powerful stable QTL detection. Physical anchoring of these QTL on the reference durum wheat genome cv. Svevo, enabled the identification of candidate genes affecting the genetic grain yield network. The availability of SNP markers within candidate genes sequences might represent a breeding strategy based on functional markers, determining a more efficient grain yield genetic gain.
Supplementary Materials
The following are available online at https://0-www-mdpi-com.brum.beds.ac.uk/2223-7747/10/2/312/s1, Table S1: Analysis of variance of grain yield (YLD), plant height (PH), heading time (HT), thousand kernel weight (TKW), grain length (GL), grain width (GW), grain area (AREA) in the Liberdur x Anco Marzio RILs mapping population evaluated at Valenzano (Bari, Italy) for three years.
Author Contributions
Conceptualization, G.M. and A.B.; methodology, G.M. and A.B.; validation, G.M. and A.B.; formal analysis, G.M., A.B. and D.N.; investigation, G.M., D.N. and M.A.S.; data curation, G.M. and A.B.; writing—original draft preparation, G.M., A.B., D.N., R.S.; writing—review and editing, G.M.; visualization, G.M.; supervision, G.M. and A.B.; project administration, A.B. and R.S.; funding acquisition, R.S. All authors have read and agreed to the published version of the manuscript.
Funding
This research was funded by ATENEO project 2014: Advanced genetic methods to study biotic and abiotic stresses in durum wheat.
Data Availability Statement
Data is contained within the article or supplementary material.
Acknowledgments
Thanks are given to Vito De Santis for technical assistance in field trials.
Conflicts of Interest
The authors declare no conflict of interest.
References
- del Pozo, A.; Matus, I.; Ruf, K.; Castillo, D.; Méndez-Espinoza, A.M.; Serret, M.D. Genetic advance of durum wheat under high yielding conditions: The case of Chile. Agronomy 2019, 9, 454. [Google Scholar] [CrossRef] [Green Version]
- FAO. The Future of Food and Agriculture—Trends and Challenges. 2017. Available online: http://www.fao.org/3/a-i6583e.pdf (accessed on 10 December 2020).
- Ray, D.K.; Mueller, N.D.; West, P.C.; Foley, J.A. Yield trends are insufficient to double global crop production by 2050. PLoS ONE 2013, 8, e66428. [Google Scholar] [CrossRef] [Green Version]
- Gegas, V.C.; Nazari, A.; Griffiths, S.; Simmonds, J.; Fish, L.; Orford, S.; Sayers, L.; Doonan, J.H.; Snape, J.W. A genetic framework for grain size and shape variation in wheat. Plant Cell 2010, 22, 1046–1059. [Google Scholar] [CrossRef] [Green Version]
- Nadolska-Orczyk, A.; Rajchel, I.K.; Orczyk, W.; Gasparis, S. Major genes determining yield-related traits in wheat and barley. Theor. Appl. Genet. 2017, 130, 1081–1098. [Google Scholar] [CrossRef] [Green Version]
- Zuo, J.R.; Li, J.Y. Molecular genetic dissection of quantitative trait loci regulating rice grain size. Annu. Rev. Genet. 2014, 48, 99–118. [Google Scholar] [CrossRef]
- Song, X.J.; Huang, W.; Shi, M.; Zhu, M.Z.; Lin, H.X. A QTL for rice grain width and weight encodes a previously unknown RINGtype E3 ubiquitin ligase. Nat. Genet. 2007, 39, 623–630. [Google Scholar] [CrossRef] [PubMed]
- Su, Z.; Hao, C.; Wang, L.; Dong, Y.; Zhang, X. Identification and development of a functional marker of TaGW2 associated with grain weight in bread wheat (Triticum aestivum L.). Theor. Appl. Genet. 2011, 122, 211–223. [Google Scholar] [CrossRef]
- Simmonds, J.; Scott, P.; Brinton, J.; Mestre, T.C.; Bush, M.; Del Blanco, A.; Dubcovsky, J.; Uauy, C. A splice acceptor site mutation in TaGW2-A1 increases thousand grain weight in tetraploid and hexaploid wheat through wider and longer grains. Theor. Appl. Genet. 2016, 129, 1099–1112. [Google Scholar] [CrossRef] [Green Version]
- Wang, S.; Wu, K.; Yuan, Q.; Liu, X.; Liu, Z.; Lin, X.; Zeng, R.; Zhu, H.; Dong, G.; Qian, Q.; et al. Control of grain size, shape and quality by OsSPL16 in rice. Nat. Genet. 2012, 44, 950–954. [Google Scholar] [CrossRef]
- Zhang, Y.; Liu, J.; Xia, X.; He, Z. TaGS-D1, an ortholog of rice OsGS3, is associated with grain weight and grain length in common wheat. Mol. Breed. 2014, 34, 1097–1107. [Google Scholar] [CrossRef]
- Hou, J.; Jiang, Q.; Hao, C.; Wang, Y.; Zhang, H.; Zhang, X. Global selection on sucrose synthase haplotypes during a century of wheat breeding. Plant Physiol. 2014, 164, 1918–1929. [Google Scholar] [CrossRef] [Green Version]
- Volpicella, M.; Fanizza, I.; Leoni, C.; Gadaleta, A.; Nigro, D.; Gattulli, B.; Mangini, G.; Blanco, A.; Ceci, L.R. Identification and characterization of the sucrose synthase 2 gene (Sus2) in durum wheat. Front. Plant Sci. 2016, 7, 266. [Google Scholar] [CrossRef] [Green Version]
- Ma, D.; Yan, J.; He, Z.; Wu, L.; Xia, X. Characterization of a cell wall invertase gene TaCwi-A1 on common wheat chromosome 2A and development of functional markers. Mol. Breed. 2012, 29, 43–52. [Google Scholar] [CrossRef]
- Würschum, T.; Langer, S.M.; Longin, C.F.H.; Tucker, M.R.; Leiser, W.L. A three-component system incorporating Ppd-D1, copy number variation at Ppd-B1, and numerous small-effect QTL facilitates adaptation of heading time in winter wheat cultivars of worldwide origin. Plant Cell Environ. 2018, 41, 1407–1416. [Google Scholar] [CrossRef]
- Foulkes, M.; Sylvester-Bradley, R.; Worland, A.; Snape, J. Effects of a photoperiod response gene Ppd-D1 on yield potential and drought resistance in UK winter wheat. Euphytica 2004, 135, 63–73. [Google Scholar] [CrossRef]
- Kamran, A.; Iqbal, M.; Spaner, D. Flowering time in wheat (Triticum aestivum L.): A key factor for global adaptability. Euphytica 2014, 197, 1–26. [Google Scholar] [CrossRef]
- Worland, A.J. The influence of flowering time genes on environmental adaptability in European wheats. Euphytica 1996, 89, 49–57. [Google Scholar] [CrossRef]
- Wang, S.; Wong, D.; Forrest, K.; Allen, A.; Chao, S.; Huang, B.E.; Maccaferri, M.; Salvi, S.; Milner, S.G.; Cattivelli, L.; et al. Characterization of polyploid wheat genomic diversity using a high-density 90,000 single nucleotide polymorphism array. Plant Biotechnol. J. 2014, 12, 787–796. [Google Scholar] [CrossRef] [PubMed] [Green Version]
- Clavijo, B.J.; Venturini, L.; Schudoma, C.; Accinelli, G.G.; Kaithakottil, G.; Wright, J.; Borrill, P.; Kettleborough, G.; Heavens, D.; Chapman, H.; et al. An improved assembly and annotation of the allohexaploid wheat genome identifies complete families of agronomic genes and provides genomic evidence for chromosomal translocations. Genome Res. 2017, 27, 885–896. [Google Scholar] [CrossRef] [PubMed] [Green Version]
- Maccaferri, M.; Harris, N.S.; Twardziok, S.O.; Pasam, R.K.; Gundlach, H.; Spannagl, M.; Ormanbekova, D.; Lux, T.; Prade, V.M.; Milner, S.G.; et al. Durum wheat genome reveals past domestication signatures and future improvement targets. Nat. Genet. 2019, 51, 885–895. [Google Scholar] [CrossRef] [Green Version]
- Maccaferri, M.; Ricci, A.; Salvi, S.; Milner, S.G.; Noli, E.; Martelli, P.L.; Casadio, R.; Akhunov, E.; Scalabrin, S.; Vendramin, V. A high-density, SNP-based consensus map of tetraploid wheat as a bridge to integrate durum and bread wheat genomics and breeding. Plant Biotechnol. J. 2015, 13, 648–663. [Google Scholar] [CrossRef] [PubMed]
- Li, N.; Xu, R.; Li, Y. Molecular networks of seed size control in plants. Annu. Rev. Plant Biol. 2019, 70, 435–463. [Google Scholar] [CrossRef]
- Wilhelm, E.P.; Turner, A.S.; Laurie, D.A. Photoperiod insensitive Ppd-A1a mutations in tetraploid wheat (Triticum durum Desf.). Theor. Appl. Genet. 2009, 118, 285–294. [Google Scholar] [CrossRef]
- Liu, L.; Tong, H.; Xiao, Y.; Che, R.; Xu, F.; Hu, B.; Liang, C.; Chu, J.; Li, J.; Chu, C. Activation of big grain 1 significantly improves grain size by regulating auxin transport in rice. Proc. Natl. Acad. Sci. USA 2015, 112, 11102–11107. [Google Scholar] [CrossRef] [Green Version]
- Roitsch, T.; González, M.C. Function and regulation of plant invertases: Sweet sensations. Trends Plant Sci. 2004, 9, 606–613. [Google Scholar] [CrossRef]
- Xu, J.; Wang, X.; Guo, W. The cytochrome P450 superfamily: Key players in plant development and defense. J. Integr. Agric. 2015, 14, 1673–1686. [Google Scholar] [CrossRef] [Green Version]
- Ma, M.; Wang, Q.; Li, Z.; Cheng, H.; Li, Z.; Liu, X.; Song, W.; Appels, R.; Zhao, H. Expression of TaCYP78A3, a gene encoding cytochrome P450 CYP78A3 protein in wheat (Triticum aestivum L.), affects seed size. Plant J. 2015, 83, 312–325. [Google Scholar] [CrossRef] [PubMed]
- Gunupuru, L.R.; Arunachalam, C.; Malla, K.B.; Kahla, A.; Perochon, A.; Jia, J.; Thapa, G.; Doohan, F.M. A wheat cytochrome P450 enhances both resistance to deoxynivalenol and grain yield. PLoS ONE 2018, 13, e0204992. [Google Scholar] [CrossRef] [PubMed] [Green Version]
- Hedden, P. The genes of the Green Revolution. Trends Genet. 2003, 19, 5–9. [Google Scholar] [CrossRef]
- Maccaferri, M.; Sanguineti, M.C.; Corneti, S.; Araus-Ortega, J.L.; Ben Salem, M.; Bort, J.; DeAmbrogio, E.; del Moral, L.F.G.; Demontis, A.; El-Ahmed, A.; et al. Quantitative trait loci for grain yield and adaptation of durum wheat (Triticum durum Desf.) across a wide range of water availability. Genetics 2008, 178, 489–511. [Google Scholar] [CrossRef] [Green Version]
- Graziani, M.; Maccaferri, M.; Royo, C.; Salvatorelli, F.; Tuberosa, R. QTL dissection of yield components and morpho-physiological traits in a durum wheat elite population tested in contrasting thermo-pluviometric conditions. Crop Pasture Sci. 2014, 65, 80–95. [Google Scholar] [CrossRef]
- Mangini, G.; Gadaleta, A.; Colasuonno, P.; Marcotuli, I.; Signorile, A.M.; Simeone, R.; De Vita, P.; Mastangelo, A.M.; Laidò, G.; Pecchioni, N.; et al. Genetic dissection of the relationships between grain yield components by genome-wide association mapping in a collection of tetraploid wheats. PLoS ONE 2018, 13, e0190162. [Google Scholar] [CrossRef] [PubMed]
- Dominguez, F.; Gonzalez, M.C.; Cejudo, F.J. A germination-related gene encoding a serine carboxypeptidase is expressed during the differentiation of the vascular tissue in wheat grains and seedlings. Planta 2002, 215, 727–734. [Google Scholar] [CrossRef] [PubMed]
- Cercos, M.; Urbez, C.; Carbonell, J. A serine carboxypeptidase gene (PsCP), expressed in early steps of reproductive and vegetative development in Pisum sativum, is induced by gibberellins. Plant Mol. Biol. 2003, 51, 165–174. [Google Scholar] [CrossRef]
- Li, Y.B.; Fan, C.C.; Xing, Y.Z.; Jiang, Y.H.; Luo, L.J.; Sun, L.; Shao, D.; Xu, C.; Li, X.; Xiao, J.; et al. Natural variation in GS5 plays an important role in regulating grain size and yield in rice. Nat. Genet. 2011, 43, 1266–1269. [Google Scholar] [CrossRef]
- Bienert, M.D.; Delannoy, M.; Navarre, C.; Boutry, M. NtSCP1 from tobacco is an extracellular serine carboxypeptidase III that has an impact on cell elongation. Plant Physiol. 2012, 158, 1220–1229. [Google Scholar] [CrossRef] [PubMed] [Green Version]
- Wang, S.; Zhang, X.; Chen, F.; Cui, D. A single-nucleotide polymorphism of TaGS5 gene revealed its association with kernel weight in Chinese bread wheat. Front. Plant Sci. 2015, 6, 1166. [Google Scholar] [CrossRef]
- Ma, L.; Li, T.; Hao, C.; Wang, Y.; Chen, X.; Zhang, X. TaGS5-3A, a grain size gene selected during wheat improvement for larger kernel and yield. Plant Biotechnol. J. 2016, 14, 1269–1280. [Google Scholar] [CrossRef]
- Canè, M.A.; Maccaferri, M.; Nazemi, G.; Salvi, S.; Francia, R.; Colalongo, C.; Tuberosa, R. Association mapping for root architectural traits in durum wheat seedlings as related to agronomic performance. Mol. Breed. 2014, 34, 1629–1645. [Google Scholar] [CrossRef] [Green Version]
- Soriano, J.M.; Malosetti, M.; Roselló, M.; Sorrells, M.E.; Royo, C. Dissecting the old Mediterranean durum wheat genetic architecture for phenology, biomass and yield formation by association mapping and QTL meta-analysis. PLoS ONE 2017, 12, e0178290. [Google Scholar] [CrossRef] [Green Version]
- Nuttall, J.G.; O’Leary, G.L.; Panozzo, J.F.; Walker, C.K.; Barlow, K.M.; Fitzgerald, G.J. Models of grain quality in Wheat—A review. Field Crop. Res. 2017, 202, 136–145. [Google Scholar] [CrossRef] [Green Version]
- Du, B.; Wang, Q.; Sun, G.; Ren, X.; Cheng, Y.; Wang, Y.; Gao, S.; Li, C.; Sun, D. Mapping dynamic QTL dissects the genetic architecture of grain size and grain filling rate at different grain-filling stages in barley. Sci. Rep. 2019, 9, 18823. [Google Scholar] [CrossRef]
- Li, B.; Liu, H.; Zhang, Y.; Kang, T.; Zhang, L.; Tong, J.; Xiao, L.; Zhang, H. Constitutive expression of cell wall invertase genes increases grain yield and starch content in maize. Plant Biotechnol. J. 2013, 11, 1080–1091. [Google Scholar] [CrossRef]
- Elouafi, I.; Nachit, M.M. A genetic linkage map of the durum × Triticum dicoccoides backcross population based on SSRs and AFLP markers, and QTL analysis for milling traits. Theor. Appl. Genet. 2004, 108, 401–413. [Google Scholar] [CrossRef]
- Nigro, D.; Gadaleta, A.; Mangini, G.; Colasuonno, P.; Marcotuli, I.; Giancaspro, A.; Giove, S.L.; Simeone, R.; Blanco, A. Candidate genes and genome-wide association study of grain protein content and protein deviation in durum wheat. Planta 2019, 249, 1157–1175. [Google Scholar] [CrossRef] [PubMed]
- Fu, J.; Thiemann, A.; Schrag, T.A.; Melchinger, A.E.; Scholten, S.; Frisc, M. Dissecting grain yield pathways and their interactions with grain dry matter content by a two-step correlation approach with maize seedling transcriptome. BMC Plant Biol. 2010, 10, 63. [Google Scholar] [CrossRef] [PubMed] [Green Version]
- Lizana, X.C.; Riegel, R.; Gomez, L.D.; Herrera, J.; Isla, A.; McQueen-Mason, S.J.; Calderini, D.F. Expansins expression is associated with grain size dynamics in wheat (Triticum aestivum L.). J. Exp. Bot. 2010, 4, 1147–1157. [Google Scholar] [CrossRef]
- Zadoks, J.C.; Chang, T.T.; Konzak, C.F. A decimal code for the growth stages of cereals. Weed Res. 1974, 14, 415–421. [Google Scholar] [CrossRef]
- TraitGenetics GmbH. Available online: http://www.traitgenetics.com (accessed on 10 December 2020).
- Akhunov, E.; Nicolet, C.; Dvorak, J. Single nucleotide polymorphism genotyping in polyploid wheat with the Illumina GoldenGate assay. Theor. Appl. Genet. 2009, 119, 507–517. [Google Scholar] [CrossRef] [Green Version]
- Meng, L.; Li, H.; Zhang, L.; Wang, J. QTL IciMapping: Integrated software for genetic linkage map construction and quantitative trait locus mapping in biparental populations. Crop J. 2015, 3, 269–283. [Google Scholar] [CrossRef] [Green Version]
- Bricker, B. MSTAT-C: A Microcomputer Program for the Design, Management, and Analysis of Agronomic Research Experiments; Plant and Soil Sciences, Michigan State University: East Lansing, MI, USA, 1991. [Google Scholar]
- Singh, M.; Ceccarelli, S. Estimation of heritability of crop traits from variety trial data. In Technical Manual N. 21; International Center for Agricultural Research in the Dry Areas (ICARDA): Aleppo, Syria, 1996. [Google Scholar]
- Snedecor, G.W.; Cochran, W.G. Statistical Methods, 6th ed.; The Iowa State University: Ames, IA, USA, 1967. [Google Scholar]
- Zhang, N.; Fan, X.; Cui, F.; Zhao, C.; Zhang, W.; Zhao, X.; Yang, L.; Pan, R.; Chen, M.; Han, J.; et al. Characterization of the temporal and spatial expression of wheat (Triticum aestivum L.) plant height at the QTL level and their influence on yield-related traits. Theor. Appl. Genet. 2017, 130, 1235–1252. [Google Scholar] [CrossRef] [PubMed]
- Fan, X.; Cui, F.; Ji, J.; Zhang, W.; Zhao, X.; Liu, J.; Meng, D.; Tong, Y.; Wang, T.; Li, J. Dissection of pleiotropic QTL regions controlling wheat spike characteristics under different nitrogen treatments using traditional and conditional QTL mapping. Front. Plant Sci. 2019, 10, 17. [Google Scholar] [CrossRef] [PubMed]
- Ma, J.; Zhang, H.; Li, S.; Zou, Y.; Li, T.; Liu, J.; Ding, P.; Mu, Y.; Tang, H.; Deng, M.; et al. Identification of quantitative trait loci for kernel traits in a wheat cultivar Chuannong16. BMC Genet. 2019, 20, 77. [Google Scholar] [CrossRef] [Green Version]
- Guo, Y.; Zhang, G.; Guo, B.; Qu, C.; Zhang, M.; Kong, F.; Zhao, Y.; Li, S. QTL mapping for quality traits using a high-density genetic map of wheat. PLoS ONE 2020, 15, e0230601. [Google Scholar] [CrossRef]
- Xin, F.; Zhu, T.; Wei, S.; Han, Y.; Zhao, Y.; Zhang, D.; Ma, L.; Ding, Q. QTL Mapping of kernel traits and validation of a major QTL for kernel length-width ratio using SNP and bulked segregant analysis in wheat. Sci. Rep. 2020, 10, 25. [Google Scholar] [CrossRef] [PubMed] [Green Version]
- GrainGenes. A Database for Triticeae and Avena. Available online: http://wheat.pw.usda.gov/ggpages/wgc/98/Intro.htm (accessed on 10 December 2020).
- Voorrips, R.E. MapChart: Software for the graphical presentation of linkage maps and QTLs. J. Hered. 2002, 93, 77–78. [Google Scholar] [CrossRef] [Green Version]
- Interomics. Available online: https://www.interomics.eu/durum-wheat-genome-intranet (accessed on 10 December 2020).
- Ensembl Plants. Available online: https://plants.ensembl.org/index.html (accessed on 10 December 2020).
Figure 1.
Frequency distribution of grain yield (YLD), plant height (PH), heading time (HT), thousand kernel weight (TKW), grain length (GL), grain width (GW), grain area (AREA) in the Liberdur x Anco Marzio RILs mapping population evaluated at Valenzano (Bari, Italy) for three years.
Figure 1.
Frequency distribution of grain yield (YLD), plant height (PH), heading time (HT), thousand kernel weight (TKW), grain length (GL), grain width (GW), grain area (AREA) in the Liberdur x Anco Marzio RILs mapping population evaluated at Valenzano (Bari, Italy) for three years.

Figure 2.
Schematic representation of the durum linkage map Liberdur x Anco Marzio with map positions of QTL for grain yield (YLD), plant height (PH), heading time (HT), thousand kernel weight (TKW), grain length (GL), grain width (GW), grain area (AREA). Each chromosome map is represented by the first and the last SNP marker, and by a SNP marker every about 20 cM. Markers are indicated on the right side and cM distances on the left side of the bar. QTL are represented by bars on the right of each chromosome bar. The + or − preceding the QTL name indicate the positive or negative additive effect of the parental line Liberdur. The left and right SNP markers of the QTL interval are indicated in red.


Table 1.
Mean squares from the combined analysis of variance of grain yield (YLD), plant height (PH), heading time (HT), thousand kernel weight (TKW), grain length (GL), grain width (GW), grain area (AREA) in the Liberdur x Anco Marzio recombinant inbred line (RIL) mapping population evaluated at Valenzano (Bari, Italy) for three years.
| Source of Variation | df | YLD | PH | HT | TKW | GL | GW | AREA |
|---|---|---|---|---|---|---|---|---|
| Block | 2 | 43.247 | 295.371 | 6.526 | 92.291 | 0.037 | 0.046 | 2.108 |
| Year (Y) | 2 | 404.805b ** | 11448.769 *** | 44492.070 *** | 14608.951 *** | 3.238 ** | 12.673 *** | 624.712 *** |
| Error | 4 | 11.698 | 68.460 | 3.852 | 141.014 | 0.120 | 0.192 | 8.839 |
| RIL (G) | 132 | 1.754 *** | 196.336 *** | 341.415 *** | 122.325 *** | 0.883 *** | 0.089 *** | 10.604 *** |
| GxY | 264 | 2.470 *** | 40.368 *** | 28.770 *** | 22.868 *** | 0.041 *** | 0.025 *** | 1.643 *** |
| Error | 792 | 0.425 | 14.143 | 1.184 | 8.573 | 0.005 | 0.007 | 0.341 |
** and ***: significant differences at 0.01 p and 0.001 p, respectively.
Table 2.
Means, ranges, standard deviation (SD), coefficient of variation (CV), and heritability (h2B), of grain yield (YLD), plant height (PH), heading time (HT), thousand kernel weight (TKW), grain length (GL), grain width (GW), grain area (AREA) in the Liberdur x Anco Marzio RIL mapping population evaluated at Valenzano (Bari, Italy) for three years.
| Trait | Year | Liberdur | Anco Marzio | p-Value 1 | RIL | Range | SD | CV (%) | h2B |
|---|---|---|---|---|---|---|---|---|---|
| YLD (t/ha) | |||||||||
| 2016 | 5.07 | 2.98 | * | 4.81 | 2.54–7.63 | 1.25 | 17.26 | 0.66 | |
| 2017 | 3.61 | 4.12 | n.s. | 3.99 | 2.89–5.36 | 0.46 | 11.75 | 0.39 | |
| 2018 | 6.16 | 5.60 | n.s. | 5.99 | 3.91–7.43 | 0.68 | 11.95 | 0.37 | |
| Across years | 4.974 | 4.23 | * | 4.93 | 3.95–5.90 | 0.44 | 13.21 | 0.00 | |
| PH (cm) | |||||||||
| 2016 | 88 | 98 | * | 91 | 74–102 | 5 | 3.99 | 0.68 | |
| 2017 | 74 | 88 | * | 81 | 69–90 | 4 | 4.59 | 0.58 | |
| 2018 | 80 | 93 | * | 86 | 71–102 | 6 | 5.06 | 0.60 | |
| Across years | 81 | 93 | * | 86 | 75–96 | 5 | 4.35 | 0.43 | |
| HT (days from 01 March) | |||||||||
| 2016 | 46 | 21 | * | 33 | 20–46 | 8 | 3.61 | 0.98 | |
| 2017 | 50 | 35 | * | 40 | 33–55 | 6 | 2.51 | 0.98 | |
| 2018 | 59 | 50 | * | 54 | 47–63 | 3 | 2.02 | 0.90 | |
| Across years | 52 | 35 | * | 42 | 33–54 | 6 | 2.57 | 0.77 | |
| TKW (g) | |||||||||
| 2016 | 47.4 | 56.8 | * | 51.8 | 41.2–64.6 | 4.9 | 5.49 | 0.72 | |
| 2017 | 41.6 | 40.5 | n.s. | 40.2 | 33.3–48.9 | 3.8 | 5.25 | 0.70 | |
| 2018 | 39.5 | 47.0 | * | 43.2 | 33.0–57.6 | 4.5 | 8.72 | 0.52 | |
| Across years | 42.8 | 48.1 | * | 45.0 | 36.9–54.8 | 3.7 | 6.49 | 0.45 | |
| GL (mm) | |||||||||
| 2016 | 7.3 | 7.4 | n.s. | 7.4 | 6.6–8.1 | 0.4 | 1.06 | 0.95 | |
| 2017 | 7.5 | 7.1 | * | 7.2 | 6.5–7.9 | 0.3 | 0.89 | 0.96 | |
| 2018 | 7.0 | 7.5 | * | 7.2 | 6.5–7.9 | 0.3 | 1.11 | 0.94 | |
| Across years | 7.3 | 7.3 | n.s. | 7.3 | 6.6–7.9 | 0.3 | 1.01 | 0.85 | |
| GW (mm) | |||||||||
| 2016 | 3.4 | 3.8 | * | 3.4 | 3.1–3.8 | 0.1 | 2.02 | 0.76 | |
| 2017 | 3.1 | 2.8 | n.s. | 3.1 | 2.9–3.3 | 0.1 | 1.89 | 0.74 | |
| 2018 | 3.1 | 3.2 | * | 3.2 | 2.9–3.5 | 0.1 | 3.66 | 0.46 | |
| Across years | 3.2 | 3.3 | n.s. | 3.2 | 3.0–3.5 | 0.1 | 2.63 | 0.35 | |
| AREA (mm2) | |||||||||
| 2016 | 19.4 | 21.9 | * | 19.7 | 16.6–23.5 | 1.5 | 2.60 | 0.88 | |
| 2017 | 18.1 | 17.3 | * | 17.5 | 15.3–19.7 | 1.0 | 2.31 | 0.86 | |
| 2018 | 16.9 | 19.1 | * | 18.0 | 15.1–21.7 | 1.2 | 4.43 | 0.65 | |
| Across years | 18.2 | 19.4 | * | 18.4 | 15.7–21.6 | 1.1 | 3.17 | 0.56 | |
1 * significant difference at 0.05 p value between parental lines based on t-test; n.s. = not significant.
Table 3.
Pearson correlation coefficients (r) among grain yield (YLD), plant height (PH), heading time (HT), thousand kernel weight (TKW), grain length (GL), grain width (GW), grain area (AREA) in the Liberdur x Anco Marzio RIL mapping population evaluated for three years (2016, 2017 and 2018) and across year.
| Year | Trait | YLD | PH | HT | TKW | GL | GW |
|---|---|---|---|---|---|---|---|
| 2016 | PH | −0.07 | |||||
| HT | 0.85 *** | −0.17 * | |||||
| TKW | −0.41 *** | 0.01 | −0.48 *** | ||||
| GL | −0.23 ** | −0.15 | −0.29 *** | 0.76 *** | |||
| GW | −0.65 *** | 0.14 | −0.70 *** | 0.83 *** | 0.37 *** | ||
| AREA | −0.51 *** | −0.02 | −0.57 *** | 0.956 *** | 0.85 *** | 0.80 *** | |
| 2017 | PH | 0.32 *** | |||||
| HT | −0.36 ** | −0.21 * | |||||
| TKW | 0.31 *** | 0.10 | −0.21 * | ||||
| GL | −0.08 | −0.11 | 0.26 ** | 0.56 *** | |||
| GW | 0.26 ** | 0.13 | −0.14 | 0.83 *** | 0.19 * | ||
| AREA | 0.08 | −0.07 | 0.13 | 0.87 *** | 0.85 *** | 0.67 *** | |
| 2018 | PH | 0.40 *** | |||||
| HT | −0.24 ** | 0.04 | |||||
| TKW | 0.22 * | 0.15 | 0.02 | ||||
| GL | 0.01 | −0.13 | 0.05 | 0.62 *** | |||
| GW | 0.21 * | 0.19 * | −0.01 | 0.90 *** | 0.28 *** | ||
| AREA | 0.14 | 0.04 | 0.02 | 0.94 *** | 0.83 *** | 0.77 *** | |
| Across years | PH | 0.16 | |||||
| HT | 0.55 *** | −0.11 | |||||
| TKW | 0.01 | 0.09 | −0.24 ** | ||||
| GL | 0.03 | −0.17 | 0.01 | 0.70 *** | |||
| GW | −0.10 | 0.19 * | −0.36 *** | 0.83 *** | 0.23 ** | ||
| AREA | −0.04 | −0.02 | −0.19 * | 0.95 *** | 0.86 *** | 0.70 *** |
*, ** and ***: significant differences at 0.05, 0.01 and 0.001 P, respectively.
Table 4.
Distribution of single nucleotide polymorphism (SNP) markers across the 14 durum wheat chromosomes in the genetic linkage map Liberdur x Anco Marzio RILs mapping population.
Table 4.
Distribution of single nucleotide polymorphism (SNP) markers across the 14 durum wheat chromosomes in the genetic linkage map Liberdur x Anco Marzio RILs mapping population.
| Chromosome | Linkage Groups (n°) | Total Markers (n°) | Map Length (cM) | Marker Density (SNP/cM) |
|---|---|---|---|---|
| 1A | 2 | 230 | 137.0 | 1.7 |
| 1B | 1 | 587 | 154.8 | 3.8 |
| 2A | 1 | 355 | 195.1 | 1.8 |
| 2B | 2 | 417 | 165.8 | 2.5 |
| 3A | 2 | 300 | 141.4 | 2.1 |
| 3B | 1 | 551 | 187.0 | 2.9 |
| 4A | 3 | 170 | 139.7 | 1.2 |
| 4B | 1 | 273 | 147.2 | 1.9 |
| 5A | 2 | 316 | 175.5 | 1.8 |
| 5B | 2 | 226 | 73.3 | 3.1 |
| 6A | 1 | 264 | 159.4 | 1.7 |
| 6B | 1 | 490 | 155.0 | 3.2 |
| 7A | 1 | 450 | 197.2 | 2.3 |
| 7B | 1 | 505 | 179.7 | 2.8 |
| Genome A | 12 | 2085 | 1145.3 | 1.8 |
| Genome B | 9 | 3049 | 1062.7 | 2.9 |
| Total | 21 | 5134 | 2207.9 | 2.3 |
Table 5.
Quantitative trait loci (QTL) for grain yield (YLD), plant height (PH), heading time (HT), thousand kernel weight (TKW), grain length (GL), grain width (GW), grain area (AREA) in the Liberdur x Anco Marzio RILs mapping population evaluated at Valenzano (Bari, Italy) for three years.
Table 5.
Quantitative trait loci (QTL) for grain yield (YLD), plant height (PH), heading time (HT), thousand kernel weight (TKW), grain length (GL), grain width (GW), grain area (AREA) in the Liberdur x Anco Marzio RILs mapping population evaluated at Valenzano (Bari, Italy) for three years.
| Trait | QTL | Linkage Group | Left Marker | Right Marker | Interval (cM) | Years | Across Years | ||||||||||
|---|---|---|---|---|---|---|---|---|---|---|---|---|---|---|---|---|---|
| 2016 | 2017 | 2018 | |||||||||||||||
| P | Add | R2 (%) | P | Add | R2 (%) | P | Add | R2 (%) | P | Add | R2 (%) | ||||||
| YLD | QYLD.mgb-2A | 2A | IWB70473 | IWB70098 | 34.4–35.6 | 36.5 | 1.04 | 67.9 | - | - | |||||||
| QYLD.mgb-7B | 7B | IWB16239 | IWB35358 | 41.5–46.7 | - | - | 3.7 | −0.24 | 11.9 | ||||||||
| HT | QHT.mgb-2A | 2A | IWB70473 | IWB70098 | 34.4–35.6 | 69.7 | 8.66 | 85.7 | 50.4 | 5.78 | 75.7 | 44.6 | 3.00 | 74.3 | 62.4 | 5.79 | 82.9 |
| QHT.mgb-7A | 7A | IWB7484 | IWB10719 | 55.7–64.8 | - | 3.8 | 1.05 | 2.5 | 2.8 | 0.53 | 2.4 | 3.1 | 0.82 | 1.7 | |||
| PH | QPH.mgb-2B | 2B_2 | IWB42187 | IWB51104 | 14.0–17.1 | - | - | 4.3 | −1.87 | 10.3 | 5.8 | −1.56 | 11.9 | ||||
| QPH.mgb-3A | 3A_1 | IWB71668 | IWB6774 | 57.3–64.0 | 6.2 | 2.09 | 12.8 | - | 3.9 | 1.75 | 9.2 | 5.3 | 1.48 | 10.9 | |||
| QPH.mgb-6B | 6B | IWB42532 | IWB7935 | 4.3–6.8 | 7.9 | −2.45 | 17.5 | - | 3.2 | −1.62 | 7.8 | 5.8 | −1.59 | 12.5 | |||
| QPH.mgb-7A | 7A | IWB43996 | IWB4178 | 88.3–94.7 | - | - | 3.1 | −1.62 | 10.0 | 4.1 | −1.33 | 8.8 | |||||
| TKW | QTKW.mgb-1A | 1A | IWB6172 | IWB21573 | 14.4–20.6 | 2.8 | −0.82 | 2.9 | - | 3.0 | −1.18 | 6.8 | 4.1 | −0.83 | 5.1 | ||
| QTKW.mgb-2A.1 | 2A | IWB70098 | IWB70375 | 35.6–36.4 | 19.6 | −2.52 | 27.1 | 3.5 | −0.81 | 4.7 | - | 5.9 | −1.01 | 7.4 | |||
| QTKW.mgb-2A.2 | 2A | IWB62891 | IWB26699 | 87.5–89.6 | 19.3 | 2.51 | 26.2 | 19.4 | 2.26 | 35.8 | 12.2 | 2.61 | 32.6 | 23.0 | 2.37 | 40.3 | |
| QTKW.mgb-3A | 3A_1 | IWB5723 | IWB25484 | 20.8–21.6 | 5.3 | 1.19 | 5.7 | - | - | 3.0 | 0.71 | 3.6 | |||||
| QTKW.mgb-6B | 6B | IWB26622 | IWB73386 | 87.9–88.3 | 7.5 | −1.42 | 8.5 | - | - | 7.1 | −1.11 | 9.1 | |||||
| GL | QGL.mgb-1B | 1B | IWB67970 | IWB6409 | 45.1–46.7 | 5.8 | −0.09 | 6.4 | - | 8.4 | −0.09 | 9.2 | - | ||||
| QGL.mgb-2A.1 | 2A | IWB70098 | IWB70375 | 35.6–36.4 | 12.7 | −0.13 | 15.1 | - | - | - | |||||||
| QGL.mgb-2A.2 | 2A | IWB62891 | IWB26699 | 87.5–89.6 | 25.5 | 0.21 | 39.1 | 28.2 | 0.24 | 53.8 | 29.8 | 0.21 | 48.8 | 31.6 | 0.24 | 51.2 | |
| QGL.mgb-5A | 5A_1 | IWA4765 | IWB36812 | 36.8–47.3 | 3.8 | −0.07 | 4.8 | - | 4.0 | −0.06 | 4.8 | 2.8 | −0.06 | 2.8 | |||
| QGL.mgb-6B.1 | 6B | IWB27151 | IWA4610 | 3.9–4.3 | 2.6 | −0.10 | 2.6 | - | 4.5 | −0.06 | 4.5 | - | |||||
| QGL.mgb-6B.2 | 6B | IWB19680 | IWB70152 | 89.8–99.1 | - | - | 7.8 | −0.09 | 8.3 | 3.9 | −0.06 | 3.7 | |||||
| GW | QGW.mgb-1B | 1B | IWB34334 | IWB51878 | 47.1–48.4 | 8.1 | 0.10 | 9.3 | 3.9 | 0.10 | 8.4 | 4.8 | 0.10 | 12.7 | 8.8 | 0.04 | 17.0 |
| QGW.mgb-2A.1 | 2A | IWB70098 | IWB70375 | 35.6–36.4 | 26.1 | −0.10 | 42.0 | - | - | 4.6 | −0.03 | 8.4 | |||||
| QGW.mgb-2A.2 | 2A | IWB62891 | IWB25623 | 87.5–93.5 | - | 7.0 | 0.10 | 16.3 | 3.5 | 0.10 | 9.2 | 6.6 | 0.04 | 12.1 | |||
| QGW.mgb-4B | 4B | IWB26975 | IWB17082 | 66.0–70.4 | - | - | 3.0 | 0.10 | 8.0 | - | |||||||
| QGW.mgb-6B | 6B | IWA1254 | IWB42821 | 2.0–2.4 | 3.9 | −0.10 | 4.1 | - | - | - | |||||||
| QGW.mgb-7B | 7B | IWB70613 | IWB69446 | 107.9–108.3 | - | 4.5 | 0.1 | 9.8 | - | 2.7 | 0.1 | 4.7 | |||||
| AREA | QAREA.mgb-2A.1 | 2A | IWB70098 | IWB70375 | 35.6–36.4 | 26.8 | −0.90 | 35.4 | - | - | 6.3 | −0.28 | 6.6 | ||||
| QAREA.mgb-2A.2 | 2A | IWB62891 | IWB26699 | 87.5–89.6 | 21.6 | 0.77 | 25.8 | 26.6 | 0.70 | 47.8 | 19.0 | 0.74 | 43.8 | 28.1 | 0.75 | 44.9 | |
| QAREA.mgb-3A | 3A_1 | IWB5723 | IWB25484 | 20.8–21.6 | 3.1 | 0.26 | 2.8 | - | - | - | |||||||
| QAREA.mgb-4B | 4B | IWB38381 | IWB26975 | 64.7–66.0 | - | 4.8 | 0.24 | 5.6 | 3.2 | 0.26 | 5.4 | - | |||||
| QAREA.mgb-7B | 7B | IWB11767 | IWB68453 | 89.9–99.1 | - | 4.7 | 0.27 | 6.6 | - | 2.6 | 0.19 | 2.8 | |||||
Percentage of the phenotypic variance(R2) and additive effect (Add) are reported in the year and across years when the QTL or suggestive QTL was detected. Suggestive QTL significant at 2.5 ≤ −log10(P) ≤ 3.0 are reported in italic. - Not significant.
Table 6.
Physical position and candidate genes within the QTL cluster detected on Liberdur x Anco Marzio genetic map evaluated for grain yield (YLD), plant height (PH), heading time (HT), thousand kernel weight (TKW), grain length (GL), grain width (GW), grain area (AREA).
Table 6.
Physical position and candidate genes within the QTL cluster detected on Liberdur x Anco Marzio genetic map evaluated for grain yield (YLD), plant height (PH), heading time (HT), thousand kernel weight (TKW), grain length (GL), grain width (GW), grain area (AREA).
| QTL Cluster | Trait Associated | Chromosome | Genetic Position on LA Map (cM) | Physical Position | Gene ID | Candidate Function | |
|---|---|---|---|---|---|---|---|
| Start (Mbp) | End (Mbp) | ||||||
| 1 | GL, GW | 1B | 45.1–48.4 | 348.3 | 361.8 | TRITD1Bv1G120210 | RING U-box superfamily protein |
| TRITD1Bv1G119290 | Cytochrome P450 family protein | ||||||
| TRITD1Bv1G118820 | Auxin-responsive family protein | ||||||
| TRITD1Bv1G118960 | Serine carboxypeptidase | ||||||
| TRITD1Bv1G119070 | Cytochrome P450 family protein | ||||||
| 2 | HT, YLD, TKW, GL, GL, AREA | 2A | 34.4–36.4 | 36.3 | 40.2 | TRITD2Av1G019110 | Expansin protein |
| TRITD2Av1G019200 | RING U-box superfamily protein | ||||||
| TRITD2Av1G019220 | E3 ubiquitin-protein ligase | ||||||
| TRITD2Av1G019250 | Pseudo-response regulator (Ppd-A1) | ||||||
| 3 | TKW, GL, GW, AREA | 2A | 87.5–93.5 | 510.0 | 560.6 | TRITD2Av1G183880 | Cellulose synthase family protein |
| TRITD2Av1G184660 | Thioredoxin | ||||||
| TRITD2Av1G187690 | Mitogen-activated protein kinase | ||||||
| TRITD2Av1G189400 | Auxin response factor (ARF1) | ||||||
| TRITD2Av1G190210 | Thioredoxin family protein | ||||||
| TRITD2Av1G192750 | Serine carboxypeptidase | ||||||
| 4 | TKW, AREA | 3A | 20.8–21.6 | 22.5 | 22.9 | TRITD3Av1G011970 | Kinase family protein |
| TRITD3Av1G012140 | Receptor-like kinase | ||||||
| TRITD3Av1G012070 | Flavin-containing monooxygenase | ||||||
| 5 | GW, AREA | 4B | 64.7–70.4 | 567.5 | 598.6 | TRITD4Bv1G171270 | Protein Big grain 1 |
| TRITD4Bv1G172000 | E3 ubiquitin-protein ligase | ||||||
| TRITD4Bv1G175480 | Auxin signaling | ||||||
| TRITD4Bv1G175840 | RING U-box superfamily protein | ||||||
| 6 | PH, GL, GW | 6B | 2.0–6.8 | 10.8 | 24.7 | TRITD6Bv1G003650 | Ubiquitin family protein |
| TRITD6Bv1G005100 | Cytochrome P450 | ||||||
| TRITD6Bv1G005370 | Acid β-fructofuranosidase | ||||||
| TRITD6Bv1G005450 | Acid β-fructofuranosidase | ||||||
| 7 | TKW, GL | 6B | 87.1–99.1 | 556.1 | 613.2 | TRITD6Bv1G185080 | E3 ubiquitin-protein ligase |
| TRITD6Bv1G189120 | Thioredoxin | ||||||
| 8 | GW, AREA | 7B | 89.9–108.3 | 543.8 | 579.0 | TRITD7Bv1G171980 | E3 ubiquitin-protein ligase |
| TRITD7Bv1G173200 | Auxin response factor | ||||||
| TRITD7Bv1G174660 | Cytochrome P450 | ||||||
| TRITD7Bv1G174890 | E3 ubiquitin-protein ligase | ||||||
| TRITD7Bv1G180500 | RING U-box superfamily protein | ||||||
Publisher’s Note: MDPI stays neutral with regard to jurisdictional claims in published maps and institutional affiliations. |
© 2021 by the authors. Licensee MDPI, Basel, Switzerland. This article is an open access article distributed under the terms and conditions of the Creative Commons Attribution (CC BY) license (http://creativecommons.org/licenses/by/4.0/).
Share and Cite
MDPI and ACS Style
Mangini, G.; Blanco, A.; Nigro, D.; Signorile, M.A.; Simeone, R. Candidate Genes and Quantitative Trait Loci for Grain Yield and Seed Size in Durum Wheat. Plants 2021, 10, 312. https://0-doi-org.brum.beds.ac.uk/10.3390/plants10020312
AMA Style
Mangini G, Blanco A, Nigro D, Signorile MA, Simeone R. Candidate Genes and Quantitative Trait Loci for Grain Yield and Seed Size in Durum Wheat. Plants. 2021; 10(2):312. https://0-doi-org.brum.beds.ac.uk/10.3390/plants10020312
Chicago/Turabian StyleMangini, Giacomo, Antonio Blanco, Domenica Nigro, Massimo Antonio Signorile, and Rosanna Simeone. 2021. "Candidate Genes and Quantitative Trait Loci for Grain Yield and Seed Size in Durum Wheat" Plants 10, no. 2: 312. https://0-doi-org.brum.beds.ac.uk/10.3390/plants10020312
Note that from the first issue of 2016, this journal uses article numbers instead of page numbers. See further details here.