
Charge Density Fluctuations on a Dielectric Surface Exposed to Plasma or UV Radiation

1
Space Research Institute, Russian Academy of Sciences, Profsoyuznaya str, 84/32, 117997 Moscow, Russia
2
Institute of Metal Physics, Ural Branch of Russian Academy of Sciences, Kovalevskaya str. 18, 620990 Yekaterinburg, Russia
*
Author to whom correspondence should be addressed.
Plasma 2021, 4(2), 201-213; https://0-doi-org.brum.beds.ac.uk/10.3390/plasma4020012
Submission received: 7 February 2021
/
Revised: 11 March 2021
/
Accepted: 18 March 2021
/
Published: 24 March 2021
Abstract
:Dust particles on a nonconductive surface are known to acquire electric charge and detach from the surface under plasma conditions and/or when affected by ultraviolet radiation. Similar phenomena occur as a result of electrostatic surface cleaning (shedding) as well as in nature, e.g., when observing levitation of dust particles above the lunar surface. A detachment of dust particles from the surface should occur when the electrostatic forces of their repulsion Fc exceed the sum of the gravitation Fg forces and the adhesive van der Waals FvdW forces acting on the particle on a nonconducting surface. However, a paradoxical situation usually arises: the three primary forces of different nature Fc, Fg, and FvdW, acting on a speck of dust with a characteristic size of the order of hundreds or thousands of nanometers, are completely incomparable in magnitude, herewith Fc << Fg << FvdW. In the last decade, numerous attempts have been made to explain how a particle on a nonconducting surface can acquire a charge sufficient for the electrostatic forces that arise to approach the adhesive forces’ values. However, despite some successes, many questions remain unanswered. This article presents a brief analysis of the charge appearance process on a solitary dust speck and a speck lying on the surface. To explain the detachment of dust particles from the surface caused by electrostatic forces and the accumulation of a charge on those particles sufficient for levitation, one should take into account the charge density fluctuations on the surface.
1. Introduction
In the lunar missions Surveyor 5, 6, and 7 [1,2] the television cameras registered a “lunar horizon-glow” shortly after the sunset. A similar glow near the lunar terminator was reported by Apollo 17 [3]. The authors interpreted this glow as sunlight dispersion on the particles over the lunar surface resulting from electrostatic “levitation”. Presently electrostatic levitation and dust movement over the airless bodies’ surface is commonly assumed to be caused by Coulomb force FQ. This force affects the charged particles in the near-surface electric field E [4]. According to the Apollo superthermal ion detector experiment (SIDE) [5], the intensity vector of this field is directed away from the surface, and it has a magnitude of about E ≈ 10 Vm−1 on the illuminated side of the Moon [6]. For the electrostatic force to lift a dust particle overcoming the gravity force Fg at this E value, the particle charge must be sufficiently large. For example, for a micron particle (diameter d ~ 1 μm), its charge q should be of the order
where ρ ≈ 3000 kg m−3 is the regolith density, gL ≈ 1.6 m s−2 is the gravity acceleration on the lunar surface, and e is the elementary charge. A dust particle with a greater charge or smaller size grains obtains some vertical speed, and the fountain mechanism may enter into effect [7]. As a result, dust particles dispersed in the near-surface electric field can fly up to a height exceeding the width of the layer in which this field exists.
Although the nature of the force that makes particles soar above the surface may be considered established, two other questions remain unanswered:
- (i)
- how can a microscopic speck of dust lying on the surface accumulate a charge of tens or hundreds of e sufficient to make it soar?
- (ii)
- how can a particle, even with a charge sufficient to levitate, overcome adhesion forces known to exceed its gravitation by thousands and millions of times [8]?
2. A Surface Charge under Plasma Conditions
In electroneutral plasma, the densities of electrons and ions are similar, but the thermal velocities of electrons are usually hundreds of times higher than the velocities of ions due to the difference in their masses. Therefore, the initially uncharged surface exposed to plasma accumulates a negative charge until the electron and ion currents become equal, e.g., [14,15]. In this case, the surface acquires the potential φs, and the electric field E appears above the surface. The value φs does not depend very much on the radius R of the surface curvature, even for highly rarefied plasma. However, the surface charge density σs and the thickness of the layer above the surface in which E has a noticeable value vary greatly with R.
If we consider a speck of dust with a small radius compared to the Debye shielding radius R << λD, then the contribution of plasma shielding to the field can be neglected. In this case, E practically disappears even at a small, say about 10R, distance from the surface:
This field must be very strong to equate the currents of electrons and ions to a dust particle in such a thin layer. It should distort the trajectories of the overwhelming majority of electrons flying toward the dust particle so that they do not hit the surface. This means that the work of the field is
which is similar to or greater than the average thermal energy of electrons. Thus,
The situation changes dramatically for a large body with R >> λD or for a flat surface. The field above the surface has an apparent size mainly inside a layer with a thickness of λD (plasmasheath [16]). Electron and ion currents are compared in this field because only the fastest electrons can overcome the potential barrier and reach the surface, while the rest (slower electrons) are thrown back by this field. This means that inequality holds here. Now, the potential varies from zero to φs inside a layer with much more significant thickness λD. Inside this layer, the field is almost uniform with intensity
If a particle radius R in plasma is much smaller than the Debye radius λD, then the ratio of the negative charge density σs (R < <λD) to the charge density on the σs(plane) plane is
For example, the charge density on the surface of the micron dust particle in the solar wind plasma in the vicinity of the Earth (λD~10 m) should be about ten million times higher than its density on the surface of the Moon.
3. Surface Charge on an Illuminated Surface in Vacuum
When light quanta from the ultraviolet region of the spectrum hit the surface, they knock out photoelectrons from it. In the first moments of lighting, photoelectrons fly away irreversibly, and the surface acquires a positive charge, e.g., [14]. After some time, the field Es above the surface becomes strong enough to return all the photoelectrons. After that, equilibrium is established at
where jph is the photocurrent density, H is the thickness of the photoelectrons’ layer, v is the average speed of their movement up and down, and ne is the number of photoelectrons soaring above each m2 of the surface. If we neglect the difference between the number of electrons flying above the surface and the number of positively charged holes on it, then . The meaning of this equilibrium condition is that all electrons (ne pieces) soaring above the surface at an arbitrary moment t fall on it by the time t + Δt, and the same number of electrons should fly up during this time.
The electric field is concentrated mainly inside a cloud of photoelectrons of thickness H. Knowing the energy of light quanta and taking into account the work function A of photoelectrons, we get a simple estimate
Here, Δφ is the potential difference between the illuminated surface and the edge of a cloud of photoelectrons hanging above it. For a sphere, we get . Therefore, the surface charge density, as in the previous section, is inversely proportional to the radius
Neglecting the inhomogeneity of the field inside the layer of photoelectrons, the charge density on the flat surface can be represented as:
Then, contrary to (6) we get
The thickness of photoelectron layer H is easy to determine by combining Equations (7) and (8). However, if the field strength Es over the surface is known, it is easier the estimate . If the photoelectric effect occurs due to the ultraviolet radiation of the Sun and Es ≈ 10 V m−1, which roughly corresponds to its value on the illuminated surface of the Moon [5], then the value of H is approximately several meters.
Thus, in photoionization, and in plasma conditions, the charge density on the surface of a small solitary dust particle must be millions of times greater than the charge density on the plane. In reality, both radiation and plasma flow, such as solar radiation and solar wind, on nearly all airless bodies throughout the solar system can simultaneously affect the surface. These two factors result in the charges of opposite signs, thus making the above estimates too simplified. Numerical calculations are needed to determine the field’s distribution above the surface (see for example [17,18]). It is natural to expect that the equilibrium value of the charge density on an object’s surface would rapidly grow with a decrease in its size.
4. The Charge of a Dust Particle on a Plane
A charge sufficient for levitation (1) can easily accumulate on a solitary speck of dust, e.g., [19,20,21,22,23,24,25,26] and others. In order for photoelectrons to return to the illuminated surface, it must acquire a potential of φs ≈ 10 V. For the potential of a solitary micron (R ≈ 0.5 μm) speck to reach this value, a charge q = 4πε0Rφs ≈ 5 · 10−16 C ≈ 3000 e must be accumulated on it. On the Moon surface, this is enough for levitation as well as for the efficient operation of the fountain mechanism [7]. In this case, before the take-off, such a charge should be acquired not by a solitary particle but by a dust particle lying on the surface. For some time, this was not taken into account. Apparently, the authors of the article [10] were the first to pay attention to this. They proposed representing the charge of a dust speck lying on the surface Qdust(t) as the sum of the time-averaged charge and the charge fluctuating over the time δQdust(t). As for the time-averaged charge, they discussed two extreme cases: the “isolated capacitor” model and the “shared charge” model [10]. Both models are static and neglect temporary charge fluctuations. However, it is emphasized in the same paper that the instantaneous value of the dust-speck charge on the surface may be significantly higher than its average value, which is usually less than the charge of one electron. This assumption is a key for understanding the phenomenon of charge accumulation sufficient for levitation.
Again, the difference between the “isolated capacitor” model and the “shared charge” model means that the charge of a solitary fine dust particle can create a field of appreciable magnitude only in a very narrow area of its surrounding space. This field must have a high-intensity E to repel/attract electrons effectively. Since above a charged surface , this requires a high charge density on the surface. Therefore, the surface of a solitary illuminated dust particle or a dust particle suspended in the plasma must accumulate a significant charge in order for the current to the particle to become equal to zero.
The situation changes radically if a speck of dust lies on a surface. The field above the surface is created by a multitude of charges. These charges are accumulated over an area that is much larger than the size of the dust particle. The electric field above the surface decelerates the electrons on their way to the surface and the dust speck lying on it. Therefore, the charge accumulation on the dust particle and the surface cease simultaneously. This means that a speck of dust can accumulate on average a charge
where σs is the average charge density on the surface. This is the “shared charge” model, i.e., a model in which the average charge density on the surface and the dust particle lying on this surface coincide [10]. In particular, on the illuminated surface of the Moon, the field strength is E~10 Vm−1, so
Assuming that this charge is distributed uniformly over the surface, the average charge of a micron dust particle is equal to
Thus, approximately only 1 of 5000 µm dust particles has a charge of e, 1 of 25,000,000 has a charge of 2e, etc. As for other particles, these numbers are inversely proportional to the square of their size.
Using this approach, one cannot expect any noticeable charge increase sufficient for its take-off and soaring above the surface. It was the principal difficulty in the explanation of the dust levitation effect.
5. Dust-Particle Detachment from the Surface
The problem of dust-particle detachment from nonconductive surface arises because the adhesive van der Waals forces FvdW which attaches it to other regolith dust particle or directly to a nonconductive surface can be quite powerful. [10]. FvdW is often estimated using the Hamaker model [27]. The parameters of the model are the sizes of interacting particles R1, R2, and the distance between them D and the Hamaker parameter A that has units of energy. The latter is related to the properties of dust materials but does not depend on the form of the particles.
The estimation of the magnitude of the attraction force between two dust particles is usually performed by the formula [8,10]:
in which the Hamaker constant A is ~10−19 J. The distance between the surfaces of the dust particles D can be determined with much less accuracy. According to [10], D can vary from 0.3 to 100 nm and possibly more, depending on the shape and asperity of dust particles. The estimates for dust particles with R~ 1 μm vary greatly—from 10−7 to 10−12 N. This means that the van der Waals force can be thousands or even millions of times greater than the gravity force.
Therefore, if the dust particles detach from the surface under the of Coulomb forces’ action, the detachment condition turns out to be a much stricter restriction than the levitation condition Formula (1). To detach a particle with a charge of q = ne from the surface, even if has a minimum value of ~1 pN [10], there must be an electric field intensity E above the surface that satisfies the condition
If we assume that E ≈ 10 Vm−1 is the same as in Formula (1), then a detached particle should have a charge of millions of e. This does not seem very real. Otherwise, one should propose a mechanism to explain the appearance of an extremely strong electric field or some force of other nature just above the surface at the moment of dust separation. In other words, one should look for the source of some fluctuations.
6. Adhesive Forces and Thermal Fluctuations
While dealing with particle separation from the surface, one should keep in mind that if the adhesive forces are small, e.g., a few piconewtons, the probability of detachment should depend strongly on temperature. Indeed, the adhesive van der Waals forces Formula (15) decrease rapidly with the distance D between the particles. Therefore, the work necessary to separate particles
appears to be not too large. If the values of A ~ 10−19 J, D ~ 0.3 nm [10] and R1 ≈ R2 ≈ 0.5 μm, then F ~ 5⋅104 pN and , which corresponds to thermal energy kBT at T 106 K. If D ~ 100 nm, then F ≈ 0.4 pN and . The latter case corresponds to the standard estimate of the energy of dipole bonds W ≈ 10–20 kJ mol−1 [28]. This means that at T ≈ 400 K, i.e., close to the sunlit lunar surface temperature of [29], quite a large number of the dust particles have sufficient energy to break the connection between them by Brownian motion. Moreover, under such conditions, the smallest specks of dust with d ~ 10 nm can levitate at an altitude of about 1 m solely due to thermal fluctuations [30].
7. Charge Fluctuations
Stochastic nature is an essential feature of the charge accumulation process on a nonconducting surface which is illuminated and/or exposed to plasma. If the area S of the surface under consideration is large, then a large number of electrons Ne ≈ SjeΔt > >1 and ions Ni ≈ SjiΔt appears on it during Δt. Here, je and ji are the average densities of random currents of electrons and ions flowing to the site. These currents should be equal to each other, i.e., je = ji = j in equilibrium. Then, the same number of positive and negative charges Ne ≈ Ni = N = SjΔt appear on the site during the time Δt. Suppose that a fall of electrons and ions on the site is purely a random event. This means that its probability does not depend on the amount of charge already accumulated on the site. Similarly, for an “honest” coin, the probability of an eagle or tail does not depend on the outcomes of previous flips. Let us denote an event in which the i-th particle hits the surface by si. Here, s can take the values s = ±1 following the charge sign on the site. Then,
is a number of excess charges (with an appropriate sign) accumulated on the site after N particles hit it. Assigning heads and tails values ±1, the same formula can be used to describe the outcome of a series of N coin flips. After conducting a large number m = 1, 2, … M of such series of shots, the average value
since both outcomes of any throw are equally probable. It is also clear that the longer the series, the greater the probability that the number of eagle fallings is much greater than the number of tails, or vice versa. Considering that the outcomes of coin flips are independent but si2 = 1, we get
In this equation, SD is a standard deviation, since the usual designation σ has already been used for surface charge density.
As an example, let us consider the process of photoemission on the surface of the Moon. According to [31], the photocurrent density in the noon area is jph ≈ 5⋅10−6 Am−2. This means that, on average, N ≈ 3⋅1013 positively charged holes appear on a site of 1 m2 during the time Δt = 1 s, and at the same time, as many previously ejected photoelectrons fall on it. As shown from (13), the average charge of this site around 3⋅108 e is very small compared to the total number of 2N charges ±e falling on it per second. However, positive and negative charges continually appearing on the site mainly compensate each other. One can notice only a small “ripple” (fluctuations) of the charge. Its amplitude should be compared to the average value of σs.
If we assume that 2N ≈ 6⋅1013 of positive and negative charges appeared within a second on an area of 1 m2 purely by chance, then the average amplitude of fluctuations of the charge number is small compared to the average number of charges on the site σs/e = 3⋅108. Does this mean that the amplitude of charge fluctuations is necessarily small and can be neglected on an area of a macroscopic size? The answer depends on how long the positive and negative charges hit the site in a purely random way with the same probabilities. If we assume that this continues, say, for a day (≈105 s), then the average amplitude of fluctuations SD increases by about 300 times and significantly exceeds σs. The question here is how large the charge of the site should be so that the field created by this charge makes the probabilities of particles with different charges significantly different. After that, fluctuation suppression develops, and the conditions of applicability of the Formula (20) are violated. These processes are discussed in the next section.
Nevertheless, fluctuations always play a crucial role for tiny areas where the average charge is small compared to e. Indeed, the charge can only change discretely by ±e. Therefore, fluctuations arise when a particle of any charge hits a small area, while the amplitude of such charge fluctuations is much higher than the average value of the charge over the surface. According to (13), an average charge of a site, e.g., on 1 μm2 is 3⋅10−4 e, and approximately 30 charges ±e appear on it every second. This means that within one second, the region charge may increase in a purely random manner by a value of the order of 10e, and in another second—decrease by the same amount, etc. Consequently, the instantaneous charge turns out to be much greater than the average charge. The average value of the charge of such a small area can be neglected if we exclude slow processes. Then, the magnitude of the amplitude of charge fluctuations becomes essential.
One can draw an analogy between the distribution of charge density on a dielectric surface and the lights of a large city. Flying up to a city at night, one first sees the large smooth glow, then some flicker becomes noticeable. At a lower altitude, one can already see car headlights, lit windows, flashing ads, etc. This is similar to the hit of the charges ±e on the surface. Several charges of one sign may almost simultaneously fall on a certain site. It is equally likely that several closely spaced light sources in the city are turned on or off almost simultaneously. Here, three questions that may be of interest: (i) how often do dark and light spots appear? (ii) how different is their illuminance from the general background?, and (iii) how are these spots distributed by size?
Blackouts certainly happen, but this is a very large and very rare fluctuation. We are interested in smaller, but much sharper and frequent fluctuations as these fluctuations play the main role in detachment of charged particles from the surface.
8. Coulomb Forces on a Charged Dielectric Surface
If a speck of dust lies on a uniformly charged plane with a density of σs, then a force acting on it is (if the plane is a capacitor plate, this force is twice as large). In the “shared charge” model [10],
if the charge density on the surface of a dust particle and that on the neighboring plane is assumed to be the same. As for the Moon surface, this repulsive force is far from enough even for the dust-speck levitation, to say nothing about its separation from the surface. This happens because the average over the surface value σs (13) is too small. The appearance of a single hole on a micron dust particle increases both the charge (14) and the force (21) by a factor of 5000. On the Moon, dozens of additional holes and electrons appear on the surface of such a dust speck every single second. Therefore, fluctuations of its charge with an amplitude of the order of 10e are quite probable [12]. Thus, by taking into account fluctuations of the charge of a dust speck on a uniformly charged plane, one can better understand the accumulation of the charge necessary for levitation. However, the mechanism of particle detachment from the surface (16) remains unclear.
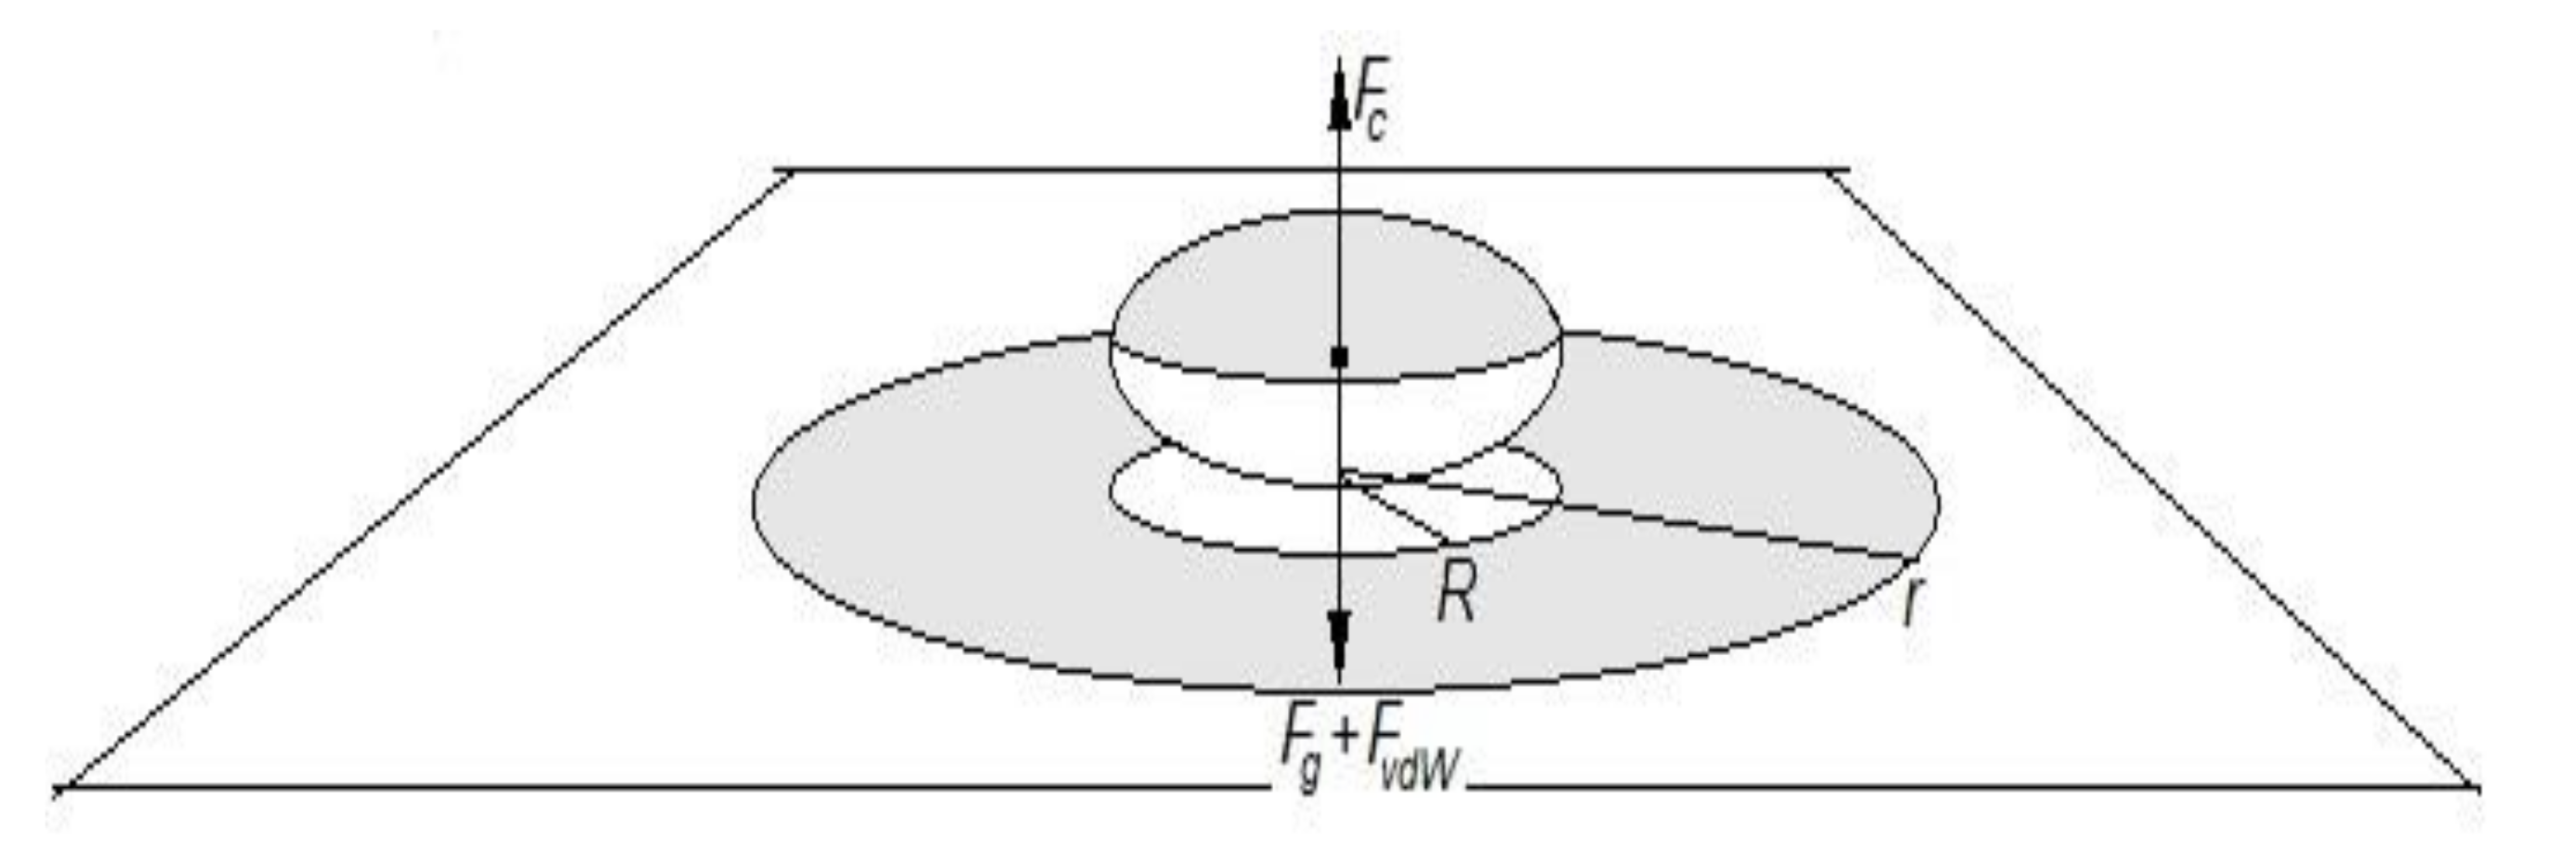
Following the idea by Flanagan and Goree, [10], we expand the area of research to see how charge fluctuations occur on the dust particle of radius R as well as in adjacent parts of the plane or in neighboring dust particles. Suppose a big fluctuation occurs in an area several times larger than the size of a speck of dust lying near the area center. Then, the charge density σs on the dust particle itself, and on some annular part of the surface R-r around it (Figure 1) increases simultaneously and approximately equally. It is easy to show [13] that if we “cut off” a part of the charged plane in Formula (21), leaving only a charged ring, limited by the radii R and r, then the force does not decrease too much. Therefore, when σs increases several thousand times due to fluctuations, the force in Formula (21) proportional to σs2 increases by tens or hundreds of millions of times.
In this case, the result depends mainly on charge density changes due to fluctuations, i.e., on the magnitude of the ratio , where is the charge change of the region with radius r during fluctuations. It is evident that should grow much slower than S (see the next section). This means that the region’s size where the Coulomb force may increase very sharply due to fluctuations is limited from above. Therefore, the size of particles that can be detached from the surface is also limited. Probably, the establishment of a quantitative relationship between the particle size, parameters of the surface, and the plasma and radiation streams falling on it should be one of the main points of the theory of this effect.
9. Mathematical Methods
Mathematical description of charge fluctuations in different areas (a small solitary speck of dust or part of a large surface) should take into account two fundamentally different charge-changing mechanisms. The first one is a purely stochastic mechanism for entering positive and negative charges into this region. It causes the appearance of fluctuations. The second mechanism tends to bring the system back after it gets out of balance and is responsible for suppressing the fluctuations.
In our case, the second mechanism is associated with an additional Coulomb field that occurs when the charge of a region deviates from its equilibrium value. This field rejects or attracts charges approaching this area if the sign of these charges coincides or opposite to the sign of the additional charge δQ arisen in the area. If the deviations from equilibrium are insignificant, the relaxation process is described by the equation of an exponential decay
The main difficulty in describing this process is related to the calculation of the relaxation time τ. The easiest way to do it is to describe charge fluctuations on a spherical dust particle in a high-density plasma. In this case, the free path of plasma spice is small compared to the dust-particle size. The probability of a charge q to appear on its surface with potential φs is proportional to the Boltzmann factor . Then, simple formulas may be used for the current strength J [15]
The calculations are more complicated in a rarefied plasma where the mean free path is vast compared to the size of a dust particle and, therefore, to the region’s size where it creates a noticeable field. In this case, the thermalized electrons and ions up to the surface of a dust particle according to dynamics laws. Although there are no collisions, these moving charges create their fields that change the fields of dust particles, meaning the problem should be solved self-consistently. Moreover, plasma spices attracted to a speck of dust may appear on stationary orbits. This makes the solution quite ambiguous [32].
The potential of a solitary dust particle in plasma is the only crucial physical parameter under the conditions of charge fluctuations on it [23] (if the surface can be considered equipotential). Methods for describing such fluctuations are well developed [20,23,25,33]. Knowing the relationship between the dust-speck potential and the probabilities of plasma spice falling on its surface opens various possibilities. It becomes possible to write the Master Equation (see Equation (5) in [33]) and then go to the Fokker–Planck equation [21,33]. To determine the mean potential value and its dispersion, one may also use the related equations [12], the stochastic differential equation [13], etc., e.g., [20,23,25,26].
Much more complex issues arise when describing charge fluctuations that appear on the surface of a macroscopic dielectric due to its contact with a low-density plasma. One of them is related to the fact that now the surface cannot be considered equipotential since the “spots” of excess charges of different signs are scattered around it randomly. Therefore, the field in which an electron or an ion moves toward a specific area on the surface, and the damping rate of fluctuations in any area depends not only on the charge of this area but also on the charges of all the areas adjacent it. This means the appearance of correlations between fluctuations that greatly complicate the solution of the problem. An attempt to overcome these difficulties using an extremely simple and rude approximation was made in [13]. However, we are still far from obtaining a more or less rigorous mathematical description of the charge fluctuations taking into account their attenuation.
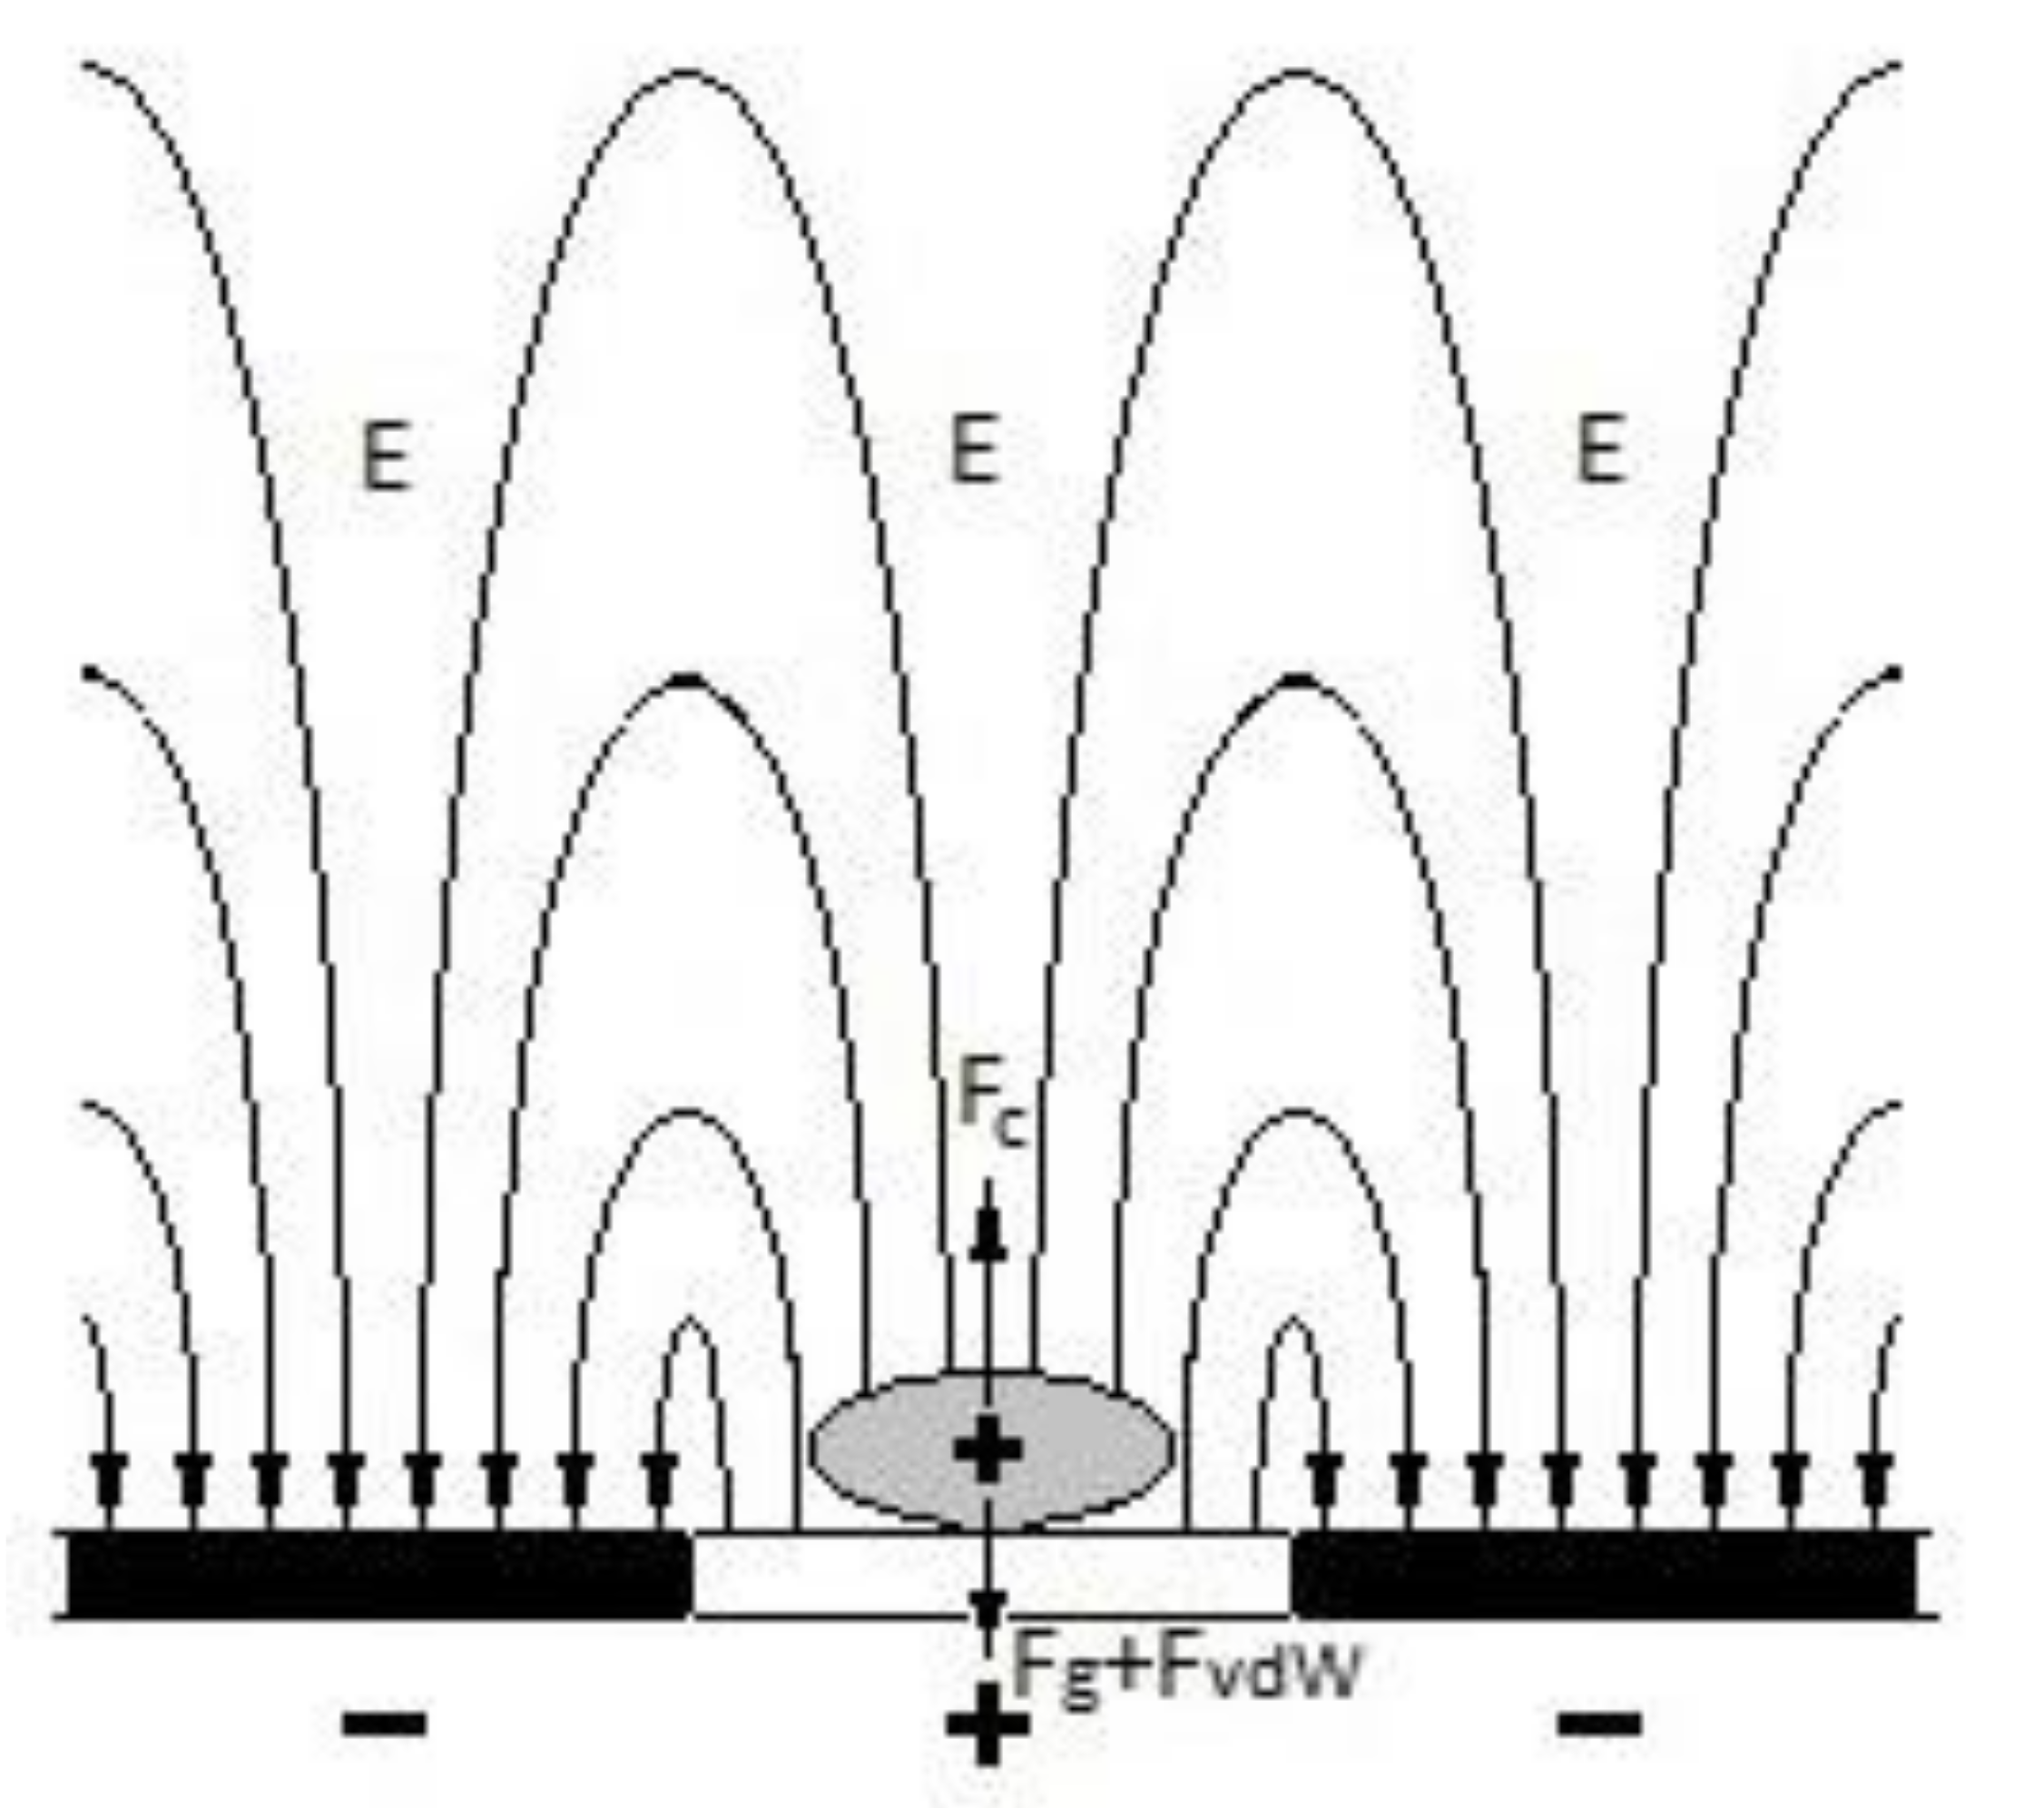
10. The Nature of the Field above the “Spotted” Surface
Let us briefly discuss the peculiarity of the electric field arising above the plane, which is spotted by opposite charges. If the magnitude of charges and the outlines of spots are random, then the field can only be determined by numerical methods. However, there should be two fairly clearly separated regions over the plane with different field geometry.
If the average density of the surface charge is equal to , then at a large distance from the plane (several times larger than the characteristic size of charge spots), the field is almost uniform, perpendicular to the plane, and equal . Closer to the plane, the main contribution to the field comes from a fluctuating charge spot directly below the observation point. Therefore, the field becomes sharply inhomogeneous, and field strength components parallel to the plane appear. A similar configuration is shown in Figure 2. Finally, directly on the surface, the field strength component perpendicular to it at any point r is equal to , where is the local density of the surface charge. These statements are valid only as long as we are not faced with the need to take into account the discreteness of the charge.
A rigorous proof of these statements for an arbitrary distribution is hardly possible. Nevertheless, it seems evident that the configuration of the field should not depend on the charges and the outlines of the spots in general terms.
As an example, let us calculate a field over an infinite “chessboard” of rectangular cells with size a × b. The potential of such a structure is surprisingly easy to calculate in an analytical form in the case of sinusoidal distribution of charge density. Assuming that our plane coincides with the xy plane and
for the potential at the point , we get the expression
From (25), we can conclude that at a distance Z = from the surface (along the z axis) the potential of the inhomogeneous field decreases by more than twenty times. At Z = α, b we obtain from Formula (25)
Therefore, the field strength reaches a maximal value directly on the surface. However, as the observation point rises above the surface, the field strength drops very quickly to . For example, if the characteristic scale of fluctuating charge spots on the surface is of the order of a micron, then already at the height of about ten micrometers, the field becomes close to the value corresponding to the averaged over the surface charge density .
11. Conclusions
In conclusion, the most important result should be emphasized once again. Fluctuating charge spots of microscopic sizes and local electric fields above them arise on the surface of a dielectric in plasma or under the influence of UV radiation. The strength of these fields can reach several tens and even hundreds of millions of volts per meter.
By taking into account charge fluctuations, one can solve both problems that were mentioned in the introduction. Charge fluctuations on a dust speck lying on the surface can ensure its levitation above this surface even in a weak average field. Fluctuations on a slightly larger areas of the surface around the dust speck lead to the appearance of a lifting force proportional to the square of the local charge density. Simple estimates show that this mechanism can lead to the appearance of repulsive forces comparable to the Van der Waals adhesive forces [8].
In addition to purely scientific interest, the need for further progress is linked to two important technical issues. On the one hand, it is already clear how much the levitating dust may complicate the study of airless planets [34]. On the other hand, the ever-accelerating miniaturization of most technical devices urgently requires the development of new and improvement of already existing methods for electrostatic surface dust cleaning or shedding [35].
Nevertheless, many significant scientific and practical issues related to the separation of microparticles from the surface and their levitation remain unresolved. The most critical of them is finding out how dimensions and lifetimes of fluctuations depend on external control parameters (surface temperature, plasma characteristics, ultraviolet radiation, etc.). Creating an adequate theory of charge fluctuations on a macroscopic surface seems to be a necessary step to solve these issues. A technique for measuring electric fields in submicron regions directly above the dielectric surface could provide useful data.
Author Contributions
Conceptualization, E.V.R. and A.V.Z.; methodology, E.V.R. and A.V.Z.; writing—E.V.R. and A.V.Z. All authors have read and agreed to the published version of the manuscript.
Funding
This research received no external funding.
Institutional Review Board Statement
Not applicable.
Informed Consent Statement
Not applicable.
Data Availability Statement
Not applicable.
Acknowledgments
This work was supported in part by the Institute of Metal Physics, Ural Branch of the Russian Academy of Sciences within the framework of the state assignment of the Ministry of Science and Higher Education of the Russian Federation (topic “Electron” No. AAAA-A18-118020190098-5) and the Space Research Institute of the Russian Academy of Sciences (topic “Planet”).
Conflicts of Interest
The authors declare no conflict of interest.
References
- Criswell, D.R. Horizon-glow and the motion of lunar dust. In Photon and Particle Interactions with Surfaces in Space; Grard, R.J.L., Ed.; D. Reidel Publishing Co.: Dordrecht, The Netherlands, 1973; pp. 545–556. [Google Scholar]
- Rennilson, J.J.; Criswell, D.R. Surveyor observations of lunar horizon-glow. Moon 1974, 10, 121–124. [Google Scholar] [CrossRef]
- McCoy, J.E.; Criswell, D.R. Evidence for a high altitude distribution of lunar dust. Proc. Fifth Lunar Conf. 1974, 3, 2991–3005. [Google Scholar]
- Colwell, J.E.; Batiste, S.; Horanyi, M.; Robertson, S.; Sture, S. Lunar surface: Dust dynamics and regolith mechanics. Rev. Geophys. 2007, 45, RG2006. [Google Scholar] [CrossRef]
- Freeman, J.W.; Fenner, M.A.; Hills, H.K. Electric potential of the Moon in the solar wind. J. Geophys. Res. Space Phys. 1973, 78, 4560–4567. [Google Scholar] [CrossRef]
- Freeman, J.W.; Inrahim, M. Lunar electric fields, surface potential and associated plasma sheaths. Moon 1975, 14, 103–114. [Google Scholar] [CrossRef]
- Stubbs, T.J.; Vondrak, R.R.; Farrell, W.M. A dynamic fountain model for lunar dust. Adv. Space Res. 2006, 37, 59–66. [Google Scholar] [CrossRef] [Green Version]
- Li, Q.; Rudolph, V.; Peukert, W. London-van der Waals adhesiveness of rough particles. Powder Technol. 2006, 161, 248–255. [Google Scholar] [CrossRef]
- Sheridan, T.E.; Goree, J.; Chiu, Y.T.; Rairden, R.L.; Kiessling, J.A. Observation of dust shedding from material bodies in a plasma. J. Geophys. Res. 1992, 97, 2935–2942. [Google Scholar] [CrossRef] [Green Version]
- Flanagan, T.M.; Goree, J. Dust release from surfaces exposed to plasma. Phys. Plasmas 2006, 13, 123504. [Google Scholar] [CrossRef] [Green Version]
- Sheridan, T.E.; Hayes, A. Charge fluctuations for particles on a surface exposed to plasma. Appl. Phys. Lett. 2011, 98, 091501. [Google Scholar] [CrossRef] [Green Version]
- Sheridan, T.E. Charging time for dust grain on surface exposed to plasma. J. Appl. Phys. 2013, 113, 143304. [Google Scholar] [CrossRef]
- Rosenfeld, E.V.; Zakharov, A.V. Dust shedding from a dielectric surface in plasma as a result of charge fluctuations. Phys. Plasmas 2018, 25, 103703. [Google Scholar] [CrossRef]
- Manka, R.H. Plasma and potential at the lunar surface. In Photon and Particle Interactions with Surfaces in Space; Grard, R.J.L., Ed.; D. Reidel Publishing Co.: Dordrecht, The Netherlands, 1973; pp. 347–361. [Google Scholar]
- Whipple, E. Potential of surface in plasma. Rep. Progr. Phys. 1981, 44, 1197–1250. [Google Scholar] [CrossRef] [Green Version]
- Anderson, N.; Walsh, G.R. The formation of a plasma sheath. Int. J. Electron. 1971, 31, 217–222. [Google Scholar] [CrossRef]
- Popel, S.I.; Kopnin, S.I.; Golub, A.P.; Dol’nikov, G.G.; Zakharov, A.V.; Zelenyi, L.M.; Izvekova, Y.N. Dusty Plasma at the Surface of the Moon. Sol. Syst. Res. 2013, 47, 419–429. [Google Scholar] [CrossRef]
- Stubbs, T.J.; Farrell, W.M.; Halekas, J.S.; Burchill, J.K.; Collier, M.R.; Zimmerman, M.I.; Vondrak, R.R.; Delory, G.T.; Pfaff, R.F. Dependence of lunar surface charging on solar wind plasma conditions and solar irradiation. Planet. Space Sci. 2014, 90, 10–27. [Google Scholar] [CrossRef]
- Goertz, C.K. Dusty plasma in the solar system. Rev. Geophys. 1989, 27, 271–292. [Google Scholar] [CrossRef]
- Cui, C.; Goree, J. Fluctuations of the charge on dust grain in a plasma. IEEE Trans. Plasma Sci. 1994, 22, 2. [Google Scholar]
- Matsoukas, T.; Russell, M. Particle charging in low-pressure plasmas. J. Appl. Phys. 1995, 77, 4285–4292. [Google Scholar] [CrossRef]
- Matsoukas, T.; Russell, M.; Smith, M. Stochastic charge fluctuations in dusty. J. Vac. Sci. Technol. A 1996, 14, 624–630. [Google Scholar] [CrossRef]
- Khrapak, S.A.; Nefedov, A.P.; Petrov, O.F.; Vaulina, O.S. Dynamical properties of random charge fluctuations in a dusty plasma with different charging mechanisms. Phys. Rev. E 1999, 59, 6017. [Google Scholar] [CrossRef] [PubMed]
- Khrapak, S.A.; Ratynskaia, S.V.; Zobnin, A.V.; Usachev, A.D.; Yaroshenko, V.V.; Thoma, M.H.; Kretschmer, M.; Höfner, H.; Morfill, G.E.; Petrov, O.F.; et al. Particle charge in the bulk of gas discharges. Phys. Rev. E 2005, 72, 016406. [Google Scholar] [CrossRef]
- Sodha, M.S.; Mishra, S.K.; Misra, S.; Srivastava, S. Fluctuation of charge on dust particles in a complex plasma. Phys. Plasmas 2010, 17, 073705. [Google Scholar] [CrossRef]
- Sodha, M.S.; Misra, S.; Mishra, S.K. Statistical mechanics of the distribution of charge on particles in complex plasmas. Phys. Scr. 2011, 83, 015502. [Google Scholar] [CrossRef]
- Hamaker, H.C. The London-van der Waals attraction between spherical particles. Physics 1937, IV, 1058–1072. [Google Scholar] [CrossRef]
- Karlstrom, K.; Jonsson, B. Intermolecular Interactions, Theoretical Chemistry, Preprint Lund University. 2013. Available online: http://www.teokem.lu.se/fileadmin/teokem/ms6.pdf (accessed on 29 December 2020).
- Vaniman, D.; Reedy, R.; Heiken, G.; Olhoeft, G.; Mendel, W. The Lunar Environment. In Lunar Sourcebook; Heiken, G.H., Vaniman, D.T., French, B.M., Eds.; Cambridge University Press: Cambridge, UK, 1991; p. 27. [Google Scholar]
- Rosenfeld, E.; Korolev, A.V.; Zakharov, A.V. Lunar nanodust: Is it a borderland between powder and gas? Adv. Space Res. 2016, 58, 560–563. [Google Scholar] [CrossRef]
- Feuerbacher, B.; Anderegg, M.; Fitton, B.; Laude, L.D.; Wills, R.F.; Grard, R.J.L. Photoemission from lunar surface fines and the lunar photoelectron sheath. Proc. Third Lunar Sci. 1972, 3, 2655–2663. [Google Scholar]
- Bernstein, I.B.; Rabinowitz, I.N. Theory of Electrostatic Probes in a Low Density Plasma. Phys. Fluids 1959, 2, 112. [Google Scholar] [CrossRef]
- Matsoukas, T. Charge distributions in bipolar particle charging. J. Aerosol. Sci. 1994, 25, 599–609. [Google Scholar] [CrossRef]
- Katzan, C.M.; Edwards, J.L. Lunar Dust Transport and Potential Interaction s with Power System Components; NASA Contractor Report 4404; National Aeronautics and Space Administration: Cleveland, OH, USA, 1991. [Google Scholar]
- Afshar-Mohajer, N.; Wu, C.-Y.; Curtis, J.S.; Gaier, J.R. Review of dust transport and mitigation technologies in lunar and Martian atmospheres. Adv. Space Res. 2015, 56, 1222–1241. [Google Scholar] [CrossRef]
Figure 1.
A microparticle lies on a plain surface under UV irradiation. During fluctuations, the charge density σs simultaneously and approximately equally increase both on the dust particle itself and on some annular portion of the R-r surface around it (grey area). Fc—the Coulomb force, FvdW—the van der Waals force, and Fg—the gravity force.

Figure 2.
A dust particle is located in fluctuating areas on a dielectric surface. The charge sign of such a dust particle coincides with that of the region of its location. E corresponds to the field strength of the charge fluctuations field and has a horizontal component.
Figure 2.
A dust particle is located in fluctuating areas on a dielectric surface. The charge sign of such a dust particle coincides with that of the region of its location. E corresponds to the field strength of the charge fluctuations field and has a horizontal component.

Publisher’s Note: MDPI stays neutral with regard to jurisdictional claims in published maps and institutional affiliations. |
© 2021 by the authors. Licensee MDPI, Basel, Switzerland. This article is an open access article distributed under the terms and conditions of the Creative Commons Attribution (CC BY) license (http://creativecommons.org/licenses/by/4.0/).
Share and Cite
MDPI and ACS Style
Zakharov, A.V.; Rosenfeld, E.V. Charge Density Fluctuations on a Dielectric Surface Exposed to Plasma or UV Radiation. Plasma 2021, 4, 201-213. https://0-doi-org.brum.beds.ac.uk/10.3390/plasma4020012
AMA Style
Zakharov AV, Rosenfeld EV. Charge Density Fluctuations on a Dielectric Surface Exposed to Plasma or UV Radiation. Plasma. 2021; 4(2):201-213. https://0-doi-org.brum.beds.ac.uk/10.3390/plasma4020012
Chicago/Turabian StyleZakharov, Alexander V., and Eugene V. Rosenfeld. 2021. "Charge Density Fluctuations on a Dielectric Surface Exposed to Plasma or UV Radiation" Plasma 4, no. 2: 201-213. https://0-doi-org.brum.beds.ac.uk/10.3390/plasma4020012