Article

Inhalation Exposure to PCB from Contaminated Indoor Air—How Much Is Absorbed into the Blood?

1
North Rhine-Westphalia State Agency for Nature, Environment and Consumer Protection, Leibnizstr. 10, D-45659 Recklinghausen, Germany
2
Institute and Clinic for Occupational, Social and Environmental Medicine, University Hospital, LMU Munich, Ziemssenstr. 1, D-80336 Munich, Germany
3
Eco-Luftqualität+Raumklima, Nattermannallee 1, D-50829 Köln, Germany
*
Author to whom correspondence should be addressed.
Submission received: 25 May 2021 / Revised: 27 July 2021 / Accepted: 13 August 2021 / Published: 1 September 2021
(This article belongs to the Special Issue Pollutants in Indoor Air)

Abstract

:
Polychlorinated biphenyls (PCBs) were used in many construction products until their banning in the 1970s and 1980s. Nonetheless, exposure to PCBs from contaminated indoor air is still an important public health issue. The aim of our study was to estimate the contribution of PCB congeners in indoor air to the levels of PCBs in human blood. We analyzed all 209 PCB congeners in the blood of 35 individuals exposed to PCBs from contaminated indoor air. For each individual, we measured the six marker indicators PCB28, PCB52, PCB101, PCB138, PCB153 and PCB180 in indoor air at the workplace. Statistically significant correlations between PCB-contaminated indoor air and the existence of the sum of mono-, di-, tri-, tetra- and pentachlorinated biphenyls (∑PCB1–127) in the blood of the exposed individuals were found. We quantified the proportions of PCBs that are absorbed into the blood via inhalation of contaminated indoor air. Inhalation of PCBs from contaminated indoor air, especially in children, adolescents and younger adults, may lead to PCB blood burdens that are higher than general PCB background levels or in approximately the same range.

1. Introduction

Polychlorinated biphenyls (PCBs) are synthetic products of solely anthropogenic origin. These chemicals were commonly used in commercial mixtures with different levels of chlorination. The PCB substance group theoretically is composed of 209 different compounds. Each PCB congener has a common structure of a biphenyl molecule with 1 to 10 chlorine atoms attached. Approximately 1,300,000 tons of PCBs were produced over a period of approximately 60 years worldwide, with a global production peak in 1970. The main producers internationally were the companies Monsanto (St. Louis, MO, USA) and Bayer (Leverkusen, Germany) [1]. PCBs have been used for various technical applications, such as transformers, capacitors, paints, sealants and flame retardants. Because of their very harmful effects on the environment and human health, PCBs were banned in most states in the 1970s and 1980s.
PCBs can cause a variety of dose-dependent adverse health effects in various human tissues and organs. The main health effects of PCBs are neurotoxicity, immunotoxicity, reproductive toxicity, thyroid effects, liver effects, skin effects, cardiovascular effects, diabetes and carcinogenic effects [2,3,4]. The International Agency for Research on Cancer (IARC) has classified PCBs as carcinogenic to humans (Group 1) [5].
Before their ban, large quantities of PCBs were released into the environment, and they also entered the food chain [2,3,6]. Due to their lipophilia, PCBs accumulate mainly in high-fat foods. In the absence of specific exposure, the general population is usually exposed to PCBs via food [2,3]. Because of management measures such as the implementation of maximum levels in food products exposure to PCBs in food has decreased significantly over the last decades [3,7]. The European Food Safety Authority (EFSA) reported a 64% reduction of PCBs in European raw milk and dairy products within 15 years [2]. In some countries, like Italy, dietary exposures to PCBs in the first decade of the 2000s were estimated to be 30% lower than found in the mid-1990s [8]. While exposures to PCBs via food have been decreasing over time, this reduction has been slower in some countries in recent years, with a flattening out over the preceding decade [3].
With decreasing PCB levels in food, other exposure pathways, such as the inhalation of PCBs from contaminated indoor air, have become more important in recent years [9,10]. Lehmann et al. [10] estimated that the extent of inhalation exposure to PCBs in some indoor settings might be at least as great as typical dietary exposure. Saktrakulkla et al. [7], who found that PCB exposure through inhalation could currently be as high as PCB exposure through diet, described similar relationships. Exposure to PCBs from contaminated indoor air is still an important public health issue, even after PCBs were banned several decades ago. PCB-containing compounds are still found in buildings, which leads to an accumulation of these substances in the indoor air of public buildings and private homes [11,12,13,14,15]. It is well known that PCBs from indoor air are absorbed into the human blood. Increased PCB levels in indoor air lead to a significant increase in PCBs, especially congeners such as PCB28, PCB52 and PCB101, in the blood of exposed individuals [16,17,18,19,20,21].
However, the proportion of inhaled PCBs among the total PCB burden has not yet been published based on empirical data from human blood. This is because for such a determination, knowledge about the concentrations of all incorporated relevant PCB congeners is essential. To determine the proportion of inhaled PCBs among total PCB exposure, it is necessary to measure a variety of congeners, preferably all 209 PCB (∑PCB1–209) congeners in human blood. The analytical results of all 209 PCB congeners in human blood have been published in only a few studies [22,23]. In 2017, our research group presented the results of measurements of all 209 PCBs (∑PCB1–209) in the blood of 86 individuals from two different regions in Germany [24]. A subgroup of 35 individuals in this study group had been exposed to PCBs in contaminated indoor air at the workplace. In Kraft et al. [13], we presented the relationship between exposure to monochlorinated, dichlorinated and trichlorinated biphenyls (∑PCB1–39) in indoor air and blood concentrations of the 35 individuals included in the study. However, we did not measure all 209 PCB congeners in indoor air. This study provides an approach to quantify the proportion of inhaled PCBs based on indicator congeners in indoor air and all 209 PCBs (∑PCB1–209) in the blood of exposed individuals.

2. Materials and Methods

The individuals (n = 35) in our study group had been working in PCB-contaminated offices in North-Rhine Westphalia, Germany for a minimum of two years. The method of recruitment is outlined in Kraft et al. (2018). Participation was voluntary and the privacy of participants was protected. The individuals were asked to complete a questionnaire with information regarding age, sex, dietary habits, daily average stay in the office rooms and the total duration of office work per week. The study concept was approved by the commissioner responsible for data protection and by the ethics committee of the Medical Association North-Rhine, Germany (registration number: 2013152). All participants provided written informed consent. The study was performed according to the recommendations in the Declaration of Helsinki (1964).The indoor air and blood sampling methods are described in detail in Kraft et al. [13,24]. Indoor air and blood sampling took place within three months during the winter period with constant temperatures between 20 °C and 22 °C in most (>85%) of the rooms examined. PCB contamination in the indoor air was measured in 35 office rooms that were frequented by the participants (n = 35). Indoor air measurements were taken during working hours once for each office room. The rooms were not mechanically ventilated. Total PCB exposure analysis was carried out by analyzing the six marker congeners PCB28, PCB52, PCB101, PCB138, PCB153 and PCB180 in indoor air. The sum of the concentrations of these marker congeners multiplied by a factor of 5 (∑PCB28,52,101,138,153,180×5) represented the total PCB load in the indoor air of the office rooms [13].
Blood samples of the individuals in the PCB-contaminated office rooms were obtained by venipuncture by the end of a working day [13]. Through this procedure, all congeners, even very volatile congeners and congeners with very short half-lives in the blood, should be detected. All 209 congeners (∑PCB1–209) were analyzed in whole blood samples of the individuals. Details of the analytical quantification are described in Kraft et al. [24].
Statistical evaluation of the data was conducted with SPSS Statistics for Windows (Version 27.0, IBM Corp., Armonk, NY, USA) and GraphPad Prism 7 (Version 7, GraphPad Software, Inc., San Diego, CA, USA). Concentrations less than the limit of quantification (LOQ) were substituted with the LOQ/2. Spearman’s correlation coefficients were calculated to test for the association of indoor air concentration with blood serum concentration. A simple linear regression model was used (without adjustment for any covariates) to predict blood serum concentration according to indoor air exposure. The significance level (α) was set to 0.05 in all cases.

3. Results

In our study, we analyzed all 209 PCBs (∑PCB1–209) in the blood of 35 individuals (20 women, 15 men) exposed to PCB-contaminated indoor air. In each individual’s office, the six marker congeners PCB28, PCB52, PCB101, PCB138, PCB153 and PCB180 were measured in indoor air. The aim of this evaluation was to determine associations between PCBs in the indoor air and in the blood of exposed individuals with correlation analyses. In addition, we aimed to quantify the proportions of PCBs absorbed into the blood from indoor air.

3.1. Study Group

The median age of the 35 study participants was 58 years. The youngest participant was 28 years and the oldest was 69 years (more details in [13]). The individuals had been working in their offices for 2 to 44 years (median: 27 years). The median weekly stay in the offices was 40 h (minimum: 15 h, maximum: 50 h).

3.2. PCB in Indoor Air
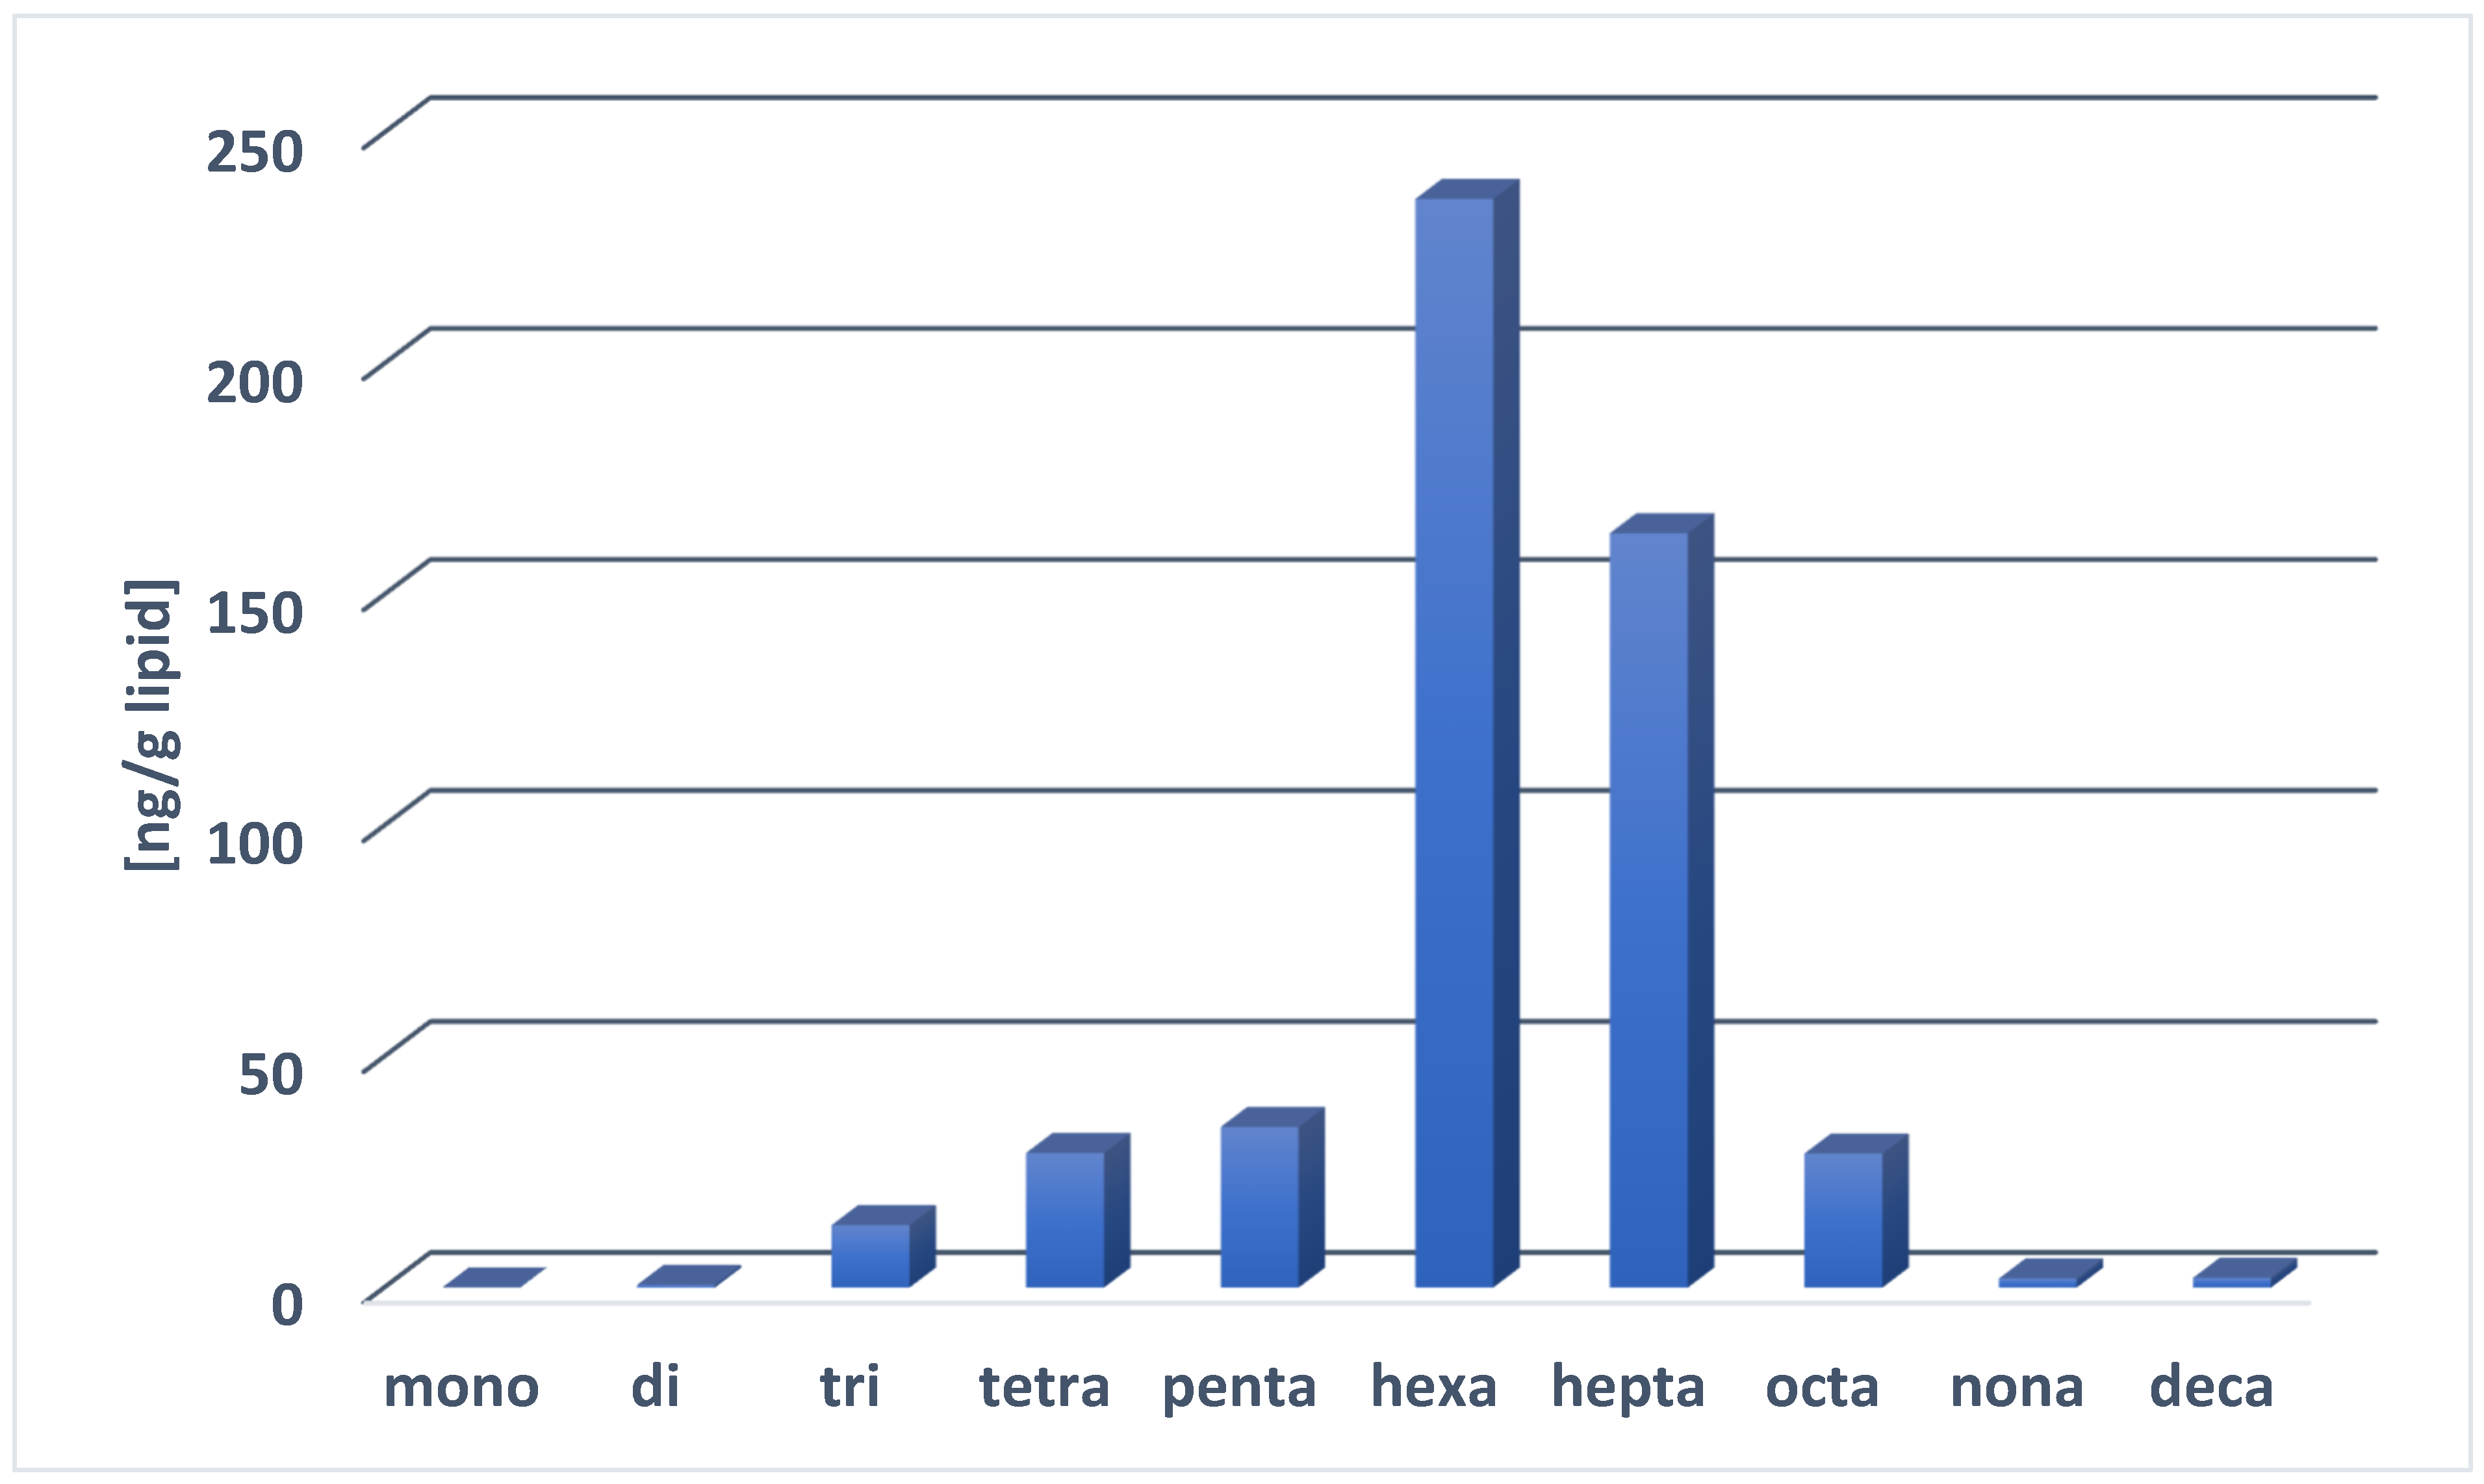
The median total PCB concentration (∑PCB28,52,101,138,153,180×5) in the indoor air of the offices (n = 35) was 479 ng/m3 (minimum: 92 ng/m3; maximum: 2797 ng/m3) [13]. The highest concentrations of single congeners were measured in an office with 305 ng PCB52/m3 and in another office with 214 ng PCB28/m3. Of the marker indicators, the lower chlorinated congeners PCB28, PCB52 and PCB101 dominated the PCB concentration in indoor air. The sum of the median concentrations of PCB28, PCB52 and PCB101 accounted for approximately 95% of all six measured marker PCBs [13].

3.3. PCB in Blood

The median total PCB burden (∑PCB1–209) in the blood of the individuals (n = 35) was 559 ng/g lipid weight (l.w.) (minimum: 119 ng/g l.w.; maximum: 2152 ng/g l.w.). Of the marker congeners, the higher-chlorinated congeners PCB153, PCB180 and PCB138 showed the highest concentrations. PCB28 (median: 12 ng/g l.w.) was the most represented congener in the group of the lower-chlorinated marker PCBs, followed by PCB52 (median: 2.3 ng/g l.w.) and PCB101 (median: 1.6 ng/g l.w.) (Table 1).
The entire PCB spectrum grouped by homologs according to chlorination levels showed a PCB blood burden attributed mainly to trichlorinated to octachlorinated biphenyls (Figure 1). The highest median levels were found for hexachlorinated (236 ng/g l.w.) and heptachlorinated (163 ng/g l.w.) biphenyls. The levels of tetrachlorinated, pentachlorinated and octachlorinated biphenyls were in the same median range (between 29 ng/g l.w. and 35 ng/g l.w.). The trichlorinated congeners showed a median concentration of 14 ng/g l.w., which is quite similar to the median concentration of trichlorinated PCB28 (13 ng/g l.w.). Congeners from the monochlorinated (<0.05 ng/g l.w.), dichlorinated (<0.6 ng/g l.w.), nonachlorinated (2.0 ng/g l.w.) and decachlorinated (<2.1 ng/g l.w.) groups existed in quite low median concentrations in the blood samples of the study group (n = 35).

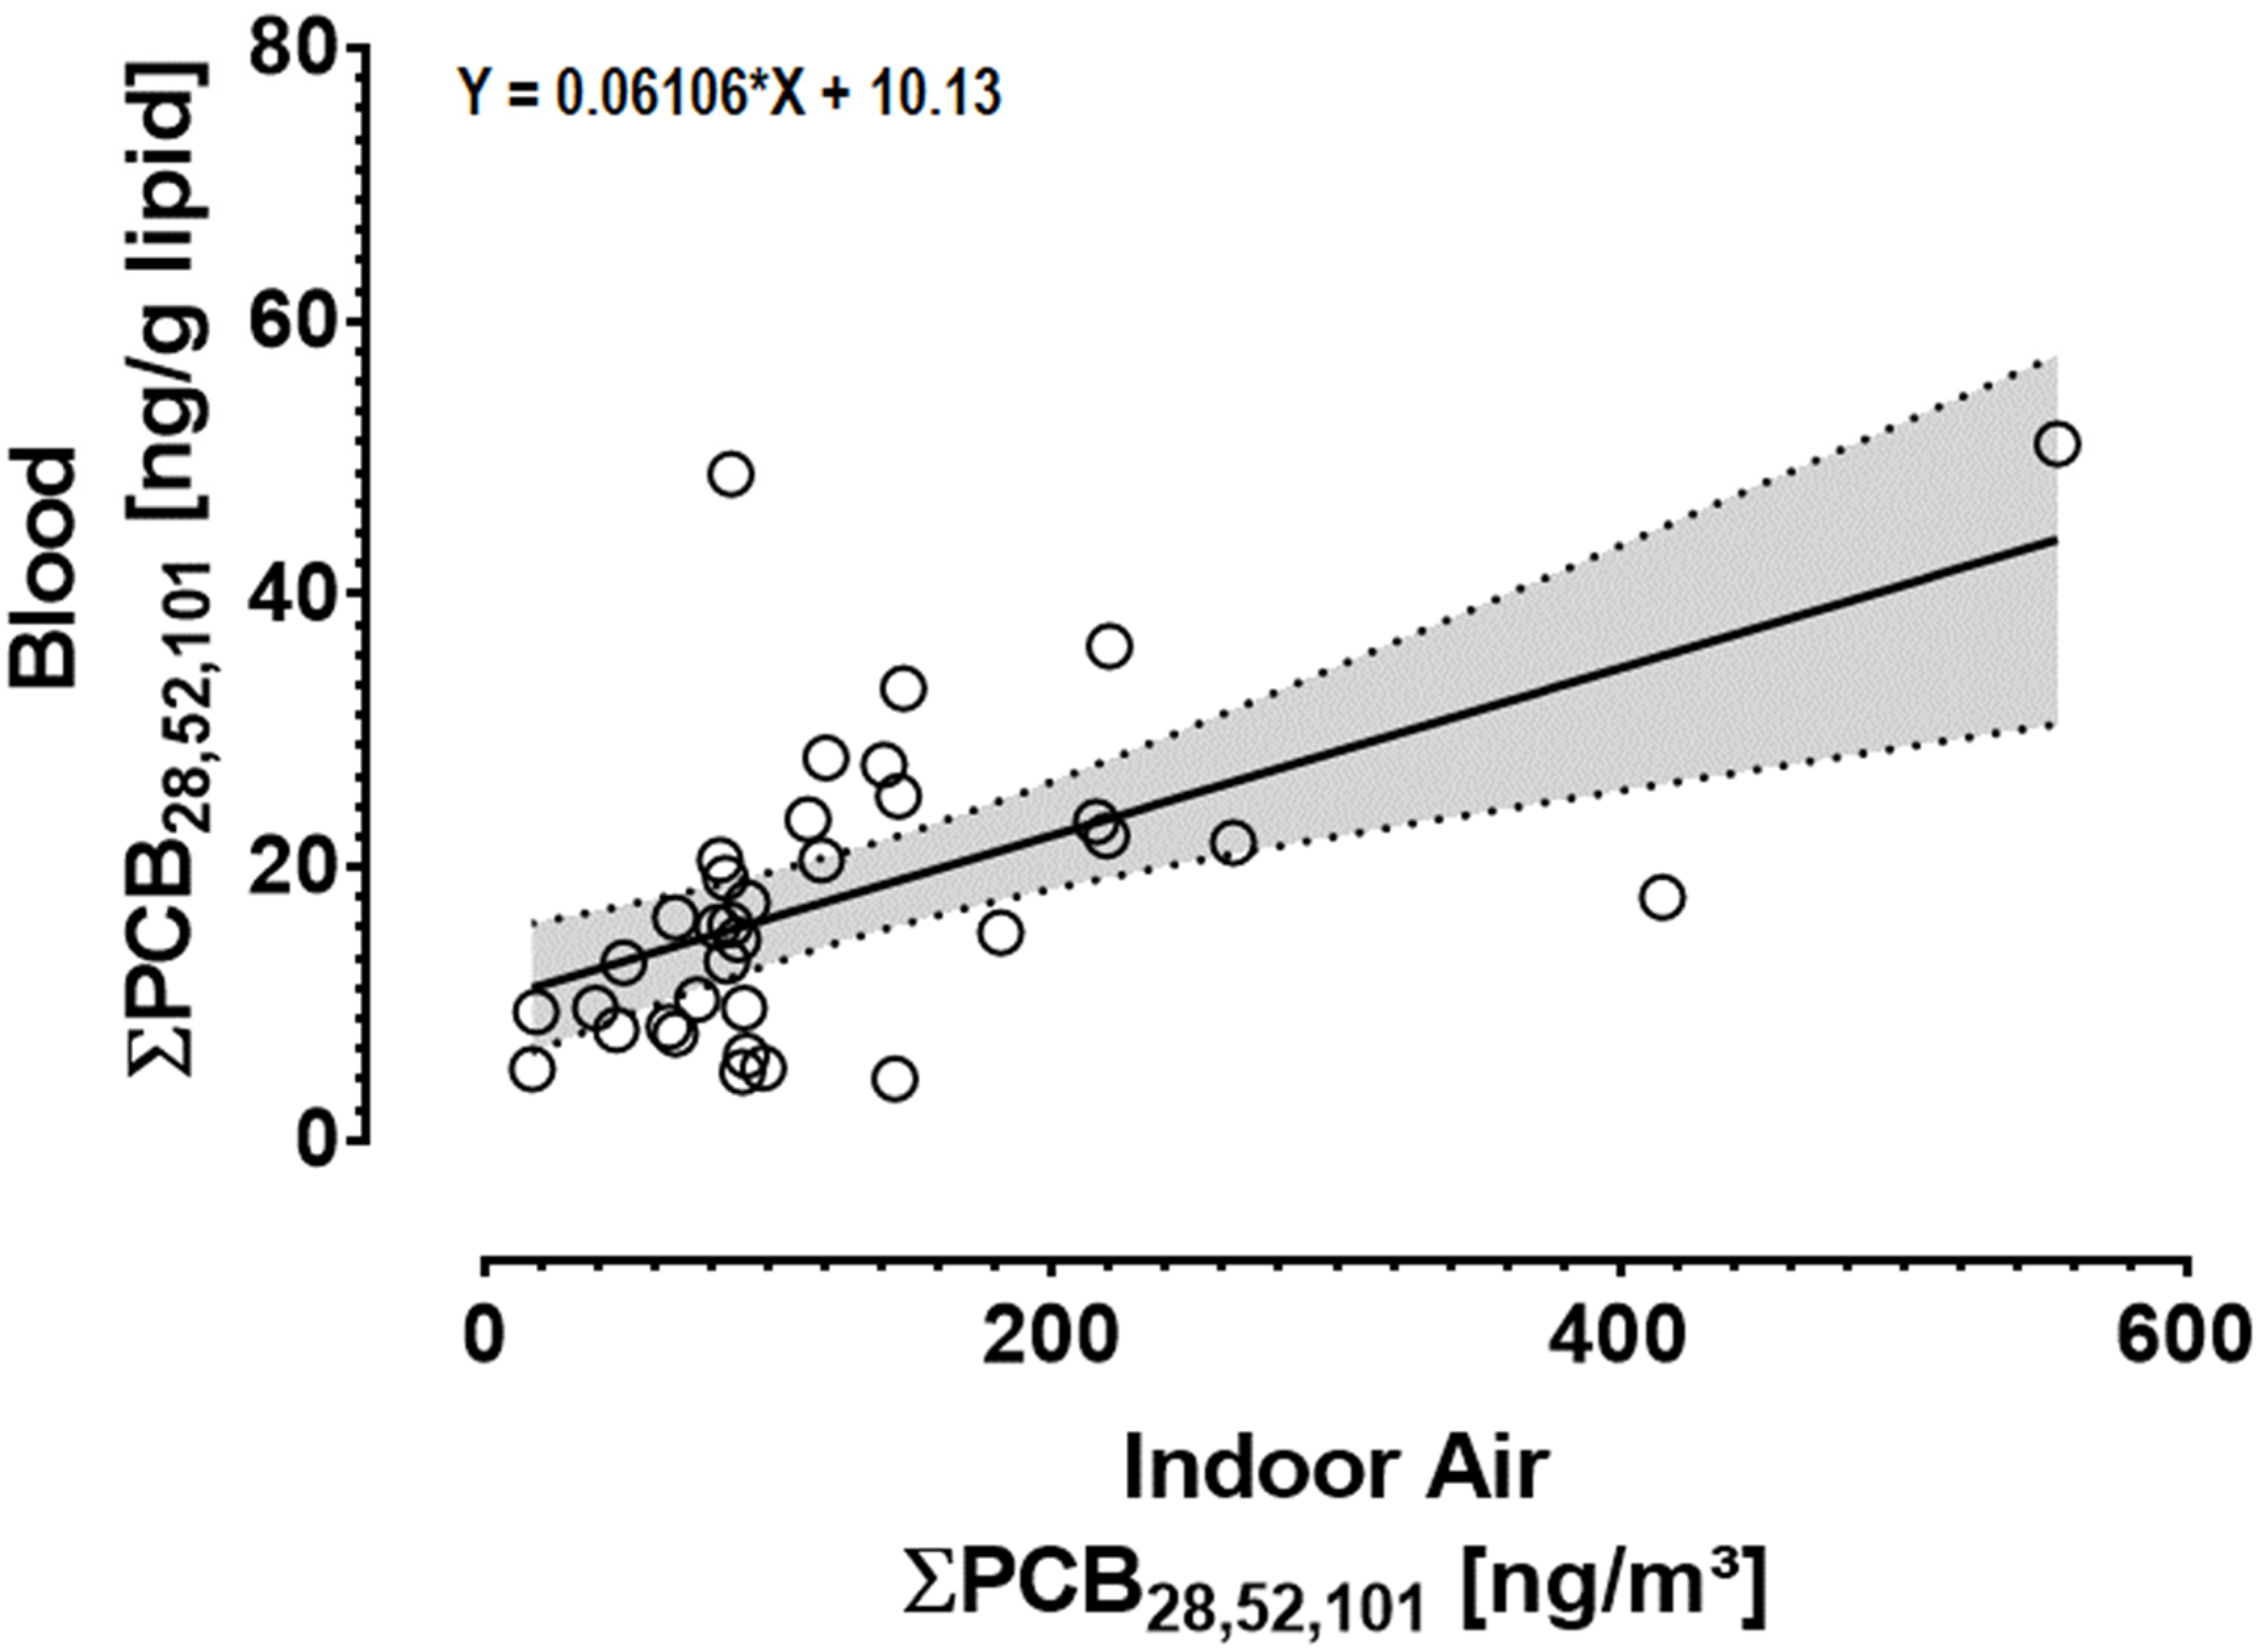
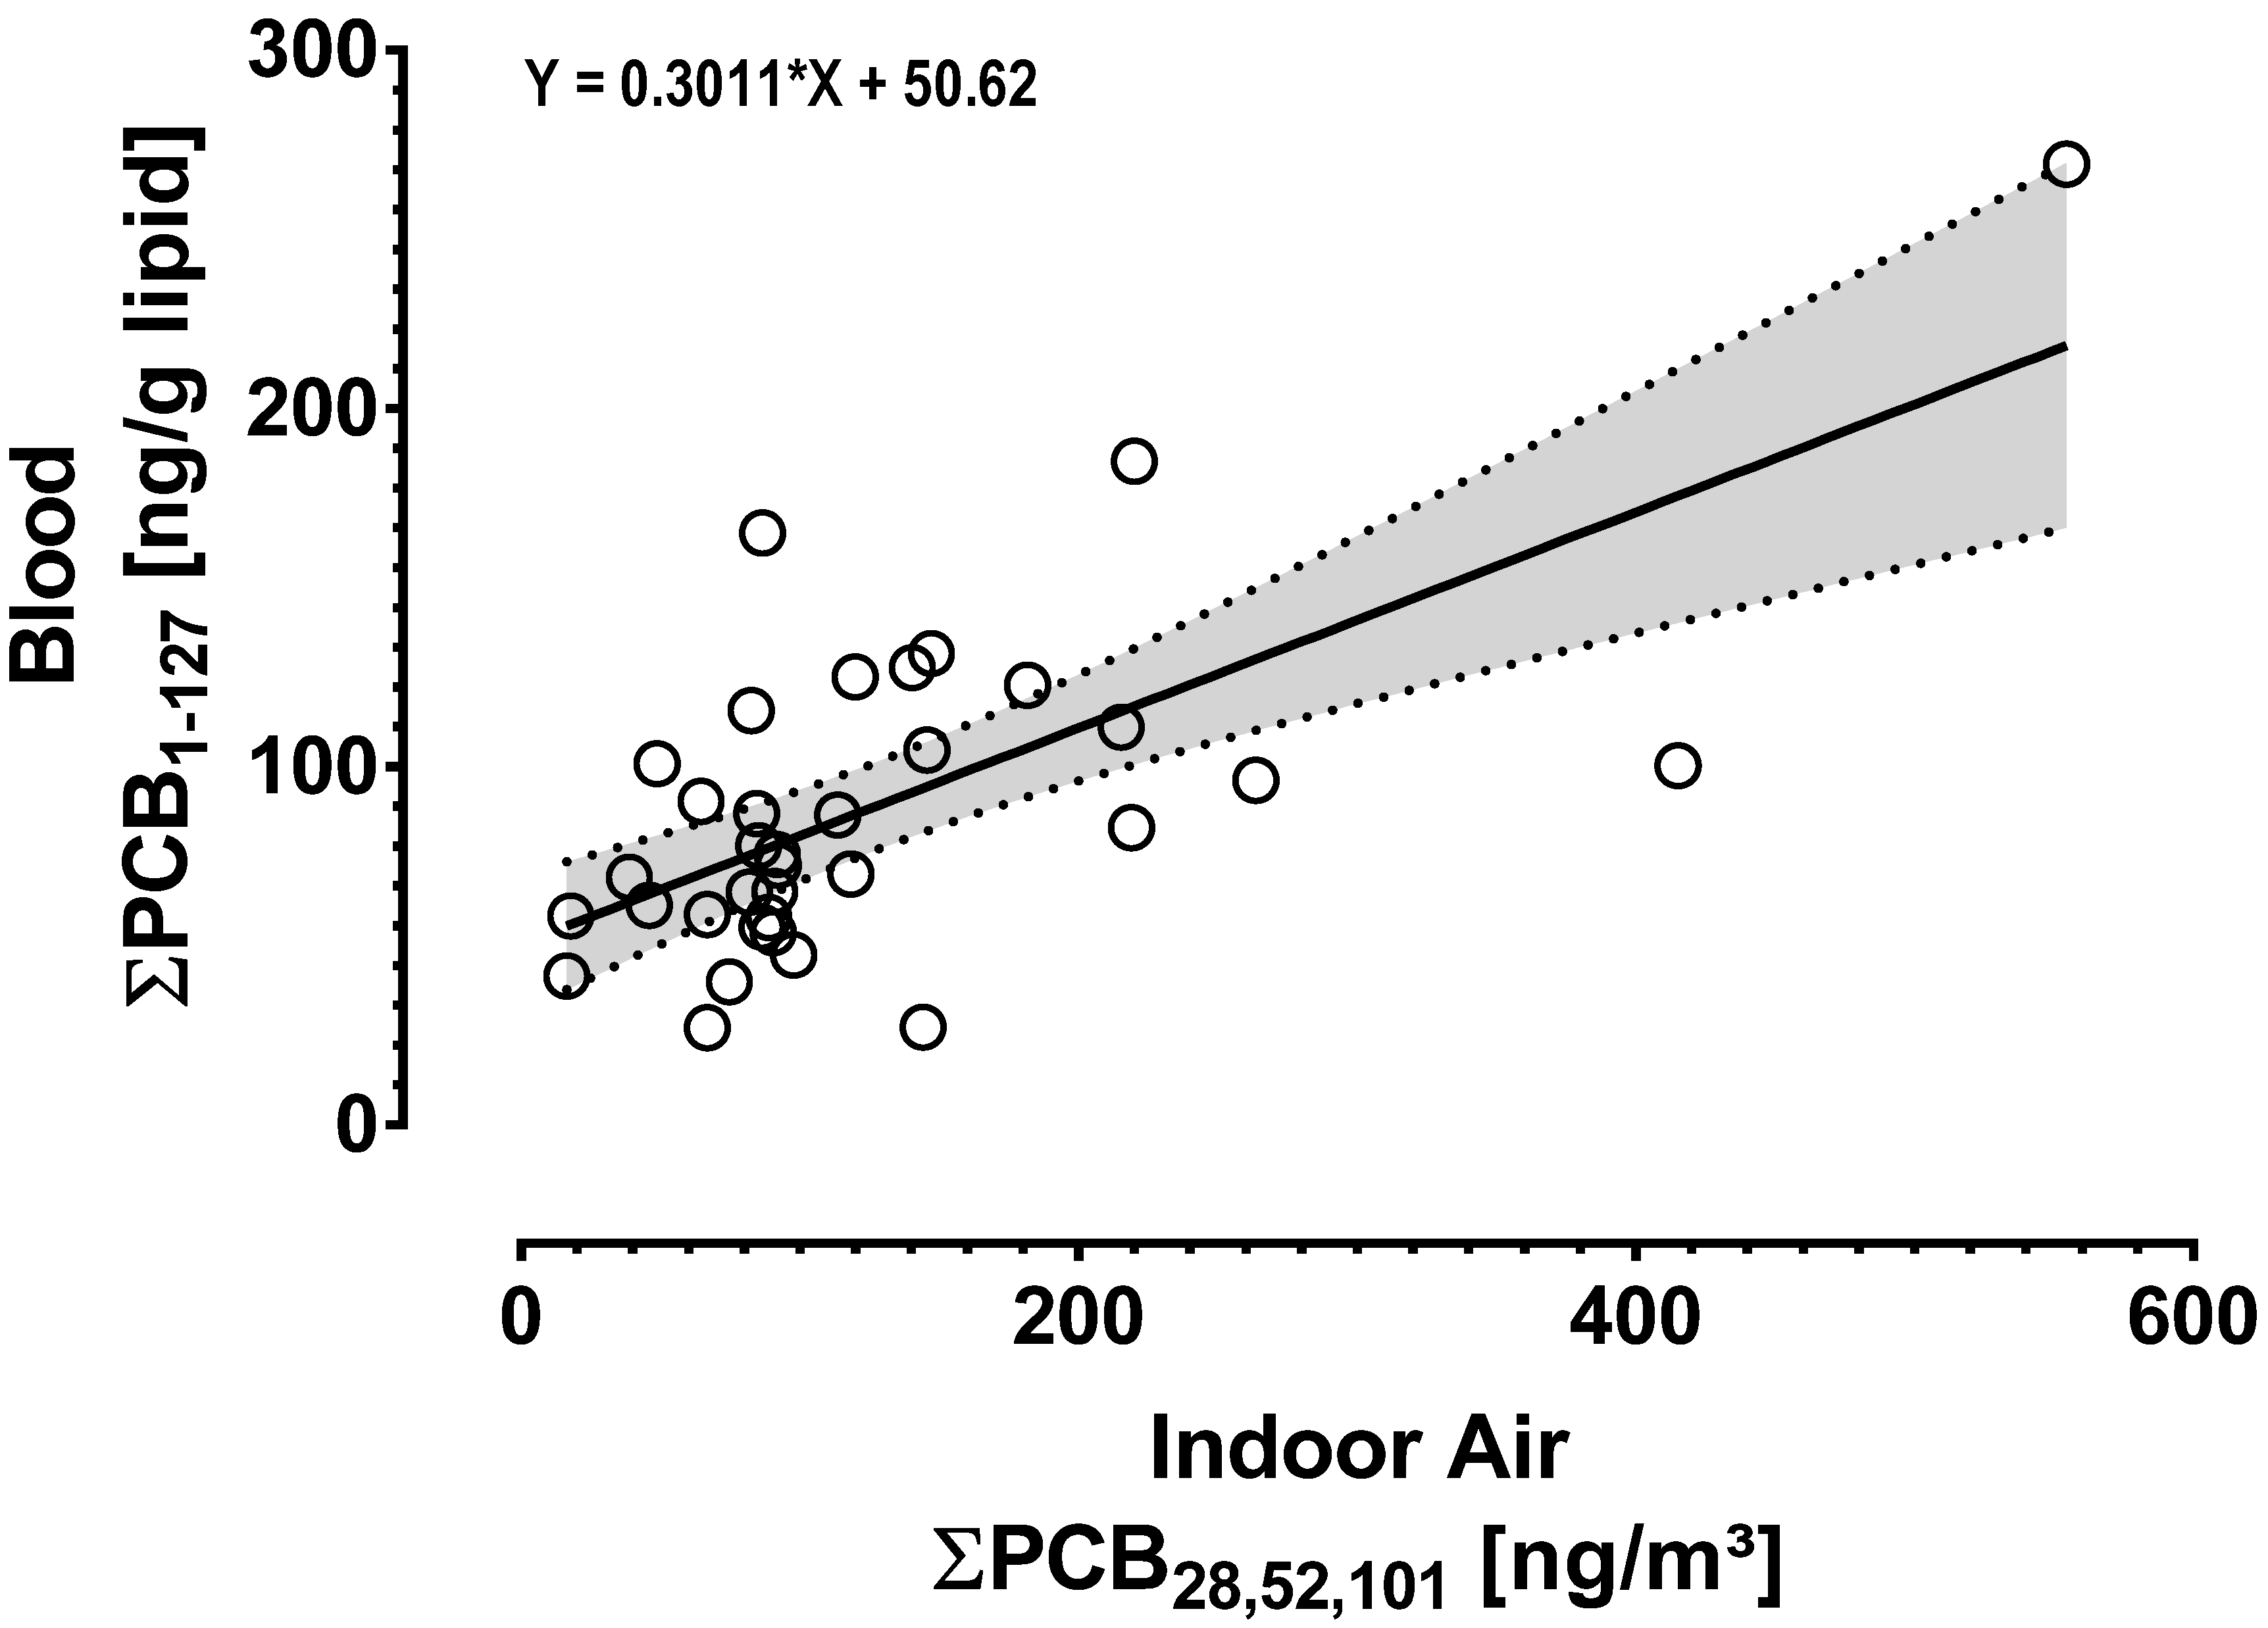
3.4. Correlation between PCBs in Indoor Air and in the Blood of Exposed Individuals

To determine whether there is an association between PCB exposure in indoor air and the concentrations of PCB in the blood samples, various correlation analyses were conducted. Exposure to PCB28, PCB52 and PCB101 in indoor air was correlated with the levels of each of these three congeners in the blood. For all three individual congeners, a statistically highly significant correlation (p < 0.001), with R-values from 0.534 to 0.686 (Table 2), between the respective congeners in indoor air and in blood was found. The correlation of the sum of the three indicator congeners (∑PCB28,52,101) in indoor air with the blood levels of these three congeners also exhibited a highly significant correlation (R: 0.587, p < 0.001). The blood burden of the three indicator congeners PCB28, PCB52 and PCB101 is therefore significantly associated with exposure to these three congeners in indoor air, suggesting that indoor air is an important exposure pathway.
PCB28, PCB52 and PCB101 are indicator congeners for PCBs from the trichlorinated, tetrachlorinated and pentachlorinated compounds. In contrast to indoor air measurements, we analyzed all PCB congeners in the blood samples. Therefore, a correlation between exposure to ∑PCB28,52,101 in indoor air and the blood burden of all congeners ranging from monochlorinated to pentachlorinated biphenyls (∑PCB1–127) was tested. Again, a highly significant correlation was identified (R: 0.535, p = 0.001). An almost identical result was found when the total PCB concentration (∑PCB28,52,101,138,153,180×5) in indoor air was taken into account instead of the three lower-chlorinated congeners (R: 0.542, p = 0.001). A statistically significant correlation was also found when the total PCB load (∑PCB28,52,101,138,153,180×5) in the indoor air was compared with the exposure to mono- to tetrachlorinated biphenyls (∑PCB1–81) or mono- to trichlorinated biphenyls (∑PCB1–39) in the blood (Figure 2). In contrast, there was no statistically significant correlation between the sum of all mono- to hexachlorinated congeners (∑PCB1–169) in the blood and the total exposure to PCBs (∑PCB28,52,101,138,153,180×5) in indoor air. Similarly, there was no statistically significant correlation between the total PCB (∑PCB1–209) burden in the blood and the total PCB load in indoor air (∑PCB28,52,101,138,153,180×5). Thus, there is a clear correlation between PCB-contaminated indoor air and the exposure to the sum of the concentrations of mono- to pentachlorinated biphenyls (∑PCB1–127) in the blood of exposed individuals.

3.5. Quantification of PCBs Absorbed into the Blood from Indoor Air

A linear regression model was used to quantify the concentrations of PCBs in the blood of individuals depending on their exposure to PCBs in indoor air. Exposure to the sum of concentrations of PCB28, PCB52 and PCB101 (∑PCB28,52,101) of 100 ng/m3 in indoor air resulted in a blood burden of these three congeners of 16 ng ∑PCB28,52,101 per gram of blood lipids (see Figure 3; Table 3). A concentration of 300 ∑PCB28,52,101/m3 led to an increase of 29 ng ∑PCB28,52,101 per gram of blood lipids.
Exposure to ∑PCB28,52,101 in indoor air is highly correlated with the blood burden of mono- to pentachlorinated biphenyls (∑PCB1–127) (see Section 3.4). In the next calculation step, the extent to which the blood levels of mono- to pentachlorinated biphenyls (∑PCB1–127) correspond to the exposure to the sum of the three indicator congeners (∑PCB28,52,101) in the indoor air was assessed (Figure 4). An indoor air concentration of 100 ng ∑PCB28,52,101/m3 led to a blood burden of 81 ng ∑PCB1–127 per gram blood lipids. Moreover, 300 ng ∑PCB28,52,101/m3 in the indoor air lead to a blood burden of 141 ng ∑PCB1–127 per gram blood lipids (Table 3).
Because exposure to PCBs from contaminated indoor air is not usually limited to only the three single marker congeners, the results of the regression analysis were transferred to real indoor air settings. These results with regard to indoor air exposure to ∑PCB28,52,101 are converted to the total PCB concentration (∑PCB28,52,101,138,153,180×5). This calculation step is of interest, as in many countries, the determination of PCB indoor air contamination is based on this convention. For this purpose, two office rooms in this study (median: Room A; maximum: Room B) were used as an example for the calculation (Table 4). The calculations showed that exposure to PCB-contaminated indoor air with 2797 ng and 479 ng ∑PCB28,52,101,138,153,180×5/m3 resulted in a blood burden of 218 ng ∑PCB1–127 and 78 ng ∑PCB1–127, respectively, per gram blood lipids in the exposed study population.
Based on our regression data, the full range of PCB indoor air contamination (minimum: 92 ng/m3; maximum: 2797 ng/m3) of this study was used to estimate the effect on the PCB blood burden of exposed individuals. The result of this estimation is shown in Figure 5. For instance, a concentration of 300 ng/m3 in indoor air leads to a blood burden of approx. 70 ng ∑PCB1–127/g blood lipids. At 1000 ng/m3, the PCB concentration in the blood increases to approximately 110 ng ∑PCB1–127/g blood lipids.

4. Discussion

We studied the effect of PCB-contaminated indoor air on the PCB blood burden of exposed individuals. Using our measurement data, we were able to quantify which proportions of inhaled PCBs enter the blood of individuals exposed to PCB in indoor air. Several studies have shown that lower-chlorinated PCBs in indoor air lead to a statistically significant increase in these congeners in the blood [16,18,19,20,21,25,26,27]. Our study results showed the same associations but additionally can be used for quantification of absorbed PCBs.
In our study, single measurement data for exposure to PCBs in blood and in indoor air were available for all individuals. Studies with the detection of PCB levels in indoor air and in the blood of exposed individuals in parallel are rather rare. Pedersen et al. [21] analyzed 27 PCB congeners in the blood of 15 individuals (median age: 50 years) who had been working for 4 to 25 years in a building contaminated by joint sealants. The mean total PCB concentration (∑PCB28,52,101,138,153,180×5) in the indoor air was 686 ng/m3 (minimum: 70 ng/m3, maximum: 1500 ng/m3) and thus similar to that identified in our study (mean: 671 ng/m3). The median PCB plasma concentrations were 0.11 µg/L and 0.016 µg/L for PCB28 and PCB52, respectively. After conversion (s. Kraft et al. [24]), this corresponds to 16 ng/g l.w. for PCB28 and 2.3 ng/g l.w. for PCB52 and is therefore in the same range as the median concentrations identified in our study (PCB28: 12 ng/g l.w.; PCB52: 2.3 ng/g l.w.). Thus, our results were confirmed at similarly high PCB levels in indoor air and in a study group with a similar age pattern. Compared to the control group (n = 30) of the study by Pedersen et al. [21], which was conducted in non-PCB-contaminated buildings, the exposure to seven PCB congeners ranging from tri- to pentachlorinated biphenyls was associated with significantly higher levels in the blood of exposed individuals. This effect was also observed in the respective homolog sums of tri- and tetrachlorinated biphenyls as well as pentachlorinated biphenyls but not for the sum of hexa- and heptachlorinated biphenyls, which corresponds very well with our data.
Associations between PCBs in indoor air and in the blood of residents from communities with high levels of environmental pollution were analyzed by Fitzgerald et al. [28]. The results from indoor air and serum samples from 170 individuals aged between 55 and 74 years showed statistically significant associations between concentrations in indoor air and serum for PCB28 and PCB105. PCB levels in indoor air (∑12 PCB congeners) were in the range of 0.6 to 233 ng/m3 (mean value: 14 ng/m3). However, the comparability to our data is very limited since Fitzgerald et al. [28] mainly measured higher-chlorinated congeners (hexa- to decachlorinated PCBs) in the indoor air and in the blood of the study group. An exception is PCB 28, which had a mean concentration of 0.748 ng/m3 in the indoor air, which is significantly lower than that in our study (mean: 29 ng/m3). The mean concentration of PCB 28 in blood in the study by Fitzgerald et al. [28] was 8.5 ng/g l.w. Compared to our study (mean: 13 ng/g l.w.), the difference was not as high as expected. This difference may be due to the high environmental PCB28 burden in the Hudson River region.
Studies that quantify PCBs absorbed from indoor air are very limited and they rely on assumptions rather than empirically collected measurement data. Based on data on exposure to PCBs in indoor air, outdoor air and food, Ampleman et al. [29] calculated the inhalation of PCBs and compared the level to the total PCB intake via food. In the homes and schools of 78 adolescent children and their mothers (n = 68), 293 measurements of PCB concentrations in indoor and outdoor air were conducted. Diet-related PCB exposure was modeled using data from the Canadian Total Diet Survey (TDS) and the National Health and Nutrition Examination Survey (NHANES). The nutritional PCB exposure was higher than that associated with indoor air. In the case of single congeners, such as PCB 40, PCB 41 or PCB 52, inhalation exposure was up to one-third of the total exposure from diet and inhalation. However, in the study of Ampleman et al. [29], the PCB concentrations (∑PCB201) in the indoor air were many times lower (mean: 8.4 ng/m3) than those in our study (mean: 671 ng/m3). Even at comparatively low levels of PCBs in indoor and outdoor air, Ampleman et al. [29] showed that the inhalation of PCBs may be a relevant pathway of total PCB exposure from all relevant sources.
Marek et al. [12] measured all 209 PCB congeners (∑PCB1–209) and 72 hydroxylated PCB compounds in the indoor air of 6 school buildings of different construction ages in the USA. The concentrations in indoor air ranged from 0.5 to 194 ng/m3 (∑PCB1–209) and between 0.004 and 0.67 ng/m3 (∑72OH-PCB). Based on data from Ampleman et al. [29], the authors calculated the amount of PCBs ingested via food and compared the obtained values with those inhaled via indoor air. Children attending the school with the highest PCB concentrations in indoor air (median: 112 ng/m3) had a calculated annual dose (µg/year) of PCBs from indoor air in the same range (or even higher) as the PCB exposure that comes from the diet. Based on data on PCB background levels and different exposure assumptions, Lehmann et al. [10] found that the extent of inhalation exposure to PCBs in some indoor settings may be at least as large as typical dietary exposure among children. While these calculations were carried solely on assumptions, such a model estimate may provide evidence that the inhalation path is increasingly important. This is true especially for children; elderly people have been exposed to high PCB levels over many decades, mainly through food.
Elevated levels of PCBs in indoor air are associated with an increase in these compounds in human blood. For different exposure scenarios in indoor air, we calculated the PCB burden in the blood of our study group. We showed that exposure, for instance, to 479 ng/m3 (total PCB = ∑PCB28,52,101,138,153,180×5) via indoor air, led to an increase of 78 ng (∑PCB1–127) per gram blood lipids. In a simplified scheme, we present the PCB burden in the blood depending on the PCB concentration in the indoor air (Figure 5). In a previous publication by our research group, we showed that the total exposure to PCB in human blood can be calculated very well by using the three marker congeners (PCB138, PCB153 and PCB180) and multiplying the sum of the concentrations by a factor of 2 [24]. This convention applies only to individuals with no additional exposure to PCBs, such as from contaminated indoor air. Comparing our data to that of individuals from Germany with usual exposure shows that PCB inhalation would contribute significantly to individual blood burden. Fromme et al. [30] analyzed blood samples of 42 randomly selected individuals from Germany between 20 and 68 years of age. The median concentration of total PCB exposure was 254 ng/g l.w. For instance, exposure to approximately 300 ng PCB/m3 in indoor air would result in an extra PCB blood burden of approximately one-third of the usual PCB background exposure. When comparing our data with the background PCB burden of the population, it must be considered that the total body burden of PCBs generally increases with age [3]. For example, Apostoli et al. [31] found an increase of 1.7 µg/L in concentrations of PCBs in whole blood for every 10-year increase in age. For older people, therefore, the relative additional contribution of PCBs from indoor air to the total PCB blood burden will be significantly lower than that of younger people. When comparing our data on PCB blood burden, one has to consider studies with stratification of age. Schettgen et al. [32] analyzed the concentrations of PCB138, PCB153 and PCB180 in plasma samples of 2750 individuals from Germany aged between 6 and 65 years. Converted to concentrations according to blood lipids (s. [24]), the median total PCB values for adults were 109 ng/g l.w. (18–25 years), 143 ng/g l.w. (26–35 years), 263 ng/g l.w. (36–45 years), 451 ng/g l.w. (46–55 years) and 689 ng/g l.w. (56–65 years). For children, the background PCB levels are lower. The total median PCB (∑PCB138,153,180×2) exposure of German children (n = 1134) aged between 3 and 17 years is between 50 and 63 ng/g blood lipids [33]. From these data, it becomes clear that the proportion of PCBs from indoor air is particularly high compared to the general background burden of the population, especially among children. Exposure to approximately 300 ng PCB/m3 in indoor air would lead to a concentration of approximately 70 ng ∑PCB1–127 per gram blood lipids, which is higher than the background PCB levels in children from Germany. In young adults, such indoor air exposure would account for approximately two-thirds of the background exposure. At a concentration of 1000 ng/m3 in indoor air, the blood concentration would be increased up to 110 ng ∑PCB1–127/g blood lipids, which is two times higher than the typical background PCB level in children. In young German adults up to 25 years of age, the exposure due to inhalation would be as high as that due to the general background burden. In older individuals, this proportion decreases continuously with age. In the 56–65 age group, even indoor air exposure to 1000 ng PCB/m3 would account for only approximately 16% of the general background level.
Our data on the absorption of PCBs from indoor air were obtained from a PCB-exposed, older study group (median: 58 years). We also assessed the quantified PCB concentrations in younger population groups. The PCB exposure in the population is significantly higher in older than in younger people with respect to the higher-chlorinated PCBs (PCB138, PCB153, PCB180). Data on age dependency for low-chlorinated PCBs are very limited. However, there is evidence that concentrations of low-chlorinated congeners, such as PCB28, are not lower in children than in older individuals. For example, Danish children (n = 116) between 6 and 11 years of age have even higher PCB28 levels than their mothers [34]. This finding is in contrast to those of the higher-chlorinated PCB138, PCB153 and PCB180; these congeners showed significantly higher concentrations in the blood of the mothers than in the blood of the children. This relationship has also been reported by Egsmose et al. [27], who showed that children had significantly higher concentrations of PCB28 in the blood than their mothers. The authors found that this difference was particularly stronger when mother and child lived in a building built between 1950 and 1977, i.e., during a period when PCBs were frequently used in the construction sector. The results of Egsmose et al. [27] may indicate that the transfer of the data collected in this study does not lead to an overestimation of PCBs absorbed in children from indoor air and it is quite conceivable that, on the basis of Danish data, there may even be an underestimation of PCBs absorbed via inhalation in children. However, a final conclusion is not possible due to a lack of human biomonitoring data of children exposed to contaminated indoor air. Therefore, the relevance of PCB inhalation from contaminated indoor air on the blood burden of PCBs in children and adolescents should also be considered in future exposure studies. Finally, due to our limited knowledge, it cannot be ruled out that children and adolescents may absorb more PCBs via inhalation than adults. Our data shows that inhalation is an important contributor to total PCB exposure. Future risk assessments of PCBs on human health should also focus on the relevance of the inhalation pathway. The previous assumption that PCBs are predominantly absorbed through food even when individuals are exposed to contaminated indoor air cannot be maintained.

5. Conclusions

Our study used empirical measurement data to quantitatively show the extent to which PCBs from indoor air contribute to the PCB blood burden of exposed individuals. We found that there was a clear correlation between PCB-contaminated indoor air and exposure to the sum of the concentrations of mono- to pentachlorinated biphenyls (∑PCB1–127) in the blood of exposed individuals. From our data, we estimated that inhalation of PCBs from contaminated indoor air, especially in children, adolescents and younger adults, may lead to a blood burden that is higher than the general background levels or in approximately the same range.

Author Contributions

Conceptualization, funding acquisition, data curation, writing–original draft, M.K.; Methodology, writing—review & editing, K.R., H.F. and Y.C.; Data collection (indoor air), L.G.; Data collection (blood), S.S.; Resources, B.K.; Statistics, visualization, Y.C. All authors have read and agreed to the published version of the manuscript.

Funding

This research was supported by a grant from the Ministry for Climate Protection, Environment, Agriculture, Conservation and Consumer Protection of the State of North Rhine-Westphalia, Germany.

Institutional Review Board Statement

The study was conducted according to the guidelines of the Declaration of Helsinki, and approved by the Ethics Committee of the Medical Association North-Rhine, Germany (registration number: 2013152, date of approval: 10 June 2013).

Informed Consent Statement

Informed consent was obtained from all subjects involved in the study.

Data Availability Statement

Data is contained within the article. Further data can be found in Kraft et al. (2018) and Kraft et al. (2017).

Acknowledgments

We thank all individuals for their participation in the study. For the local support we thank Ursula Fornefeld-Schwarz, Ruhr University Bochum, Germany, Manfred Kessel, Environmental Office Ratingen, Germany, and Siegfied Hauswirth, Health Office Rhein-Kreis-Neuss, Germany.

Conflicts of Interest

The authors declare no conflict of interest. The funders had no role in the design of the study; in the collection, analyses, or interpretation of data; in the writing of the manuscript, or in the decision to publish the results.

References

  1. Breivik, K.; Sweetman, A.; Pacyna, J.M.; Jones, K.C. Towards a global historical emission inventory for selected PCB congeners—A mass balance approach: 1. Global production and consumption. Sci. Total Environ. 2002, 290, 181–198. [Google Scholar] [CrossRef]
  2. EFSA–European Food Safety Authority. Update of the monitoring of levels of dioxins and PCBs in food and feed. EFSA J. 2012, 10, 2832. [Google Scholar]
  3. WHO–World Health Organization. Safety Evaluation of Certain Food Additives and Contaminants: Supplement 1: Non-Dioxin-Like Polychlorinated Biphenyls/Prepared by the Eightieth Meeting of the Joint FAO/WHO Expert Committee on Food Additives (JECFA); World Health Organization: Geneva, Switzerland, 2016. [Google Scholar]
  4. Grimm, F.A.; Klaren, W.D.; Li, X.; Lehmler, H.-J.; Karmakar, M.; Robertson, L.W.; Chiu, W.A.; Rusyn, I. Cardiovascular effects of polychlorinated biphenyls and their major metabolites. Environ. Health Perspect. 2020, 128, 77008. [Google Scholar] [CrossRef] [PubMed]
  5. Lauby-Secretan, B.; Loomis, D.; Grosse, Y.; Ghissassi, F.E.; Bouvard, V.; Benbrahim-Tallaa, L.; Guha, N.; Baan, R.; Mattock, H.; Straif, K. Carcinogenicity of polychlorinated biphenyls and polybrominated biphenyls. Lancet Oncol. 2013, 14, 287–288. [Google Scholar] [CrossRef] [Green Version]
  6. Malisch, R.; Kotz, A. Dioxins and PCBs in feed and food-review from European perspective. Sci. Total Environ. 2014, 491–492, 2–10. [Google Scholar] [CrossRef] [PubMed]
  7. Saktrakulkla, P.; Lan, T.; Hua, J.; Marek, R.F.; Thorne, P.S.; Hornbuckle, K.C. Polychlorinated biphenyls in food. Environ. Sci. Technol. 2020, 54, 11443–11452. [Google Scholar] [CrossRef]
  8. Fattore, E.; Fanelli, R.; Dellatte, E.; Turrini, A.; Di Domenico, A. Assessment of the dietary exposure to non-dioxin-like PCBs of the Italian general population. Chemosphere 2008, 73, S278–S283. [Google Scholar] [CrossRef]
  9. Cogliano, V.J. Lack of data drives uncertainty in PCB health risk assessments. Environ. Sci. Pollut. Res. 2016, 23, 2212–2219. [Google Scholar] [CrossRef]
  10. Lehmann, G.M.; Christensen, K.; Maddaloni, M.; Phillips, L.J. Evaluating health risks from inhaled polychlorinated biphenyls: Research needs for addressing uncertainty. Environ. Health Perspect. 2015, 123, 109–113. [Google Scholar] [CrossRef] [Green Version]
  11. Frederiksen, M.; Meyer, H.W.; Ebbehøj, N.E.; Gunnarsen, L. Polychlorinated biphenyls (PCBs) in indoor air originating from sealants in contaminated and uncontaminated apartments within the same housing estate. Chemosphere 2012, 89, 473–479. [Google Scholar] [CrossRef]
  12. Marek, R.F.; Thorne, P.S.; Herkert, N.J.; Awad, A.M.; Hornbuckle, K.C. Airborne PCBs and OH-PCBs inside and outside urban and rural U.S. schools. Environ. Sci. Technol. 2017, 51, 7853–7860. [Google Scholar] [CrossRef] [PubMed]
  13. Kraft, M.; Sievering, S.; Grün, L.; Rauchfuss, K. Mono-, di-, and trichlorinated biphenyls (PCB 1-PCB 39) in the indoor air of office rooms and their relevance on human blood burden. Indoor Air 2018, 28, 441–449. [Google Scholar] [CrossRef]
  14. Andersen, H.V.; Gunnarsen, L.; Knudsen, L.E.; Frederiksen, M. PCB in air, dust and surface wipes in 73 Danish homes. Int. J. Hyg. Environ. Health 2020, 229, 113429. [Google Scholar] [CrossRef] [PubMed]
  15. Frederiksen, M.; Andersen, H.V.; Haug, L.S.; Thomsen, C.; Broadwell, S.L.; Egsmose, E.L.; Kolarik, B.; Gunnarsen, L.; Knudsen, L.E. PCB in serum and hand wipes from exposed residents living in contaminated high-rise apartment buildings and a reference group. Int. J. Hyg. Environ. Health 2020, 224, 113430. [Google Scholar] [CrossRef]
  16. Gabrio, T.; Piechotowski, I.; Wallenhorst, T.; Klett, M.; Cott, L.; Friebel, P.; Link, B.; Schwenk, M. PCB-blood levels in teachers, working in PCB-contaminated schools. Chemosphere 2000, 40, 1055–1062. [Google Scholar] [CrossRef]
  17. Johansson, N.; Hanberg, A.; Wingfors, H.; Tysklind, M. PCB in building sealant is influencing PCB levels in blood of residents. Organohalogen Compd. 2003, 63, 381–384. [Google Scholar]
  18. Liebl, B.; Schettgen, T.; Kerscher, G.; Broding, H.-C.; Otto, A.; Angerer, J.; Drexler, H. Evidence for increased internal exposure to lower chlorinated polychlorinated biphenyls (PCB) in pupils attending a contaminated school. Int. J. Hyg. Environ. Health 2004, 207, 315–324. [Google Scholar] [CrossRef]
  19. Schettgen, T.; Alt, A.; Preim, D.; Keller, D.; Kraus, T. Biological monitoring of indoor-exposure to dioxin-like and non-dioxin-like polychlorinated biphenyls (PCB) in a public building. Toxicol. Lett. 2012, 213, 116–121. [Google Scholar] [CrossRef]
  20. Meyer, H.W.; Frederiksen, M.; Göen, T.; Ebbehøj, N.E.; Gunnarsen, L.; Brauer, C.; Kolarik, B.; Müller, J.; Jacobsen, P. Plasma polychlorinated biphenyls in residents of 91 PCB-contaminated and 108 non-contaminated dwellings-an exposure study. Int. J. Hyg. Environ. Health 2013, 216, 755–762. [Google Scholar] [CrossRef]
  21. Pedersen, E.B.; Ebbehøj, N.E.; Göen, T.; Meyer, H.W.; Jacobsen, P. Exposure to 27 polychlorinated biphenyls in the indoor environment of a workplace: A controlled bio-monitoring study. Int. Arch. Occup. Environ. Health 2016, 89, 43–47. [Google Scholar] [CrossRef] [PubMed]
  22. Marek, R.F.; Thorne, P.S.; Wang, K.; DeWall, J.; Hornbuckle, K.C. PCBs and OH-PCBs in serum from children and mothers in urban and rural U.S. communities. Environ. Sci. Technol. 2013, 47, 3353–3361. [Google Scholar] [CrossRef] [PubMed]
  23. Marek, R.F.; Thorne, P.S.; DeWall, J.; Hornbuckle, K.C. Variability in PCB and OH-PCB serum levels in children and their mothers in urban and rural U.S. communities. Environ. Sci. Technol. 2014, 48, 13459–13467. [Google Scholar] [CrossRef]
  24. Kraft, M.; Rauchfuss, K.; Sievering, S.; Wöckner, M.; Neugebauer, F.; Fromme, H. Quantification of all 209 PCB congeners in blood-Can indicators be used to calculate the total PCB blood load? Int. J. Hyg. Environ. Health 2017, 220, 201–208. [Google Scholar] [CrossRef] [PubMed]
  25. Schwenk, M.; Gabrio, T.; Päpke, O.; Wallenhorst, T. Human biomonitoring of polychlorinated biphenyls and polychlorinated dibenzodioxins and dibenzofuranes in teachers working in a PCB-contaminated school. Chemosphere 2002, 47, 229–233. [Google Scholar] [CrossRef]
  26. Herrick, R.F.; Meeker, J.D.; Altshul, L. Serum PCB levels and congener profiles among teachers in PCB-containing schools: A pilot study. Environ. Health 2011, 10, 56. [Google Scholar] [CrossRef] [Green Version]
  27. Egsmose, E.L.; Bräuner, E.V.; Frederiksen, M.; Mørck, T.A.; Siersma, V.D.; Hansen, P.W.; Nielsen, F.; Grandjean, P.; Knudsen, L.E. Associations between plasma concentrations of PCB 28 and possible indoor exposure sources in Danish school children and mothers. Environ. Int. 2016, 87, 13–19. [Google Scholar] [CrossRef]
  28. Fitzgerald, E.F.; Shrestha, S.; Palmer, P.M.; Wilson, L.R.; Belanger, E.E.; Gomez, M.I.; Cayo, M.R.; Hwang, S.-A. Polychlorinated biphenyls (PCBs) in indoor air and in serum among older residents of upper Hudson River communities. Chemosphere 2011, 85, 225–231. [Google Scholar] [CrossRef] [PubMed]
  29. Ampleman, M.D.; Martinez, A.; DeWall, J.; Rawn, D.F.K.; Hornbuckle, K.C.; Thorne, P.S. Inhalation and dietary exposure to PCBs in urban and rural cohorts via congener-specific measurements. Environ. Sci. Technol. 2015, 49, 1156–1164. [Google Scholar] [CrossRef] [PubMed]
  30. Fromme, H.; Hilger, B.; Albrecht, M.; Gries, W.; Leng, G.; Völkel, W. Occurrence of chlorinated and brominated dioxins/furans, PCBs, and brominated flame retardants in blood of German adults. Int. J. Hyg. Environ. Health 2016, 219, 380–388. [Google Scholar] [CrossRef]
  31. Apostoli, P.; Magoni, M.; Bergonzi, R.; Carasi, S.; Indelicato, A.; Scarcella, C.; Donato, F. Assessment of reference values for polychlorinated biphenyl concentration in human blood. Chemosphere 2005, 61, 413–421. [Google Scholar] [CrossRef] [PubMed]
  32. Schettgen, T.; Alt, A.; Esser, A.; Kraus, T. Current data on the background burden to the persistent organochlorine pollutants HCB, p,p’-DDE as well as PCB 138, PCB 153 and PCB 180 in plasma of the general population in Germany. Int. J. Hyg. Environ. Health 2015, 218, 380–385. [Google Scholar] [CrossRef] [PubMed] [Green Version]
  33. Bandow, N.; Conrad, A.; Kolossa-Gehring, M.; Murawski, A.; Sawal, G. Polychlorinated biphenyls (PCB) and organochlorine pesticides (OCP) in blood plasma–Results of the German environmental survey for children and adolescents 2014–2017 (GerES V). Int. J. Hyg. Environ. Health 2020, 224, 113426. [Google Scholar] [CrossRef] [PubMed]
  34. Mørck, T.A.; Erdmann, S.E.; Long, M.; Mathiesen, L.; Nielsen, F.; Siersma, V.D.; Bonefeld-Jørgensen, E.C.; Knudsen, L.E. PCB concentrations and dioxin-like activity in blood samples from Danish school children and their mothers living in urban and rural areas. Basic Clin. Pharmacol. Toxicol. 2014, 115, 134–144. [Google Scholar] [CrossRef] [PubMed] [Green Version]
Figure 1. Median levels of PCB homolog groups (ng/g l.w.) in whole blood samples of the study group (n = 35).
Pollutants 01 00015 g001
Figure 2. Heat map of correlation factors between PCBs in the indoor air and in the blood of the individuals (n = 35); ** = p < 0.05.
Pollutants 01 00015 g002
Figure 3. Linear regression between ∑PCB28,52,101 in indoor air and ∑PCB28,52,101 in blood (n = 35) (R2 = 0.33, F(1,33) = 16.28; p < 0.001). The solid line is the regression line superimposed over a scatter plot of the data and the dotted lines show the 95% confidence interval of the fit.
Pollutants 01 00015 g003
Figure 4. Linear regression between ∑PCB28,52,101 in indoor air and ∑PCB1–127 in blood (n = 35) (R2 = 0.46, F(1,33) = 27.94; p < 0.001). The solid line is the regression line superimposed over a scatter plot of the data and the dotted lines show the 95% confidence interval of the fit.
Pollutants 01 00015 g004
Figure 5. Relationship between PCBs in indoor air (ng/m3) and PCBs in human blood lipids (ng/g l.w.) (n = 35). The straight line shows the approximated PCB blood burden (∑PCB1–127) depending on PCB levels in indoor air.
Pollutants 01 00015 g005
Table 1. Marker PCBs and total PCB load (∑PCB1–209) in the blood lipids of the individuals (n = 35).
n >
LOQ
Minimum25th
Percentile
Median75th
Percentile
95th
Percentile
MaximumMean
[ng/g l.w.][ng/g l.w.][ng/g l.w.][ng/g l.w.][ng/g l.w.][ng/g l.w.][ng/g l.w.]
PCB 28352.25.91216373913
PCB 52350.351.22.34.38.78.93.0
PCB 101350.390.71.62.94.54.71.9
PCB 138358.828476412919652
PCB 153351974136168311531143
PCB 18035115978128367370112
∑PCB1–209 11938555975016002152632
Table 2. Correlations between PCBs in the indoor air and in the blood of the individuals (n = 35).
Indoor AirBloodSpearman’s Coefficient (Rho) of Correlationp Value
PCB28PCB280.534<0.001
PCB52PCB520.564<0.001
PCB101PCB1010.686<0.001
∑PCB28,52,101∑PCB28,52,1010.587<0.001
∑PCB28,52,101∑PCB1–127 (mono-penta)0.5350.001
∑PCB28,52,101,138,153,180x5∑PCB1–39 (mono-tri)0.4620.005
∑PCB28,52,101,138,153,180x5∑PCB1–81 (mono-tetra)0.5510.001
∑PCB28,52,101,138,153,180x5∑PCB1–127 (mono-penta)0.5420.001
∑PCB28,52,101,138,153,180x5∑PCB1–169 (mono-hexa)(0.130)(0.455)
∑PCB28,52,101,138,153,180x5∑PCB1–209 (mono-deca)(0.050)(0.775)
Table 3. Blood burden of ∑PCB28,52,101 and ∑PCB1–127 (ng/g l.w.) due to exposure to ∑PCB28,52,101 in indoor air (ng/m3).
Indoor Air [ng/m3]Blood [ng/g l.w.]
∑PCB28,52,101100∑PCB28,52,10116 (95% CI 13–20)
300 29 (95% CI 22–35)
∑PCB28,52,101100∑PCB1–12781 (95% CI 68–93)
300 141 (95% CI 118–164)
Table 4. Transfer of results from regression analyses to real indoor air exposure conditions. Exposure to the sum of the three lower-chlorinated marker congeners (∑PCB28,52,101) and total PCB concentration (∑PCB28,52,101,138,153,180×5) in indoor air (ng/m3) and related blood burden of ∑PCB1–127 (ng/g l.w.).
Indoor Air [ng/m3]Blood [ng/g l.w.]
∑PCB28,52,101∑PCB28,52,101,138,153,180×5∑PCB1–127
room A9247978 (95% CI 65–91)
room B5552797218 (95% CI 167–269)
Publisher’s Note: MDPI stays neutral with regard to jurisdictional claims in published maps and institutional affiliations.

