
Unfolding of Helical Poly(L-Glutamic Acid) in N,N-Dimethylformamide Probed by Pyrene Excimer Fluorescence (PEF)


Institute for Polymer Research, Waterloo Institute of Nanotechnology, Department of Chemistry, University of Waterloo, Waterloo, ON N2L 3G1, Canada
*
Author to whom correspondence should be addressed.
Polymers 2021, 13(11), 1690; https://0-doi-org.brum.beds.ac.uk/10.3390/polym13111690
Submission received: 19 April 2021
/
Revised: 14 May 2021
/
Accepted: 18 May 2021
/
Published: 22 May 2021
(This article belongs to the Special Issue Luminescent Polymers from Theory to Application)
Abstract
:The denaturation undergone by α–helical poly(L-glutamic acid) (PLGA) in N,N-dimethylformamide upon addition of guanidine hydrochloride (GdHCl) was characterized by comparing the fluorescence of a series of PLGA constructs randomly labeled with the dye pyrene (Py-PLGA) to that of a series of Py-PDLGA samples prepared from a racemic mixture of D,L-glutamic acid. The process of pyrene excimer formation (PEF) was taken advantage of to probe changes in the conformation of α–helical Py-PLGA. Fluorescence Blob Model (FBM) analysis of the fluorescence decays of the Py-PLGA and Py-PDLGA constructs yielded the average number (<Nblob>) of glutamic acids located inside a blob, which represented the volume probed by an excited pyrenyl label. <Nblob> remained constant for randomly coiled Py-PDLGA but decreased from ~20 to ~10 glutamic acids for the Py-PLGA samples as GdHCl was added to the solution. The decrease in <Nblob> reflected the decrease in the local density of PLGA as the α–helix unraveled in solution. The changes in <Nblob> with GdHCl concentration was used to determine the change in Gibbs energy required to denature the PLGA α–helix in DMF. The relationship between <Nblob> and the local density of macromolecules can now be applied to characterize the conformation of macromolecules in solution.
1. Introduction
The Fluorescence Blob Model (FBM) was introduced in 1999 as a mathematical tool to extract quantitative information about the internal dynamics of polymers, that had been randomly labeled with the fluorescent dye pyrene [1]. As discussed in several reviews [2,3,4,5], the FBM takes advantage of the ability of an excited pyrene to form an excimer upon diffusive encounter with a ground-state pyrene inside the volume probed by the excited pyrene, and referred to as a blob. In turn, the blob could be used as a unit volume to divide the polymer coil into a cluster of identical subvolumes. Random labeling of a polymer with a pyrene derivative ensured that the pyrenyl labels would distribute themselves randomly among the blobs according to a Poisson distribution. Analysis of the fluorescence decays acquired with solutions of the pyrene-labeled polymers yielded the average number (<n>) of ground-state pyrenes per blob, which could be related to the number (Nblob) of structural units encompassed inside a blob. For different polymers, a larger Nblob typically indicated that the excited pyrenyl label could probe a larger volume, reflecting a more flexible polymeric backbone.
While these early studies [1,2,3,4,5] established the FBM as an interesting means for gauging the flexibility of one polymer backbone against another, they overlooked an important aspect of the FBM, which is its ability to provide quantitative information about the local density of a macromolecule. In turn, this information could be related to the conformation of the macromolecule of interest, a most important research topic in macromolecular science. Based on this insight, a combination of pyrene excimer formation (PEF), FBM, and molecular mechanics optimizations (MMOs) was applied to yield the internal density of arborescent poly(L-glutamic acid)s (PLGAs) [6], confirm the helical conformation of amylose in dimethylsulfoxide (DMSO) [7], PLGA in N,N-dimethylformamide (DMF) [8,9,10], and poly(L-lysine) in acetonitrile/water mixtures [11], predict the 310-helical conformation of PLGA in DMSO [12], introduce the Solution-Cluster model to describe the interior of amylopectin in DMSO [13,14], and provide the first 1:1 direct relationship between the experimental and predicted folding time of proteins [15,16].
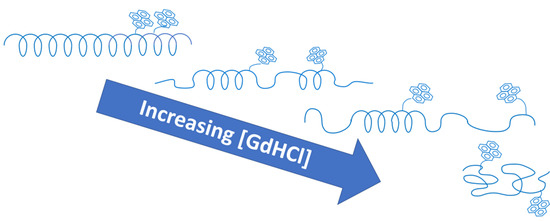
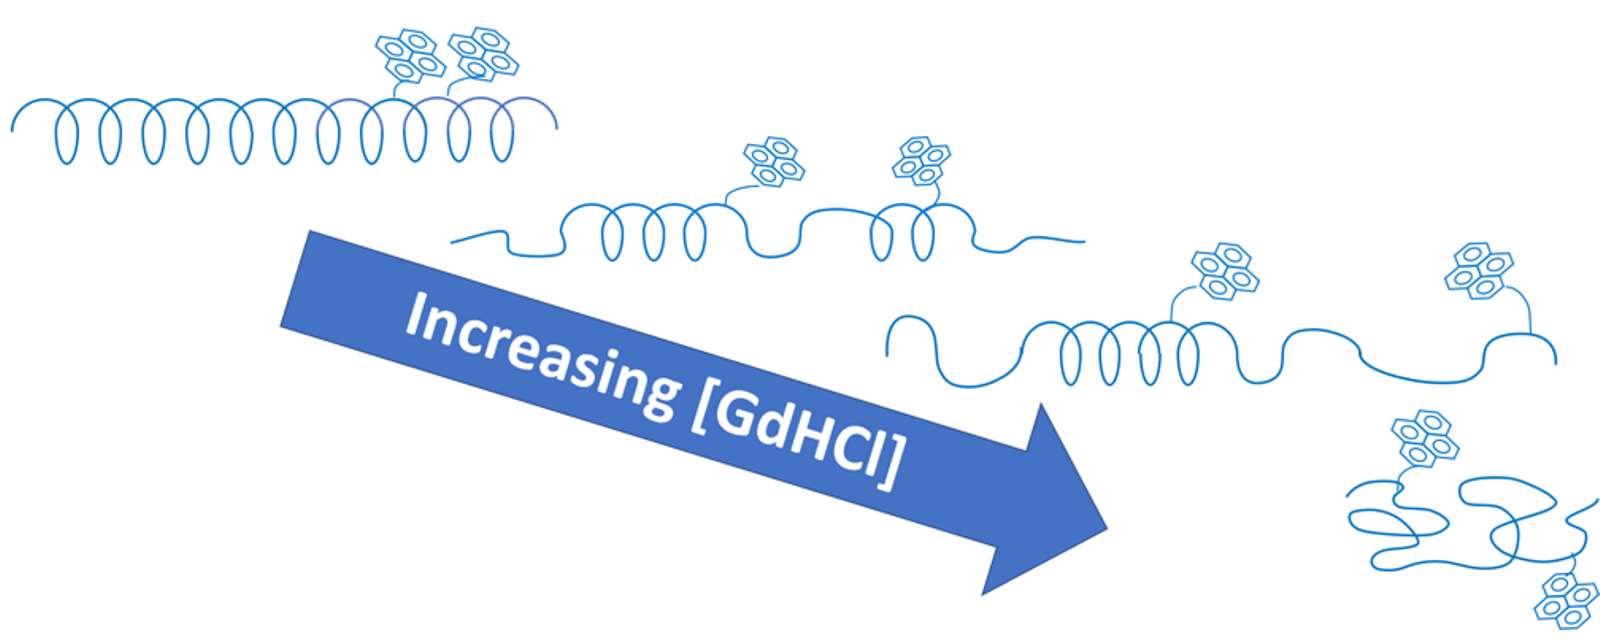
The ability to characterize the conformation of macromolecules in solution makes Nblob a central parameter in the study of macromolecules by PEF [1,2,3,4,5], in the same manner as the radius of gyration (Rg) and ellipticity (θ) are central parameters to, respectively, scattering [17,18,19] or circular dichroism (CD) [20,21,22,23,24,25,26] measurements to probe the conformation of, respectively, synthetic macromolecules or proteins in solution. To further assess the ability of Nblob to probe macromolecular conformations in solution, the present study investigates how Nblob reports on the unravelling of an α–helical PLGA in DMF as guanidine hydrochloride (GdHCl), a well-known denaturing agent [27], is added to the solution. To this end, a sample of PLGA and of poly(D,L-glutamic acid) (PDLGA) were randomly labeled with 1-pyrenemethylamine (PyMA) to yield Py-PLGA and Py-PDLGA, respectively, and PEF was applied to probe conformational changes in PLGA as GdHCl was added to the solution. PLGA is known to adopt an α–helical conformation in DMF [8,9,10], while the racemic nature of PDLGA imposes that it adopts a random coil conformation under any solvent condition. Consequently, PDLGA with its random coil conformation regardless of solvent conditions provided an ideal baseline against which the conformation of PLGA could be compared as GdHCl was added to the polypeptide solutions. The fluorescence decays of dilute solutions of Py-PLGA and Py-PDLGA in DMF were acquired and analyzed according to the FBM to retrieve Nblob as a function of the concentration of GdHCl added to the solutions. Comparison of the Nblob values obtained for the randomly coiled Py-PDLGA samples and the α–helical Py-PLGA samples in DMF without GdHCl provided a means to assess the extent of denaturation in the PLGA α–helix as GdHCl was added.
The results show that Nblob reflected the extent of the denaturation of the PLGA α–helix, decreasing as the helix unfolded with increasing GdHCl concentration, while Nblob remained constant for PDLGA in DMF over the entire GdHCl concentration range. The Nblob value was also employed to determine the molar fraction of native (fN) and denatured (fD) PLGA molecules in solution. In turn, the fN and fD fractions could be applied to determine the equilibrium constant (Kunfold) for the Native ⇌ Denatured equilibrium at each GdHCl concentration [28,29] and yield the change in Gibbs energy (ΔunfoldG(DMF)) for the unfolding of the α–helical PLGA in DMF in the same manner, that experiments using CD or LS would do. In summary, these PEF experiments further support the notion that Nblob, determined for macromolecules randomly labeled with pyrene, reports on the local density of macromolecules and can be used to infer their conformation in solution.
2. Materials and Methods
2.1. Sample Preparation
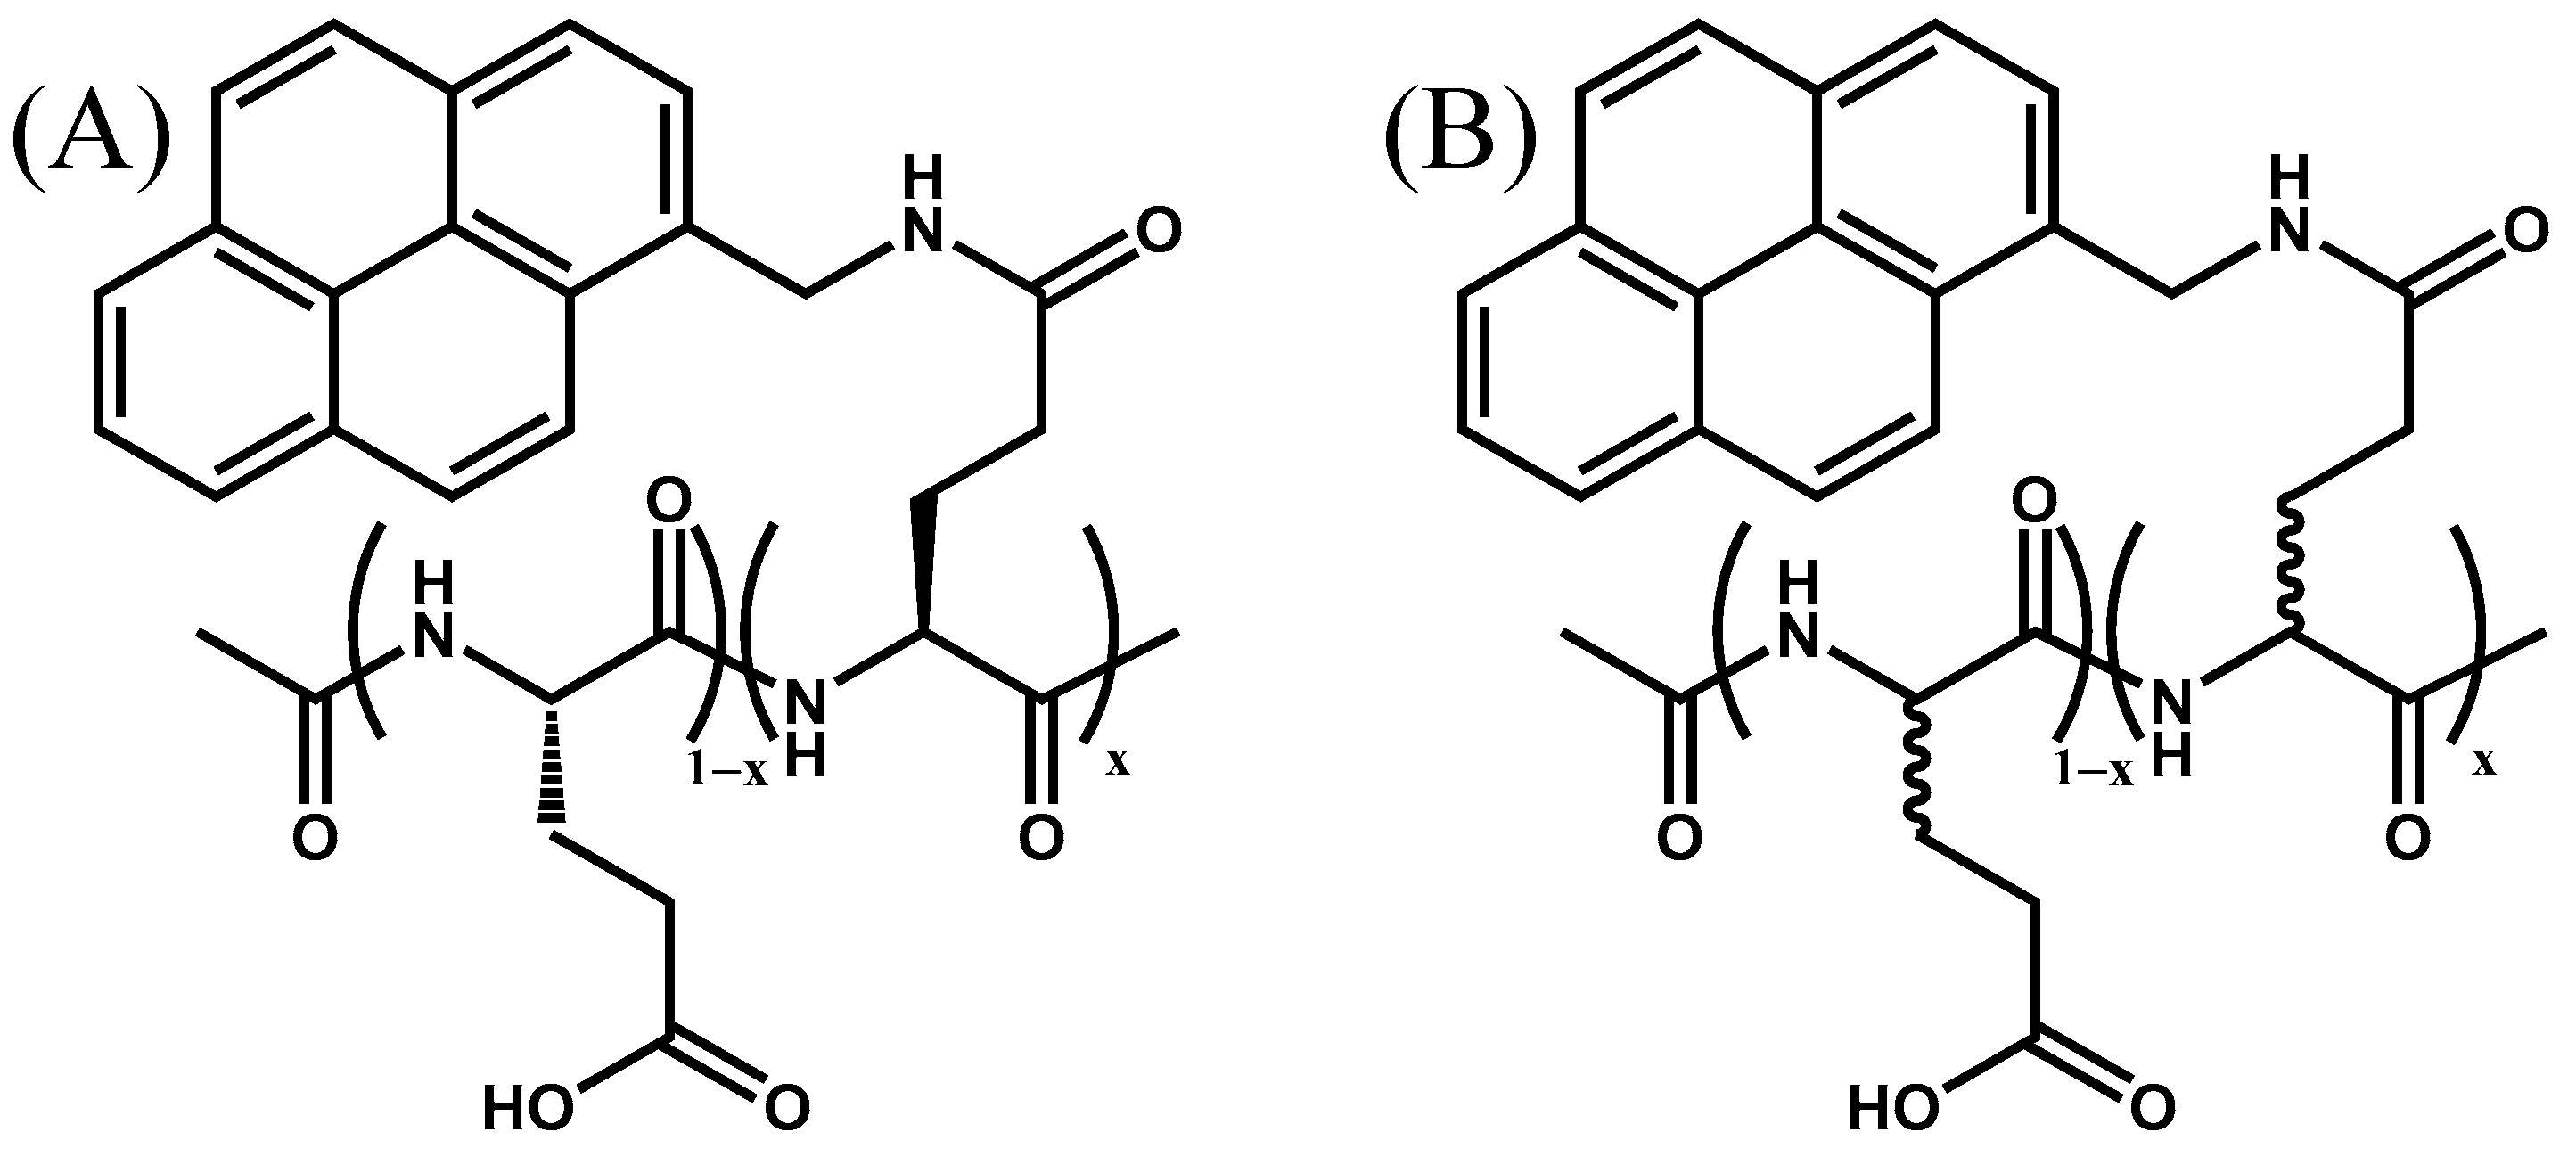
The preparation of the Py-PLGA and Py-PDLGA samples has been described earlier [10]. Six Py-PLGA samples and five Py-PDLGA samples were used in these experiments. Their chemical structure is described in Figure 1. The samples were dissolved in DMF (Sigma, ≥99.8%) before being diluted so that their concentration in pyrenyl label would equal 2.5 × 10⁻⁶ M, low enough to avoid any intermolecular interactions. Oxygen dissolved in the Py-PLGA solutions was outgassed by passing a gentle flow of 99.99% high purity N2 (Praxair, N4.0) for 30 min. Steady-state (SSF) and time-resolved (TRF) fluorescence experiments (SSF: LS-100 Photon Technology International, London, ON, Canada; TRF: IBH Ltd, Glasgow, Scotland, UK) were conducted with the degassed solutions.
2.2. Steady-State Fluorescence
A PTI spectrofluorometer was used to acquire the SSF spectra with a 344 nm excitation wavelength. The excitation and emission slit widths were set at 2 and 1 nm, respectively. The SSF spectrum was then analyzed by determining the fluorescence intensity of the monomer (IM) and excimer (IE) from the integration of the area under the spectrum from 372 to 378 nm and from 500 to 530 nm, respectively. These intensities were used to determine the IE/IM ratio, which was employed to gauge the PEF efficiency.
2.3. Time-Resolved Fluorescence
The TRF decays were acquired with an IBH time-correlated single photon counting (TC-SPC) fluorometer using a 340 nm-NanoLED for excitation. The solutions were excited at 344 nm with an excitation monochromator and the monomer and excimer fluorescence decays were collected at 375 and 510 nm using a 370 and 495 nm cutoff filter, respectively. A repetition rate of 1 MHz or 500 kHz, time per channel of 1.02 or 2.04 ns/ch, and number of counts at the decay maximum of 40,000 or 20,000 counts were applied to the monomer and excimer fluorescence decays, respectively. These experimental settings were the same as those reported in earlier publications [10,12].
2.4. Fluorescence Decay Analysis
The FBM was employed to fit the TRF decays [1,2,3,4,5] using in-house software. The FBM assumes that five different pyrene species exist in solution. The species Pydiff* represents the excited pyrenes, that diffuse toward a ground-state pyrene to yield the species Pyk2*, where the excited and the ground-state pyrene labels are close enough to rearrange rapidly with a large rate constant k2 to form an excimer. The pyrenes, that result in excimer formation, are referred to as E0* or D* depending on whether the excimers produced are the result of the interaction between two well-stacked or two poorly stacked pyrenes, respectively. The fifth species, Pyfree* cannot form excimer and emits as if it were free in solution. The natural lifetime of the three species Pydiff*, Pyk2*, and Pyfree* is that of the pyrene monomer (τM), whereas E0* and D* emit with their natural lifetimes τE0 and τD, respectively. The monomer and excimer fluorescence decays were fitted globally first with the program globmis90lbg, where k2 is allowed to float freely, and then with the program globmis90obg, where k2 is fixed in the analysis to its average value obtained with the earlier round of fits. The analysis provides the molar fractions fdiff, fk2, ffree, fE0, and fD of the pyrene species Pydiff*, Pyk2*, Pyfree*, E0*, and D*, respectively. The sum of the fractions fE0 and fD is referred to as fagg since it represents the molar fraction of aggregated pyrenes. The FBM analysis also yields the average number <n> of ground-state pyrenes inside a blob, the product ke × [blob] of the rate constant ke for the exchange of ground-state pyrenes between blobs and the blob concentration [blob], and the rate constant kblob for diffusive encounters between two pyrenyl labels inside a blob. All the parameters retrieved from the fit of the fluorescence decays were optimized with the Marquardt–Levenberg algorithm [30]. The equations used to fit the monomer and excimer fluorescence decays globally according to the FBM are provided as Supplementary Material (SM) as Equations (S1) and (S2), respectively, along with tables listing the FBM parameters retrieved from this analysis. In turn, the number of structural units found inside the volume of a blob (Nblob) can be obtained from <n> according to Equation (1), where x is the molar fraction of glutamic acids, that were labeled with 1-pyrenmethylamine (see Figure 1), and fMfree represents the molar fraction of the Pyfree* species contributing to the monomer decay.
3. Results
3.1. Steady-State Fluorescence
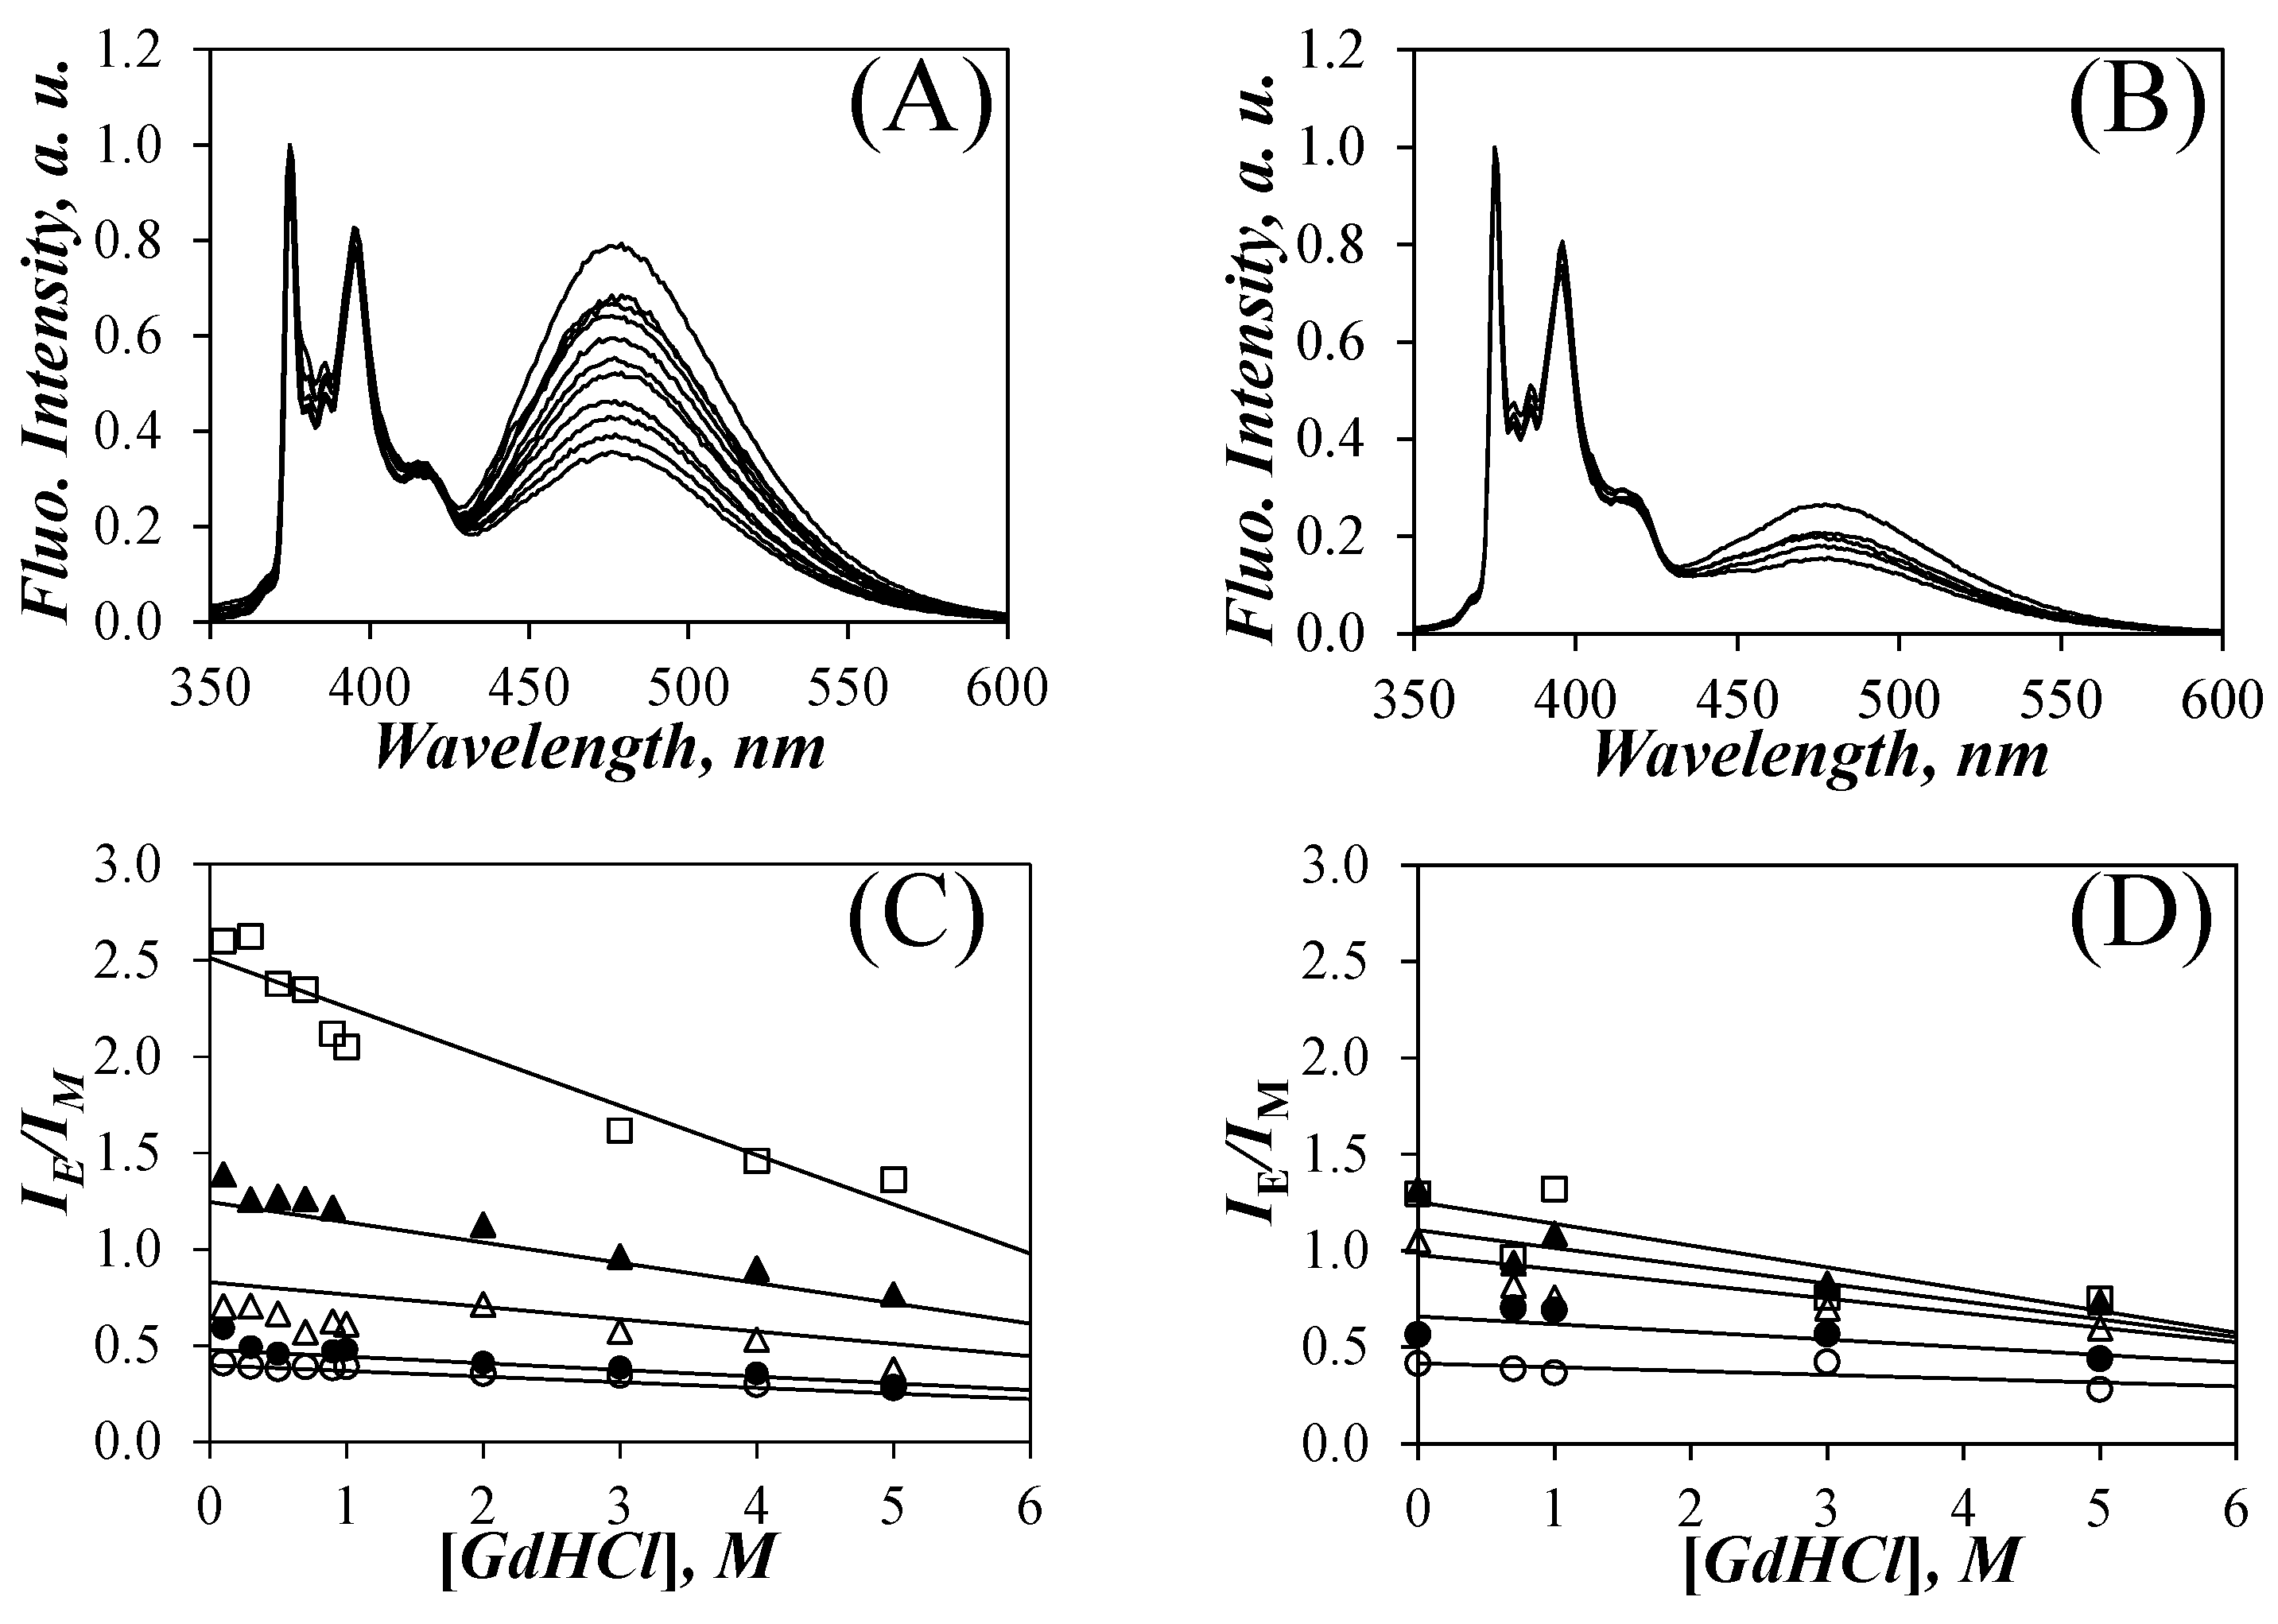
Since Py-PLGA adopts an α–helical conformation in DMF [8,9,10,31], the effect of GdHCl (Sigma, ≥99%), a well-known denaturing agent [27], on the denaturation of the PLGA helix was investigated by monitoring the fluorescence response of the Py-PLGA constructs as a function of the GdHCl concentration, which was varied from 0.1 to 5 M. The SSF spectra of solutions in DMF of five Py-PLGA and five Py-PDLGA samples were acquired for different GdHCl concentrations. The effect of the addition of GdHCl to the solution of Py(14.0)-PLGA and Py(10.4)-PDLGA in DMF is shown in Figure 2A,B after normalization at 375 nm, which corresponds to the 0–0 transition of pyrene. For both samples, the fluorescence of the pyrene excimer centered at 480 nm decreased with increasing GdHCl concentration. Although this effect was observed for all Py-PGA samples, it was more pronounced for the Py-PLGA samples. This is illustrated in a more quantitative manner by plotting the IE/IM ratio as a function of [GdHCl] in Figure 2C,D.
The behavior of the IE/IM ratio could be discussed in terms of Equation (2) [32], which shows how the IE/IM ratio is related to the rate constant kdiff of diffusive encounters between an excited and a ground-state pyrenyl label and the local pyrene concentration [Py]loc. As described by Equation (2), the reduction in IE/IM could be a result of one or more of the following three effects. First, the increase in viscosity by the addition of GdHCl is expected to reduce kdiff. Second, the probability of PEF upon encounter between an excited and a ground-state pyrenyl label [33] might change with GdHCl concentration and is known to affect kdiff. Third, the denaturation of the PLGA α–helix, which would reduce [Py]loc. The difficulty in identifying which one of these parameters best rationalized the effects observed with the IE/IM ratios was resolved by applying the FBM analysis to the decays acquired with the pyrene-labeled samples. As a matter of fact, the FBM is designed to separate the contributions arising from kdiff and [Py]loc with the parameters kblob (=kdiff × (1/Vblob), where Vblob is the blob volume and 1/Vblob represents the concentration equivalent to one ground-state pyrene inside a blob) and <n> (=[Py]loc × Vblob). <n> can then be used to determine the number Nblob of GA’s contained within each blob volume according to Equation (1) [1,2,3,4,5].
3.2. Time-Resolved Fluorescence
The fluorescence decays of the pyrene monomer and excimer were acquired for all samples and fitted globally according to the FBM with Equations (S1) and (S2) in SI. The lifetime (τM) of the pyrene monomer was estimated by fitting the fluorescence decays of Py(2.3)-PLGA with a sum of exponentials. The low pyrene content of this sample ensured that it would form little excimer so that its long-lived behavior reflected isolated pyrenyl labels, whose decay time was attributed to τM. τM was found to decrease from 215 to 207 ns, when the GdHCl concentration was increased from zero to 0.1 M, before decreasing linearly with increasing GdHCl concentration from 207 to 190 ns from 0.1 and 5 M according to Equation (3). The lifetime τM was fixed in the fluorescence decay analysis to its value determined with Equation (3) for a given GdHCl concentration. This modest decrease in τM with increasing GdHCl concentration indicated that GdHCl is not an efficient quencher of pyrene.
τM (ns) = −3.33 × [GdHCl] + 207
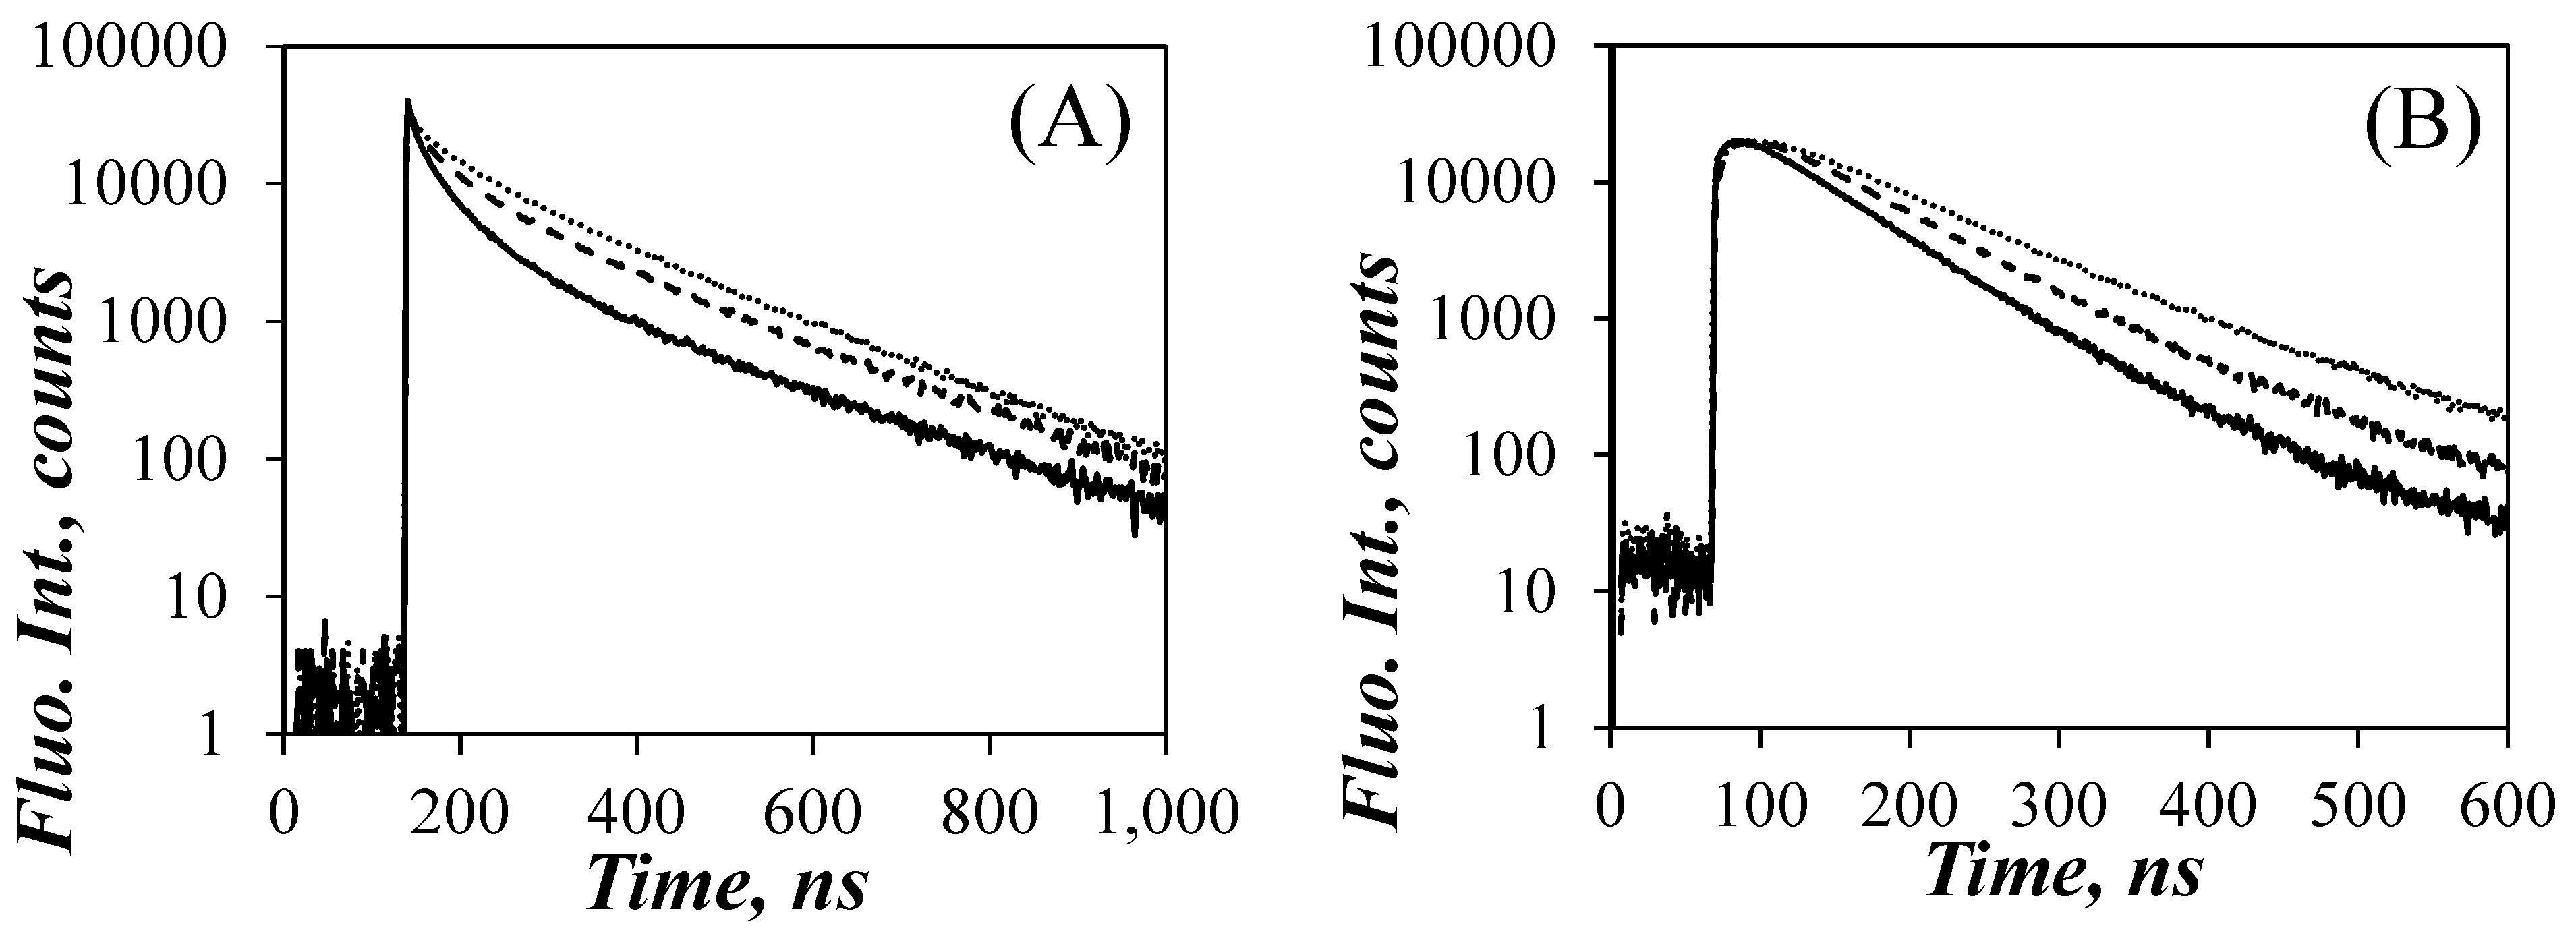
The effect of GdHCl concentration on the monomer and excimer fluorescence decays can be seen in Figure 3, where the monomer and excimer fluorescence decays of Py(9.0)-PLGA are represented for GdHCl concentrations of 0.1, 1, and 5 M. The long-lived tails of the pyrene monomer decays in Figure 3A were essentially parallel, as expected since τM did not change much with GdHCl concentration. The early part of the monomer decay for Py(9.0)-PLGA in DMF with 0.1 M GdHCl showed a pronounced decrease reflecting efficient PEF, as would be expected if PLGA adopted a condensed conformation, such as that expected of an α–helix. This decrease in fluorescence intensity at the early times became less pronounced as more GdHCl was added to the solution, reflecting a decrease in PEF efficiency, that agreed with the IE/IM trends observed in Figure 2C. The decrease in PEF observed for the monomer decays as more GdHCl was added to the solution was also observed in the excimer decays in Figure 3B, that showed a longer rise time with increasing GdHCl concentration. Similar to the SSF spectra in Figure 1A, the fluorescence decays also indicated that the addition of GdHCl affected PEF, suggesting that these changes might be related to the conformational changes experienced by the PLGA a-helix in DMF.
3.3. Fluorescence Blob Model Analysis of Decays
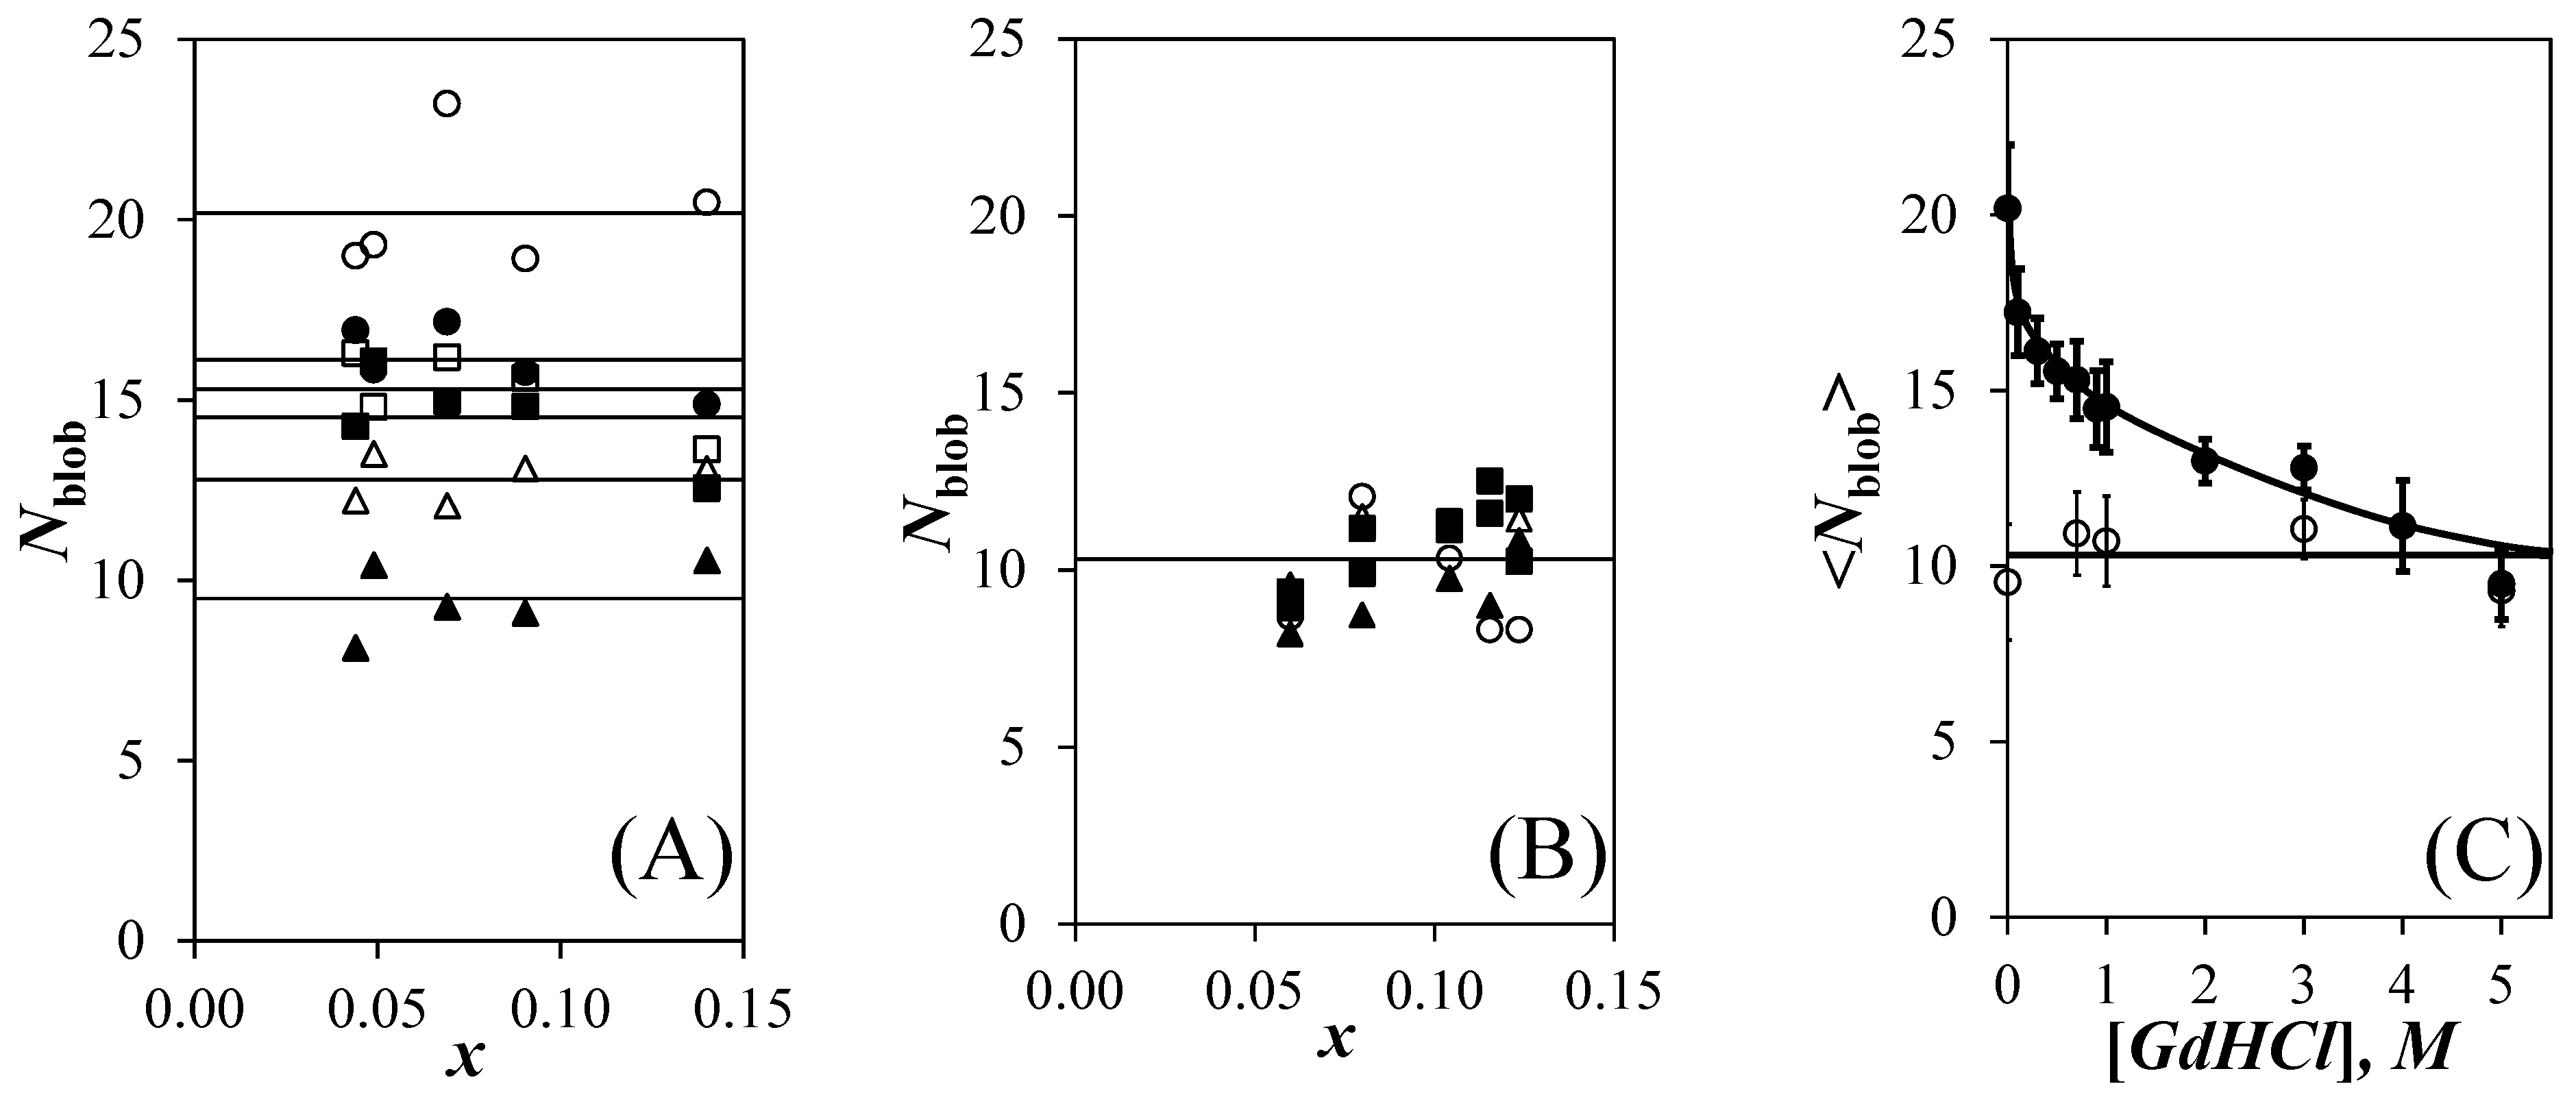
After determining the k2 value at each GdHCl concentration, the k2 value was fixed for a given GdHCl concentration and the fluorescence decays were fitted according to Equations (S1) and (S2). The Nblob values were determined by introducing the <n> values retrieved from the fluorescence decay analysis into Equation (1). The Nblob values obtained for the Py-PLGA and Py-PDLGA samples are plotted as a function of pyrene content for different GdHCl concentrations in Figure 4A,B, respectively. For each GdHCl concentration, and despite the scatter, the Nblob values clustered around a constant value indicating that the pyrene-labeling did not affect the behavior of the polymers. The main difference in behavior between the Py-PLGA and Py-PDLGA samples was that Nblob decreased continuously with increasing GdHCl concentration in Figure 4A while Nblob remained constant and equal to 10.4 (±1.3) for the Py-PDLGA samples in Figure 4B. This effect was clearly illustrated in Figure 4C, where the Nblob values obtained as a function of pyrene content were averaged to yield <Nblob>, which was plotted as a function of GdHCl concentration. <Nblob> decreased from 20.2 (±1.8) for Py-PLGA in DMF without GdHCl to an average value of 10.2 (±1.5) for Py-PLGA with 4 and 5 M GdHCl. An <Nblob> value of 20.2 (±1.8) has been reported numerous times, when Py-PLGA adopts an α–helical conformation [9,10,12], as it is known to do in DMF [31]. With 4 and 5 M GdHCl, <Nblob> for Py-PLGA approached the <Nblob> value for randomly coiled Py-PDLGA in DMF, that remained constant and equal to 10.4 (±1.3) at all GdHCl concentrations. Overall, the results in Figure 4C indicate that addition of GdHCl to a solution of α–helical PLGA in DMF induces the progressive unraveling of the PLGA α–helix, until it becomes a random coil at high GdHCl concentrations.
The FBM analysis of the fluorescence decays also yielded kblob, which was plotted as a function a pyrene content in Figure 5A,B for the Py-PLGA and Py-PDLGA samples, respectively. In agreement with Nblob, kblob did not change much with pyrene content within experimental error, again implying that the pyrene content did not affect the behavior of the polymers. The kblob values obtained as a function of pyrene content in Figure 5A,B were averaged to yield <kblob>, which was plotted as a function of GdHCl concentration in Figure 5C. Within experimental error, the <kblob> values for the Py-PLGA and Py-PDLGA samples showed a similar trend, with <kblob> decreasing with increasing GdHCl concentration. The decrease in kblob was most certainly a consequence of the increase in the solution viscosity associated with the addition of fairly large amounts of GdHCl and the main contributor to the decrease in the IE/IM ratios observed for the Py-PDLGAs in Figure 2D.
The trends shown in Figure 4C and Figure 5C displayed some remarkable features. A decrease in <Nblob>, such as that displayed by the Py-PLGA samples in Figure 4C, is normally associated with smaller Vblob and larger <kblob> values, since kblob = kdiff × (1/Vblob). The decrease of both <Nblob> in Figure 4C and <kblob> in Figure 5C for the Py-PLGA samples with increasing GdHCl concentration was thus noticeable. The constancy of Nblob with GdHCl concentration found for the Py-PDLGA samples suggested that Vblob did not change. Therefore, the ~30% decrease in kblob observed for Py-PDLGA must have been a consequence of the increase in viscosity associated with the addition of large amounts of GdHCl. The similarity of the kblob-vs-[GdHCl] trends in Figure 5C for both Py-PLGA and Py-PDLGA, coupled with the fact that they were labeled with pyrene in the same manner, suggested that both samples shared a same Vblob, which remained constant over the range of GdHCl concentrations studied. This implied that the decrease in Nblob found for Py-PLGA in Figure 4C with increasing GdHCl concentration reflected a decrease in the local polypeptide concentration experienced by an excited pyrenyl label, as expected with the unravelling of the PLGA α–helix. The reduction in the local peptide concentration as Py-PLGA transitions from an α–helix to a random coil also leads to a reduction in [Py]loc, which explains the more pronounced change in the IE/IM-vs-[GdHCl] trends observed for Py-PLGA than those observed for Py-PDLGA in Figure 2C,D, respectively.
In summary, Nblob appeared to be a direct measure of the number of structural units encompassed inside Vblob. Since Vblob did not change with GdHCl concentration, Nblob thus reflected the local density of the polypeptides in solution. This conclusion is supported by earlier reports, which also suggested that FBM experiments report directly on the local density of a polypeptide as experienced by an excited pyrenyl label [15,16]. Consequently, the results obtained up to this point suggested that the Nblob values reported in Figure 4C reflected the extent of structured PLGA existing in the solution, and could possibly be handled in the same manner as other structural parameters commonly used to gauge the structural content of polypeptides in solution such as ellipticity [20,21,22,23,24,25], fluorescence intensity [25,26], or fluorescence anisotropy [26]. The implication of this conclusion was that Nblob could be employed to probe the stability of a polypeptide upon addition of a denaturant. These considerations are discussed hereafter.
4. Discussion
4.1. Unfolding of a Protein According to the Two-State Model
The stability of a protein is usually defined by its ability to resist unfolding upon being subject to denaturing forces resulting from the addition of a denaturing agent, a sudden change in solution pH, or a step increase in temperature [28,29,34]. A quantitative measure of the stability of a protein is provided by the change in Gibbs energy (ΔunfoldG(H2O)) between the folded (N) and fully unfolded (D) conformation of a protein in water. Numerous reports in the literature suggest that the folding of many proteins follows the two-state model, whereby an equilibrium exists between the denatured and native state of proteins, as shown in Equation (4) [28,29].
The equilibrium constant Kunfold describing the equilibrium between the native and unfolded protein can be related to ΔunfoldG(H2O) according to Equation (5), where fD and fN represent the molar fractions of denatured and native protein, respectively. In turn, the ratio fD/fN is expected to be well represented by an experimental observable (Y), that accurately reflects the extent of denaturation experienced by the protein of interest.
Based on the Linear Extrapolation Method (LEM) first introduced by Green and Pace [20], a plot of Ln(fD/fN) should decrease linearly with the denaturant concentration as shown in Equation (6), with the y-intercept yielding ΔunfoldG(H2O). In water, ΔunfoldG(H2O) values around ~40 kJ·mol−1 have been reported for ~300 aa-long proteins [29]. The slope (m) is related to the ability of the denaturant to unfold a protein and would take a value of ~4 kJ·mol−1·M−1 [29].
4.2. Using <Nblob> as a Structural Parameter
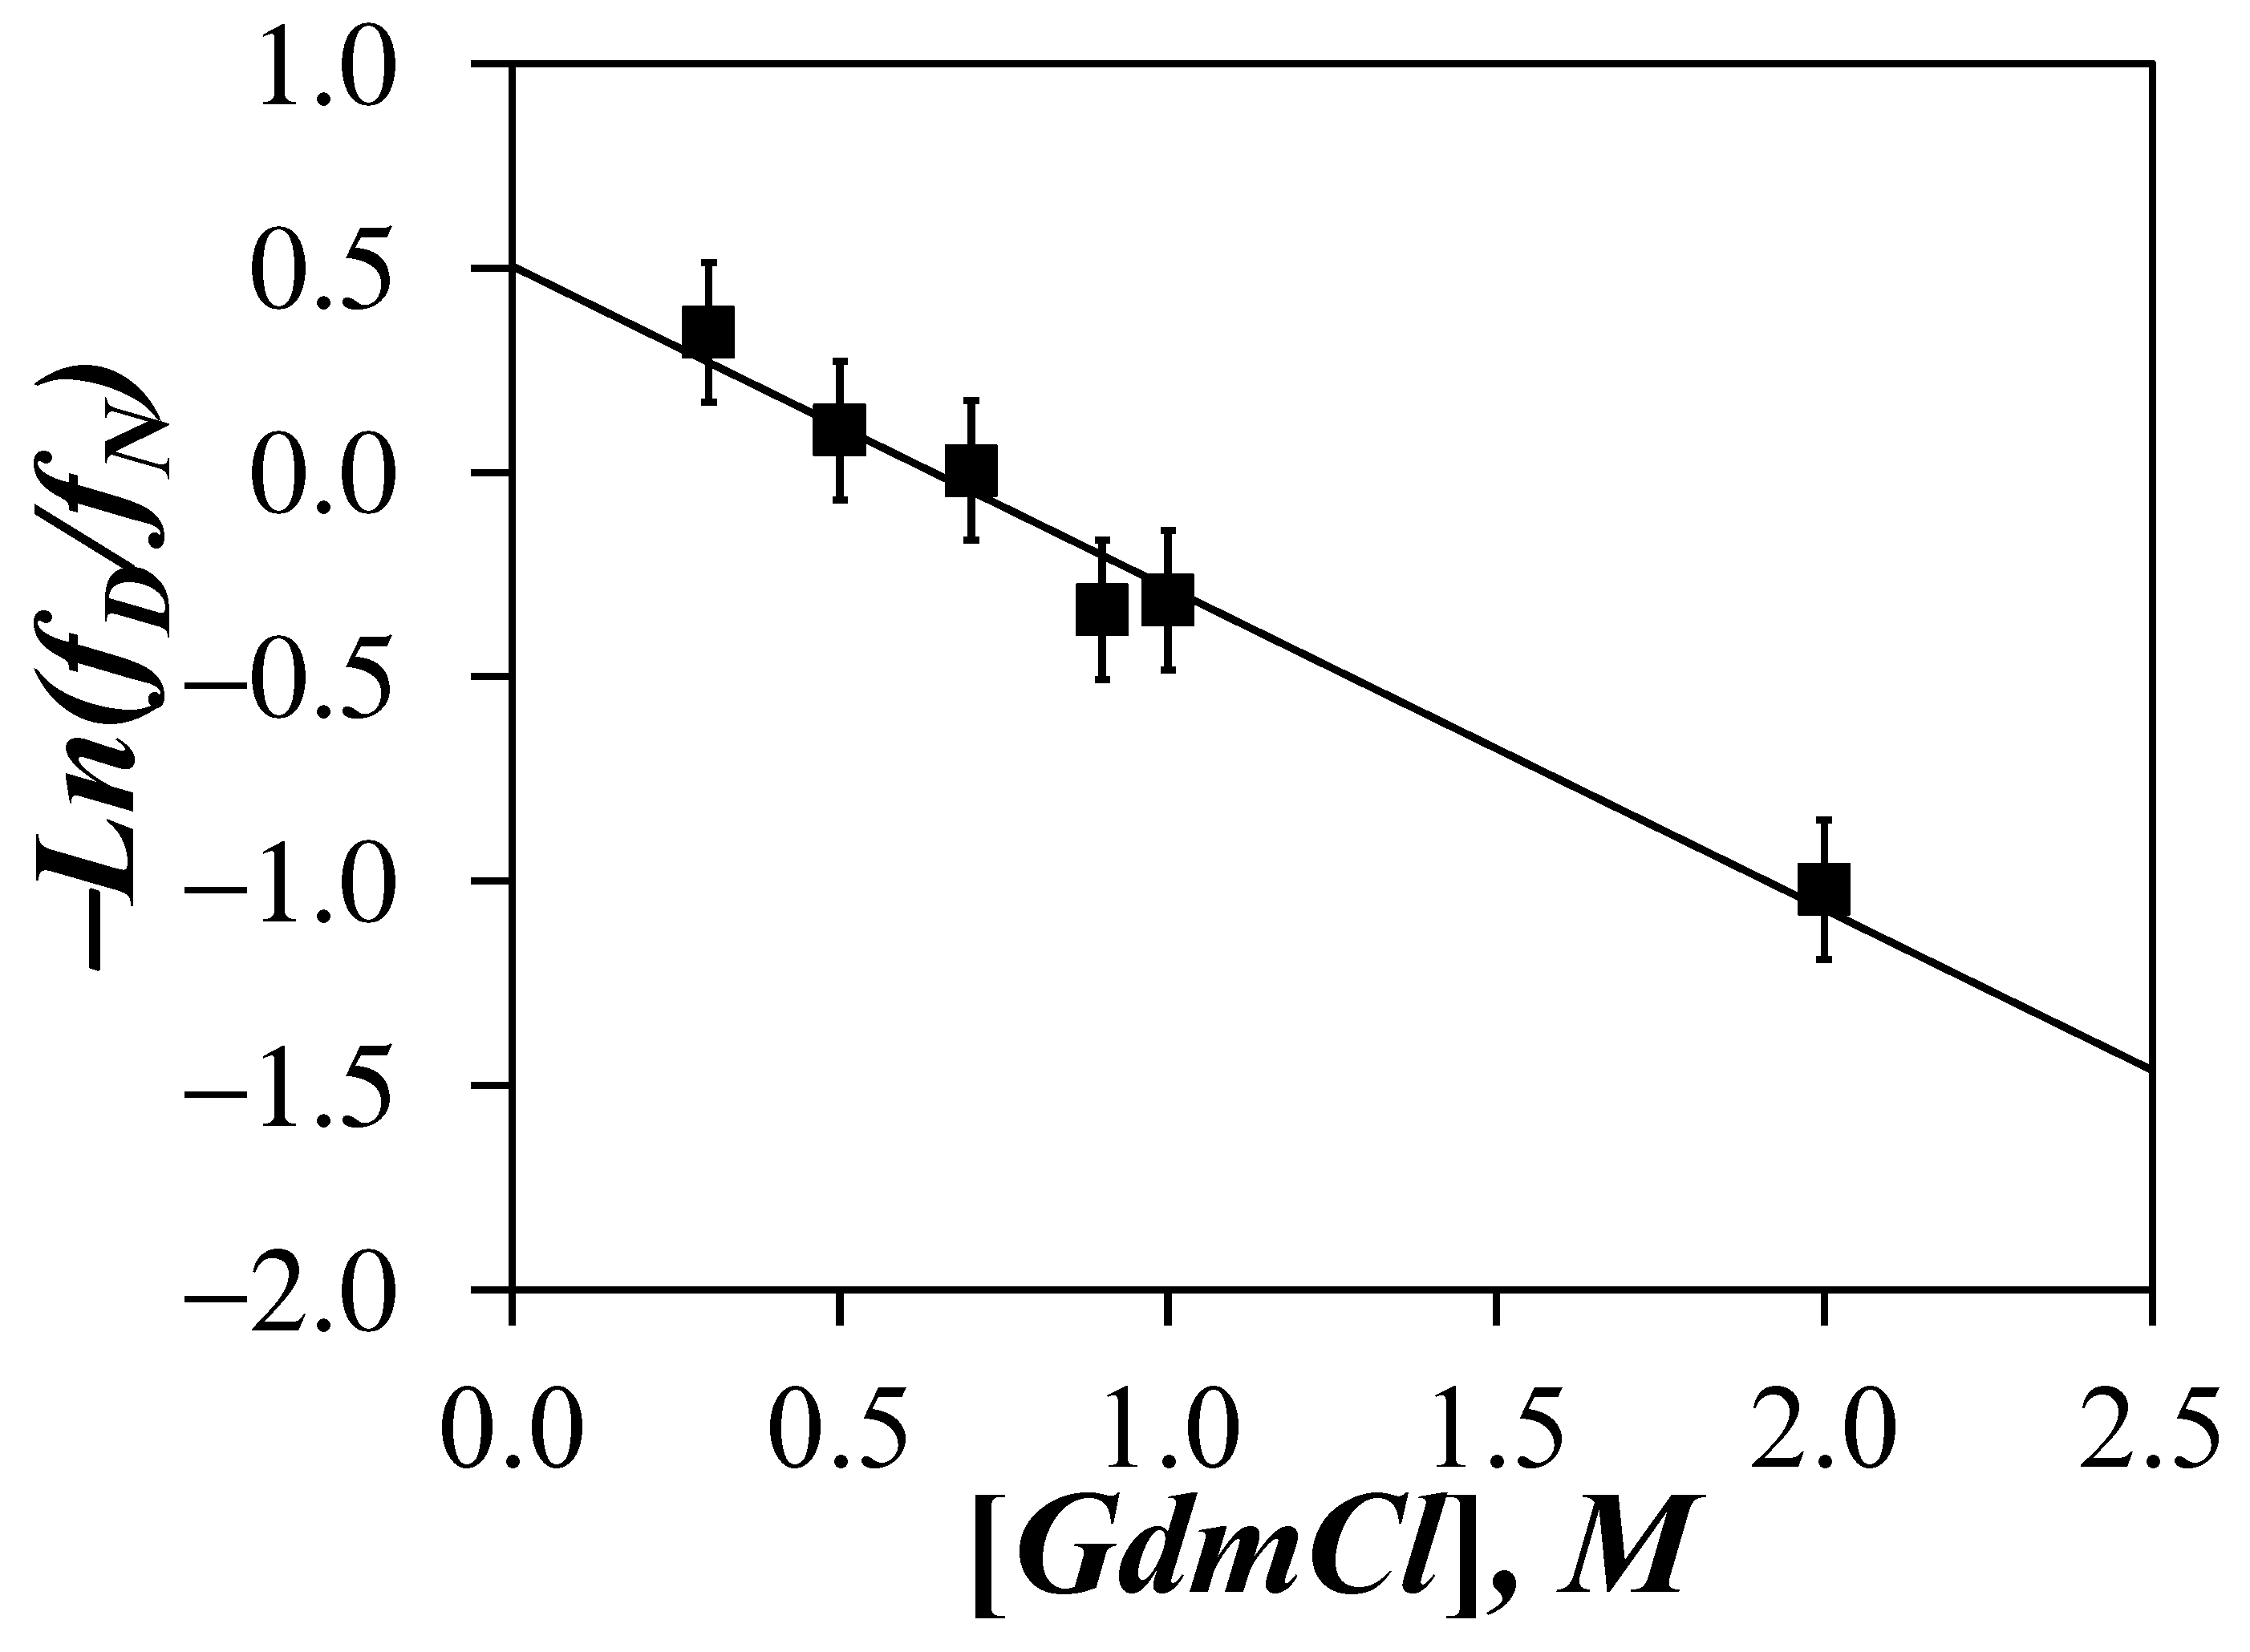
Since the <Nblob>-vs-[GdHCl] trends obtained in Figure 4C suggested that <Nblob> reflected the structural content of the Py-PLGA samples in DMF as a function of GdHCl concentration, we decided to investigate whether <Nblob> could be taken as such an observable (i.e., Y = <Nblob> in Equation (5)) to determine ΔunfoldG(DMF) for the unfolding of an α–helical PLGA in DMF into a random coil upon addition of GdHCl. We also note that while the ellipticity of a protein determined by circular dichroism is normally the observable of choice to determine ΔunfoldG(H2O), the strong amide absorption of DMF would rule out the use of CD to determine ΔunfoldG(DMF) for the unfolding of a protein in DMF. The <Nblob> values obtained in Figure 4C were introduced into Equation (5) to determine the fD/fN ratio for GdHCl concentrations between 0.3 and 2 M, using an <Nblob> value of 20.2 and 10.4 obtained for α–helical Py-PLGA in DMF without GdHCl and randomly coiled Py-PDLGA in DMF over all GdHCl concentrations for the YN and YD values, respectively. −Ln(fD/fN) was plotted as a function of GdHCl concentration in Figure 6. A satisfactory straight line was obtained with an intercept corresponding to a ΔunfoldG(DMF) value of 1.3 (±0.2) kJ·mol−1 and an m value of 1.9 (±0.2) kJ·mol−1·M−1.
Application of the LEM using <Nblob> as an experimental observable to measure ΔunfoldG(DMF) for the unfolding of PLGA in DMF upon the addition of GdHCl resulted in a surprisingly good linearity between −Ln(fD/fN) and the GdHCl concentration in Figure 6. The ΔunfoldG(DMF) value of 1.3 (±0.2) kJ·mol−1 obtained from the y-intercept of the plot was more than one order of magnitude lower than the ΔunfoldG(H2O) values reported for the unfolding of globular proteins in water [29]. Such a difference between ΔunfoldG(DMF) and ΔunfoldG(H2O) was to be expected. Beside the fact that DMF was used instead of H2O, the main difference in stability between PLGA and proteins was most likely due to the extended conformation of α–helical PLGA, which could not benefit from the many additional stabilizing interactions existing between the structural motives found in the interior of globular proteins in water [35,36,37,38]. Instead, internal H-bonds between the amide bonds of the polypeptide backbone were the only stabilizing contributions to the structural integrity of the PLGA α–helix [39], which were easily neutralized by the addition of GdHCl. These considerations rationalize the rather low ΔunfoldG(DMF) value obtain for PLGA in DMF. Although low, the m value of 1.9 (±0.2) kJ·mol−1·M−1 retrieved for PLGA was only half the value expected for globular proteins, suggesting that the unfolding of the PLGA α–helix in DMF results in substantial exposure of the glutamic acid residues to the solvent.
4.3. Strengths and Weaknesses of PEF-Based Macromolecular Structure Determination
As already discussed in earlier works [7,8,9,10,11,12], the FBM analysis of the PEF signal generated by macromolecules randomly labeled with pyrene yields the parameter Nblob, which describes the conformation of structured macromolecules in solution. The fact that the macromolecule needs to be randomly labeled does not require specific attachment points, and can be polydisperse represents important advantages to the method. It also takes advantage of the outstanding sensitivity of fluorescence to probe macromolecules under extremely dilute conditions, typically at concentrations around 1 mg/L, two-to-three orders of magnitude lower than most other standard techniques used for structure determination like scattering or NMR. Despite its formidable advantages, the PEF-based method also has some important disadvantages, which should not be overlooked. First, pyrene is hydrophobic and aggregates in water, making the structural study of pyrene-labeled macromolecules in water challenging [40]. Second, the random labeling of a macromolecule is well suited to characterize its structure in solution as long as the pyrenyl labels are attached at its periphery such as onto the side groups of helices of amylose [7] or PLGA or poly(L-lysine) [8,9,10,11,12]. In the case of a protein containing several closely packed structural motives, the random introduction of pyrenyl labels onto the motives would interfere with their tight packing, which would affect the structure of the protein. Third, a PEF experiment reports on a macromolecular structure over a length scale, that is defined by the reach of a pyrenyl label bound to the macromolecule via a linker of specific length. In the case of the PGAs randomly labeled with 1-pyrenemethylamine, the maximum distance separating two α–carbon in the polypeptide backbone would equal 3.1 (±0.2) and 3.1 (±0.4) nm for α–helical PLGA and randomly coiled PDLGA constructs, which corresponded to <Nblob> values of 20.5 (±1.5) and 10.5 (±1.5) in DMF, respectively. Fourth, polymers containing chemical groups such as amines [11] or primary amides (but not secondary or tertiary amides) capable of quenching the pyrene fluorescence cannot be studied. Nevertheless, and despite these drawbacks, many synthetic and natural polymers remain, whose characterization would strongly benefit from the determination of their conformation in solution through a PEF study.
5. Conclusions
A series of experiments were conducted, where the PEF of Py-PLGA and Py-PDLGA constructs in DMF was analyzed with the FBM to yield <Nblob> as a function of the amount of GdHCl, a known denaturing agent [27], that was added to the solution. <Nblob> decreased progressively from a value of 20.2 (±1.8) for Py-PLGA in DMF without GdHCl to 10.2 (±1.5) in DMF with 4 or 5 M GdHCl. Since <Nblob> values of ~20 and ~10 are those expected for α–helical and randomly coiled Py-PLGA, respectively [9,10,12], the <Nblob>-vs-[GdHCl] trend obtained for Py-PLGA in Figure 4C was taken as evidence that these FBM experiments reflected the unravelling of the PLGA α–helix as GdHCl was added to the solution. Furthermore, the constancy of <Nblob> observed for the Py-PDLGA samples suggested that the blob volume (Vblob) remained constant with GdHCl concentration and that the decrease in kblob with increasing GdHCl concentration observed for Py-PDLGA must have been due to an increase in solution viscosity with increasing GdHCl concentration. Combining the constancy in Vblob with the similarity of the kblob-vs-[GdHCl] plots obtained for the Py-PLGA and Py-PDLGA samples led to the conclusion, that Vblobs remained constant for the Py-PLGA samples and that Nblob reflected the change in polymer density experienced by an excited pyrenyl label as the PLGA α–helix unraveled upon addition of GdHCl. This conclusion agreed with those reached in earlier studies [15,16] and represents an important improvement in the applicability of the FBM to probe the local density of macromolecules in solution, a feature that used to be mainly accessible by scattering techniques.
The inferred ability of <Nblob> to report on the extent of structural content of the PLGA α–helix was further confirmed by applying the LEM to determine the change in Gibbs energy (ΔunfoldG(DMF)) for the unfolding of PLGA in DMF upon addition of GdHCl. The good linearity observed in Figure 6 between −Ln(fD/fN) and the GdHCl concentration suggested that <Nblob> reported accurately on the structural content of PLGA. The low ΔunfoldG(DMF) value retrieved from this analysis was mostly a consequence of dealing with an isolated α–helix, whose stability was the result of intramolecular H-bonding between the backbone amides [39]. These would represent fairly weak interactions compared to those experienced by the different structural motives inside a globular proteins [35,36,37,38], which must contribute to the higher ΔunfoldG(H2O) values obtained for the unfolding of proteins in aqueous solutions.
In summary, this study provides further support to the notion that a combination of PEF and FBM analysis of pyrene-labeled macromolecules yields information about the density of macromolecules in solution. Because PEF occurs locally over ~3 nm in the case of Py-PGA constructs, the ability to use Nblob to probe the density of macromolecules over a ~3 nm length scale offers a means to probe macromolecules in solution at close range, a feature that should nicely complement the studies of macromolecules by scattering techniques, that typically probe entire macromolecules. Consequently, the PEF study of pyrene-labeled macromolecules opens new venues of research to characterize the conformation of complex macromolecules in solution.
Supplementary Materials
The following are available online at https://0-www-mdpi-com.brum.beds.ac.uk/article/10.3390/polym13111690/s1, FBM equations, plot of k2 as a function of GdHCl concentration, tables of parameters retrieved from the FBM of the fluorescence decays acquired with the Py-PLGA and Py-PDLGA samples.
Author Contributions
W.Y. conducted all experiments and wrote the first draft of this manuscript; R.C. ensured the day-to-day supervision and training of W.Y. and prepared the polypeptides used in this study; J.D. oversaw the project and wrote the final report submitted for publication. All authors have read and agreed to the published version of the manuscript.
Funding
This research was funded by the Natural Sciences and Engineering Research Council of Canada (NSERC).
Institutional Review Board Statement
Not applicable.
Informed Consent Statement
Not applicable.
Data Availability Statement
The data presented in this study are available on request from the corresponding author.
Conflicts of Interest
The authors declare no conflict of interest. The funders had no role in the design of the study; in the collection, analyses, or interpretation of data; in the writing of the manuscript, or in the decision to publish the results.
References
- Mathew, A.; Siu, H.; Duhamel, J. A Blob Model to Study Chain Folding by Fluorescence. Macromolecules 1999, 32, 7100–7108. [Google Scholar] [CrossRef]
- Duhamel, J. Polymer Chain Dynamics in Solution Probed with a Fluorescence Blob Model. Acc. Chem. Res. 2006, 39, 953–960. [Google Scholar] [CrossRef] [PubMed]
- Duhamel, J. New Insights in the Study of Pyrene Excimer Fluorescence to Characterize Macromolecules and their Supramolecular Assemblies in Solution. Langmuir 2012, 28, 6527–6538. [Google Scholar] [CrossRef] [PubMed]
- Duhamel, J. Global Analysis of Fluorescence Decays to Probe the Internal Dynamics of Fluorescently Labeled Macromolecules. Langmuir 2014, 30, 2307–2324. [Google Scholar] [CrossRef] [PubMed]
- Farhangi, S.; Duhamel, J. Long Range Polymer Chain Dynamics Studied by Fluorescence Quenching. Macromolecules 2016, 49, 6149–6162. [Google Scholar] [CrossRef] [Green Version]
- Hall, T.; Whitton, G.; Casier, R.; Gauthier, M.; Duhamel, J. Arborescent Poly(L-glutamic acid)s as Standards to Study the Dense Interior of Polypeptide Mesoglobules by Pyrene Excimer Fluorescence. Macromolecules 2018, 51, 7914–7923. [Google Scholar] [CrossRef]
- Li, L.; Duhamel, J. Conformation of Pyrene-Labeled Amylose in DMSO Characterized with the Fluorescence Blob Model. Macromolecules 2016, 49, 7965–7974. [Google Scholar] [CrossRef] [Green Version]
- Duhamel, J.; Kanagalingam, S.; O’Brien, T.; Ingratta, M. Side-Chain Dynamics of an α–Helical Polypeptide Monitored by Fluorescence. J. Am. Chem. Soc. 2003, 125, 12810–12822. [Google Scholar] [CrossRef]
- Ingratta, M.; Duhamel, J. Effect of Side-chain Length on the Side-chain Dynamics of α–Helical Poly(L-glutamic acid) as Probed by a Fluorescence Blob Model. J. Phys. Chem. B 2008, 112, 9209–9218. [Google Scholar] [CrossRef] [PubMed]
- Casier, R.; Duhamel, J. Pyrene Excimer Fluorescence as a Direct and Easy Experimental Means to Characterize the Length Scale and Dynamics of Polypeptide Foldons. Macromolecules 2018, 51, 3450–3457. [Google Scholar] [CrossRef]
- Casier, R.; Duhamel, J. The Effect of Structure on Polypeptide Blobs: A Model Study Using Poly(L-Lysine). Langmuir 2020, 36, 7980–7990. [Google Scholar] [CrossRef] [PubMed]
- Casier, R.; Duhamel, J. The Effect of Like-Charges on the Conformation and Internal Dynamics of Polypeptides Probed by Pyrene Excimer Fluorescence. Macromolecules 2020, 53, 5147–5157. [Google Scholar] [CrossRef]
- Li, L.; Kim, D.; Zhai, X.; Duhamel, J. A Pyrene Excimer Fluorescence (PEF) Study of the Interior of Amylopectin in Dilute Solution. Macromolecules 2020, 53, 6850–6860. [Google Scholar] [CrossRef]
- Li, L.; Duhamel, J. Interior of Amylopectin and Nanosized Amylopectin Fragments Probed by Viscometry, Dynamic Light Scattering, and Pyrene Excimer Formation. Polymers 2020, 12, 2649. [Google Scholar] [CrossRef] [PubMed]
- Casier, R.; Duhamel, J. Blob-Based Approach to Estimate the Folding Time of Proteins Supported by Pyrene Excimer Fluorescence Experiments. Macromolecules 2020, 53, 9823–9835. [Google Scholar] [CrossRef]
- Casier, R.; Duhamel, J. Blob-Based Predictions of Protein Folding Times from the Amino Acid Dependent Conformation of Polypeptides in Solution. Macromolecules 2021, 54, 919–929. [Google Scholar] [CrossRef]
- Schatz, C.; Pichot, C.; Delair, T.; Viton, C.; Domard, A. Static Light Scattering Studies on Chitosan Solutions: From Macromolecular Chains to Colloidal Dispersions. Langmuir 2003, 19, 9896–9903. [Google Scholar] [CrossRef]
- Rajapaksha, A.; Stanley, C.B.; Todd, B.A. Effects of Macromolecular Crowding on the Structure of a Protein Complex: A Small Angle Scattering Study of Peroxide Dismutase. Biophys. J. 2015, 108, 967–974. [Google Scholar] [CrossRef] [Green Version]
- Kikuchi, M.; Nakano, R.; Jinbo, Y.; Saito, Y.; Ohno, S.; Togashi, D.; Enomoto, K.; Narumi, A.; Haba, O.; Kawaguchi, S. Graft Density Dependence of Main Chain Stiffness in Molecular Rod Brushes. Macromolecules 2015, 48, 5878–5886. [Google Scholar] [CrossRef]
- Greene, R.F.; Pace, C.N. Urea and Guanidinium Hydrochloride Denaturation of Ribonuclease, Lysozyme, a-Chimotrypsin, and b-Lactoglobulin. J. Biol. Chem. 1974, 249, 5388–5393. [Google Scholar] [CrossRef]
- Santoro, M.M.; Bolen, D.W. Unfolding Free Energy Changes Determined by the Linear Extrapolation Method. 1. Unfolding of Phenylmethanesulfonyl a-Chymotrypsin Using Different Denaturants. Biochemistry 1988, 27, 8063–8068. [Google Scholar] [CrossRef]
- Santoro, M.M.; Bolen, D.W. A Test of the Linear Extrapolation of Unfolding Free Energy Changes over an Extended Denaturant Concentration Range. Biochemistry 1992, 31, 4901–4907. [Google Scholar] [CrossRef]
- Smith, J.S.; Scholtz, J.M. Guanidine Hydrochloride Unfolding of Peptide Helices: Separation of Denaturant and Salt Effects. Biochemistry 1996, 35, 7292–7297. [Google Scholar] [CrossRef]
- Curnow, P.; Booth, P.J. Combined Kinetic and Thermodynamic Analysis of a-Helical Membrane Protein Unfolding. Proc. Natl. Acad. Sci. USA 2007, 104, 18970–18975. [Google Scholar] [CrossRef] [Green Version]
- Findlay, H.E.; Rutherford, N.G.; Henderson, P.J.F.; Booth, P.J. Unfolding Free Energy of a Two Domain Transmembrane Sugar Transport Protein. Proc. Natl. Acad. Sci. USA 2010, 107, 18451–18456. [Google Scholar] [CrossRef] [Green Version]
- Patra, M.; Mukhopadhyay, C.; Chakrabarti, A. Probing Conformational Stability and Dynamics of Erythroid and Nonerythroid Spectrin: Effect of Urea and Guanidine Hydrochloride. PLoS ONE 2015, 10, e0116991. [Google Scholar] [CrossRef]
- Tanford, C.; Kawahara, K.; Lapanje, S. Proteins as Random Coils. I. Intrinsic Viscosity and Sedimentation Coefficients in Concentrated Guanidine Hydrochloride. J. Am. Chem. Soc. 1967, 89, 729–736. [Google Scholar] [CrossRef]
- Flecha, F.L.G. Kinetic Stability of Membrane Proteins. Biophys. Rev. 2017, 9, 563–572. [Google Scholar] [CrossRef] [Green Version]
- Kazlauskas, R. Engineering more Stable Proteins. Chem. Soc. Rev. 2018, 47, 9026–9045. [Google Scholar] [CrossRef]
- Press, W.H.; Flannery, B.P.; Teukolsky, S.A.; Vetterling, W.T. Numerical Recipes. The Art of Scientific Computing (Fortran Version); Cambridge University Press: Cambridge, UK, 1992; p. 82. [Google Scholar]
- Yamaoka, K.; Ueda, K. Reversing-Pulse Electric Birefringence Study of Helical Poly(a-L-glutamic acid) in N,N-Dimethylformamide with Emphasis on a New Data Analysis for the Polydisperse System. J. Phys. Chem. 1982, 86, 406–413. [Google Scholar] [CrossRef]
- Cuniberti, C.; Perico, A. Intramolecular Excimer Formation in Polymers. Pyrene-Labeled Polyvinylacetate. Eur. Polym. J. 1980, 16, 887–893. [Google Scholar] [CrossRef]
- Lakowicz, J.R. Principles of Fluorescence Spectroscopy, 2nd ed.; Kluwer Acad.: New York, NY, USA, 1999; p. 241. [Google Scholar]
- Bedouelle, P. Principles and Equations for Measuring and Interpreting Protein Stability: From Monomer to Tetramer. Biochimie 2016, 121, 29–37. [Google Scholar] [CrossRef]
- Karshikoff, A.; Ladenstein, R. Ion Pairs and the Thermotolerance of Proteins from Hyperthermophiles: A ‘Traffic Rule’ for Hot Roads. Trends Biochem. Sci. 2001, 26, 550–557. [Google Scholar] [CrossRef]
- Kumar, S.; Nussinov, R. Close-Range Electrostatic Interactions in Proteins. ChemBioChem 2002, 3, 604–617. [Google Scholar] [CrossRef]
- Fass, D. Disulfide Bonding in Protein Biophysics. Annu. Rev. Biophys. 2012, 41, 63–79. [Google Scholar] [CrossRef]
- Pace, N.C.; Scholtz, J.M.; Grimsley, G.R. Forces Stabilizing Proteins. FEBS Lett. 2014, 588, 2177–2184. [Google Scholar] [CrossRef] [Green Version]
- Pauling, L.; Corey, R.B.; Branson, H.R. The Structure of Proteins: Two Hydrogen-Bonded Helical Configurations of the Polypeptide Chain. Proc. Natl. Acad. Sci.USA 1951, 37, 205–211. [Google Scholar] [CrossRef] [Green Version]
- Winnik, F.M.; Winnik, F.M. Photophysics of Preassociated Pyrenes in Aqueous Polymer Solutions and in Other Organized Media. Chem. Rev. 1993, 93, 587–614. [Google Scholar] [CrossRef]
Figure 1.
Chemical structure of (A) Py(x)-PLGA (x = 2.9, 4.4, 4.9, 6.9, 9.0, and 14.3 mol%) and (B) Py(x)-PDLGA (x = 6.0, 8.0, 10.4, 11.3, and 12.3 mol%) samples used in this study.
Figure 1.
Chemical structure of (A) Py(x)-PLGA (x = 2.9, 4.4, 4.9, 6.9, 9.0, and 14.3 mol%) and (B) Py(x)-PDLGA (x = 6.0, 8.0, 10.4, 11.3, and 12.3 mol%) samples used in this study.

Figure 2.
SSF spectra of (A) Py(14.0)-PLGA and (B) Py(10.4)-PDLGA in DMF with different GdHCl concentrations. From bottom to top: (A) [GdHCl] = 5.0, 4.0, 3.0, 2.0, 1.0, 0.9, 0.7, 0.5, 0.3, 0.1, 0.0 M and (B) [GdHCl] = 5.0, 3.0, 1.0, 0.7, and 0.0 M. Plots of IE/IM for (C) Py(x)-PLGA, where x = ( ![Polymers 13 01690 i001]() ) 4.4, (
) 4.4, ( ![Polymers 13 01690 i002]() ) 4.9, (
) 4.9, ( ![Polymers 13 01690 i005]() ) 6.9, (
) 6.9, ( ![Polymers 13 01690 i006]() ) 9.0, and (
) 9.0, and ( ![Polymers 13 01690 i003]() ) 14.3 mol%, and (D) Py(x)-PDLGA, where x = (
) 14.3 mol%, and (D) Py(x)-PDLGA, where x = ( ![Polymers 13 01690 i001]() ) 6.0, (
) 6.0, ( ![Polymers 13 01690 i002]() ) 8.0, (
) 8.0, ( ![Polymers 13 01690 i005]() ) 10.4, (
) 10.4, ( ![Polymers 13 01690 i006]() ) 11.3, and (
) 11.3, and ( ![Polymers 13 01690 i003]() ) 12.3 mol%.
) 12.3 mol%.
 ) 4.4, (
  ) 4.9, (
  ) 6.9, (
  ) 9.0, and (
  ) 14.3 mol%, and (D) Py(x)-PDLGA, where x = ( ) 6.0, ( ) 8.0, ( ) 10.4, ( ) 11.3, and ( ) 12.3 mol%.
Figure 2.
SSF spectra of (A) Py(14.0)-PLGA and (B) Py(10.4)-PDLGA in DMF with different GdHCl concentrations. From bottom to top: (A) [GdHCl] = 5.0, 4.0, 3.0, 2.0, 1.0, 0.9, 0.7, 0.5, 0.3, 0.1, 0.0 M and (B) [GdHCl] = 5.0, 3.0, 1.0, 0.7, and 0.0 M. Plots of IE/IM for (C) Py(x)-PLGA, where x = ( ![Polymers 13 01690 i001]() ) 4.4, (
) 4.4, ( ![Polymers 13 01690 i002]() ) 4.9, (
) 4.9, ( ![Polymers 13 01690 i005]() ) 6.9, (
) 6.9, ( ![Polymers 13 01690 i006]() ) 9.0, and (
) 9.0, and ( ![Polymers 13 01690 i003]() ) 14.3 mol%, and (D) Py(x)-PDLGA, where x = (
) 14.3 mol%, and (D) Py(x)-PDLGA, where x = ( ![Polymers 13 01690 i001]() ) 6.0, (
) 6.0, ( ![Polymers 13 01690 i002]() ) 8.0, (
) 8.0, ( ![Polymers 13 01690 i005]() ) 10.4, (
) 10.4, ( ![Polymers 13 01690 i006]() ) 11.3, and (
) 11.3, and ( ![Polymers 13 01690 i003]() ) 12.3 mol%.
) 12.3 mol%.
) 4.4, ( ) 4.9, ( ) 6.9, ( ) 9.0, and ( ) 14.3 mol%, and (D) Py(x)-PDLGA, where x = ( ) 6.0, ( ) 8.0, ( ) 10.4, ( ) 11.3, and ( ) 12.3 mol%.
Figure 3.
Fluorescence decays of the pyrene (A) monomer and (B) excimer of the Py(9.0)-PLGA solutions in DMF at different GdHCl concentrations. From bottom to top: [GdHCl] = 0.1, 1.0, 5.0 mol·L−1 yielding Nblob values of 19, 15, and 11, respectively.
Figure 3.
Fluorescence decays of the pyrene (A) monomer and (B) excimer of the Py(9.0)-PLGA solutions in DMF at different GdHCl concentrations. From bottom to top: [GdHCl] = 0.1, 1.0, 5.0 mol·L−1 yielding Nblob values of 19, 15, and 11, respectively.

Figure 4.
Plot of Nblob as a function of the mole fraction (x) of pyrene-labeled glutamic acids for (A) the Py-PLGA and (B) the Py-PDLGA samples in DMF with ( ![Polymers 13 01690 i001]() ) 0 M, (
) 0 M, ( ![Polymers 13 01690 i002]() ) 0.3 M, (
) 0.3 M, ( ![Polymers 13 01690 i003]() ) 0.7 M, (
) 0.7 M, ( ![Polymers 13 01690 i004]() ) 1 M, (
) 1 M, ( ![Polymers 13 01690 i005]() ) 3 M, and (
) 3 M, and ( ![Polymers 13 01690 i006]() ) 5M GdHCl. (C) Plot of <Nblob> as a function of GdHCl concentration for (
) 5M GdHCl. (C) Plot of <Nblob> as a function of GdHCl concentration for ( ![Polymers 13 01690 i002]() ) PLGA and (
) PLGA and ( ![Polymers 13 01690 i001]() ) PDLGA.
) PDLGA.
) 0 M, ( ) 0.3 M, ( ) 0.7 M, (  ) 1 M, ( ) 3 M, and ( ) 5M GdHCl. (C) Plot of <Nblob> as a function of GdHCl concentration for ( ) PLGA and ( ) PDLGA.
Figure 4.
Plot of Nblob as a function of the mole fraction (x) of pyrene-labeled glutamic acids for (A) the Py-PLGA and (B) the Py-PDLGA samples in DMF with ( ![Polymers 13 01690 i001]() ) 0 M, (
) 0 M, ( ![Polymers 13 01690 i002]() ) 0.3 M, (
) 0.3 M, ( ![Polymers 13 01690 i003]() ) 0.7 M, (
) 0.7 M, ( ![Polymers 13 01690 i004]() ) 1 M, (
) 1 M, ( ![Polymers 13 01690 i005]() ) 3 M, and (
) 3 M, and ( ![Polymers 13 01690 i006]() ) 5M GdHCl. (C) Plot of <Nblob> as a function of GdHCl concentration for (
) 5M GdHCl. (C) Plot of <Nblob> as a function of GdHCl concentration for ( ![Polymers 13 01690 i002]() ) PLGA and (
) PLGA and ( ![Polymers 13 01690 i001]() ) PDLGA.
) PDLGA.
) 0 M, ( ) 0.3 M, ( ) 0.7 M, ( ) 1 M, ( ) 3 M, and ( ) 5M GdHCl. (C) Plot of <Nblob> as a function of GdHCl concentration for ( ) PLGA and ( ) PDLGA.
Figure 5.
Plot of kblob as a function of the mole fraction (x) of pyrene-labeled glutamic acids for (A) the Py-PLGA and (B) the Py-PDLGA samples in DMF with ( ![Polymers 13 01690 i001]() ) 0 M, (
) 0 M, ( ![Polymers 13 01690 i002]() ) 0.3 M, (
) 0.3 M, ( ![Polymers 13 01690 i003]() ) 0.7 M, (
) 0.7 M, ( ![Polymers 13 01690 i004]() ) 1 M, (
) 1 M, ( ![Polymers 13 01690 i005]() ) 3 M, and (
) 3 M, and ( ![Polymers 13 01690 i006]() ) 5 M GdHCl. (C) Plot of kblob as a function of GdHCl concentration for (
) 5 M GdHCl. (C) Plot of kblob as a function of GdHCl concentration for ( ![Polymers 13 01690 i002]() ) PLGA and (
) PLGA and ( ![Polymers 13 01690 i001]() ) PDLGA.
) PDLGA.
) 0 M, ( ) 0.3 M, ( ) 0.7 M, ( ) 1 M, ( ) 3 M, and ( ) 5 M GdHCl. (C) Plot of kblob as a function of GdHCl concentration for ( ) PLGA and ( ) PDLGA.
Figure 6.
Plot of −Ln(fD/fN) as a function of GdHCl concentration where fD and fN are calculated from the <Nblob> values obtained for Py-PLGA trend shown in Figure 4C.
Figure 6.
Plot of −Ln(fD/fN) as a function of GdHCl concentration where fD and fN are calculated from the <Nblob> values obtained for Py-PLGA trend shown in Figure 4C.

Publisher’s Note: MDPI stays neutral with regard to jurisdictional claims in published maps and institutional affiliations. |
© 2021 by the authors. Licensee MDPI, Basel, Switzerland. This article is an open access article distributed under the terms and conditions of the Creative Commons Attribution (CC BY) license (https://creativecommons.org/licenses/by/4.0/).
Share and Cite
MDPI and ACS Style
Yuan, W.; Casier, R.; Duhamel, J. Unfolding of Helical Poly(L-Glutamic Acid) in N,N-Dimethylformamide Probed by Pyrene Excimer Fluorescence (PEF). Polymers 2021, 13, 1690. https://0-doi-org.brum.beds.ac.uk/10.3390/polym13111690
AMA Style
Yuan W, Casier R, Duhamel J. Unfolding of Helical Poly(L-Glutamic Acid) in N,N-Dimethylformamide Probed by Pyrene Excimer Fluorescence (PEF). Polymers. 2021; 13(11):1690. https://0-doi-org.brum.beds.ac.uk/10.3390/polym13111690
Chicago/Turabian StyleYuan, Weize, Remi Casier, and Jean Duhamel. 2021. "Unfolding of Helical Poly(L-Glutamic Acid) in N,N-Dimethylformamide Probed by Pyrene Excimer Fluorescence (PEF)" Polymers 13, no. 11: 1690. https://0-doi-org.brum.beds.ac.uk/10.3390/polym13111690
Note that from the first issue of 2016, this journal uses article numbers instead of page numbers. See further details here.