1. Introduction
Cellulose is one of the most abundant bio-polymers on Earth. It represents 40–60% of wood mass, can be extracted in the form of 20–40 µm thick fibers upon pulping [
1] and is processed into functional nanoparticles. Among these, cellulose nanocrystals (CNC) are crystalline nano-rods with a diameter of 3–10 nm and a length of a few hundred nanometers. They are extracted from pulp fibers using an acid-mediated procedure [
2] and can be utilized for the enhancement of novel eco-friendly materials [
3] such as polyurethane foams (PUs) [
4,
5,
6].
PUs are generally composed of polyol, isocyanate and several additives. Pus’ mechanical and functional properties are determined by the typology of polyols and isocyanate precursors, by the consequent distribution of the soft and hard segments that composed the PUs polymeric matrix and by the morphological structure in terms of open or closed cells [
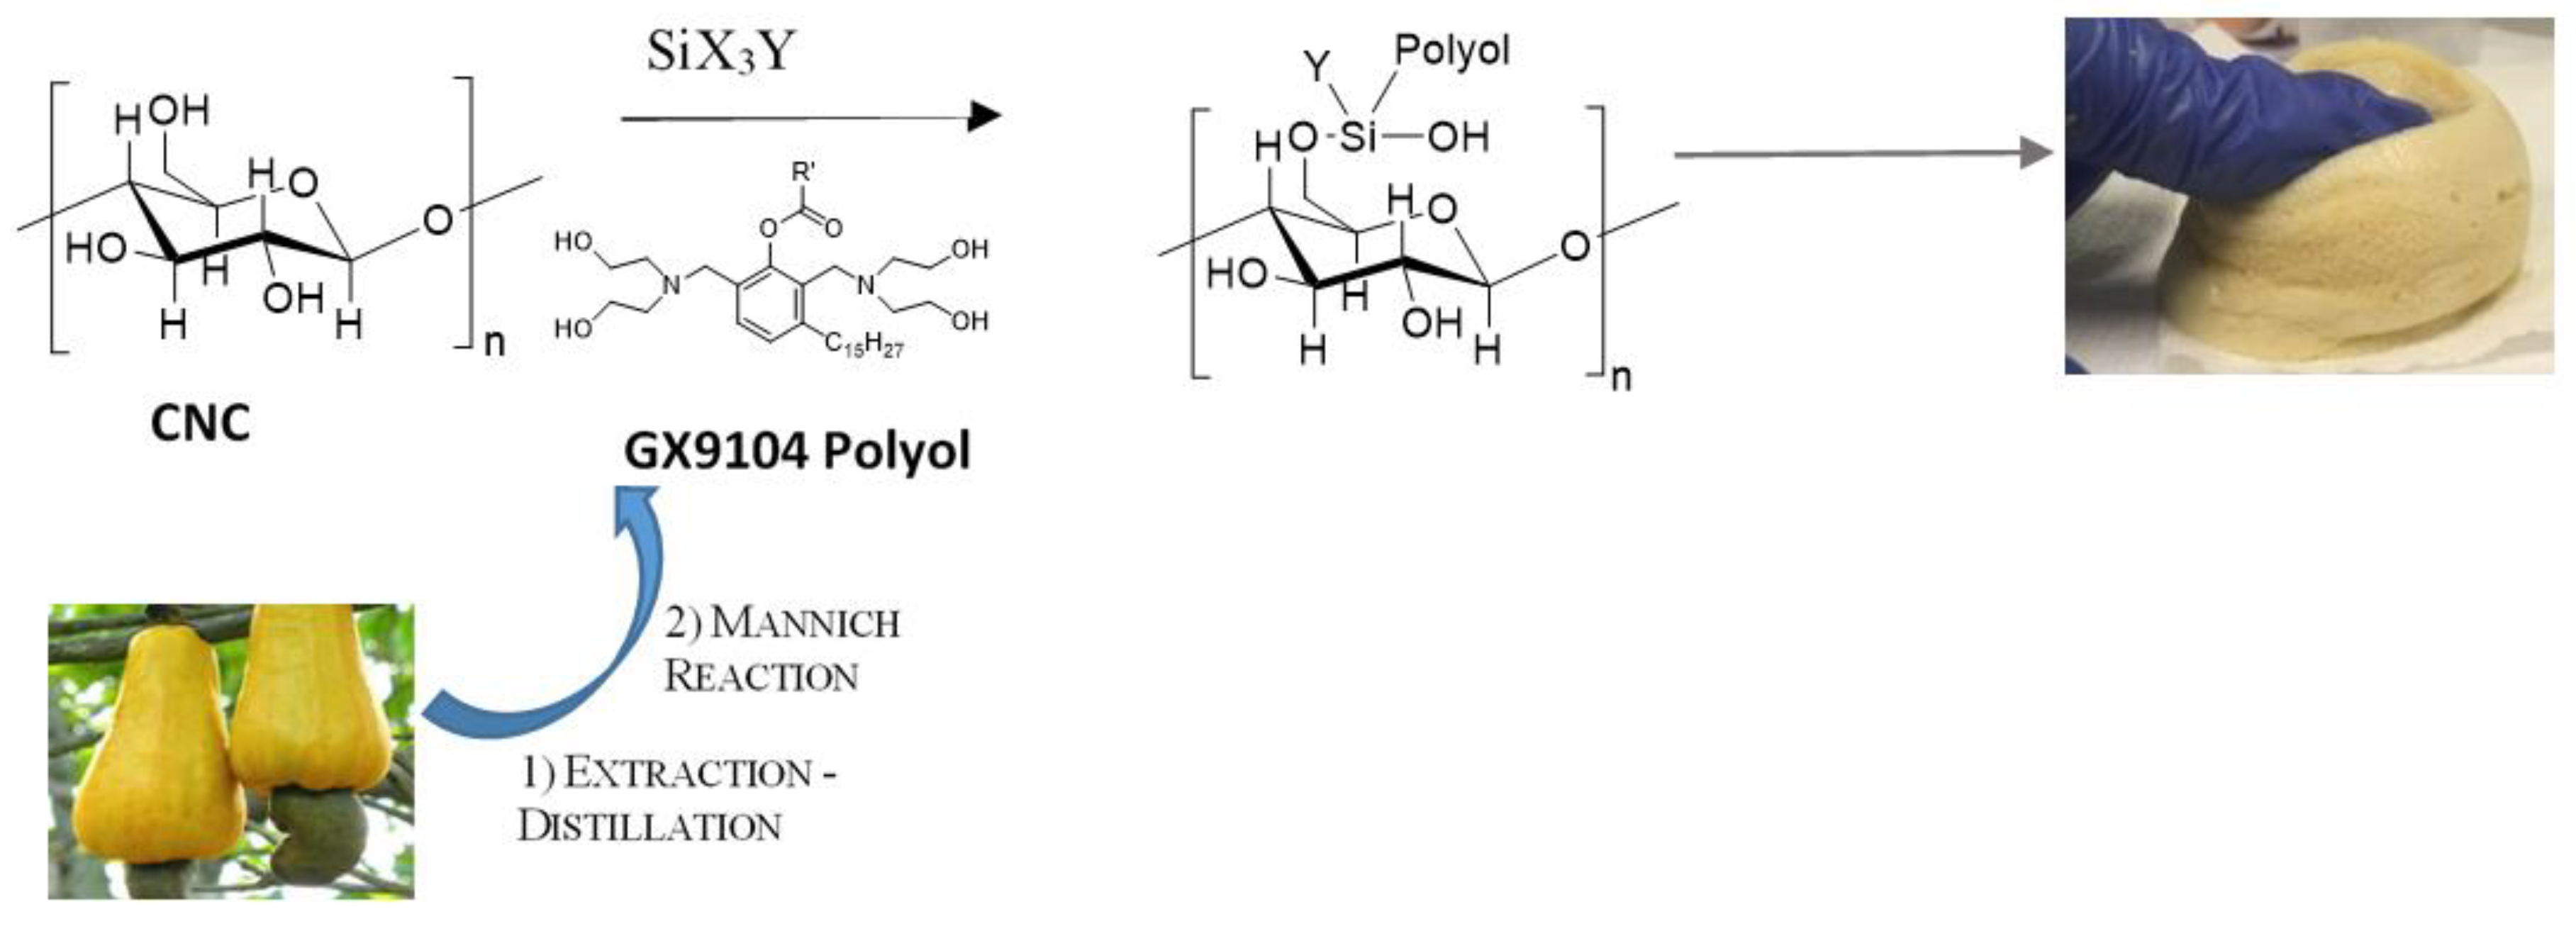
7]. Nowadays, the feasibility of using bio-based polyols to produce PUs has been strongly investigated due to the wide application fields accessible for foamed products such as biomedical, construction, aerospace, etc. Among bio-based polyols, the Mannich-based polyols derived from Cashew Nut Shell Liquid (CNSL) [
8,
9,
10], due to their chemical structure, phenolic ring and a tertiary amine (
Scheme 1), can be used for the synthesis of bio-based polyurethane (bio-PUs).
The presence of a filler, such as CNC, could act as heterogeneous nuclei for crystallization of PU and, consequently, increase the mechanical properties of foam [
11,
12,
13]. The combination of cellulose characteristics, such as low cost, chemical modification capacity, high Young’s modulus, biodegradability, abundance in nature, along with features of the nanosized materials, such as very large specific surface area, high aspect ratio, light weight, and outstanding reinforcing potential, justifies the big interest of scientists in CNC [
14]. On the other hand, the cellulose hydrophilicity leads to a bad dispersion of non-polar matrices, and the consequential nanocrystal aggregation could decrease thermo-physical and mechanical properties of the nanocomposites [
15]. The reinforcing mechanism, in fact, depends mainly on the formation of a three-dimensional network between the filler surface and matrix. Such interaction can also be improved by the formation of strong interfacial interactions or by a co-continuous phase mediated by grafted polymer chains on CNC surface [
16,
17].
Physical and chemical modification of CNC [
18] plays a key role in improving dispersibility in solvent, regulating miscibility with the hydrophobic polymer matrix, and enhancing thermal stability [
19,
20]. Functionalized PLA nanocellulose composites show better properties than their unmodified counterparts due to improved dispersion and interaction with the PLA matrix [
21].
The abundant hydroxyl groups on CNC are an essential route to altering the surface structure, regulating properties and developing functional materials. A wide range of chemical modifications can be placed on CNC surfaces through simple reactions such as oxidation and acetylation [
22,
23] and sometimes, the modification involved the grafting of functional materials and polymers.
In the literature, few examples of the formation of modified cellulose by hydrophobic polyols are reported. In 2019, Xu et al. [
24] grafted cellulose pulp with polymeric epoxidized soybean oil (ESO), as a renewable environmentally friendly and low-cost raw material, with the aim to prepare oil-absorbing materials. In the same year, Gorade et al. [
25] achieved microcrystalline cellulose (MCC) with hydrophobic property by means of chemical transesterification using rice bran oil (RBO). At the same time, Alzate-Arbeláez et al. [
26] loaded nanocellulose, derived from banana rachis, with a polyphenolic-rich extract of Andean berries (Vaccinium meridionale) through simple impregnation obtaining an antioxidant nanocomplex. Instead, bio-based formulations with adhesion properties were synthesized first by inducing the functionalization of cellulose acetate with 1,6-hexamethylene diisocyanate and then mixing the resulting biopolymer with a variable amount of castor oil to obtain bio-based polyurethane adhesives showing more suitable mechanical properties [
27].
A typical CNC monomeric unit presents at least three reactive groups suitable to be functionalized, but for sterical reasons, only one is available. Otherwise, polyols contain many hydroxyl groups, whose bulky moieties prevent the direct reaction with the reactive group of CNC. For this reason, it is necessary to introduce a spatial linker, such as a silane, to make the reaction happen. An attractive method to functionalize cellulose surface in aqueous media is by using silane chemistry. Suitable substituted trialkoxy silanes (X-Si (OR)
3), with vinyl, thiol and azido groups, can be used to impart to cellulose reactive moieties. Azido silanes are often used to promote further functionalization through click reactions [
28,
29]. 3-mercaptopryltrimethoxysilane is used to introduce -SH functionality on cellulose by thiol-ene reaction [
30]. The major problem regarding the silanization is related to the hornification that causes pore system collapse and results in a decrease in reactivity and in a modification in the 3D structure of the material. The collapse is attributed to the modification conditions which may induce disorder and misalignment of the structure of cellulose fibers (e.g., axial orientation of molecular chains and crystalline phase of the fiber are reduced) [
31]. However, silanization is classified as a mild and green approach for cellulose modification because it could occur in an aqueous medium [
32]. In contrast to conventional methods, no curing or solvent exchange is necessary, thereby the functionalized celluloses remain never-dried, and no agglomeration or hornification occurs in the process [
33]. Often the cellulose functionalization is used to increase the hydrophobic character of cellulose nanofibrils. Fathi et al. in 2017 observed that cellulose TEMPO oxidation significantly improved the bonding efficiency of the silane coupling agents on the flax fibers surface thus, the compatibility between the flax fibers and the polymer matrices, such as epoxy resin, was improved [
34]. Zimmermann et al. in 2016 modified cellulose fibers with triethoxyvinylsilane to be used as reinforcement agents in poly (ethylene-vinyl acetate) composites. The samples showed greater stiffness and increased mechanical properties creating a more compatible interface with the polymeric matrix [
35]. Rachini et al. in 2008 asserted that the formation of a chemical bond between the hydroxyl groups of the hemp fibers and the hydrolyzed silane molecules improves even the thermal decomposition of the hemp fibers [
36].
In this paper, for the first time, we report the new approach of functionalization of CNC with bio-polyol, through the silane chemistry functionalization, in order to be used as a successful reactive filler in bio-based polyurethane flexible foams, PUFs. The alkyl silanes were used as efficient coupling agents for the grafting of CNC and bio-polyols. Four different strategies to obtain CNC grafted with polyol (CNC-grafted-Polyol) were fine-tuned to use CNC as reactive filler in bio-based PUFs (
Scheme 1).
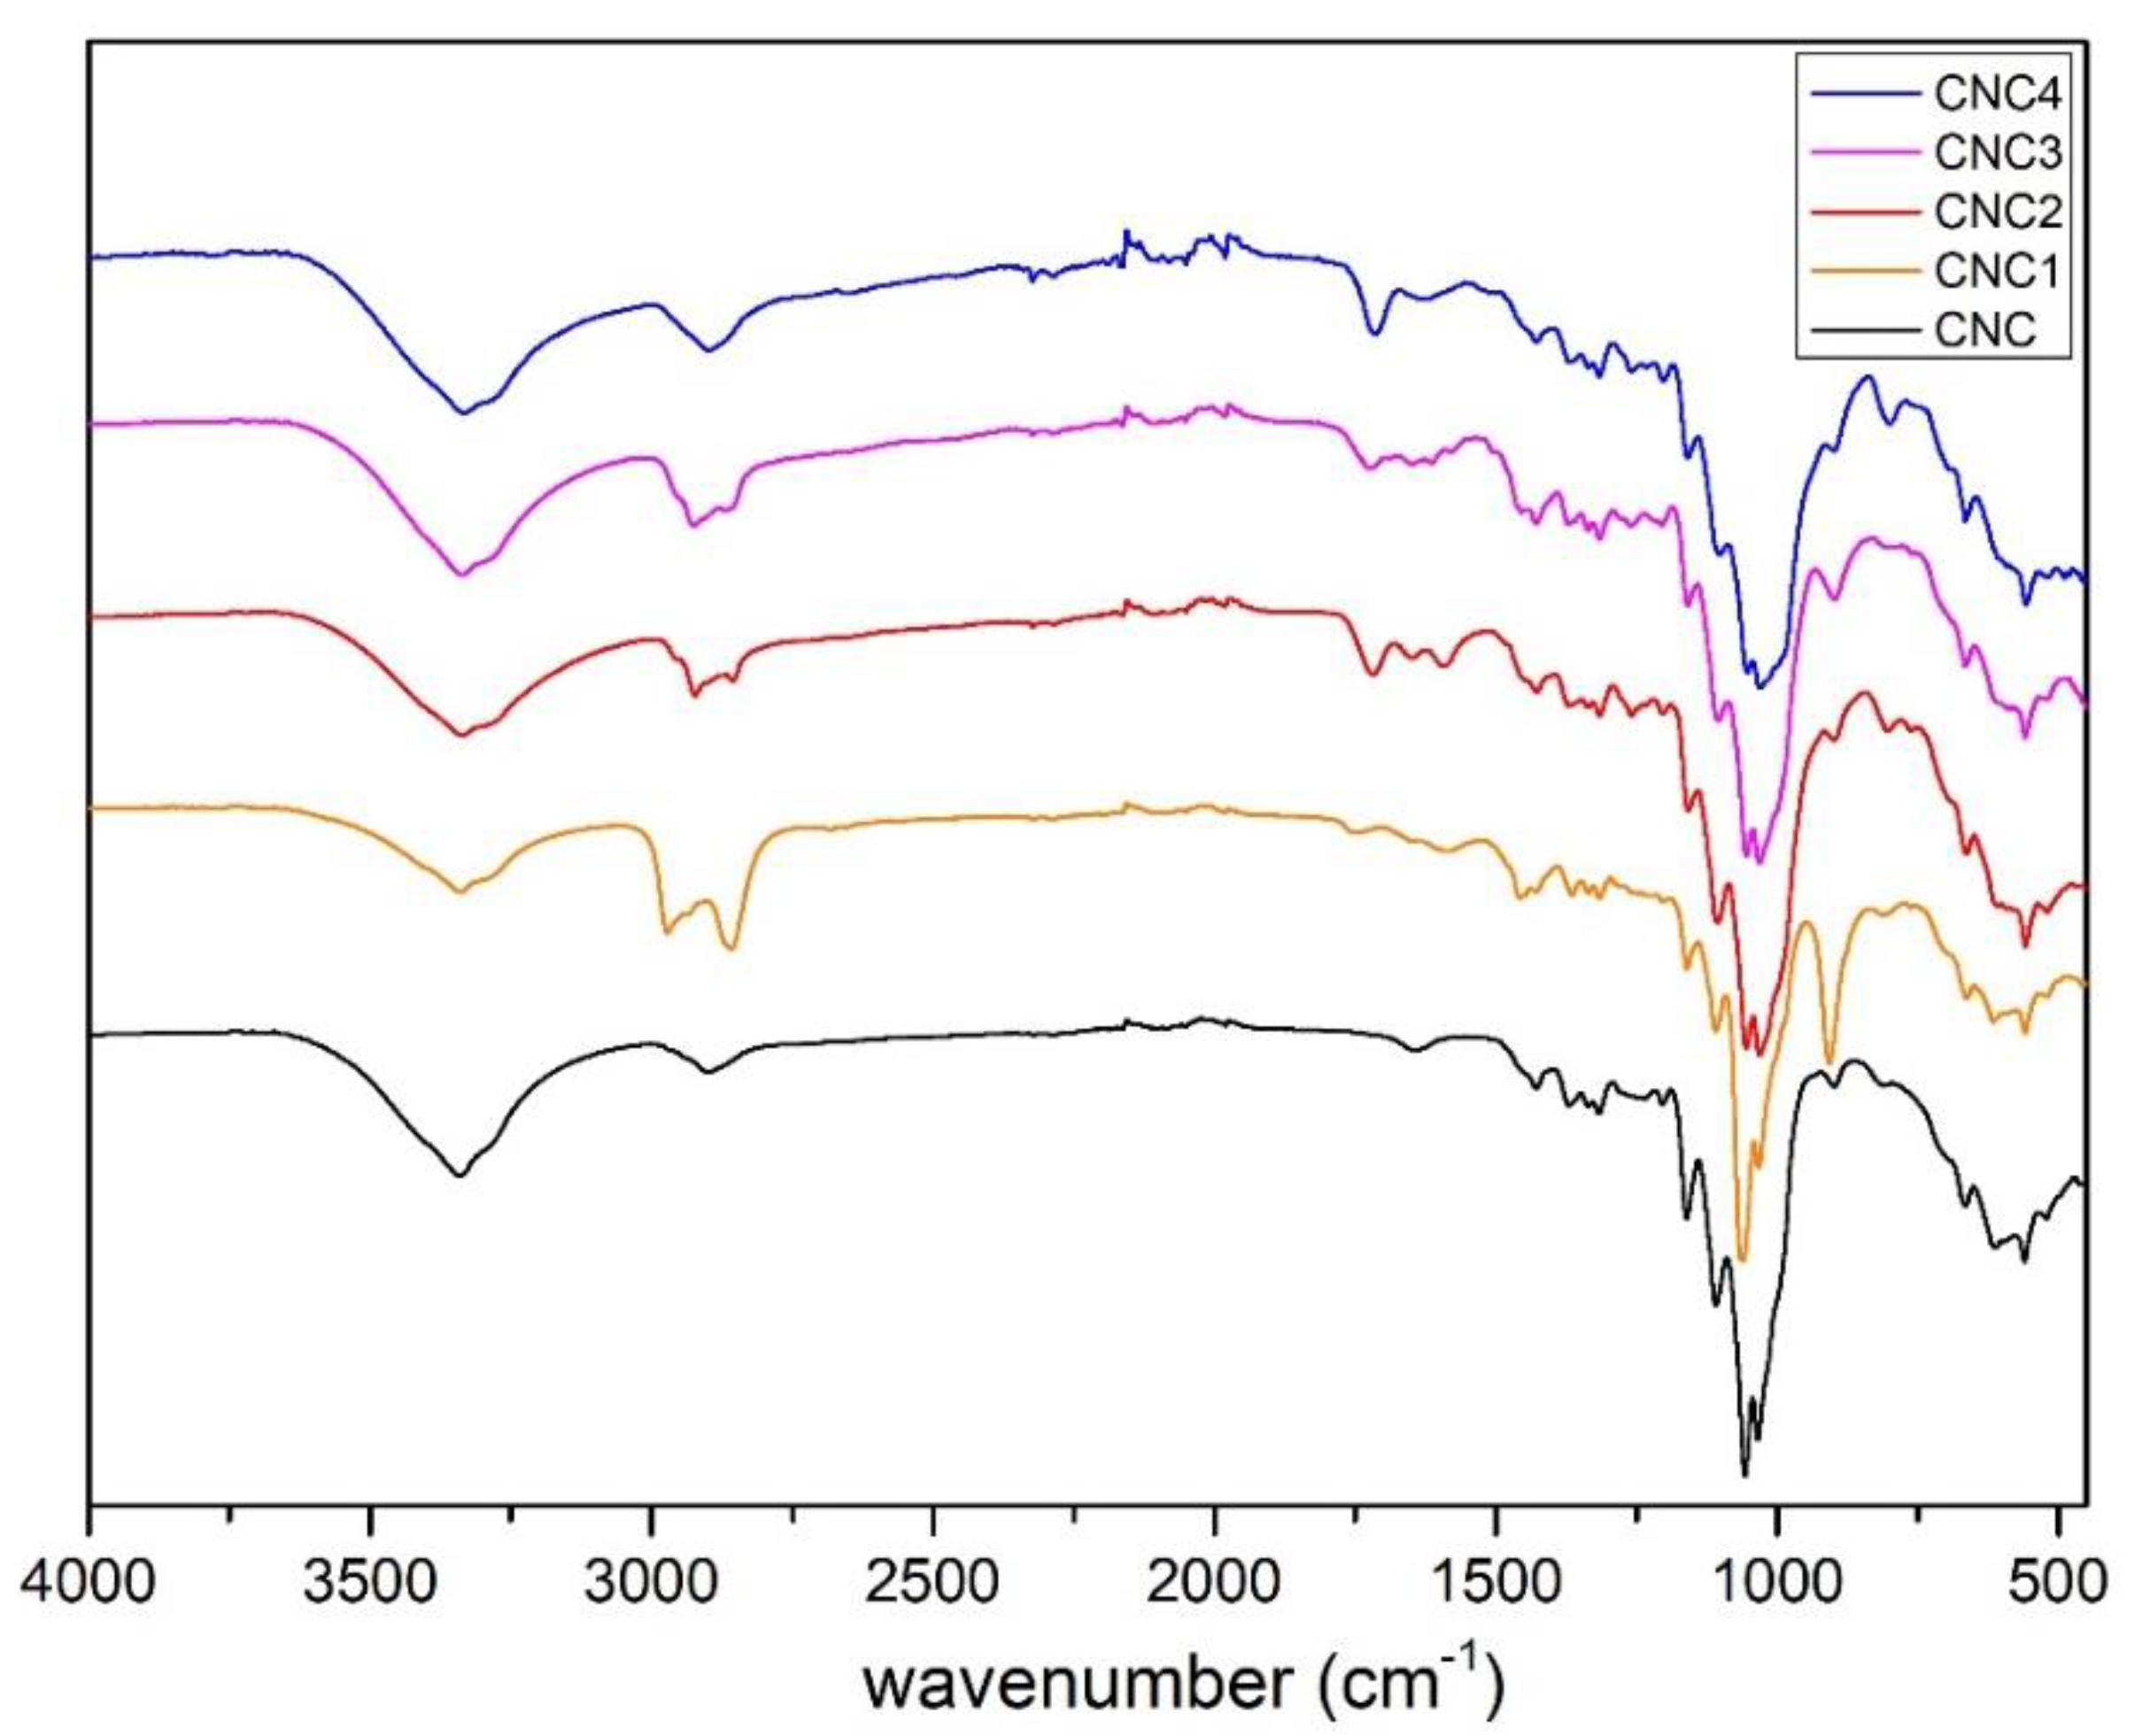
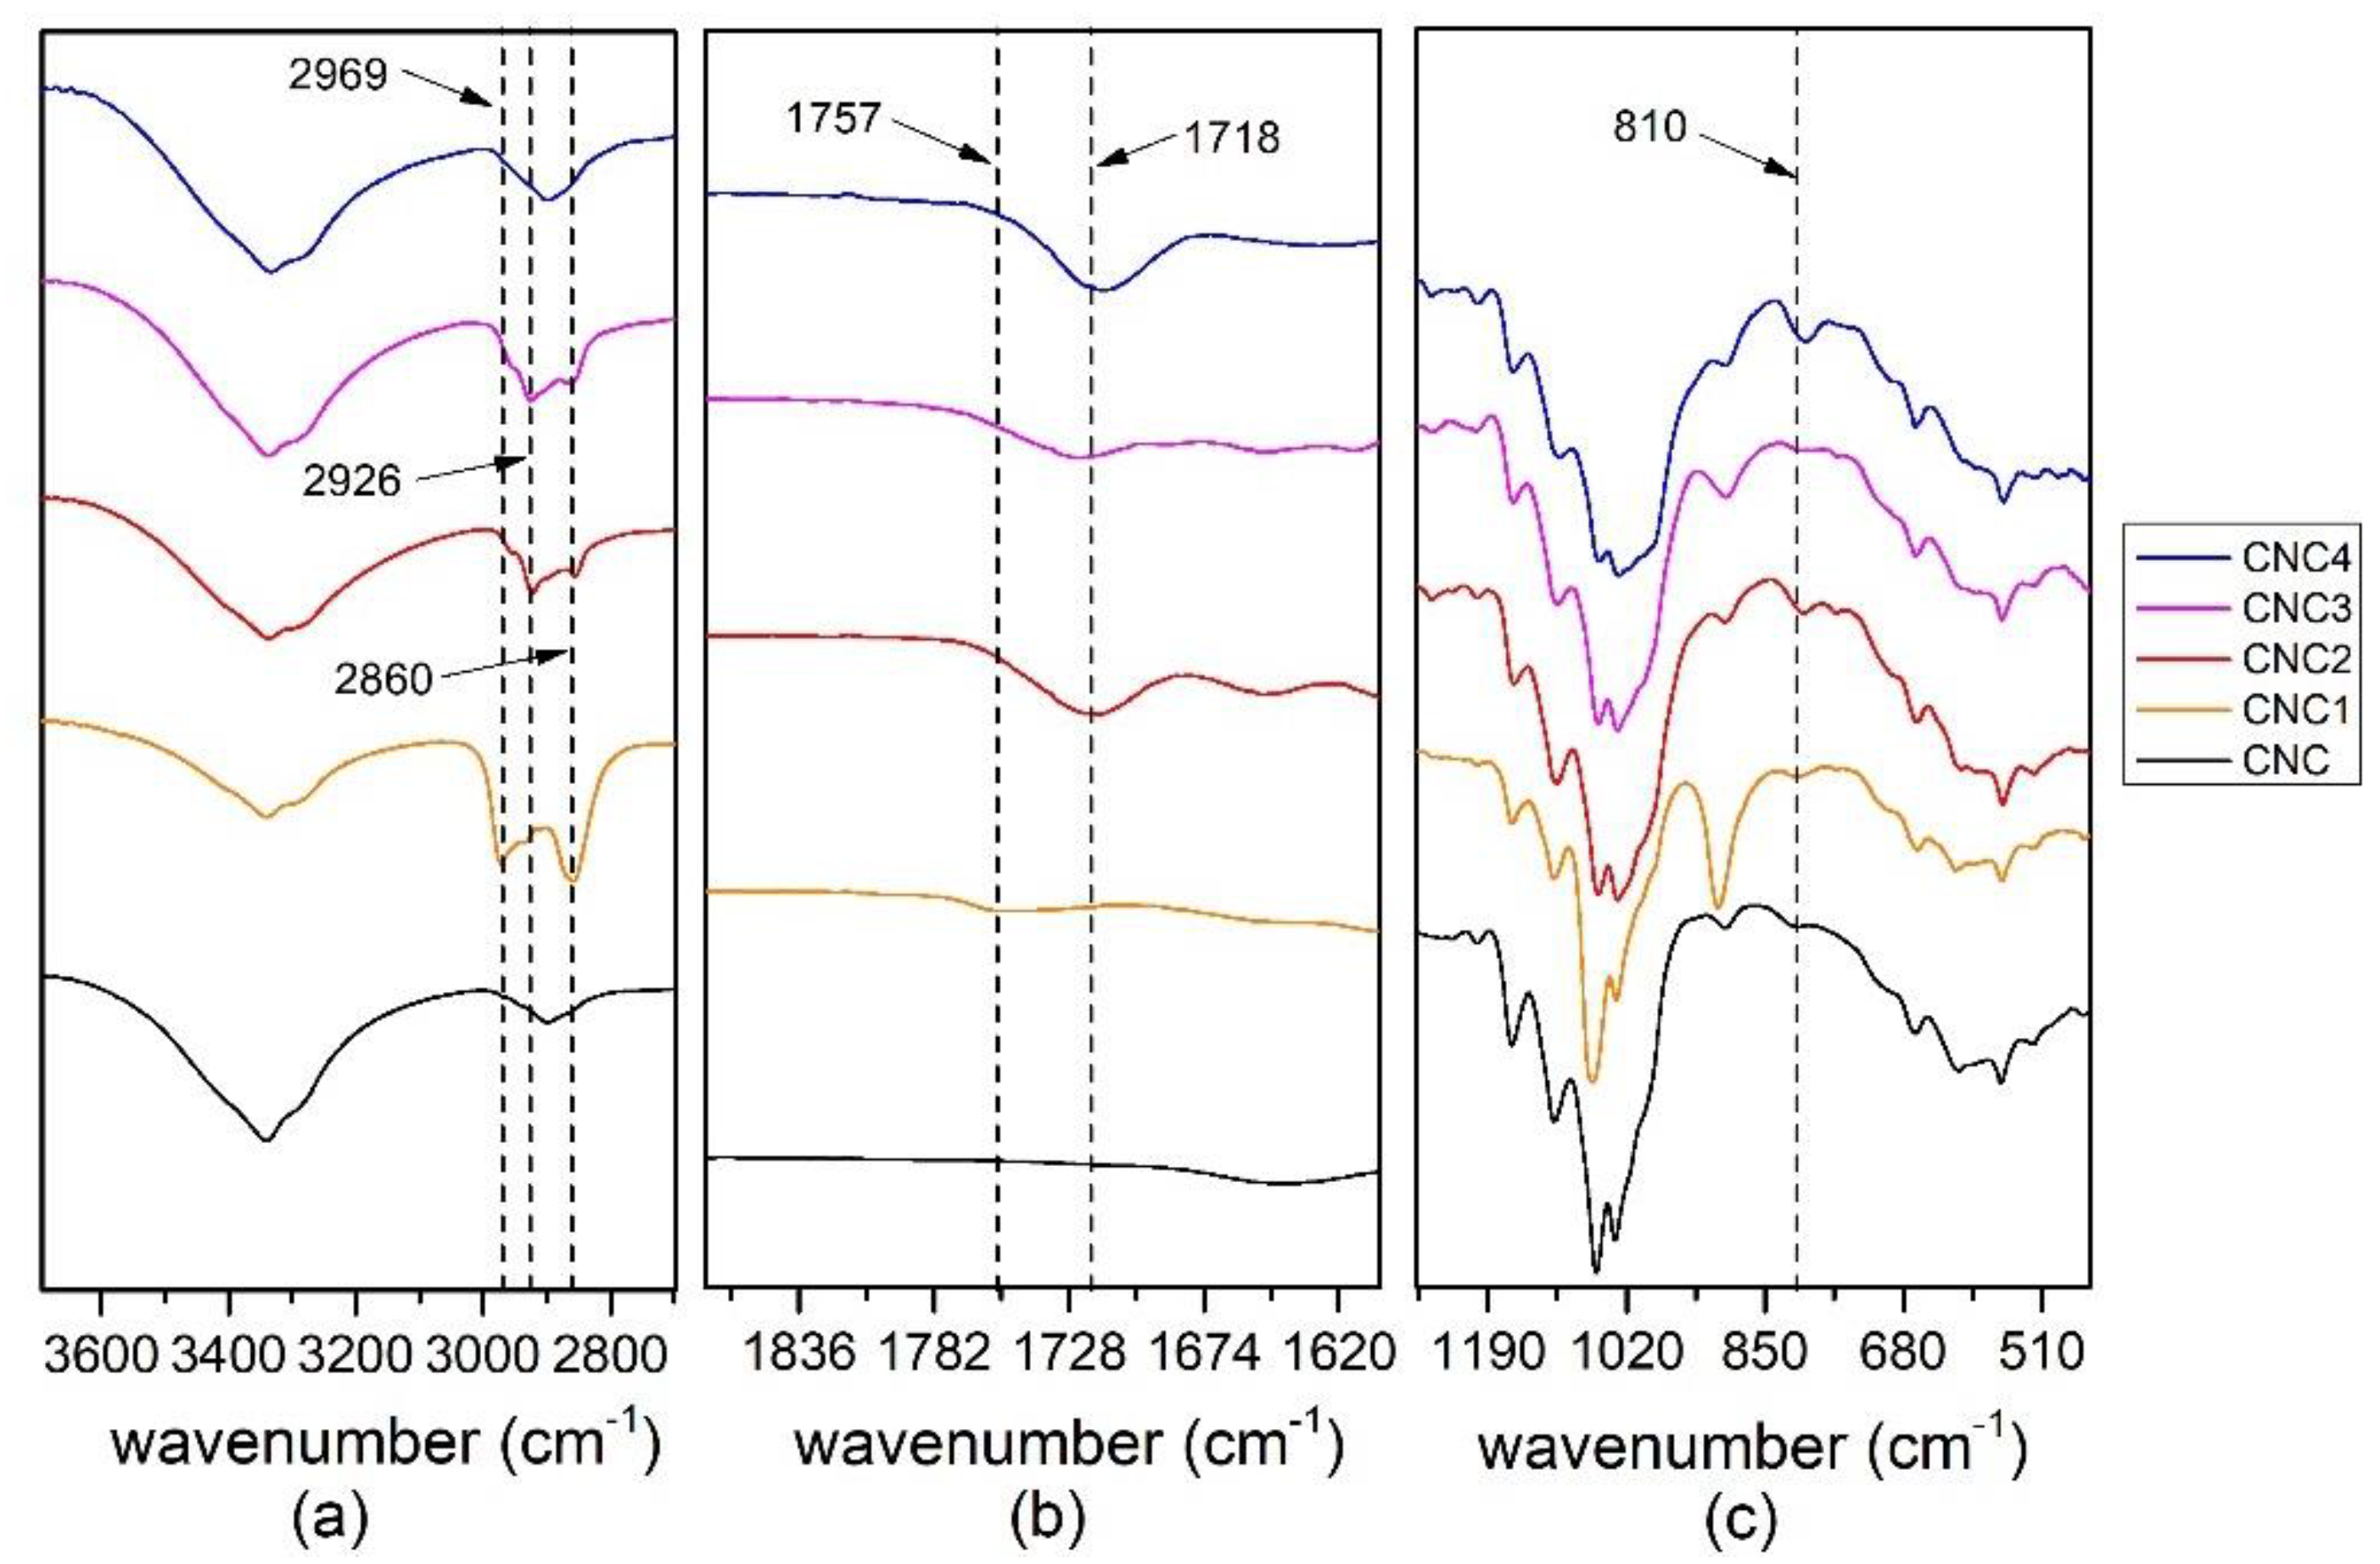
The effective grafting of the bio polyol on CNC was evaluated by FTIR analysis, and the amount of grafted polyol by thermogravimetric analysis (TGA).
Finally, the morphological and mechanical properties and hydrophobicity of filled PUs were thoughtfully assessed as well as the structure of the foams and in particular of the edges and walls of the cell foams by means of the modified Gibson–Ashby model [
37,
38,
39].
2. Materials and Methods
2.1. Materials
The bio-polyol GX9104, a cashew nutshell liquid (CNSL) based polyol with an OH value of 245 mg KOH/1 g oil, was supplied by Cardolite Corporation (Bristol, PA, USA). The bio-polyol RV33, a polyol with an OH value of 78 mg KOH/g, was supplied by AEP Polymers S.r.l. (Basovizza, TS, Italy). Sovermol® 750, a bio-polyol with an OH value of value 300–330 mg KOH/g, was purchased by BASF. Sovermol® 815, a bio-polyol with an OH value of 200–230 mg KOH/g, was purchased by BASF. Glycerol was purchased by Sigma-Aldrich (St. Louis, MO, USA). The co-reactive flame retardant Exolit® OP 560 with an OH value of 450 mg KOH/g was purchased by Clariant. Blowing catalyst Dabco® 33-LV and cross-linking Dabco® NE 300 were purchased from Evonik. Silicone surfactant TEGOSTAB® B 8747 LF2 was purchased from Evonik. Lupranate M20S poly(4,4′-Diphenylmethandiisocyanat) with 31.5% NCO-content was purchased from BASF.
The CNC used was supplied by MELODEA Ltd. (Rehovot, Israel) as a 3% aqueous suspension. In
Table 1 we report the characteristics of CNC used in the experiments.
The TEA (triethylamine) was purchase from Sigma-Aldrich (St. Louis, MO, USA) and distilled over calcium hydride before use. The silanes (trimethoxy(propyl)silane, trimethoxy(octyl)silane, trichloro(propyl)silane and (3-Aminopropyl) triethoxysilane (APTES) and the solvents used (Dimethylformamide (DMF) dry, Tetrahydrofuran (THF), Methanol, Ethanol, Acetone) are purchased from Sigma-Aldrich (St. Louis, MO, USA) and used without any purification.
2.2. Modified CNC Preparations
2.2.1. Dried Lyophilized CNC Preparation
The dried lyophilized CNC powder was obtained by using the liophilizer LIO-5P, (Cinquepascal S.R.L, Trezzano Sul Naviglio, Italy) and the ball milling Retsch MM 400 (Retsch GmbH, Haan, Germany).
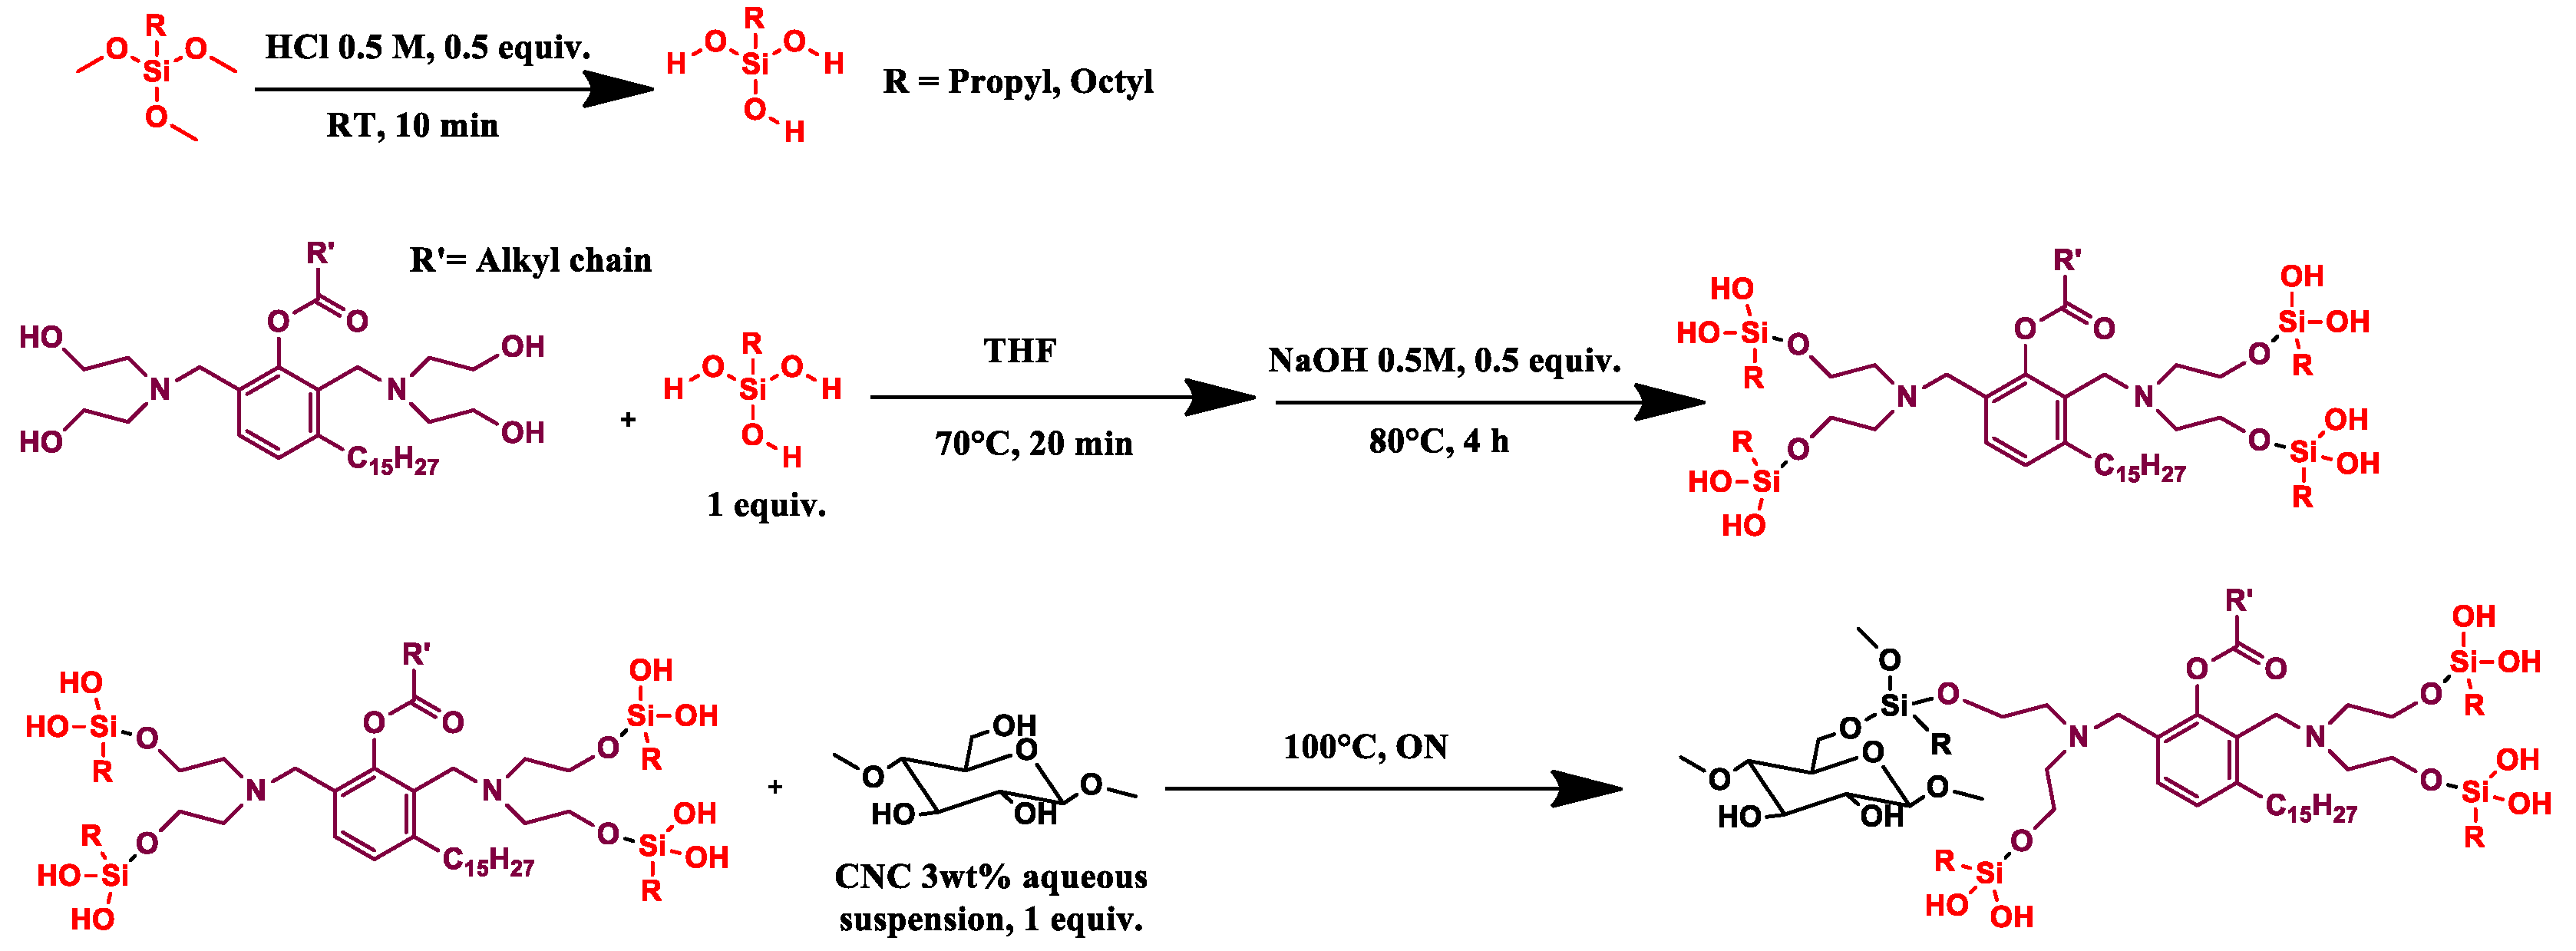
2.2.2. CNC_grafted_TMPS_polyol (CNC1) and CNC_grafted_TMOS_polyol (CNC2) Preparations
Trimethoxy(propyl)silane (1 eq, 1.2 mL, 1.12 g) (TMPS) or trimethoxy(octyl)silane (1 eq, 1.8 mL, 1.63 g) (TMOS) was hydrolyzed in acid aqueous solution (HCl solution 0.5 M, 0.5 eq) for 10 min at room temperature, then the GX9104 polyol (1 eq, OH value = 245 mg KOH/g, Mw = 2886 g/mol), in THF solution (20 mL), was added and the mixture kept at 70 °C for 20 min. Then, 14 mL of NaOH (0.5 M, 0.5 eq) was added and the solution warmed at 80 °C for 4 h.
CNC as a 3 wt% aqueous suspension (1 eq, 36.6 mL) was added and the reaction was left overnight at 100 °C. The mixture was washed using THF, methanol and finally acetone, respectively. During each washing step, the mixture was sonicated for 15 min in an ultrasound bath and then centrifuged at 6000 RPM. The solid recovered was dried in an oven at 80 °C under vacuum (100 mbar) for 1 night. Finally, the sample was pre-freezed in liquid nitrogen and then pulverized in a ball milling for 2 min using a frequency of 30 oscillations/sec until a white powder was obtained (
Scheme 2).
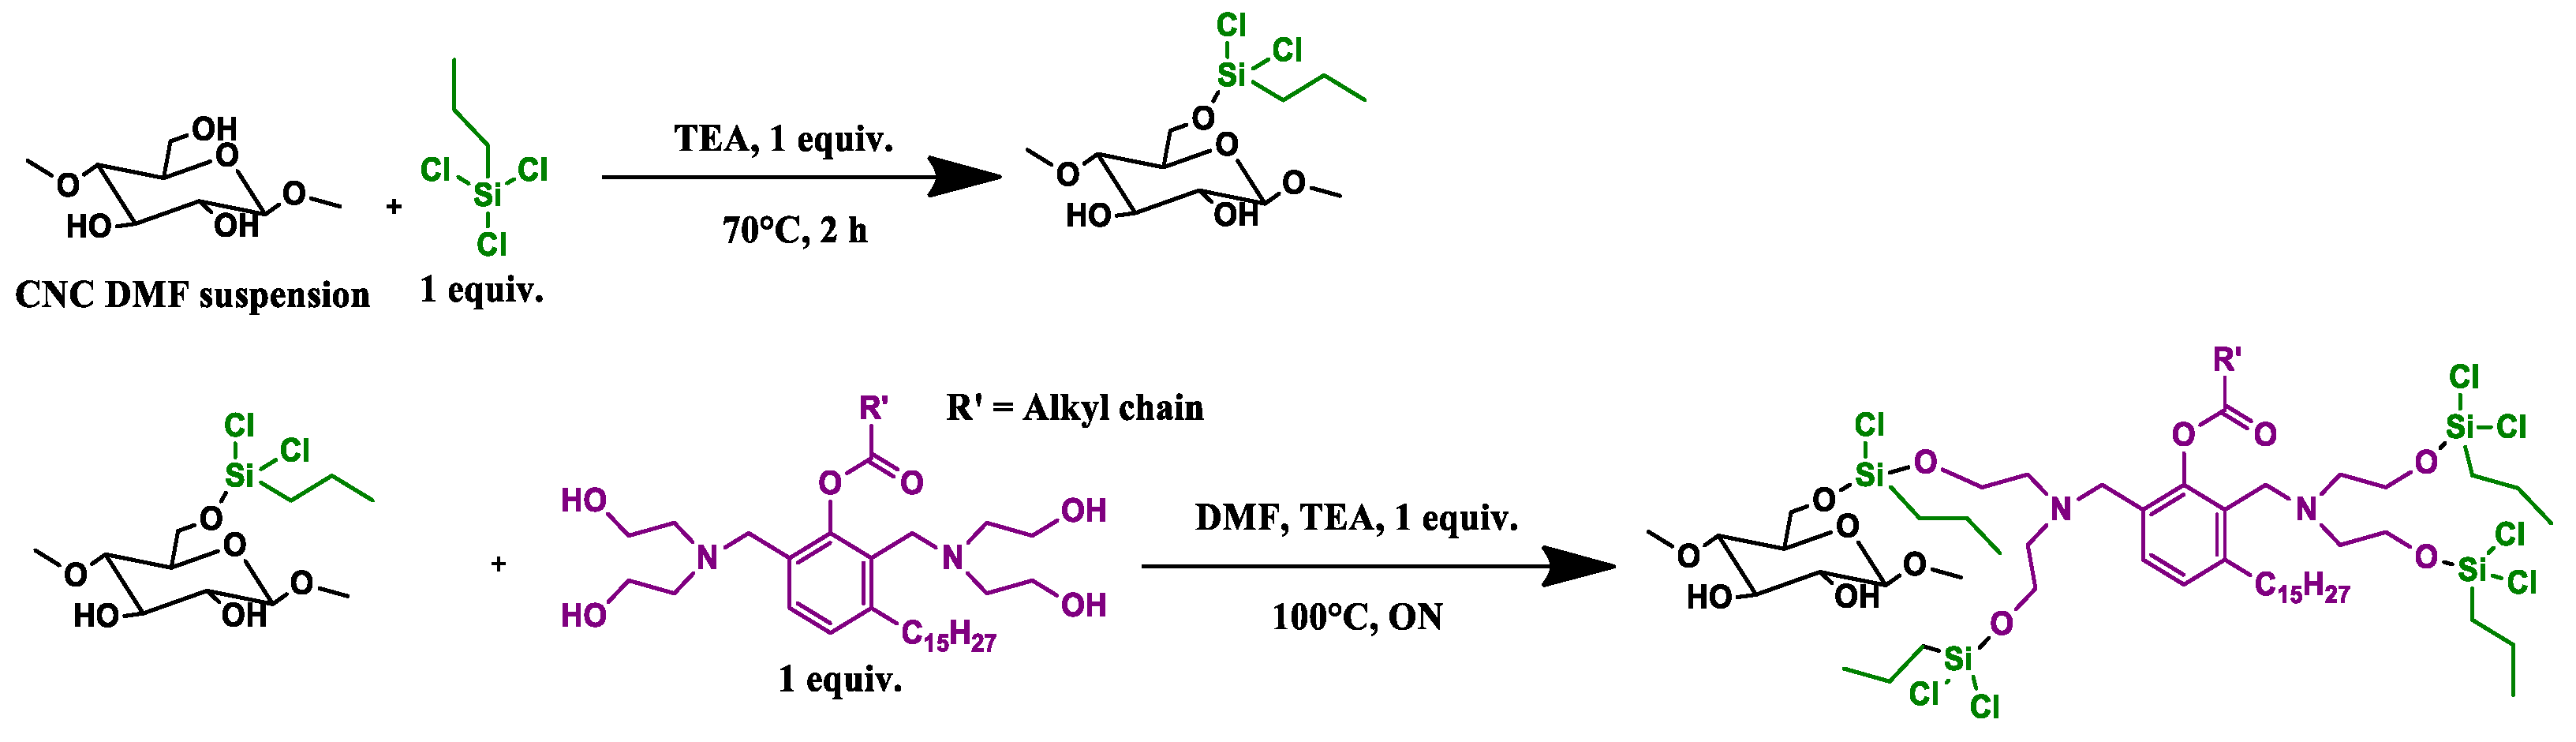
2.2.3. CNC_grafted_TCPS_polyol (CNC3) Preparations
2 g (1 eq) of lyophilized CNC was suspended in a nitrogen atmosphere in 70 mL of dry DMF at 120 °C for 4 h, then the reaction was cooled and trichloro(propyl)silane (TCPS) added (1 equiv, 2 mL, 2.39 g) together with TEA (1 equiv) and left to react for 2 h at 60 °C. After that, a further amount of TEA (2 mL) was added together with the polyol GX9104 (1 equiv), previously dissolved in 4 mL of dry DMF, and the mixture was left overnight at 100 °C. After that, the mixture was washed using THF, methanol and finally acetone, respectively. During each washing step, the mixture was sonicated for 15 min in an ultrasound bath and then centrifuged at 6000 RPM. The solid recovered was dried in an oven at 80 °C under vacuum (100 mbar) for 1 night. Finally, the sample was pre-freezed in liquid nitrogen and then pulverized in a ball milling for 2 min using a frequency of 30 oscillations/sec until a white powder was obtained (
Scheme 3).
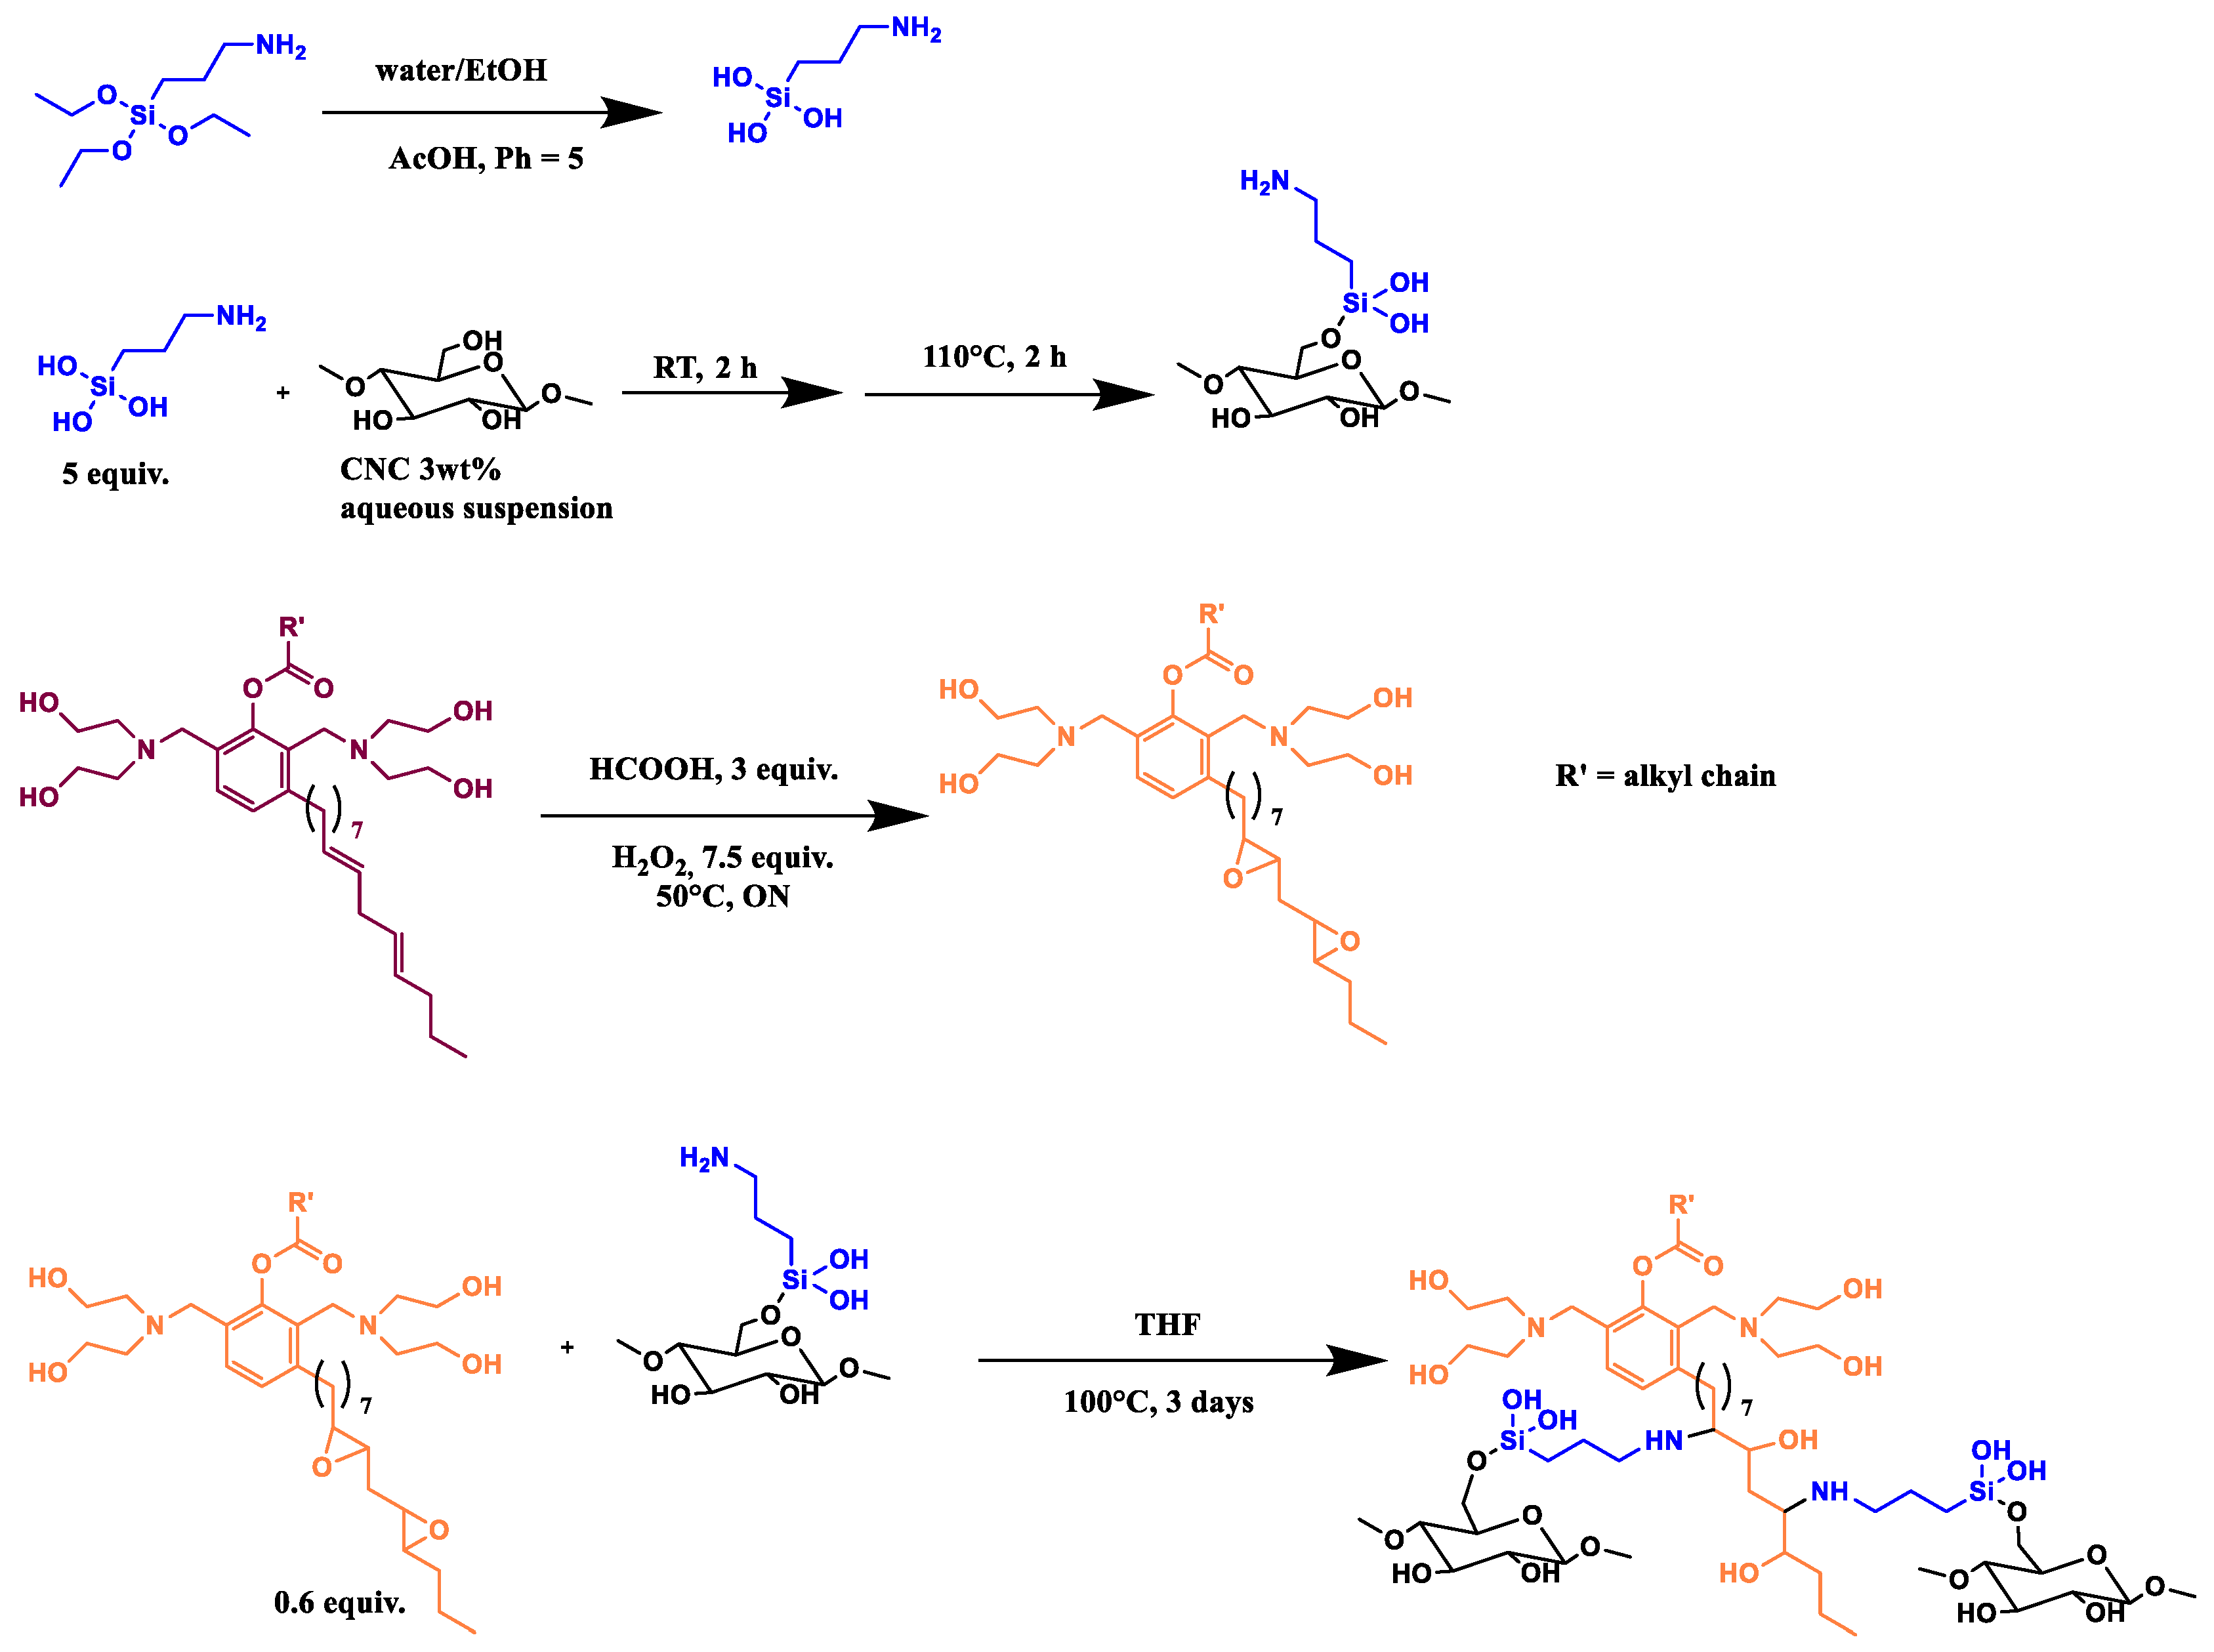
2.2.4. CNC_grafted_APTES_polyol (CNC4) Preparations
In a beaker, 5 equiv of APTES was solubilized in a solution of water (190 mL) and ethanol (190 mL). Acetic acid was dropped to have a pH = 5, then 108 mL of CNC 3 wt% suspension (1 equiv) was added and keep for 2 h at room temperature. The mixture was then filtered and put in a 250 mL round-bottomed flask at 110 °C for 1 h.
Then, 1 eq of GX9104 polyol was mixed with 3 eq of formic acid (2.3 mL) for 15 min at room temperature, and 7.5 equiv of H2O2 was added drop by drop and then the solution was left overnight at 50 °C. After that, an aqueous solution of NaHCO3 was added and the mixture was washed with CHCl3 several times; then, the organic phase was dried over NaSO4 and the solvent was removed under reduced pressure. The obtained epoxidized polyol was analyzed by FT-IR (Spectrometer Perkin Elmer, Waltham, Massachusetts, U.S.) and the disappearance of the signal at 3007 cm−1, typical of double bound, was observed as well as the appearance of the characteristic features of the epoxy group at 823, 871 and 917 cm−1.
The epoxidized polyol was dissolved in THF (0.6 eq) and mixed with CNC silylated with APTES. The reaction was left at 100 °C for 3 days. The product obtained was analyzed by FT-IR spectrometer (
Scheme 4).
2.2.5. CNC Purification
All the modified CNC prepared, CNC1, CNC2, CNC3 and CNC4, were purified by unreacted polyols and/or silanes by using a Soxhlet apparatus and THF as solvent.
2.3. PU Foams Preparation
The bio-based polyurethane (PU) foams were prepared by using a one-step method. Component A was prepared by mixing in a plastic beaker with a mechanical stirrer, for 5 min at 500 rpm the following bio-based polyols: RV33, Cardolite® NX-9201 (polyester diol), Sovermol® 750 (branched polyether/polyester polyol), Sovermol® 815 (branched polyether/polyester polyol), glycerol as chain extender, blowing agent water, co-reactive flame retardant Exolit® OP 560, blowing and cross-linking catalysts Dabco® 33-LV and Dabco® NE 300 respectively, silicone surfactant TEGOSTAB® B 8747 LF2.
An appropriate amount ([NCO]/[OH] = 1.05) of Component B (poly(4,4′-Diphenylmethandiisocyanate) Lupranate M20S was added to Component A and the mixture was stirred with a mechanical stirrer for 20 s at 500 rpm. Afterward, immediately, the resultant mixture was transferred to an open cylindrical mold and allowed to free rising at room temperature. In
Table 2, the amounts of reagents for the PU formulation are reported.
For the preparation of filled bio-based PU foams, an according amount of filler was mixed with Component A at the mass ratio of 1, 2 and 3 wt% and the mixture was stirred for 5 min at 500 rpm. Then, the isocyanate was added following the same procedure described for the non-filled foam (namely PU-Ref). The produced composite panels were labeled PU-CNCx_y, where x is the number associated with the selected filler (can be equal to 1, 2, 3 or 4), and y is the amount of filler dispersed within the matrix (can be equal to 1, 2 or 3)
2.4. Characterization of Modified CNCs and PU Foams
2.4.1. Modified CNCs Characterization
All the modified CNC prepared, CNC1, CNC2, CNC3 and CNC4, were characterized by FT-IR Spectrometer Perkin Elmer (Waltham, MA, U.S.) in Attenuated Total Reflectance (ATR) mode from 400−4000 cm−1, 4 cm−1 resolutions and 64 scans. The spectra were normalized between 0 to 100 on transmittance value.
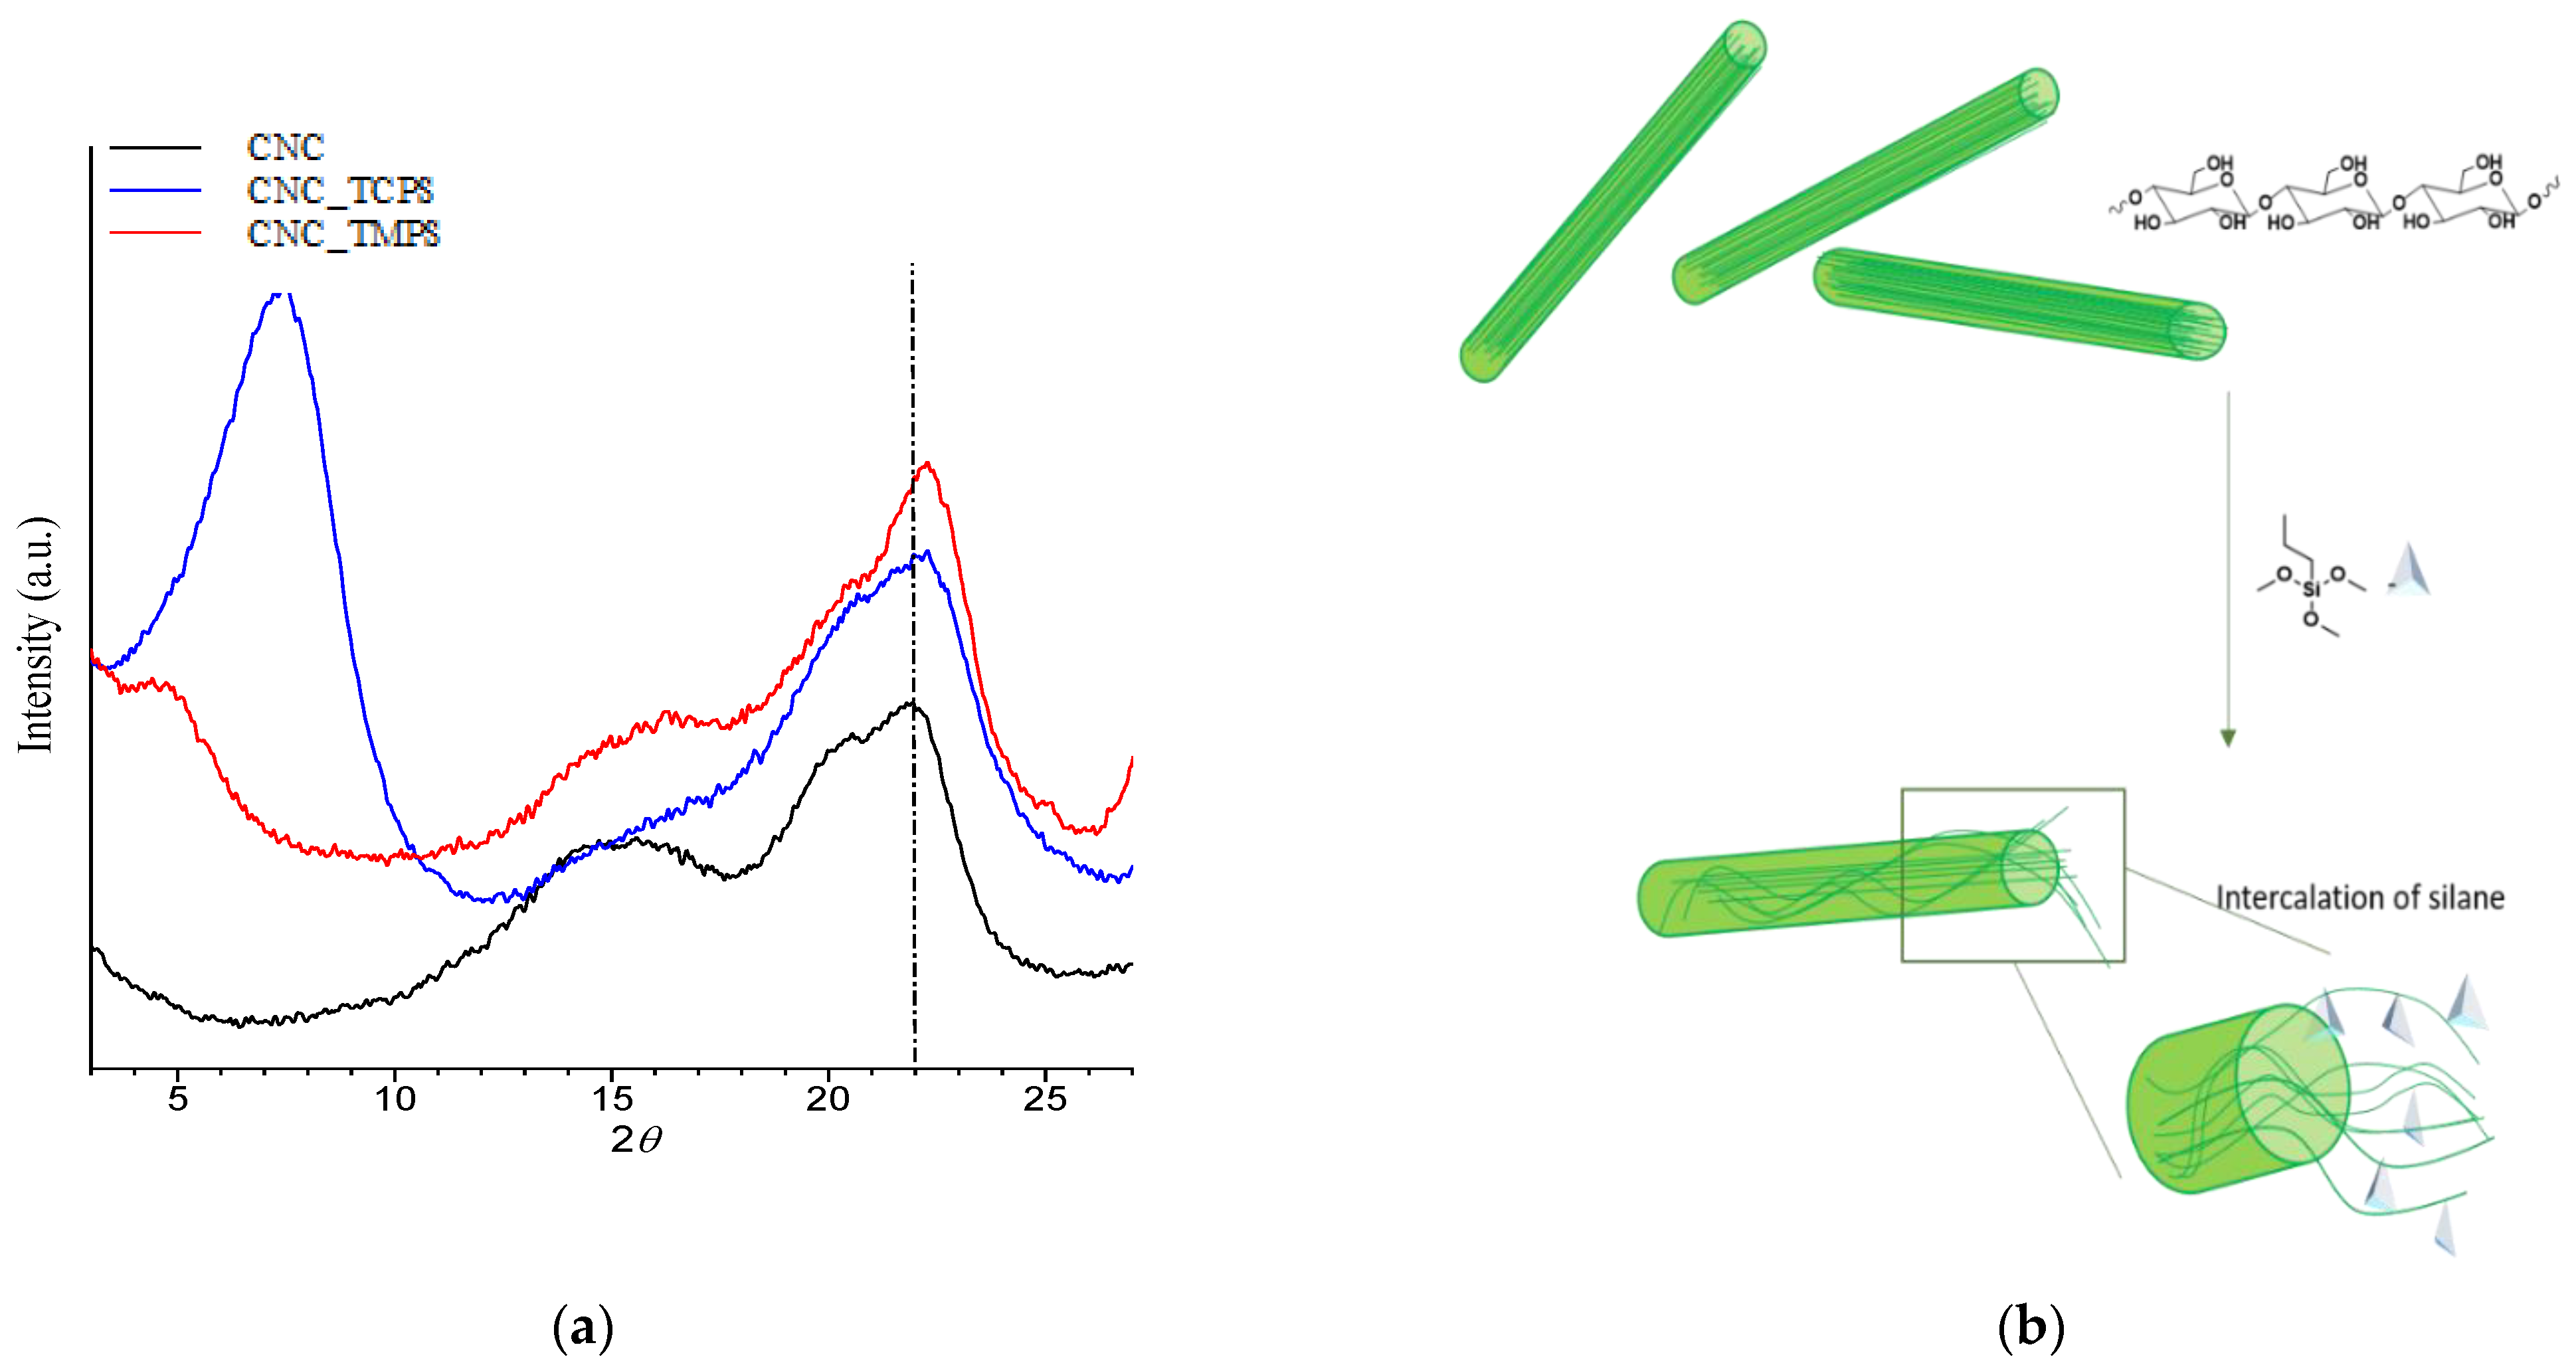
Structural characterization of CNCs was performed through Wide Angle X-ray Scattering (WAXS) analysis using an Anton Paar SAXSess camera equipped with a 2D imaging plate detector. Then, 1.5418 Å wavelengths CuKα X-Rays were generated by a Philips PW3830 sealed tube generator source (40 kV, 50 mA) and slit collimated. Spectra of CNCs powder were collected for 10 min. The crystallinity index (
CrI, %) was determined using the empirical method, known as the Segal or peak height method, [
40] as follows:
where
CrI expresses the relative degree of crystallinity,
I200 is the maximum intensity (in arbitrary units) of the 200 lattice diffraction and
Iam is the intensity of diffraction in the same units at 2θ = 18°.
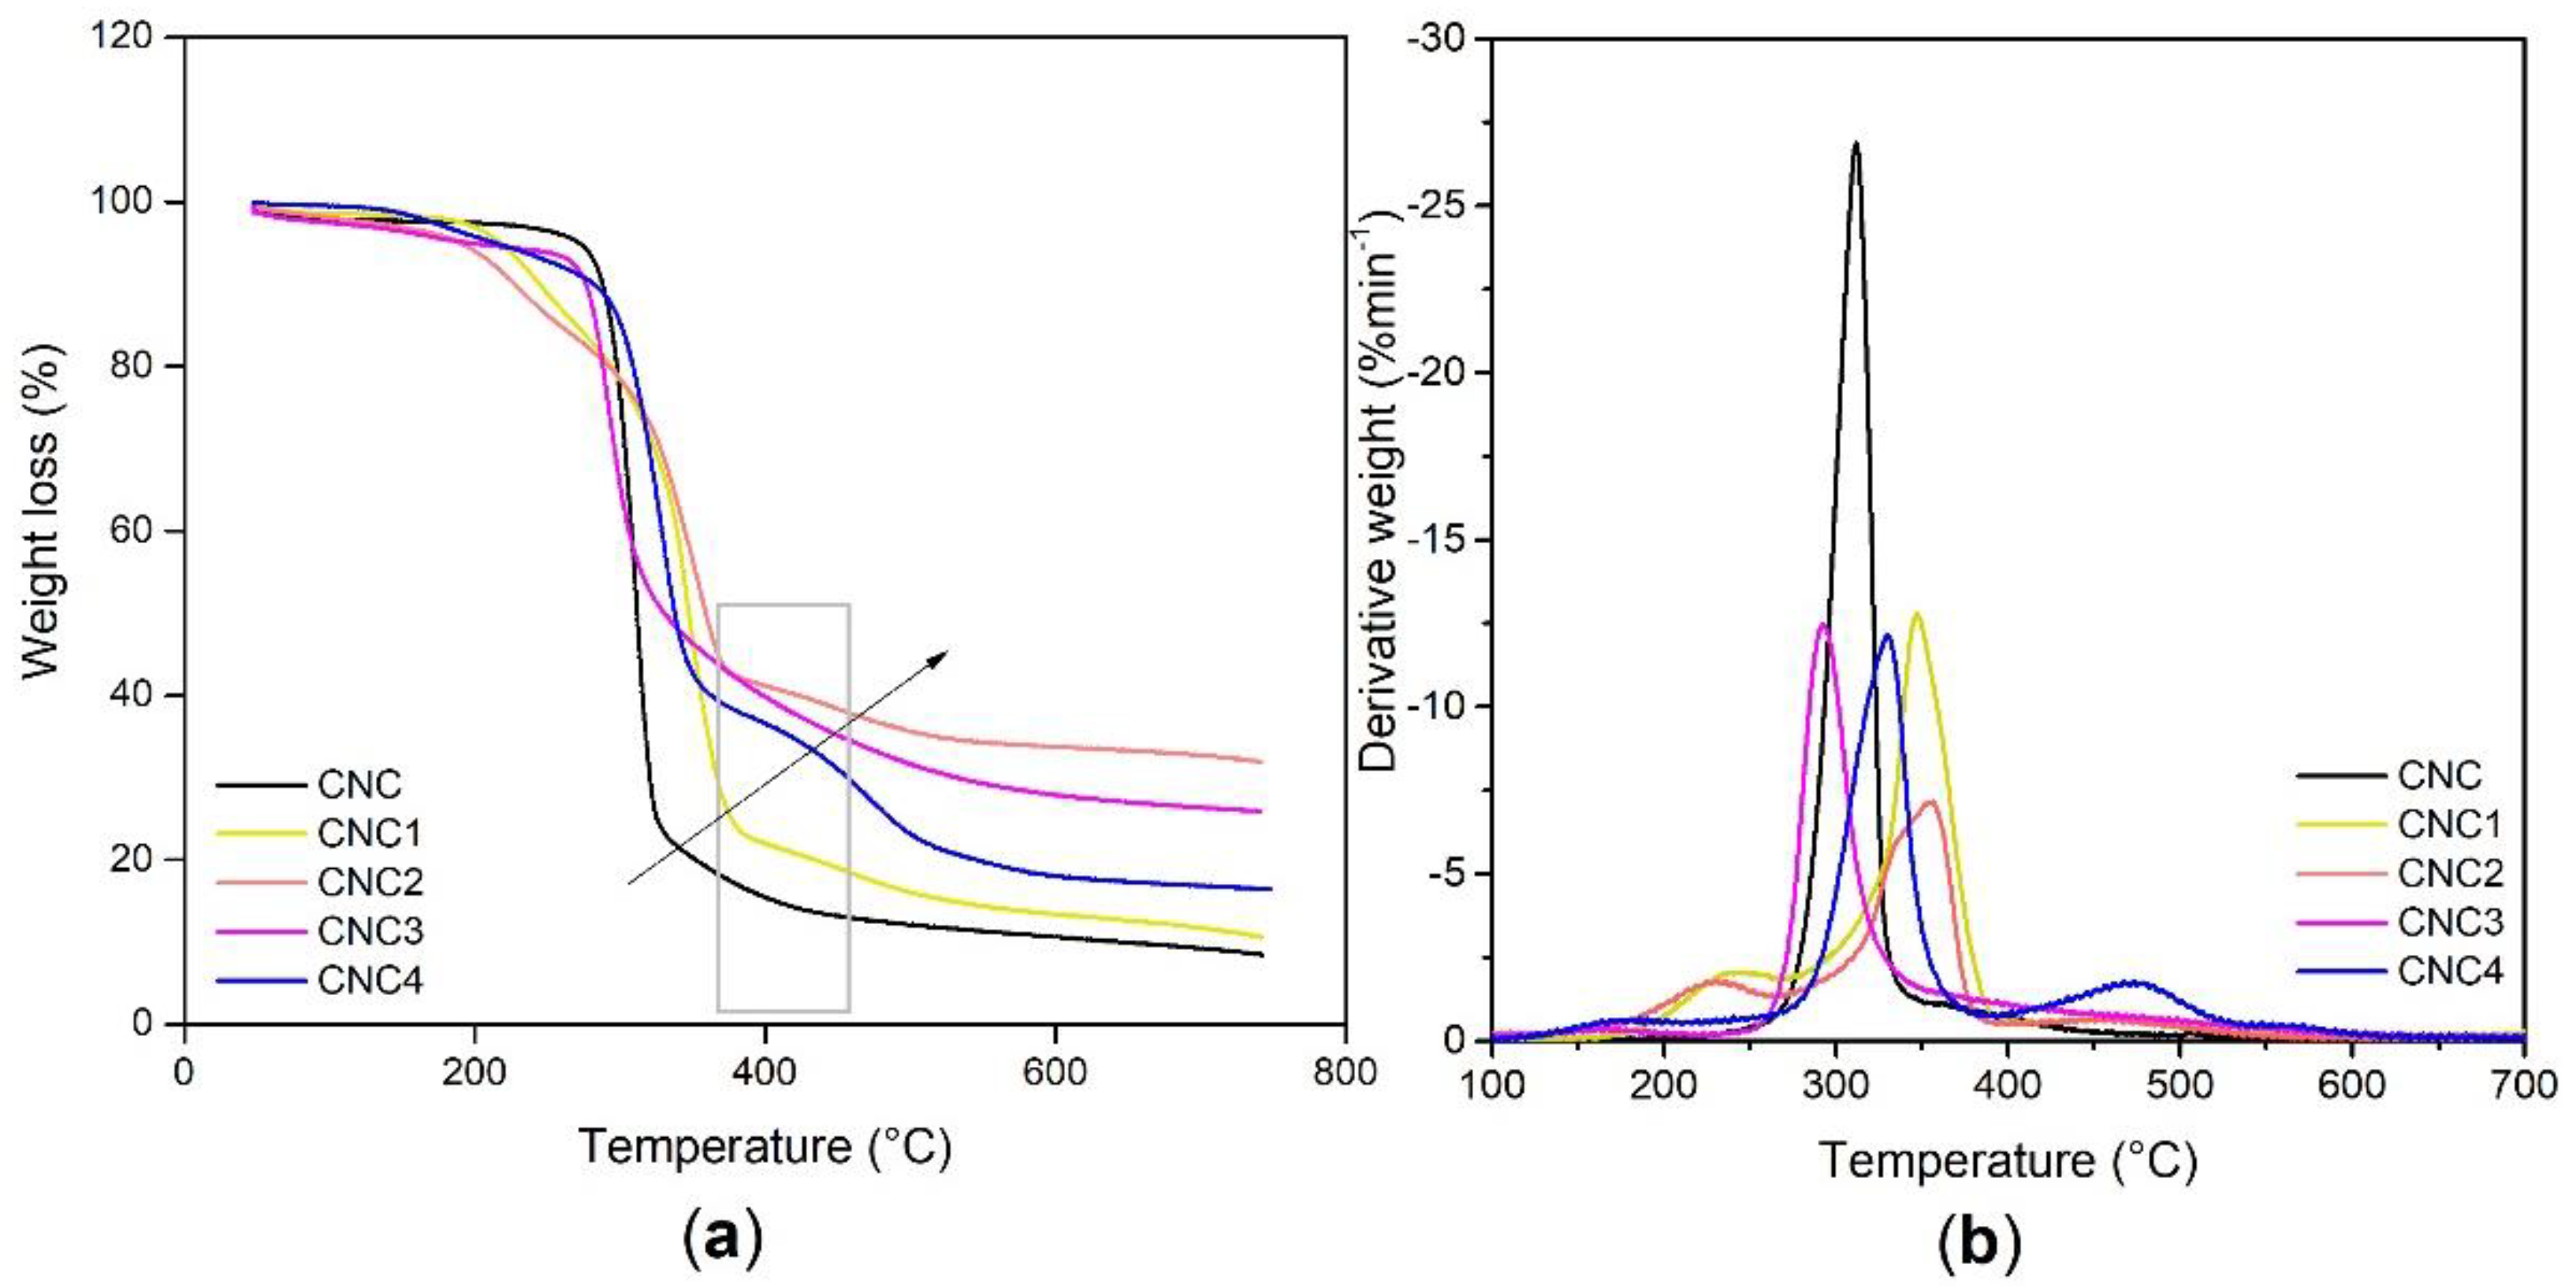
Thermo-gravimetric (TGA) analyses, by using a TGA 7 Perkin Elmer (Waltham, MA, USA) over a temperature range from 30 °C to 800 °C under nitrogen atmosphere, were performed on modified CNCs to evaluate the amount of silane and polyols grafted (see Equation (7)).
2.4.2. PU Foams Characterization
FTIR spectra of foamed samples were collected at room temperature by using an FT-IR spectrometer (Bruker IFS 66 FT-IR equipment) in attenuated total reflectance (ATR) mode from 400−4000 cm−1, 4 cm−1 resolutions and 64 scans.
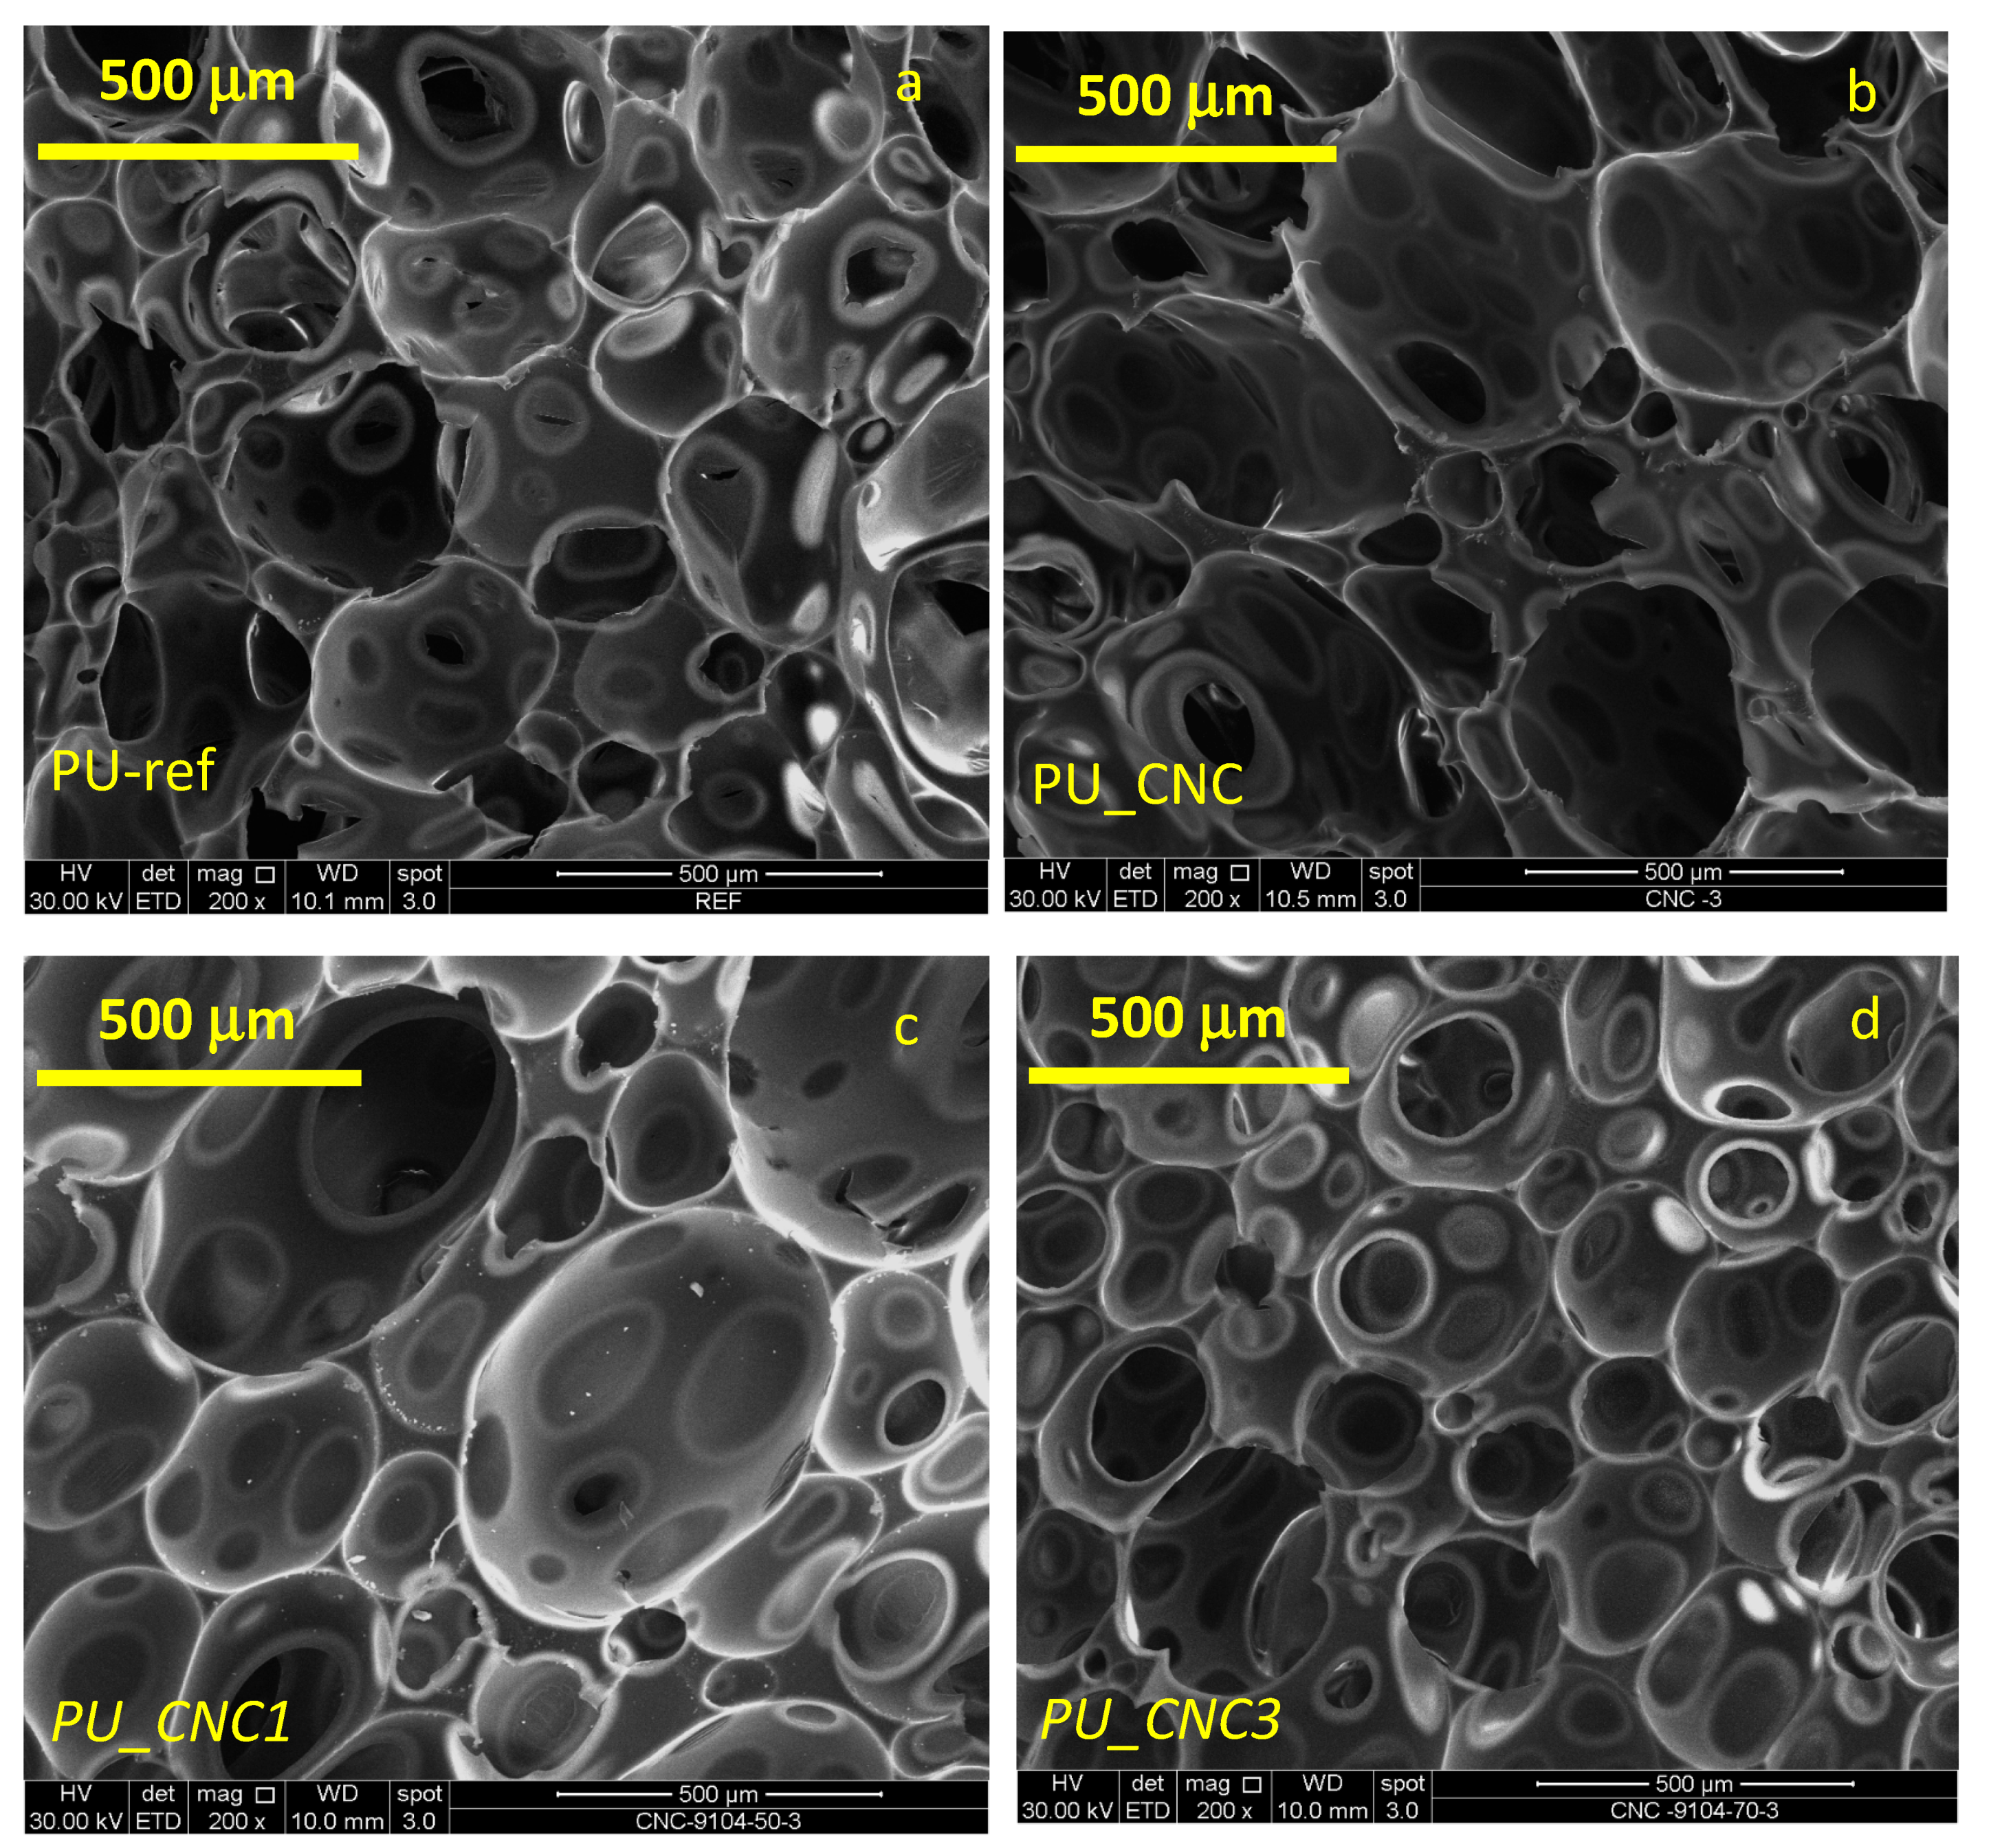
The morphological structure of polyurethane foams was investigated by scanning electron microscopy (SEM, FEI ESEM Quanta 200, acceleration voltage of 15 or 20 kV). The density of PU foams was determined at 23 °C with 50% relative humidity (ASTM D1622-03). The density value reported is the average value of 10 specimens with size 30 mm × 30 mm × 30 mm (length × width × thickness).
Hydrophobicity of filled PU foams was determined by optical contact angle analysis instrument OCA 25 (DataPhysics Instruments GmbH, Berlin, Germany). The instrument measures the contact angle of a drop of water placed by a dosing needle on the foam surface. The value of contact angle is the average value of 10 tests.
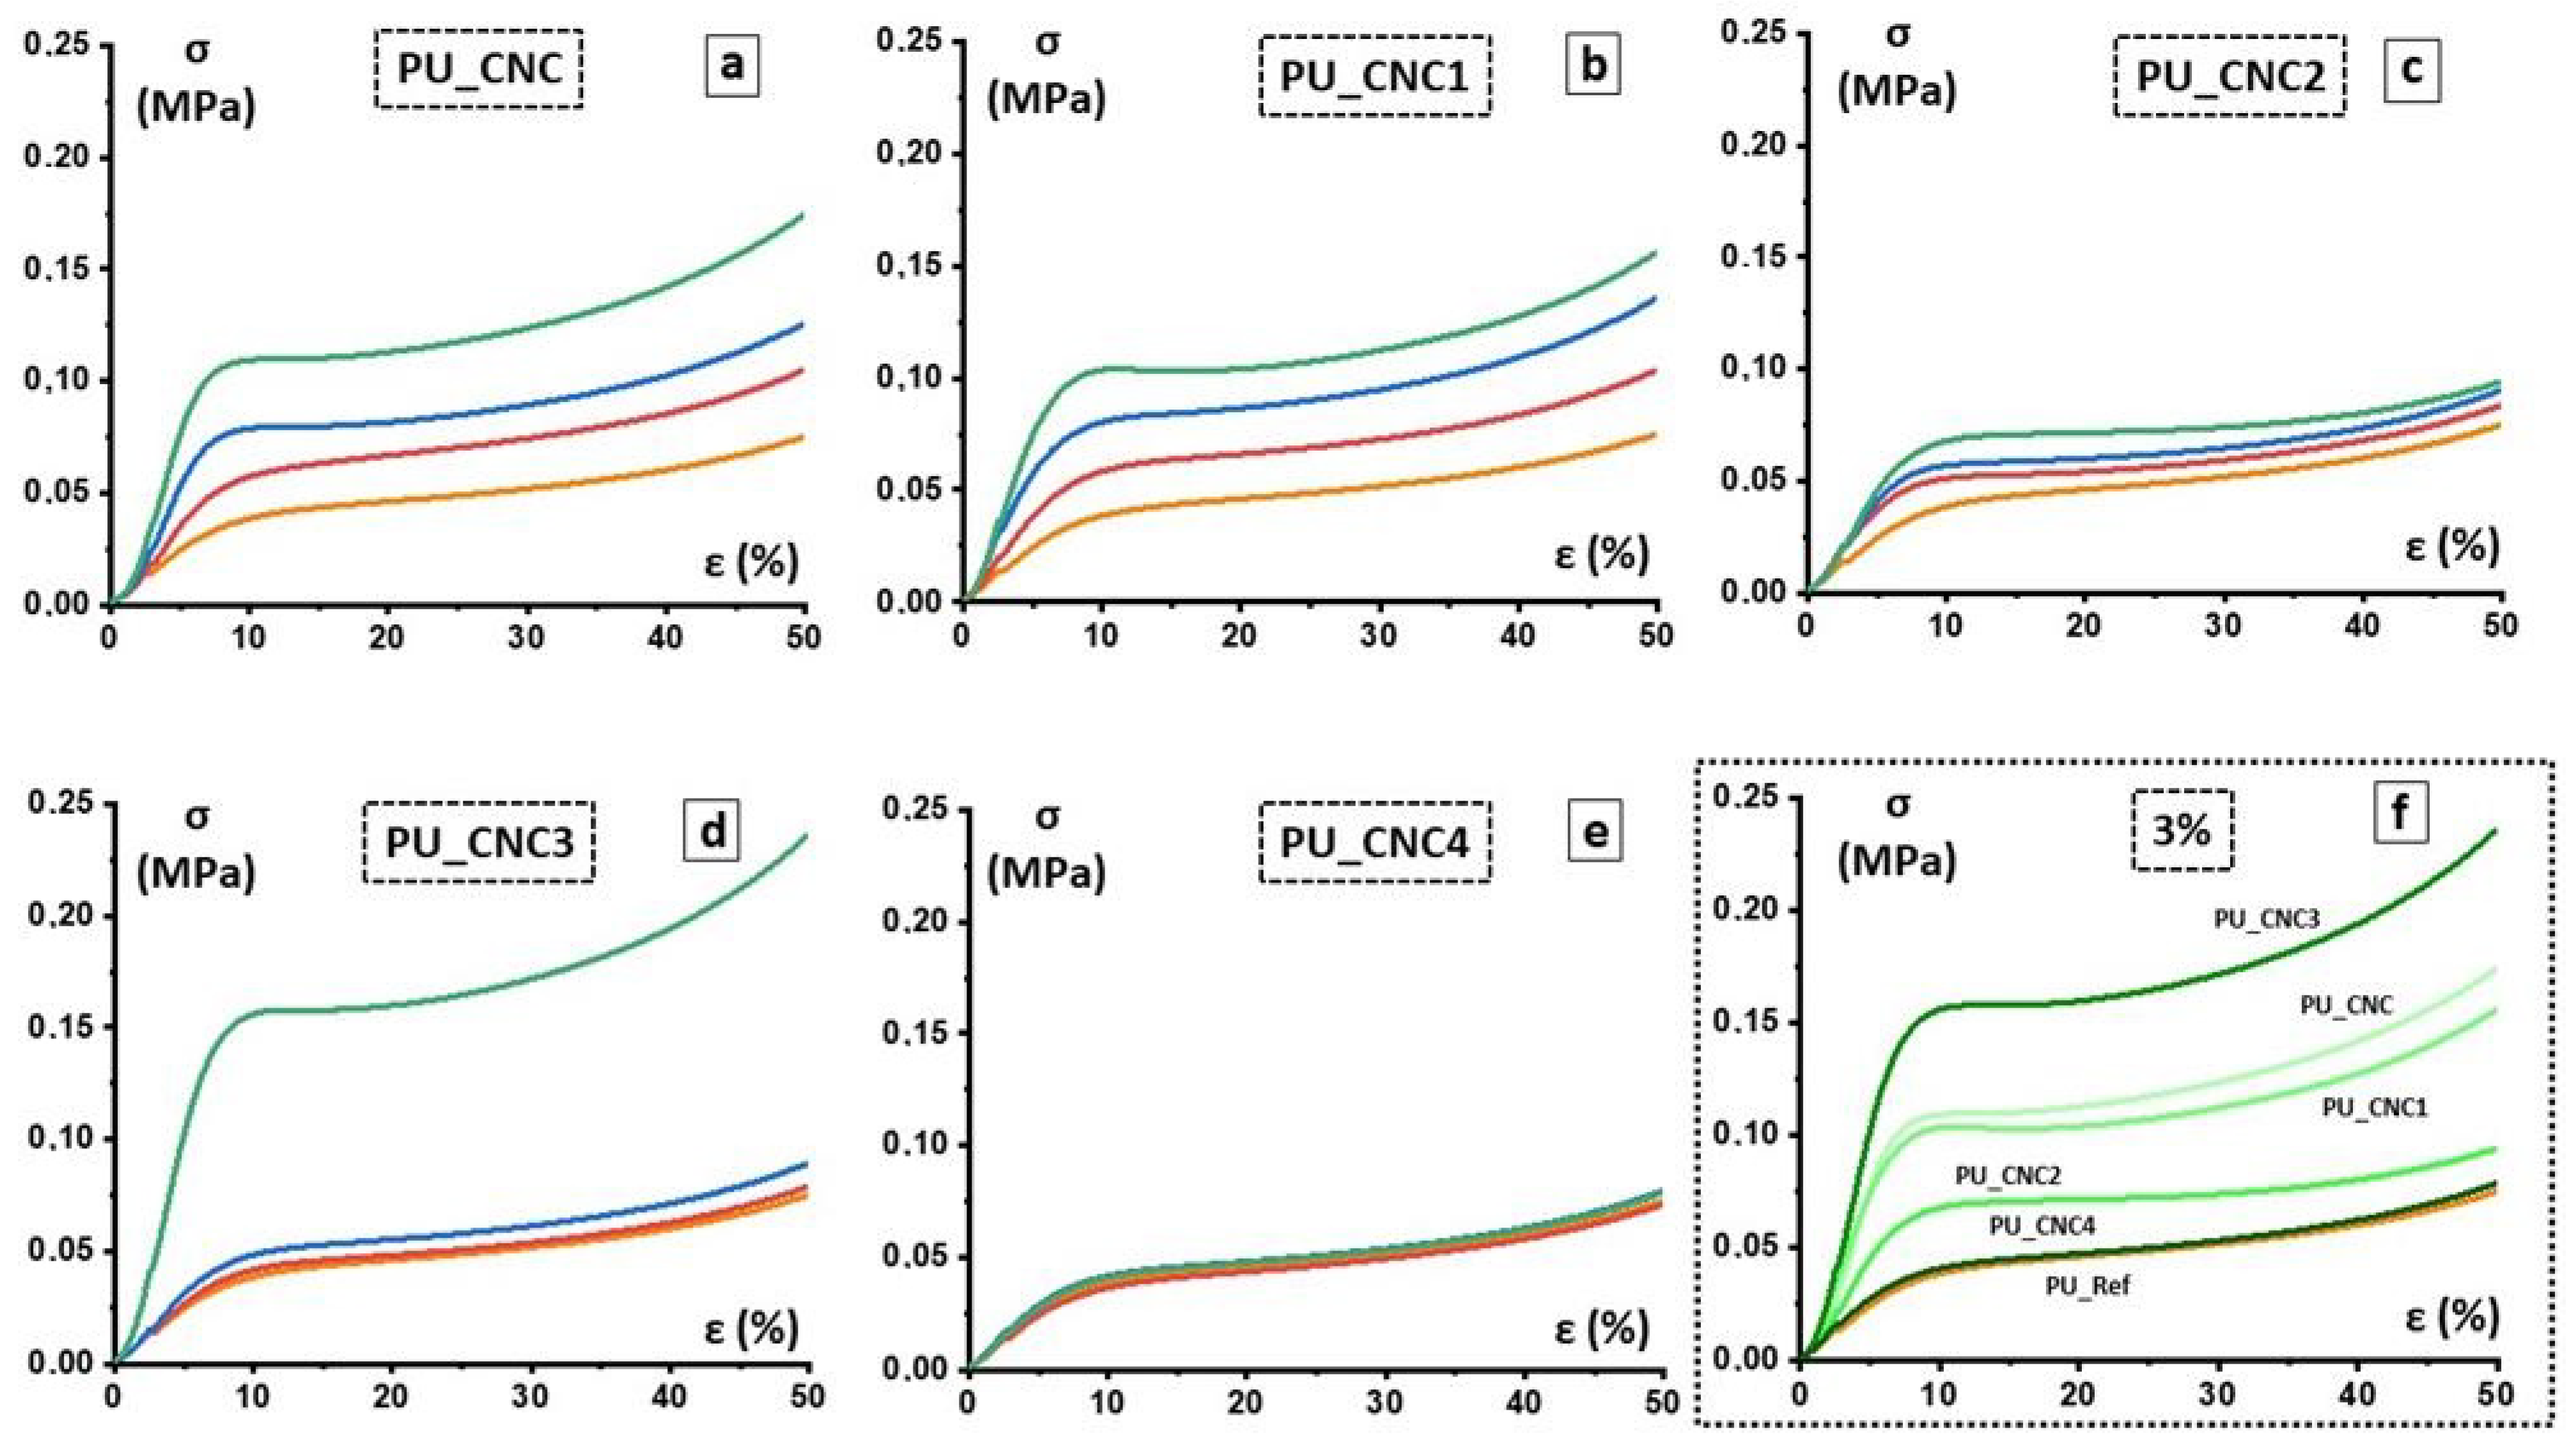
Mechanical compressive strength of PU foams was determined according to DIN EN ISO 844 and carried out through Zwick 1445 Retroline machine (ZwickRoell GmbH and Co. KG, Berlin, Germany). The following parameters were used for measurement: initial load 0.5 N, E-modulus velocity 10 mm/min, testing velocity 10%/min, maximal deformation 70%. Compressive strength at 10% and 40% strain and according to values of compressive modulus were performed. Then, 10 specimens were tested and an average value was taken along with the standard deviation.
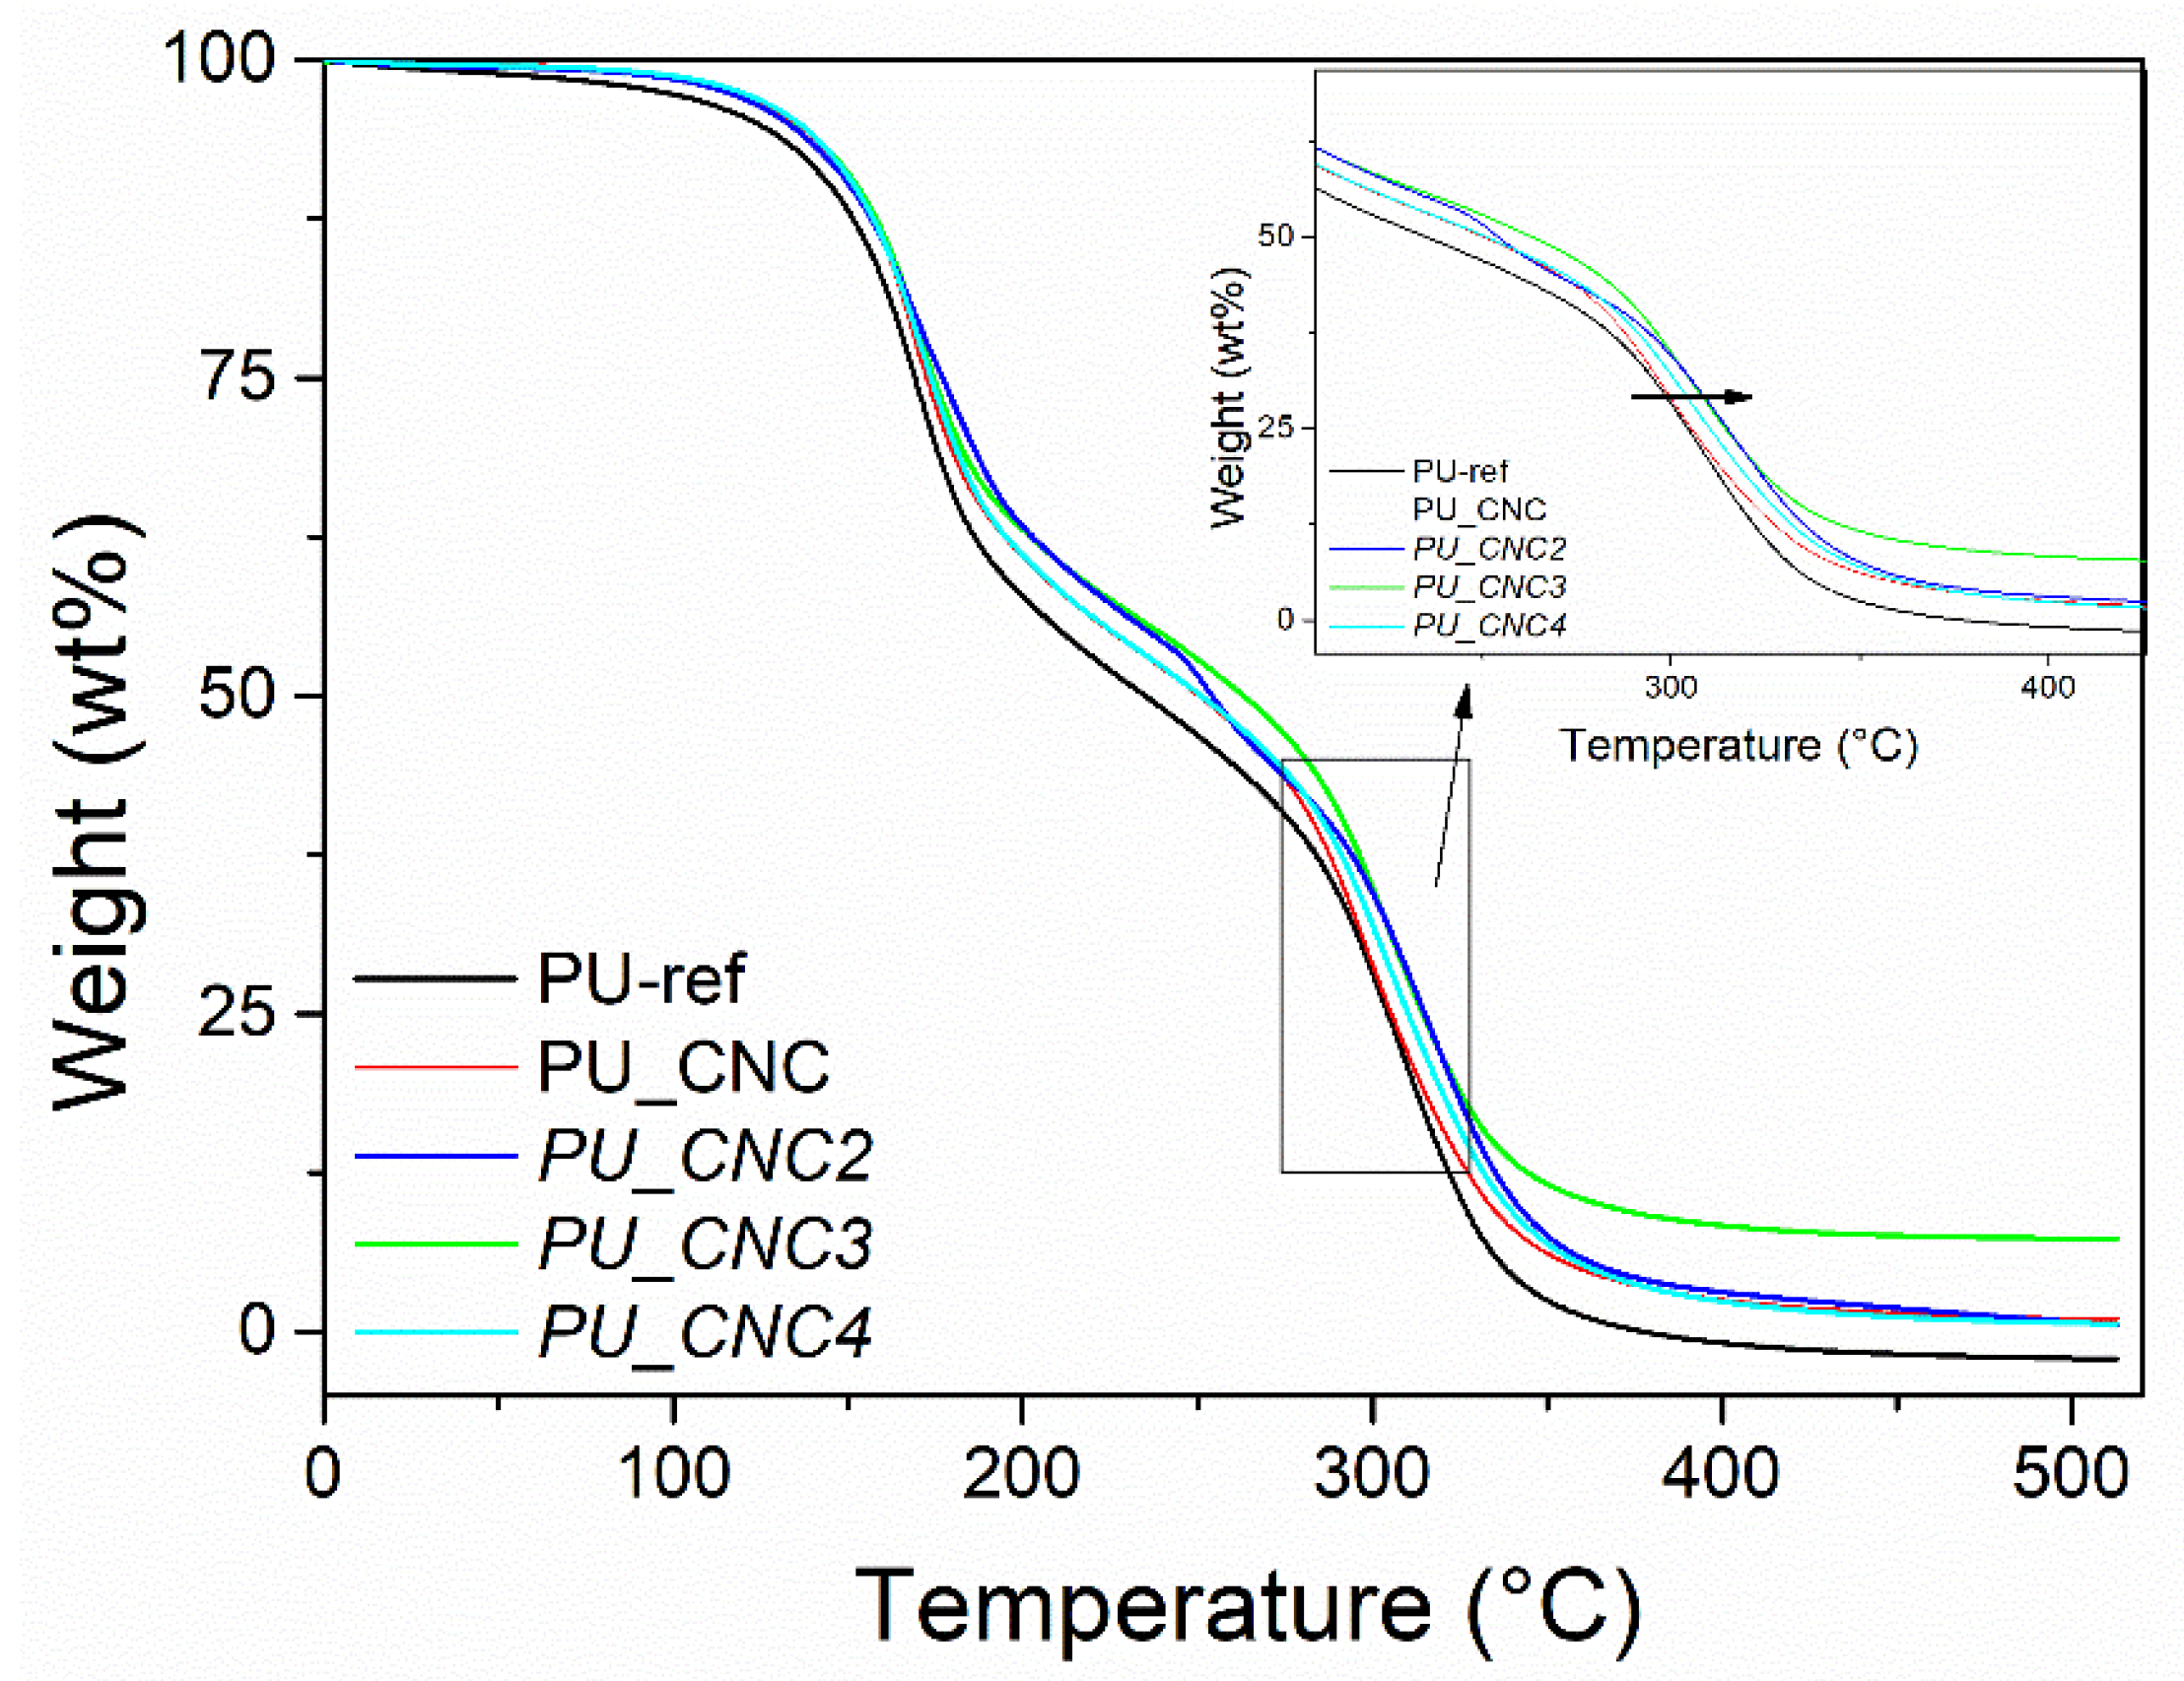
TGA/DTG analysis of PU foams was carried out with TGA/DSC 3+ STAReSystem (Mettler Toledo, Berlin, Germany). An amount of 5–10 mg of powder sample was loaded in the aluminum crucible and analyzed by the thermal analyzer. Thermal degradation was terminated from RT up to 580 °C with a heating rate of 10 °C/min under an air flow of 50 mL/min.
2.4.3. Modified Gibson–Ashby Model
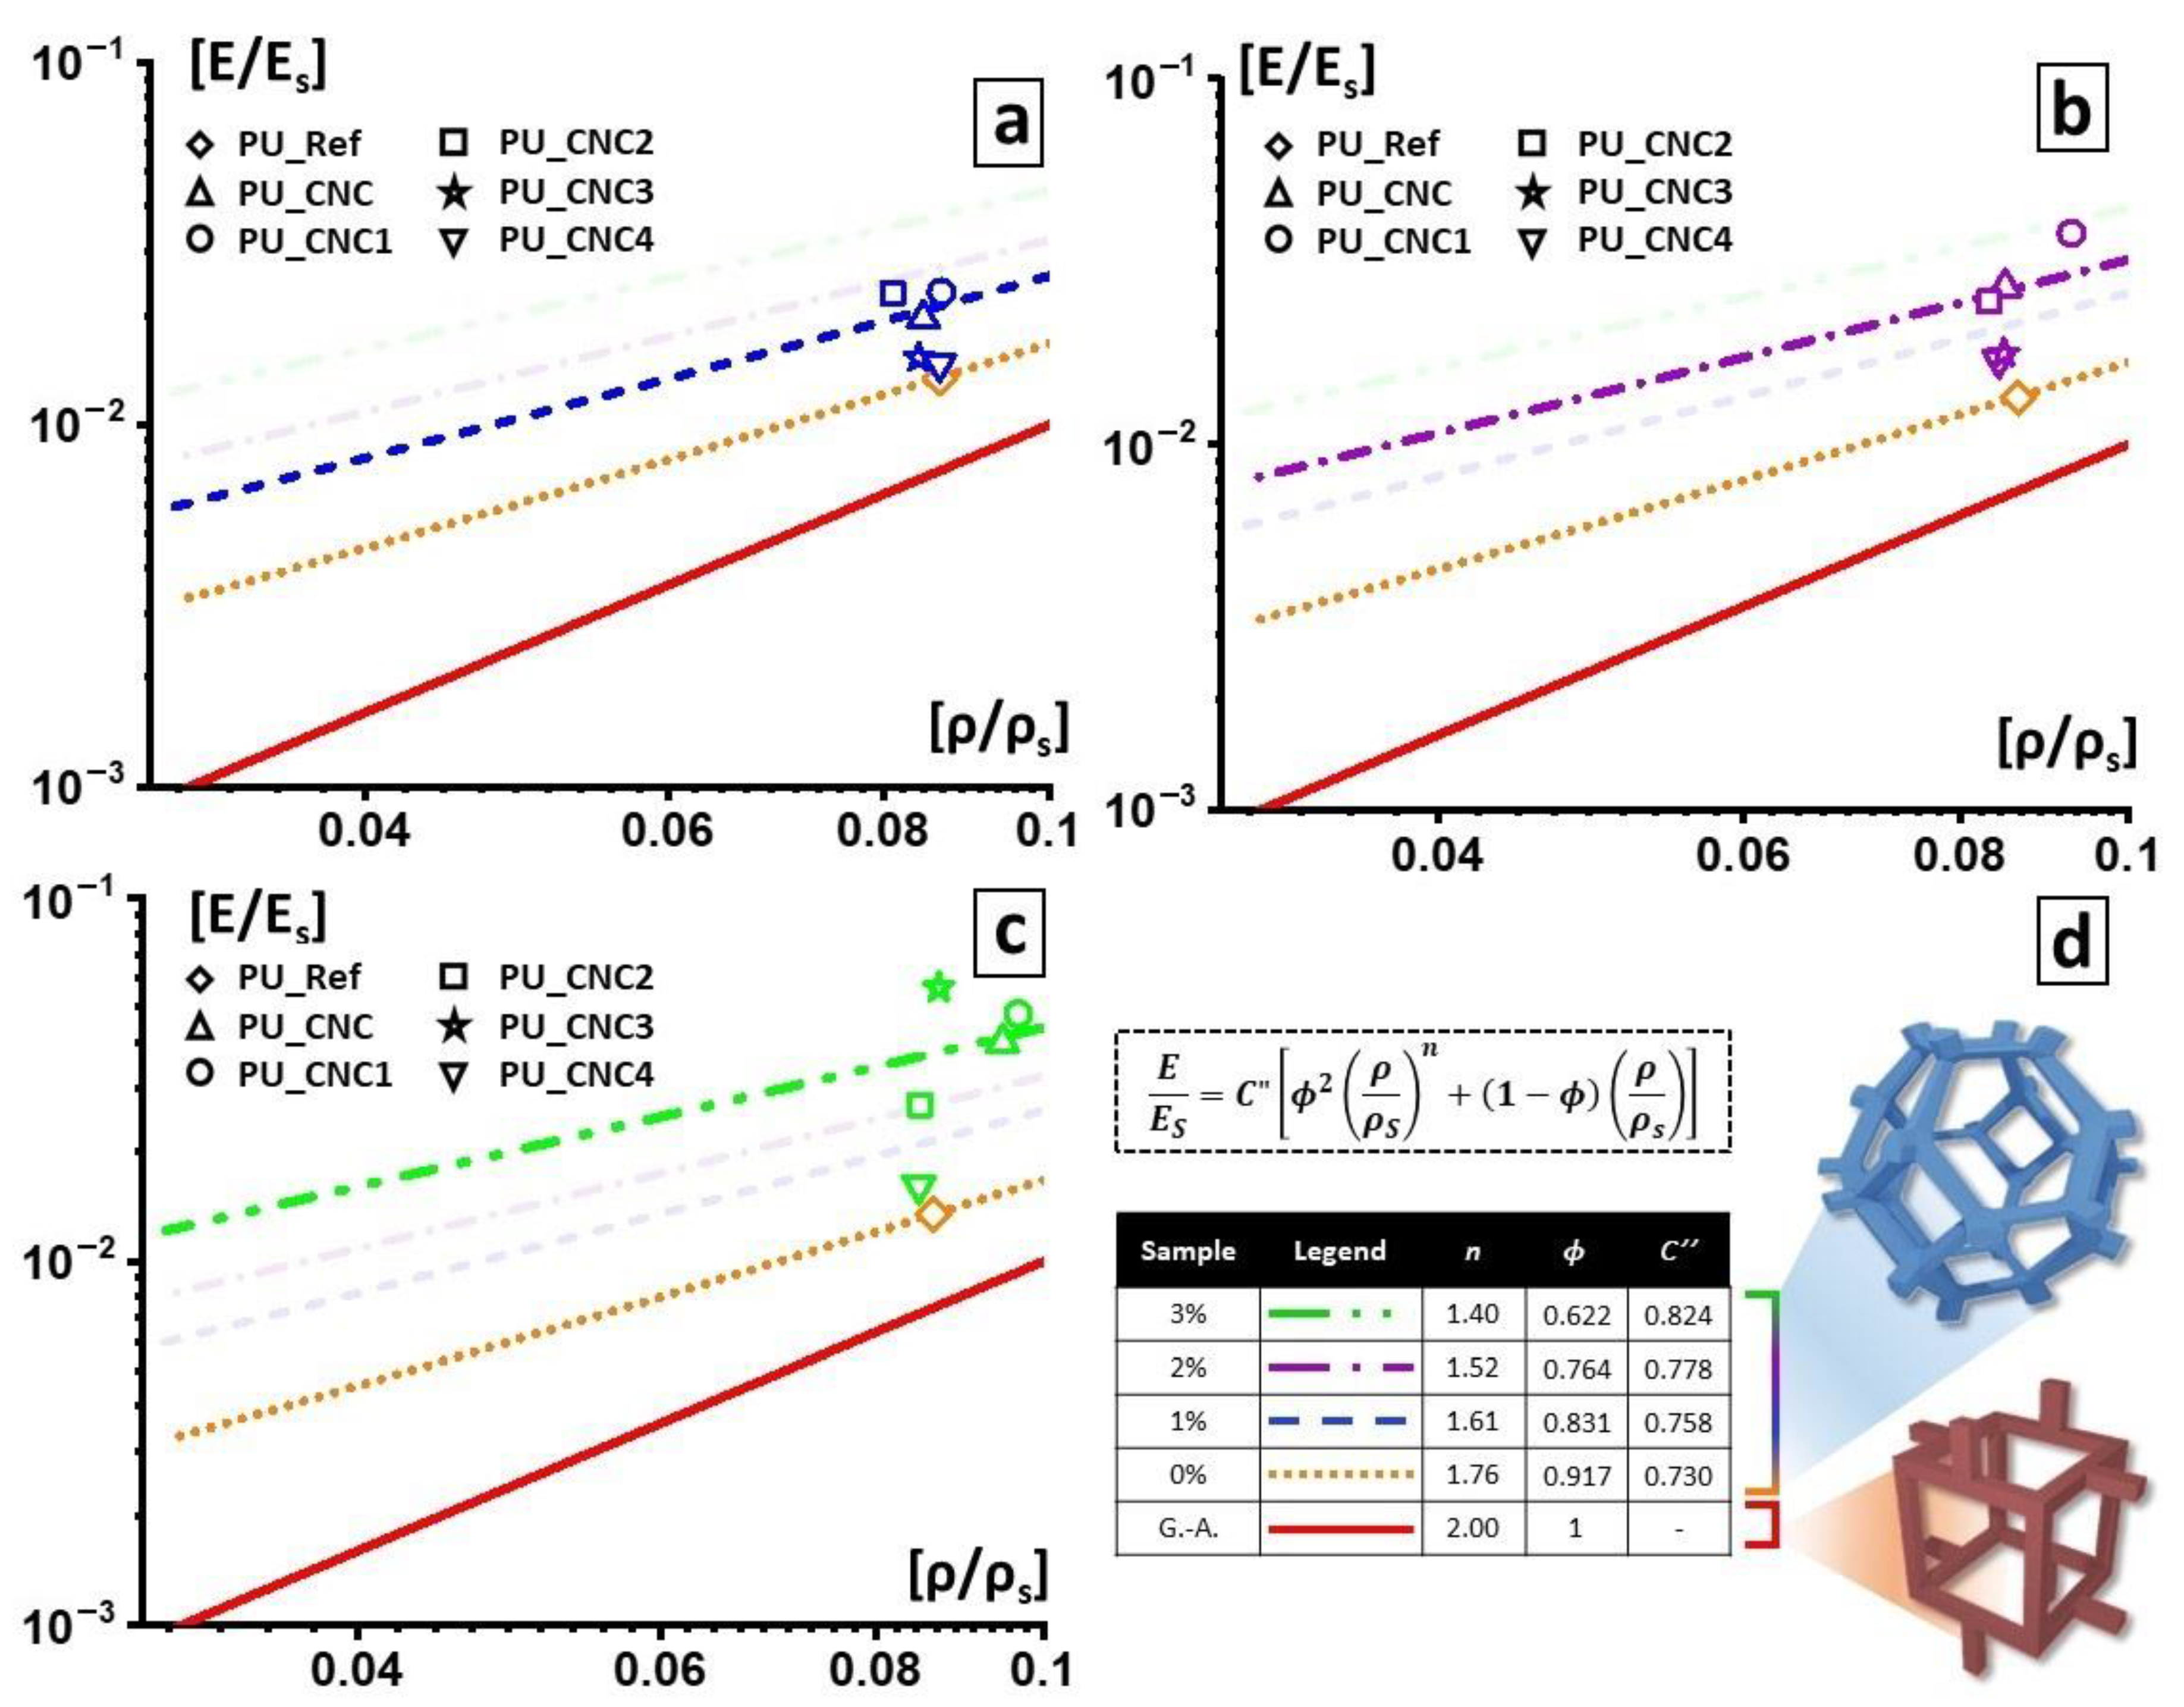
Even though the foam cell structure can be appreciated from the SEM analysis, the direct correlation between the cell walls or edges structure and mechanical properties is better elucidated by the Gibson–Ashby model [
37,
38,
39]. It correlates the relative density (density of the foam over the density of the cell-walls (or cell-edges) material, ρ/ρ
s) with the mechanical properties of the foam, such as the relative Young’s modulus given by the ratio between the elastic modulus of the foamed material (E) and the elastic modulus of the material constituting the cell walls (Es) by Equation (2).
where
C and
C′ are usually equal to 1, and the factor ϕ is the fraction of volume condensate in the cell edges. This equation is usually related to foams with closed-cell structures. If ϕ = 1, then the equation becomes
which models open-cell foams. However, a more generic equation could explain how the pores constituting the foam are made:
when
C = 1, it is possible to obtain the value of the exponent
n for each set of data.
Here we propose a modified Gibson–Ashby equation to model the linear elasticity of our PU foams with a hybrid open/closed cells structure. We start with Equation (2) to obtain ϕ values for each foam. In this way, we collected a dataset of the average pore of the single PU foam is constituted, in terms of material distribution between edges and wall.
Once the dataset was collected, we used it to develop the modified Gibson–Ashby model that could better fit with our outcomes.
with
C″ (given by Equation (6)) is a constant, depending on the variables (ϕ and
n) by a power law, by means of two arbitrary constants
a and
b. Since the equation is non-linear, it is solved by successive attempts, in order to obtain a general value of
C″, from which each out-coming best fit does not differ from the relative modulus and relative density of the corresponding material of more than 1%. In our specific case, the two constants resulted to be
a = 1.7 and
b = 5.
Substituting the exponent n with the values found with Equation (4) and the factor ϕ with values found with Equation (2), the presented model fit the measured mechanical parameters best and was better at elucidating the structure of the foam.
4. Conclusions
In this paper, a protocol for the synthesis of CNC-grafted-biopolyol to be used as a successful active filler in bio-PUFs was assessed. Four different alkyl silanes were used as efficient coupling agents for the grafting of CNC and bio-polyols.
Best results in terms of mmol of silane grafted on the CNC were obtained by using trichloro(propyl)silane (TCPS) with dried CNC and DMF as reaction medium.
Moreover, the grafting of TCPS induces a significant change in the crystalline structure of CNC (CNC3), while TMPS (CNC1) and TMOS (CNC2) and APTES (CNC4) do not seem to have any effect. This behavior could be correlated to the intercalation of TCPS within the structure of cellulose. In particular, the intercalation is higher for TCPS with respect to the more sterically hindered TMPS. This promotes a partial exfoliation of the fibrils, which became available, through OH groups, to react with isocyanate groups.
The functionalized and un-functionalized CNCs are used as reactive filler in polyurethane foams and their effects on morphological, mechanical, thermal and functional properties are determined. Morphological analysis reveals that, with respect to the PU-Ref, the CNC3 leads to a reduction of foam-cells of the final foams (PU_CNC3); on the other hand, any changes in microstructure are observed for the other PU composites. In addition, the PU_CNC3 system (mainly for the PU_CNC3_3) highlights an increase up to more than 300% in the compressive strengths and of the Young modulus, along with an improvement of thermal stability if compared to the reference ones, PU-Ref, and the PU_CNC.
Thanks to the modified Gibson–Ashby model, by means of the mechanical properties and, as a consequence, by means of the parameters used for the model, n and ϕ were also possible to monitor the changes in the foam cells, while the filler content changed. In this view, PU_CNC3_3 exhibited the most evaluable change in the material distribution, with smaller thickened cells, and consequently, a more distributed material among cell edges and cell walls while keeping an open-cell configuration.
Furthermore, as the most valuable result, it is shown that with a suitable functionalization of CNC, it is possible to have a reactive filler able to tune the hydrophobicity, thermal stability morphological structure and consequently the mechanical performances of polyurethane foams with a low concentration of filler.


 and
and 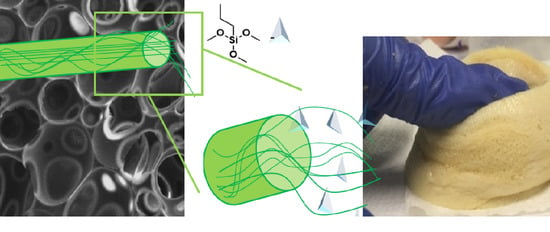


