
Enhanced Chemical and Electrochemical Stability of Polyaniline-Based Layer-by-Layer Films
by
 , , and
Putri Bintang Dea Firda
1, 
Yoga Trianzar Malik
1,
Jun Kyun Oh
2,
Evan K. Wujcik
3 and
Ju-Won Jeon
1,* 1
Department of Chemistry, Kookmin University, 77, Jeongneung-ro, Seongbuk-gu, Seoul 136-702, Korea
2
Department of Polymer Science and Engineering, Dankook University, 152 Jukjeon-ro, Suji-gu, Yongin-si 16890, Korea
3
Materials Engineering and Nanosensor [MEAN] Laboratory, Department of Chemical and Biological Engineering, The University of Alabama, Tuscaloosa, AL 35487, USA
*
Author to whom correspondence should be addressed.
Polymers 2021, 13(17), 2992; https://0-doi-org.brum.beds.ac.uk/10.3390/polym13172992
Submission received: 10 August 2021
/
Revised: 28 August 2021
/
Accepted: 30 August 2021
/
Published: 3 September 2021
(This article belongs to the Special Issue Conjugated Polymer Nanocomposites: Synthesis, Characterization, and Applications)
Abstract
:Polyaniline (PANI) has been widely used as an electroactive material in various applications including sensors, electrochromic devices, solar cells, electroluminescence, and electrochemical energy storage, owing to PANI’s unique redox properties. However, the chemical and electrochemical stability of PANI-based materials is not sufficiently high to maintain the performance of devices under many practical applications. Herein, we report a route to enhancing the chemical and electrochemical stability of PANI through layer-by-layer (LbL) assembly. PANI was assembled with different types of polyelectrolytes, and a comparative study between three different PANI-based layer-by-layer (LbL) films is presented here. Polyacids of different acidity and molecular structure, i.e., poly(acrylic acid) (PAA), polystyrene sulfonate (PSS), and tannic acid (TA), were used. The effect of polyacids’ acidity on film growth, conductivity, and chemical and electrochemical stability of PANI was investigated. The results showed that the film growth of the LbL system depended on the acidic strength of the polyacids. All LbL films exhibited improved chemical and electrochemical stability compared to PANI films. The doping level of PANI was strongly affected by the type of dopants, resulting in different chemical and electrochemical properties; the strongest polyacid (PSS) can provide the highest conductivity and chemical stability of conductive PANI. However, the electrochemical stability of PANI/PAA was found to be better than all the other films.

1. Introduction
Polyaniline (PANI) is a type of conducting polymer that has been widely studied in sensors, electrochromic devices, solar cells, electroluminescence, and electrochemical energy storage systems due to its tunable conductivity, redox properties, high chemical flexibility, low cost, and facile synthesis [1,2,3,4,5]. Through a unique doping–dedoping process, PANI can have different oxidation states, i.e., fully reduced leucoemeraldine base (LB), leucoemeraldine salt (LS), partially oxidized emeraldine salt (ES), emeraldine base (EB), fully oxidized pernigraniline base (PB), and pernigraniline salt (PS), resulting in substantial changes in electrical conductivity and electroactivity [6]. The conductive state of PANI (ES form) can easily lose its electrical conductivity and electroactivity by dedoping and/or excessive oxidation [7,8]. For example, the conductive ES form of PANI can be spontaneously converted to a nonconductive EB form due to the volatility of small molecule dopants [9,10]. In addition, PANI can lose its electroactivity by diffusion of dopants and irreversible oxidation, resulting in performance degradation [7,8,9]. The low chemical and electrochemical stability of PANI is disadvantageous in many cases, which hinders its more practical applications [11,12]. Therefore, it is essential to improve PANI’s chemical and electrochemical stability, which remains a challenge.
One of the ways to increase the chemical and electrochemical stability of PANI is to dope it using large molecule polyacids, instead of small molecule anion dopants [1,13,14,15]. The Loo Group reported that electroactivity and electrochemical stability can be enhanced by doping PANI using a strong polyacid, poly(2-acrylamide-2-methyl-1-propane sulfonic acid (PAAMPSA)), showing that PANI can reversibly change its oxidation state in neutral and alkaline aqueous solutions [9]. Other research reported that a sulfonic acid group of PAAMPSA can change its reaction pathway and improve electrochemical stability in an nonaqueous solution by preventing the irreversible formation of an excessively oxidized PB state [16].
Layer-by-layer (LbL) assembly is a technique that can produce multilayer films consisting of a wide range of materials including polyelectrolytes, nanoparticles, biomolecules, and colloids [17,18,19]. LbL assembly can provide versatile routes for the construction of functional materials on substrates by sequential deposition of electroactive materials [1,20,21]. Several electroactive PANI-based multilayer films have been reported through the LbL assembly technique: PANI/V2O5 [8], PANI/poly(acrylic acid) (PAA) [1], PANI/multiwalled carbon nanotube [20], and PANI/PAAMPSA [7] in which the enhancement of electrochemical stability was observed. For instance, by optimizing the LbL assembly condition, PANI doped using PAA, a weak polyacid with carboxylic acid functional groups, exhibited highly improved electrochemical stability, in a nonaqueous electrolyte, in comparison to PANI homopolymer [1]. These results indicate that secondary interactions between PANI and polyacids strongly affect the electrochemical properties of PANI. However, how polyacids’ characteristics affect the electrochemical properties of PANI-based film remains unclear. We hypothesize that characteristics of polyacids such as acidic strength and molecular structure can influence secondary interactions and the doping level of PANI, resulting in different chemical and electrochemical properties.
Herein, in order to improve chemical and electrochemical stability of PANI, we assemble three different PANI LbL films using polystyrene sulfonate (PSS), PAA, and tannic acid (TA). We perform a systematic study to investigate the effect of pKa and the structure of polyacids on the chemical and electrochemical properties of PANI. In this study, polyacids of different acidity and molecular structure, i.e., PSS, PAA, and TA, are used as dopants to fabricate PANI-based LbL films. PSS is a strong polyacid (pKa: 1) [21] and PAA is a weak polyacid (pKa: 4.5) [22], while TA is relatively small and the weakest polyacid (pKa: ~8.5) [23,24]. It is found that the acidic strength of polyacids assembled with PANI affects the doping level of PANI in a consistent manner. For PANI assembled using a strong polyacid, PSS successfully improved the chemical stability across a wide range of pH, while the highest electrochemical stability was achieved in PANI assembled with a weak polyacid, PAA.
2. Materials and Methods
2.1. Materials
Emeraldine base polyaniline (EB, Mw = 20,000), poly(acrylic acid) (PAA, Mw = 250,000, 35 wt.% in H2O), tannic acid (TA, Mw = 1701, ACS reagent), poly(ethyleneimine) (PEI, Mw = 750,000, 50% aqueous solution), dimethylacetamide (DMAc, anhydrous, 99.8%), sodium sulfate (Na2SO4, ACS reagent, anhydrous), and hydrochloric acid (HCl, ACS reagent, 37%) were purchased from Sigma-Aldrich (Seoul, Korea). Poly(styrene sulfonic acid) (PSS, Mw = 75,000, 30 w/v% aqueous solution) was purchased from Alfa Aesar (Tewksbury, MA, USA). Indium–tin–oxide (ITO)-coated glass (~25 Ω) was purchased from AMG glass.
2.2. Preparation of Dispersions
ES dispersion was prepared from EB according to the previously reported method [25]. Briefly, 0.05 g of EB was diluted to 10 mL of DMAc then stirred overnight and sonicated for 8 h. Afterwards, the dispersion was diluted using DI water at pH 3–3.5, at a ratio of 1:9 DMAc to DI water. Subsequently, the pH of the dispersion was adjusted to 2.5 using 1 M HCl. For 0.5 mg mL−1 solutions of PEI, PAA, TA, and PSS, 50 mg of materials was diluted separately using DI water until the volume reached 100 mL. Then the pH was adjusted to 2.5 using 1 M HCl. A stable PANI (ES) dispersion was obtained by controlling the pH of the prepared PANI (EB) dispersion at 2.5 using 1 M HCl. At a pH of 2.5, an EB state was converted to an ES state [16], which was confirmed by the observation of a color change from blue (EB) to green (ES) dispersion. The presence of an ES state was confirmed by the UV–Vis spectra that showed the characteristic peak of an ES spectra (Supplementary Materials Figure S1). The absorbance peak at ~840 nm indicates the electronic transition of C=N bond, a shoulder peak at ~420 nm is ascribed to the polaron band transitions, while an absorbance peak at ~340 nm is assigned to the π–π* transition of the benzenoid ring [26,27].
2.3. Glass Pretreatment
ITO-coated glass slides were sequentially washed with acetone, ethanol, and DI water. Nitrogen blowing was performed after each step to dry the glass surface. Subsequently, the glass was sonicated in DI water for 20 min to eliminate possible contaminants [28]. After being dried by nitrogen blowing, the glass was treated with UV-O3 treatment for 20 min to increase the hydrophilicity of the glass [29]. The cleaned glasses were then deposited with PEI–PAA bilayers. The glass was dipped into PEI solution for 5 min, and then dipped in DI water for 1 min, three times. Afterward, the PAA layer was deposited using the same method. This sequential process was repeated twice to deposit two bilayers of a PEI–PAA pair to improve the following film deposition. The presence of the carboxylic acid functional group of PAA can increase hydrophilicity of the glass surface, interacting with PANI so that the adhesion and stability of the LbL films are improved [20].
2.4. Preparation of PANI/Polyacid LbL Films and PANI Films
The as-prepared ITO-coated glass was dipped into PANI (ES) dispersion for 5 min, then, subsequently, immersed into DI water for 1 min; this was performed three times to remove the excess PANI that was adsorbed. The polyacid (PAA, TA, or PSSA) layer was deposited following the same procedure. A bilayer of positively charged PANI and negatively charged polyacids was deposited sequentially until the desired number of bilayers was reached. LbL films of 5, 10, 20, 30, and 40 bilayers were prepared for each sample. PANI homopolymer film was also prepared as a reference sample. PANI (ES) dispersion of 2.5 mg/mL was deposited to the as-prepared ITO-coated glasses using a spin-coating technique (2000 rpm, 30 s) until the desired thickness was obtained.
2.5. Characterization
Film thickness and roughness were measured using profilometry (D-500, KLA-Tencor). The measurement was carried out at six different points for each sample and the obtained value was then averaged. Fourier transform infrared (FTIR) spectroscopy was performed using benchtop FTIR spectrometer (Agilent Cary 630 FTIR) and samples were scanned using an ATR mode. UV–Vis spectra were measured using a PerkinElmer UV–Vis Lambda 356 spectrometer. The absorbance was recorded in the wavelength range of 300–1100 nm. The surface morphology of the LbL system was captured by field emission scanning electron microscopy (FE-SEM) using a JEOL JSM-7610F.
The electrochemical properties of the LbL films were investigated in an aqueous three-electrode cell. The LbL-coated ITO-coated glass was used as a working electrode, Ag/AgCl was used as a reference electrode, a platinum wire was used as the counter electrode, and 1 M Na2SO4 in water was used as the electrolyte. The electrochemical measurements were performed using an IVIUMnSTAT multichannel electrochemical analyzer. A cyclic voltammetry scan was carried out using a voltage range of −0.2 V to 0.8 V (vs. Ag/AgCl). Conductivity was measured by electrochemical impedance spectroscopy (EIS) using an IVIUMnSTAT multichannel electrochemical analyzer.
3. Results and Discussions
3.1. Physical Properties of LbL Films
The photograph of the polyacid-doped, PANI-based film shows that, as the number of bilayers increases, a higher intensity of the film color (Figure 1a,b) is obtained, which indicates a consistent increase in film thickness. The growth and roughness profile are displayed by plotting film thickness and roughness as a function of bilayer numbers (Figure 1c,d). According to the profilometry results, the sample used for further characterizations is PANI/PAA 20BL, PANI/PSS 30BL, and PANI/TA 40BL which have similar thicknesses (116–150 nm).
Figure 1c shows the growth profiles of LbL films, in which PANI/PSS and PANI/PAA exhibit a similar growth pattern while PANI/TA film’s growth rate is much slower than PANI/PSS and PANI/PAA. The average thickness of one bilayer for PANI/PAA, PANI/PSS, and PANI/TA is 7, 5.8, 2.6 nm, respectively. The slow growth rate of PANI/TA can be attributed to the substantially smaller molecular weight of TA (Mw = 1701) compared to the other polyelectrolytes: PSS (Mw = 75,000) and PAA (Mw = 250,000). The slow growth rate of PANI/TA LbL films is confirmed by its weak green color (Figure 1a). The roughness value was obtained from the root-mean-square (RMS) data from profilometry measurement [30]. As shown in Figure 1d, the roughness profile of the LbL system also shows a similar trend to their growth profile.
The UV–Vis spectra of the samples were recorded as a function of bilayer pairs (Figure 2a–c). The spectra of the LbL systems showed a similar characteristic to the UV–V is spectra of the ES solution (Figure S1), which indicates that the LbL assembly processes did not change the oxidation state of PANI (ES). The broad absorption band at ~840 nm confirmed the presence of ES. The trend of the absorbance intensity at ~840 nm increased as the number of bilayers increased (Figure 2d), which agrees positively with the growth profiles and the intensity of the film color (Figure 1a–c). According to the Beer–Lambert law, concentration of the light-absorbing species has proportional relationships based on the following equation:
where A is absorbance, I is transmitted intensity, I0 is incident intensity, a is absorptivity (extinction coefficient), b is the length of the beam in the absorbing medium, and C is the concentration of the absorbing species [31,32]. This, therefore, reveals that the total amount of PANI consistently increases with an increased number of PANI/polyacid layer pairs.
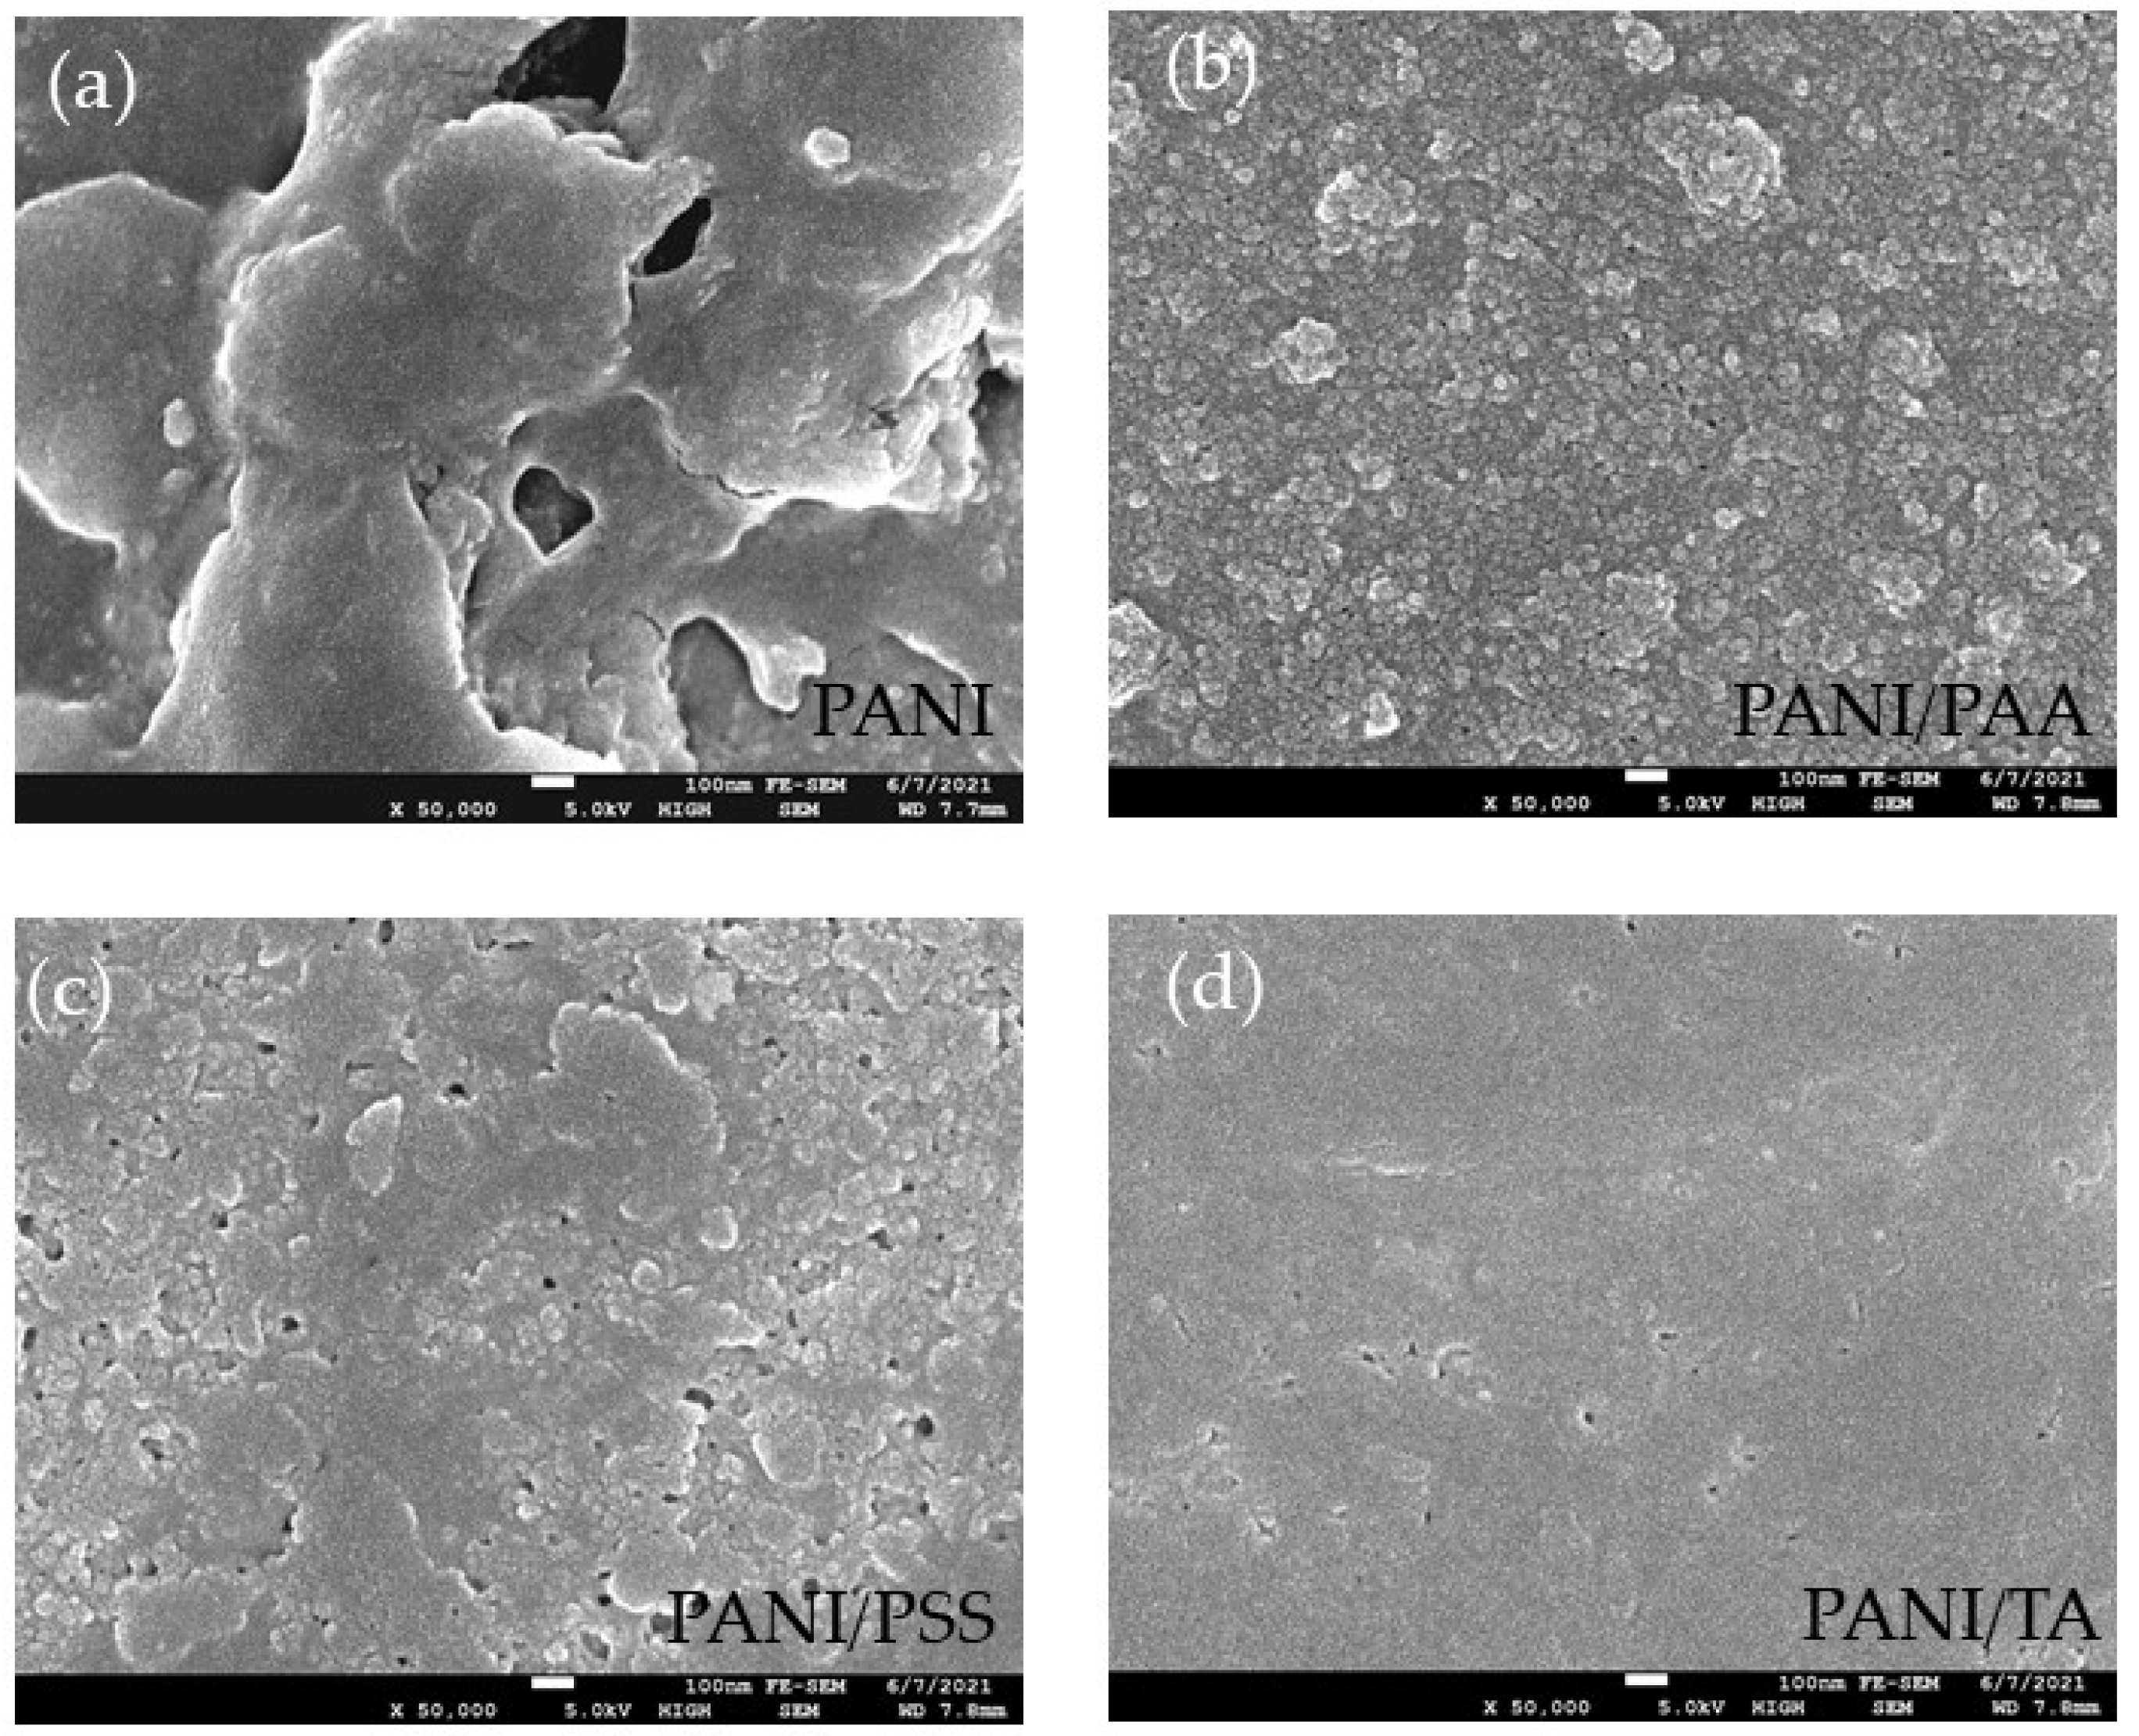
The FE–SEM images of the LbL films and PANI film are displayed in Figure 3a–d, with a magnification of 50,000 times (scale bar of 100 nm). The PANI film showed large particle aggregation, while other LbL films showed relatively uniform surface morphology. The RMS roughness of PANI, PANI/PSS, PANI/PAA, and PANI/TA, with similar thickness (116–153 nm), is 125, 60, 47, and 44 nm, respectively. Previous studies showed that doping PANI using small molecule HCl renders high-electrical conductivity but undesirable aggregation, while weak organic acid doping leads to more uniform morphology but lower electrical conductivity [33].
3.2. Chemical Properties of PANI/Polyacids LbL Films and PANI Films
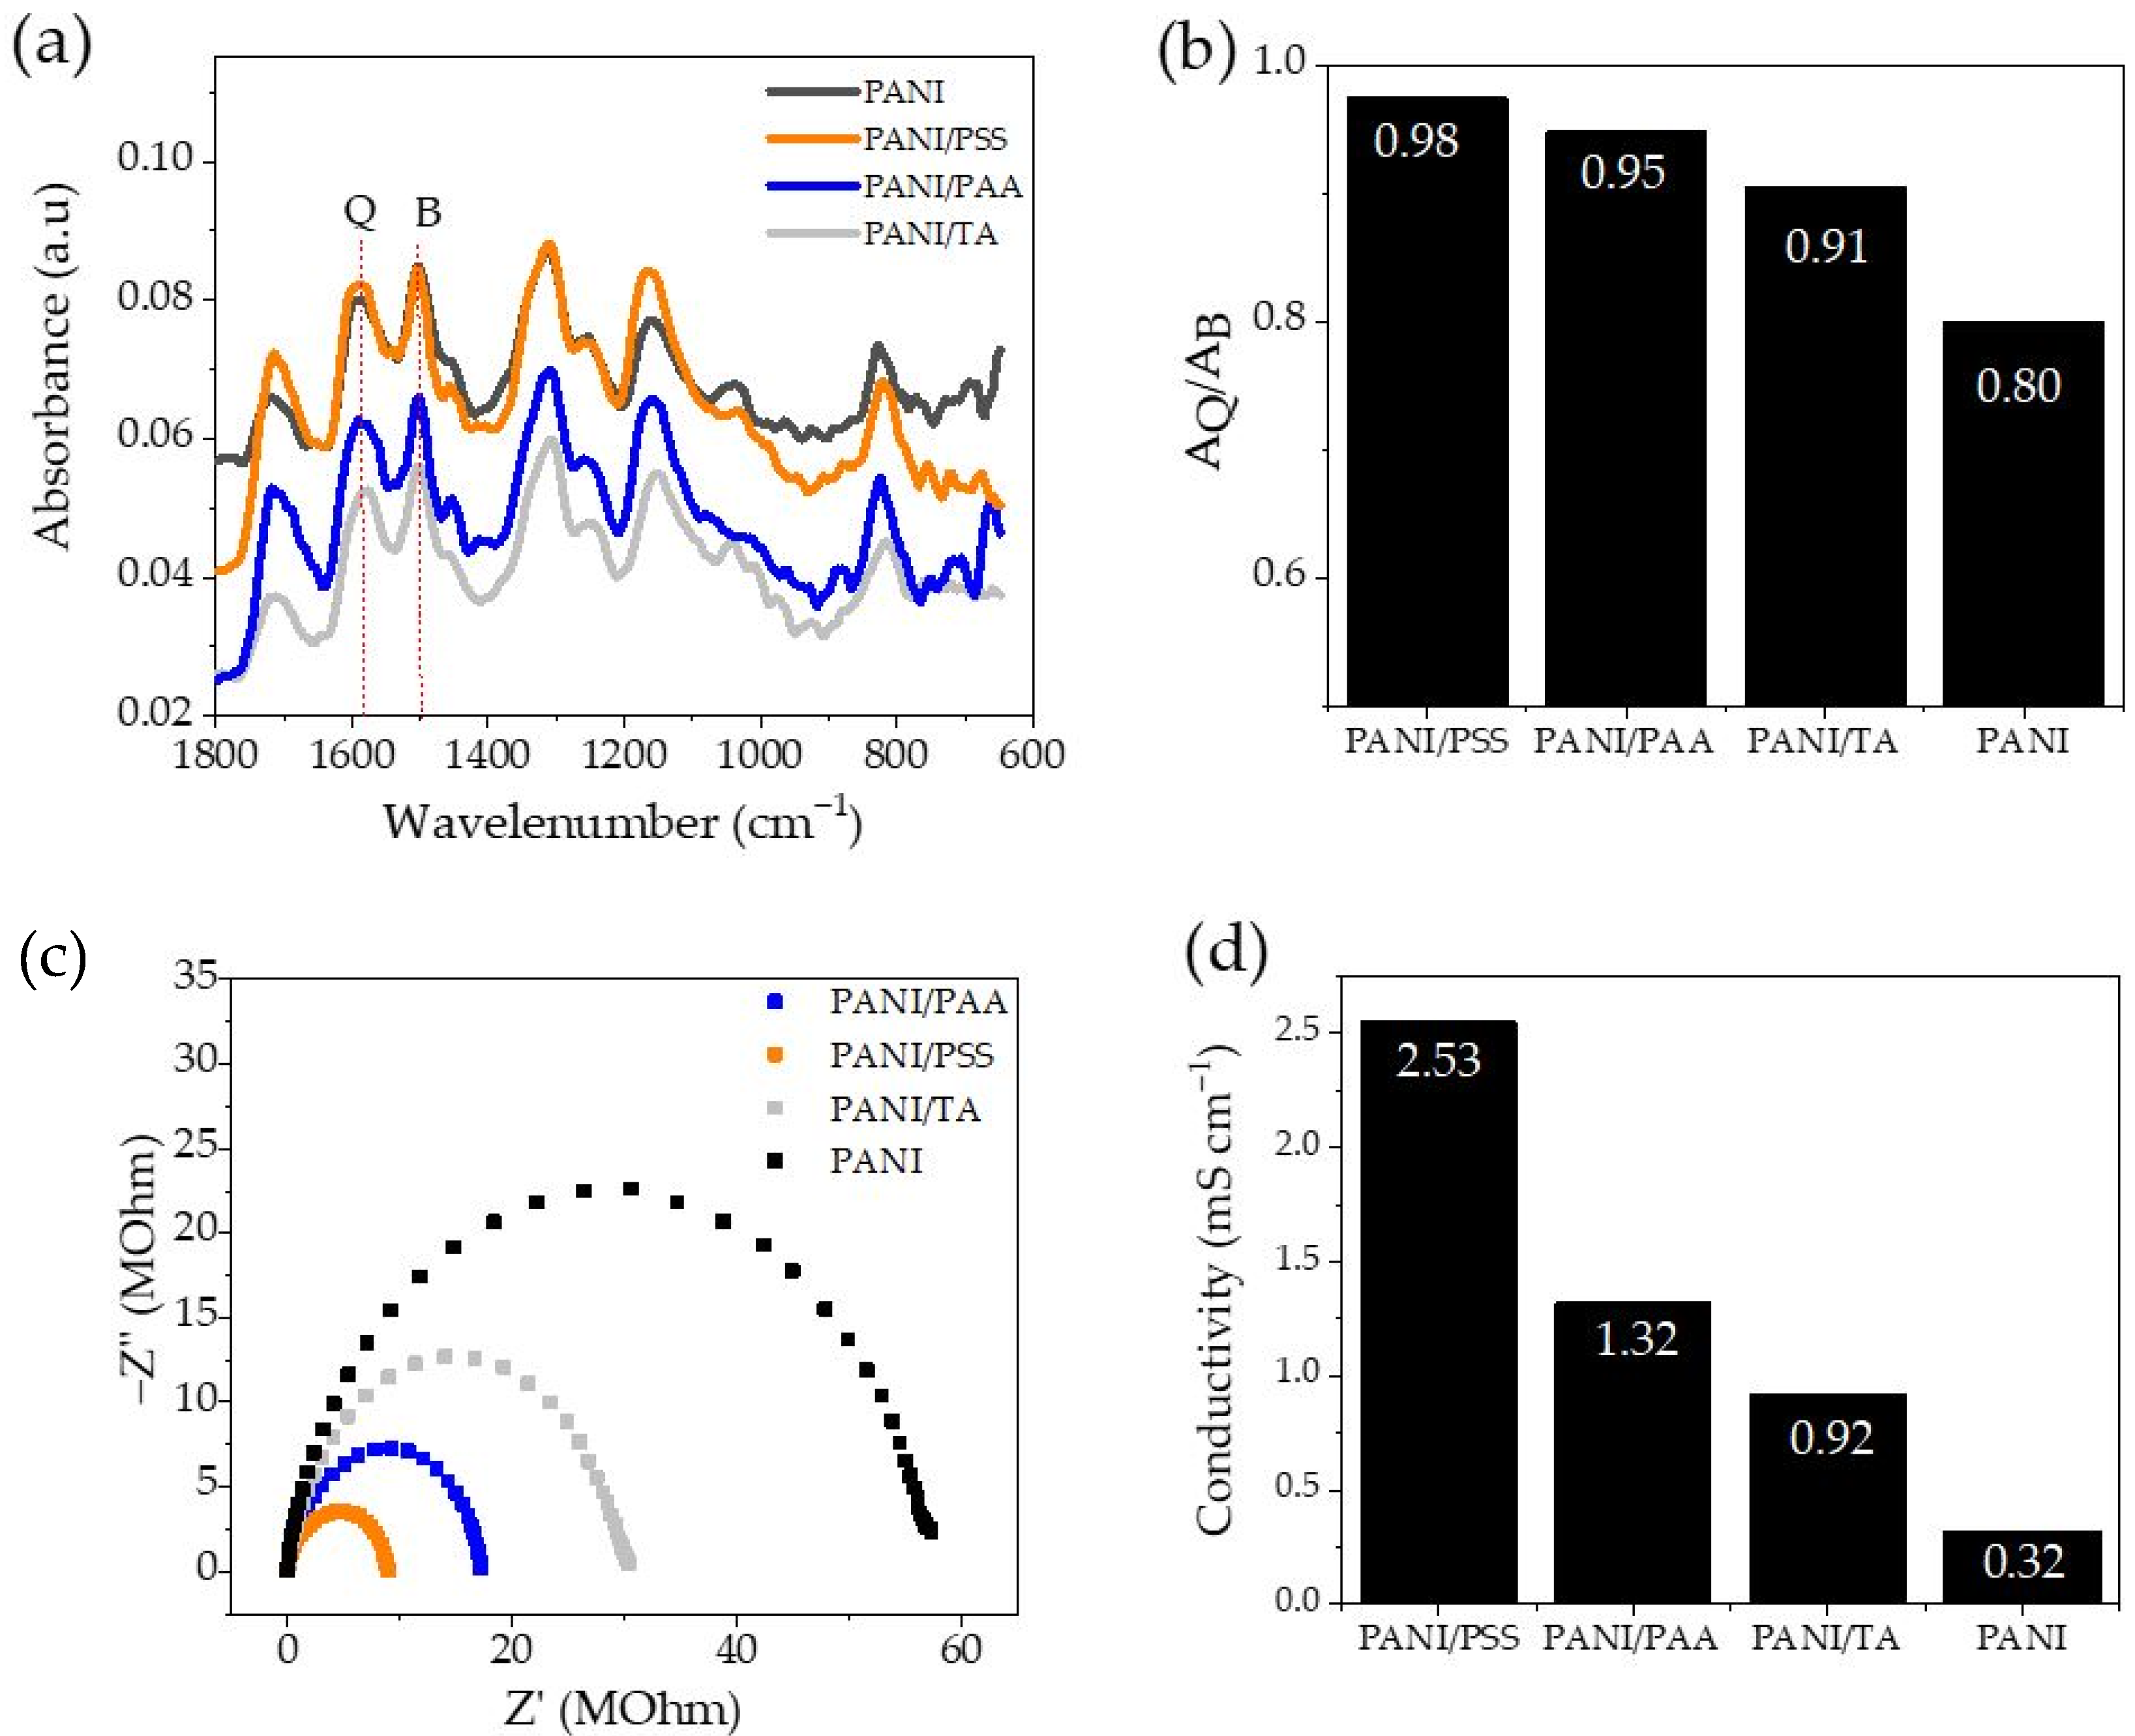
The FTIR spectra of the LbL films and PANI film were collected using the ATR method using bare ITO for the baseline (Figure 4a). All recorded spectra included the characteristic peaks of PANI. As summarized in Table 1, the peaks at ~1590 cm−1 and ~1500 cm−1 are attributed to the -C=C- stretching of the quinoid (Q) ring and benzenoid (B) ring, respectively [34]. The peaks ~1310 cm−1 and ~1160 cm−1 are ascribed to the C-N vibration of secondary aromatic amine and -NH+ vibration from the protonation of nitrogen atoms in the imine ring of quinone, while the peak at ~820 cm−1 is attributed to the trans =C-H out-of-plane bending [35,36].
The doping level of PANI film can be investigated from the FTIR spectra by calculating the ratio of peak intensity of Q to B (Figure 4b). In the chemical structure of PANI, the B ring is the more reduced unit, while the Q ring is the more oxidized unit [37]. Thus, as the doping level of PANI increases, the ratio of Q to B increases. Therefore, the value of the peak intensity ratio (Q/B) can be used to examine the degree of doping of PANI [38,39]. All LbL films have a higher Q/B value than PANI homopolymer (Figure 4b). The PANI assembled using the strongest polyacid, PSS, exhibited a Q/B ratio of 0.98, which is substantially higher than that of PANI (0.80). This is consistent with the previous study showing that PANI doped with PAA and HCl have higher doping levels than PANI doped with HCl [40]. In our study, polyacid solutions also contained HCl; these were used to adjust the pH of the solutions. This possibly led to a co-doping effect of polyacids and HCl, resulting in an increased doping level.
Interestingly, in our study, the doping level of LbL films is consistent with the trend of pKa values of polyacids. The Q/B ratios of films are ordered: PANI/PSS (0.98) > PANI/PAA (0.95) > PANI/TA (0.91) > PANI (0.80). A higher doping level was obtained using a stronger polyacid, demonstrating lower pKa values. The pKa values of PSS, PAA, and TA are known to be ~1, ~4.5, and ~8.5, respectively; PSS is the strongest polyacid and TA is the weakest polyacid [21,22,23]. The proportional relationship between the doping level of PANI and the strength of the polyacids can be attributed to the fact that stronger polyacids have a greater amount of negatively charged functional groups, which can dope PANI more effectively.
EIS measurement was carried out at a frequency range of 1 Hz–250 kHz. The Nyquist plot is depicted in Figure 4c. The resistance (Rs) value was determined from the low-frequency intersection of the Nyquist plot with the Z’ axis. Then, the conductivity value was calculated using the following equation:
where σ is conductivity (mS cm−1), d is electrode distance (cm), R is resistance (Ohm), and A is cross-sectional area (cm−2) [41]. The tabulated details of the data analysis are summarized in Table S2. As depicted in Figure 4d, the highest conductivity value of 2.53 mS cm−1 was obtained by PANI/PSS, followed by PANI/PAA at 1.32 mS cm−1, PANI/TA at 0.92 mS cm−1, and PANI at 0.32 S cm−1. The trend of the conductivity value is consistent with the trend of quinoid to benzenoid peak ratio in the FTIR results in Figure 4b. The conductivity of PANI can vary depending on numerous variables such as synthesis method, doping level, etc. [42]. Previous research reported a conductivity value of PANI–PSS thin film in the range of 3 × 10⁻⁴ mS cm−1 [43]. In our case, the low conductivity value can be attributed to low film thickness, since the conductivity of the thin film decreases with decreasing film thickness [44]. Izet et al. reported that a reciprocal relationship between the rotational speed of the disk (rpm) and the specific conductivity of doped PANI film is inversely proportional; as the rpm increased (film thickness decreased), the conductivity of the film decreased [45].
The high conductivity of PANI makes it useful for various applications such as sensors, solar cells, thermoelectric, supercapacitors, and batteries [3,6,33,39]. Thus, it is important to improve the chemical stability of the conductive form of PANI (ES). It is known that the electroactivity of PANI will gradually reduce due to its oxidation state change from ES to EB by spontaneous dedoping of PANI [9]. The chemical stability of PANI depends on several factors such as acidity, molecular weight, polarity of dopants, pH condition, and type of electrolyte [46].
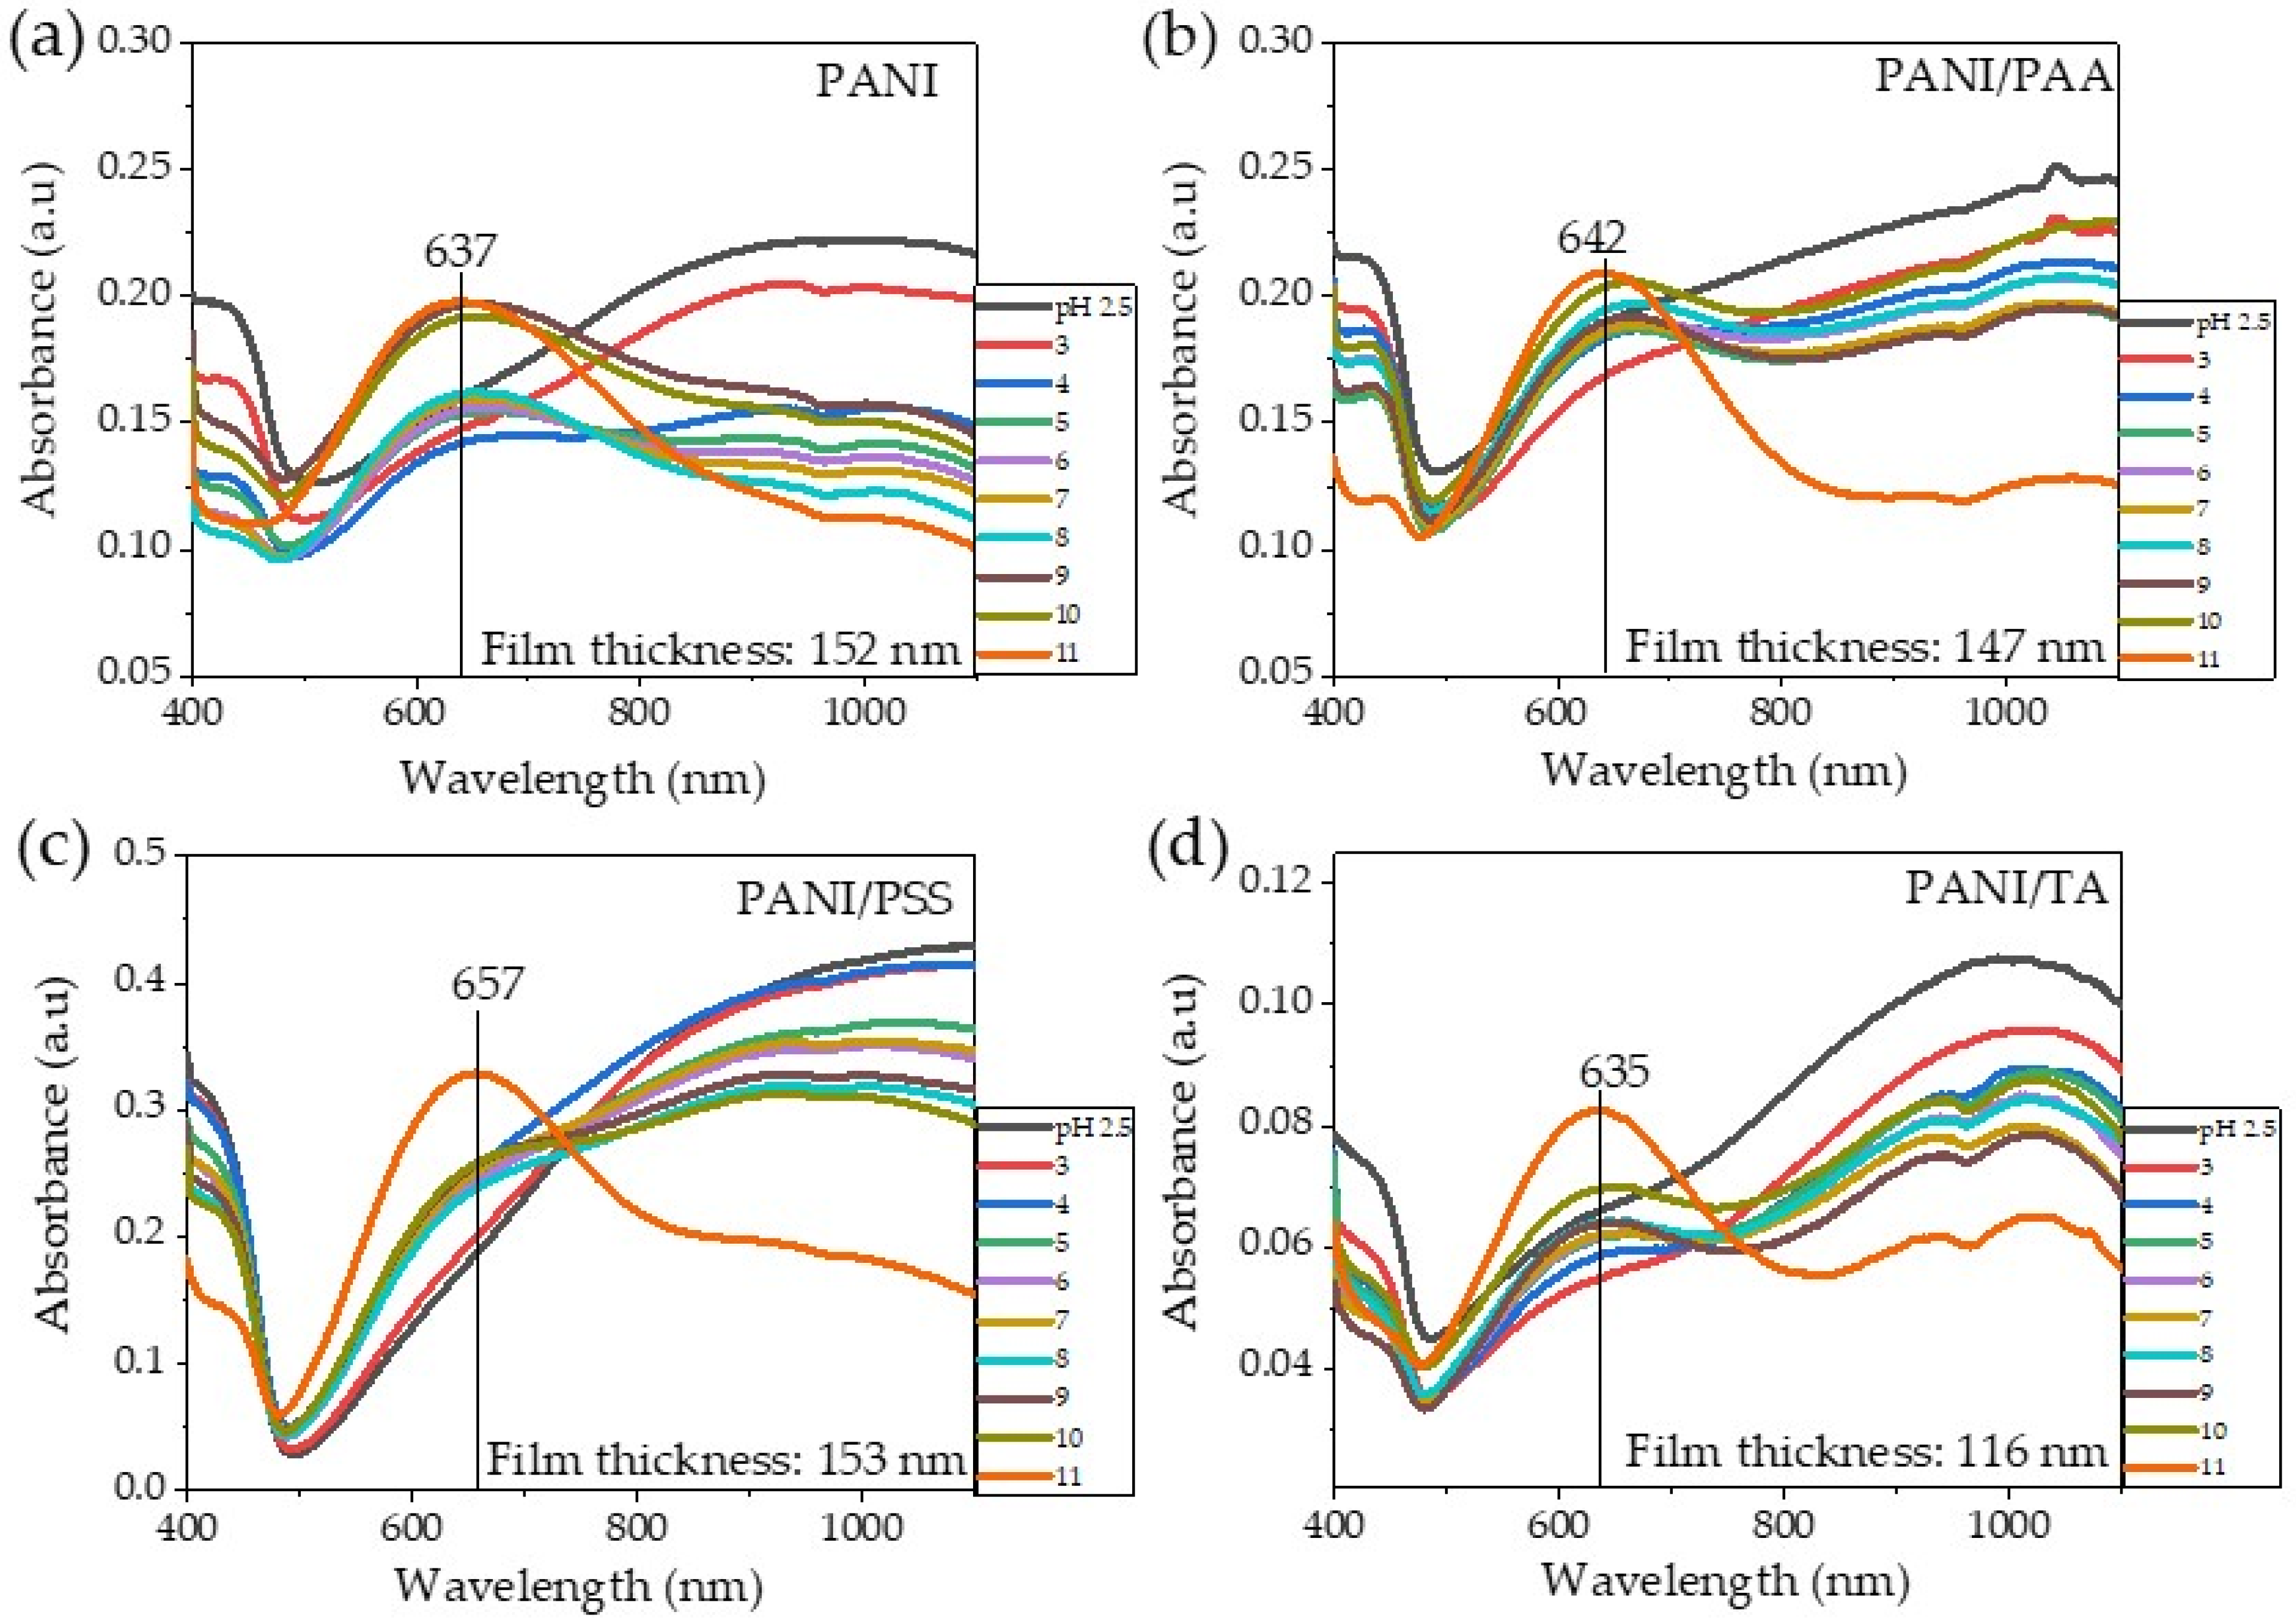
We investigated the chemical stability of the ES state of PANI-based films using UV–Vis spectroscopy at different pH values of water, as shown in Figure 5a–d. The UV–Vis spectra of the PANI homopolymer film showed that peak intensity of a broad absorption peak at around 1000 nm significantly decreased, and a new peak at 637 nm started to appear at pH 5 (Figure 5a). This result indicates that the ES form of PANI films was converted to EB at a pH value higher than 5 [9]. Importantly, all PANI/polyacid LbL films exhibited better chemical stability of ES of PANI than the PANI homopolymer film. The PANI/PSS, PANI/PAA, and PANI/TA films can still retain the ES characteristic peak in the near-IR region (~1000 nm) up to pH 10. However, at pH 11, all LbL films exhibited substantially reduced peak intensity in the near-IR region, showing new peaks at 642, 635, and 657 nm, for PANI/PAA, PANI/TA, and PANI/PSS, respectively. The peaks at 642 nm (PANI/PAA) and 635 nm (PANI/TA) are indicative of EB [27], while the peak at 657 nm could be attributed to PS [16]. We hypothesize that the protonated amine group of PANI ES strongly interacts with the sulfonic acid group in PSS, more so than carboxylic acid in PAA and hydroxyl group in TA, which likely changes the reaction pathway.
3.3. Electrochemical Study of LbL Films
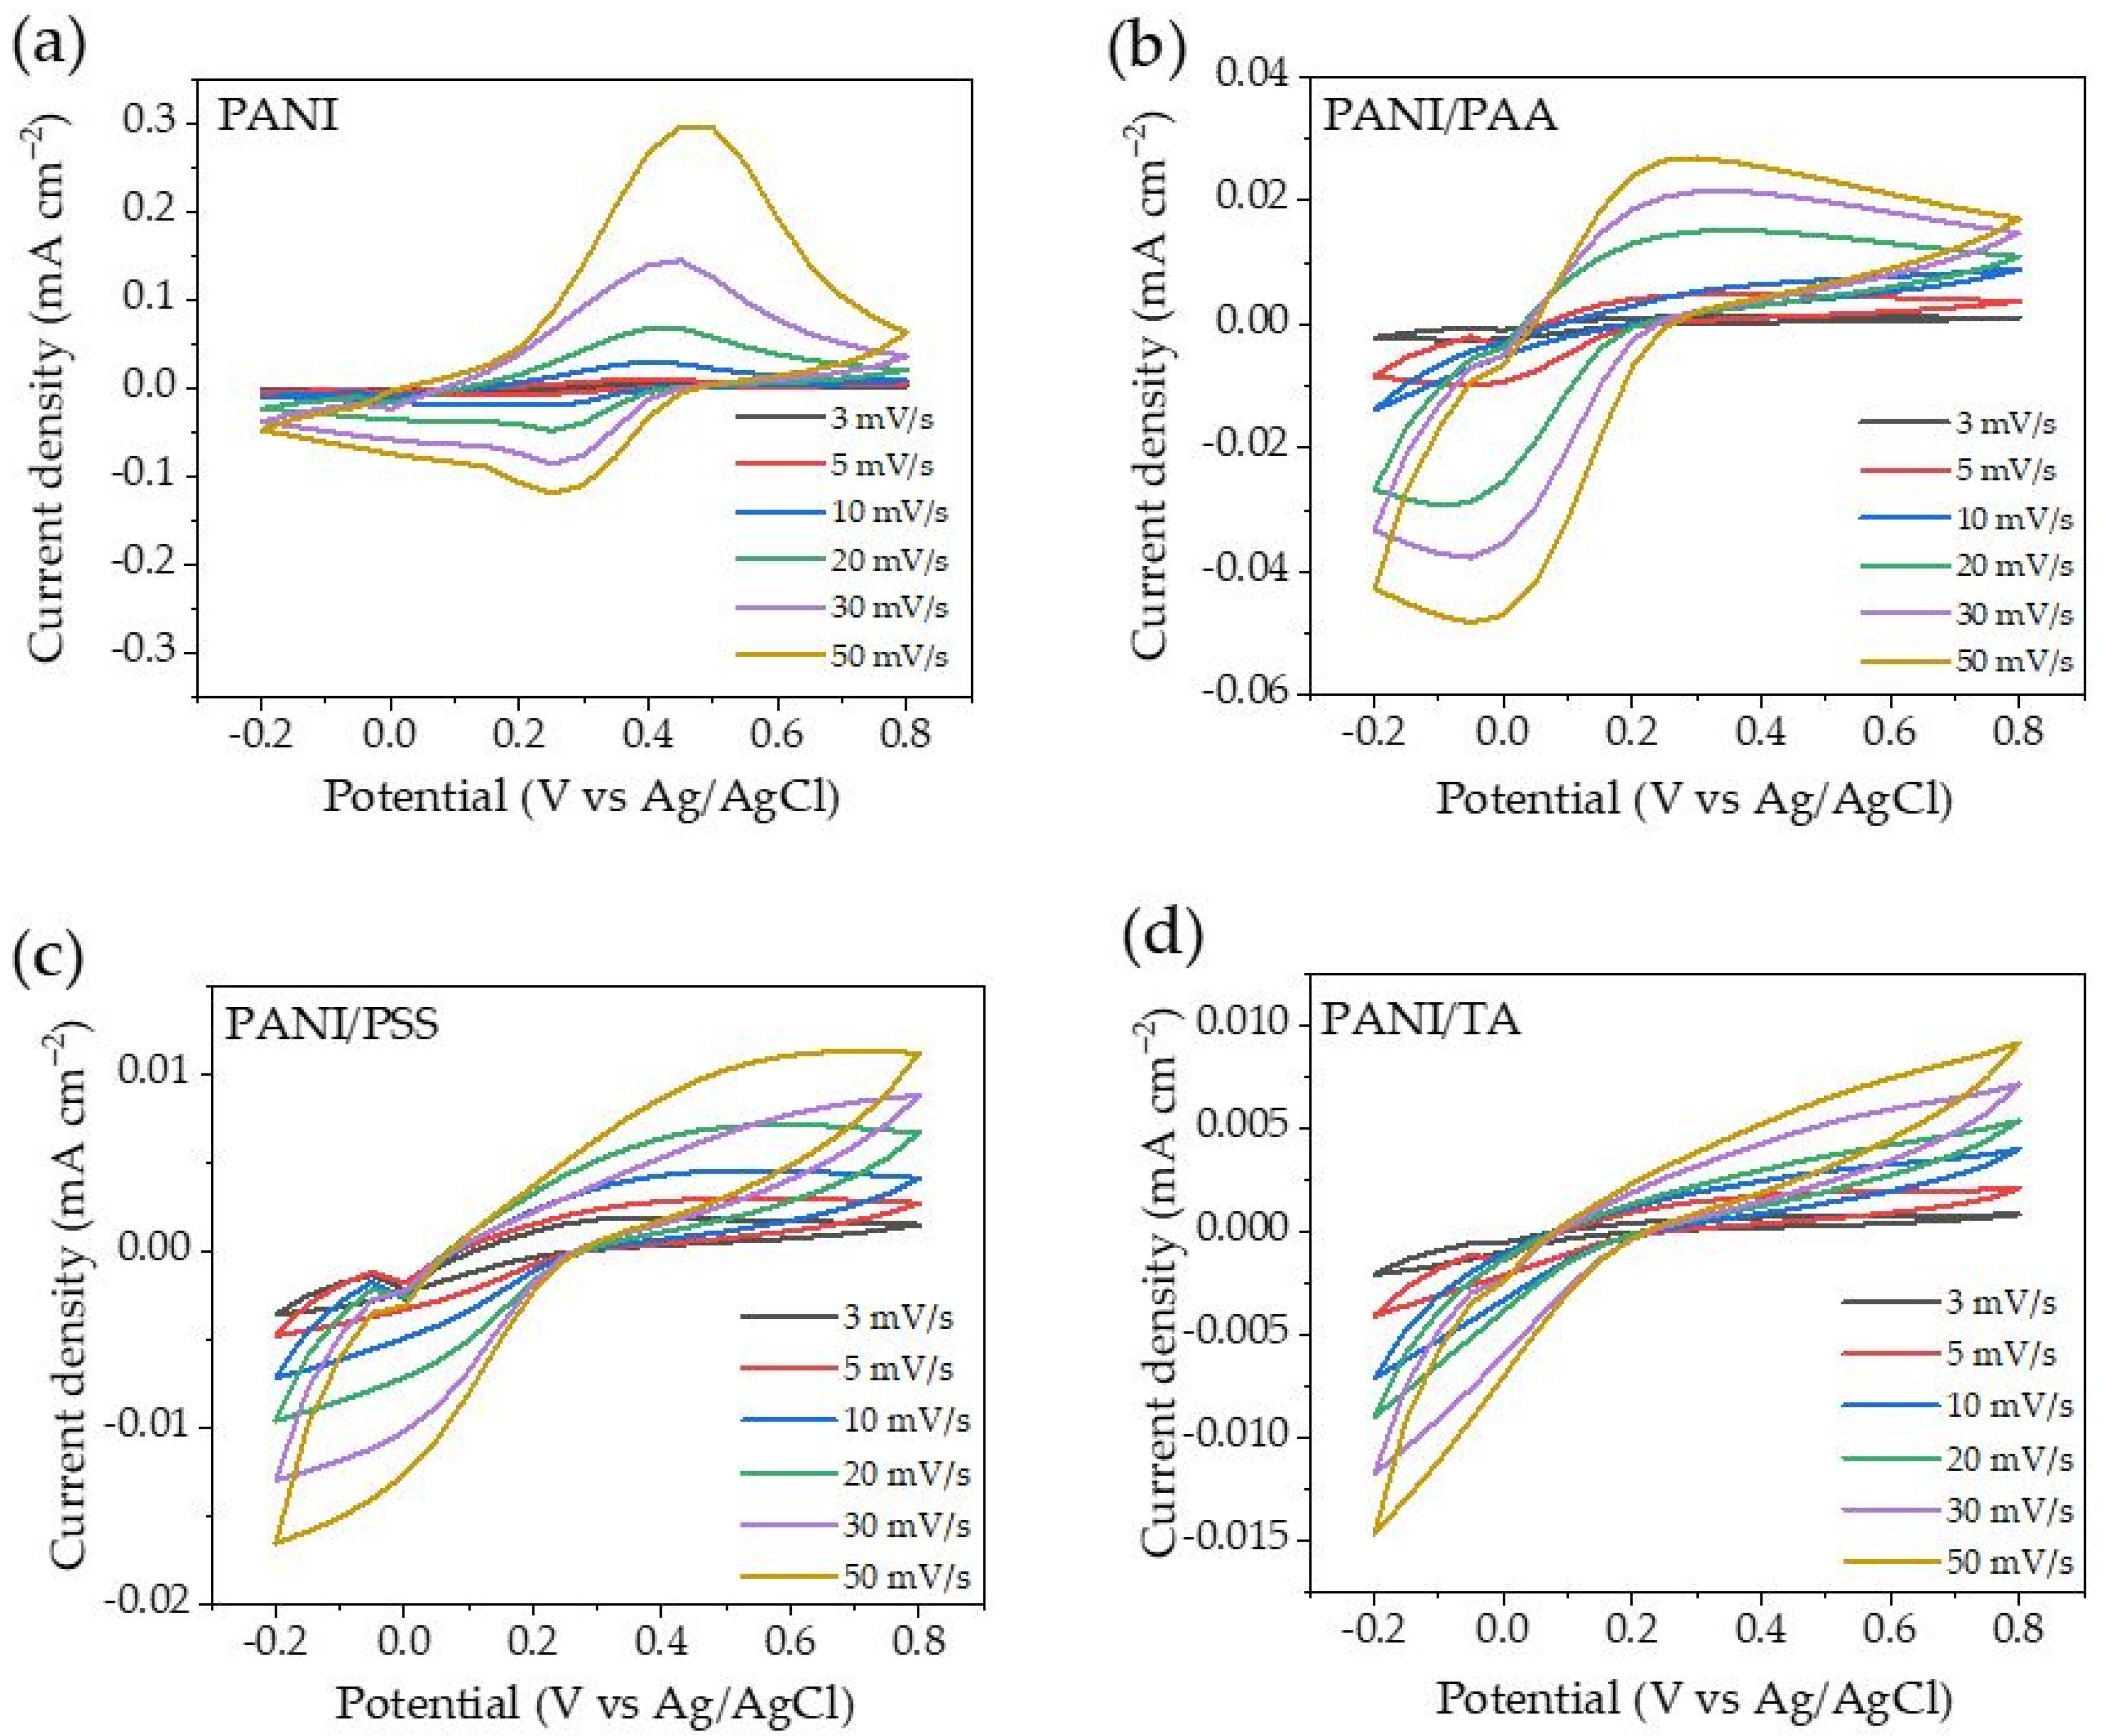
A cyclic voltammetry (CV) scan was conducted at different scan rates of 3, 5, 10, 20, 30, and 50 mV s−1 (Figure 6a–d) to investigate the nature of electrochemical reactions of the LbL films. Preconditioning was conducted by cycling at 10 mV s−1 five times until the cyclic voltammogram showed a stable current peak (data are not shown). The plot of the maximum current value as a function of scan rate and the square root of the scan rate was used to determine whether the electrochemical process was a diffusion-controlled process or not. The linear relationship between the current peak and the square root of the scan rate can be described by the Randles–Sevcik equation:
where is the current peak, n is the total number of electrons reacted per mole in the electrochemical process, A is film area (cm2), C is the concentration of the film material at the surface, D is the diffusion coefficient, and v is the scan rate [47]. While the linear relationship of the current peak and the scan rate can be characterized by the following equation:
where Ip is the current peak, n is the total number of electrons reacted per mole in the electrochemical process, F is faradaic constant, v is the scan rate, l is the distance of the film, A is the film area, C is concentration, R is the ideal gas constant, and T is temperature [47].
From the CV data, the maximum current is plotted vs. the square root of the scan rate and vs. the scan rate (Figure S2a–h). The linear relationship was determined by the value of R2 through data fitting. An R2 value closer to 1 means a stronger linear relationship between current peak and the square root of scan rates, or scan rates. A PANI sample shows a stronger linear relationship between current peak and scan rates, which suggests that a redox reaction of PANI films is not controlled by the diffusion of electrolytes; rather, it is controlled by its intrinsic redox properties [48,49]. In contrast, a stronger linear relationship between the maximum current peak and the square root of the scan rates was shown for PANI/PAA, PANI/PSS, and PANI/TA films, which suggests that the polyacid layers act as a physical barrier that hinders the diffusion of electrolytes to PANI [47,48].
Electrochemical activity and cycling stability were investigated by monitoring the areal capacitance value from the CV scans. In total, 100 cycles at a voltage range of −0.2 V to 0.8 V were carried out at a scan rate of 50 mV s−1. The result is displayed in Figure 7a–d. The areal capacitance value was calculated based on the following equation:
where Cs, S, , A, and k are the areal capacitance, area of the CV loop, potential window (V), film area (cm2), and scan rates (mV s−1), respectively [6,50]. Capacitance retention was calculated based on the following equation:
where Cn is capacitance at n cycle and C0 is initial capacitance.
The plot of calculated capacitance and capacitance retention vs. cycle numbers is depicted in Figure 7e,f, while the details of the data analysis are summarized in Table S3. The results indicate that PANI had the highest initial capacitance of 2.145 mF cm−2, which significantly decreased to 0.769 mF cm−2 at the third cycle. The capacitance retention of the PANI sample was only 2% after 30 cycles. Conversely, all LbL films showed much lower initial capacitance values, but greatly improved cycling stability. The PANI/PSS had an initial capacitance of 8 × 10⁻² mF cm−2, and it decreased by half to 4 × 10⁻² mF cm−2 at the third cycle, while PANI/TA had the initial capacitance of 5.6 × 10⁻² mF cm−2 and decreased to 2.6 × 10⁻² mF cm−2 at the third cycle. The lower capacitance of PANI/PSS and PANI/TA films can be attributed to a lower PANI content compared to PANI homopolymer films. The capacitance retention of PANI/PSS and PANI/TA at the 30th cycle is 14% and 16%, respectively. In contrast, PANI/PAA has the highest capacitance retention of 45% at the 30th cycle, with an initial capacitance of 0.22 mF cm−2. This result is consistent with previous work that showed PANI/PAA improved electrochemical stability in a nonaqueous electrolyte [1]. The interactions between the carboxylic acid groups of PAA and the amine groups of PANI may mitigate the electrochemical degradation of films during cycling [1,51].
4. Conclusions
Three different PANI/polyacid LbL films were successfully fabricated by dip-assisted LbL assembly. The effect of the polyacids’ acidity on chemical and electrochemical properties of the LbL films was investigated and compared. It was found that pKa of polyacids are closely related to the doping level of PANI, showing that stronger acids can achieve a higher doping level of PANI. The LbL assembly of PANI using the strongest polyacid, PSS, provided the highest conductivity of 2.53 × 10⁻³ S cm−1 and improved the chemical stability of the doped ES form of PANI. In contrast, PANI/PAA outperformed PANI/PSS and PANI/TA in terms of electrochemical properties and electrochemical stability in an aqueous electrolyte. The PANI/PAA had the highest capacitance retention of 45% at the 30th cycle, which was an improvement on the PANI homopolymer under the same conditions. Our results suggest that the chemical and electrochemical stability of PANI can be improved using polyacid dopants, and the acidity of functional groups of polyacids affects the chemical (doping level and electrical conductivity) and electrochemical properties (capacitance and cycling stability) of PANI.
Supplementary Materials
The following are available online at https://0-www-mdpi-com.brum.beds.ac.uk/article/10.3390/polym13172992/s1, Figure S1: UV-Vis spectra of emeraldine salt PANI. Figure S2: Plot of maximum current peak vs square root of scan rate, and maximum current peak vs scan rate of PANI (a,b), PANI/PAA (c,d), PANI/PSS (e,f), PANI/TA (g,h) from Figure 7. Table S1: Thickness data and roughness data of PANI/PAA (a,b), PANI/PSS (c,d), PANI/TA (e,f). Table S2: Data for conductivity calculation in Figure 4 (c,d), Table S3. Data of areal capacitance from Figure 7, with scan rate of 50 mV s−1 and voltage window of 1 V.
Author Contributions
Conceptualization, J.K.O., E.K.W. and J.-W.J.; methodology, J.-W.J., Y.T.M. and P.B.D.F.; experimental, P.B.D.F. and Y.T.M.; analysis, data curation, writing—original draft preparation, P.B.D.F.; writing—review and editing, J.-W.J., J.K.O. and E.K.W.; supervision, J.-W.J. All authors have read and agreed to the published version of the manuscript.
Funding
This work is supported by the National Research Foundation (NRF-2020R1G1A1099985).
Institutional Review Board Statement
Not applicable.
Informed Consent Statement
Not applicable.
Data Availability Statement
All data in the manuscript and Supplementary Materials are available.
Acknowledgments
The authors gratefully acknowledge the support from the National Research Foundation of Korea (NRF) grant funded by the Korea government (MSIP, Grant No. 2020R1G1A1099985) and Global Scholarship Program for Foreign Graduate Students at Kookmin University in Korea.
Conflicts of Interest
The authors declare no conflict of interest.
References
- Jeon, J.W.; Kwon, S.R.; Li, F.; Lutkenhaus, J.L. Spray-On Polyaniline/Poly(acrylic acid) Electrodes with Enhanced Electrochemical Stability. ACS Appl. Mater. Interfaces 2015, 7, 24150–24158. [Google Scholar] [CrossRef]
- Mooss, V.A.; Vijayakumar, V.; Kurungot, S.; Athawale, A.A. Interconnected polyaniline nanostructures: Enhanced interface for better supercapacitance retention. Polymer 2021, 212, 123169. [Google Scholar] [CrossRef]
- Amirabad, R.; Ramazani Saadatabadi, A.; Siadati, M.H. Preparation of polyaniline/graphene coated wearable thermoelectric fabric using ultrasonic-assisted dip-coating method. Mater. Renew. Sustain. Energy 2020, 9, 1–12. [Google Scholar] [CrossRef]
- Zarrintaj, P.; Vahabi, H.; Saeb, M.R.; Mozafari, M. Chapter 14—Application of polyaniline and its derivatives. In Fundamentals and Emerging Applications of Polyaniline; Mozafari, M., Chauhan, N.P.S., Eds.; Elsevier: Amsterdam, The Netherlands, 2019; pp. 259–272. [Google Scholar]
- Ma, Y.; Ma, M.; Yin, X.; Shao, Q.; Lu, N.; Feng, Y.; Lu, Y.; Wujcik, E.K.; Mai, X.; Wang, C.; et al. Tuning polyaniline nanostructures via end group substitutions and their morphology dependent electrochemical performances. Polymer 2018, 156, 128–135. [Google Scholar] [CrossRef]
- Wan, M. Polyaniline as A Promising Conducting Polymer. In Conducting Polymers with Micro or Nanometer Structure; Tsinghua University Press: Beijing, China, 2009; pp. 16–46. [Google Scholar]
- Jeon, J.W.; O’Neal, J.; Shao, L.; Lutkenhaus, J.L. Charge storage in polymer acid-doped polyaniline-based layer-by-layer electrodes. ACS Appl. Mater. Interfaces 2013, 5, 10127–10136. [Google Scholar] [CrossRef] [PubMed]
- Shao, L.; Jeon, J.-W.; Lutkenhaus, J.L. Polyaniline/Vanadium Pentoxide Layer-by-Layer Electrodes for Energy Storage. Chem. Mater. 2012, 24, 181–189. [Google Scholar] [CrossRef]
- Tarver, J.; Yoo, J.E.; Dennes, T.J.; Schwartz, J.; Loo, Y.L. Polymer acid doped polyaniline is electrochemically stable beyond pH 9. Chem. Mater. 2009, 21, 280–286. [Google Scholar] [CrossRef]
- Lu, Y.; Liu, Z.; Yan, H.; Peng, Q.; Wang, R.; Barkey, M.E.; Jeon, J.W.; Wujcik, E.K. Ultrastretchable Conductive Polymer Complex as a Strain Sensor with a Repeatable Autonomous Self-Healing Ability. ACS Appl. Mater. Interfaces 2019, 11, 20453–20464. [Google Scholar] [CrossRef] [PubMed]
- Zhong, C.; Li, L.; Chen, N.; Peng, Z.; Hu, W. Spatially resolved electrochemical reversibility of a conducting polymer thin film imaged by oblique-incidence reflectivity difference. Chem. Commun. (Camb.) 2020, 56, 1972–1975. [Google Scholar] [CrossRef]
- Charlton, M.; Hatchard, T.D.; Obrovac, M.N. Polyaniline Electrode Activation in Li Cells. J. Electrochem. Soc. 2020, 167, 080501. [Google Scholar] [CrossRef]
- Shen, J.; Shahid, S.; Sarihan, A.; Patterson, D.A.; Emanuelsson, E.A.C. Effect of polyacid dopants on the performance of polyaniline membranes in organic solvent nanofiltration. Sep. Purif. Technol. 2018, 204, 336–344. [Google Scholar] [CrossRef]
- Lyutov, V.; Kabanova, V.; Gribkova, O.; Nekrasov, A.; Tsakova, V. Electrochemically-Obtained Polysulfonic-Acids Doped Polyaniline Films—A Comparative Study by Electrochemical, Microgravimetric and XPS Methods. Polymers 2020, 12, 1050. [Google Scholar] [CrossRef]
- Sarihan, A.; Shahid, S.; Shen, J.; Amura, I.; Patterson, D.A.; Emanuelsson, E.A.C. Exploiting the electrical conductivity of poly-acid doped polyaniline membranes with enhanced durability for organic solvent nanofiltration. J. Membr. Sci. 2019, 579, 11–21. [Google Scholar] [CrossRef]
- Jeon, J.-W.; Ma, Y.; Mike, J.F.; Shao, L.; Balbuena, P.B.; Lutkenhaus, J.L. Oxidatively stable polyaniline:polyacid electrodes for electrochemical energy storage. Phys. Chem. Chem. Phys. 2013, 15, 9654–9662. [Google Scholar] [CrossRef] [PubMed]
- Richardson, J.J.; Cui, J.; Björnmalm, M.; Braunger, J.A.; Ejima, H.; Caruso, F. Innovation in Layer-by-Layer Assembly. Chem. Rev. 2016, 116, 14828–14867. [Google Scholar] [CrossRef] [Green Version]
- Wågberg, L.; Erlandsson, J. The Use of Layer-by-Layer Self-Assembly and Nanocellulose to Prepare Advanced Functional Materials. Adv. Mater. 2021, 33, 2001474. [Google Scholar] [CrossRef] [PubMed]
- Decher, G. Fuzzy Nanoassemblies: Toward Layered Polymeric Multicomposites. Science 1997, 277, 1232. [Google Scholar] [CrossRef]
- Hyder, M.N.; Lee, S.W.; Cebeci, F.Ç.; Schmidt, D.J.; Shao-Horn, Y.; Hammond, P.T. Layer-by-layer assembled polyaniline nanofiber/multiwall carbon nanotube thin film electrodes for high-power and high-energy storage applications. Acs Nano 2011, 5, 8552–8561. [Google Scholar] [CrossRef]
- Lewis, S.R.; Datta, S.; Gui, M.; Coker, E.L.; Huggins, F.E.; Daunert, S.; Bachas, L.; Bhattacharyya, D. Reactive nanostructured membranes for water purification. Proc. Natl. Acad. Sci. USA 2011, 108, 8577–8582. [Google Scholar] [CrossRef] [Green Version]
- Wisniewska, M.; Nosal-Wiercinska, A.; Ostolska, I.; Sternik, D.; Nowicki, P.; Pietrzak, R.; Bazan-Wozniak, A.; Goncharuk, O. Nanostructure of Poly(Acrylic Acid) Adsorption Layer on the Surface of Activated Carbon Obtained from Residue After Supercritical Extraction of Hops. Nanoscale Res. Lett. 2017, 12, 2. [Google Scholar] [CrossRef] [PubMed] [Green Version]
- Peng, L.; Cheng, F.; Zheng, Y.; Shi, Z.; He, W. Multilayer Assembly of Tannic Acid and an Amphiphilic Copolymer Poloxamer 188 on Planar Substrates toward Multifunctional Surfaces with Discrete Microdome-Shaped Features. Langmuir 2018, 34, 10748–10756. [Google Scholar] [CrossRef] [PubMed]
- Cuthbert, J.; Yerneni, S.S.; Sun, M.; Fu, T.; Matyjaszewski, K. Degradable Polymer Stars Based on Tannic Acid Cores by ATRP. Polymers 2019, 11, 752. [Google Scholar] [CrossRef] [PubMed] [Green Version]
- Cheung, J.H.; Stockton, W.B.; Rubner, M.F. Molecular-level processing of conjugated polymers. 3. Layer-by-layer manipulation of polyaniline via electrostatic interactions. Macromolecules 1997, 30, 2712–2716. [Google Scholar] [CrossRef]
- Gasaymeh, S.S. Formation Mechanism and Characterization of PANI Nanoparticles by Hybrid Chemical and Gamma Irradiation Technique. Am. J. Appl. Sci. 2018, 15, 519–531. [Google Scholar] [CrossRef] [Green Version]
- Mamma, K.; Siraj, K.; Meka, N. Synthesis and effect of secondary dopant on the conductivity of conducting polymer polyaniline. J. Polym. Eng. 2013, 33, 785–792. [Google Scholar] [CrossRef]
- Ebnesajjad, S. Material Surface Preparation Techniques. In Handbook of Adhesives and Surface Preparation; Elsevier Inc.: Berkeley, CA, USA, 2011; pp. 49–81. [Google Scholar]
- Delplanque, A.; Henry, E.; Lautru, J.; Leh, H.; Buckle, M.; Nogues, C. UV/ozone surface treatment increases hydrophilicity and enhances functionality of SU-8 photoresist polymer. Appl. Surf. Sci. 2014, 314, 280–285. [Google Scholar] [CrossRef]
- Bhushan, B. Surface Roughness Analysis and Measurement Techniques; CRC Press LLC: Boca Raton, FL, USA, 2001. [Google Scholar]
- Swinehart, D.F. The Beer-Lambert law. J. Chem. Educ. 1962, 39, 333–335. [Google Scholar] [CrossRef]
- McNaught, A.D.; Wilkinson, A. IUPAC. Compendium of Chemical Terminology, 2nd ed.; Blackwell Scientific Publications: Oxford, UK, 1997. [Google Scholar]
- Gawli, Y.; Banerjee, A.; Dhakras, D.; Deo, M.; Bulani, D.; Wadgaonkar, P.; Shelke, M.; Ogale, S. 3D Polyaniline Architecture by Concurrent Inorganic and Organic Acid Doping for Superior and Robust High Rate Supercapacitor Performance. Sci. Rep. 2016, 6, 21002. [Google Scholar] [CrossRef] [Green Version]
- Morávková, Z.; Šeděnková, I.; Bober, P. The First Stages of Chemical and Electrochemical Aniline Oxidation—Spectroscopic Comparative Study. Appl. Sci. 2020, 10, 2091. [Google Scholar] [CrossRef] [Green Version]
- Trchová, M.; Stejskal, J. Polyaniline: The infrared spectroscopy of conducting polymer nanotubes (IUPAC Technical Report). Pure Appl. Chem. 2011, 83, 1803–1817. [Google Scholar] [CrossRef]
- Konyushenko, E.N.; Stejskal, J.; Trchová, M.; Blinova, N.V.; Holler, P. Polymerization of aniline in ice. Synth. Met. 2008, 158, 927–933. [Google Scholar] [CrossRef]
- Mazzeu, M.A.C.; Faria, L.K.; Baldan, M.R.; Rezende, M.C.; Gonçalves, E.S. Influence of reaction time on the structure of polyaniline synthesized on a pre-pilot scale. Braz. J. Chem. Eng. 2018, 35, 123–130. [Google Scholar] [CrossRef] [Green Version]
- Noby, H.; El-Shazly, A.H.; Elkady, M.F.; Ohshima, M. Strong acid doping for the preparation of conductive polyaniline nanoflowers, nanotubes, and nanofibers. Polymer 2019, 182, 121848. [Google Scholar] [CrossRef]
- Arenas, M.C.; Sánchez, G.; Nicho, M.E.; Elizalde-Torres, J.; Castaño, V.M. Engineered doped and codoped polyaniline gas sensors synthesized in N,N,dimethylformamide media. Appl. Phys. A 2011, 106, 901–908. [Google Scholar] [CrossRef]
- Kuo, C.-W.; Kuo, P.-L.; Ho, K.-S.; Hsieh, T.-H.; Chen, S.-J.; Wu, T.-Y.; Huang, Y.-C. Polyaniline Doped with Various Inorganic Acids and Polymeric Acids as Platinum Catalyst Support for Methanol Electro-oxidation. J. Chin. Chem. Soc. 2012, 59, 1294–1302. [Google Scholar] [CrossRef]
- Snyder, K.A.; Ferraris, C.; Martys, N.S.; Garboczi, E.J. Using Impedance Spectroscopy to Assess the Viability of the Rapid Chloride Test for Determining Concrete Conductivity. J. Res. Natl. Inst. Stand. Technol. 2000, 105, 121848. [Google Scholar] [CrossRef]
- Beygisangchin, M.; Abdul Rashid, S.; Shafie, S.; Sadrolhosseini, A.R.; Lim, H.N. Preparations, Properties, and Applications of Polyaniline and Polyaniline Thin Films—A Review. Polymers 2021, 13, 2003. [Google Scholar] [CrossRef]
- Detsri, E.; Dubas, S.T. Interfacial polymerization of polyaniline and its layer-by-layer assembly into polyelectrolytes multilayer thin-films. J. Appl. Polym. Sci. 2013, 128, 558–565. [Google Scholar] [CrossRef]
- Lacy, F. Developing a theoretical relationship between electrical resistivity, temperature, and film thickness for conductors. Nanoscale Res. Lett. 2011, 6, 1–14. [Google Scholar] [CrossRef] [Green Version]
- Gazdić, I.; Šahbazović, A.M.; Sulejmanović, S. Analysis of Specific Electric Conductivity of Thin Films of Polyaniline Doped with Sulfuric and Hydrochloric Acid. TEM J. 2016, 5, 38–43. [Google Scholar]
- Wang, Y.; Levon, K. Influence of Dopant on Electroactivity of Polyaniline. Macromol. Symp. 2012, 317–318, 240–247. [Google Scholar] [CrossRef]
- Kim, T.; Choi, W.; Shin, H.-C.; Choi, J.-Y.; Kim, J.M.; Park, M.-S.; Yoon, W.-S. Applications of Voltammetry in Lithium Ion Battery Research. J. Electrochem. Sci. Technol. 2020, 11, 14–25. [Google Scholar] [CrossRef] [Green Version]
- Elgrishi, N.; Rountree, K.J.; McCarthy, B.D.; Rountree, E.S.; Eisenhart, T.T.; Dempsey, J.L. A Practical Beginner’s Guide to Cyclic Voltammetry. J. Chem. Educ. 2017, 95, 197–206. [Google Scholar] [CrossRef]
- Jeon, J.-W.; Kwon, S.R.; Lutkenhaus, J.L. Polyaniline nanofiber/electrochemically reduced graphene oxide layer-by-layer electrodes for electrochemical energy storage. J. Mater. Chem. A 2015, 3, 3757–3767. [Google Scholar] [CrossRef]
- Rao, S.; Kanaka Durga, I.; Naresh, B.; Jin-Soo, B.; Krishna, T.N.V.; In-Ho, C.; Ahn, J.-W.; Kim, H.-J. One-Pot Hydrothermal Synthesis of Novel Cu-MnS with PVP Cabbage-Like Nanostructures for High-Performance Supercapacitors. Energies 2018, 11, 1590. [Google Scholar] [CrossRef] [Green Version]
- Tong, J.; Han, C.; Hao, X.; Qin, X.; Li, B. Conductive Polyacrylic Acid-Polyaniline as a Multifunctional Binder for Stable Organic Quinone Electrodes of Lithium-Ion Batteries. ACS Appl. Mater. Interfaces 2020, 12, 39630–39638. [Google Scholar] [CrossRef]
Figure 1.
Photographs of the polyacid-doped PANI-based film: (a,b) the negative images, (c) growth profiles, and (d) roughness profiles of the LbL films of different bilayers (BL).
Figure 1.
Photographs of the polyacid-doped PANI-based film: (a,b) the negative images, (c) growth profiles, and (d) roughness profiles of the LbL films of different bilayers (BL).


Figure 2.
UV–Vis spectra of: (a) PANI/PAA, (b) PANI/PSS, and (c) PANI/TA LbL films and (d) their plot of maximum absorbance (~840 nm) as a function of the number of bilayers.
Figure 2.
UV–Vis spectra of: (a) PANI/PAA, (b) PANI/PSS, and (c) PANI/TA LbL films and (d) their plot of maximum absorbance (~840 nm) as a function of the number of bilayers.

Figure 3.
FE–SEM images of: (a) PANI, (b) PANI/PAA, (c) PANI/PSS, and (d) PANI/TA films. At a scheme of 100 nm.
Figure 3.
FE–SEM images of: (a) PANI, (b) PANI/PAA, (c) PANI/PSS, and (d) PANI/TA films. At a scheme of 100 nm.

Figure 4.
(a) FTIR spectra, (b) the ratio of quinoid to benzenoid peaks, (c) Nyquist plot, (d) conductivity value of doped PANI films.
Figure 4.
(a) FTIR spectra, (b) the ratio of quinoid to benzenoid peaks, (c) Nyquist plot, (d) conductivity value of doped PANI films.

Figure 5.
(a) UV–Vis spectra of PANI homopolymer, (b) PANI/PAA, (c) PANI/PSS, (d) and PANI/TA LbL films at different levels of pH in water.
Figure 5.
(a) UV–Vis spectra of PANI homopolymer, (b) PANI/PAA, (c) PANI/PSS, (d) and PANI/TA LbL films at different levels of pH in water.

Figure 6.
(a) Cyclic voltammograms of PANI, (b) PANI/PAA, (c) PANI/PSS, and (d) PANI/TA LbL films at different scan rates in 1 M Na2SO4 electrolyte (vs. Ag/AgCl reference electrode).
Figure 6.
(a) Cyclic voltammograms of PANI, (b) PANI/PAA, (c) PANI/PSS, and (d) PANI/TA LbL films at different scan rates in 1 M Na2SO4 electrolyte (vs. Ag/AgCl reference electrode).

Figure 7.
The cyclic voltammograms of (a) PANI, (b) PANI/PAA, (c) PANI/PSS, and (d) PANI/TA at the scan rate of 50 mV/s, and (e) a plot of areal capacitance, and (f) capacitance retention vs. cycle numbers.
Figure 7.
The cyclic voltammograms of (a) PANI, (b) PANI/PAA, (c) PANI/PSS, and (d) PANI/TA at the scan rate of 50 mV/s, and (e) a plot of areal capacitance, and (f) capacitance retention vs. cycle numbers.


Table 1.
The associated peaks of the FTIR spectra from Figure 4 and the conductivity data.
Table 1.
The associated peaks of the FTIR spectra from Figure 4 and the conductivity data.
| Wavenumber (cm−1) | Characteristic | |||
|---|---|---|---|---|
| PANI | PANI/PSS | PANI/PAA | PANI/TA | |
| 1592 | 1588 | 1592 | 1577 | Quinoid ring stretching |
| 1502 | 1506 | 1502 | 1502 | Benzenoid ring stretching |
| 1312 | 1312 | 1308 | 1308 | C-N vibration of secondary aromatic amine |
| 1163 | 1167 | 1159 | 1152 | −NH+ vibration (protonation of nitrogen atoms in imine ring of quinones) |
| 828 | 824 | 824 | 816 | Trans = C-H out-of-plane bending |
Publisher’s Note: MDPI stays neutral with regard to jurisdictional claims in published maps and institutional affiliations. |
© 2021 by the authors. Licensee MDPI, Basel, Switzerland. This article is an open access article distributed under the terms and conditions of the Creative Commons Attribution (CC BY) license (https://creativecommons.org/licenses/by/4.0/).
Share and Cite
MDPI and ACS Style
Firda, P.B.D.; Malik, Y.T.; Oh, J.K.; Wujcik, E.K.; Jeon, J.-W. Enhanced Chemical and Electrochemical Stability of Polyaniline-Based Layer-by-Layer Films. Polymers 2021, 13, 2992. https://0-doi-org.brum.beds.ac.uk/10.3390/polym13172992
AMA Style
Firda PBD, Malik YT, Oh JK, Wujcik EK, Jeon J-W. Enhanced Chemical and Electrochemical Stability of Polyaniline-Based Layer-by-Layer Films. Polymers. 2021; 13(17):2992. https://0-doi-org.brum.beds.ac.uk/10.3390/polym13172992
Chicago/Turabian StyleFirda, Putri Bintang Dea, Yoga Trianzar Malik, Jun Kyun Oh, Evan K. Wujcik, and Ju-Won Jeon. 2021. "Enhanced Chemical and Electrochemical Stability of Polyaniline-Based Layer-by-Layer Films" Polymers 13, no. 17: 2992. https://0-doi-org.brum.beds.ac.uk/10.3390/polym13172992
Note that from the first issue of 2016, this journal uses article numbers instead of page numbers. See further details here.