Article

The Effect of Different Extraction Conditions on the Physical Properties, Conformation and Branching of Pectins Extracted from Cucumis melo Inodorus

by
Danielle C. Reynolds
,
Laura J. Denman
,
Hana A. S. Binhamad
and
Gordon A. Morris
*
Department of Chemical Sciences, School of Applied Sciences, University of Huddersfield, Huddersfield HD1 3DH, UK
*
Author to whom correspondence should be addressed.
Polysaccharides 2020, 1(1), 3-20; https://doi.org/10.3390/polysaccharides1010002
Submission received: 30 June 2020 / Revised: 28 August 2020 / Accepted: 31 August 2020 / Published: 8 September 2020

Abstract

:
The extraction of pectin involves the physico-chemical hydrolysis and solubilisation of pectic polymers from plant tissues under the influence of several processing parameters. In this study, an experimental design approach was used to examine the effects of extraction pH, time and temperature on the pectins extracted from Cucumis melo Inodorus. Knowledge of physical properties (intrinsic viscosity and molar mass), dilute solution conformation (persistence length and mass per unit length), together with chemical composition, was then used to propose a new method, which can estimate the length and number of branches on the pectin RG-I region. The results show that physical properties, conformation and the length and number of branches are sensitive to extraction conditions. The fitting of regression equations relating length and number of branches on the pectin RG-I region to extraction conditions can, therefore, lead to tailor-made pectins with specific properties for specific applications.

1. Introduction

Pectins are a family of complex polygalacturonic acid-based structural polysaccharides, which constitute approximately one-third of the dry weight of cell walls from higher primary plants [1]. Pectins play important roles in growth, development and senescence [2,3,4]. Extracted pectins have been utilised in applications in both the food and pharmaceutical industries where they are generally used as gelling agents [5], thickeners, stabilisers and emulsifiers [6,7,8]; furthermore, a number of pectins have been shown to be bioactive [9,10,11,12,13,14].
Pectic polysaccharides are copolymers of two anionic polysaccharides: homogalacturonan (HG) and type 1 rhamnoglacturonan (RG-I), often described in simplified terms as “smooth” and “hairy” regions, respectively [15,16]. The HG regions are made up of 1,4-linked α-D-GalA (galacturonic acid) units that could be partially methylated at C-6 [17] and, less commonly, the positions O-2 and/or O-3 can be acetyl esterified [17]. The RG-I regions consist of alternating 1,4-linked α-D-GalA and 1,2-linked-α-L-Rha (rhamnose) units. The 1,2-linked-α-L-Rha units have neutral sugar side chain substituents at position 4 and these 1,2-linked-α-L-Rha units cause a kink in the otherwise linear chain [18]. Side chains of arabinans and galactans can also be present which are either in the RG-I region or randomly dispersed [3].
The extraction of pectin involves the physico-chemical hydrolysis and solubilisation of pectic polymers from plant tissues [19,20,21,22,23] under the influence of several processing parameters, for example, pH, time and temperature [20,23]. The first step involves the solubilisation of the protopectin followed by a secondary hydrolysis reaction where the pectin is degraded, which may result in a reduction in yield at longer extraction times; when there is no longer any extractable pectin, available hydrolysis will predominate [21,22], most likely due to the loss of arabinan side chains [24]. Therefore, pH, extraction time and extraction temperature influence the quality as well as the quantity of the extracted pectins [21,22,24,25,26,27,28,29,30,31,32]. As might be expected, the highest yields of pectins are obtained using the most suitable industrial extraction methods, which are hot acid (pH 1.5–2.5) at temperatures around 70–90 °C [33].
In this study, an experimental design approach was used to examine the effects of extraction pH, time and temperature on the pectins extracted from Cucumis melo Inodorus and any interactions they may have [24,27,34]. The aim was to create factorial models, which can describe the relationships between the responses and extraction conditions [24,27,34]. These models could then be used to predict conditions that would give a desired response. The factorial design used was a two-level design (high and low) for the three parameters (pH, temperature and time). The higher level (+1) corresponded to pH 3, 80 °C and an extraction time of four hours and the lower level (−1) corresponded to pH 1, 60 °C and an extraction time of two hours [24]. Factorial design was used primarily as it allows the examination of interactions between factors. The combinations of levels for the three factors obtained using the factorial design can be used to determine whether the differences in extracted pectins were due to one factor (pH, time or temperature) or to a combination of these factors. Regression equations can then be fitted to relate physical properties, conformational parameters or branching (number and length of branches) to extraction conditions, which can potentially allow the desired characteristics to be optimised and lead to tailor-made pectins for specific applications. For example, RG-I side chain lengths together with the galactose/arabinose ratio are important for their biological activity [35]; therefore, a method to control and predict these parameters warrants further study [35].
The aim of this work was to characterise the physical properties (molar mass and intrinsic viscosity) of the pectic polysaccharides extracted from Cucumis melo Inodorus (Honeydew melon or muskmelon). These data can then be used to estimate dilute solution conformation (persistence length, mass per unit length and translational frictional ratio), which can then—for the first time, to the best of our knowledge—be related to extraction processes. Together with primary structure (e.g., HG: RG-I ratio) and physical properties (e.g., molar mass), conformation underpins the structure–function relationship in polysaccharides [36]. Knowledge of physical properties, dilute solution conformation together with chemical composition (published previously [24]) was then be used to develop a new method to estimate the length and number of branches on the pectin RG-I region. This new method is based on the pectin mass per unit length [37], which is a direct measure of the degree of branching [38]. However knowledge of pectin fine structure (HG: RG-I ratio) now allows the estimation of the mass per unit lengths of the HG and RG-I regions individually and not their average, as has been done previously [37,39]. This, therefore, leads to a simple method, albeit based on a large number of experimental measurements, which can be used to estimate both the number and length of side chains in the RG-I region. The minimum information required is the HG: RG-I ratio, the molar mass and one other physical measurements (e.g., intrinsic viscosity, radius of gyration or sedimentation coefficient), although the estimate would be improved with the neutral sugar composition, degree of methyl esterification and degree of acetylation. It is hoped that this methodology will be of benefit to scholars in the pectin community.

2. Materials and Methods

The melon pectin samples (A–H) were prepared as described previously [24] using a 23 factorial design. This study utilised a two-level, full factorial design for each of the three factors (pH, time and temperature), i.e., a 23 design. Therefore, there were eight individual pectin samples (A–H). Two levels (high and low) for each of the three extraction parameters (pH, temperature and time) were established, the lower level (−1) corresponding to pH 1, 60 °C and 2 h, and the upper level (+1) corresponding to pH 3, 80 °C and 4 h. Due to low yields [24], it was not possible to further analyse sample F in duplicate and this sample was only analysed in singlicate. All other samples were analysed in duplicate. Therefore, for each physical/conformational property determination, there was a minimum of 15 measurements.

2.1. High-Performance Size Exclusion Chromatography Coupled to a Differential Pressure Viscometer (HPSEC-DPV)

A total of 2 mg/mL of sample was dissolved in distilled water prior to centrifugation to remove any insoluble solids. High-performance size exclusion chromatography (HPSEC) was performed at room temperature on a system consisting of a PL aquagel guard column (Polymer Labs, Amherst, MA, USA) followed by in series PL aquagel-OH 60, PL aquagel-OH 50 and PL aquagel-OH 40 analytical columns eluted with distilled water at a flow rate of 0.7 mL/min. The eluent was detected online by a T-270 differential pressure viscometer (DPV) (Viscotek, Huston, TX, USA) and a rEX differential refractometer (RI) (Wyatt, Santa Barbara, CA, USA).
The refractive index increment, dn/dc, was taken to be 0.15 mL/g [40]. The number–average molar mass (Mn) was then estimated from the weight–average intrinsic viscosity ([η]w) using a universal calibration [41] produced with pullulan standards of number–average molar mass from 45,000–640,000 g/mol (Sigma-Aldrich, Gillingham, UK).

2.2. Estimation of Conformation

2.2.1. Translational Frictional Ratio

The translational frictional ratio, f/f0, is a parameter which depends on conformation and molecular expansion through hydration effects [42]. It can be measured experimentally from the hydrodynamic radius and molecular weight:
f f 0 = r H ( 4 π N A 3 v ¯ M w ) 1 3
where
r H = ( [ η ] w M n 4 3 π N A ) 1 3
NA is Avogadro’s number, v ¯ is the partial specific volume, 0.63 mL/g for pectin [39,43], f is the friction coefficient of the molecule and f0 the corresponding value for a spherical particle of the same mass and (anhydrous) volume [42].

2.2.2. Persistence Length (Lp) and Mass Per Unit Length (ML)

The linear flexibility of polymer chains can also be represented quantitatively in terms of the persistence length, Lp of equivalent worm-like chains [44,45,46] where the persistence length is defined as the average projection length along the initial direction of the polymer chain. In the case of a theoretical perfect random coil, Lp = 0, and for the equivalent extra-rigid rod, Lp = ∞, although in practice limits of ~1 nm for random coils (e.g., pullulan) and 200 nm for an extra-rigid rod (e.g., xanthan) are more appropriate [44]. The mass per unit length, ML [37] is a direct measure of the degree of branching [38] and a larger value is indicative of a more branched molecule. The mass per unit length, ML of a pectin HG region is approximately 370 g/mol nm, although this will depend on the degree of methyl esterification (DM) and acetylation (DA) [39].
The persistence length, Lp and mass per unit length, ML can be estimated using Multi-HYDFIT program [47] which considers data sets of intrinsic viscosity and molar mass. It then performs a minimisation procedure [47] to find the best values of ML and Lp which satisfy the Bushin-Bohdanecky [44,48,49] equation (Equation (3)).
( M 2 [ η ] ) 1 / 3 = A 0 M L Φ 1 / 3 + B 0 Φ 1 / 3 ( 2 L p M L ) M 1 / 2
where
M L = m l
where m and l are the average molar mass and length of the average monomeric unit (≈0.5 nm [50]).
Although knowledge of the HG: RG-I ratio [24] would allow the estimation of the mass per unit length (ML) from the composition, it was decided that, for melon pectins, we would consider the scenario where only the chain diameter was fixed at 0.8 nm [39]. The Multi-HYDFIT program then floats the variable parameters (Lp and ML) in order to find a minimum of the target function [47].
Flexibility can also be estimated from the ratio of Lp/ML (nm2 mol/g) which increases with increasing stiffness [51].

2.2.3. Conformation Zoning (Normalised Scaling Relations)

Conformation zoning describes a procedure to represent the conformation of polymers in solution based on the relationship between their molar mass, intrinsic viscosity and mass per unit length, ML [52,53]. In this case, we have used the mass per unit length calculated using the HYDFIT algorithm.

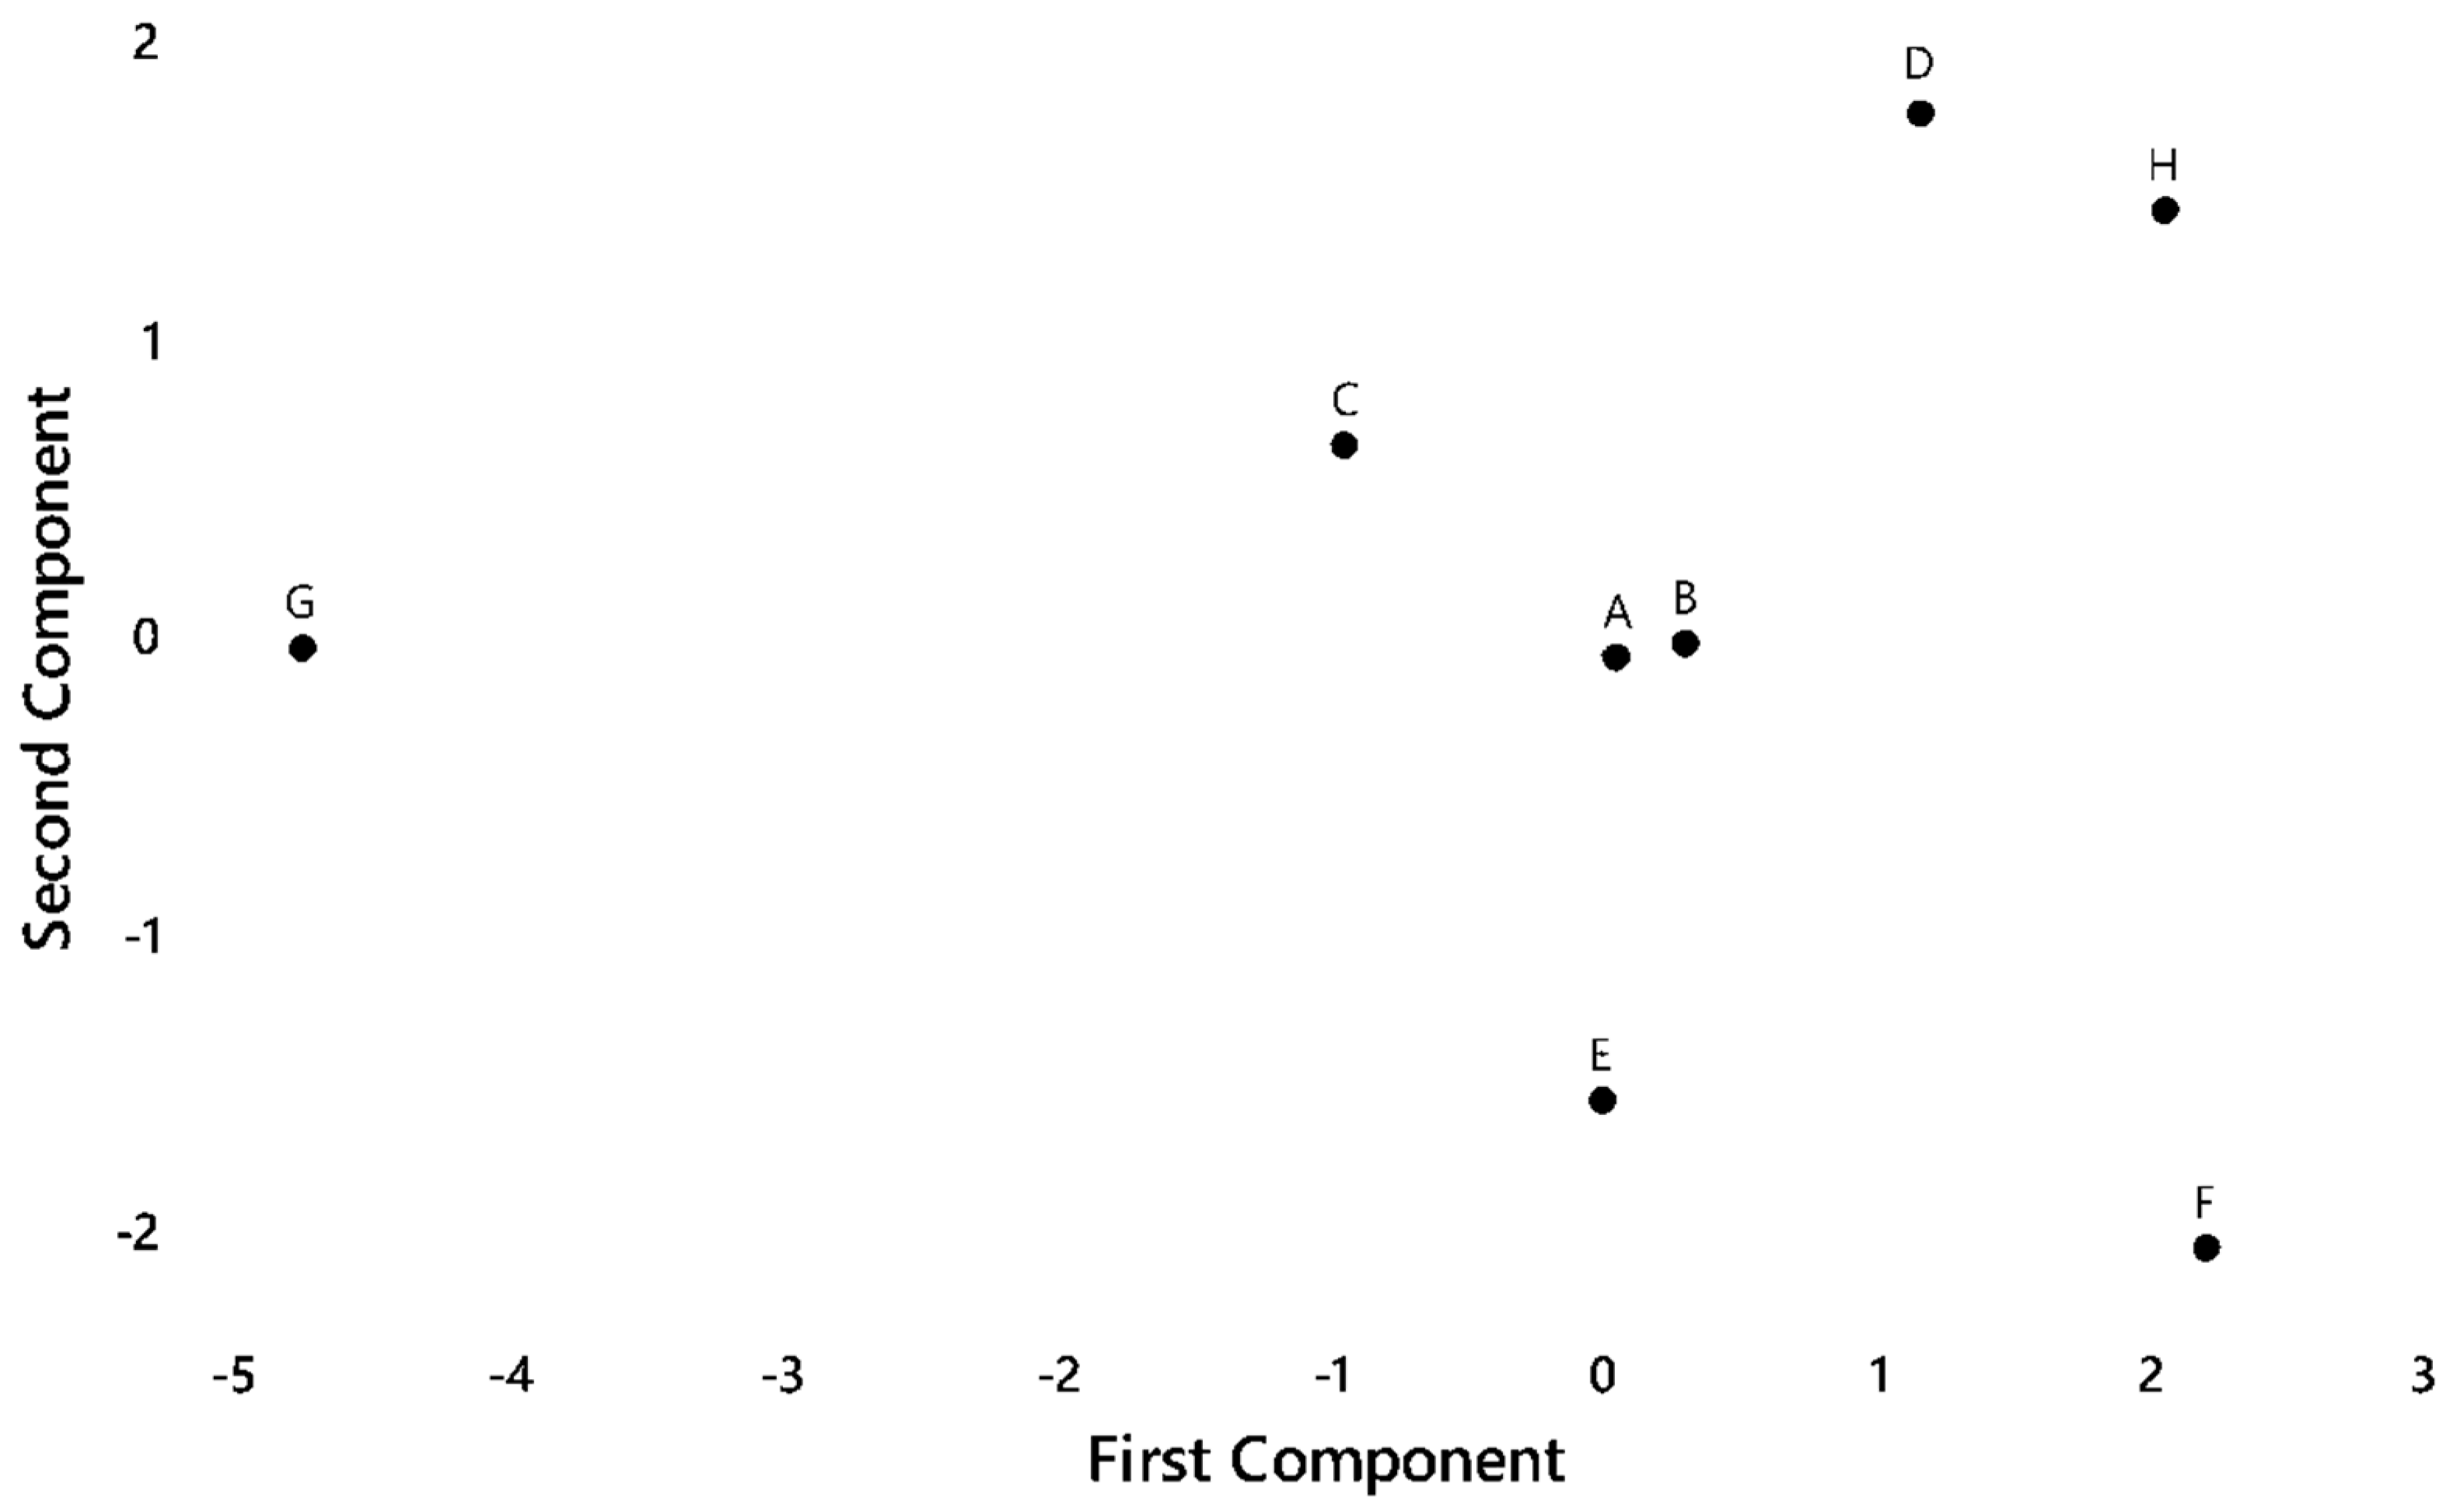
2.3. Statistical Analysis

Data from experiments were analysed using Minitab version 18 (Minitab Inc., Philadelphia, PA, USA). Differences were considered significant at p ≤ 0.05. The two-level factorial design was employed to study relationship between the extraction parameters/variables (pH, temperature and time) and the response (intrinsic viscosity, number average molar mass, translational frictional ratio, persistence length, mass per unit length, Lp/ML ratio, mean side chain length and mean side chain number) [54]. The polynomial Equations ((5)–(10), (13) and (14)) were used to fit the mean values of the experimental data, where X1, X2 and X3 correspond to pH, time and temperature, respectively [55].

3. Results and Discussion

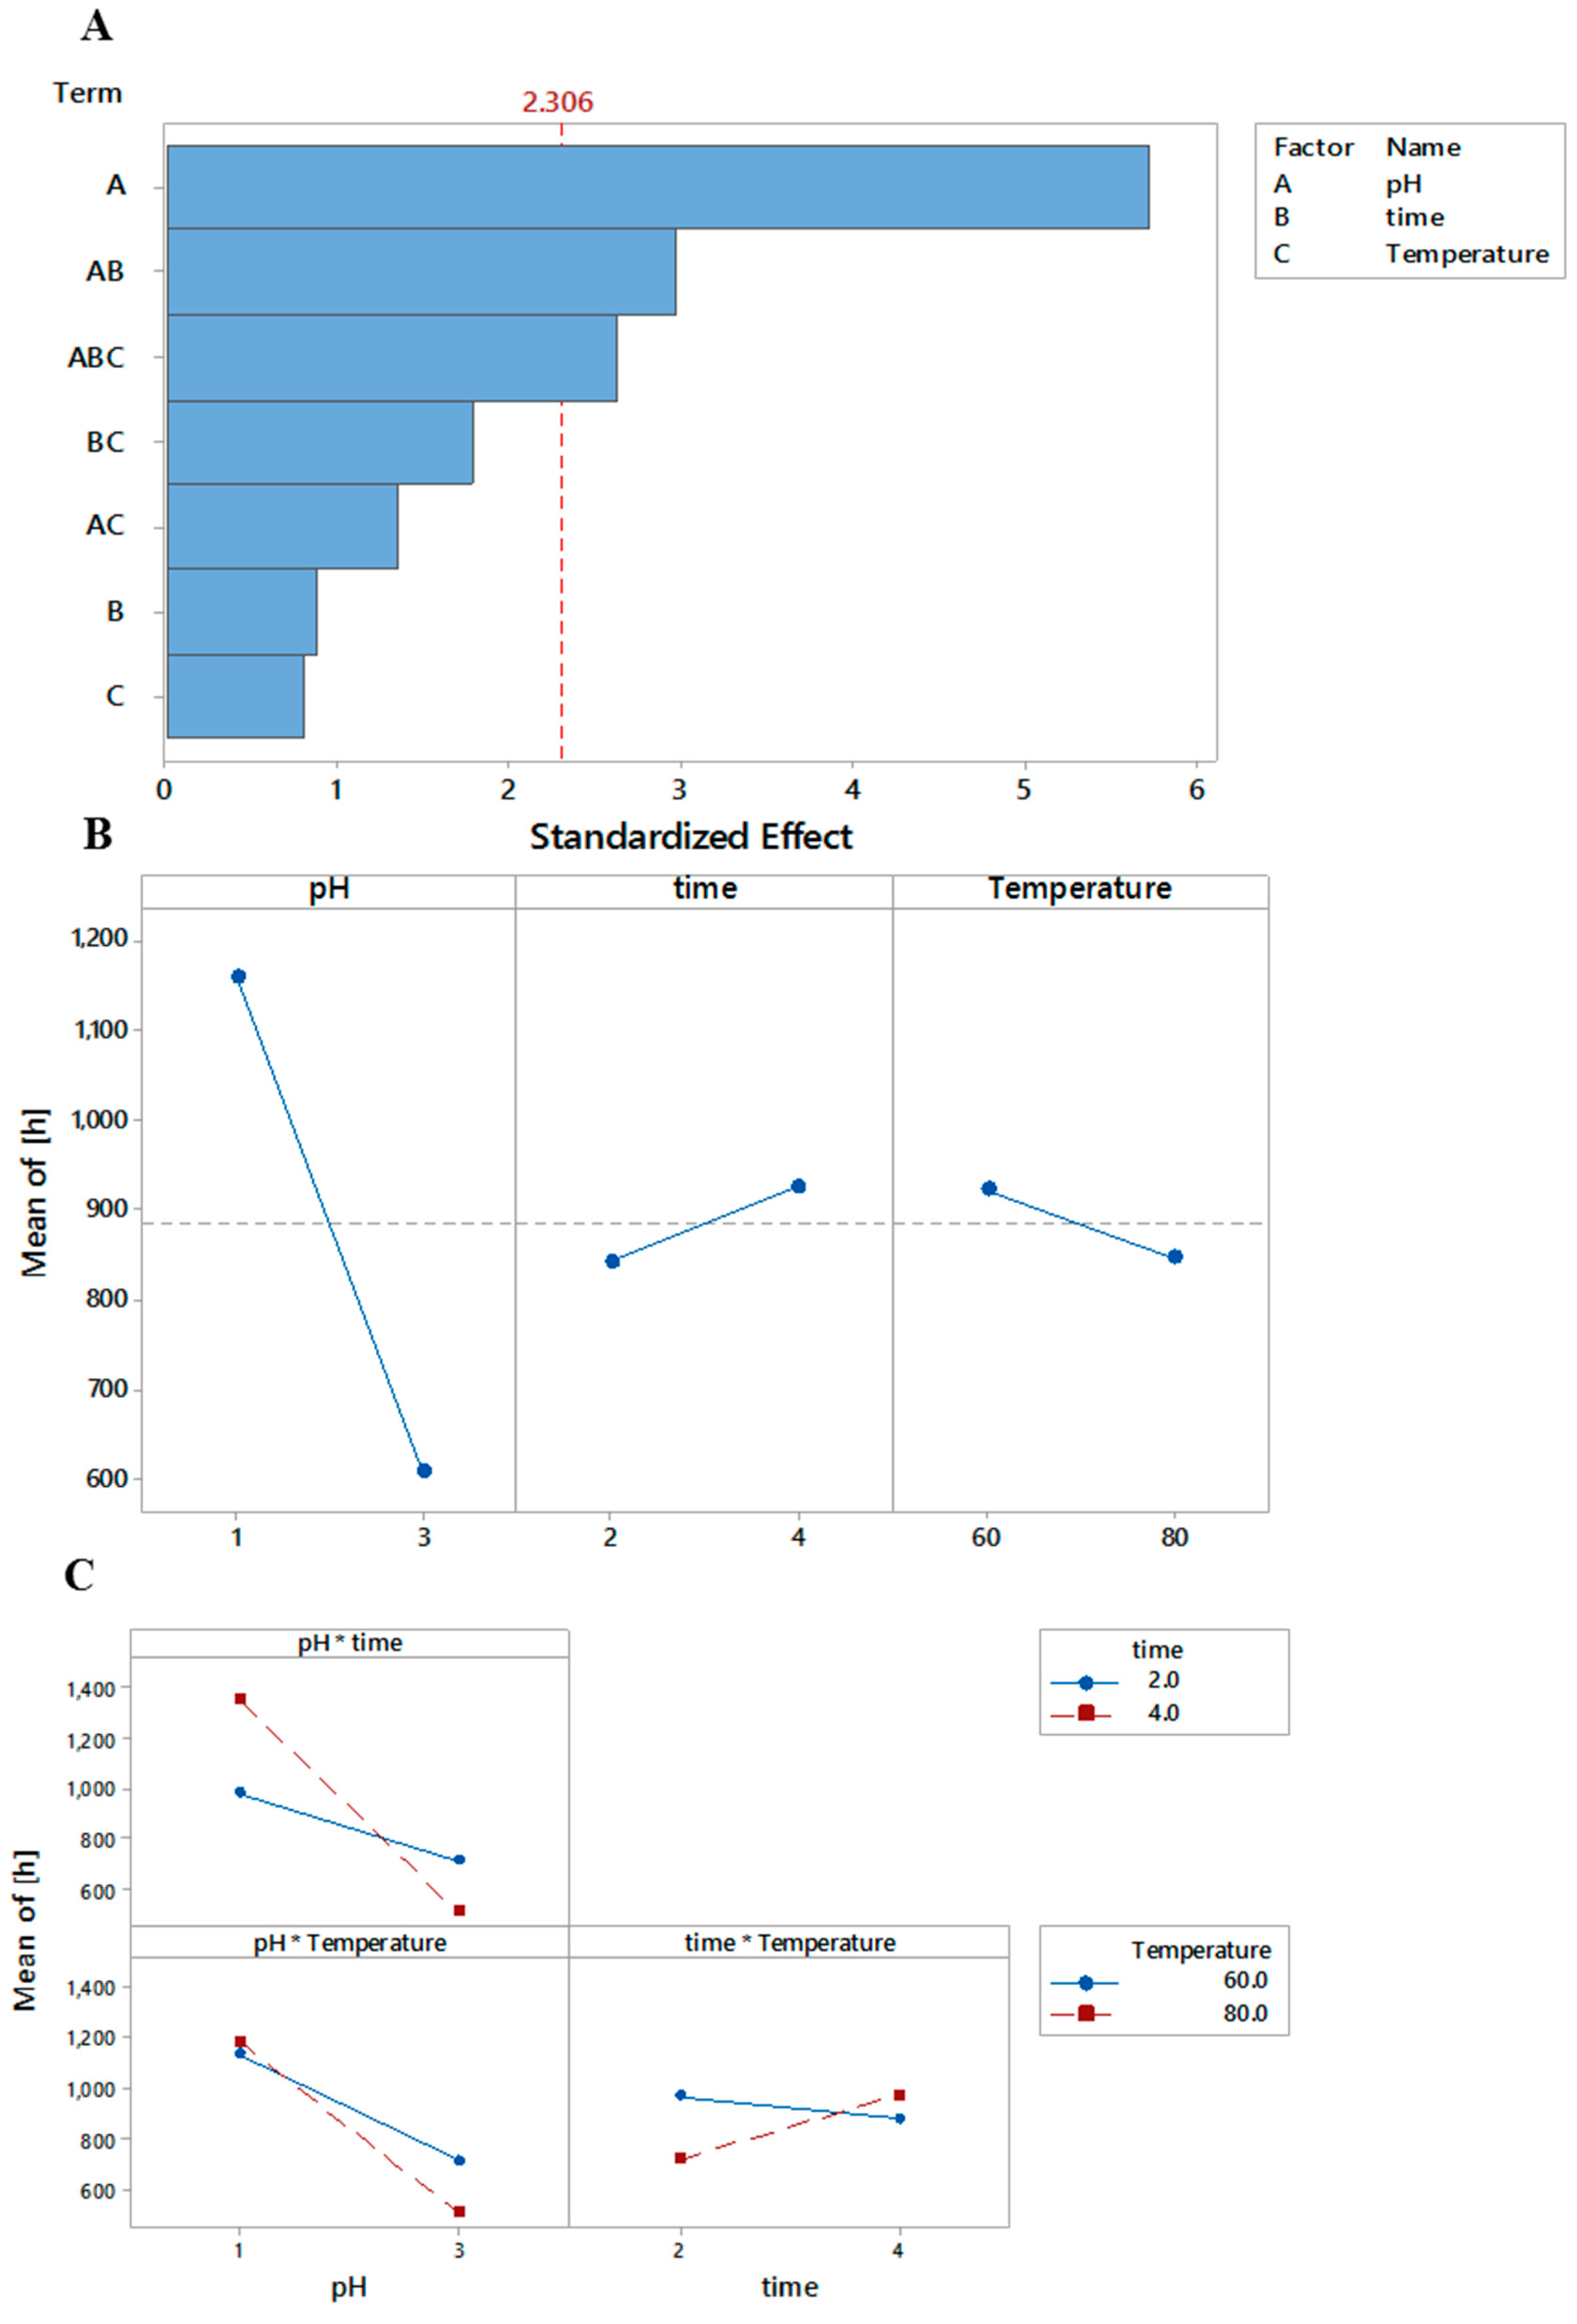
3.1. Intrinsic Viscosity ([η]w)

The weight-average intrinsic viscosity (Table 1) varied from ~360–1580 mL/g and the effects of different processing conditions were fitted using Equation (5).
[η]w = 6914 − 2044X1 − 2040X2−92.3X3 + 741X1X2 + 31.4X1X3 + 33.8X2X3 − 12.62X1X2X3
r2 = 0.87
pH, pH × time and pH × time × temperature (in Equation (5)) all had significant influences on intrinsic viscosity, p = 0.001, 0.018, and 0.030, respectively (Figure 1A). Intrinsic viscosity values are very similar for okra pectins extracted under different processing conditions [56]. However, the values of intrinsic viscosity are considerable higher than those found for sugar beet pectin [27] but it is in agreement with their observation that pH has the most significant effect in the modelling of intrinsic viscosity (Figure 1B) and that there are interactions between all the extraction parameters (Figure 1C).

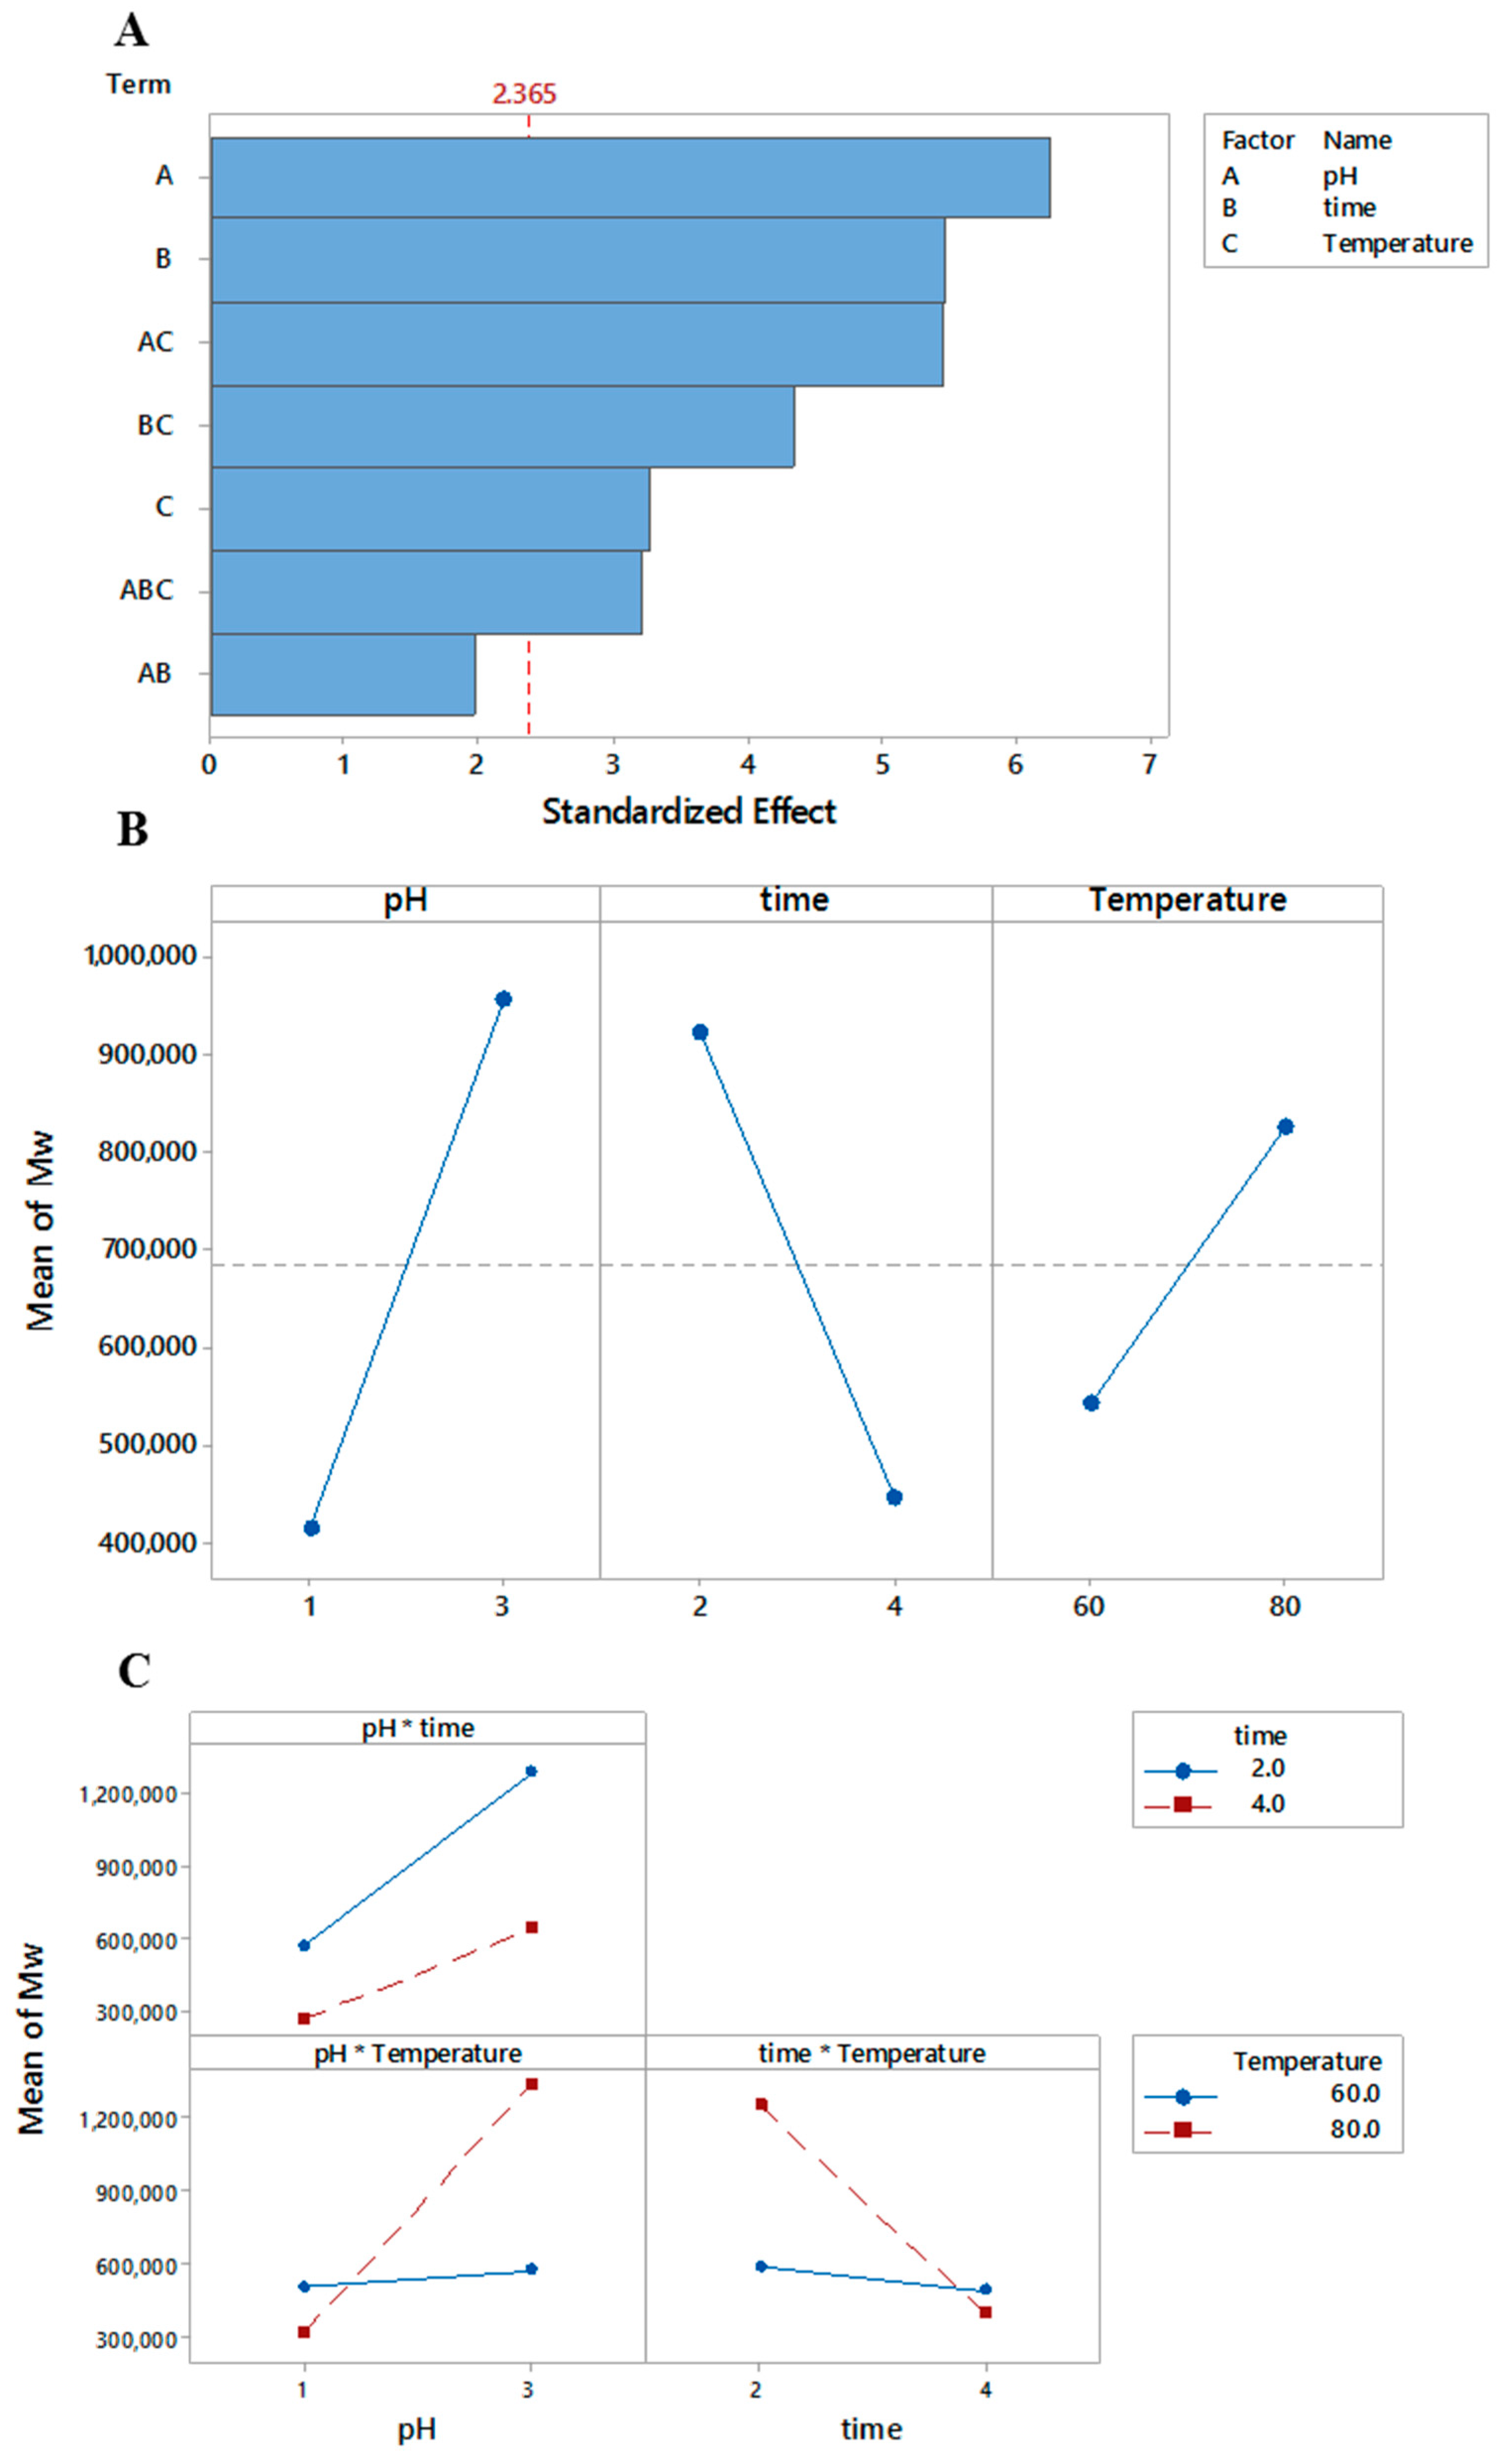
3.2. Molar Mass (Mn)

The number-average molar mass (Table 1) varied from ~1.15 × 10⁵–2.0 × 10⁶ g/mol and the effects of different processing conditions were fitted using Equation (6).
Mn = 4,580,501 − 4,070,497X1 − 702,037X2 − 60,567X3 + 892,834X1X2 + 65718X1X3 + 9077X2X3 − 13,983X1X2X3
r2 = 0.93
All factors except pH × time are significant (Figure 2A). Molecular weight increased as pH and temperature increased, but decreased with increased extraction times (Figure 2B). There are interactions between all three parameters, although the interaction between pH and time is not very large as indicated by the almost parallel lines in the interaction plot (Figure 2C). This again is in partial agreement previous research which found that the molar masses of sugar beet pectins were significantly influenced by pH and pH x temperature [27] and pH and time [34], respectively. It can be seen that the molar mass of melon pectins ranged from 115,000 to 2,000,000 g/mol, which was considerably higher than those obtained previously in similar studies, albeit using different starting materials [22,27,58,59]. Such high values may be explained by the presence of molecular aggregates in the pectin solutions, which may be due to the extraction of RG-I cross-linked with RG-II [3] or the co-extraction of hemicelluloses and/or non-structural components such as proteins [56]. This may be reflective of different pectin sub-fractions with variable compositions, molar masses and conformations being extracted under different conditions and/or the concept of a two-stage extraction process of solubilisation and depolymerisation [21,22,60].
This together with the intrinsic viscosity data would suggest that pectins extracted at pH 1 were more rigid than those extracted at pH 3 and that pectins extracted for longer times are also more rigid, but higher temperatures result in the extraction of less rigid polymers. Pectin chain flexibility can be estimated quantitatively using the translational frictional ratio (f/f0) and the persistence length (Lp) and semi-quantitatively using conformation zoning.

3.3. Estimation of Conformation

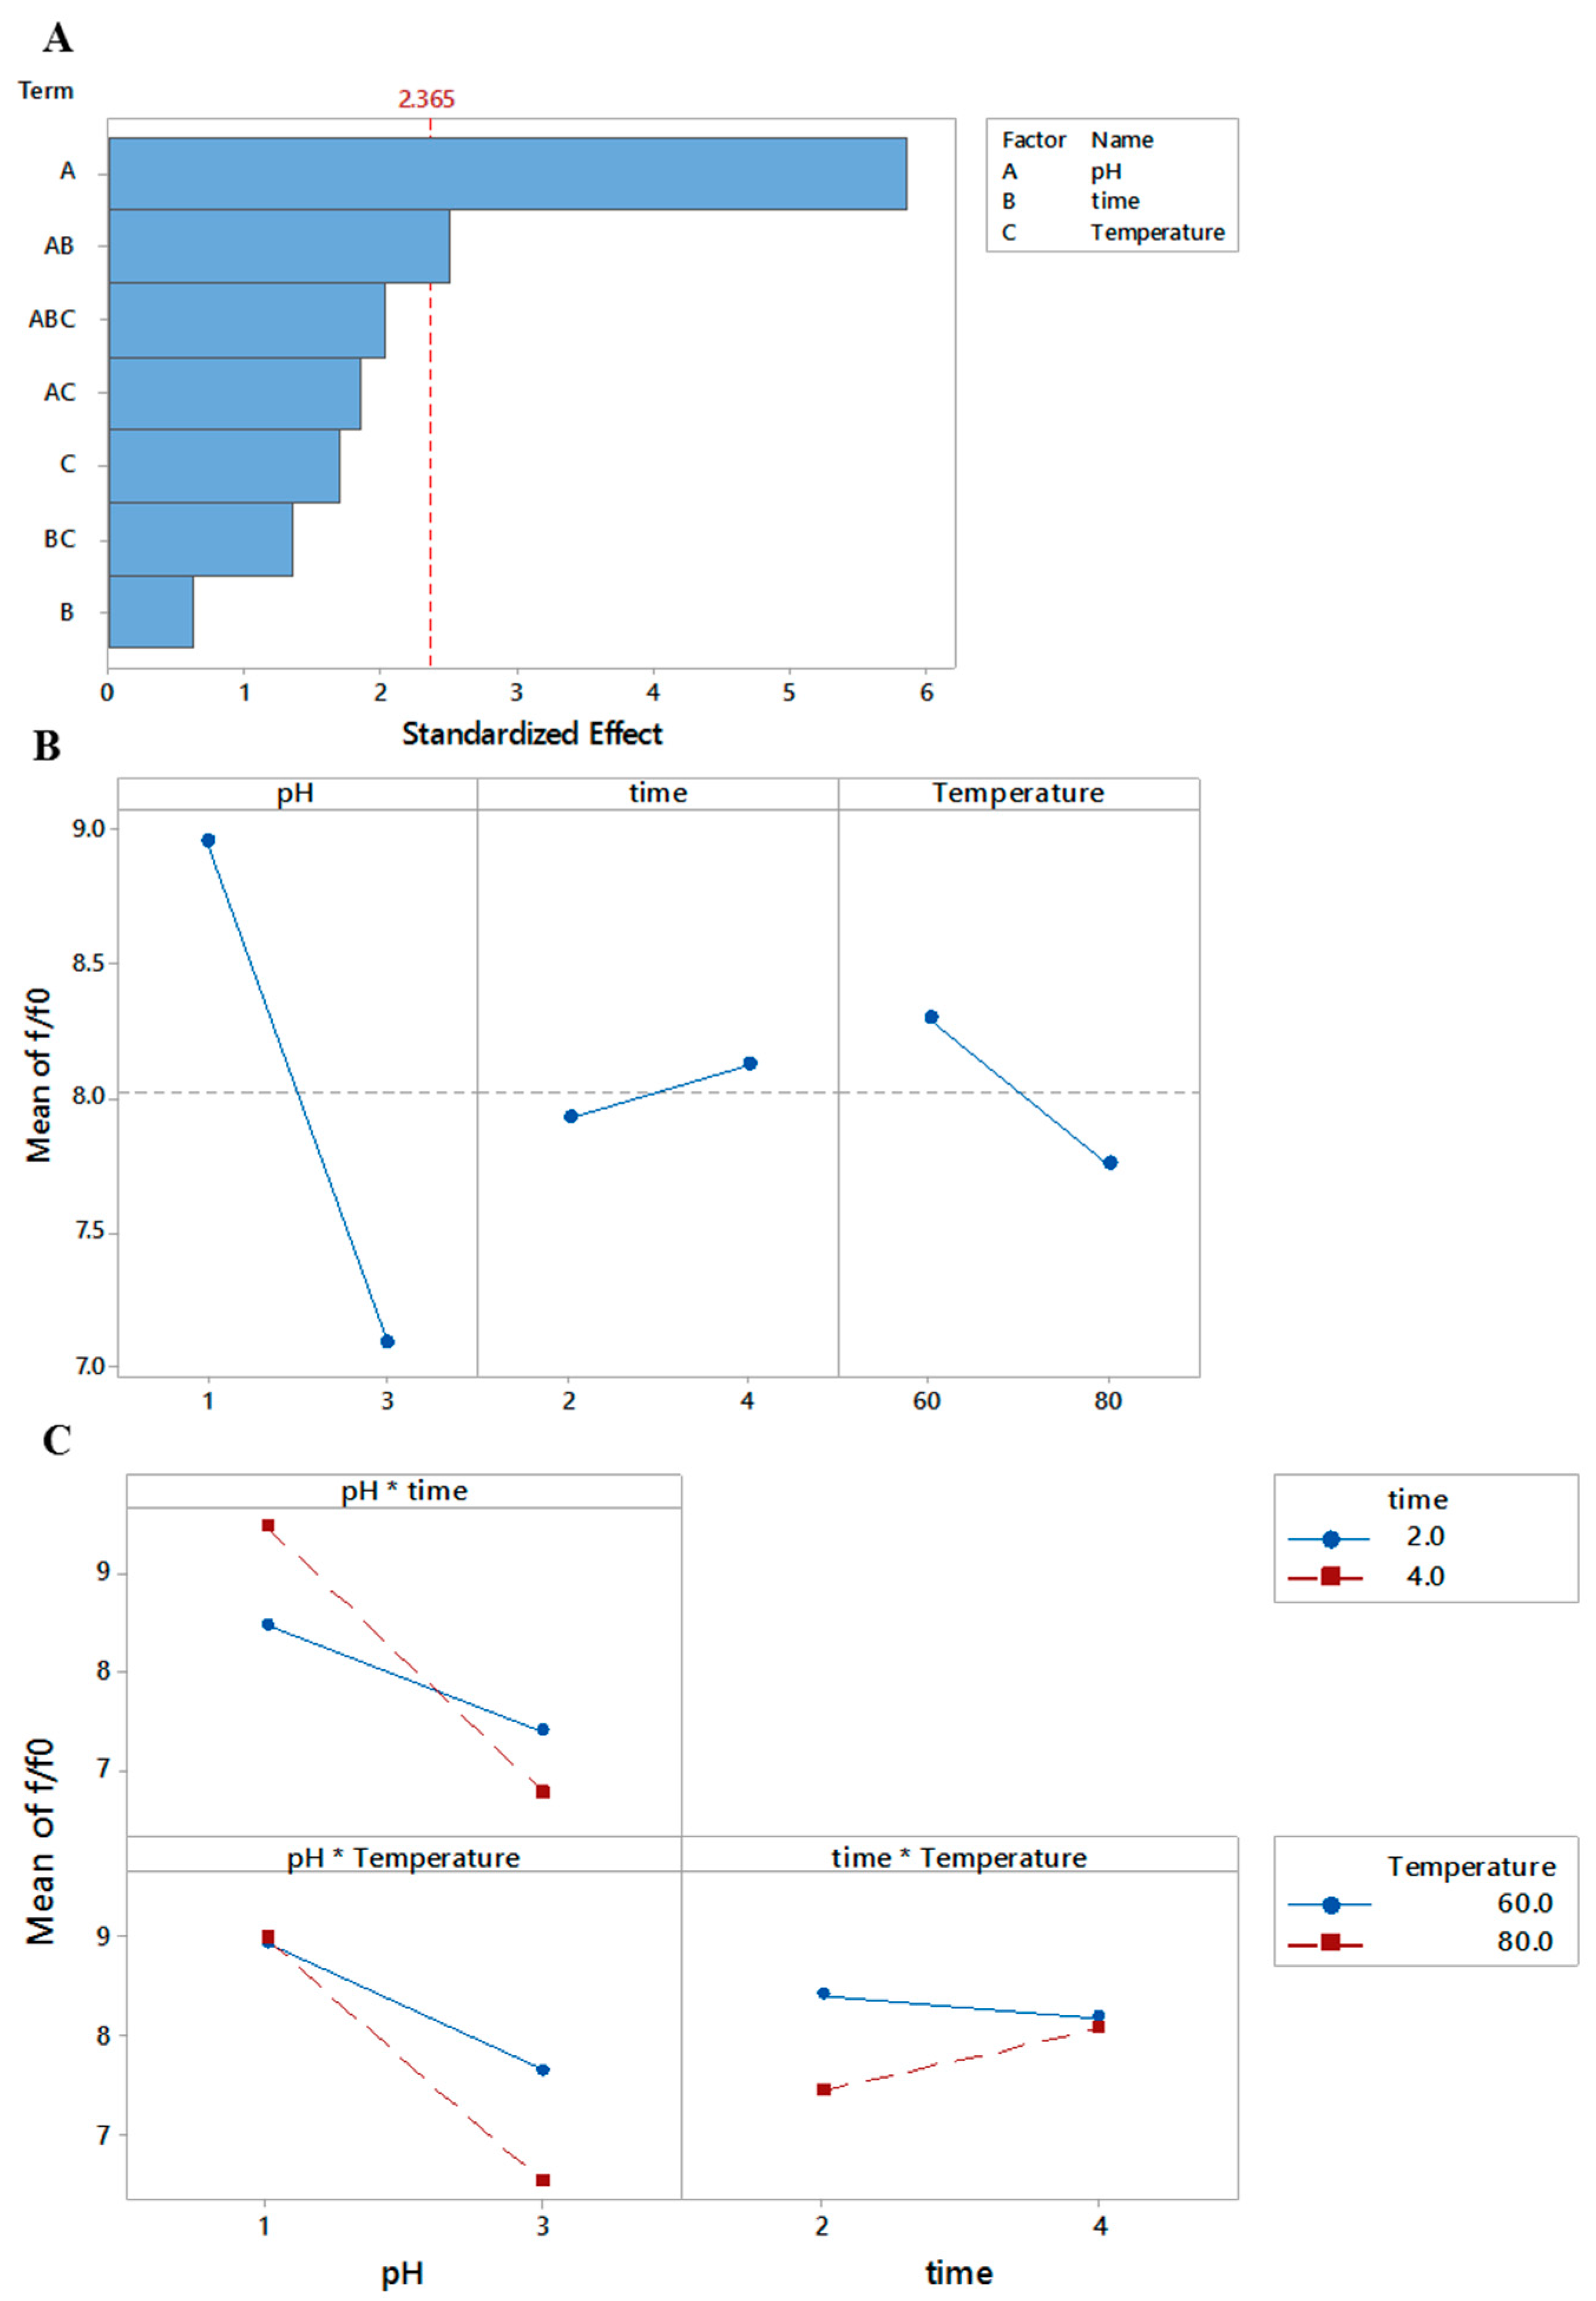
3.3.1. Translational Frictional Ratio

Estimates for the translational frictional ratio, f/f0 (Table 1) are consistent with the range of values, which have been found previously for pectins of ~7–10 [39,43] and the effects of different processing conditions were fitted using Equation (7).
f/f0 = 23.15 − 4.49X1 − 5.16X2 − 0.228X3 + 1.87X1X2 + 0.0678X1X3 + 0.0866X2X3 − 0.0325X1X2X3
r2 = 0.89
pH and pH × time (in Equation (7)) had significant influences on the translational frictional ratio, p = 0.001 and 0.041, respectively (Figure 3A).
The translational frictional ratio decreased as pH and temperature increased, but increased with increased extraction times (Figure 3B). There are interactions between all three parameters (Figure 3C). This is consistent with pectins extracted at pH 1 being more rigid than those extracted at pH 3 and that pectins extracted for longer times are also more rigid, but higher temperatures result in the extraction of less rigid polymers. This may again be reflective of different pectin sub-fractions being extracted under different conditions and/or the concept of a two-stage extraction process of solubilisation and depolymerisation [21,22,60]. It should be noted that there are also potential implications due to molecular expansion through hydration effects [42], although these would be expected to have a minimal effect on the frictional ratio of pectins.

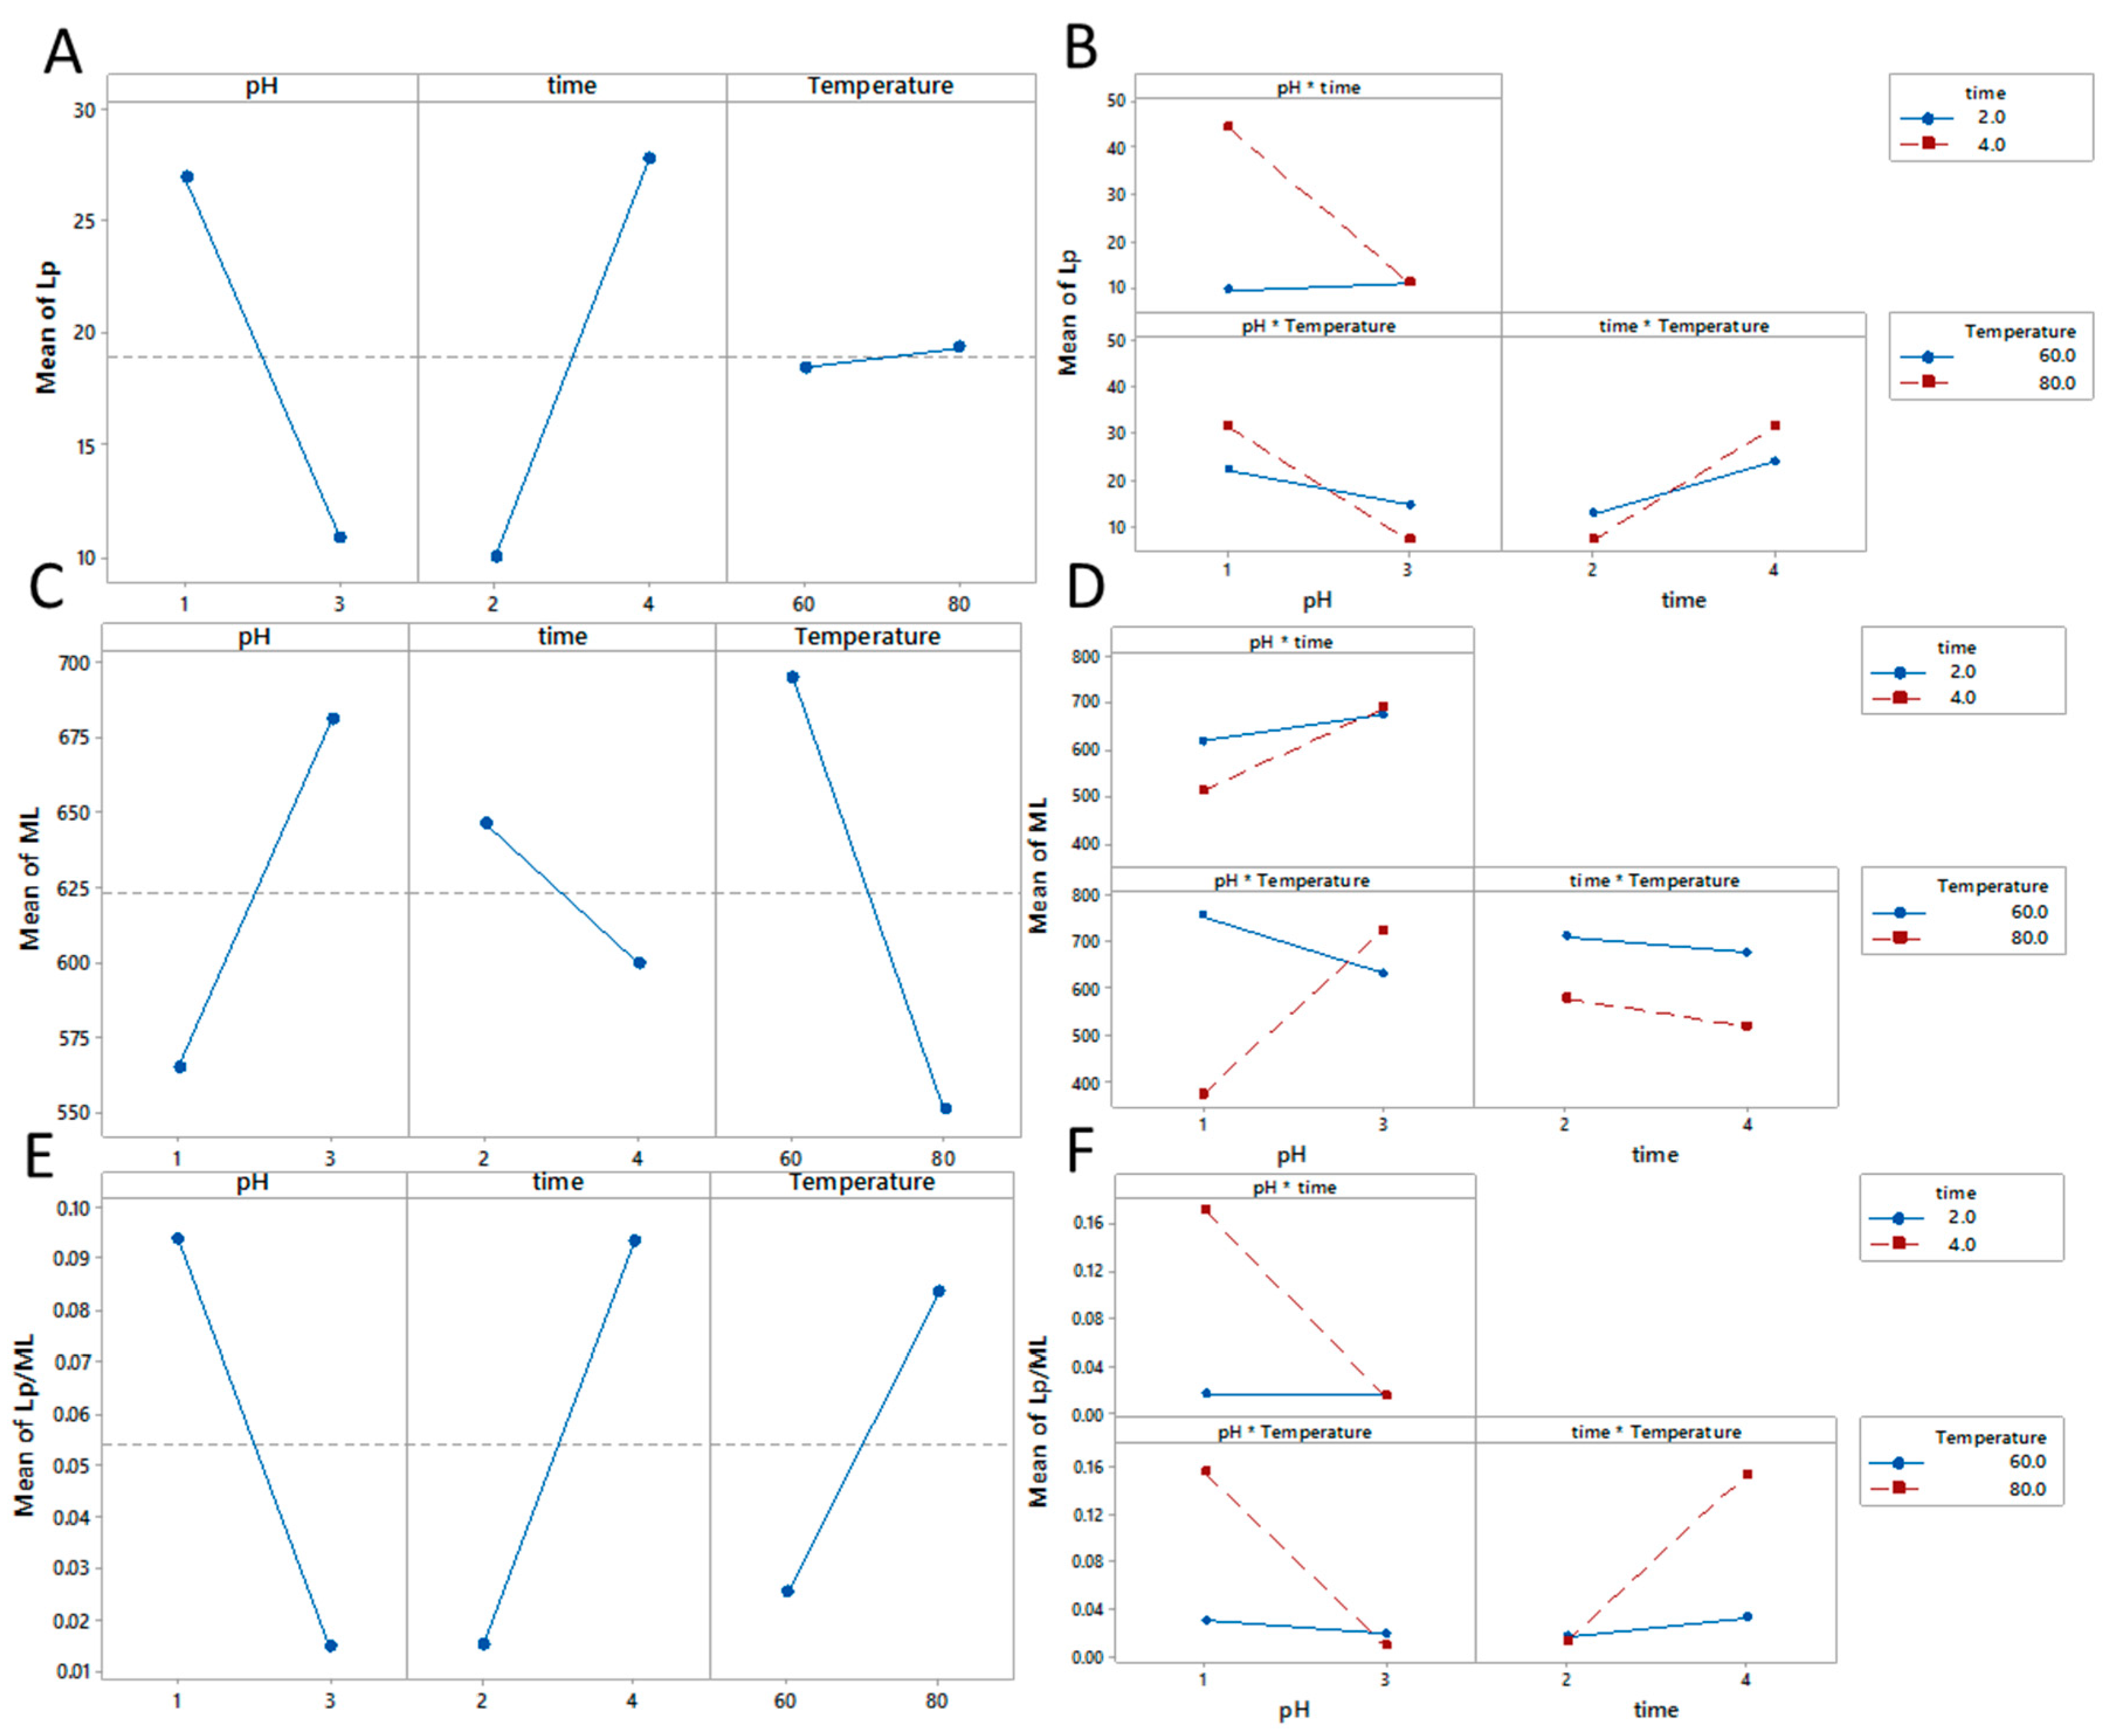
3.3.2. Persistence Length (Lp) and Mass Per Unit length (ML)

Estimates for the persistence lengths (Table 1) when the mass per unit length was allowed to float freely are mostly in the range of values, which have been found previously for pectins of ~2–26 nm [39,61]. Two exceptions are pectins C and G that have particularly high values of 35 and 54 nm, respectively. However, as the higher values of persistence length were coupled with an increase in the mass per unit length, the Lp/ML ratio is perhaps a better indication of chain stiffness [51,61] as this mitigates against an over reliance on localized minima in the global HYDFIT analysis plot [51,61]. These values (Table 1) are again generally higher for pectins extracted at pH 1 when compared to pectins extracted at pH 3, and this is especially noticeable for pectin G, which would appear to be stiff with little or no side chains. The effects of different processing conditions were fitted using Equations (8)–(10). However, it should be noted that the fit for mass per unit length is very poor (r2 = 0.51).
Lp = 16 + 21.2X1 − 14.4X2 − 0.87X3 + 0.1X1X2 − 0.039X1X3 + 0.584X2X3 − 0.127X1X2X3
r2 = 0.85
ML = 1104 – 23X1 + 525X2 − 4.9X3 – 251X1X2 − 0.1X1X3 − 8.7X2X3 + 4.02X1X2X3
r2 = 0.51
Lp/ML = 0.98 − 0.293X1 − 0.508X2 − 0.0171X3 + 0.164X1X2 + 0.00529X1X3 + 0.00893X2X3 − 0.00290X1X2X3
r2 = 0.69
With respect to persistence length time, pH and pH × time are significant (data not shown). Persistence length decreased as pH increased, but increased with increased extraction times. Temperature had very little effect (Figure 4A). There are interactions between all 3 parameters (Figure 4B). This is consistent with pectins extracted at pH 1 being more rigid than those extracted at pH 3 and that pectins extracted for longer times are also more rigid, but in this case, unlike transitional frictional ratio, higher extraction temperatures are not reflected in a change in conformation of the extracted pectins.
In the case of mass per unit length, none of the extraction parameters were significant (data not shown). Mass per unit length increased as pH increased, but decreased with increased extraction times and higher extraction temperatures (Figure 4C). There are interactions between pH and time, and pH and temperature, although time and temperature have very little interaction (Figure 4D). This is consistent with pectins extracted at pH 1 being less branched than those extracted at pH 3 and that pectins extracted for longer times and at higher temperatures are also less branched, this would be expected due to the loss of arabinan side chains [24,27]. Due to local variations in global minima, it is often useful to use the ratio of Lp/ML to estimate chain rigidity [51,61], where a higher value is indicative of a more rigid polymer.
Again, as with the mass per unit length, none of the extraction parameters were significant (data not shown). The ratio of persistence length to mass per unit length decreased as pH increased, but increased with increased extraction times and higher extraction temperatures (Figure 4E). There are interactions between all three parameters (Figure 4F). This is consistent with pectins extracted at pH 1 being less branched/more rigid than those extracted at pH 3 and that pectins extracted for longer times and at higher temperatures are also less branched/more rigid. However, less branched in this sense could mean fewer branches and/or shorter branches and, in Section 3.4, we will propose a new simple method which may distinguish between these two possibilities.

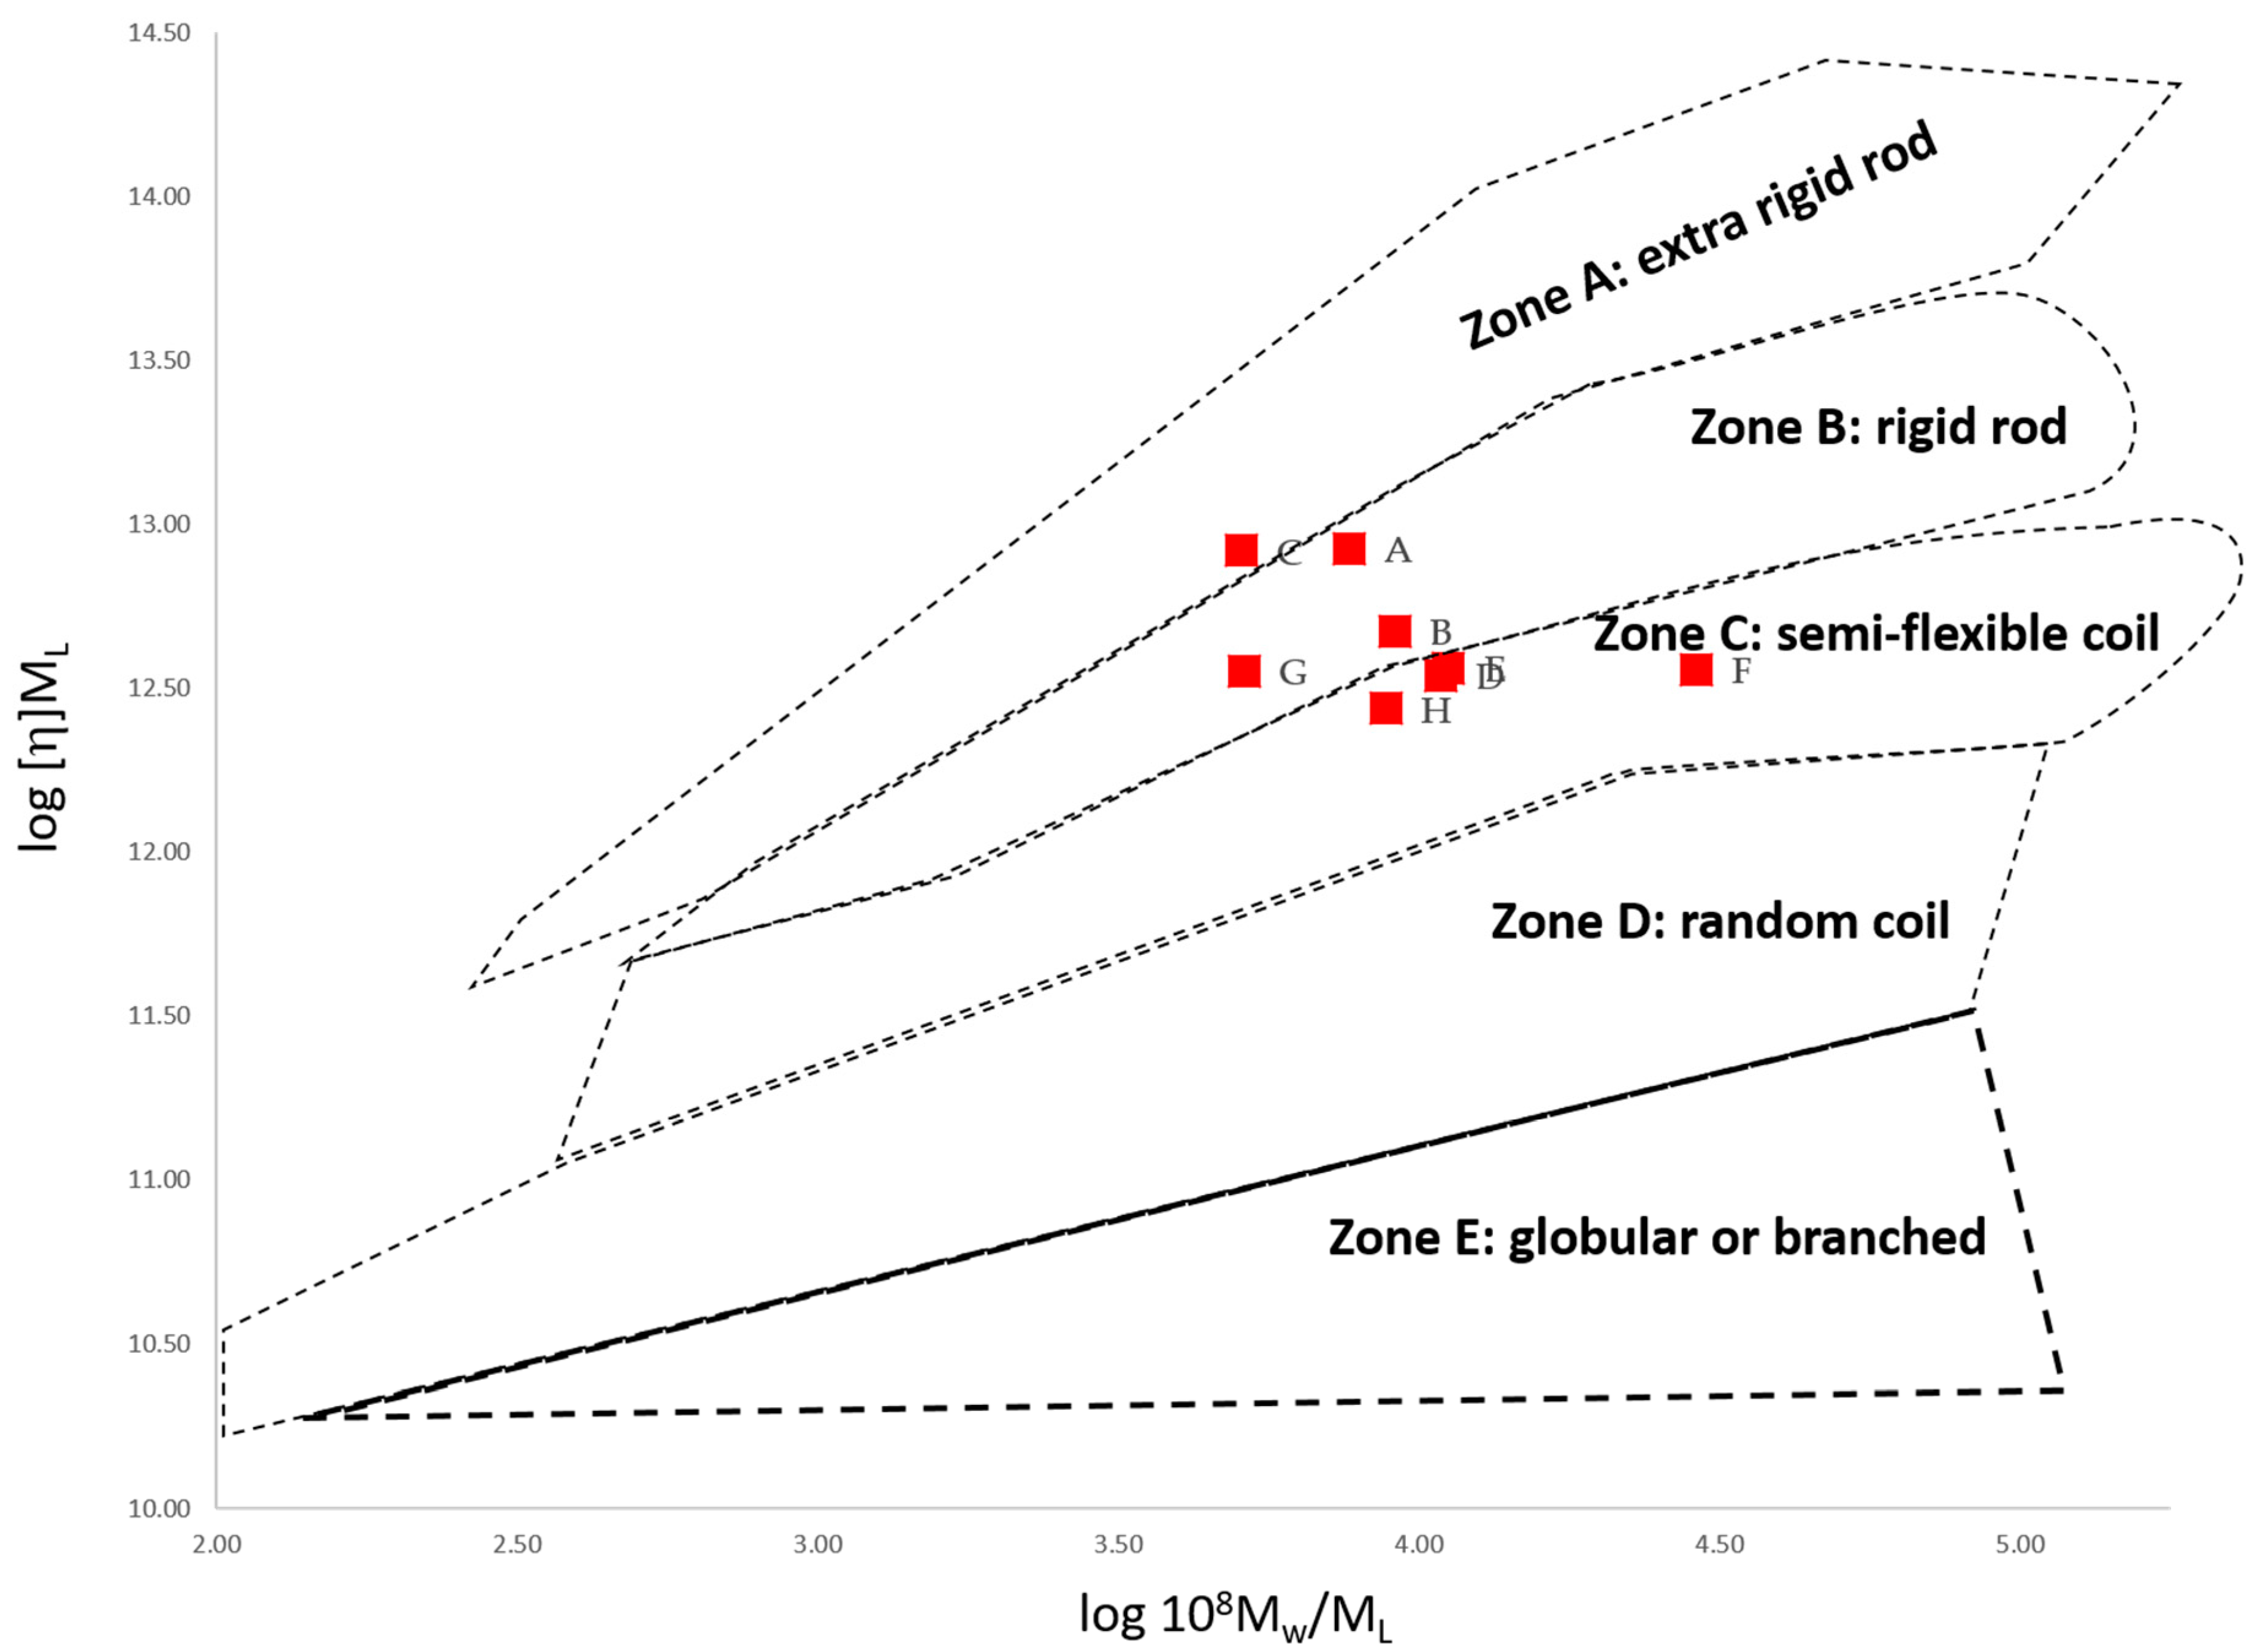
3.3.3. Conformation Zoning (Normalised Scaling Relations)

Qualitatively, Figure 5 is consistent with the pectins extracted at pH 1 (A, C, E and G) being more rigid on average than those extracted at pH 3 (B, D, F and H). Neither extraction time nor temperature appear a great influence. All pectins, except pectin C, have similar conformations to those found previously for both citrus and sugar beet pectins [39,61]. It has been found previously that an estimation of stiffness (flexibility) that relies solely on the variation of intrinsic viscosity with molar mass, rather than using a suite of hydrodynamic techniques, tends to result in an overestimate of chain stiffness [62].

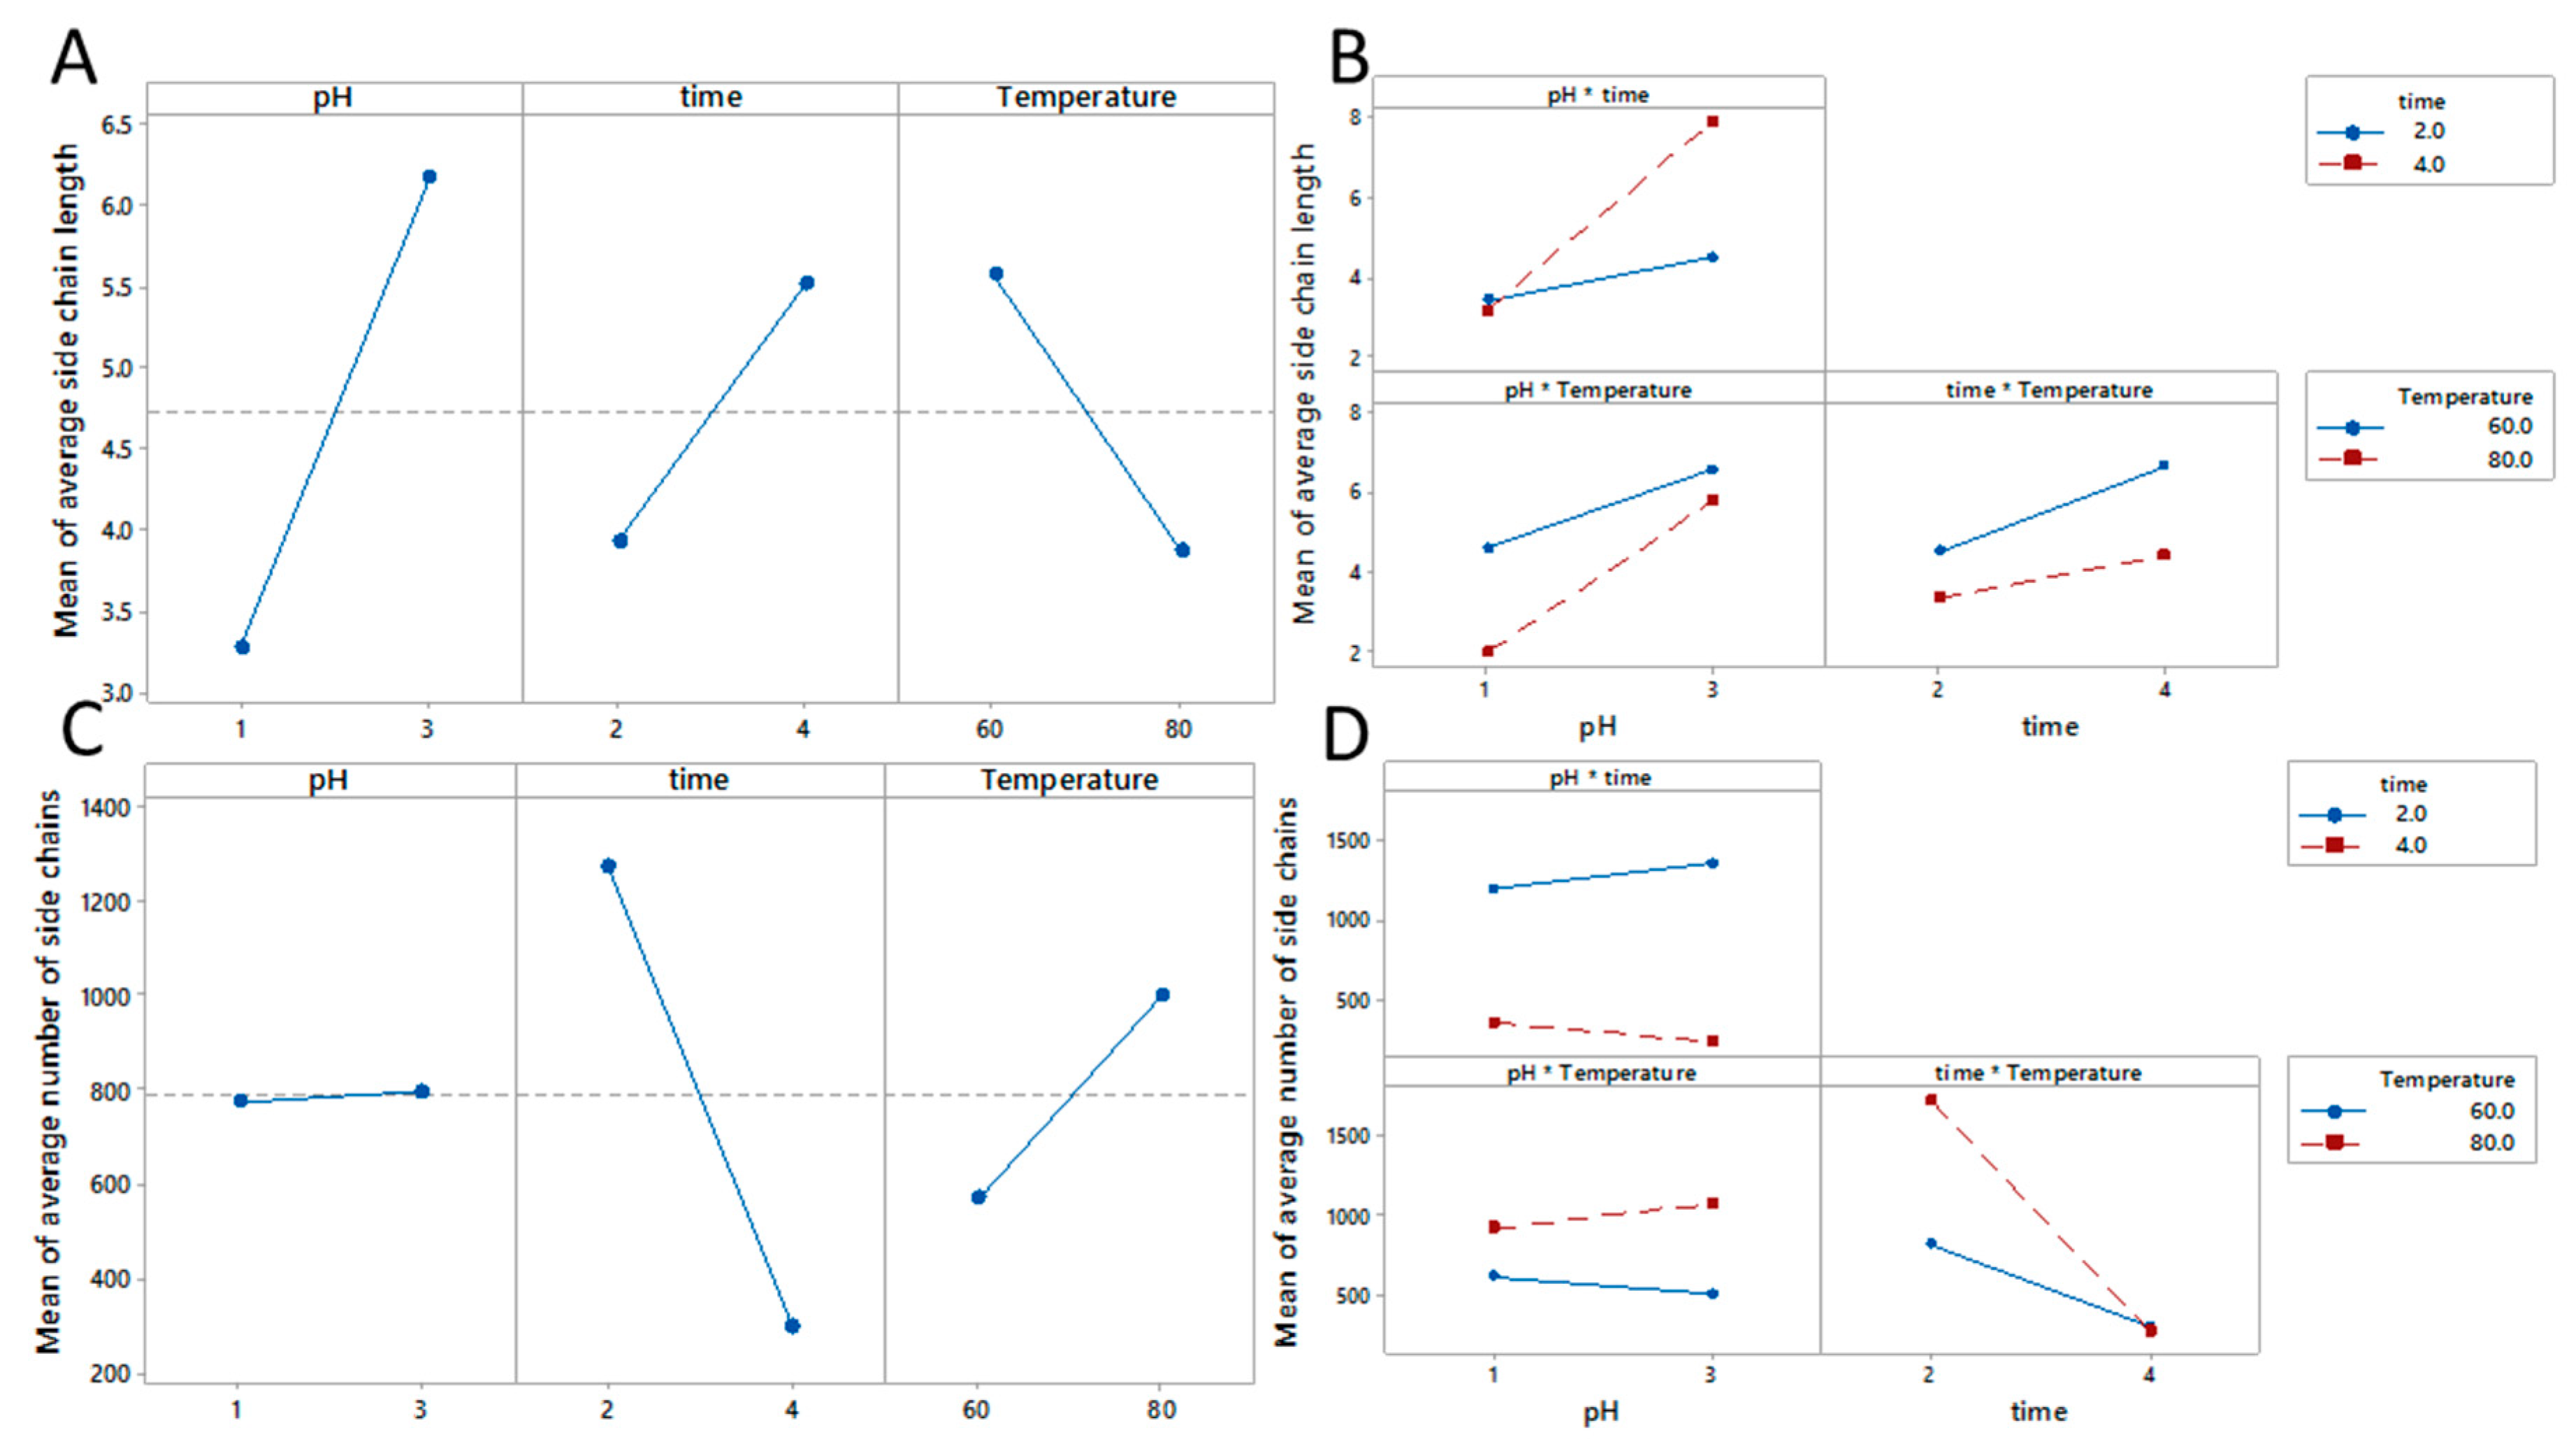
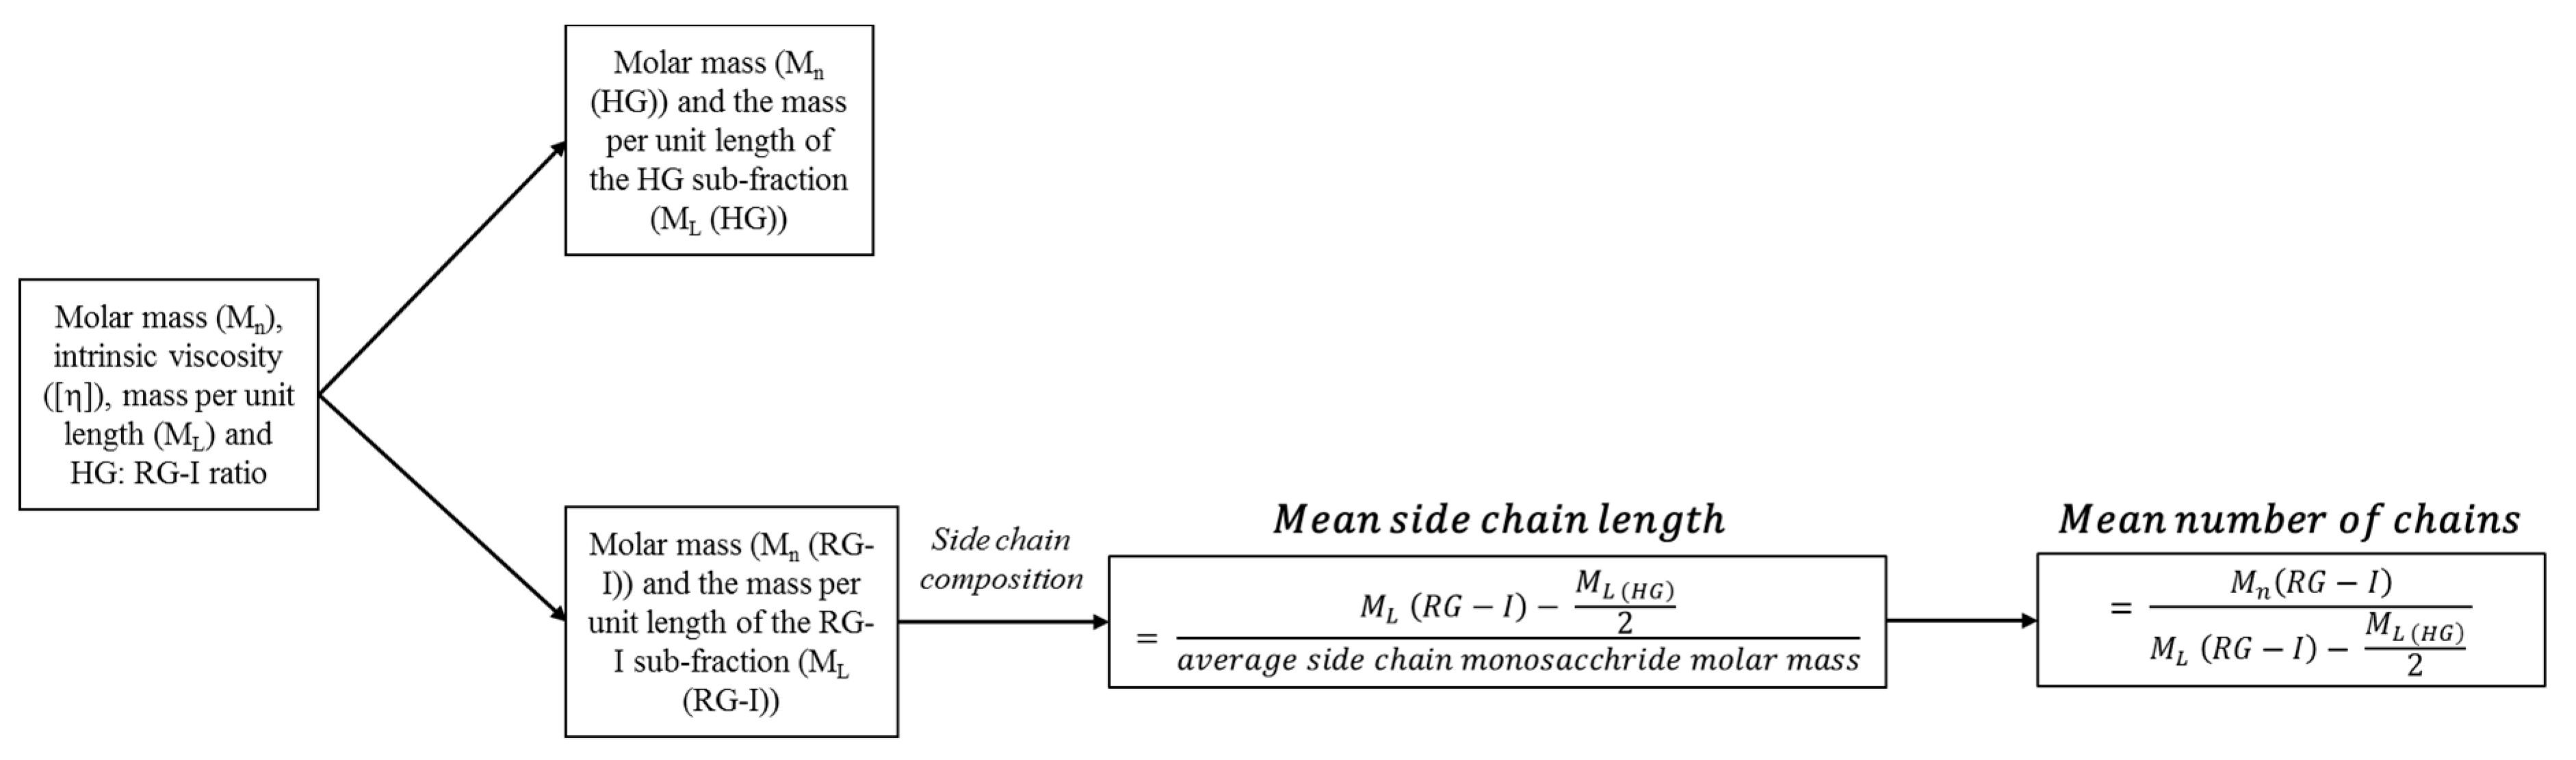
3.4. Estimation of Branching

Knowledge of molar mass, intrinsic viscosity and conformational data (Table 2) coupled with the compositional data in our previous publication [24], enables the potential estimation of both the mean number and mean length of the side chains on a pectin molecule. The procedure is explained in Scheme 1.
This can be done using the mass per unit length calculated from the freely floated HYDFIT procedure (Table 2). Which together with knowledge of the HG: RG-I ratio [24] enables the estimation of the molar mass and the mass per unit length of both the HG and RG-I sub-fractions (Table 2). These calculations (Equations (11) and (12)) are based on the assumption that all the side chains are in the RG-I sub-fraction. This is an extension on the approach used previously to determine whether or not xanthan chains are double helices using the mass per unit length [38] and could potentially be used in the analysis in the degree of dimerization of pectins linked via ferulic acid bridges [27,51].
M e a n   s i d e   c h a i n   l e n g t h =   M L   ( R G I )   M L   ( H G ) 2 a v e r a g e   s i d e   c h a i n   m o n o s a c c h r i d e   m o l a r   m a s s
M e a n   n u m b e r   o f   c h a i n s =   M n ( R G I ) M L   ( R G I )   M L   ( H G ) 2  
where M L   ( R G I )   M L   ( H G ) 2 is the average side chain mass and the average side chain monosaccharide molar mass can be calculated from the pectin composition and in most cases is ~150 g/mol [24], although this will vary depending on the neutral sugar composition and hexose (galactose) to pentose (arabinose) ratio.
It is believed that this is the first time this type of analysis has been used to estimate the number and length of pectin side chains. Clearly, there is a large difference in the results of the model for the different pectin samples. However, what can be observed is that, in general, these pectins have a large number of relatively short side chains when compared to those visualised by atomic force microscopy (AFM) [63], which had a length of approximately 30–170 nm (~60–340 monosaccharide units assuming a typical monomer is 0.5 nm). As an aside, knowledge of side chain lengths from, for example, AFM, could be used in conjunction with other measurements to estimate pectin conformation. Furthermore, it does appear that the more rigid molecules have fewer and shorter side chains. We can, therefore, use the factorial design to determine the influence of the different extraction parameters on the number of side chains and their respective lengths.
Mean side chain length = 22.4 − 9.9X1 − 2.75X2 − 0.249X3 + 2.72X1X2 + 0.123X1X3 + 0.024X2X3 − 0.0258X1X2X3
r2 = 0.75
Mean side chain number = −4129 – 5X1 + 1437X2 + 85X3 – 150X1X2 + 3.2X1X3 − 25.5X2X3 + 1.2X1X2X3
r2 = 0.58
With respect to the average side chain length, the only significant extraction parameter was pH (data not shown). The mean length of branches increased as pH increased and with increased extraction times, but decreased with higher extraction temperatures (Figure 6A). There are interactions between all three parameters, but there is only a large interaction between pH and time (Figure 6B). This is consistent with pectins extracted at pH 1 having shorter branches than those extracted at pH 3 and that pectins extracted at higher temperatures also have shorter branches whereas those extracted for longer times have longer branches. This may again be reflective of different pectin sub-fractions being extracted under different conditions and/or the concept of a two-stage extraction process of solubilisation and depolymerisation [21,22,60] including loss of arabinan side chains [24,27]. In the case of the number of side chains, none of the extraction parameters were significant (data not shown). The mean number of branches as apparently independent of pH, whilst the number of side chains decreased with increased extraction times, but increased with higher extraction temperatures (Figure 6C). There are interactions between all three parameters (Figure 6D). This is consistent with pectins extracted at pH 1 having a similar number of branches, but with these being shorter branches than those extracted at pH 3. Pectins extracted at higher temperatures have a larger number of shorter branches whereas those extracted for longer times have fewer side chains of a longer length.
There are, of course, some limitations which we need to consider when discussing this new procedure. The mean length of side chains is the “number” average, and, at this time, there is no information on the distribution of side chain lengths. However, it is possible to measure the molar mass and intrinsic viscosity at each slice in a size exclusion chromatogram. Therefore, with knowledge of the mass per unit length and neutral sugar composition at each individual slice [61], it would be possible to estimate number and length of these side chains.

4. Conclusions

The data in Table 1 and Table 2 were used to generate an overall principal component score for each of the samples (Figure 7) [24,64].
The first component is positively correlated with molar mass, mass per length, number and length of side chains and hence probably gives a good indication of being highly branched and therefore being a more compact polymer. This further supported by the intrinsic viscosity, translational frictional ratio, persistence length and persistence length to mass per unit length ratio all being negatively correlated with this component. It may be reasonable to suggest their order from left to right is a good approximation of their rigidity, with G being the most rigid and F the least. This is in at least partial agreement with conformational zoning and the estimates from Lp/ML.
The second component appears to differentiate those with more side chains from those with longer side chains. For example, those samples with more side chains for example E and F are well separated from those samples with fewer side chains for example D and H. This is perhaps particularly interesting in the case of pectins D and E, which have very similar conformations when we consider only their Lp/ML ratio or their position in the conformational zoning plot and again demonstrates the importance of using more than one method in estimating the branching of a polysaccharide [39,43,62]. As with conformation zoning and translational frictional ratio, we can see that samples extracted at pH 1 are more rigid than those extracted at pH 3. This is consistent with results from chemical analysis which also shows clear differences between samples extracted at pH 1 and pH 3 [24]. There is also some evidence that pectins extracted at higher temperatures (C, D, G and H) have fewer side chains, which could be due to the loss of arabinan side chains [24,27]. The first and second components describe 83% of the variation in the samples. It is, therefore, clear that extraction conditions, and pH in particular, have a great influence on the number and length of side chains on the RG-I region of pectins extracted from Cucumis melo Inodorus.
This, therefore, leads to the observation that knowledge of how different extraction parameters influence chemical/physical/conformation/branching characteristics can potentially allow for these desired characteristics to be maximised (or minimized) which can lead to tailor-made pectins for specific applications. It has been reported previously that the bioactivities of pectins are related to their RG-I side chains [9,65] and, furthermore, the HG: RG-I ratio has an influence on the stability of pectin-stabilised emulsions [66] or on their ability to act as bioflocculating agents [56]. However, this new approach may give additional insight into the influence of the number and length of side chains on the RG-I region on pectin functionality. This would represent an additional level of knowledge of the pectin “fine” structure compared to previous studies [9,56,65,66]. Therefore, using the data in Table 1 and Table 2, we can optimise one or more parameters to a desired value and adapt the extraction conditions accordingly. For example, if we consider two extremes where the intrinsic viscosity, molar mass, length and number of side chains are either maximised or minimised. The optimal conditions (staying within the limits of pH 1–3, extraction time 2–4 h and an extraction temperature 60–80 °C) for these extractions would be pH 3, 2 h at 80 °C and pH 1, 4 h 80 °C, respectively. However, in relation to commercial applications other important industrial considerations, for example, pectin yield [21,22,24,25,26,27,28,29,30,31,32,33] and the environmental issues surrounding the disposal of hazardous chemicals would need to be considered.
To the best of our knowledge, this is the first time that a combination of compositional, physico-chemical and conformation analyses, including the mass per unit length have been used to determine the length and number of side chains on a pectin polysaccharide. RG-I side chain lengths together with the galactose/arabinose ratio can, therefore, be estimated, which may give useful information in the prediction of pectin functionality, including, for example, their biological activities [35], bioflocculating [56] and emulsifying properties [66]. There are, of course, several other factors which have an influence on pectin’s structure and function, for example, genetic variety, seasonal and geographical variations and ripening stage [67,68] which could also be investigated in this manner. This type of analysis is an additional tool, which can be used in the characterisation of pectins, and when combined with experimental design, pectin properties could be optimised to give a desired functionality. It is expected that, with some modifications, a similar approach may be useful in the analysis of several branched polysaccharides.

Author Contributions

D.C.R.: Methodology, Investigation, Data interpretation and analysis, Writing—sections of the original draft. L.J.D.: Methodology, Investigation, Data interpretation and analysis. H.A.S.B.: Methodology, Data interpretation and analysis, Writing—sections of the original draft. G.A.M.: Conceptualization, Resources, Methodology, Data interpretation and analysis, Writing—review, editing & revisions, Supervision. All authors have read and agreed to the published version of the manuscript.

Funding

This research received no external funding.

Conflicts of Interest

The authors declare no conflict of interest.

References

  1. Harding, S.E.; Tombs, M.; Adams, G.; Smestad Paulsen, B.; Inngjerdingen, K.; Barsett, H. An Introduction to Polysaccharide Biotechnology; CRC Press: Boca Raton, FL, USA, 2017. [Google Scholar] [CrossRef]
  2. Willats, W.G.T.; McCartney, L.; Mackie, W.; Knox, J.P. Pectin: Cell biology and prospects for functional analysis. Plant Mol. Biol. 2001, 47, 9–27. [Google Scholar] [CrossRef]
  3. Ridley, B.L.; O’Neill, M.A.; Mohnen, D. Pectins: Structure, biosynthesis, and oligogalacturonide-related signaling. Phytochemistry 2001, 57, 929–967. [Google Scholar] [CrossRef]
  4. Houben, K.; Jolie, R.P.; Fraeye, I.; Van Loey, A.M.; Hendrickx, M.E. Comparative study of the cell wall composition of broccoli, carrot, and tomato: Structural characterization of the extractable pectins and hemicelluloses. Carbohydr. Res. 2011, 346, 1105–1111. [Google Scholar] [CrossRef]
  5. Zhang, C.; Zhu, X.; Zhang, F.; Yang, X.; Ni, L.; Zhang, W.; Liu, Z.; Zhang, Y. Improving viscosity and gelling properties of leaf pectin by comparing five pectin extraction methods using green tea leaf as a model material. Food Hydrocoll. 2020, 98, 105246. [Google Scholar] [CrossRef]
  6. Pi, F.; Liu, Z.; Guo, X.; Guo, X.; Meng, H. Chicory root pulp pectin as an emulsifier as compared to sugar beet pectin. Part 1: Influence of structure, concentration, counterion concentration. Food Hydrocoll. 2019, 89, 792–801. [Google Scholar] [CrossRef]
  7. Fracasso, A.F.; Perussello, C.A.; Carpiné, D.; Petkowicz, C.L.d.O.; Haminiuk, C.W.I. Chemical modification of citrus pectin: Structural, physical and rheologial implications. Int. J. Biol. Macromol. 2018, 109, 784–792. [Google Scholar] [CrossRef] [PubMed]
  8. Schmidt, U.S.; Koch, L.; Rentschler, C.; Kurz, T.; Endreß, H.U.; Schuchmann, H.P. Effect of Molecular Weight Reduction, Acetylation and Esterification on the Emulsification Properties of Citrus Pectin. Food Biophys. 2015, 10, 217–227. [Google Scholar] [CrossRef]
  9. Cui, J.; Zhao, C.; Zhao, S.; Tian, G.; Wang, F.; Li, C.; Wang, F.; Zheng, J. Alkali + cellulase-extracted citrus pectins exhibit compact conformation and good fermentation properties. Food Hydrocoll. 2020, 106079. [Google Scholar] [CrossRef]
  10. Nergard, C.S.; Kiyohara, H.; Reynolds, J.C.; Thomas-Oates, J.E.; Matsumoto, T.; Yamada, H.; Michaelsen, T.E.; Diallo, D.; Paulsen, B.S. Structure-immunomodulating activity relationships of a pectic arabinogalactan from Vernonia kotschyana Sch. Bip. ex Walp. Carbohydr. Res. 2005, 340, 1789–1801. [Google Scholar] [CrossRef] [PubMed]
  11. Georgiev, Y.N.; Paulsen, B.S.; Kiyohara, H.; Ciz, M.; Ognyanov, M.H.; Vasicek, O.; Rise, F.; Denev, P.N.; Lojek, A.; Batsalova, T.G.; et al. Tilia tomentosa pectins exhibit dual mode of action on phagocytes as β-glucuronic acid monomers are abundant in their rhamnogalacturonans I. Carbohydr. Polym. 2017, 175, 178–191. [Google Scholar] [CrossRef]
  12. Huang, C.; Yao, R.; Zhu, Z.; Pang, D.; Cao, X.; Feng, B.; Paulsen, B.S.; Li, L.; Yin, Z.; Chen, X.; et al. A pectic polysaccharide from water decoction of Xinjiang Lycium barbarum fruit protects against intestinal endoplasmic reticulum stress. Int. J. Biol. Macromol. 2019, 130, 508–514. [Google Scholar] [CrossRef]
  13. Zou, Y.F.; Zhang, Y.Y.; Fu, Y.P.; Inngjerdingen, K.T.; Paulsen, B.S.; Feng, B.; Zhu, Z.K.; Li, L.X.; Jia, R.Y.; Huang, C.; et al. A polysaccharide isolated from codonopsis pilosula with immunomodulation effects both in vitro and in vivo. Molecules 2019, 24, 3632. [Google Scholar] [CrossRef] [PubMed] [Green Version]
  14. Zou, Y.F.; Zhang, Y.Y.; Paulsen, B.S.; Rise, F.; Chen, Z.L.; Jia, R.Y.; Li, L.X.; Song, X.; Feng, B.; Tang, H.Q.; et al. Structural features of pectic polysaccharides from stems of two species of Radix Codonopsis and their antioxidant activities. Int. J. Biol. Macromol. 2020, 159, 704–713. [Google Scholar] [CrossRef] [PubMed]
  15. Williams, M.A.K.; Cucheval, A.; Ström, A.; Ralet, M.C. Electrophoretic behavior of copolymeric galacturonans including comments on the information content of the intermolecular charge distribution. Biomacromolecules 2009, 10, 1523–1531. [Google Scholar] [CrossRef] [PubMed]
  16. Sun, L.; Ropartz, D.; Cui, L.; Shi, H.; Ralet, M.C.; Zhou, Y. Structural characterization of rhamnogalacturonan domains from Panax ginseng C. A. Meyer. Carbohydr. Polym. 2019, 203, 119–127. [Google Scholar] [CrossRef]
  17. Voragen, A.G.J.; Coenen, G.-J.; Verhoef, R.P.; Schols, H.A. Pectin, a versatile polysaccharide present in plant cell walls. Struct. Chem. 2009, 20, 263. [Google Scholar] [CrossRef] [Green Version]
  18. Axelos, M.A.V.; Thibault, J.F. Influence of the substituents of the carboxyl groups and of the rhamnose content on the solution properties and flexibility of pectins. Int. J. Biol. Macromol. 1991, 13, 77–82. [Google Scholar] [CrossRef]
  19. Seixas, F.L.; Fukuda, D.L.; Turbiani, F.R.B.; Garcia, P.S.; Petkowicz, C.L.D.O.; Jagadevan, S.; Gimenes, M.L. Extraction of pectin from passion fruit peel (Passiflora edulis f.flavicarpa) by microwave-induced heating. Food Hydrocoll. 2014, 38, 186–192. [Google Scholar] [CrossRef]
  20. Adetunji, L.R.; Adekunle, A.; Orsat, V.; Raghavan, V. Advances in the pectin production process using novel extraction techniques: A review. Food Hydrocoll. 2017, 62, 239–250. [Google Scholar] [CrossRef]
  21. Pagán, J.; Ibarz, A. Extraction and rheological properties of pectin from fresh peach pomace. J. Food Eng. 1999, 39, 193–201. [Google Scholar] [CrossRef]
  22. Pagán, J.; Ibarz, A.; Llorca, M.; Coll, L. Quality of industrial pectin extracted from peach pomace at different pH and temperatures. J. Sci. Food Agric. 1999, 79, 1038–1042. [Google Scholar] [CrossRef]
  23. Pagán, J.; Ibarz, A.; Llorca, M.; Pagán, A.; Barbosa-Cánovas, G.V. Extraction and characterization of pectin from stored peach pomace. Food Res. Int. 2001, 34, 605–612. [Google Scholar] [CrossRef]
  24. Denman, L.J.; Morris, G.A. An experimental design approach to the chemical characterisation of pectin polysaccharides extracted from Cucumis melo Inodorus. Carbohydr. Polym. 2015, 117, 364–369. [Google Scholar] [CrossRef] [PubMed]
  25. Kliemann, E.; De Simas, K.N.; Amante, E.R.; Prudêncio, E.S.; Teófilo, R.F.; Ferreira, M.M.C.; Amboni, R.D.M.C. Optimisation of pectin acid extraction from passion fruit peel (Passiflora edulis flavicarpa) using response surface methodology. Int. J. Food Sci. Technol. 2009, 44, 476–483. [Google Scholar] [CrossRef]
  26. Kumar, M.; Chauhan, A.K.R.; Kumar, S.; Kumar, A.; Malik, S. Design and evaluation of pectin based metrics for transdermal patches of meloxicam. J. Pharm. Res. Health Care 2010, 2, 244–247. [Google Scholar]
  27. Levigne, S.; Ralet, M.C.; Thibault, J.F. Characterisation of pectins extracted from fresh sugar beet under different conditions using an experimental design. Carbohydr. Polym. 2002, 49, 145–153. [Google Scholar] [CrossRef]
  28. Samavati, V. Polysaccharide extraction from Abelmoschus esculentus: Optimization by response surface methodology. Carbohydr. Polym. 2013, 95, 588–597. [Google Scholar] [CrossRef]
  29. Samavati, V. Central composite rotatable design for investigation of microwave-assisted extraction of okra pod hydrocolloid. Int. J. Biol. Macromol. 2013, 61, 142–149. [Google Scholar] [CrossRef]
  30. Sudhakar, D.V.; Maini, S.B. Isolation and characterization of mango peel pectins. J. Food Process. Preserv. 2000, 24, 209–227. [Google Scholar] [CrossRef]
  31. Ayora-Talavera, T.; Ramos-Chan, C.; Covarrubias-Cárdenas, A.; Sánchez-Contreras, A.; García-Cruz, U.; Pacheco, L.N. Evaluation of Pectin Extraction Conditions and Polyphenol Profile from Citrus x lantifolia Waste: Potential Application as Functional Ingredients. Agriculture 2017, 7, 28. [Google Scholar] [CrossRef] [Green Version]
  32. Yapo, B.M.; Robert, C.; Etienne, I.; Wathelet, B.; Paquot, M. Effect of extraction conditions on the yield, purity and surface properties of sugar beet pulp pectin extracts. Food Chem. 2007, 100, 1356–1364. [Google Scholar] [CrossRef]
  33. May, C.D. Industrial pectins: Sources, production and applications. Carbohydr. Polym. 1990, 12, 79–99. [Google Scholar] [CrossRef]
  34. Happi Emaga, T.; Ronkart, S.N.; Robert, C.; Wathelet, B.; Paquot, M. Characterisation of pectins extracted from banana peels (Musa AAA) under different conditions using an experimental design. Food Chem. 2008, 108, 463–471. [Google Scholar] [CrossRef] [PubMed]
  35. Mao, G.; Wu, D.; Wei, C.; Tao, W.; Ye, X.; Linhardt, R.J.; Orfila, C.; Chen, S. Reconsidering conventional and innovative methods for pectin extraction from fruit and vegetable waste: Targeting rhamnogalacturonan I. Trends Food Sci. Technol. 2019, 94, 65–78. [Google Scholar] [CrossRef]
  36. Wu, D.; Zheng, J.; Mao, G.; Hu, W.; Ye, X.; Linhardt, R.J.; Chen, S. Rethinking the impact of RG-I mainly from fruits and vegetables on dietary health. Crit. Rev. Food Sci. Nutr. 2019, 1–23. [Google Scholar] [CrossRef]
  37. Harding, S.E.; Berth, G.; Ball, A.; Mitchell, J.R.; de la Torre, J.G. The molecular weight distribution and conformation of citrus pectins in solution studied by hydrodynamics. Carbohydr. Polym. 1991, 16, 1–15. [Google Scholar] [CrossRef] [Green Version]
  38. Stokke, B.T.; Smidsrød, O.; Elgsaeter, A. Electron microscopy of native xanthan and xanthan exposed to low ionic strength. Biopolymers 1989, 28, 617–637. [Google Scholar] [CrossRef]
  39. Morris, G.A.; de al Torre, J.C.; Ortega, A.; Castile, J.; Smith, A.; Harding, S.E. Molecular flexibility of citrus pectins by combined sedimentation and viscosity analysis. Food Hydrocoll. 2008, 22, 1435–1442. [Google Scholar] [CrossRef] [Green Version]
  40. Theisen, A.; Johann, C.; Deacon, M.P.; Harding, S.E. Refractive Increment Data-Book for Polymer and Biomolecular Scientists; Nottingham University Press: Nottingham, UK, 2000. [Google Scholar]
  41. Grubisic, Z.; Rempp, P.; Benoit, H. A universal calibration for gel permeation chromatography. J. Polym. Sci. Part B Polym. Phys. 1996, 34, 1707–1713. [Google Scholar] [CrossRef]
  42. Tanford, C. Physical Chemistry of Macromolecules; John Willey and Sons Inc.: Hoboken, NJ, USA, 1961. [Google Scholar]
  43. Morris, G.A.; Foster, T.J.; Harding, S.E. The effect of the degree of esterification on the hydrodynamic properties of citrus pectin. Food Hydrocoll. 2000, 14, 227–235. [Google Scholar] [CrossRef]
  44. Harding, S.E. The intrinsic viscosity of biological macromolecules. Progress in measurement, interpretation and application to structure in dilute solution. Prog. Biophys. Mol. Biol. 1997, 68, 207–262. [Google Scholar] [CrossRef]
  45. Kratky, O.; Porod, G. Röntgenuntersuchung gelöster Fadenmoleküle. Recl. Trav. Chim. Pays-Bas 1949, 68, 1106–1122. [Google Scholar] [CrossRef]
  46. Pavlov, G.M.; Korneeva, E.V.; Harding, S.E.; Vichoreva, G.A. Dilute solution properties of carboxymethylchitins in high ionic-strength solvent. Polymer 1998, 39, 6951–6961. [Google Scholar] [CrossRef]
  47. Ortega, A.; García de la Torre, J. Equivalent radii and ratios of radii from solution properties as indicators of macromolecular conformation, shape, and flexibility. Biomacromolecules 2007, 8, 2464–2475. [Google Scholar] [CrossRef]
  48. Bushin, S.V.; Tsvetkov, V.N.; Lysenko, E.B.; Emel’yanov, V.N. Conformational properties and rigidity of molecules of ladder polyphenylsiloxane in solutions according the data of sedimentation-diffusion analysis and viscometry. Vysokomol. Soedin. Ser. A 1981, 23, 2494–2503. [Google Scholar]
  49. Bohdanecky, M. New Method for Estimating the Parameters of the Wormlike Chain Model from the Intrinsic Viscosity of Stiff-Chain Polymers. Macromolecules 1983, 16, 1483–1492. [Google Scholar] [CrossRef]
  50. Ralet, M.C.; Crépeau, M.J.; Lefèbvre, J.; Mouille, G.; Höfte, H.; Thibault, J.F. Reduced number of homogalacturonan domains in pectins of an Arabidopsis mutant enhances the flexibility of the polymer. Biomacromolecules 2008, 9, 1454–1460. [Google Scholar] [CrossRef]
  51. Morris, G.A.; Ralet, M.C.; Bonnin, E.; Thibault, J.F.; Harding, S.E. Physical characterisation of the rhamnogalacturonan and homogalacturonan fractions of sugar beet (Beta vulgaris) pectin. Carbohydr. Polym. 2010, 82, 1161–1167. [Google Scholar] [CrossRef] [Green Version]
  52. Pavlov, G.M.; Harding, S.E.; Rowe, A.J. Normalized scaling relations as a natural classification of linear macromolecules according to size. In Progress in Colloid and Polymer Science; Springer: Berlin, Germany, 1999; Volume 113, pp. 76–80. [Google Scholar]
  53. Pavlov, G.M.; Rowe, A.J.; Harding, S.E. Conformation zoning of large molecules using the analytical ultracentrifuge. TrAC Trends Anal. Chem. 1997, 16, 401–405. [Google Scholar] [CrossRef]
  54. Gadalla, H.H.; El-Gibaly, I.; Soliman, G.M.; Mohamed, F.A.; El-Sayed, A.M. Amidated pectin/sodium carboxymethylcellulose microspheres as a new carrier for colonic drug targeting: Development and optimization by factorial design. Carbohydr. Polym. 2016, 153, 526–534. [Google Scholar] [CrossRef]
  55. Teja, S.P.S.; Damodharan, N. 23 Full Factorial Model for Particle Size Optimization of Methotrexate Loaded Chitosan Nanocarriers: A Design of Experiments (DoE) Approach. BioMed Res. Int. 2018, 2018, 7834159. [Google Scholar] [CrossRef] [PubMed] [Green Version]
  56. Mao, Y.; Millett, R.; Lee, C.S.; Yakubov, G.; Harding, S.E.; Binner, E. Investigating the influence of pectin content and structure on its functionality in bio-flocculant extracted from okra. Carbohydr. Polym. 2020, 241, 116414. [Google Scholar] [CrossRef] [PubMed]
  57. Israel, L.L.; Lellouche, E.; Kenett, R.S.; Green, O.; Michaeli, S.; Lellouche, J.P. Ce3/4+ cation-functionalized maghemite nanoparticles towards siRNA-mediated gene silencing. J. Mater. Chem. B 2014, 2, 6215–6225. [Google Scholar] [CrossRef] [PubMed]
  58. Urias-Orona, V.; Rascón-Chu, A.; Lizardi-Mendoza, J.; Carvajal-Millán, E.; Gardea, A.A.; Ramírez-Wong, B. A novel pectin material: Extraction, characterization and gelling properties. Int. J. Mol. Sci. 2010, 11, 3686–3695. [Google Scholar] [CrossRef] [Green Version]
  59. Wang, J.H.; Luo, J.P.; Yang, X.F.; Zha, X.Q. Structural analysis of a rhamnoarabinogalactan from the stems of Dendrobium nobile Lindl. Food Chem. 2010, 122, 572–576. [Google Scholar] [CrossRef]
  60. Li, D.-Q.; Jia, X.; Wei, Z.; Liu, Z.-Y. Box–Behnken experimental design for investigation of microwave-assisted extracted sugar beet pulp pectin. Carbohydr. Polym. 2012, 88, 342–346. [Google Scholar] [CrossRef]
  61. Morris, G.A.; Ralet, M.C. The effect of neutral sugar distribution on the dilute solution conformation of sugar beet pectin. Carbohydr. Polym. 2012, 88, 1488–1491. [Google Scholar] [CrossRef] [Green Version]
  62. Morris, G.A.; Patel, T.R.; Picout, D.R.; Ross-Murphy, S.B.; Ortega, A.; Garcia de la Torre, J.; Harding, S.E. Global hydrodynamic analysis of the molecular flexibility of galactomannans. Carbohydr. Polym. 2008, 72, 356–360. [Google Scholar] [CrossRef] [Green Version]
  63. Paniagua, C.; Posé, S.; Morris, V.J.; Kirby, A.R.; Quesada, M.A.; Mercado, J.A. Fruit softening and pectin disassembly: An overview of nanostructural pectin modifications assessed by atomic force microscopy. Ann. Bot. 2014, 114, 1375–1383. [Google Scholar] [CrossRef] [Green Version]
  64. Santos, E.E.; Amaro, R.C.; Bustamante, C.C.C.; Guerra, M.H.A.; Soares, L.C.; Froes, R.E.S. Extraction of pectin from agroindustrial residue with an ecofriendly solvent: Use of FTIR and chemometrics to differentiate pectins according to degree of methyl esterification. Food Hydrocoll. 2020, 107, 105921. [Google Scholar] [CrossRef]
  65. Yamada, H.; Kiyohara, H. Complement-activating polysaccharides from medicinal herbs. Immunomodul. Agents Plants 1999, 161–202. [Google Scholar] [CrossRef]
  66. Kpodo, F.M.; Agbenorhevi, J.K.; Alba, K.; Oduro, I.N.; Morris, G.A.; Kontogiorgos, V. Structure-Function Relationships in Pectin Emulsification. Food Biophys. 2018, 13, 71–79. [Google Scholar] [CrossRef] [PubMed] [Green Version]
  67. Buergy, A.; Rolland-Sabaté, A.; Leca, A.; Renard, C.M.G.C. Pectin modifications in raw fruits alter texture of plant cell dispersions. Food Hydrocoll. 2020, 107, 105962. [Google Scholar] [CrossRef]
  68. Deng, L.Z.; Pan, Z.; Zhang, Q.; Liu, Z.L.; Zhang, Y.; Meng, J.S.; Gao, Z.J.; Xiao, H.W. Effects of ripening stage on physicochemical properties, drying kinetics, pectin polysaccharides contents and nanostructure of apricots. Carbohydr. Polym. 2019, 222, 114980. [Google Scholar] [CrossRef]
Figure 1. The Pareto (A), main effects (B) and interaction plots (C) for the effect of different extraction conditions on the intrinsic viscosity of melon pectin. In the Pareto plot (A), the larger the bar the greater the influence of each parameter, and values larger than 2.306 (indicated by the dashed red line) are statistically significant. In the main effects plot (B), the steeper the slope the greater the magnitude of the main effect. In the interactions plot (C), the Y-axis scale is always the same for each combination of factors. When the lines are parallel, interaction effects are zero [57].
Polysaccharides 01 00002 g001
Figure 2. The Pareto (A), main effects (B) and interaction plots (C) for the effect of different extraction conditions on the molar mass of melon pectin. For further explanation of the individual plots, see Figure 1.
Polysaccharides 01 00002 g002
Figure 3. The Pareto (A), main effects (B) and interaction plots (C) for the effect of different extraction conditions on the translational frictional ratio (f/f0) of melon pectin. For further explanation of the individual plots, see Figure 1.
Polysaccharides 01 00002 g003
Figure 4. The main effects (A,C,E) and interaction plots (B,D,F) for the effect of different extraction conditions from left to right on the persistence length, mass per unit length and their ratio (Lp/ML) for melon pectin. Pareto plots not shown for clarity. For further explanation of the individual plots, see Figure 1.
Polysaccharides 01 00002 g004
Figure 5. Normalised scaling plot of [η]wML versus Mn/ML (adapted from [52]) where Zone A: extra rigid rod; Zone B: rigid rod; Zone C: semi-flexible; Zone D: random coil and Zone E: globular or branched [52,53]. N. B. pectins D and E are almost overlapping. This a semi-empirical plot derived from the conformation data estimated for >80 polymers in the two articles by Pavlov, Harding and Rowe (1997, 1999) [52,53].
Polysaccharides 01 00002 g005
Scheme 1. The method used to calculate the mean side chain length and number for melon pectin.
Polysaccharides 01 00002 sch001
Figure 6. The main effects (A,C) and interaction plots (B,D) for the effect of different extraction conditions from left to right on the length and number of side chains for melon pectin. Pareto plots not shown for clarity. For further explanation of the individual plots, see Figure 1.
Polysaccharides 01 00002 g006
Figure 7. Principal component scores for pectin extracted from Cucumis melo Inodorus.
Polysaccharides 01 00002 g007
Table 1. Physical properties: molar mass (Mn), intrinsic viscosity ([η]w), frictional ratio (f/f0), mass-per-unit length (ML), persistence length (Lp) and Lp/ML for pectins extracted from Cucumis melo Inodorus.
Sample (Extraction Conditions)Mn (g/mol)[η]w (mL/g)f/f0ML (g/mol nm)Lp (nm)Lp/ML (nm2 mol/g)
A (pH 1, 2 h, 60 °C)610,000 b1160 a,b9 a,b760 a9 b0.012
B (pH 3, 2 h, 60 °C)570,000 b770 b,c8 a,b,c660 a17 a,b0.022
C (pH 1, 2 h, 80 °C)405,000 b1110 a,b,c9 a,b750 a35 a,b0.048
D (pH 3, 2 h, 80 °C)580,000 b650 b,c7 b,c610 a13 b0.018
E (pH 1, 4 h, 60 °C)520,000 b790 b,c8 a,b,c475 a9 b0.018
F (pH 3, 4 h, 60 °C)2,000,000 a650 b,c7 b,c690 a5 b0.007
G (pH 1, 4 h, 80 °C)115,000 b1580 a10 a275 a54 a0.295
H (pH 3, 4 h, 80 °C)680,000 b360 c6 c770 a9 b0.012
Means of each physical property followed by different letters in the same column are significantly different (p ≤ 0.05).
Table 2. The mean length and number of side chains for pectins extracted from Cucumis melo Inodorus.
SampleHG: RG-IHG
Mn (g/mol)
HG
ML (g/mol nm)
RG-I
Mn (g/mol)
RG-I
ML (g/mol nm)
a Mean Side Chain Lengtha Mean Number of Side Chains
A0.3140,000367470,0008875800
B0.6205,000368370,0008314850
C0.390,000368315,0008764450
D1.1300,000371280,00014949180
E0.3135,000363390,00051621590
F0.5725,0003731,300,00086851850
G0.745,00036570,0004722260
H1.1370,000372315,00012287300
a in order to determine the degree of number and degree of branching, knowledge of the mass per unit length, HG: RG-I ratio [24], number average molecular weight, degree of methyl esterification and the average mass of side chain sugar residue are required. The monosaccharide composition and degree of methylation has been published in Tables 2 and 3 of our previous publication [24]. Furthermore, knowledge the degree of acetyl esterification can also be included if available.

