Article

Process Design and Optimization towards Digital Twins for HIV-Gag VLP Production in HEK293 Cells, including Purification

1
Institute for Separation and Process Technology, Clausthal University of Technology, Leibnizstr. 15, 38678 Clausthal-Zellerfeld, Germany
2
Faculty of Applied Natural Sciences, Technische Hochschule Köln, 51368 Leverkusen, Germany
*
Author to whom correspondence should be addressed.
Submission received: 10 January 2022 / Revised: 4 February 2022 / Accepted: 11 February 2022 / Published: 21 February 2022
(This article belongs to the Special Issue Towards Autonomous Operation of Biologics and Botanicals)

Abstract

:
Despite great efforts to develop a vaccine against human immunodeficiency virus (HIV), which causes AIDS if untreated, no approved HIV vaccine is available to date. A promising class of vaccines are virus-like particles (VLPs), which were shown to be very effective for the prevention of other diseases. In this study, production of HI-VLPs using different 293F cell lines, followed by a three-step purification of HI-VLPs, was conducted. The quality-by-design-based process development was supported by process analytical technology (PAT). The HI-VLP concentration increased 12.5-fold while >80% purity was achieved. This article reports on the first general process development and optimization up to purification. Further research will focus on process development for polishing and formulation up to lyophilization. In addition, process analytical technology and process modeling for process automation and optimization by digital twins in the context of quality-by-design framework will be developed.

1. Introduction

In more than twenty-five years of research, several candidate vaccines have been developed against the human immunodeficiency virus (HIV) that causes acquired immunodeficiency syndrome (AIDS), but they have proven ineffective [1,2]. Therefore, further vaccines need to be developed [2], and virus-like particles (VLPs) have shown promise as an approach for antigen presentation [3].
VLPs are multiprotein or membrane structures that mimic the organization and conformation of authentic viruses. However, unlike natural viruses, they lack the viral genome. Due to the absence of the viral genome, a VLP, unlike a virus, is replication-incompetent. Thus, the risk of infecting a recipient is avoided, making VLPs ideal vaccine candidates. Furthermore, the need for viral inactivation is eliminated [4].
Natural HIV-1 particles consist of the cleaved products of the three viral polyproteins Gag, Pol and Env. The particles are surrounded by a lipid layer and carry the RNA genomes within the Gag-formed capsid core. In mature HIV particles, the Gag protein is proteolytically cleaved into its subunits: matrix (MA), capsid (CA) and nucleocapsid (NC). In contrast, VLPs can be referred to as immature HIV-1-derived particles formed by uncleaved Gag precursor proteins surrounded by a host cell lipid layer [5].
Compared to soluble antigens, which need to be injected with adjuvants to induce a protective immune response, VLPs are able to elicit superior cellular and humoral responses [6,7]. Due to their repetitive structures and particulate natures, they are very efficiently taken up by antigen-presenting cells (APCs). This stimulates both a humoral and a cellular immune response [5].
VLPs are produced using different types of expression systems. These include bacterial, yeast, insect, mammalian and plant cells. Large-scale approaches for the production of HIV-1-Gag VLPs exist, so far, mainly for the baculovirus expression system [8,9,10,11].
Production of VLPs in mammalian cells is associated with lower productivity yet is capable of producing more complex enveloped VLPs such as HIV-1-Gag VLPs [12]. Human embryonic kidney 293 cells (HEK293) are particularly suitable because they are easy to genetically manipulate, can grow in suspension cultures and can reach high cell densities [13]. In addition, these 293F suspension cells are already established for the production of many virus-based products such as viral vaccines and most viral vectors in the industry [14,15,16,17]. Furthermore, 293 cells are rapidly being accepted in the industry because they have been approved by the FDA and EMA for the production of the first adenovirus-based gene therapy product (Gendicine®) in China and a therapeutic recombinant protein (Xigris®) [13].
Despite the many advantages of mammalian cells as an expression system for HIV-derived VLPs, few production methods have been described in the literature [2,18], especially for suspension cultures [13].
As enveloped nanoparticles, HIV-based VLPs require special requirements for the downstream process conditions due to their sensibility regarding shear stress, pH and osmotic pressure when compared to nonenveloped nanoparticles [5]. Harvest at lab-scale is usually performed by low-speed centrifugation, which comes with the risk of product loss [19]. As an alternative, depth filtration has often been applied, as it offers the advantage of established scale-up methodologies and poses low risk to product retention if cut-offs are chosen appropriately [20].
Isolation and first purification during early cell line optimization at lab-scale is often achieved by ultracentrifugation. This difficult-to-scale-up technique often requires several up to dozens of hours of process time, and product sampling is challenging if yield loss is to be avoided. To date, either UF/DF, followed by AEXC or direct AEXC, is the most chosen purification approach [21]. Performing UF/DF prior to AEXC offers the advantages of fast concentration and quick change to more stable buffer conditions while significantly reducing the load of side components. Special attention, however, needs to be attributed towards shear stress, which is why hollow fiber modules are often preferred in this process stage for enveloped viruses [2]. Early work on ATPE for HIV-derived VLP purification has been published by Jacinto et al. [22], who demonstrated batch-scale ATPE optimization based on microfluidic devices for HIV-VLP separation, as well as by Turpeinen et al. [23], who developed a process for continuous purification of an enveloped viral particle utilizing a 15 mL scale settler.
AEXC weak and strong AEX resins as well as membrane adsorbers and monoliths have been investigated in the literature [24]. A summary of chromatography purification studies can be found in the work of Segura et al. [25].
AEXC is, in most cases, followed by either a subsequent UF/DF or SEC for desalting/buffer exchange as well as for improving purity. Recently, Gonzales-Dominiguez at al. published a purification framework consisting of harvest by depth filtration, purification by AEXC, desalting by SEC and subsequent storage by lyophilization [26].
Quality-by-design (QbD) methods are required by regulatory authorities and are becoming the standard in biopharmaceutical process development. QbD-based process development can be used to establish causality between process parameters and relevant product quality characteristics. The holistic QbD approach can ensure consistent product quality from development to piloting to production [27,28]. QbD is based on a validated design space in which consistent quality can be ensured to avoid out-of-specification (OOS) batches [27,29]. The design space can be spanned by experiments or rigorous process models. The workflow for developing a QbD process is shown in Figure 1 [30,31].
CQAs are the basis for further process development and must be dynamically adapted as new knowledge about the process or product is gained. They are obtained through experiments and risk management [32,33]. The definition of the design space that follows the risk analysis is traditionally conducted experimentally. Design-of-experiments (DoE) methods are usually used to reduce the experimental effort [34]. The final steps of QbD-based process development are the development of a process analytical technology (PAT)-supported control strategy and continuous improvement [32,35]. Process analytical technology is not limited to in-line analytics, but by integrating it into the QbD concept, it enables process control to generate real-time release tests (RTRTs). These enable a reduction in the effort required for quality assurance and, at the same time, ensure sufficient product quality [36].
In bioprocesses, process parameters such as cell density, product concentration and nutrient concentration are currently determined by sampling from the bioreactor and offline analysis, such as size exclusion chromatography or infrared spectroscopy [36,37,38,39,40,41,42,43]. Evidence of the feasibility of RTRT through online PAT tools is still pending. This leads to multiparameter optimizations and a significant experimental effort [36].
One of the most widely used concepts for advanced process control is model predictive control (MPC) [44,45,46,47,48]. These MPCs manipulate the input variables to match the desired setpoints while maintaining critical process constraints. This is conducted by using process model optimization routines that predict future process behavior for the next time frame [49,50]. Common drawbacks of these models are that the model results, over time, deviate from the actual plant data due to aging, fouling or blockage phenomena or the summation of prediction errors in cyclic processes [51]. This is usually remedied by updating the internal model states, e.g., concentrations, with real plant data [52]. This real-time plant data must be obtained via potentially time-consuming and invasive offline analytics if PAT tools are not implemented, resulting in a gap between actual process data and analytics [53,54]. This gap poses not only the risk of a mismatch between the current process state and the model but also a general mismatch between the current process and the process analytics that prevent data-driven process decisions, especially for continuous processes. Implementing an advanced control strategy requires sensors, in-line or at-line analytics, to be selected in early process development. Initially, in-line studies naturally started with the first unit, cultivation, either in fed-batch or perfusion mode, with a wide range of applications [36,55,56,57,58,59]. For example, Raman, Fourier-transformed infrared (FTIR) or fluorescence spectroscopy or recording spectra using a diode array detector (DAD) can be used. It should be noted that the presence of too many minor components can reduce the detection accuracy [60], which is why the combination of several spectroscopic techniques was proposed to improve the detection accuracy [61]. The PAT approaches presented above can be used in combination with a digital twin for advanced process control and in-line process optimization [36,62]. Moreover, PAT can compensate inaccuracies of the model by providing additional measurement data [36].
Therefore, the aim of this study was to develop a process optimized with respect to cell number and product concentration for the production of HIV-VLPs in human suspension 293F cells. For this purpose, a concept for cell separation and product purification as well as concentration by a combination of ultra- and diafiltration (UF/DF), followed by anion exchange chromatography, was developed, as shown in Figure 2. To demonstrate QbD-based development, including the provision of real-time control strategies, spectroscopic technologies were investigated for their suitability for process monitoring and control.

2. Materials and Methods

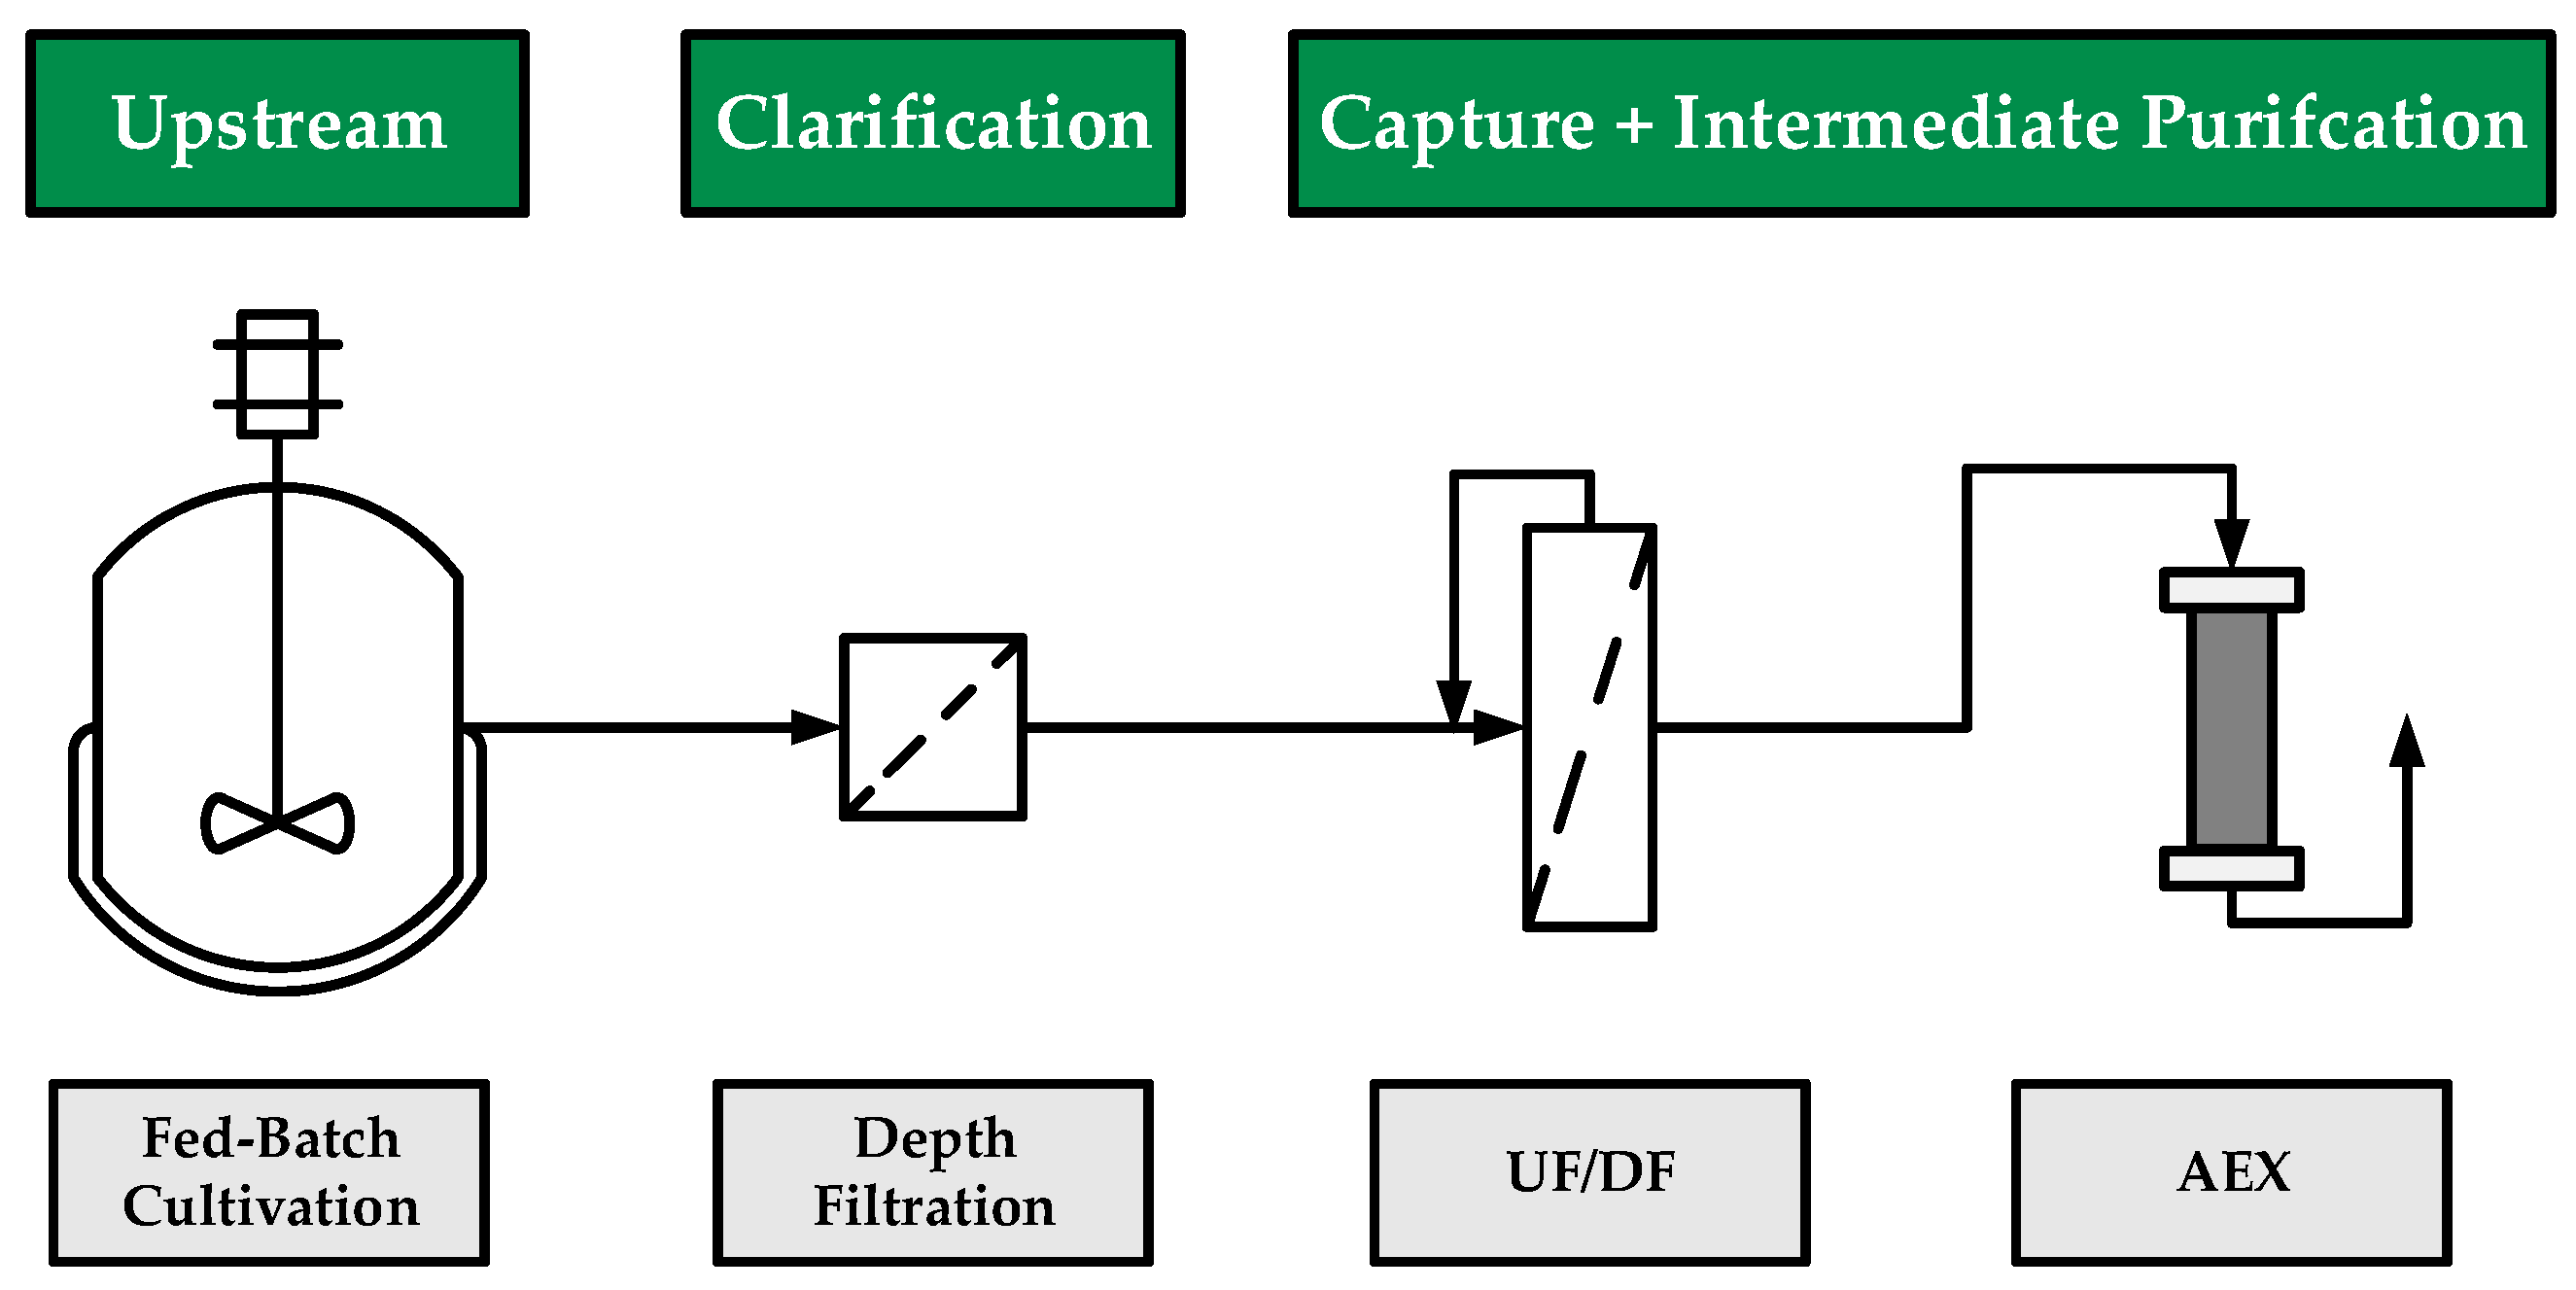
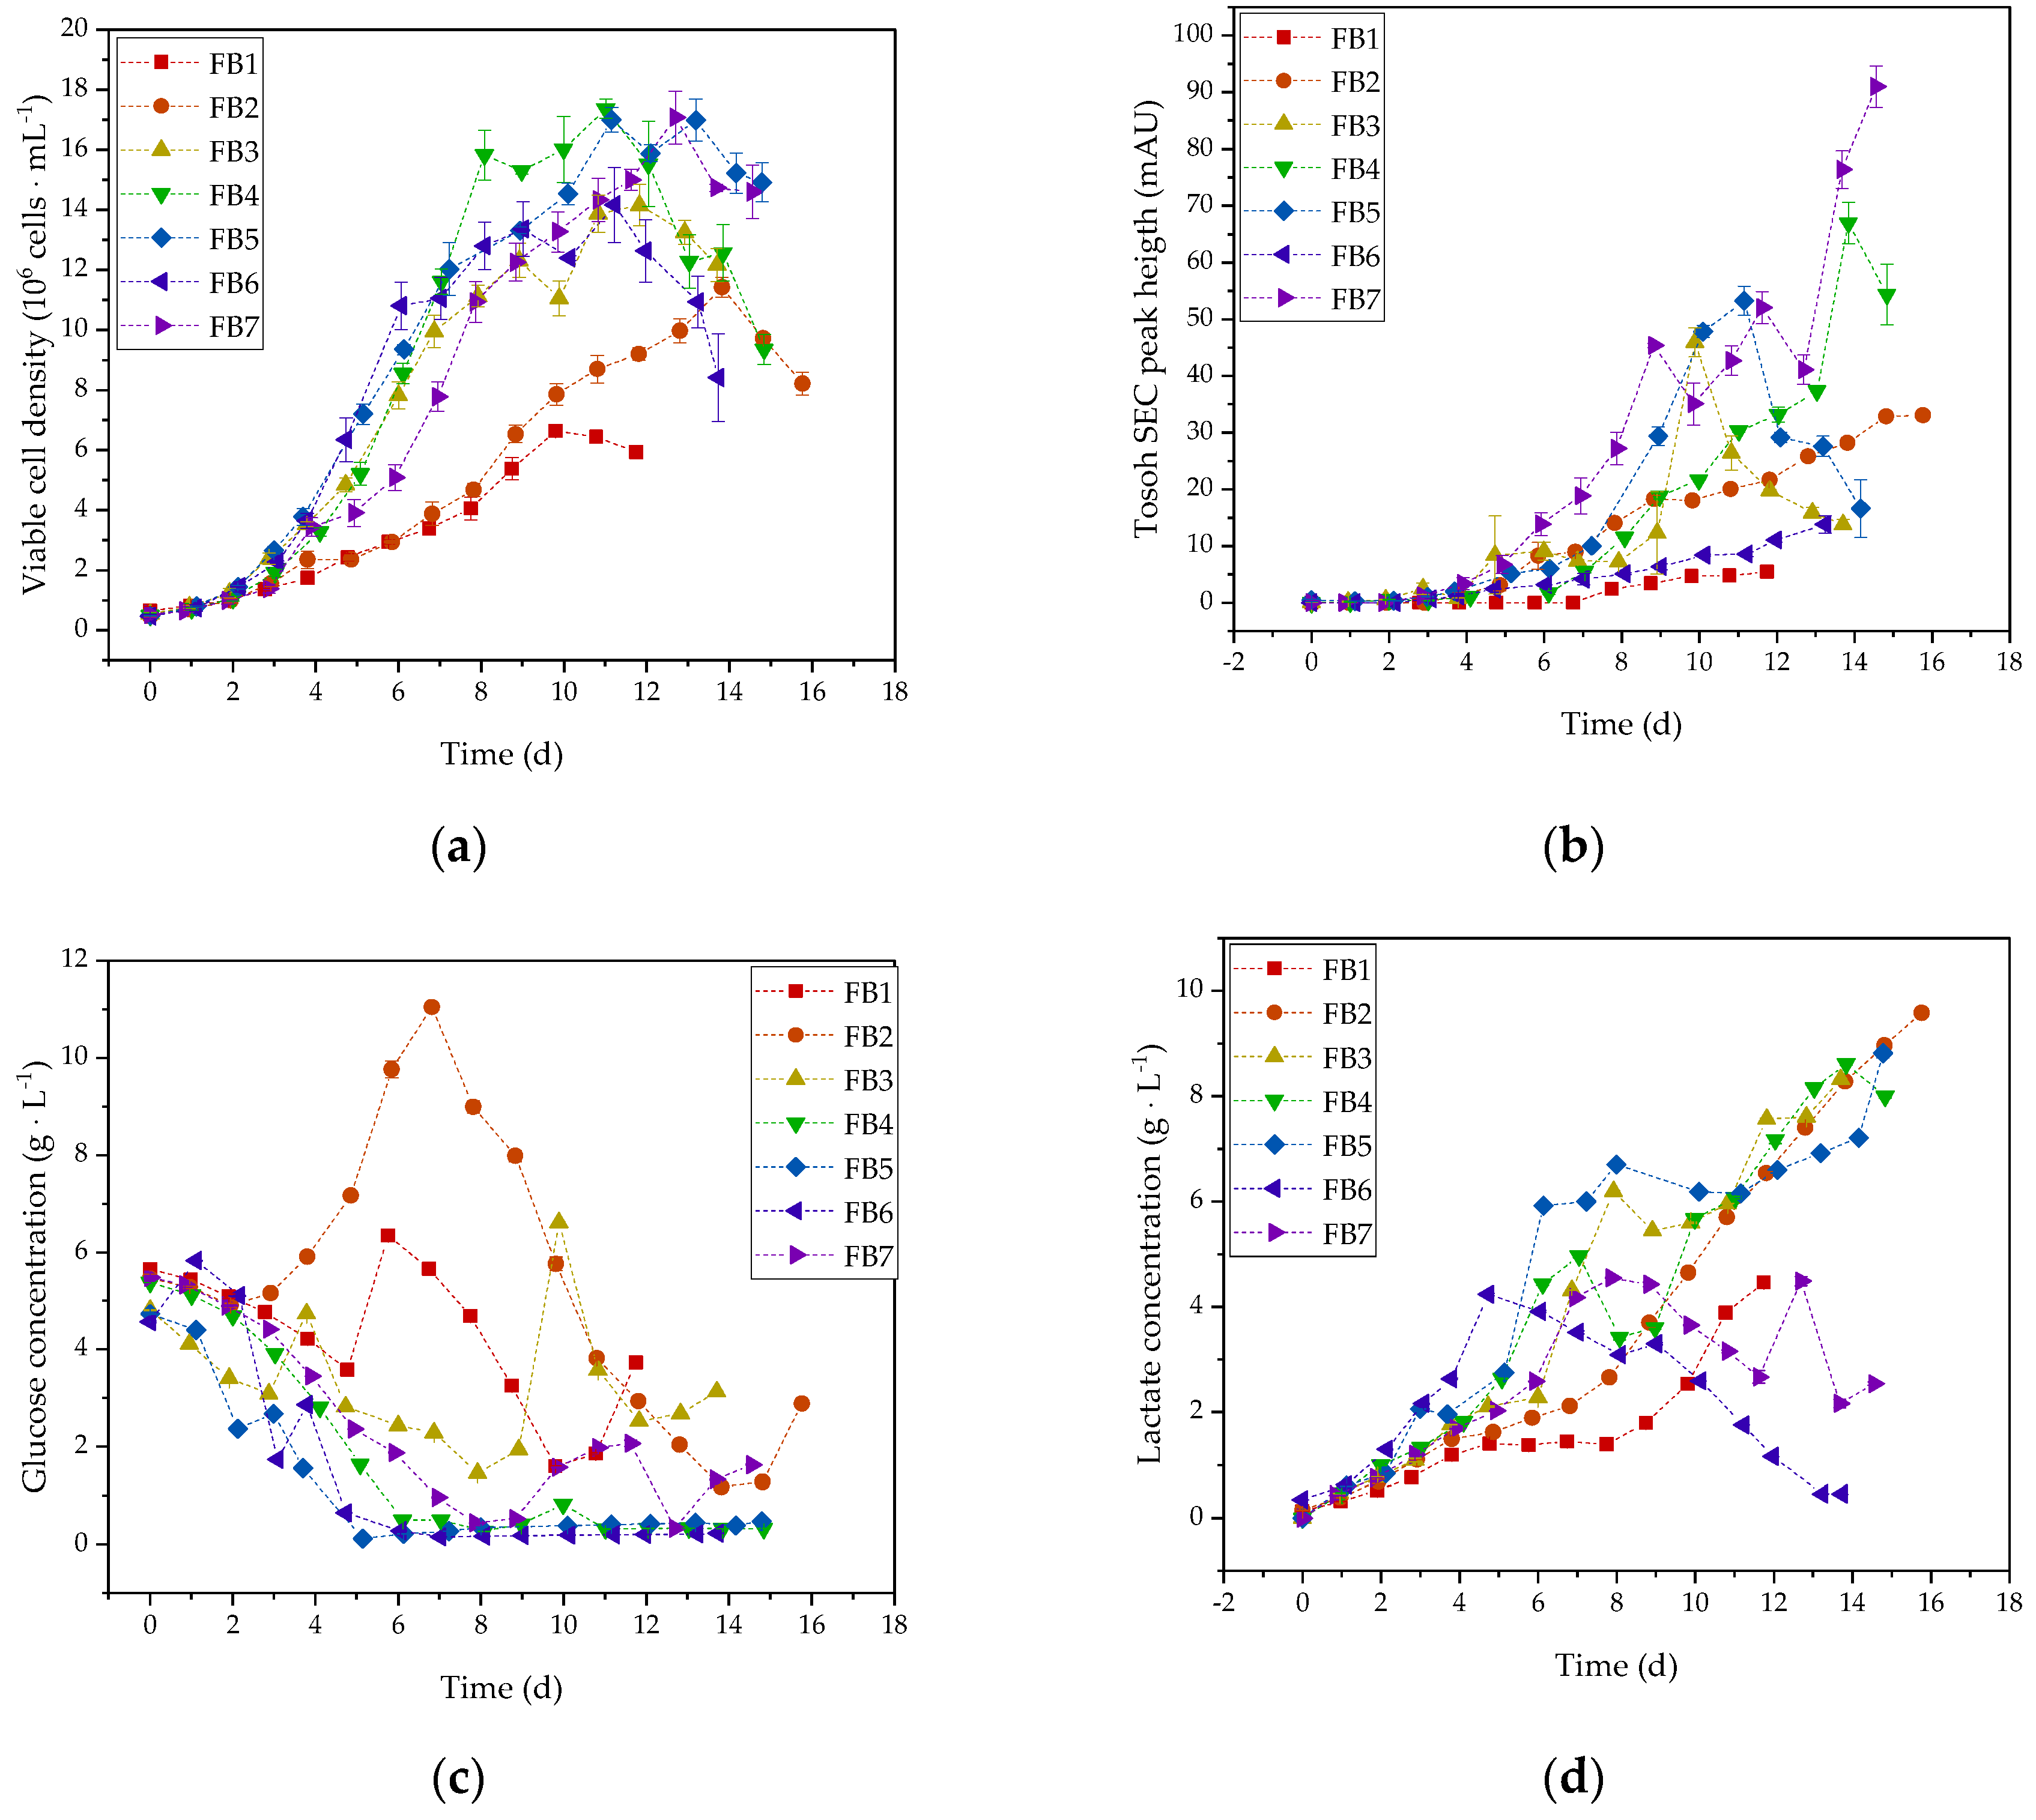
2.1. Fed-Batch Cultivation

Three different stable recombinant producer cell lines were used: 293FwtGag cells, which express Gag precursor proteins derived from the HIV-1 molecular clone NL4.3, 293FMos1.Gag cells, which produce Gag proteins composed of mosaic epitopes originating from different HIV-1 variants, and 293FMos1.Gag/Mos2S.Env, which coexpress mosaic Env proteins [6,63,64].
The cells were cultured in a 2 L glass bioreactor at 37 °C, pH 7.1, 60% relative oxygen saturation based on air saturation. A segmented three-blade impeller with a blade pitch of 30° was used as the stirrer, which was operated constantly at 433 rpm. Cell concentration was determined once a day using the trypan blue exclusion method and a CEDEX XS (Roche Holding, Basel, Switzerland) for automated counting of the cells. Glucose and lactate concentrations were determined daily from clarified cell culture samples by enzymatic measurement using a LaboTRACE Compact (TRACE Analytics GmbH, Braunschweig, Germany). Feeding was started after 3–4 days when the glucose concentration had dropped to <2 g/L. Different base and feed media, as well as different feeding strategies regarding glucose addition, were tested during the optimization of the cultivation as detailed in Table 1.

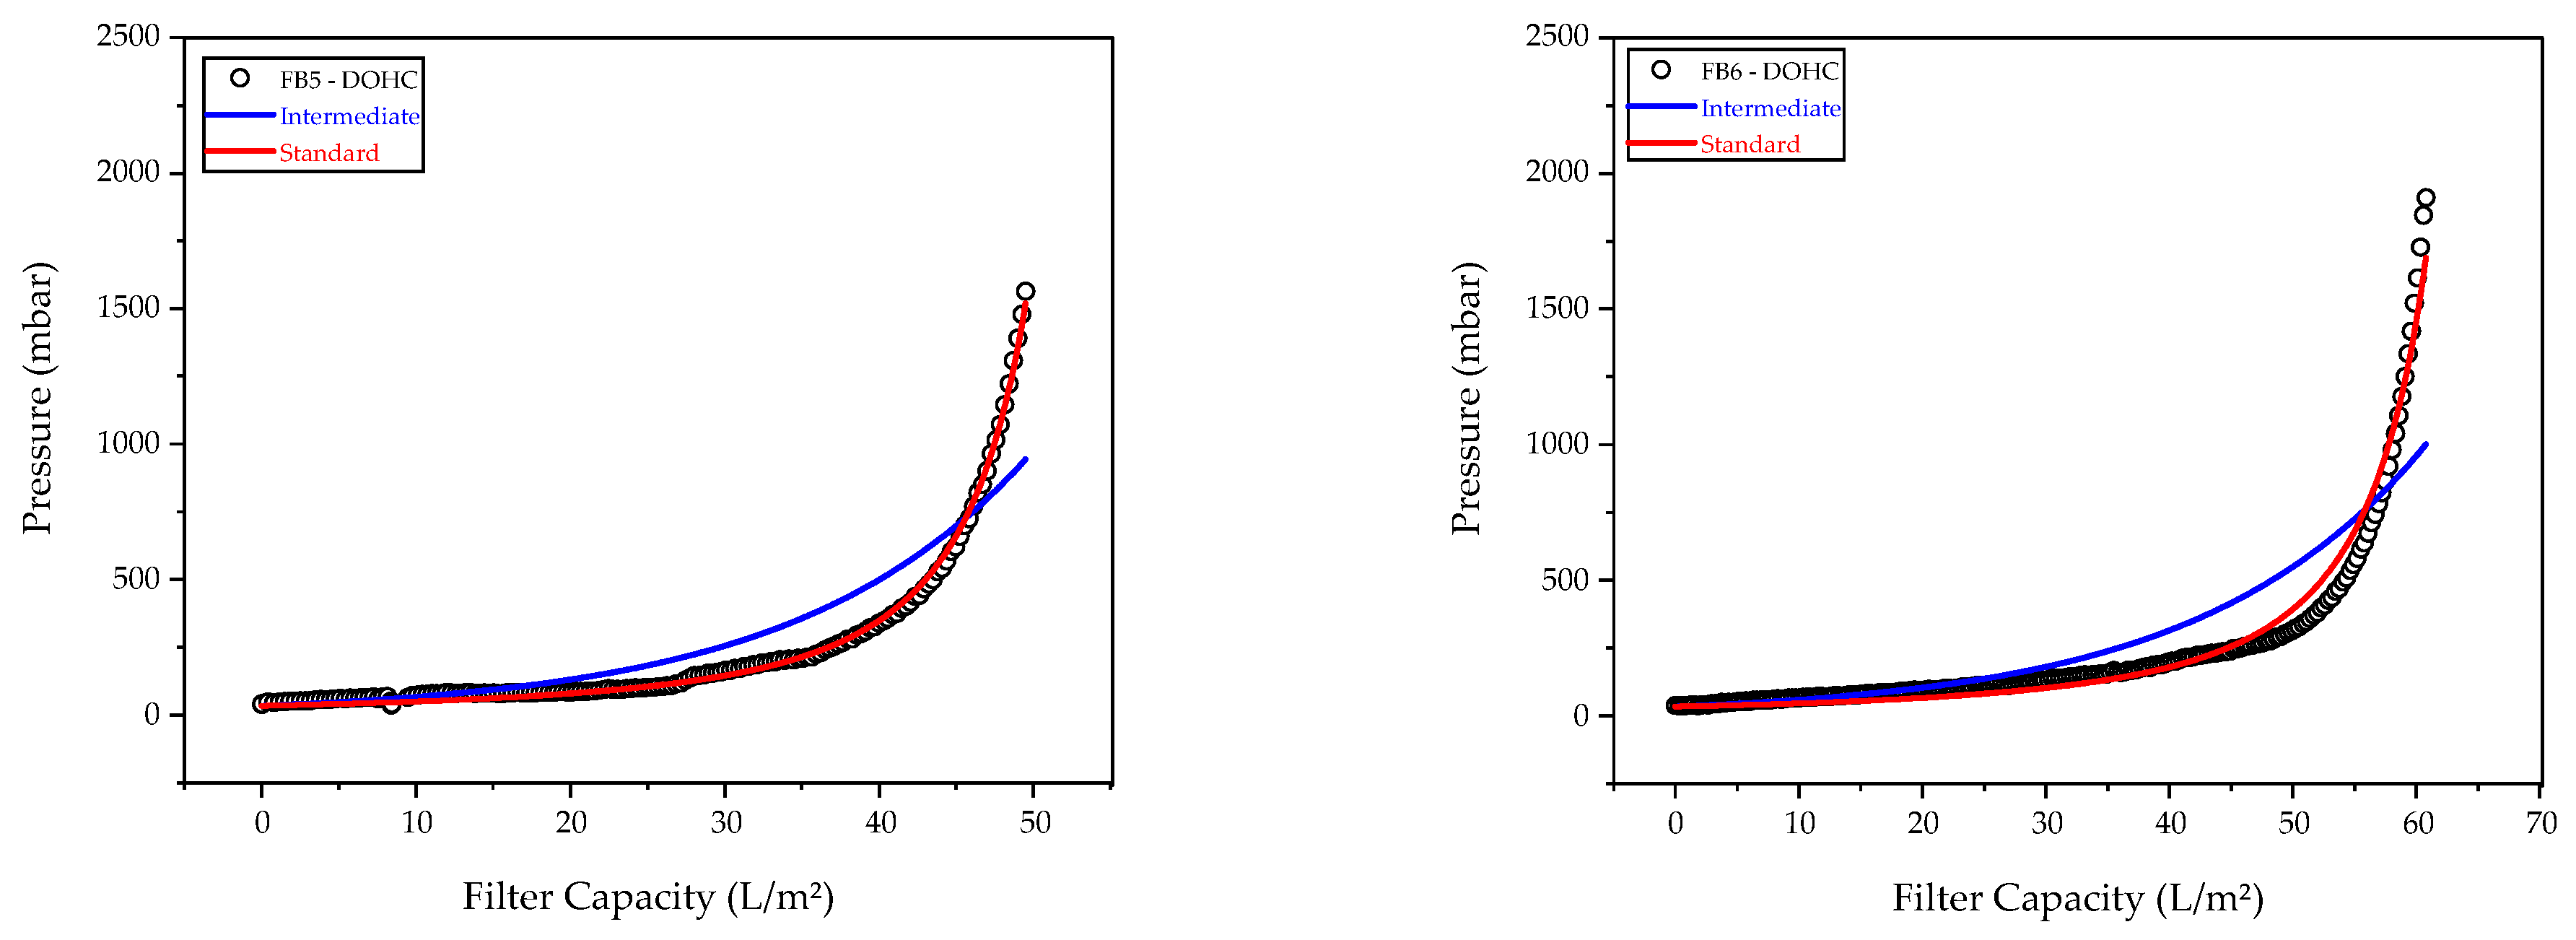
2.2. Depth Filtration

Cell separation and initial purification of the product were performed using depth filters having different pore sizes. All filters used, including cut-off and manufacturer, can be found in Table 2.
The depth filtration section consisted of a LaPrep P130 HPLC pump (VWR International GmbH, Radnor, PA, USA) and one, two or three depth filters connected in series. Pressure sensors were installed upstream and downstream of the filters. The flow rate was measured using a mass flow controller. The pump was controlled using a PID-controller in LabVision software to achieve a constant LMH of 60 L·m−2·h−1., and the fermentation broth was continuously stirred using a magnetic stir plate to prevent the cells from settling during the experiment. Filters were flushed with water according to the manufacturer’s instructions before use.

2.3. Ultra- and Diafiltration

Initial product purification and subsequent concentration were conducted using a Sartorius SARTOFLOW® Slice 200 benchtop system (Sartorius, Göttingen, Germany) and a hollow fiber module with a pore size of 0.05 µm (MIDIKROS 20 cm 0.05 µm PS 0.5 mm; Repligen Corporation, Waltham, MA, USA). The starting medium was the fermentation broth harvested at the end of the fed-batch cultivations, which was pooled and, in some cases, already prepurified by centrifugation at 500 g or by depth filtration (see Section 3.2). The obtained solution was filtered using the Millistark+ DOHC depth filter (Merck KGaA, Darmstadt, Germany) before performing UF/DF. First, a concentration was performed and a sample of the permeate was taken to track any possible product loss. Then, a buffer change was performed using seven diafiltration volumes, corresponding to a residual salt content of 0.8%, to the Tosoh SEC buffer. The experiments were carried out according to a three-stage experimental design (Table 3), with 350 mL serving as the initial volume in each case. The transmembrane pressure, the flow rate and the concentration factor were varied.

2.4. Anion-Exchange Chromatography

After concentration and diafiltration, the product phase was loaded onto two anion exchange columns without further sample preparation. Screening and fractionation were performed on a weak anion exchange resin (Fractogel® DEAE, Merck KGaA, Darmstadt, Germany) and a strong anion exchange resin (POROS™ GoPure™ HQ, Thermo Fisher Scientific Inc., Waltham, MA, USA). For the step elution assay, both columns were equilibrated with 10 column volumes of 95% mobile phase A (50 mM 2-(4-(2-hydroxyethyl)-1-piperazinyl)-ethanesulfonic acid (HEPES), pH 7.2) and 5% mobile phase B (50 mM HEPES, 2000 mM NaCl, pH 7.2), resulting in a concentration of 100 mM NaCl as equilibration condition. 1 mL (1 CV) of UF/DF product was injected for screening, while 5 mL (5 CV) was loaded for preparative fractionation experiments. Elution was performed in steps of 300 (15% MPB), 700 (35% MPB), 900 (45% MPB), 1200 (60% MPB) and 2000 mM NaCl (100% MPB), with a holding time of 10 CV each. After elution, re-equilibration was performed for another 10 CV. The flow rate was set to 1 CV/min, resulting in a total procedure time of 70 min. After each elution, sanitization was performed with 1 M NaOH for at least 10 CV. For fractionation, UV extinction was observed at 280 nm. In addition, UV absorbance at 260 nm was recorded as a complementary wavelength. Fractions from the flowthrough (FT) and each elution step (E1 to E5) were sampled. The methodology is based on work published by Pereira Aguilar et al. [65] and González-Domínguez et al. [26].

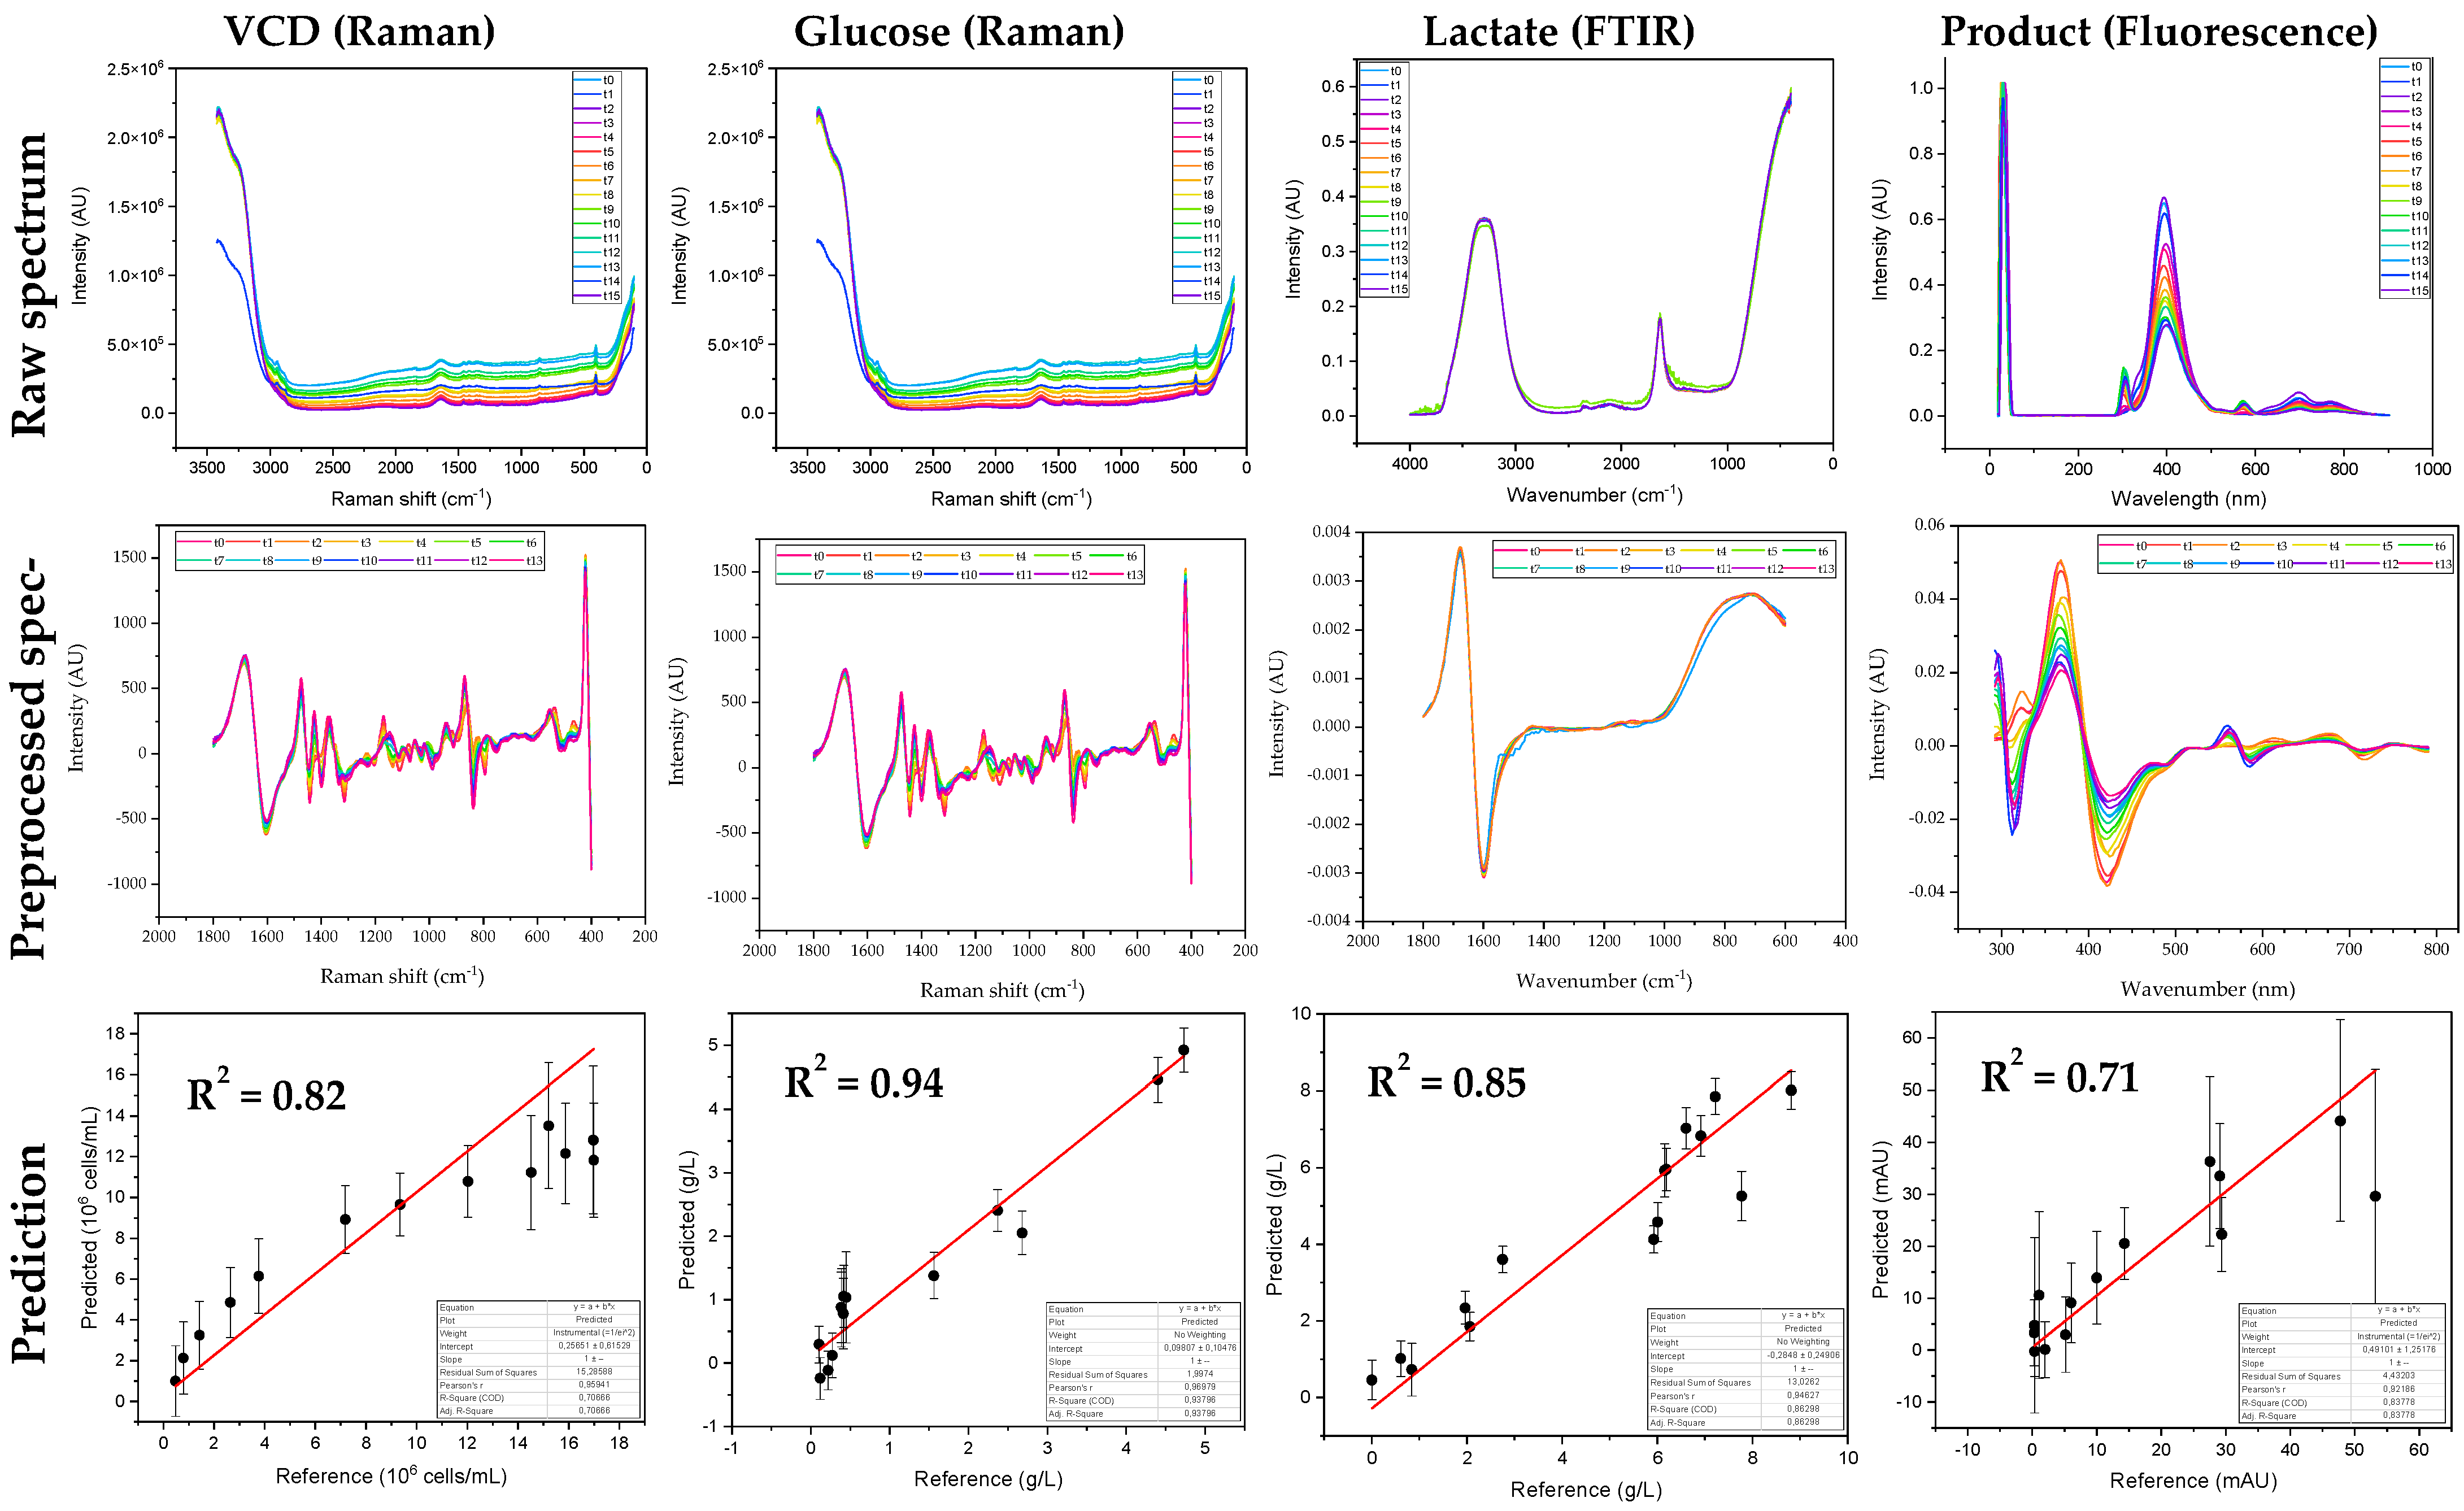
2.5. Processing of Spectral Data

The spectra were processed and analyzed using Unscrambler® X (Camo Analytics AS, Oslo, Norway). The raw spectra were analyzed using descriptive statistics to determine an appropriate preprocessing strategy. An important tool was the scattering effect plot, which plots the spectra against the mean spectrum and shows the type of distortion effects present in the spectra. Preprocessing was adjusted to the effects that occur, such as additive and multiplicative effects, to extract the maximum information content. Elimination of additive effects was conducted by deriving the spectra, performing the first derivation. Multiplicative effects were removed by applying the standard normal variant (SNV) method. If both effects occurred, both approaches were combined, with a derivation first and then the SNV applied to the spectra. To minimize noise, the number of smoothing points during the derivation was dynamically adjusted to the degree of noise. The pretreated spectra were then used to correlate changes in concentrations with changes in spectral intensity in specific spectral regions using partial least squares regression (PLSR). A detailed description of the basics of PLSR was published by Esbensen et al. [66]. In the regression, the number of main components was limited to a maximum of 5 factors to prevent overfitting of the data. Using the spectral line loading plot, the score plot and the plot of the described variance against the number of principal components, the quality of the model was assessed.

2.6. SEC Analysis

Size exclusion chromatography was used for the product analysis. The TSKgel G5000PWXL (7.8 × 300 mm; 10 µm; Tosoh Bioscience LLC, Montgomeryville, PA, USA) was used for this purpose. Elution was isocratic at a flow rate of 0.2 mL·min−1, with the elution buffer consisting of 50 mM HEPES and 100 mM NaCl, which had a pH of 7.2.

2.7. p24 ELISA

p24 enzyme-linked immunosorbent assay (p24 ELISA) was performed for detection of VLP. The ELISA kit VPK-108-H (HIV p24 ELISA, 96 Assays) was purchased from BioCat GmbH (Heidelberg, Germany). The assay was performed according to the manufacturer’s instructions.

3. Results and Discussion

3.1. Optimization of Cultivation of HIV-Gag Producing 293F Cells

A total of seven fed-batch cultivations was performed. In the course of the cultivation experiments, different base media and feeds as well as feeding strategies were investigated with the aim of achieving a high VLP concentration as cost-effectively as possible. The viable cell concentration curves are shown in Figure 3.
The first cultivation experiments were performed with the base media PM (FB1) and SMD (FB2). These showed that SMD is more suitable for the cultivation of 293 cells. These results were consistent with previous experiments performed in shake flasks (not shown). SMD was thus further used as the primary base medium. The initial cultivation experiments (Cultivations 1–3) were fed daily such that the glucose concentration after feed addition was 6 g/L ± 0.5 g/L. In subsequent experiments, the glucose concentration after feed addition was reduced to 2.5–3 g/L, which allowed higher cell numbers to be achieved (Cultivations 4–7). Further cultivation experiments were aimed at reducing the feed addition and realizing part of the added glucose by feeding a 400 g/L glucose solution to make the process more cost-efficient while maintaining the same productivity. In combination with the HEK FS feed medium, the maximum live cell number concentration was 11.4 ± 0.3 million cells·mL−1. In the first cultivation, the cells grew until the ninth day, like those of the second cultivation, but then the death phase had already begun. By using the SMD medium and the HEK FS feed in Fermentations 3–5 and 7, the maximum live cell number concentration increased to 14.2 ± 0.7 million cells·mL−1 for the first cell line, to 17.4 ± 0.3 million cells·mL−1 for the second cell line and to 17.1 ± 0.9 million cells·mL−1 for the third cell line. At Fed-batch 6, only a live cell concentration of 14.2 ± 1.2 million cells·mL−1 was achieved with the Cell Boost 6 feeding solution. Based on the courses of glucose and glutamine concentrations, it can be concluded that the cells were overfed in the first two fermentations, because, here, the concentrations rose to a maximum of 11.0 ± 0.02 g·L−1 glucose and 5.1 ± 0.05 mM glutamine. By adjusting the feeding strategy to a glucose concentration in the medium of 2.5–3 g·L−1 glucose, the glucose and glutamine concentrations decreased to a minimum of 0.1 ± 0.004 g·L−1 glucose and 0.3 ± 0.006 mM glutamine, respectively, without hindering cell growth, thus allowing feed savings. A further advantage resulting from the lower glucose concentration is that the metabolism of the cells shifted towards lactate consumption.
In the context of QbD-based process development, process monitoring by means of process analysis technologies is in focus. Therefore, for the cultivation of HI-VLP producing 293F cells, a PAT concept should be developed, which allows the analysis of the main process parameters. For this purpose, four spectroscopic methods were investigated: Raman spectroscopy, FTIR spectroscopy, UV/Vis spectroscopy and fluorescence spectroscopy.
As part of the process development, PLS models were developed to predict the live cell count, glucose, lactate concentration and relative product concentration. First, a PAT model was created for the respective target variables based on the first cultivation. On the one hand, the model was used to predict the concentration in the subsequent cultivation; on the other hand, it was further trained with an increasing number of cultivations in order to cover a larger range of process conditions. The validation of the model was conducted by comparing the concentrations measured off-line with the predictions of the PLS model for the respective cultivation. Figure 4 shows an example of the prediction of Fed-batch 5 based on the PLS model trained from Fed-batch Cultivations 1–4. It was found that Raman spectroscopy was most suitable for the prediction of live cell count as well as glucose concentration, with R² values 0.82 and 0.94, respectively. For the prediction of lactate concentration, FTIR was slightly more suitable than Raman spectroscopy, with an R2 of 0.85. Product concentration could be predicted sufficiently well using fluorescence spectroscopy, with an R2 of 0.71. UV/Vis spectroscopy was not sufficiently suited for the prediction of either of the analyzed process parameters.
The prediction of VCD and glucose concentration for the cultivation of CHO cells is widely described in the literature. The results presented here show that this procedure is also transferable to the cultivation of HEK293 cells. Lactate concentration is an important process variable, as lactate accumulation inhibits cell growth. In the context of cultivation optimization (see Figure 3d), lactate accumulation could be prevented by adjusting the feeding strategy. Prediction by FTIR spectroscopy is able to detect and predict broad concentration ranges of lactate.

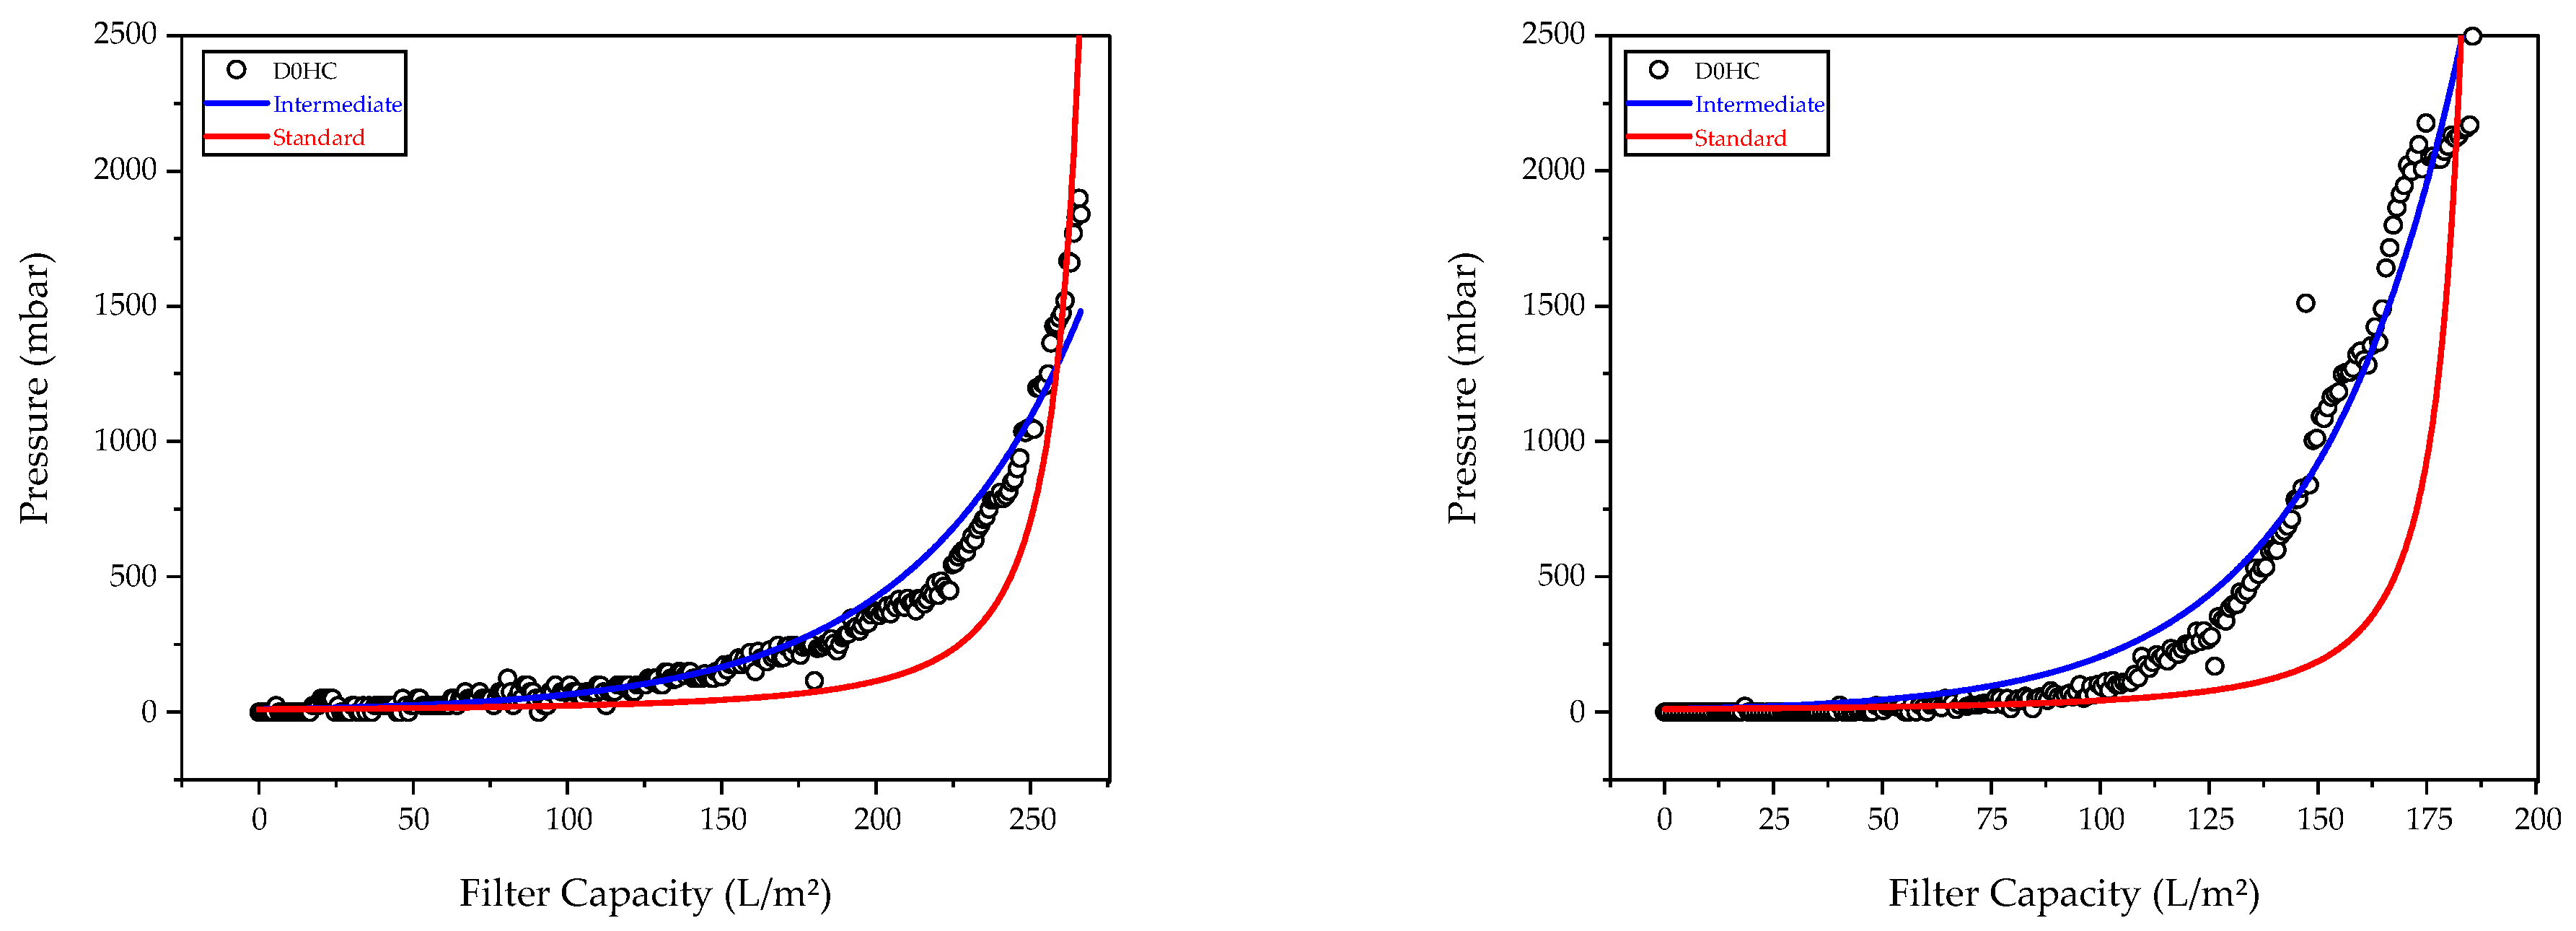
3.2. Characterization of Harvest via Depth Filtration

For distinct and quantitative depth filter characterization, a selection of appropriate depth filter media was investigated. The main optimization criterion was filter capacity for economic and cost reasons as well as to avoid unnecessary product dilution due to pre- and postflush volumes. Usually, four distinct blocking mechanism models are used to explain the increase in pressure during constant flux filtration: complete, standard and intermediate blockage, as well as cake formation. In this work, filter media from Merck Millipore (Billerica, MA, USA)were investigated and characterized in terms of filter capacity and blocking behavior.
Graphical representation of these four blocking models is shown in the following in detail in the example of FB5 harvest by Millistak®+D0HC filter media (Merck Millipore, Billerica, MA, USA), which is shown in Figure 5. On first sight, cake filtration (Figure 5c, bottom right) was not able to qualitatively describe the pressure rise. This was expected, as the cultivation fluid is a polydispersed mixture ranging from 100 to 200 nm sized HIV-1-derived VLPs, exosomes, etc., up to approx. 15–60 µm sized bioparticles, such as cells, cell agglomerates and precipitates. Therefore, no single, monodispersed, nondeformable particle shape should be present to form a cake layer as dominant filtration resistance.
Other than cake filtration, each blocking model is linked to a conceivable phenomenon, e.g., in the case of complete blocking, particles in same size range as or slightly larger than the filter pores gradually block entire pores. The filter media discussed here was composed of two different media grades: a cellulose layer with a filter rating of 5–8 µm (Millistak®+CE25) prior to a combination of filter aid material (diatomaceous earth) and a cellulose layer with a filter rating of 0.6–1 µm (Millistak®+DE40). For such heterogenous filter material, a complete blocking mechanism was unlikely. The two remaining blocking models, standard and intermediate, were investigated in more detail. Best regression achieved with both models for FB5 and FB6 are shown in Figure 6.
The standard blocking model could very accurately describe the observed filter resistance with adj. R2 of 0.997 (FB5) and 0.975 (FB6), while the intermediate model failed to predict the quick pressure rise prior to total filter blocking (see Table 4 and Figure 6). Although filter capacities of down to 50 L/m2 are within specification of Millistak®+D0HC [67], potential benefits by preclarification were investigated.
In contrast to direct harvest filtration described above, the same filter media now showed a clear intermediate blocking behavior, instead of the standard mechanism, while also achieving much higher filter capacities of up to 260 L/m2, as desired (Figure 7). While in the case of direct filtration of FB5 and FB6, particles must be present, leading to the fouling of much larger pores [68], here, the intermediate blocking phenomenon suggested that a combination of cake and complete blocking was observed. This was probably attributable to exosome and VLP agglomerates and other particles that were within the 5–8 µm (Layer 1) or 0.6–1 µm (Layer 2) filter rating size ranges.
The achieved regression efficiency was very high in the case of intermediate blocking, with adj. R² of 0.948 (PC1) and 0.976 (PC2), as summarized in Table 5. The difference in filter capacities for PC1 and PC2 was caused by different particle loads.

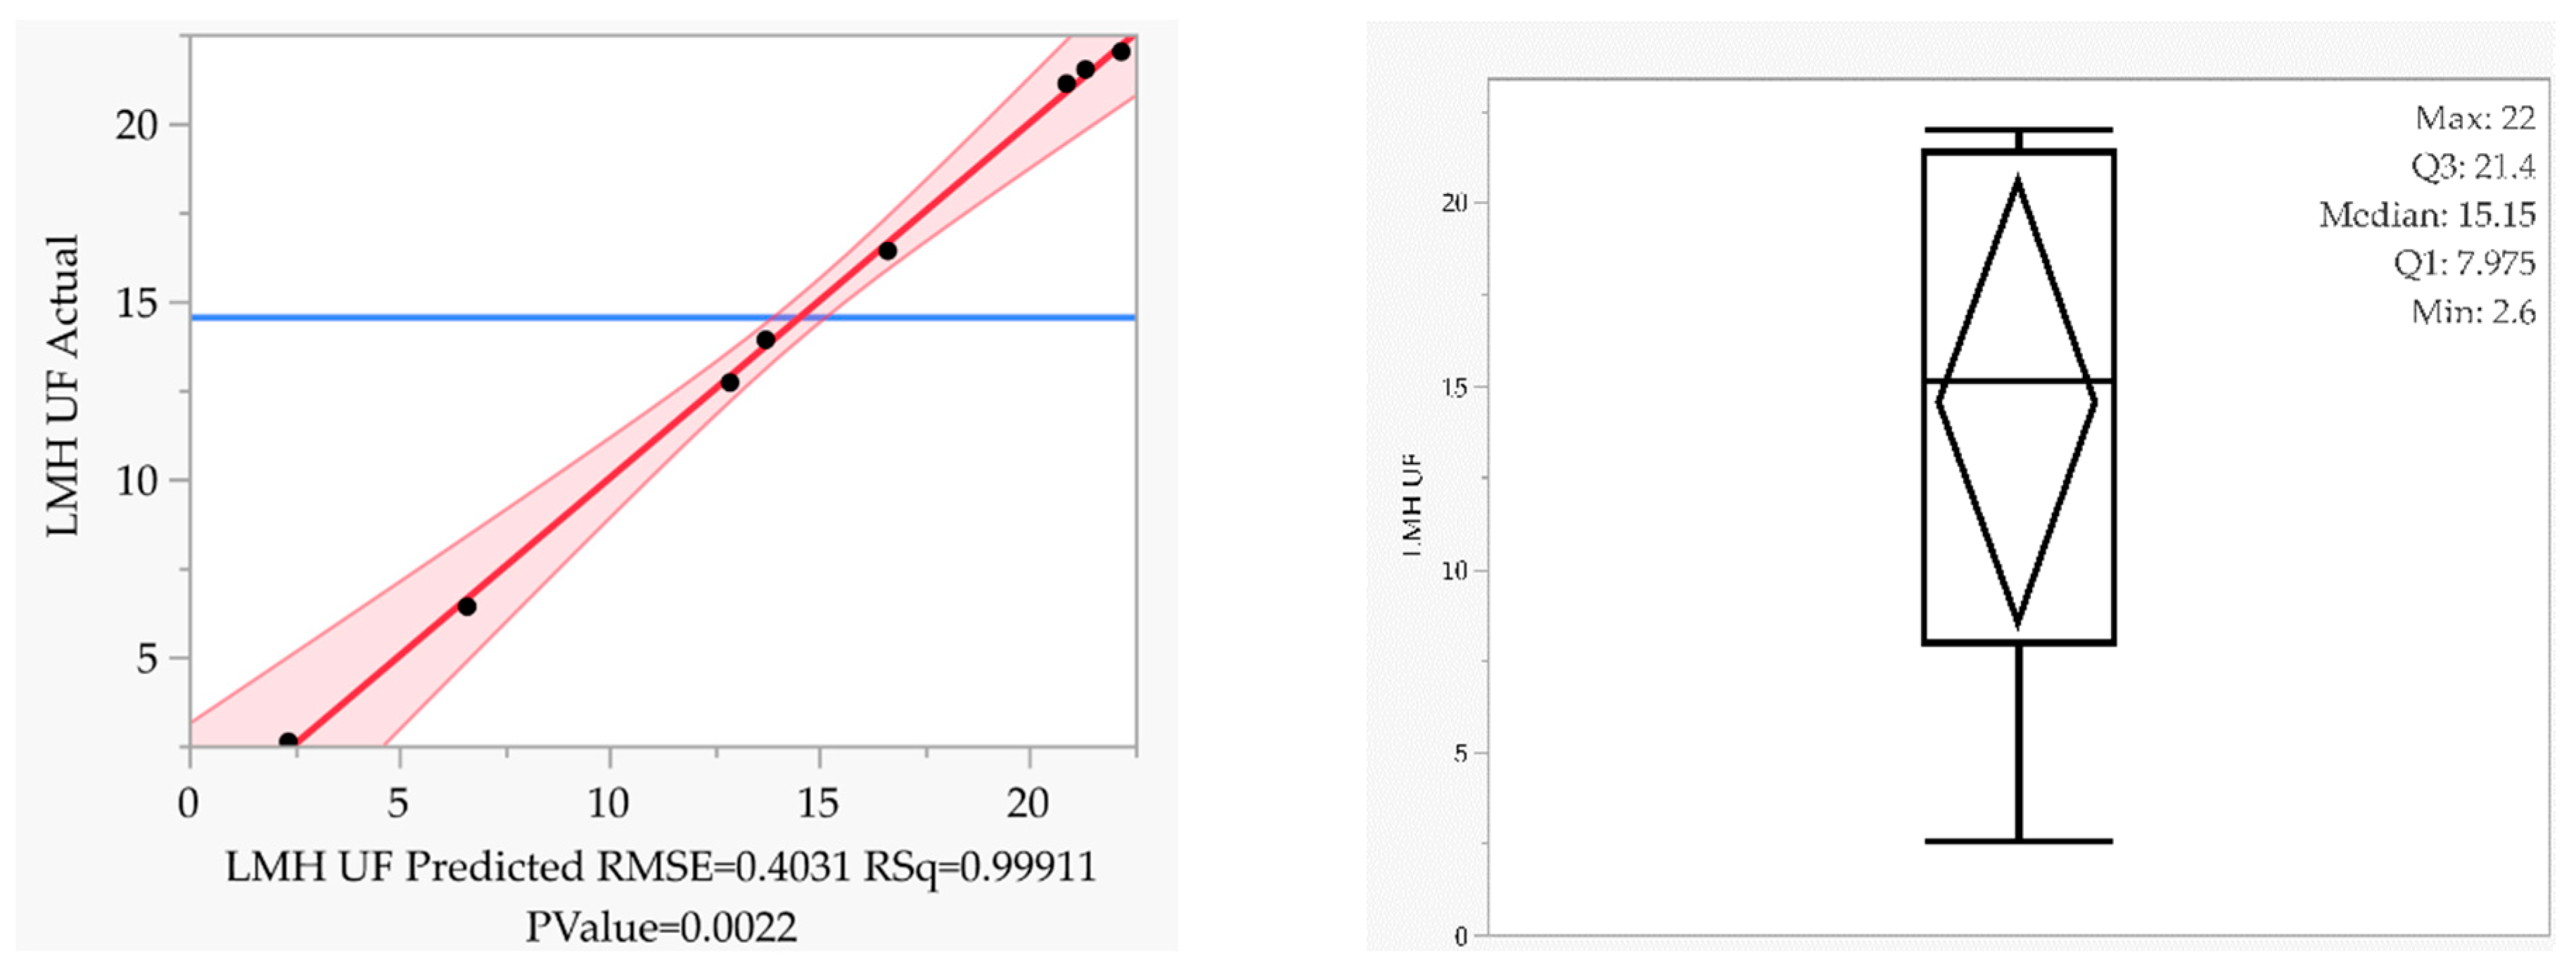
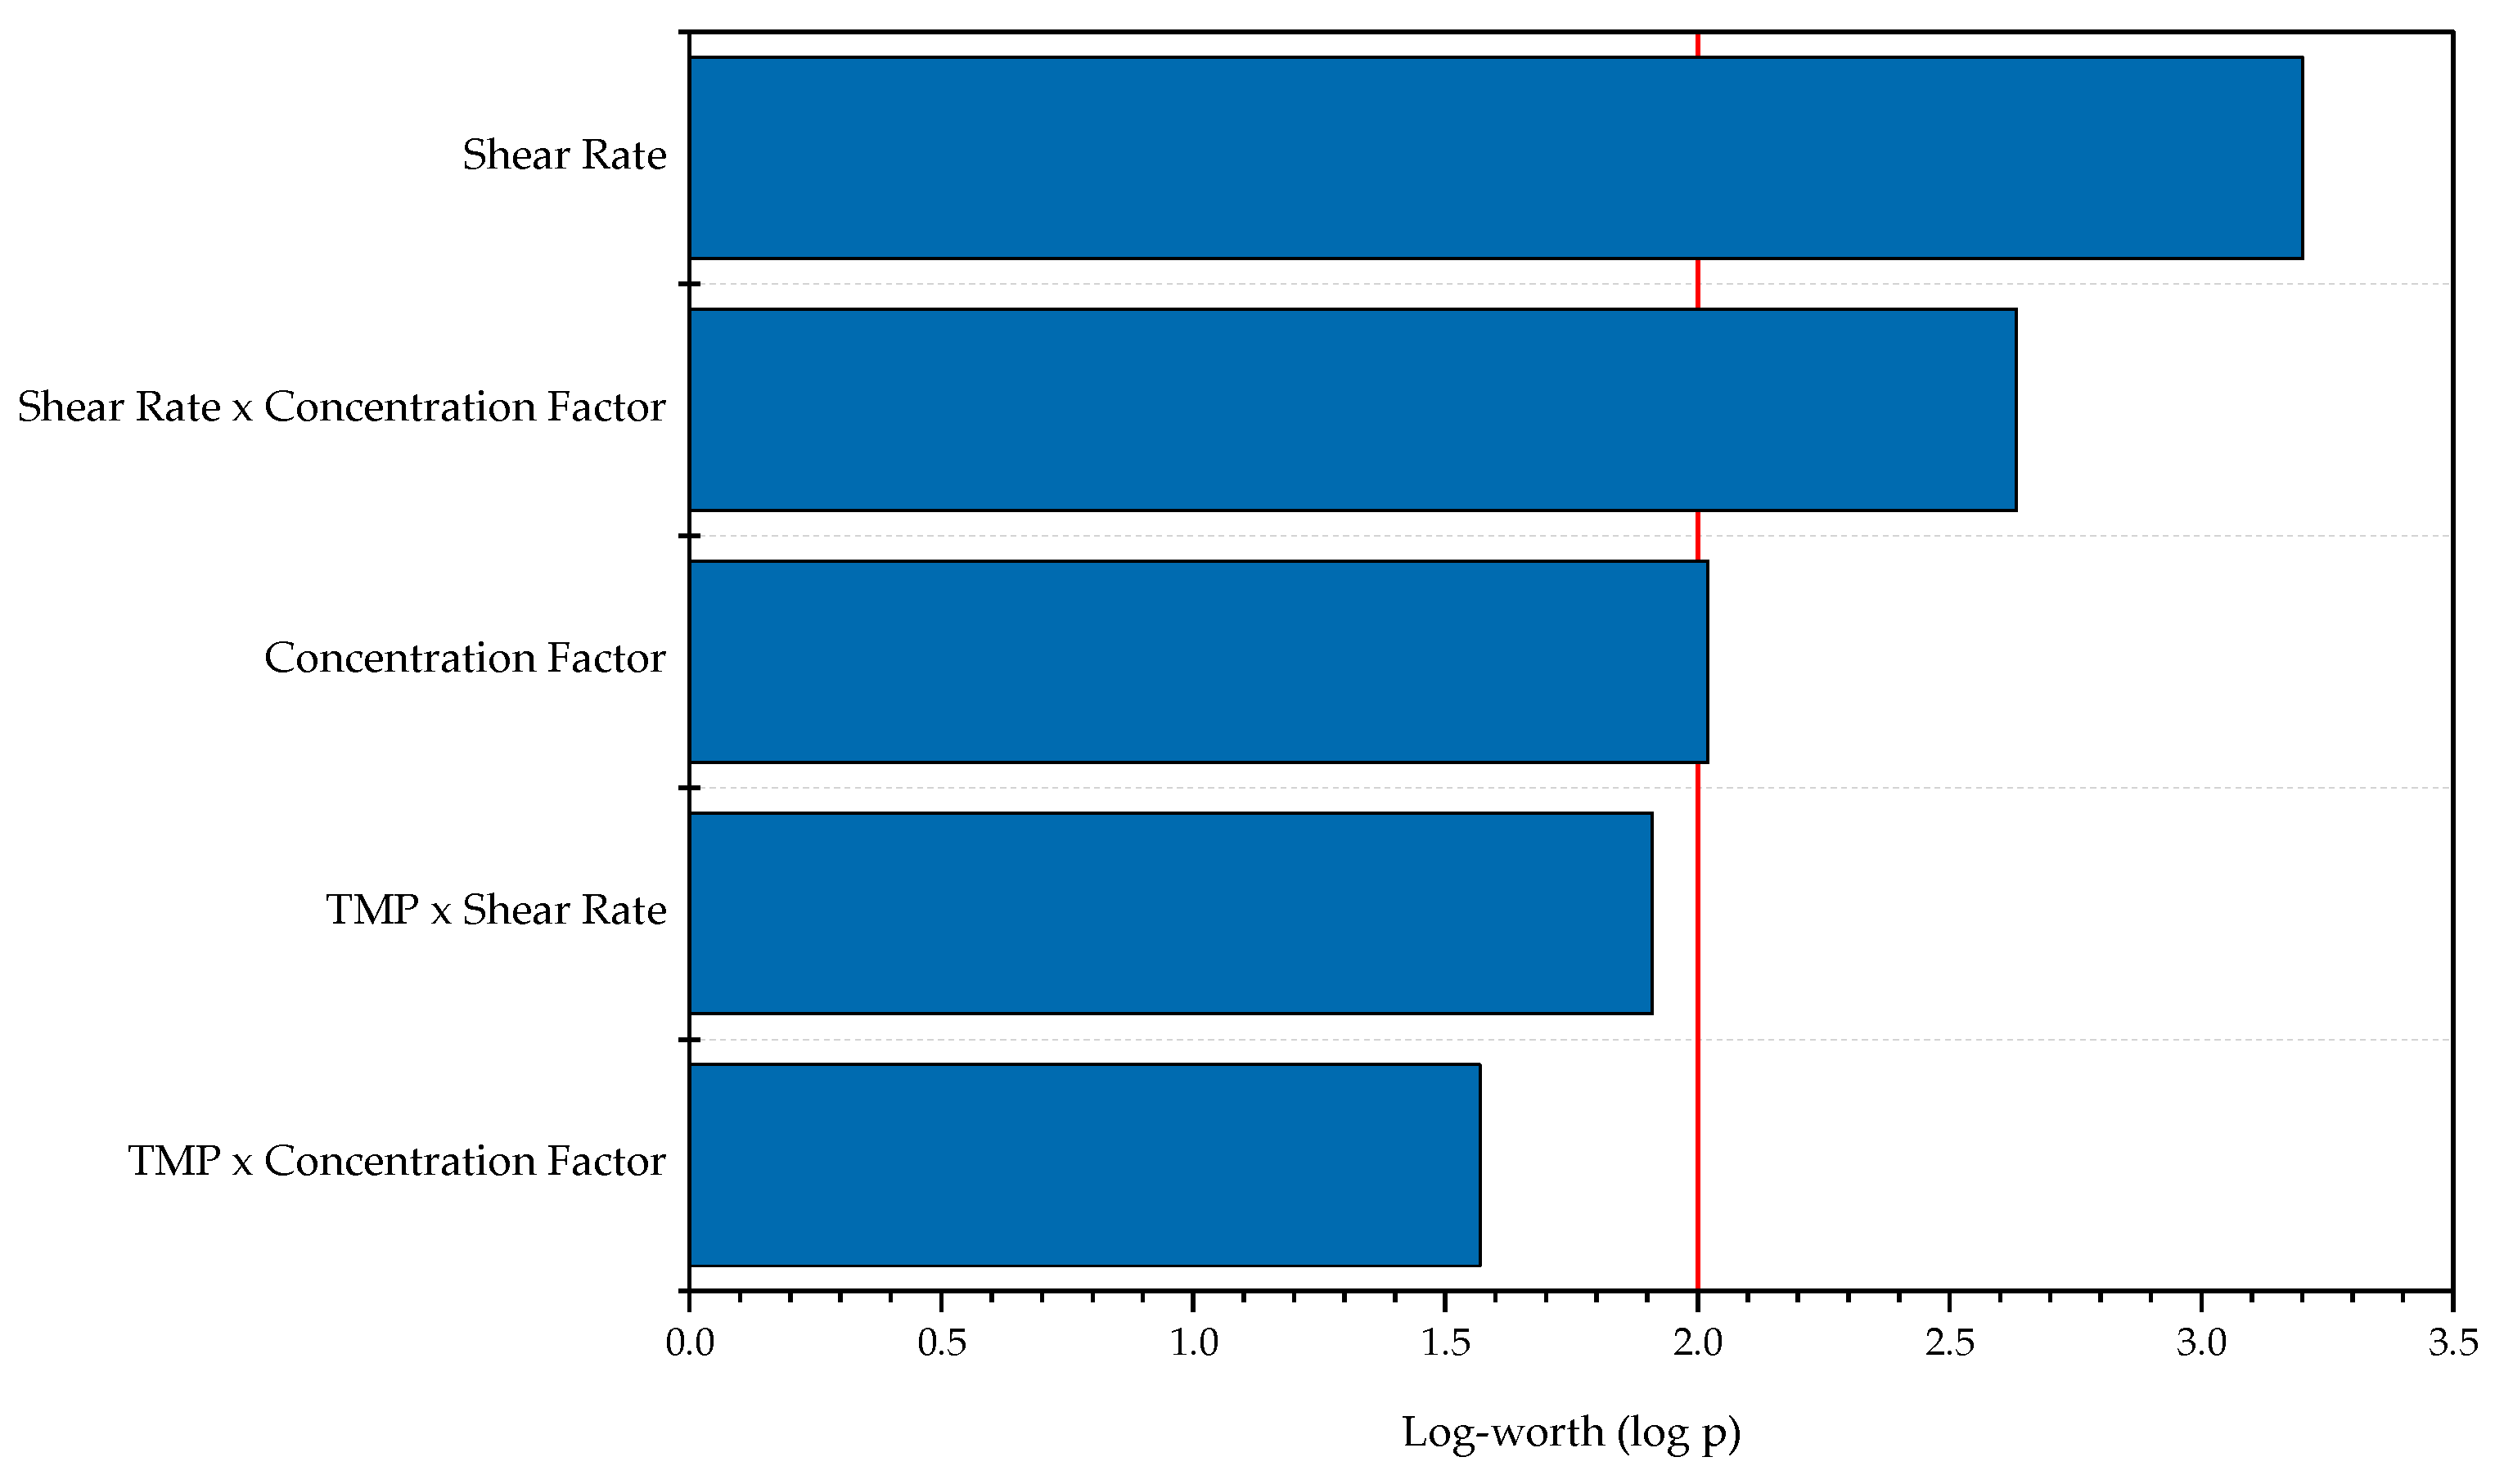
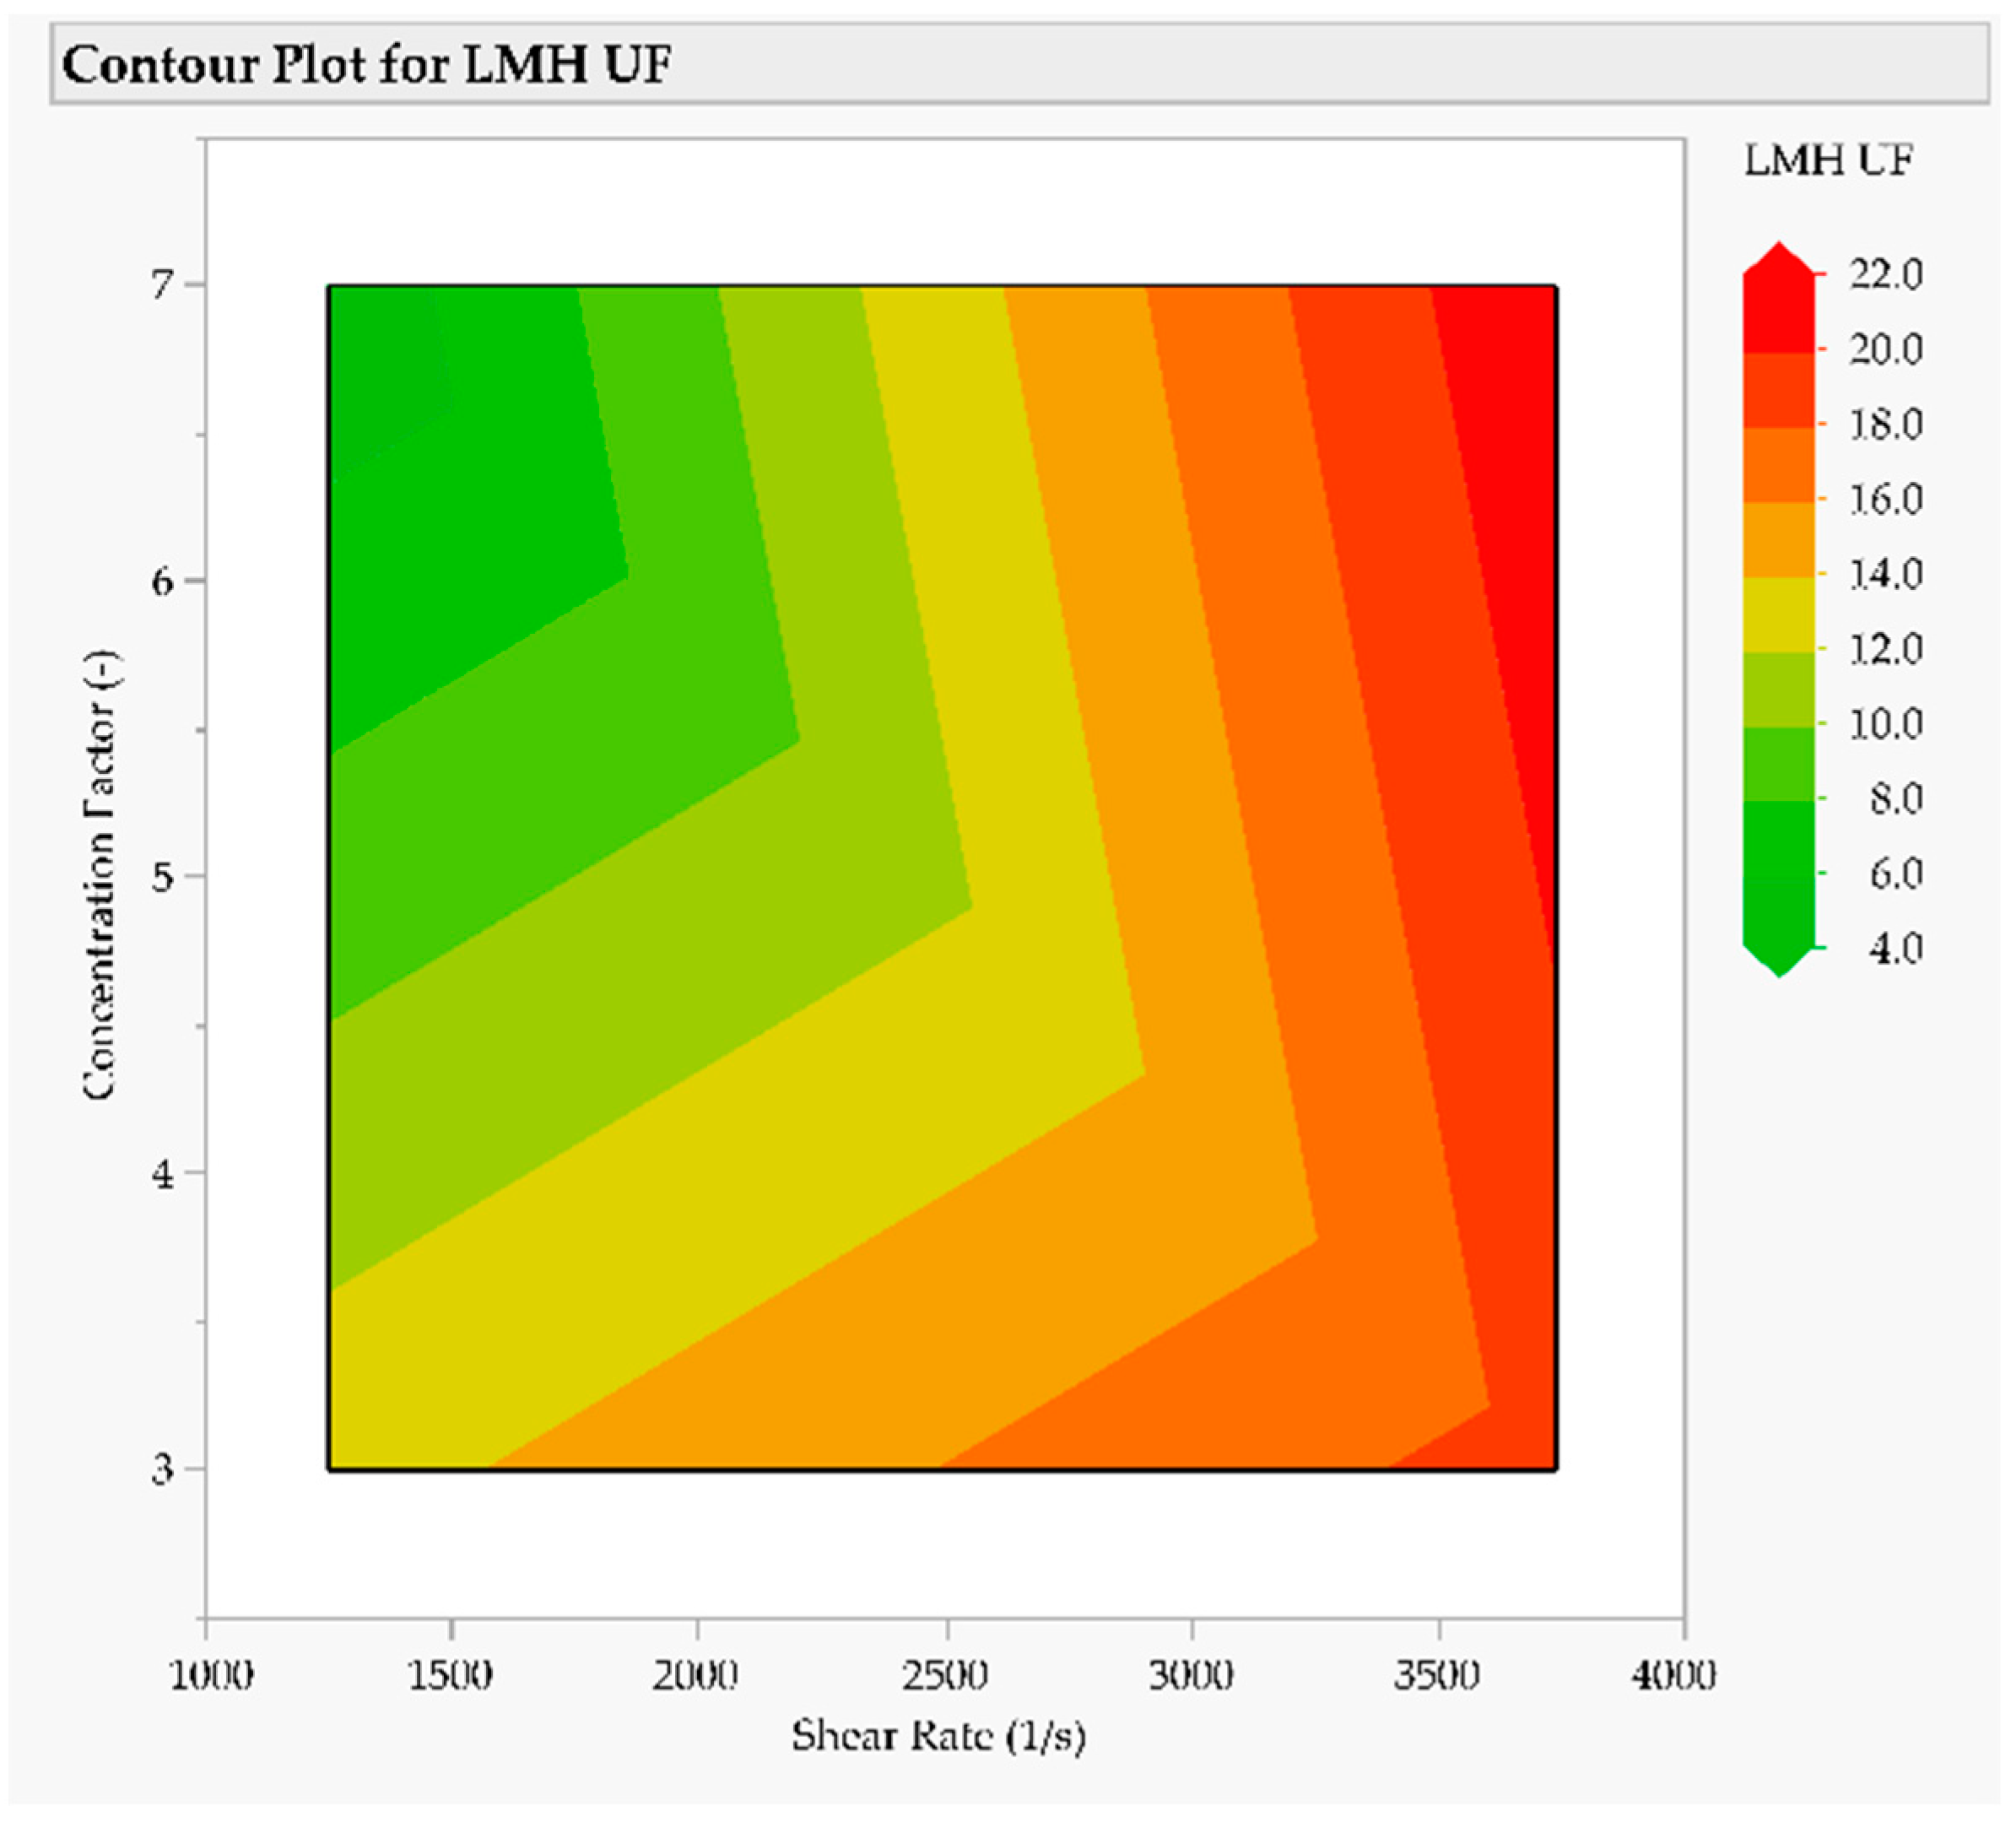
3.3. Intermediate Purification and Concentration via Ultra- and Diafiltration

In this work, initial product purification and subsequent concentration of the harvested cell culture fluid (HCCF) were achieved by ultrafiltration utilizing hollow fiber modules (MIDIKROS 20 cm length, 0.05 µm pore diameter, 60 fibers, polysulfone). The characterization WAS conducted by statistical evaluation of an experimental plan (Table 3) that covered the combinations of the key process parameters: transmembrane pressure (TMP), shear rate and the final relative increase in concentration.
The desired range of concentration increase in this work was set due to robustness reasons, as bigger concentrations were difficult to reproduce given the dead volume (50 mL) of the utilized set-up being in the same range and higher than the final concentrate volume at a factor of five and beyond. The range of TMP was set to cover a reasonable range, with 0.5 bar being a typical lower pressure value and 1.5 bar being as close to the specified pressure limit of 2 bars without risking total blockage during the initial filtration stage. Shear rate was set purposely low at a range of 1249 s−1 up to 3738 s−1. Although typically for mid- to high-fouling solutions, shear rates of 6000 s−1 to 10,000 s−1 are recommended [69], a most-gentle-as-possible filtration process was desired due to the fragility of the VLP.
The statistical model was built stepwise by minimizing the p-value threshold using an algorithm featured in JMP®16.0. Applying the standard least squares routine to the so found model effects resulted in a very high regression efficiency (Figure 8) for the actual LMH, with an adj. R2 of 0.997 and a p-value of 0.0022. As the experimental design was set inside a shear rate space, which is prone to fouling, the lowest LMH could be found as expected at 1249 s−1, while the highest LMH could be found at a shear rate of 1738 s−1. With a log-worth of 3.201, it was the most significant process parameter. The second strongest single-effect was the final concentration factor (log-worth of 2.01), with the interaction of those two effects being as expected in between both (log-worth of 2.633). In the face of the strong influence that these parameters have on the process, the TMP and interactions involving this factor became insignificant, with log-worth smaller than 0.2, which is the threshold for significance (Figure 9).
With this information, a rudimentary design space could be defined, i.e., in the form of a contour plot (Figure 10). The highest LMH, and therefore highest productivity, can be achieved at a high shear rate. As mentioned above, this indicates the operation within a fouling prone process range. Though it could be concluded that higher fluxes can be achieved by operating at increased shear rates above 3738 s−1, this could lead to product loss due to shear-stress-induced disintegration. Higher concentration factors result in smaller LMH, especially at low shear rates. Nonetheless, there is a tradeoff between decreased flux and increased concentration, which is favorable for the subsequent downstream.
Figure 11 shows an example of the chromatogram of Tosoh SEC for Experiment 5 for the product of the depth filtration, which served as feed for the UF/DF, the permeate of the ultrafiltration and the diafiltration as well as the retentate of the diafiltration. It can be clearly seen that, as expected, no VLPs, which migrate through the column with a retention time of approx. 30 min, were present in the permeate of the ultrafiltration and the diafiltration. On the other hand, the concentration by a factor of seven can be easily recognized. In addition, hardly any secondary components were present in the retentate, which indicates good purification in the diafiltration.
During diafiltration, spectra were continuously recorded using a FTIR spectrometer and a DAD. In addition, a fluorescence spectrum was recorded at the beginning and at the end of the diafiltration. The spectra generated during Experiments 1 and 2 are shown in Figure 12. The color gradient from blue to red shows the progress of the diafiltration over time. The blue spectra in the FTIR (Figure 12a,b) represent water as a reference. As the experiment progresses, a peak appears at a wavenumber of 1200 cm−1 that increases in intensity with time. An interaction at this wavenumber is especially characteristic for carbon–nitrogen compounds [70]. In the DAD (Figure 12c,d), the intensity of the measured absorption decreases with increasing experimental time.
In the fluorescence spectra (Figure 12e,f), there are three characteristic peaks at the wavelengths of about 300, 390 and 590 nm, the first and the third peak being significantly larger at the end of the process than at the beginning.

3.4. Anion-Exchange Chromatography

The decision whether to use a weak or strong anion exchange resin for further purification after UF/DF was based on initial screening experiments with Experiment 6’s product phase. Figure 13 shows step elution on both the POROS™ GoPure™ HQ column packed with strong anion exchange resin (left) and the Fractogel® DEAE column packed with weak anion exchange resin (right). In both cases, a clear elution peak can be observed at each NaCl step. While the holding time of 10 CV on the strong AEX resin was sufficient to achieve baseline separation, tailing into the subsequent fraction was observed on the weak AEX resin, especially between E1 and E3. In order to achieve optimal purification at even higher column loading without investing time for further method optimization, the decision was made to use the strong AEX resin.
The higher column load results in an overall stronger tailing and higher peak intensities (Figure 14, top). The fractions were subdivided according to UV absorbance at 280 nm (Figure 14, top, blue bars). SEC analysis showed that no product was lost in the flowthrough or in E2 (Figure 14, middle). As can be seen in the SEC analytics of the AEX fractions, the VLP was enriched in fraction E3.

4. Summary

The aim of this work was to optimize the production of HIV-VLPs using PAT and to investigate different process control strategies. In addition, a concept for cell separation by depth filtration and subsequent product purification and concentration using a combination of ultrafiltration and diafiltration was to be developed. For this purpose, three different cell lines were cultivated in different media in combination with different feeds. It was shown that by combining SMD with HEK FS as feed medium, a maximum live cell number concentration of 17.4 ± 0.3 million cells·mL−1 was obtained, which corresponds to an increase of 272% compared to the first cultivation, in which PM was used as medium and production medium spiked with 44 mM glutamine was used as feed. In addition, overfeeding of the cells was noticed, especially in the determination of glucose and glutamine concentrations, whereupon the feeding strategy was adjusted so that instead of 6 g·L−1 glucose, 2.5–3.0 g·L−1 glucose was fed. In addition to saving on a cost-intensive feeding medium, this had the positive effect of shifting cell metabolism towards the consumption of lactate, which is critical for cell growth. Furthermore, the optimization of the medium and the resulting higher concentration of live cells led to an increase in productivity, resulting in a relative increase in product concentration by a factor of 16.7. For the separation of the cells from the cultivation broth, different depth filters were used, either individually or connected in series, which were characterized in this work with regard to their blocking mechanisms. The Millistak®+D0HC from Merck Millipore could be described very well by the standard blocking model with a minimum R2 of 0.975 when used as a direct harvest filter. With pretreatment, the main blocking mechanism shifts towards the intermediate model, which describes filtration very well with a minimum R² of 0.948. Moreover, pretreatment increased the filtration capacity from a maximum of 60 L·m−2 up to 260 L·m−2. Furthermore, it was shown that process analysis is suitable for predicting process parameters, such as glucose and lactate concentration, as well as the target parameters’ live cell counts and product concentrations. For this purpose, Raman, FTIR, DAD and fluorescence spectra were recorded and evaluated using statistical data analysis. A prediction model was developed based on the first cultivation in each case, and this model was used to predict the data from the offline analysis of the second cultivation. These were subsequently included in the training data set to increase the predictivity of the subsequent cultivation. It has been shown that even a change in the process conditions such as the feeding strategy, the medium used or the cell line used allows prediction. For example, a fluorescence detector is best suited for the prediction of the product concentration. It was shown that model training improved the prediction efficiency from an R2 of 0.24 to an R² of 0.71. In addition, the highest predictivity of glucose and viable cell density was obtained by using a Raman spectrometer. Thus, the efficiency of the prediction of glucose concentration for cultivations with the same media combination by model training increased the R² to 0.94. The R2 for the prediction of the viable cell density was increased by 81% to an R² of 0.82 by expanding the training data set. For the prediction of the lactate concentration, the FTIR spectrometer proved to be suitable. Using FTIR spectra, a R2 of 0.85 could be obtained. Only a prediction of glutamine concentration was not satisfactory with any of the four spectrometers.

5. Conclusions

The presented process is effective in producing, concentrating and purifying HIV-Gag VLPs: Figure 15 shows the relative VLP concentration and purity over the process as a summary. After efficient removal of cells and bigger cell debris by depth filtration, the UF/DF concentrates the VLP approximately 7.5-fold and, at the same time, achieves a purity of approximately 20%. In the following anion exchange chromatography, the purity can be increased to over 80% and concentration increased to 12.5-fold initial VLP concentration.
Further research will be dedicated to another chromatography step following AEX to polish the VLPs and achieve >99% purity as well as to formulation and freeze drying of the purified VLP solution to cover the full VLP production process.

Author Contributions

Conceptualization, J.S. (Jochen Strube); software, process and analytics experiments, A.H., H.H. and A.S.; VLP cell line development, J.R. and J.S. (Jörn Stitz); writing—original draft preparation, A.H., H.H. and A.S.; writing—review and editing, A.H., H.H., A.S., J.R., J.S. (Jörn Stitz) and J.S. (Jochen Strube); supervision, J.S. (Jochen Strube); project administration, J.S. (Jochen Strube). All authors have read and agreed to the published version of the manuscript.

Funding

A part of this work was supported by a grant of the German Federal Ministry of Education and Research, funding program Forschung an Fachhochschulen, contract number 13FH767IA6 to JS.

Institutional Review Board Statement

Not applicable.

Informed Consent Statement

Not applicable.

Data Availability Statement

Data generated in this study are available from the authors upon reasonable request.

Conflicts of Interest

The authors declare no conflict of interest.

References

  1. Flynn, N.M.; Forthal, D.N.; Harro, C.D.; Judson, F.N.; Mayer, K.H.; Para, M.F. Placebo-controlled phase 3 trial of a recombinant glycoprotein 120 vaccine to prevent HIV-1 infection. J. Infect. Dis. 2005, 191, 654–665. [Google Scholar] [CrossRef] [PubMed]
  2. Hammonds, J.; Chen, X.; Zhang, X.; Lee, F.; Spearman, P. Advances in methods for the production, purification, and characterization of HIV-1 Gag—Env pseudovirion vaccines. Vaccine 2007, 25, 8036–8048. [Google Scholar] [CrossRef] [PubMed]
  3. Deml, L.; Speth, C.; Dierich, M.P.; Wolf, H.; Wagner, R. Recombinant HIV-1 Pr55gag virus-like particles: Potent stimulators of innate and acquired immune responses. Mol. Immunol. 2005, 42, 259–277. [Google Scholar] [CrossRef] [PubMed]
  4. Roldão, A.; Mellado, M.C.M.; Castilho, L.R.; Carrondo, M.J.T.; Alves, P.M. Virus-like particles in vaccine development. Expert Rev. Vaccines 2010, 9, 1149–1176. [Google Scholar] [CrossRef]
  5. Cervera, L.; Gòdia, F.; Tarrés-Freixas, F.; Aguilar-Gurrieri, C.; Carrillo, J.; Blanco, J.; Gutiérrez-Granados, S. Production of HIV-1-based virus-like particles for vaccination: Achievements and limits. Appl. Microbiol. Biotechnol. 2019, 103, 7367–7384. [Google Scholar] [CrossRef]
  6. Rosengarten, J.F.; Schatz, S.; Wolf, T.; Barbe, S.; Stitz, J. Components of a HIV-1 vaccine mediate virus-like particle (VLP)-formation and display of envelope proteins exposing broadly neutralizing epitopes. Virology 2022, 568, 41–48. [Google Scholar] [CrossRef]
  7. Ludwig, C.; Wagner, R. Virus-like particles—Universal molecular toolboxes. Curr. Opin. Biotechnol. 2007, 18, 537–545. [Google Scholar] [CrossRef]
  8. Cruz, P.E.; Cunha, A.; Peixoto, C.C.; Clemente, J.; Moreira, J.L.; Carrondo, M.J. Optimization of the production of virus-like particles in insect cells. Biotechnol. Bioeng. 1998, 60, 408–418. [Google Scholar] [CrossRef]
  9. Pillay, S.; Meyers, A.; Williamson, A.-L.; Rybicki, E.P. Optimization of chimeric HIV-1 virus-like particle production in a baculovirus-insect cell expression system. Biotechnol. Prog. 2009, 25, 1153–1160. [Google Scholar] [CrossRef]
  10. Puente-Massaguer, E.; Grau-Garcia, P.; Strobl, F.; Grabherr, R.; Striedner, G.; Lecina, M.; Gòdia, F. Accelerating HIV-1 VLP production using stable High Five insect cell pools. Biotechnol. J. 2021, 16, e2000391. [Google Scholar] [CrossRef]
  11. Visciano, M.L.; Diomede, L.; Tagliamonte, M.; Tornesello, M.L.; Asti, V.; Bomsel, M.; Buonaguro, F.M.; Lopalco, L.; Buonaguro, L. Generation of HIV-1 Virus-Like Particles expressing different HIV-1 glycoproteins. Vaccine 2011, 29, 4903–4912. [Google Scholar] [CrossRef] [PubMed]
  12. Zhu, J. Mammalian cell protein expression for biopharmaceutical production. Biotechnol. Adv. 2012, 30, 1158–1170. [Google Scholar] [CrossRef] [PubMed]
  13. Cervera, L.; Gutiérrez-Granados, S.; Martínez, M.; Blanco, J.; Gòdia, F.; Segura, M.M. Generation of HIV-1 Gag VLPs by transient transfection of HEK 293 suspension cell cultures using an optimized animal-derived component free medium. J. Biotechnol. 2013, 166, 152–165. [Google Scholar] [CrossRef] [PubMed]
  14. Durocher, Y.; Pham, P.L.; St-Laurent, G.; Jacob, D.; Cass, B.; Chahal, P.; Lau, C.J.; Nalbantoglu, J.; Kamen, A. Scalable serum-free production of recombinant adeno-associated virus type 2 by transfection of 293 suspension cells. J. Virol. Methods 2007, 144, 32–40. [Google Scholar] [CrossRef]
  15. Kamen, A.; Henry, O. Development and optimization of an adenovirus production process. J. Gene Med. 2004, 6 (Suppl. 1), S184–S192. [Google Scholar] [CrossRef]
  16. Le Ru, A.; Jacob, D.; Transfiguracion, J.; Ansorge, S.; Henry, O.; Kamen, A.A. Scalable production of influenza virus in HEK-293 cells for efficient vaccine manufacturing. Vaccine 2010, 28, 3661–3671. [Google Scholar] [CrossRef]
  17. Segura, M.M.; Garnier, A.; Durocher, Y.; Coelho, H.; Kamen, A. Production of lentiviral vectors by large-scale transient transfection of suspension cultures and affinity chromatography purification. Biotechnol. Bioeng. 2007, 98, 789–799. [Google Scholar] [CrossRef]
  18. Jalaguier, P.; Turcotte, K.; Danylo, A.; Cantin, R.; Tremblay, M.J. Efficient production of HIV-1 virus-like particles from a mammalian expression vector requires the N-terminal capsid domain. PLoS ONE 2011, 6, e28314. [Google Scholar] [CrossRef]
  19. Cruz, P.E.; Peixoto, C.C.; Devos, K.; Moreira, J.L.; Saman, E.; Carrondo, M.J. Characterization and downstream processing of HIV-1 core and virus-like-particles produced in serum free medium. Enzym. Microb. Technol. 2000, 26, 61–70. [Google Scholar] [CrossRef]
  20. Venereo-Sanchez, A.; Simoneau, M.; Lanthier, S.; Chahal, P.; Bourget, L.; Ansorge, S.; Gilbert, R.; Henry, O.; Kamen, A. Process intensification for high yield production of influenza H1N1 Gag virus-like particles using an inducible HEK-293 stable cell line. Vaccine 2017, 35, 4220–4228. [Google Scholar] [CrossRef]
  21. Negrete, A.; Pai, A.; Shiloach, J. Use of hollow fiber tangential flow filtration for the recovery and concentration of HIV virus-like particles produced in insect cells. J. Virol. Methods 2014, 195, 240–246. [Google Scholar] [CrossRef] [PubMed]
  22. Jacinto, M.J.; Soares, R.; Azevedo, A.M.; Chu, V.; Tover, A.; Conde, J.P.; Aires-Barros, M.R. Optimization and miniaturization of aqueous two phase systems for the purification of recombinant human immunodeficiency virus-like particles from a CHO cell supernatant. Sep. Purif. Technol. 2015, 154, 27–35. [Google Scholar] [CrossRef]
  23. Turpeinen, D.G.; Joshi, P.U.; Kriz, S.A.; Kaur, S.; Nold, N.M.; O’Hagan, D.; Nikam, S.; Masoud, H.; Heldt, C.L. Continuous purification of an enveloped and non-enveloped viral particle using an aqueous two-phase system. Sep. Purif. Technol. 2021, 269, 118753. [Google Scholar] [CrossRef]
  24. Steppert, P.; Burgstaller, D.; Klausberger, M.; Berger, E.; Aguilar, P.P.; Schneider, T.A.; Kramberger, P.; Tover, A.; Nöbauer, K.; Razzazi-Fazeli, E.; et al. Purification of HIV-1 gag virus-like particles and separation of other extracellular particles. J. Chromatogr. A 2016, 1455, 93–101. [Google Scholar] [CrossRef] [Green Version]
  25. Segura, M.M.; Mangion, M.; Gaillet, B.; Garnier, A. New developments in lentiviral vector design, production and purification. Expert Opin. Biol. Ther. 2013, 13, 987–1011. [Google Scholar] [CrossRef] [PubMed]
  26. González-Domínguez, I.; Lorenzo, E.; Bernier, A.; Cervera, L.; Gòdia, F.; Kamen, A. A Four-Step Purification Process for Gag VLPs: From Culture Supernatant to High-Purity Lyophilized Particles. Vaccines 2021, 9, 1154. [Google Scholar] [CrossRef]
  27. Chen, Y.; Yang, O.; Sampat, C.; Bhalode, P.; Ramachandran, R.; Ierapetritou, M. Digital Twins in Pharmaceutical and Biopharmaceutical Manufacturing: A Literature Review. Processes 2020, 8, 1088. [Google Scholar] [CrossRef]
  28. Matsunami, K.; Ryckaert, A.; Peeters, M.; Badr, S.; Sugiyama, H.; Nopens, I.; de Beer, T. Analysis of the Effects of Process Parameters on Start-Up Operation in Continuous Wet Granulation. Processes 2021, 9, 1502. [Google Scholar] [CrossRef]
  29. Yu, L.X.; Amidon, G.; Khan, M.A.; Hoag, S.W.; Polli, J.; Raju, G.K.; Woodcock, J. Understanding pharmaceutical quality by design. AAPS J. 2014, 16, 771–783. [Google Scholar] [CrossRef] [Green Version]
  30. Sixt, M.; Uhlenbrock, L.; Strube, J. Toward a Distinct and Quantitative Validation Method for Predictive Process Modelling—On the Example of Solid-Liquid Extraction Processes of Complex Plant Extracts. Processes 2018, 6, 66. [Google Scholar] [CrossRef] [Green Version]
  31. Uhlenbrock, L.; Sixt, M.; Strube, J. Quality-by-Design (QbD) process evaluation for phytopharmaceuticals on the example of 10-deacetylbaccatin III from yew. Resour. -Effic. Technol. 2017, 3, 137–143. [Google Scholar] [CrossRef]
  32. Schmidt, A.; Strube, J. Distinct and Quantitative Validation Method for Predictive Process Modeling with Examples of Liquid-Liquid Extraction Processes of Complex Feed Mixtures. Processes 2019, 7, 298. [Google Scholar] [CrossRef] [Green Version]
  33. Zobel-Roos, S.; Schmidt, A.; Mestmäcker, F.; Mouellef, M.; Huter, M.; Uhlenbrock, L.; Kornecki, M.; Lohmann, L.; Ditz, R.; Strube, J. Accelerating Biologics Manufacturing by Modeling or: Is Approval under the QbD and PAT Approaches Demanded by Authorities Acceptable Without a Digital-Twin? Processes 2019, 7, 94. [Google Scholar] [CrossRef] [Green Version]
  34. Kis, Z.; Kontoravdi, C.; Shattock, R.; Shah, N. Resources, Production Scales and Time Required for Producing RNA Vaccines for the Global Pandemic Demand. Vaccines 2020, 9, 3. [Google Scholar] [CrossRef] [PubMed]
  35. Kornecki, M.; Schmidt, A.; Strube, J. PAT as key-enabling technology for QbD in pharmaceutical manufacturing A conceptual review on upstream and downstream processing. Chim. Oggi-Chem. Today 2018, 36, 44–48. [Google Scholar]
  36. Helgers, H.; Schmidt, A.; Lohmann, L.J.; Vetter, F.L.; Juckers, A.; Jensch, C.; Mouellef, M.; Zobel-Roos, S.; Strube, J. Towards Autonomous Operation by Advanced Process Control—Process Analytical Technology for Continuous Biologics Antibody Manufacturing. Processes 2021, 9, 172. [Google Scholar] [CrossRef]
  37. Buijs, J.; Norde, W.; Lichtenbelt, J.W.T. Changes in the Secondary Structure of Adsorbed IgG and F(ab′) 2 Studied by FTIR Spectroscopy. Langmuir 1996, 12, 1605–1613. [Google Scholar] [CrossRef]
  38. Wasalathanthri, D.P.; Feroz, H.; Puri, N.; Hung, J.; Lane, G.; Holstein, M.; Chemmalil, L.; Both, D.; Ghose, S.; Ding, J.; et al. Real-time monitoring of quality attributes by in-line Fourier transform infrared spectroscopic sensors at ultrafiltration and diafiltration of bioprocess. Biotechnol. Bioeng. 2020, 117, 3766–3774. [Google Scholar] [CrossRef]
  39. Berry, B.; Moretto, J.; Matthews, T.; Smelko, J.; Wiltberger, K. Cross-scale predictive modeling of CHO cell culture growth and metabolites using Raman spectroscopy and multivariate analysis. Biotechnol. Prog. 2015, 31, 566–577. [Google Scholar] [CrossRef]
  40. Biechele, P.; Busse, C.; Solle, D.; Scheper, T.; Reardon, K. Sensor systems for bioprocess monitoring. Eng. Life Sci. 2015, 15, 469–488. [Google Scholar] [CrossRef]
  41. ICH Expert Working Group. Riskmanagement (Q9): ICH Harmonised Tripartite Guideline; ICH Expert Working Group: Geneva, Switzerland, 2005. [Google Scholar]
  42. ICH Expert Working Group. Pharmaceutical Quality System (Q10): ICH Harmonised Tripartite Guideline; ICH Expert Working Group: Geneva, Switzerland, 2008. [Google Scholar]
  43. ICH Expert Working Group. Pharmaceuticel Development Q8(R2): ICH Harmonised Tripartite Guideline; ICH Expert Working Group: Geneva, Switzerland, 2009. [Google Scholar]
  44. Qin, S.J.; Badgwell, T.A. A survey of industrial model predictive control technology. Control. Eng. Pract. 2003, 11, 733–764. [Google Scholar] [CrossRef]
  45. Morari, M.; Lee, J.H. Model predictive control: Past, present and future. Comput. Chem. Eng. 1999, 23, 667–682. [Google Scholar] [CrossRef]
  46. Camacho, E.F.; Alba, C.B. Model Predictive Control; Springer Science & Business Media: Berlin/Heidelberg, Germany, 2013; ISBN 0857293982. [Google Scholar]
  47. Garcia, C.E.; Prett, D.M.; Morari, M. Model predictive control: Theory and practice—A survey. Automatica 1989, 25, 335–348. [Google Scholar] [CrossRef]
  48. Dittmar, R. Advanced Process Control: PID-Basisregelungen, Vermaschte Regelungsstrukturen, Softsensoren, Model Predictive Control; DE GRUYTER: Berlin, Germany; Boston, MA, USA, 2017; ISBN 9783110499582. [Google Scholar]
  49. Keerthi, S.S.; Gilbert, E.G. Optimal infinite-horizon feedback laws for a general class of constrained discrete-time systems: Stability and moving-horizon approximations. J. Optim. Theory Appl. 1988, 57, 265–293. [Google Scholar] [CrossRef] [Green Version]
  50. Song, I.-H.; Amanullah, M.; Erdem, G.; Mazzotti, M.; Rhee, H.-K. Experimental implementation of identification-based optimizing control of a simulated moving bed process. J. Chromatogr. A 2006, 1113, 60–73. [Google Scholar] [CrossRef]
  51. Sommeregger, W.; Sissolak, B.; Kandra, K.; von Stosch, M.; Mayer, M.; Striedner, G. Quality by control: Towards model predictive control of mammalian cell culture bioprocesses. Biotechnol. J. 2017, 12, 1600546. [Google Scholar] [CrossRef] [Green Version]
  52. Fanali, S. Editorial on “Simulated moving bed chromatography for the separation of enantiomers” by A. Rajendran, G. Paredes and M. Mazzotti. J. Chromatogr. A 2009, 1216, 708. [Google Scholar] [CrossRef]
  53. Diederich, P.; Hansen, S.K.; Oelmeier, S.A.; Stolzenberger, B.; Hubbuch, J. A sub-two minutes method for monoclonal antibody-aggregate quantification using parallel interlaced size exclusion high performance liquid chromatography. J. Chromatogr. A 2011, 1218, 9010–9018. [Google Scholar] [CrossRef]
  54. Rüdt, M.; Andris, S.; Schiemer, R.; Hubbuch, J. Factorization of preparative protein chromatograms with hard-constraint multivariate curve resolution and second-derivative pretreatment. J. Chromatogr. A 2019, 1585, 152–160. [Google Scholar] [CrossRef]
  55. Abu-Absi, N.R.; Kenty, B.M.; Cuellar, M.E.; Borys, M.C.; Sakhamuri, S.; Strachan, D.J.; Hausladen, M.C.; Li, Z.J. Real time monitoring of multiple parameters in mammalian cell culture bioreactors using an in-line Raman spectroscopy probe. Biotechnol. Bioeng. 2011, 108, 1215–1221. [Google Scholar] [CrossRef]
  56. Claßen, J.; Aupert, F.; Reardon, K.F.; Solle, D.; Scheper, T. Spectroscopic sensors for in-line bioprocess monitoring in research and pharmaceutical industrial application. Anal. Bioanal. Chem. 2017, 409, 651–666. [Google Scholar] [CrossRef] [PubMed]
  57. Kornecki, M.; Strube, J. Process Analytical Technology for Advanced Process Control in Biologics Manufacturing with the Aid of Macroscopic Kinetic Modeling. Bioengineering 2018, 5, 25. [Google Scholar] [CrossRef] [PubMed] [Green Version]
  58. Santos, R.M.; Kessler, J.-M.; Salou, P.; Menezes, J.C.; Peinado, A. Monitoring mAb cultivations with in-situ raman spectroscopy: The influence of spectral selectivity on calibration models and industrial use as reliable PAT tool. Biotechnol. Prog. 2018, 34, 659–670. [Google Scholar] [CrossRef] [PubMed]
  59. Kornecki, M.; Strube, J. Accelerating Biologics Manufacturing by Upstream Process Modelling. Processes 2019, 7, 166. [Google Scholar] [CrossRef] [Green Version]
  60. Rolinger, L.; Rüdt, M.; Diehm, J.; Chow-Hubbertz, J.; Heitmann, M.; Schleper, S.; Hubbuch, J. Multi-attribute PAT for UF/DF of Proteins—Monitoring Concentration, particle sizes, and Buffer Exchange. Anal. Bioanal. Chem. 2020, 412, 2123–2136. [Google Scholar] [CrossRef]
  61. Jungbauer, A.; Dürauer, A.; Walch, N.; SAUER, D.; Scharl-Hirsch, T.; Melcher, M.; Leisch, F. Real-Time Monitoring of Product Purification. International Patent Application No. WO2017174580A1, 4 April 2017. [Google Scholar]
  62. Klepzig, L.S.; Juckers, A.; Knerr, P.; Harms, F.; Strube, J. Digital Twin for Lyophilization by Process Modeling in Manufacturing of Biologics. Processes 2020, 8, 1325. [Google Scholar] [CrossRef]
  63. Langedijk, J.P.M.; Callendret, B.C.S.; Van Manen, D.; Krarup, A.; Stitz, J.; Wegmann, F.; Vellinga, J. Human Immunodeficiency Virus Antigens, Vectors, Compositions, and Methods of Use Thereof. International Patent Application No. AU2019203468B2, 21 May 2020. [Google Scholar]
  64. Langedijk, J.P.M.; Van Manen, D.; Vellinga, J.; Wegmann, F.; Callendret, B.C.S.; Krarup, A.; Stitz, J. Recombinant Adenoviruses Encoding Mosaic Human Immunodeficiency Virus (HIV) Env, Gag, and Pol antigens. U.S. Patent Application No. 10,973,907, 13 April 2021. [Google Scholar]
  65. Pereira Aguilar, P.; González-Domínguez, I.; Schneider, T.A.; Gòdia, F.; Cervera, L.; Jungbauer, A. At-line multi-angle light scattering detector for faster process development in enveloped virus-like particle purification. J. Sep. Sci. 2019, 42, 2640–2649. [Google Scholar] [CrossRef]
  66. Esbensen, K.H. Multivariate Data Analysis—In Practice: An Introduction to Multivariate Data Analysis and Experimental Design, 5th ed.; CAMO Analytics: Bedford, MA, USA, 2012; ISBN 8299333032. [Google Scholar]
  67. MilliporeSigma. Clarification of Mammalian Cell Cultures by Depth Filtration; MilliporeSigma: Burlington, MA, USA, 2017. [Google Scholar]
  68. Iritani, E.; Katagiri, N. Developments of Blocking Filtration Model in Membrane Filtration. KONA Powder Part. J. 2016, 33, 179–202. [Google Scholar] [CrossRef] [Green Version]
  69. Repligen. Product Information—Midikros: Shear Conditions Graph. 2021. Available online: https://store.repligen.com/collections/midikros-hollow-fiber-filters/products/midikros-20cm-0-05um-ps-0-5mm-fll-x-fll-1-pk (accessed on 7 December 2021).
  70. Compound Interest. Analytical Chemistry—Infrared (IR) Spectroscopy. 2015. Available online: https://www.compoundchem.com/2015/02/05/irspectroscopy/ (accessed on 8 December 2021).
Figure 1. Workflow of model validation based on a QbD-oriented approach. In the first step, the QTPPs are defined. Subsequently, the CQAs are defined and a risk assessment of the influence of various process parameters on the CQAs is carried out. The risk assessment results in a design space for the process parameters to be investigated, which can be examined either via experiments or by means of a rigorous process model. Based on the results, a control strategy is defined, which can be continuously compared online via PAT with the actual state of the system. Strict implementation of this strategy allows continuous process optimization.
Processes 10 00419 g001
Figure 2. Process flow diagram showing the production and subsequent three-step purification of HIV-Gag VLPs. Capture is achieved by depth filtration, ultrafiltration/diafiltration (UF/DF) is used for concentration and initial purification, and anion exchange chromatography is used for further purification and concentration of HIV-Gag VLPs.
Processes 10 00419 g002
Figure 3. (a) Viable cell concentration over process time of the seven fed-batch (FB) cultivations, (b) relative VLP concentration based on SEC analysis, (c) glucose concentration, (d) lactate concentration, (e) glutamine concentration.
Processes 10 00419 g003aProcesses 10 00419 g003b
Figure 4. Raw spectra (top), processed spectra (middle) and predictions (bottom) of VCD and glucose concentration using Raman spectroscopy, lactate concentration using FTIR spectroscopy and relative product concentration using fluorescence spectroscopy.
Processes 10 00419 g004
Figure 5. Characterization of blocking mechanism during depth filtration of FB5 (Millistak®+D0HC) by linear regression: (a) complete; (b) standard; (c) intermediate; (d) cake. Blue lines represent linear regression results.
Processes 10 00419 g005
Figure 6. Increase in pressure over filter capacity during constant flux direct (not preclarified) depth filtration of FB5 (left) and FB6 (right). Experimental pressure values (black circles) are compared with standard blockage (red line) and intermediate blockage models (blue line).
Processes 10 00419 g006
Figure 7. Increase in pressure over filter capacity during constant flux direct (not preclarified) depth filtration of preclarified feed PC1 (left) and PC2 (right). Experimental pressure values (black circles) are compared with standard blockage (red line) and intermediate blocking models (blue line).
Processes 10 00419 g007
Figure 8. Actual-vs-predicted plot for the concentration step during ultrafiltration (left). Statistical key-numbers of obtained response values as Boxplot (right).
Processes 10 00419 g008
Figure 9. Effect summary in the concentration step during ultrafiltration.
Processes 10 00419 g009
Figure 10. Contour plot of the concentration step during ultrafiltration.
Processes 10 00419 g010
Figure 11. Chromatograms of Tosoh SEC of the product of depth filtration (black line), permeate of ultrafiltration (green line) and diafiltration (blue line) of Experiment 5 and retentate of ultrafiltration (red line) of Experiment 5 with VLP peak marked.
Processes 10 00419 g011
Figure 12. PAT results of UF/DF experiments for product concentration and purification. Raw spectra for: FTIR, (a) Experiment 1, (b) Experiment 2; DAD, (c) Experiment 1, (d) Experiment 2; fluorescence, (e) Experiment 1, (f) Experiment 2.
Processes 10 00419 g012
Figure 13. Screening of the elution step on a packed column of strong anion exchange resin POROS™ GoPure™ HQ (left) and a packed column of weak anion exchange resin Fractogel® DEAE (right).
Processes 10 00419 g013
Figure 14. Fractionation with 5 CV loading on a packed column with strong anion exchange resin POROS™ GoPure™ HQ at a flow rate of 1 CV/min (top). SEC analysis for product concentration and purity (middle). Overview of the increase in concentration and purity (bottom).
Processes 10 00419 g014
Figure 15. Relative product concentration and purity over the process.
Processes 10 00419 g015
Table 1. Base and feed media and target glucose concentration after feed addition of the seven fed-batch cultivations.
CultivationCell LineBase MediumFeed MediumGlucose Target Concentration after Feed Addition (g/L)
1293FwtGagPMPM6
2293FwtGagPMFeed Supplement6
3293FwtGagSMDFeed Supplement6
4293FMos1.GagSMDFeed Supplement3–3.5
5293FMos1.GagSMDFeed Supplement2.5–3
6293FMos1.GagSMDCell Boost 62.5–3
7293FMos1.Gag/Mos2S.EnvSMDFeed Supplement2.5–3
Table 2. Depth filters tested for clarification of cell culture broth.
FilterCut-Off (µm)Manufacturer
Millistak+D0HC0.55–9Merck KGaA, Darmstadt, Germany
PDP86–30Pall Corporation, Port Washington, NY, USA
PDK51.5–20
PDH40.5–15
Bio200.4–1
Table 3. Experimental plan to characterize the concentration step by ultrafiltration.
ExperimentTMP (bar)Shear Rate (s−1)Concentration Factor (-)
11.537387
21.537383
31.512493
40.512493
50.537387
60.512497
70.537383
81.512497
Table 4. Summary of regression efficiency achieved with intermediate and standard blocking models for FB5 and FB6.
ModelEquationBlocking Constant (dm−1)Adj. R2Feed
Intermediate p = p 0 × exp ( K i × v ) 0.06713 ± 2.3 × 10−40.852FB5
0.05564 ± 1.6 × 10−40.761FB6
Standard p = p 0   (   1 K s × v 2 ) 2 0.03436 ± 2.79 × 10−40.997FB5
0.02824 ± 5.63 × 10−40.975FB6
Table 5. Summary of regression efficiency achieved with intermediate and standard blocking models for preclarified feed PC1 and PC2.
ModelEquationBlocking Constant (dm−1)Adj R2Feed
Intermediate p = p 0 × exp ( K i × v ) 0.01876 ± 8.1 × 10−60.948PC1
0.03015 ± 9.4 × 10−60.976PC2
Standard p = p 0   (   1 K s × v 2 ) 2 0.00705 ± 1.28 × 10−60.792PC1
0.001025 ± 3.39 × 10−60.489PC2
Publisher’s Note: MDPI stays neutral with regard to jurisdictional claims in published maps and institutional affiliations.

