
Design and Simulation of Small-Scale Waste Separation and Sorting Equipment

1
College of Mechanical and Electrical Engineering, Central South University, Changsha 410083, China
2
Automotive Engineering Research Institute, Guangzhou Automobile Group Co., Ltd., Guangzhou 511434, China
*
Author to whom correspondence should be addressed.
Processes 2022, 10(5), 1020; https://0-doi-org.brum.beds.ac.uk/10.3390/pr10051020
Submission received: 29 March 2022
/
Revised: 16 May 2022
/
Accepted: 17 May 2022
/
Published: 20 May 2022
(This article belongs to the Special Issue Advances in Solid Waste Treatment and Design)
Abstract
:Environmental pollution is currently a major concern globally owing to increase in the world population and advances in industrialization. An automatic waste separation and sorting equipment for small-scale waste sorting systems was constructed in this paper. A two-DoF (two-degree-of-freedom) parallel sorting mechanism as well as a belt waste separation and feeding mechanism were designed, and 3D models of the mechanism were established. Finite element analysis (FEA) was conducted for the sorting mechanism, and kinematic and dynamic analysis and numerical simulation were performed for the waste and sorting mechanism. The simulation results demonstrated that the spherical waste did not roll out of the platform after leaving the slideway. The waste was stabilized at the center of the platform within a short duration with movement of the collecting mechanism of the platform. The system was optimized to reduce waste separation and sorting time. Stability of the waste motion in the equipment as well as efficiency of the system were significantly improved after optimization. The results showed that the designed equipment can complete separation and sorting of waste materials at lower output power.
1. Introduction
The Law of the People’s Republic of China on Prevention and Control of Environmental Pollution by Solid Waste proposes the general principles of “reduction, recycling, and harmlessness” for waste disposal. These recommendations ensure nationwide popularization of waste sorting culture in both urban and rural areas [1]. The diversity and complexity of domestic waste limit large-scale centralized waste sorting, and thus significantly reduce the feasibility of its application. Therefore, recent studies have explored lightweight, automatic, and efficient waste-sorting methods as alternatives [2], especially at the disposal stage, to circumvent the challenges in mixed disposal.
Several studies have explored the design and optimization of garbage classification systems based on intelligent garbage classification technology from the perspective of automatic sorting mechanisms, machine learning algorithms, and artificial intelligence model construction. Carlos et al. proposed a three-category automatic garbage classification system based on computer vision, with an accuracy rate of over 70% [3]. However, the study mainly explored the application of computer vision and its accuracy was low, thus it was not feasible for domestic application. Moreover, Seunguk Na et al. expounded the process of developing an artificial intelligence model for a classification system [4]. A novel model based on the Frechette starting distance method was developed for common learning data collection challenges in the field of garbage classification [4]. Lukka et al. developed a construction waste collector in 2014, which automatically sorted construction waste with a robotic arm. The equipment comprised multiple sensors, such as visible-spectrum cameras, near-infrared spectrometers, tactile sensors, and electronic scales. The findings showed that use of a robotic arm in a small-scale waste separation and sorting equipment significantly improved the complexity of the system. However, production cost and sorting efficiency of the system did not meet the requirements of small-scale garbage classification [5]. In 2016, TechCrunch Disrupt Hackathon designed an automatic sorting trash can to distinguish compostable waste from recyclable waste. Analysis showed that the system could only complete the binary classification task through clumsy mechanical devices with low efficiency and reliability [6]. Furthermore, Torres-García et al. designed an Intelligent Waste Separator (IWS) with similar technology to the equipment that TechCrunch Disrupt Hackathon developed. The IWS had extra features for waste disposal through Radio Frequency Identification (RFID). However, the dimensions of the IWS prototype were too large for extensive use [7]. In 2021, Zhang et al. established a novel two-stage Waste Recognition-Retrieval algorithm (W2R). The process began by training a Recognition Model (RegM) to recognize waste as one out of thirteen sub-categories. Further, a Recognition-Retrieval Model (RevM) that classified the identified subcategories into one out of four categories was built. In addition, a two-degree-of-freedom sorting device was constructed. The experimental results indicated that the average accuracy of RevM was 94.71% ± 1.69, which was significantly higher relative to that of the one-stage waste Classification Model (ClfM) at 69.66% ± 3.43. However, the sorting speed of the sorting device was low due to the combination of the feed motion of ball screw and the rotary motion of motor. Thus, further studies should explore ways to improve the efficiency of RevM [8].
China’s waste sorting industry has shifted toward higher intelligence, and manual sorting has been replaced by early stage of automatic sorting owing to technological advances such as the Internet of Things and artificial intelligence [9,10]. However, global waste sorting technology is still in its infancy, and several limitations must be explored. For example, optimal designs have not yet been established for the waste separation mechanisms and the sorting mechanisms, although machine recognition and image processing technology are markedly advanced. Other limitations related to conventional waste sorting equipment include low degree of automation, low efficiency, low cost-effectiveness, and manual operation.
In this paper, an automatic separation and sorting equipment for small-scale waste management was designed to circumvent the limitations of conventional systems. The mechanisms effectively alleviate the complexity of mixed disposal in the small-scale waste classification system and have high potential for field application. In addition, the sorting speed was improved from the perspective of mechanical design, resulting in a faster speed compared with that of similar structures. The mechanisms were fully linked with image acquisition and computer vision processing and are highly effective in waste classification. Therefore, the present study presents a mechanical equipment with higher reliability and better efficiency for small-scale waste separation and sorting systems. This system provides a basis for development of intelligent waste classification techniques. The experimental design of the present study is presented in Figure 1.
2. Mechanical Design and the Principle of the Waste Management Equipment
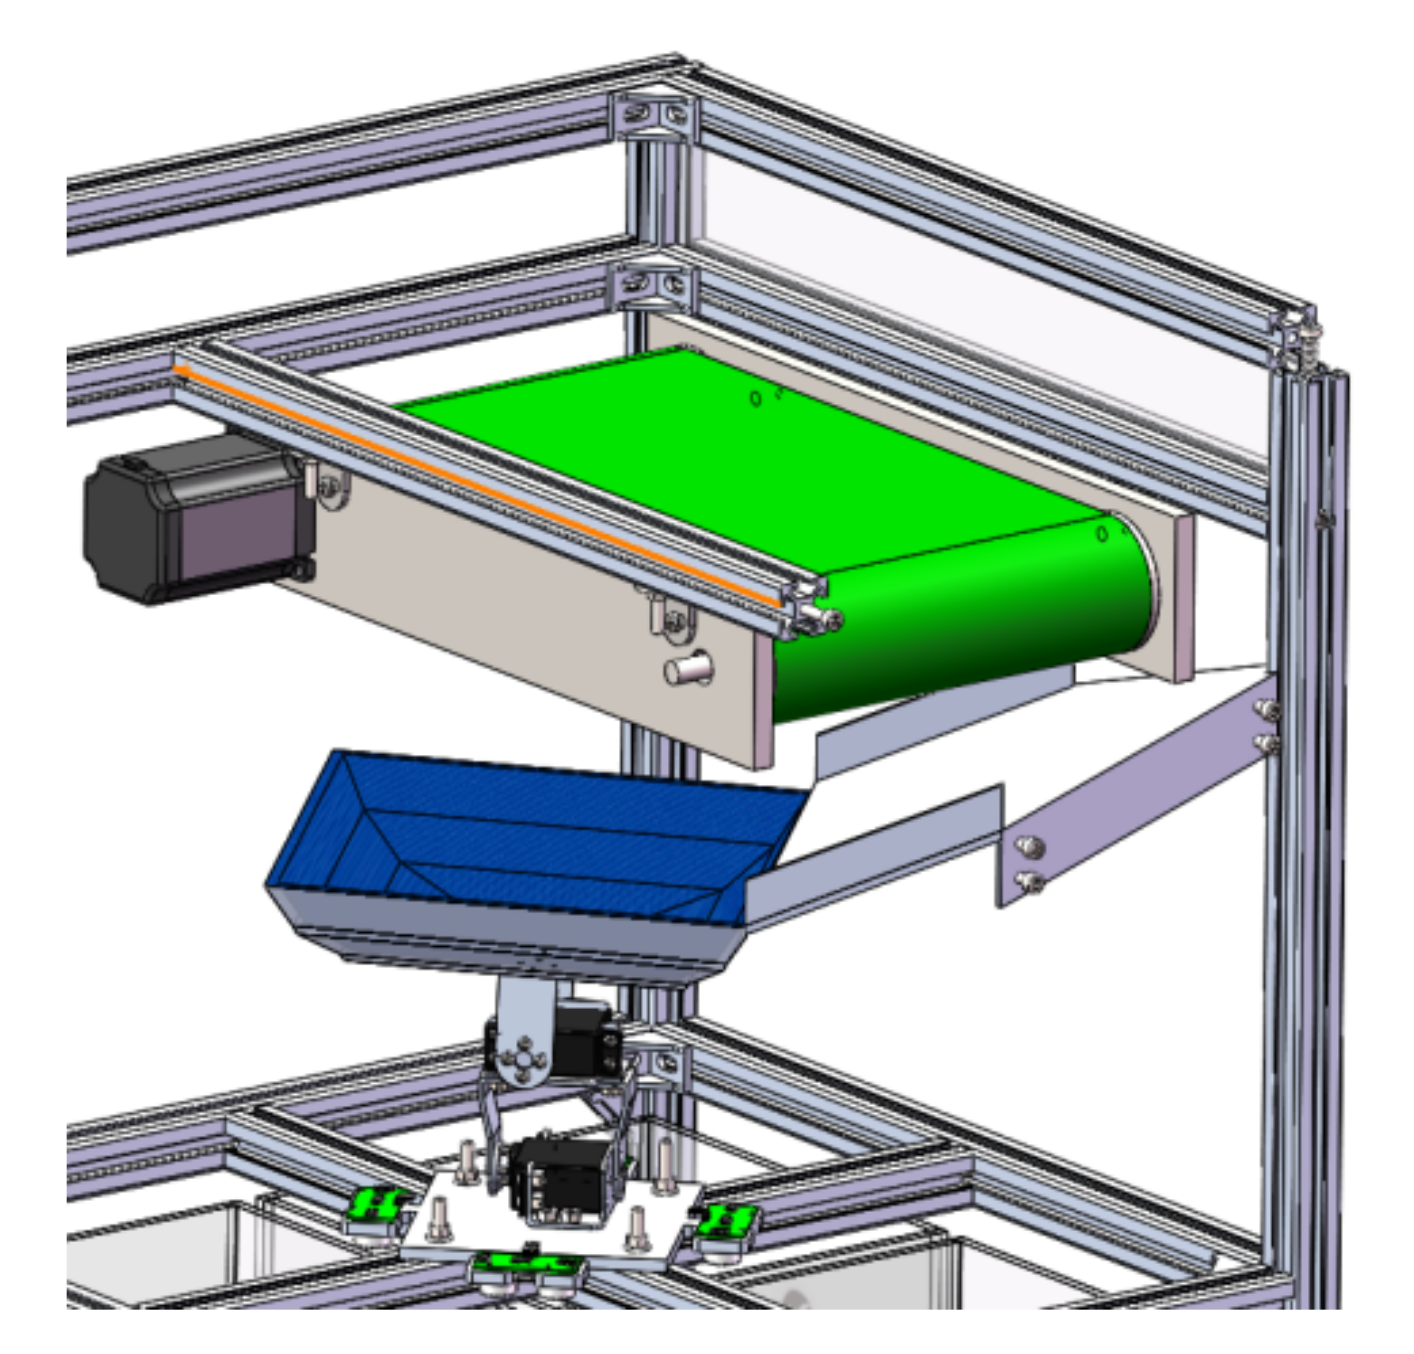
The waste management simulation equipment in the present study was designed to achieve the processing of multiple types of wastes corresponding to the actual waste management. A conveyor belt was used for the waste separation process, and the sorting section was characterized by a two-DoF parallel platform. The separation and the sorting sections were connected by a slideway. A 3D model of the overall structure of the equipment is presented in Figure 2. The separation and sorting sections were coordinated to achieve the sorting of four types of waste: recyclable waste, hazardous waste, kitchen waste, and other types of waste.
2.1. Two-DoF Parallel Platform for Waste Sorting
The sorting process in current small-scale waste sorting systems can be divided into three sections as follows.
- (1)
- The bottom of the waste identification platform has a door, and four waste cans are placed on a rotatable base. The waste type is first identified then the corresponding waste can is rotated to the bottom of the identification platform, and the door is opened for waste sorting. This strategy is currently applied in China’s garbage classification industry.
- (2)
- The trash cans are placed side by side, and the motor moves the identification table straight to the top of each type of trash can for delivery. This strategy is similar to the sorting device designed by Zhang et al. in 2021.
- (3)
- The entire identification platform is a rota-platform. The platform rotates to a position above the corresponding waste bin, after identification of the type of waste, for waste delivery [11]. This sorting mechanism was previously designed by Dai et al. in 2021.
These methods comprise two consecutive steps namely: waste positioning and delivery. Notably, only one type of waste can be processed at a time in the two-step methods, making the process very inefficient. Positioning and delivery of wastes are carried out simultaneously by imitating manual waste sorting behavior. Therefore, a one-step sorting design was explored in the present study.
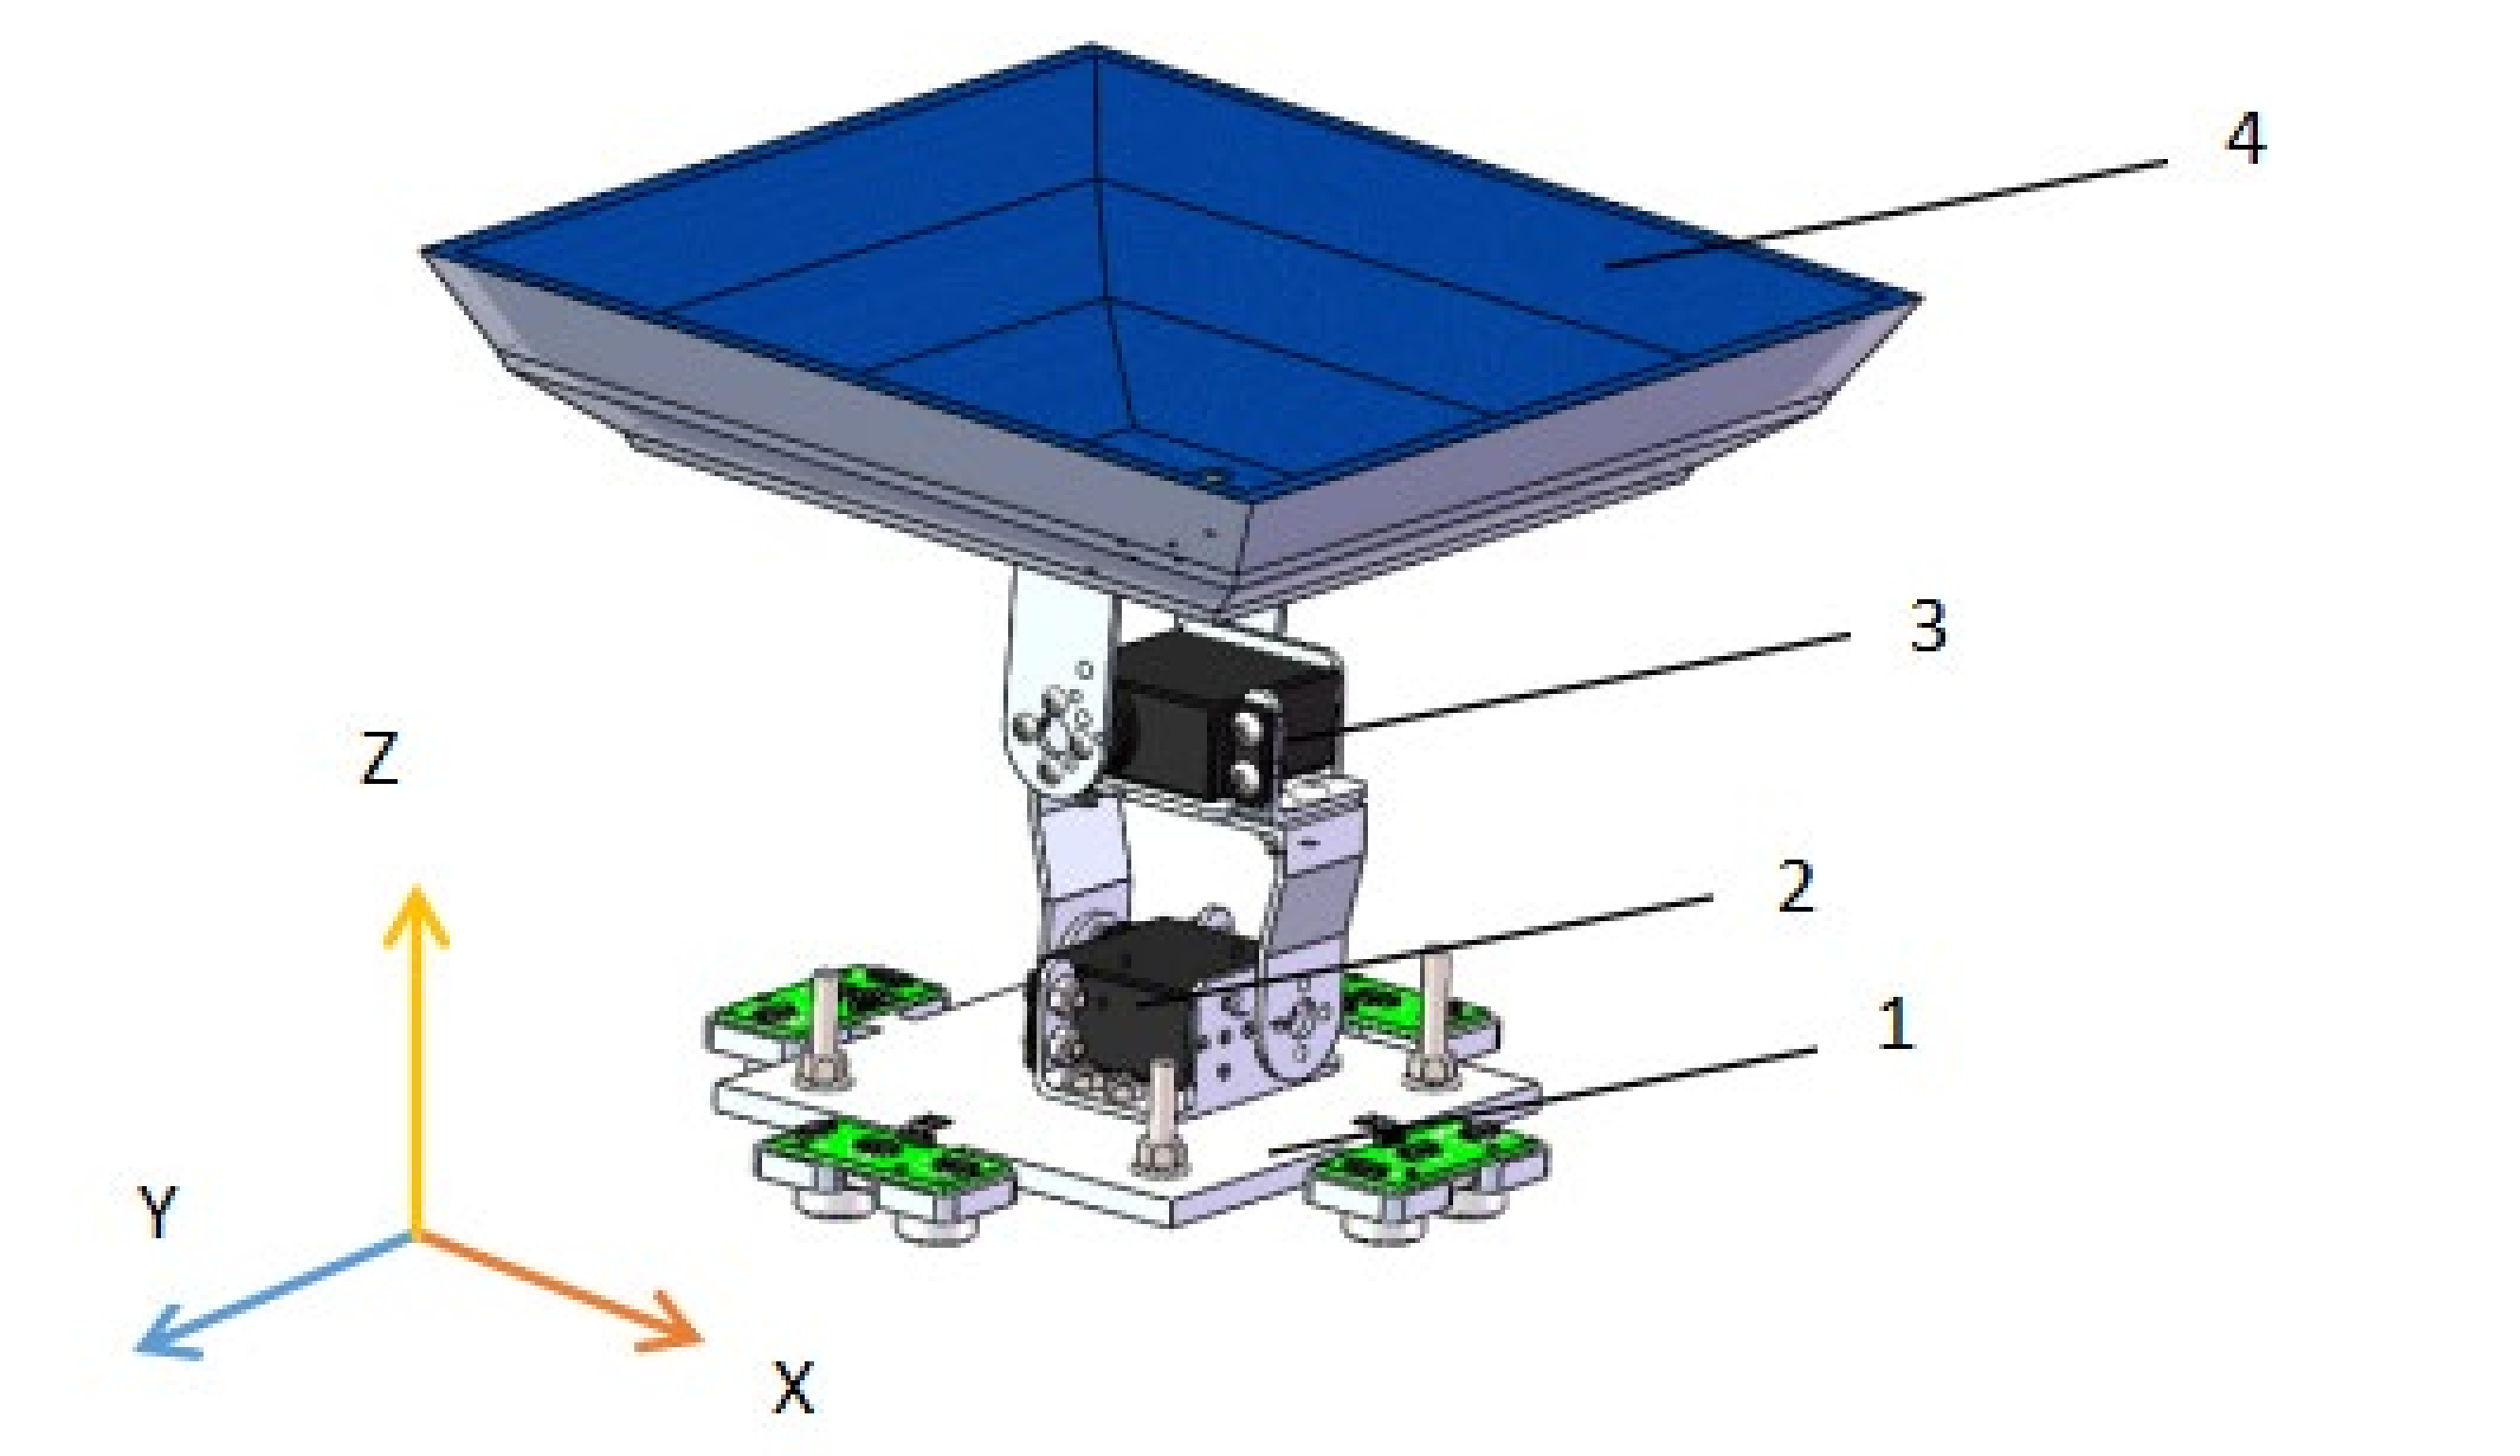
The two-DoF parallel sorting mechanism comprises a base, a driving steering gear, a rocker bracket, and a waste identification platform (Figure 3). The upper and lower steering gears were adopted to provide the rotational torque of the platform. The rocker bracket transmits torque and withholds loads. The lower steering gear ensures that the identification platform rotates at +80° or −80° around the x-axis, achieving delivery of hazardous waste and recyclable waste, respectively. The upper steering gear rotates the identification platform at +80° or −80° around the y-axis to achieve delivery of other types of waste and kitchen waste. The design proposed in the present study only requires one steering gear to perform an 80° rotation and a reset function for each type of waste. Testing of a physical prototype revealed that the one-step sorting was completed in about 1 s with the motor at full speed, and the efficiency was four-fold higher compared with that of traditional two-step methods.
The identification platform receives the waste and identifies its type as well as carries out waste sorting. The center of the identification platform is a 60 mm × 60 mm horizontal plane, and the four sides are three-stage slopes with different inclination angles. The acute angle between the slopes and the horizontal plane gradually increases from the bottom to the top, thus the platform forms a bowl shape. This design was chosen to buffer the speed of the waste through the varying slopes. This prevents the waste from rushing out of the platform and ensures that the waste rapidly achieves a low speed in the central horizontal plane or becomes static. These features allow the stability and the placement of the waste to be well-positioned for image collection.
2.2. Conveyor Belt Mechanism
The separation and sorting sections can be classified into two types according to the placement of the waste, (namely, random position and linear placement), to meet the requirements of multiple waste sorting simultaneously. The waste separation mechanism should have a robotic arm to perform multiple complex actions, such as identification, positioning, grasping, moving, and throwing, due to its randomness for the random waste placement process. This implies that the process relies on computer vision for target detection [12,13,14]. The recognition accuracy is high whereas the recognition speed is not ideal when the R-CNN algorithm of the Region Proposal Network is used for this process [15]. The one-stage algorithm is characterized by a high speed and sub-optimal accuracy [16]. This implies that recognition of multiple objects is complex and inevitably affects the recognition speed and accuracy. Moreover, the mechanical arm is a complex system and is characterized by various uncertainties such as parameter perturbation, external interference, and unmodeled dynamics [17]. Notably, the model of the arm is complex. The motion trajectory of the joint space, which is very inefficient and not cost-effective in small-scale waste sorting systems, should be carefully chosen for different tasks [18]. A conveyor belt separation and feeding mechanism was designed to achieve linear placement of multiple types of waste. As a result, only one type of waste is placed on the platform each time, increasing the accuracy and speed of image recognition.
The conveyor belt is divided into compartments to ensure that the waste is placed linearly, allowing sequential identification and delivery to the corresponding waste can. Image recognition is conducted in the conveyor belt area to fully utilize the high accuracy and efficiency of the two-DoF parallel platform. The conveyor belt moves the waste forward to a slideway at the end of the conveyor belt and delivers the waste to the lower sorting platform. The conveyor belt stopping time = t is presumed to be equal to the duration between falling of waste into the sorting mechanism to completion of identification and sorting. The conveyor belt then moves forward every time = t to transport waste to the lower sorting mechanism, and the belt displacement is equivalent to the length of one compartment. Identification and sorting are immediately performed when an item of waste is delivered to the identification platform. These steps are repeated until all the waste is processed. The speed and pause time = t of the conveyor belt can be preset, since the time needed for each incidence of waste sorting is certain and stable. Therefore, the conveyor belt separation system and the sorting system are coordinated without communication.
The slideway performs the following three functions: (1) it effectively connects the conveyor belt and the identification platform; (2) it ensures vertical positioning of the waste movement path, which makes full use of the internal space of the waste can; (3) it buffers the gravitational potential energy of the waste falling from the conveyor belt, reducing its impact on the recognition platform, and stabilizes the waste on the recognition platform.
The conveyor belt has a length of 360 mm and a width of 200 mm. The conveyor belt is divided into three equal compartments using rigid plates. The size of each compartment is 120 × 200 mm. One type of waste is placed in each compartment during the waste management process. Rotation of the conveyor belt is driven by a stepping motor, which is controlled by a single-chip microcomputer. The time required from the waste falling from the slideway to the completion of waste sorting is 1.4–1.6 s based on the actual measurement. The pause time = t of the conveyor belt was set to 1.8 s, thus a different type of waste is sorted after a duration of 1.8 s.
3. Image Intelligent Classification Software Design
3.1. Waste Image Sample Preprocessing
The surface of the garbage identification table facing the camera was covered with blue paint in the prototype design. The inserted materials are transferred to the garbage identification platform by the distributing mechanism. The garbage identification section is easily contaminated, and the geometry of domestic garbage is irregular. Therefore, it is easily interfered by background pollutants during image processing, reducing the accuracy of recognition. Separation of material and background pollutants is achieved based on HSV (Hue, Saturation, Value) color space [19]. The HSV color space is adopted to decompose the background from the overall color, since the background of the recognition station is uniformly set to blue. The thresholds of the H value, S value, and V value corresponding to the blue background are approximated through repeated experiments, and the final HSV threshold set ranged from (100, 75, 145)~(130, 255, 255). The comparison chart of the before and after processing effect after color space separation and filtering is presented in Figure 4. The findings showed that the material entity in the image became the main part under the black background and exhibited few noise impurities after background separation and filtering.
The material entities were dominant in the processed image, leaving a residual noise when the color space is used to separate the background. The Canny edge detection algorithm was then applied to obtain the edge contour information in the image. The effective information and the noisy information were distinguished, and the noise was removed according to the perimeter of the contour [20]. The processing effect is presented in Figure 5. Unnecessary or redundant interference information in the image data was completely removed after noise processing using the Canny edge detection algorithm.
The garbage pattern was moved to the center of the image field of view, owing to the randomness of the position of the material falling into the garbage identification table to improve the accuracy of image identification. The circumscribed rectangle of the garbage outline was initially confirmed, then the length and width of the circumscribed rectangle and the coordinate position of the center point were recorded. Further, the garbage pattern was determined from the point coordinates of the rectangle. The center point of the circumscribed rectangle of the garbage image was coincident with the center point of the all-black image in the newly created all-black image to complete centering conversion of the garbage image. The processing effect before and after pattern centering conversion is presented in Figure 6.
3.2. Target Detection and Classification Algorithm Based on YOLOv5
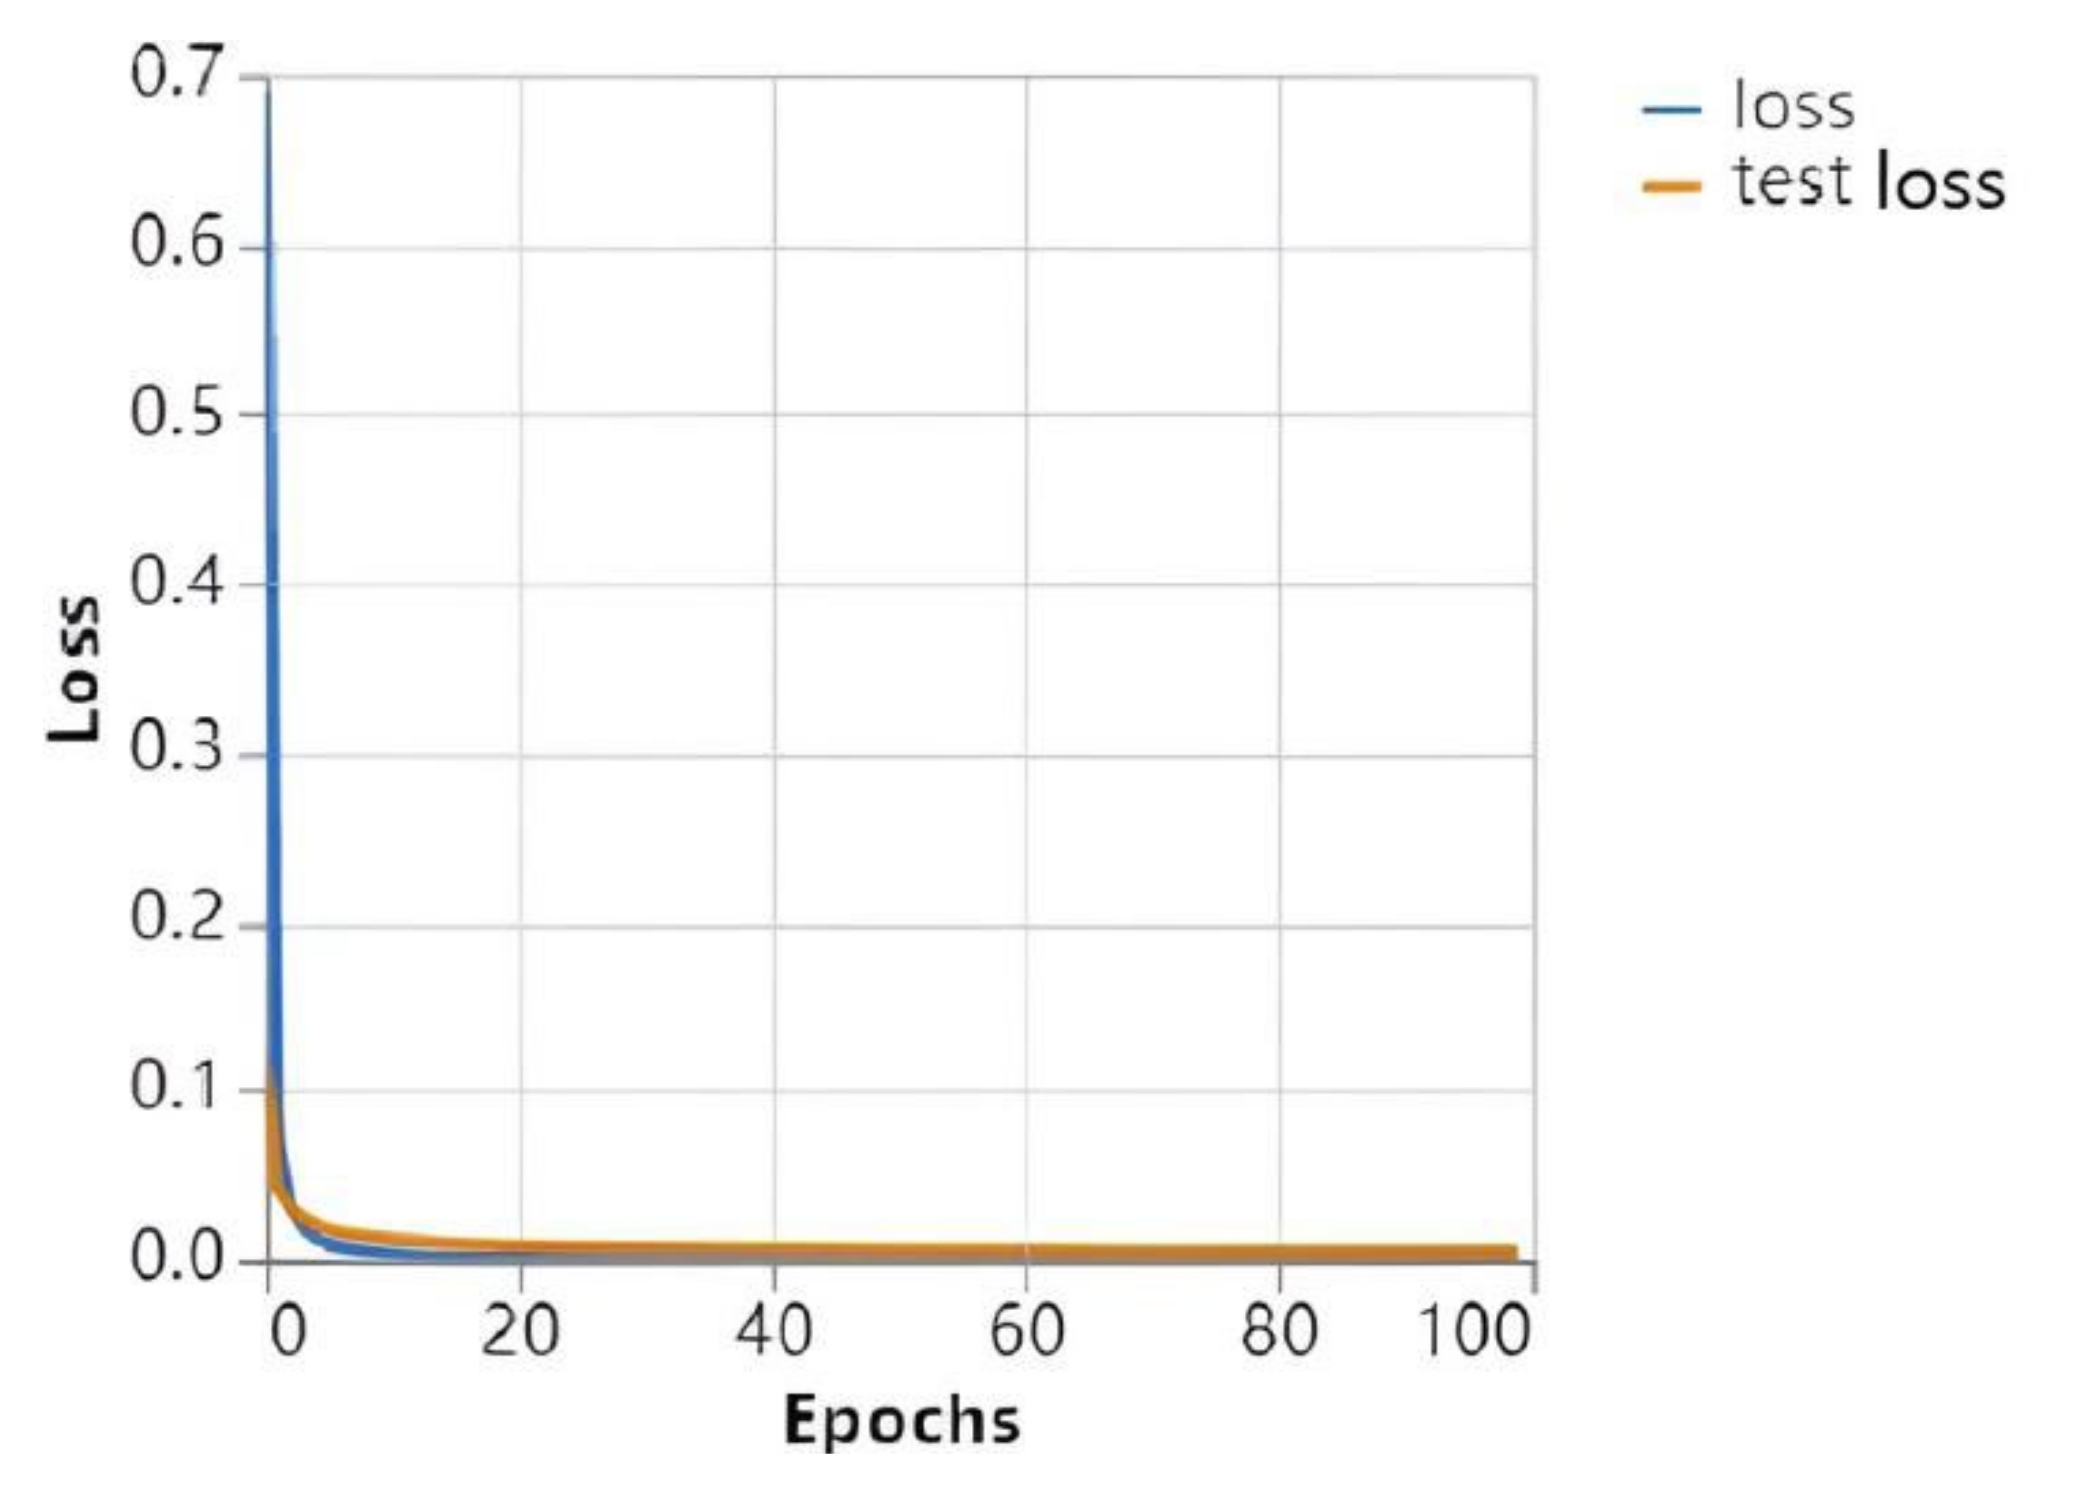
The YOLO algorithm is used for classification and localization of target detection based on a neural network and has been widely used in the field of target detection. YOLOv5 technology is currently advanced and has the advantages of high recognition rate, low false alarm rate, easy-to-read code, convenient format conversion, and high work efficiency [21]. Therefore, YOLOv5 plays a key role in garbage classification recognition and classification. The garbage categories in the algorithm test experiment were set to eight kinds of cans, mineral water bottles, potatoes, carrots, white radishes, broken ceramic chips, batteries, and pebbles. Each category dataset comprised 100 image samples, grouped into 85 training sets and 15 test sets. The parameter training uses the SGD optimization algorithm [22]. The parameters were set as follows: batch size of 32, epoch number at 100, the learning rate was dynamically adjusted by cosine annealing strategy, the initial learning rate was 0.01, and GIOU Loss was used as the loss function [23]. The loss function curves of the training set and test set of the YOLOv5 network are presented in Figure 7. The findings showed that the initial loss function value of the algorithm was small, the convergence speed was high, and the convergence state was good (Figure 7).
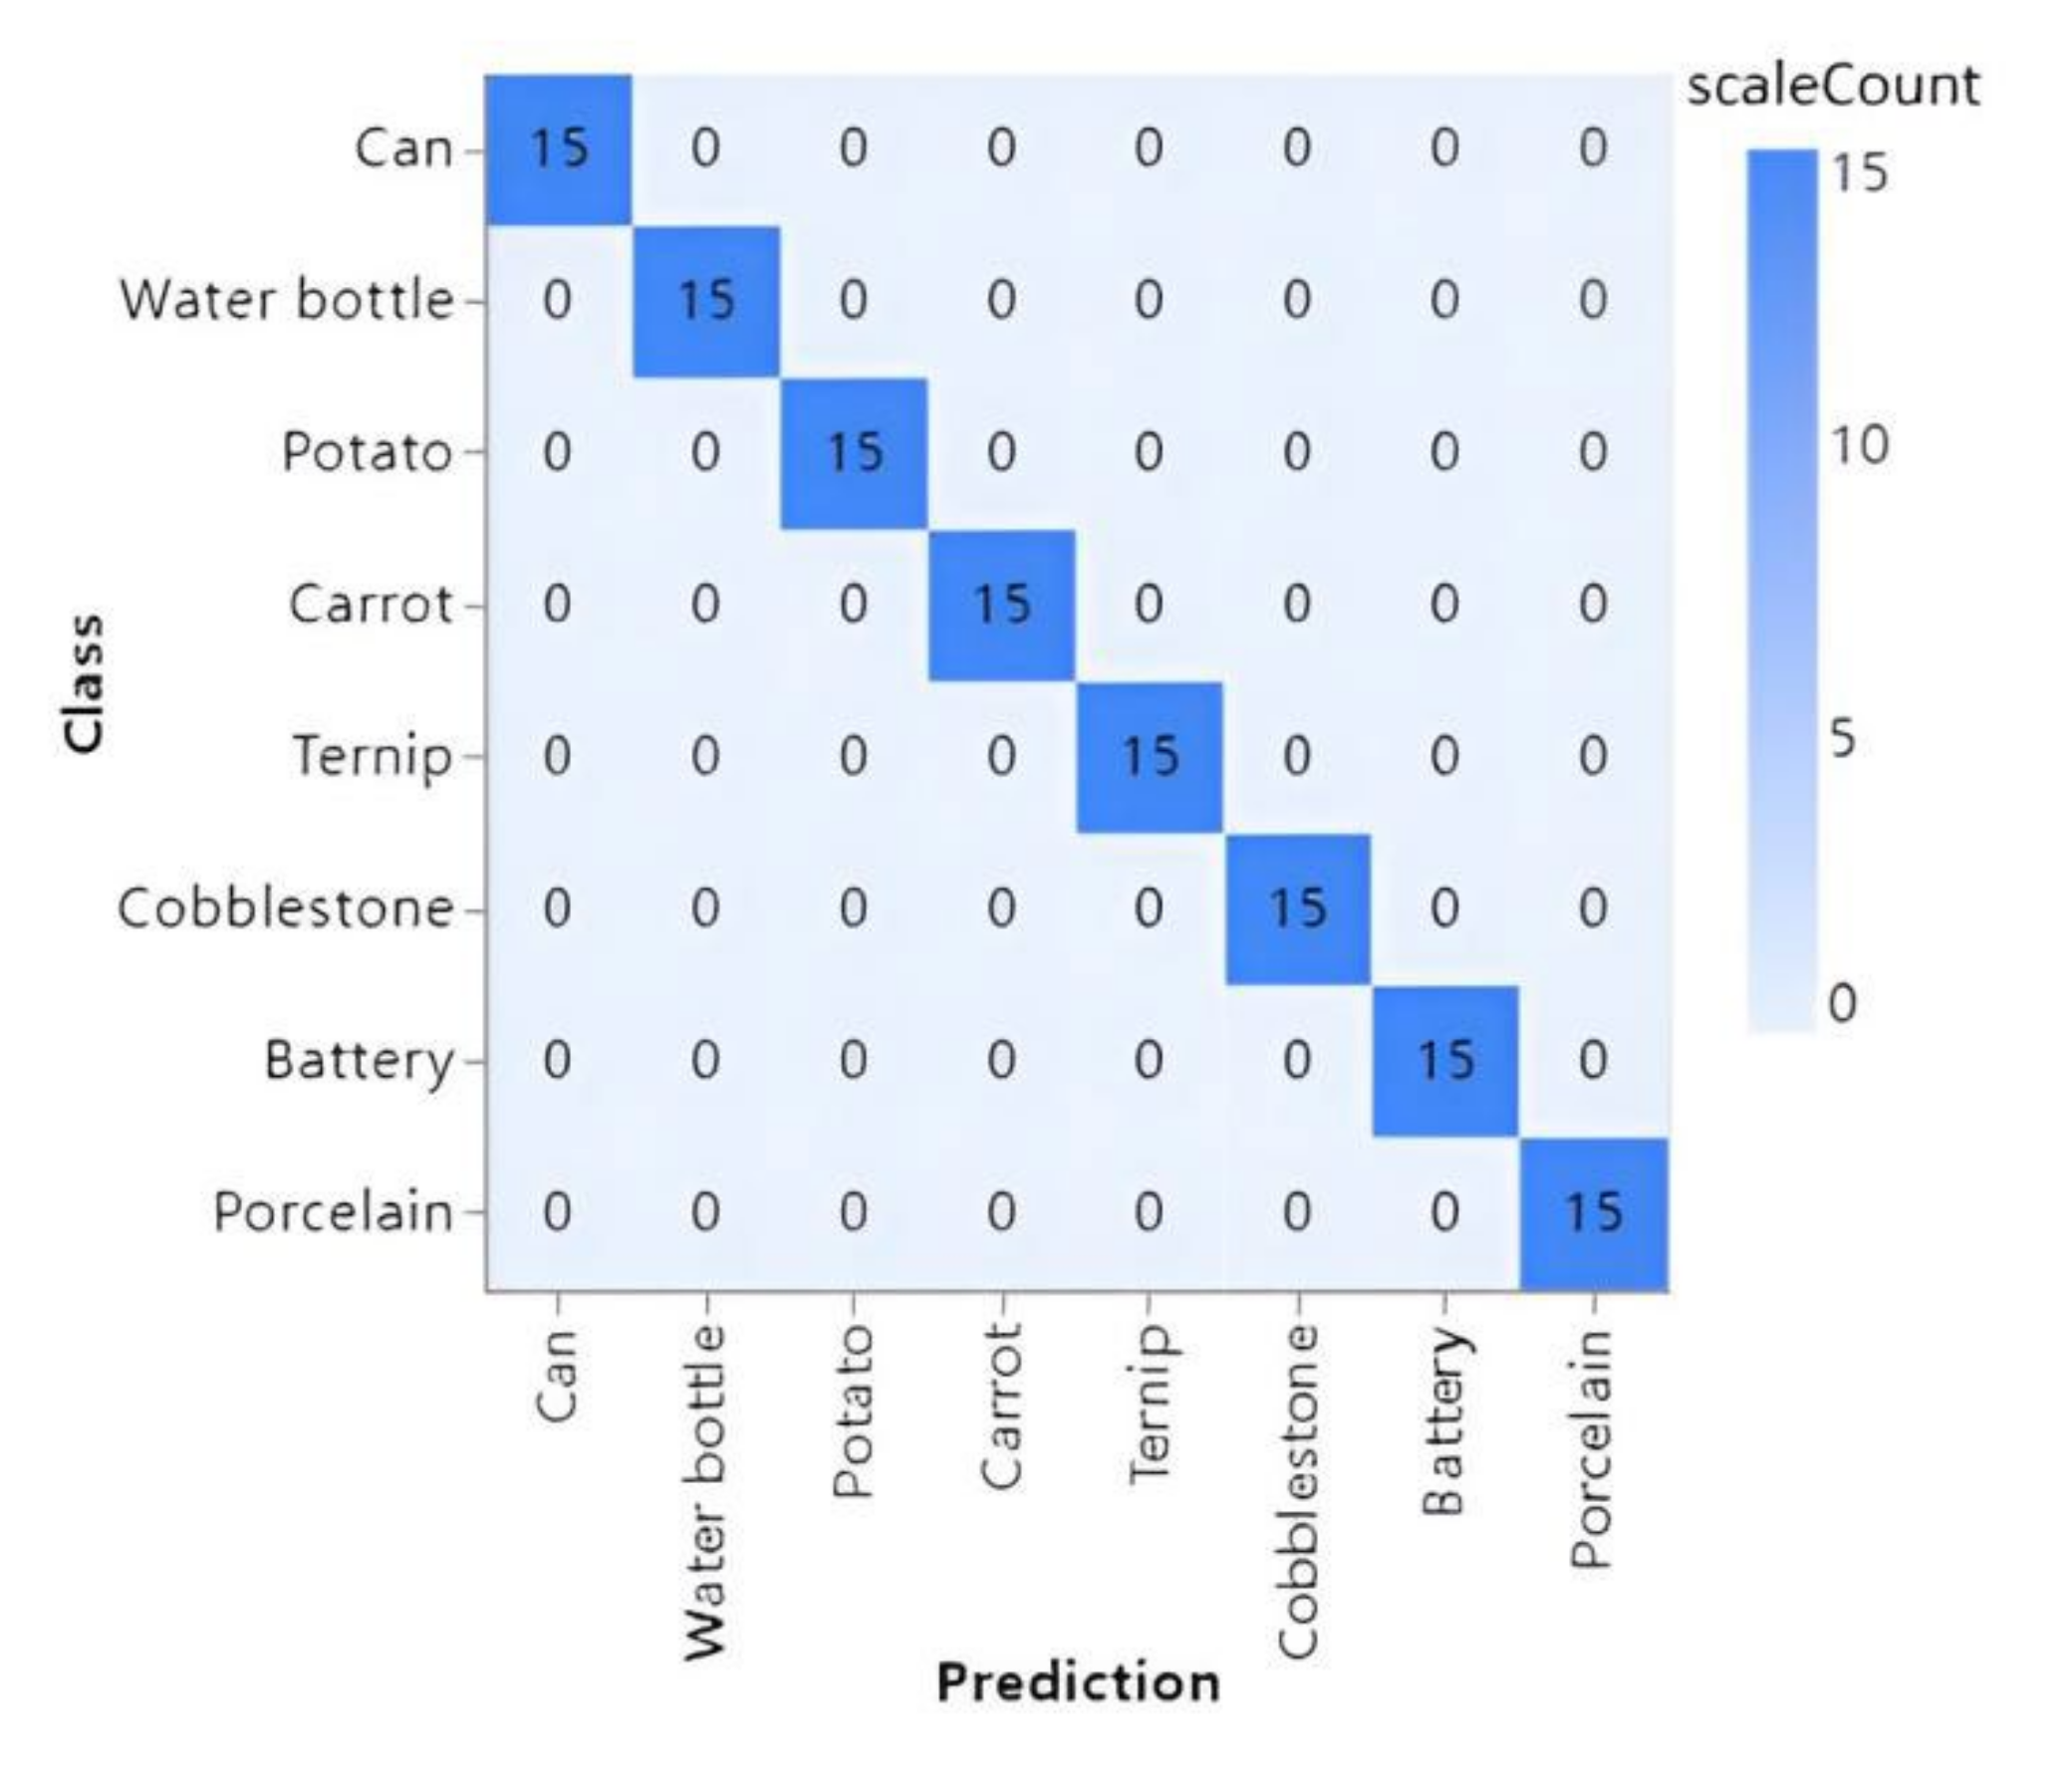
The confusion matrix image is presented in Figure 8. The accuracy rate of all kinds of garbage recognition in the test set comprising 15 images in each of eight categories reached 100%, the theoretical test results of the YOLOv5 algorithm were good, and the accuracy was high.
4. Finite Element Analysis of the Waste Sorting Platform
4.1. Modeling
The prototype model of classification mechanism and material distribution mechanism was established using SolidWorks tool. The height of the sorting mechanism was 166 mm in a completely vertical state. The size of the side of the garbage identification table was 210 mm × 210 mm, the size of the central horizontal plane was 60 mm × 60 mm, and the inner depth was 45 mm. The three-level slopes around the garbage identification platform were initially set, and the included angles with the horizontal plane were 15°, 37°, and 60° from bottom to top. The lengths from the rotation center axis of the upper and lower steering gear rocker arms of the classification mechanism to the top of the rocker arms were 39.5 mm and 42 mm, respectively. The vertical drop between the upper surface of the conveyor belt and the highest point of the garbage identification table was 140 mm, and the inclination angle of the slideway in the distributing mechanism was set to 15°. The bottom of the slideway and the side of the identification table were always in a coincident relationship.
Some features such as threaded holes and rounded corners were used in the actual design of the sorting mechanism in this study for connection and good appearance. These features did not affect the mechanical properties of the platform and were thus simplified [24]. The shell structure, reduction gear set, and control chip of the high-speed steering gear that provided torque in the mechanism were neglected in the finite element analysis of the overall mechanism, and the steering gear was simplified as a rotation pair. The mechanism was thus first simplified to accommodate the computer resources before analysis.
4.2. Static Analysis
The steering gear and identification platform were designed from Q235 steel to obtain excellent performance and improve the fatigue strength and welding performance of the mechanism [25]. The density of the Q235 steel was 7.85 g/cm3, the elastic modulus was 205 GPa, the Poisson’s ratio was 0.29, and the tensile strength and yield strength were 460 MPa and 235 MPa, respectively. The base supported the entire mechanism and maintained its stability. Q345 steel was used for construction of the base [26,27]. The density of Q345 steel was 7.86 g/cm3, the elastic modulus was 209 GPa, the Poisson’s ratio was 0.29, and the tensile strength and the yield strength were 620 MPa and 345 MPa, respectively [28,29]. The material properties are listed in Table 1.
ANSYS software was used for meshing [30], and the element size control mode was set as fine. Hexahedral elements were utilized for the structurally simple entities such as the base and steering arm. Tetrahedral ten-node elements were used for the identification platform. The target quality of mesh was set to 0.5, and high-quality mesh smoothing was applied. The model was preliminarily divided into 127,497 units and 233,093 nodes. The mesh quality is presented in Figure 9. Analysis of the mesh showed that the overall quality was between 0.85 and 1, which satisfied the requirements (Figure 9).
The mesh independence analysis was required to carry out using finite element numerical simulation using the maximum static stress and displacement of the platform as objects. The independence analysis was conducted with different mesh quantities, including 29,636, 31,778, 43,797, 87,963, 119,415, and 165,115. The calculated values of the objects under the condition of different mesh quantities are presented in Table 2.
The values showed that the quantity of meshes brings about significant impact on the numerical simulation results (Table 2). The maximum static stress and maximum displacement were significantly different when the mesh quantity is below 110,000, relative to the values obtained by applying dense grids. Notably, the values steeply increased with increase in mesh quantity. Maximum static stress and maximum displacement showed convergence when the mesh quantity was above 110,000. In summary, the findings showed that the initial quantity of meshes (127,497 units and 233,093 nodes) met the independence requirements of finite element analysis.
4.3. Stress Analysis
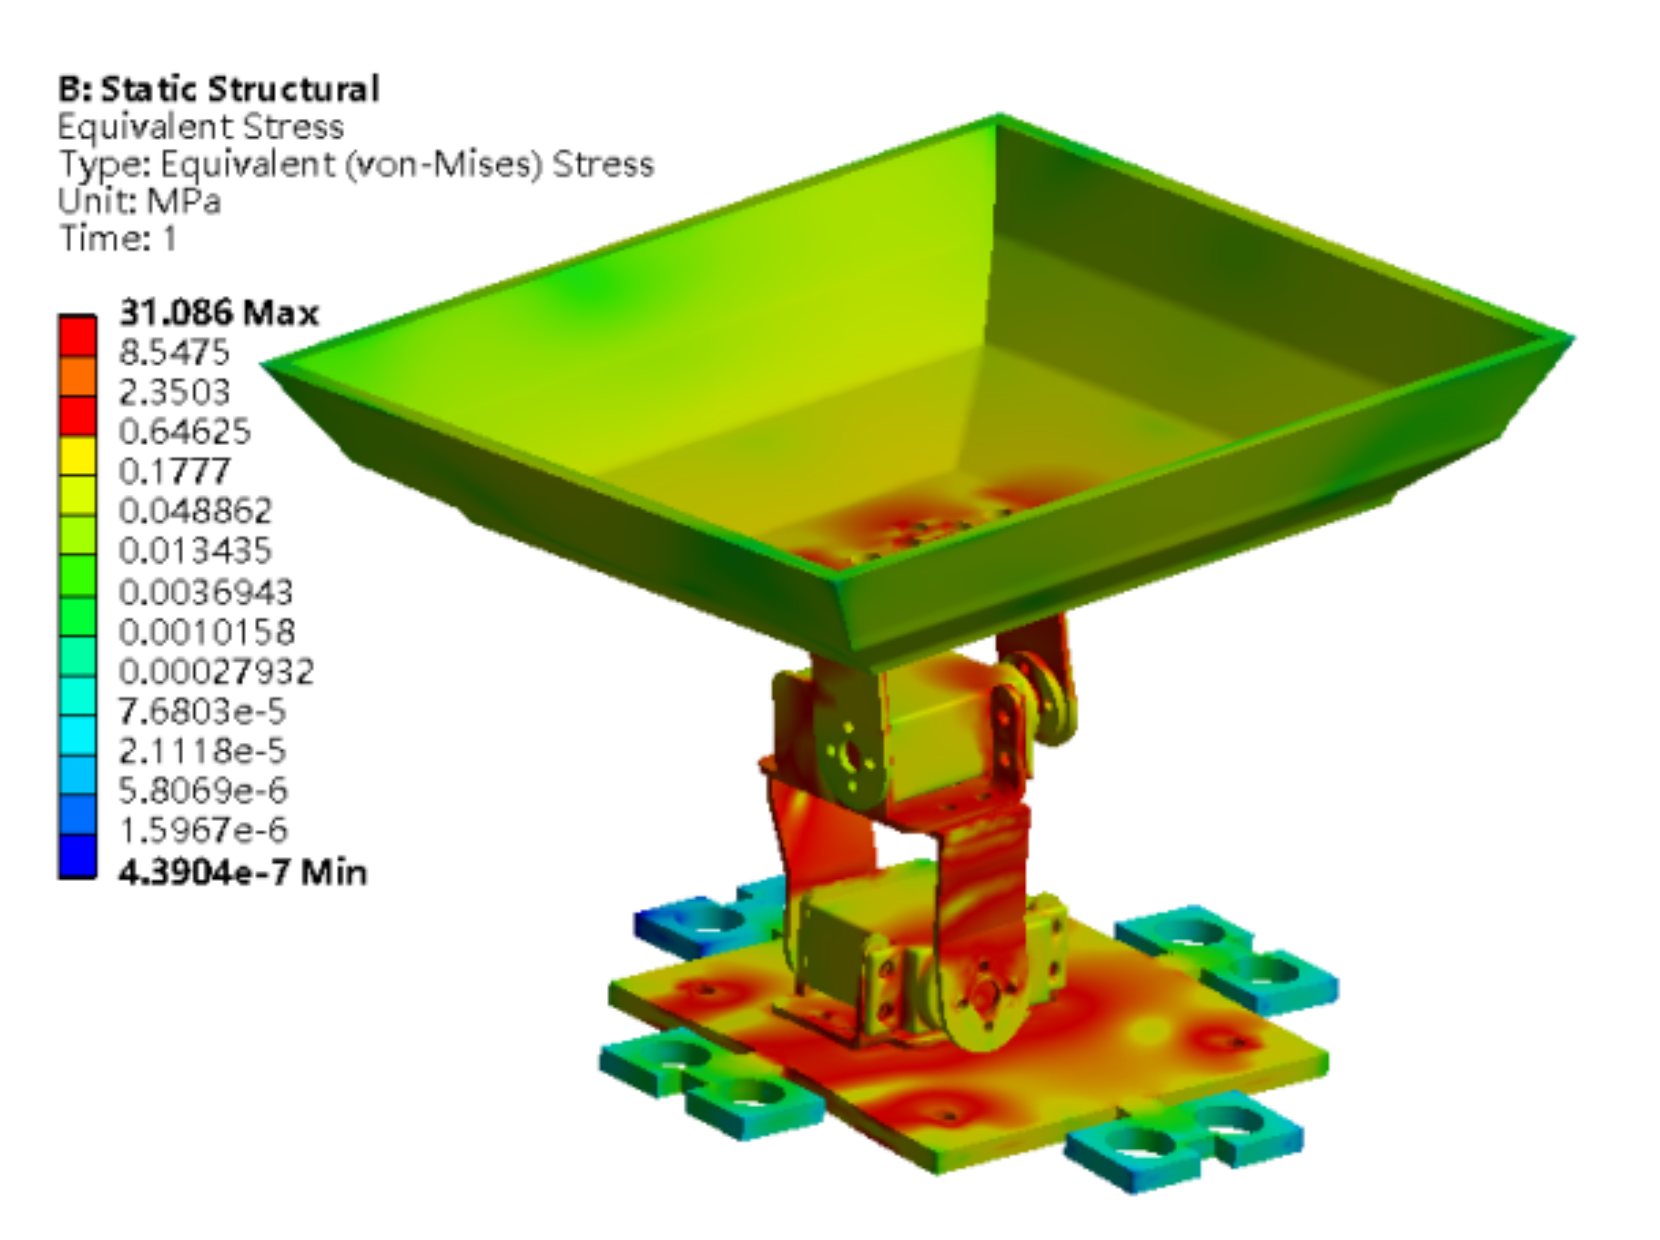
The gravity loads were set at appropriate positions in the sorting mechanism. The overall stress map of the platform after mechanical analysis is shown in Figure 10. The maximum stress was observed at the support arm of the steering gear and the contact position of each connection, since the load of the upper structure produced torque. The maximum stress was 31.086 MPa, which was significantly lower compared with the maximum allowable stress and the yield strength of the material. This implies that the design met the strength requirements.
4.4. Displacement Analysis
The mechanism experienced a slight deformation because the platform was subjected to the torque generated by the weight of each component [31]. The deformation gradually increased from the bottom to the top, resulting in translation of the waste identification platform. A linear relationship between the displacement and the distance to the base is presented in Figure 11. A larger distance of an element from the base was correlated with a higher total displacement. The displacement of the base was 0 mm, implying that the base was stable. Maximum displacements were located at the four corners of the platform, with a value of ΔX = 3.52 mm. The displacement of the entire sorting mechanism was minimal and did not affect the posture of the identification platform. The displacement at the center of the waste identification platform was 1.5–1.8 mm. The maximum displacement at the corners was 1.75% of the size of the identification platform, thus it was neglected. These findings indicate that the displacement and the stability of the sorting mechanism met the design requirements.
5. Kinematic and Dynamic Simulation of the Sorting Mechanism
Kinematic and dynamic modeling and simulation were conducted to ensure that the sorting mechanism met the design requirements. Kinematic and dynamic characteristics curves were obtained by simulating the kinematic and dynamic parameters of the key components of the sorting mechanism. This process was conducted to verify the feasibility of the mechanism design and provide a theoretical basis for further optimization and experiments. The garbage model was designed as a sphere with a diameter of 80 mm. The sphere rolls down from the initial position on the slideway, at a 150 mm vertical height from the bottom of the garbage identification table. The garbage identification platform was horizontal and stationary at the initial state.
5.1. Constraints
A total of five fixed pairs were set up: slideway-ground, identification platform-upper steering arm, upper steering gear-lower steering arm, lower steering gear-base, and base-ground, according to the working conditions of the waste sorting mechanism. In addition, two rotating pairs were set up, namely: the upper steering arm-upper steering gear and the lower steering arm-lower steering gear. The constraints are listed in Table 3.
5.2. Drive
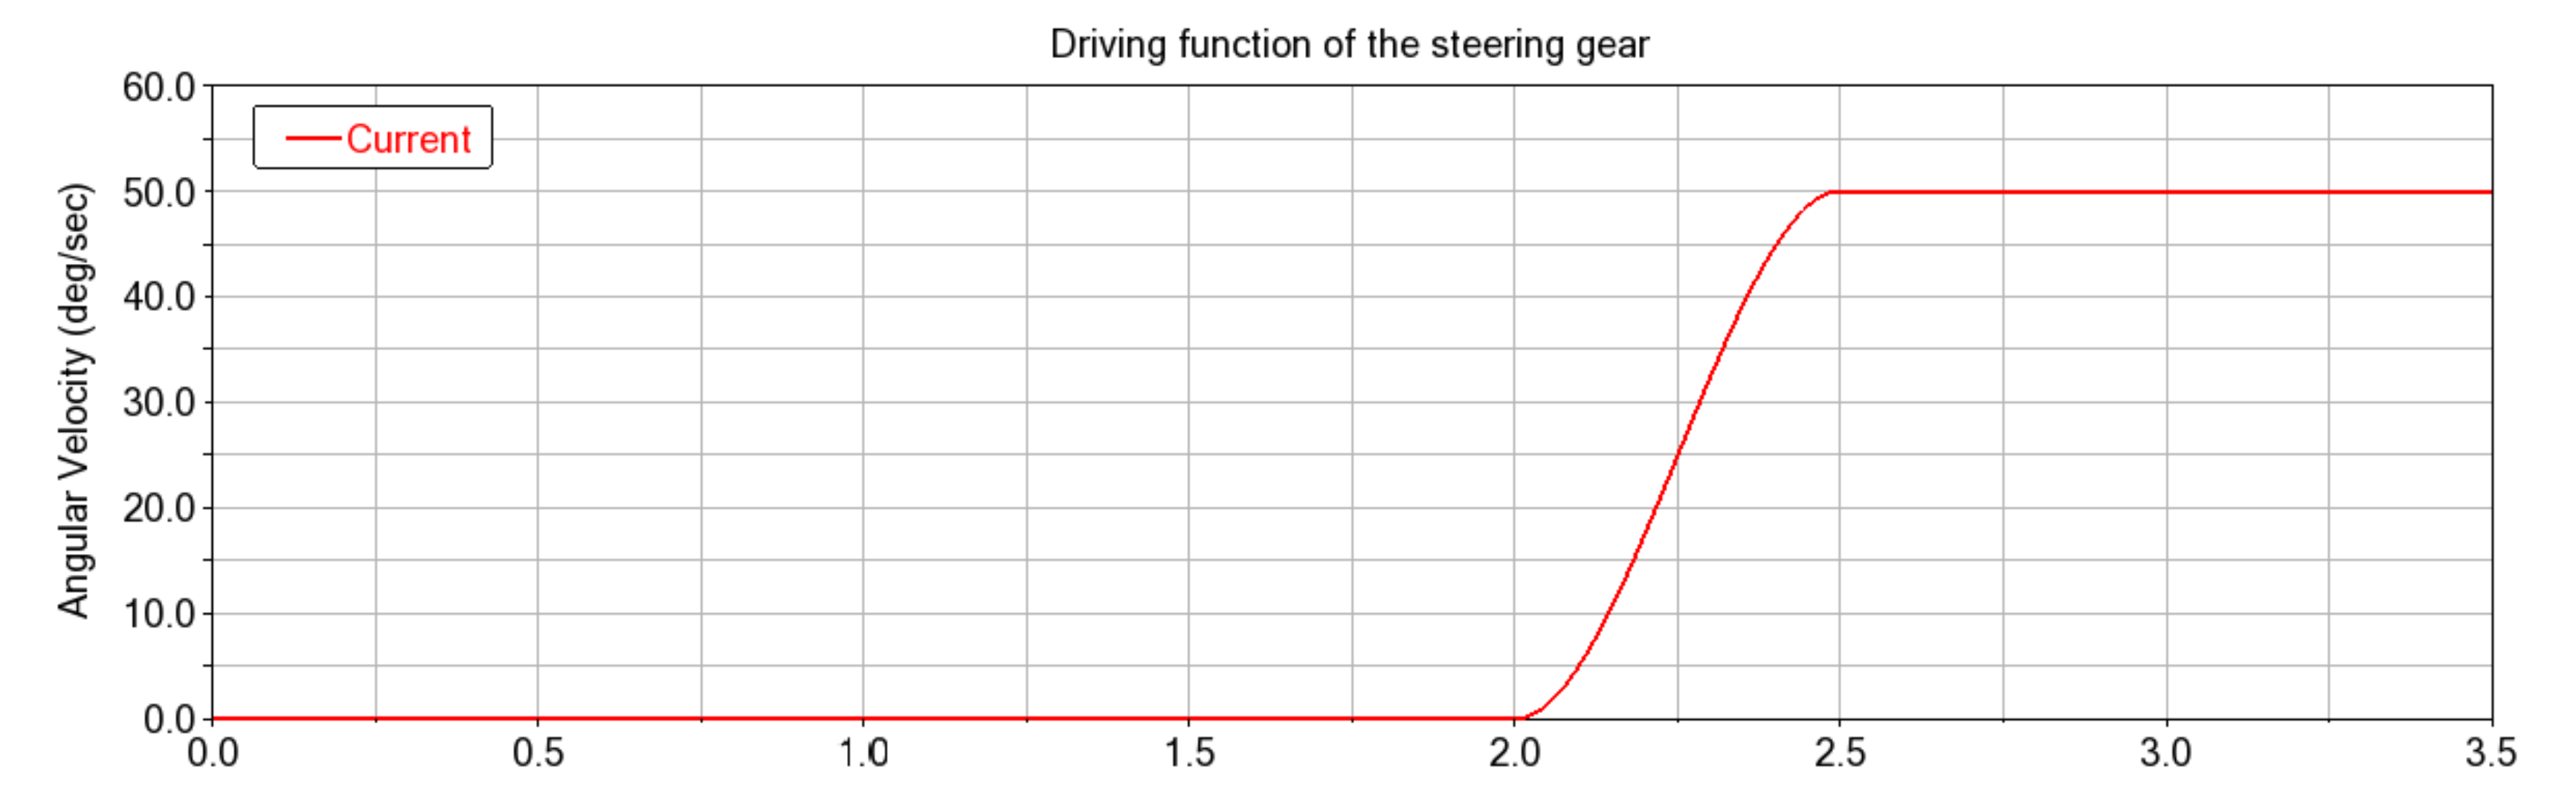
The angular velocity drive was used during simulation of the waste sorting mechanism [32], and the rotation speed was set to 50 °/s. The starting time of the steering gear was delayed by t = 2 s to simulate the waste movement in the identification platform and evaluate the feasibility of the structural design.
The driving function of the steering gear is presented below:
step (time, 2, 0, 2.5, 50 d)
The driving function is shown in Figure 12. The motor started to work from t = 2 s and reached a 50 °/s angular velocity at t = 2.5 s.
5.3. Contacts and Friction Coefficient
The contact force between the spherical waste and the identification platform is equal to the sum of the elastic force and friction [33]. The impact function in Adams software was adopted for calculation of the contact force between the sphere and the identification platform [34,35,36]. Collision between the spherical waste and the platform was equivalent to a nonlinear equivalent spring damping model based on the penetration depth [37,38]. The impact function is expressed below:
where q represents the distance variable, indicates the velocity variable, k represents the stiffness coefficient, , e indicates the exponent of force, Cmax represents the maximum damping coefficient, and d indicates the cut-in amount when the damping reaches the maximum. Calculation of the above parameters was conducted to define the contacts. The final impact function is expressed as follows:
DM and VR functions were used to determine the distance and velocity between the two entities.
The stiffness coefficient k was expressed as shown in the equation below:
where Rwaste and Rplatform indicate the curvature radii of the two objects at the collision position.
where Ewaste and Eplatform represent the elastic moduli of the two objects; μwaste and μplatform represent the Poisson’s ratios.
The maximum damping coefficient Cmax is obtained as follows:
where μ denotes the hysteresis damping factor, δ indicates the deformation of the colliding object, and e represents the exponent of force.
The values of the parameters of the impact function are presented in Table 4.
The Coulomb function was used to calculate the friction between the contact surfaces, which was equal to the product of the normal force and the friction coefficient. The static friction coefficient was applied when the relative movement speed of the two surfaces was less than the static friction conversion speed Vs. The kinetic friction coefficient was applied when the relative movement speed was greater than the kinetic friction conversion speed Va. The kinetic and static friction coefficients were associated with the material properties and the surface roughness of the two objects. Q235 material was used for the garbage identification station. The density of the Q235 material was 7.85 g/cm3, the elastic modulus was 205 GPa, and the Poisson’s ratio was 0.29. Stainless steel was selected because the middle section of the slideway was subjected to the impact load caused by falling materials and required high corrosion resistance. The density of the stainless-steel material was 7.75 g/cm3, the Young’s modulus was 1.9 × 10⁵ N/mm2, and the Poisson’s ratio was 0.305. The ball was made of copper material, with a material density of 8.906 g/cm3, Young’s modulus of 1.19 × 10⁵ N/mm2, and Poisson’s ratio of 0.326. The values of the friction coefficients used in this study are presented in Table 5:
5.4. Analysis of Waste Displacement Curve
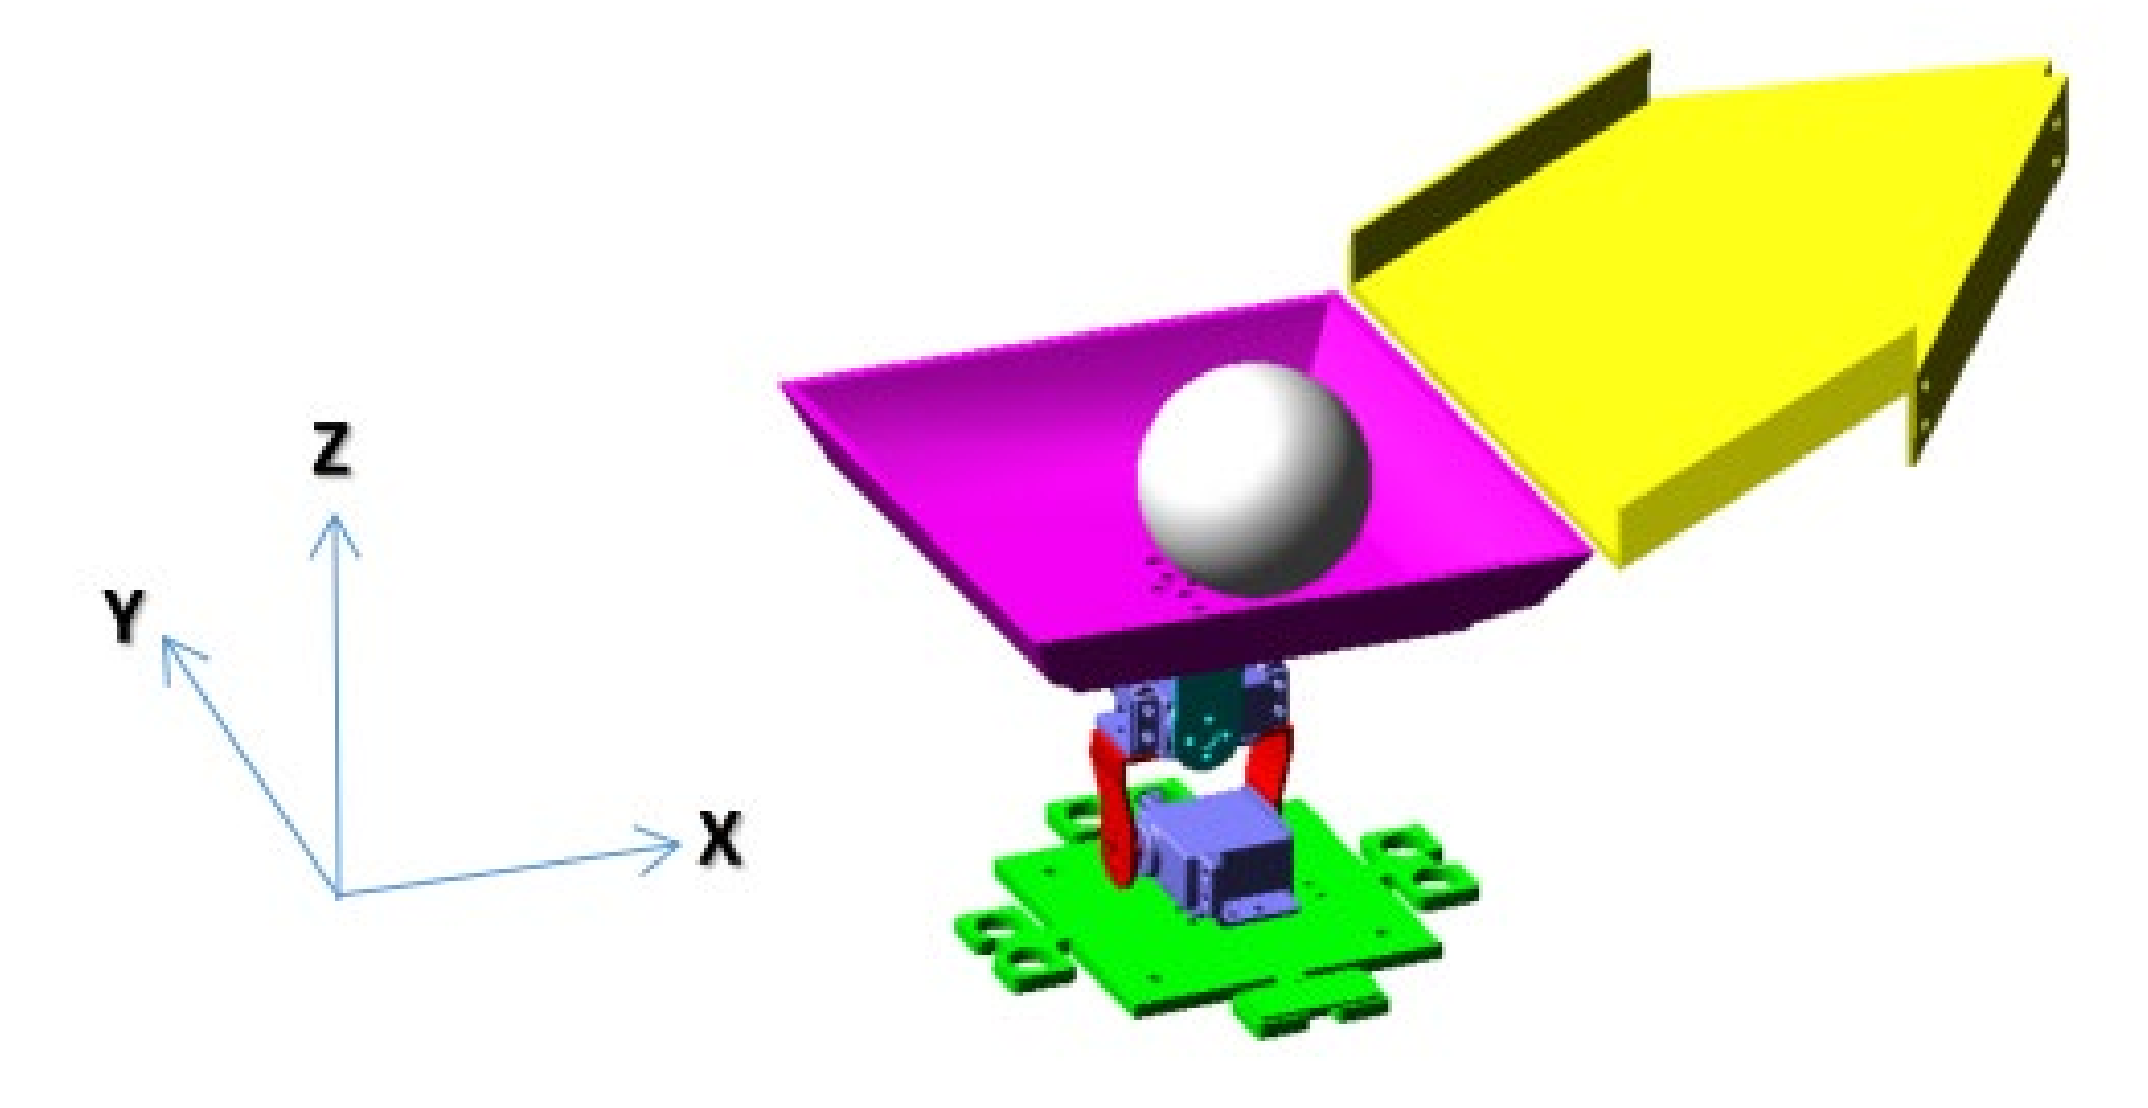
The coordinate system of the 3D model is presented in Figure 13. The x-axis in the figure represents the horizontal direction of the slideway, the y-axis is perpendicular to the x-axis on the horizontal plane, and the z-axis indicates the vertical direction. The process of waste rolling from the initial position to the identification platform to complete waste classification was simulated in this coordinate system. Further, the kinematics and dynamics simulations of the process were analyzed.
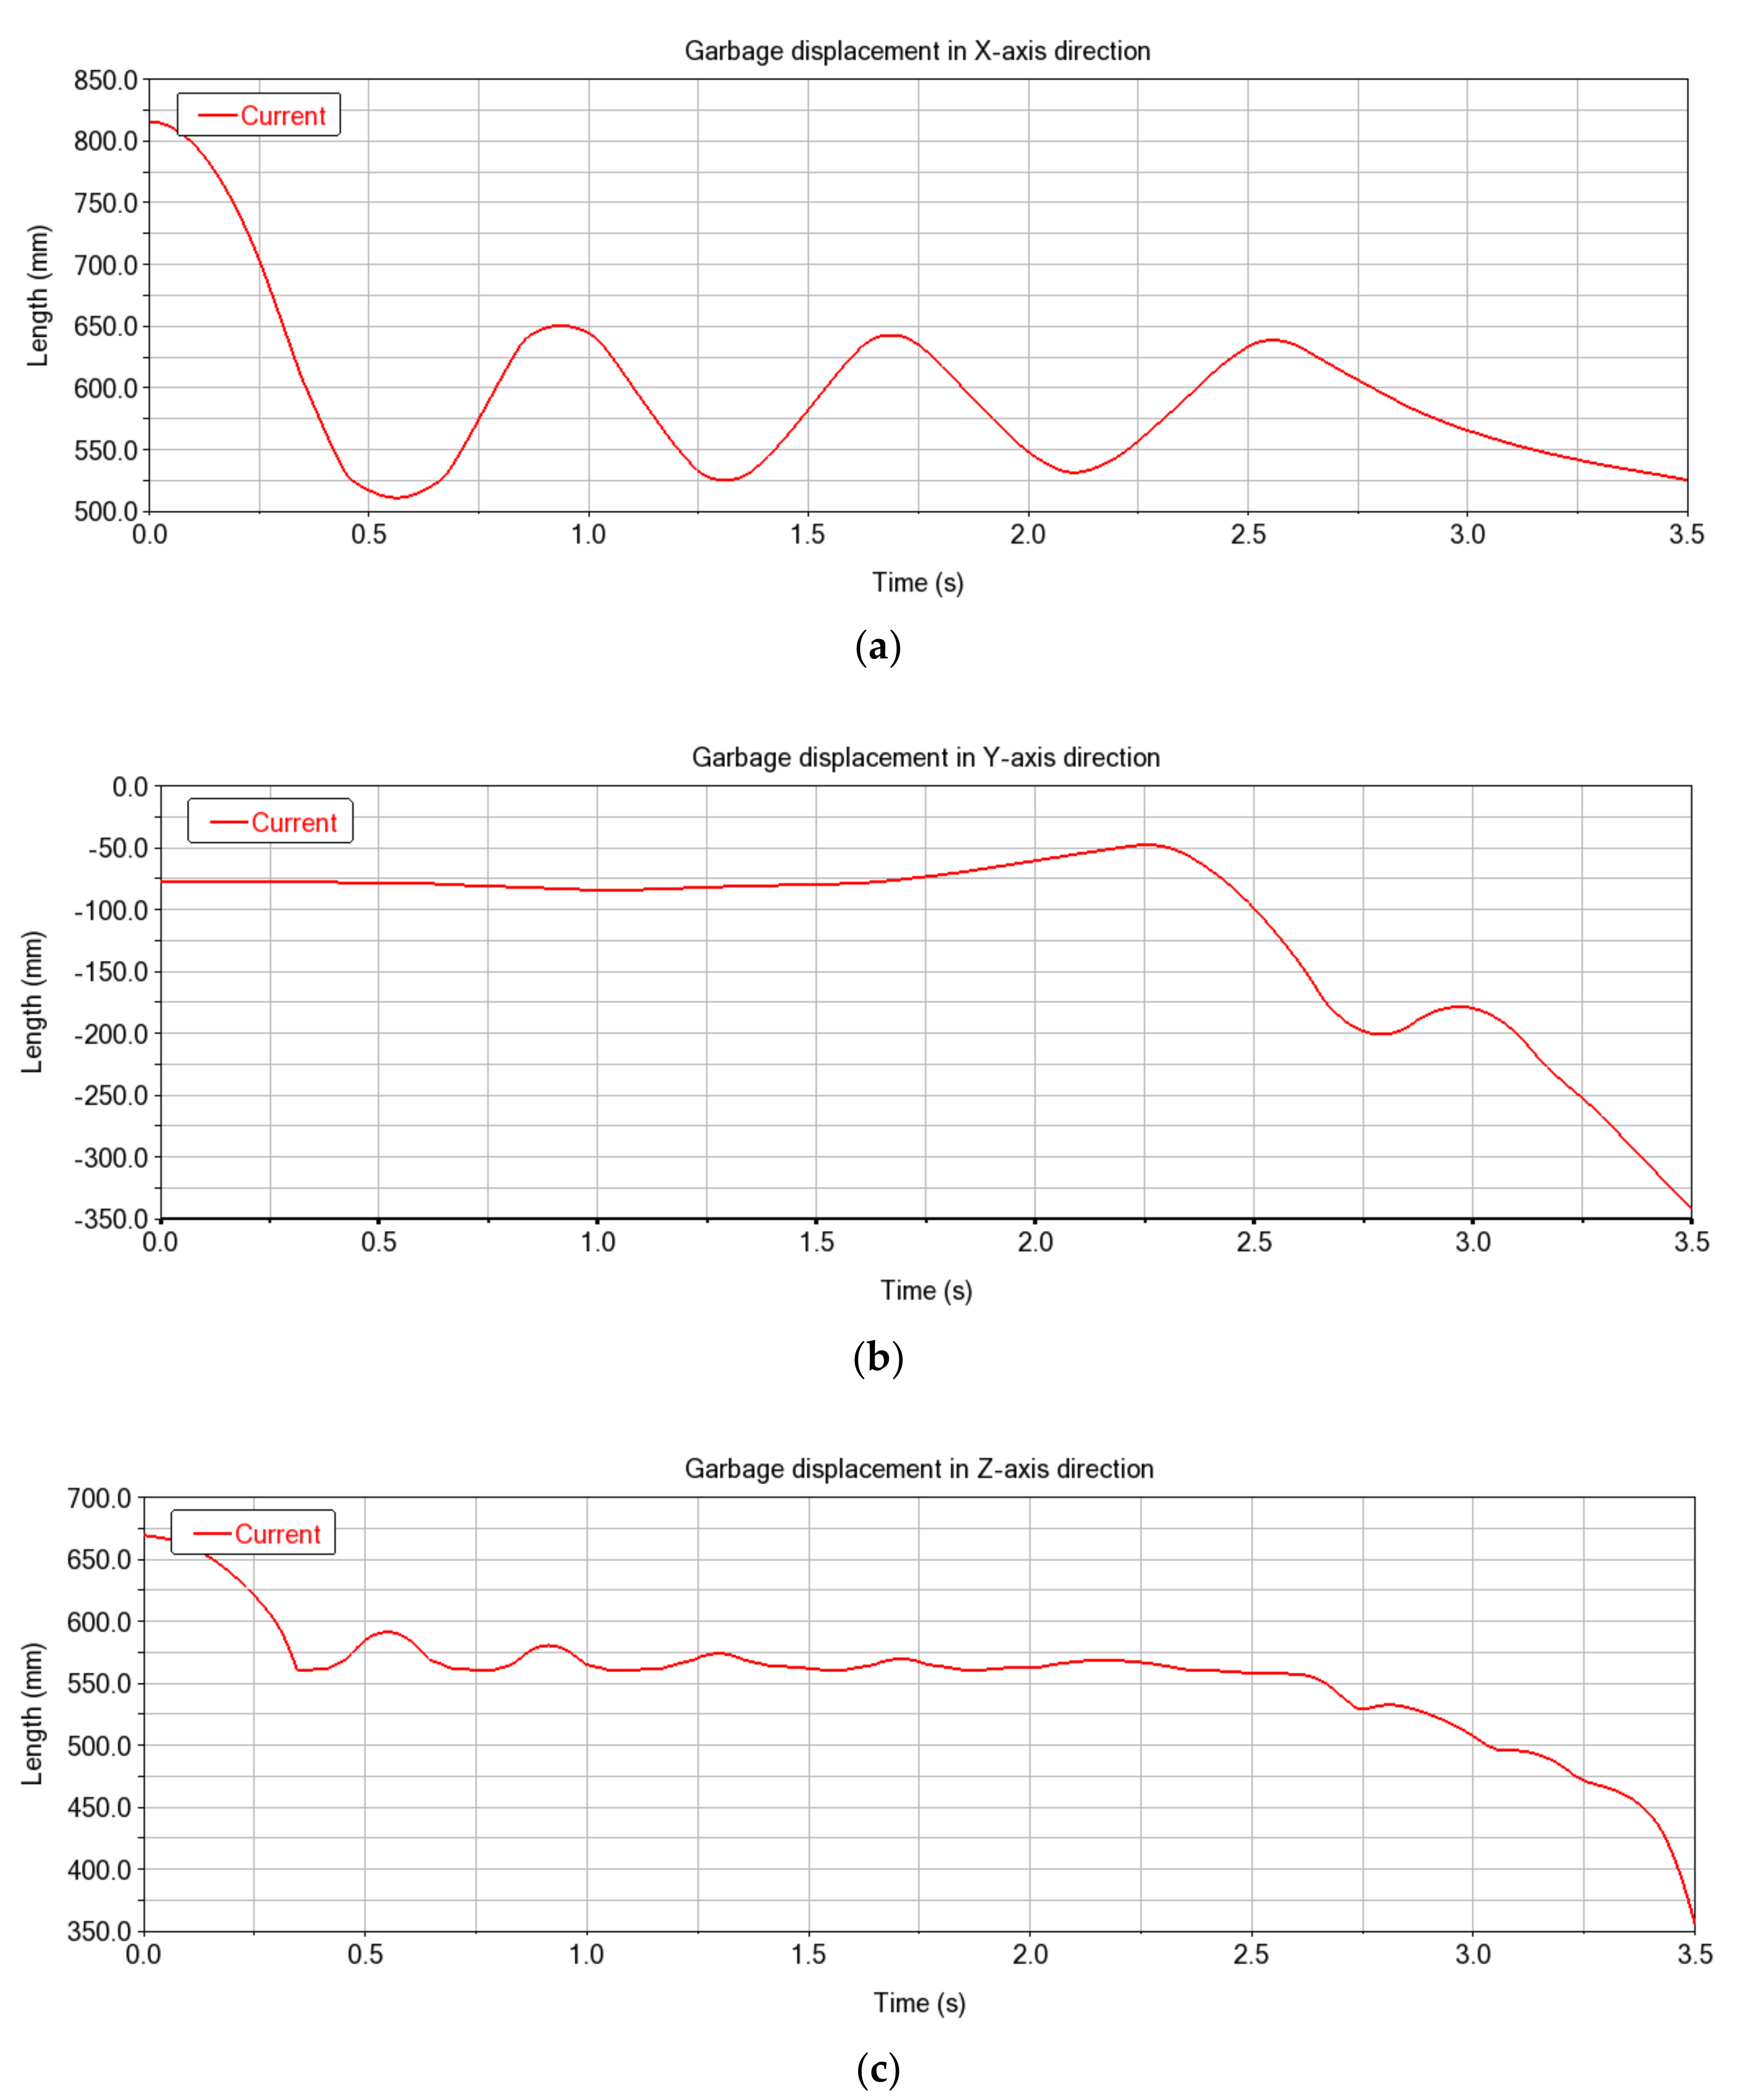
The center of mass displacement of the waste in the sorting process is shown in Figure 14. The gravitational potential energy was converted into kinetic energy as the spherical waste rolled down the slideway, and the waste infiltrated the identification platform at an initial speed of about 1.02 m/s at t = 0.28 s. The Y-axis displacement indicates that the displacement of the center of mass in the Y-axis within 0–2 s was markedly small, with a maximum displacement of 23.3 mm. The X-axis and Z-axis displacement curves indicate that the waste reached the central trough area of the platform for the first time within 0–2 s. The center of mass was 30 mm higher than the bottom of the platform and less than the maximum height of the platform when the waste flowed to the slope opposite to the slideway for the first time. This implies that the waste did not fall out of the platform due to inertia, indicating the platform effectively reduced the initial kinetic energy of the waste.
The displacement-time relationship for free fall is expressed as follows:
The z-axis displacement when the waste was in free fall was parabolic. The simulation and the z-axis displacement curve show that the waste completely left the identification platform at 3.02 s, then fell into the corresponding waste bin to complete the sorting. Therefore, the identification platform did not hinder the falling of the waste during sorting owing to the steep inclination of the slopes, and the sorting mechanism completed the sorting task.
The waste moved back to the identification platform through gravity and inertia. The x-axis and z-axis displacement curves indicate that the height of the waste on the slopes gradually decreased under the frictional resistance, and the fluctuations in the x and z displacements significantly decreased until the waste moved slowly in a reciprocating motion in the central area of the platform. This process allowed verification of the waste-stabilizing performance of the platform. The waste stabilization ensured stability and position of the waste for image collection.
5.5. Analysis of Velocity Curve of the Waste and the Sorting Platform
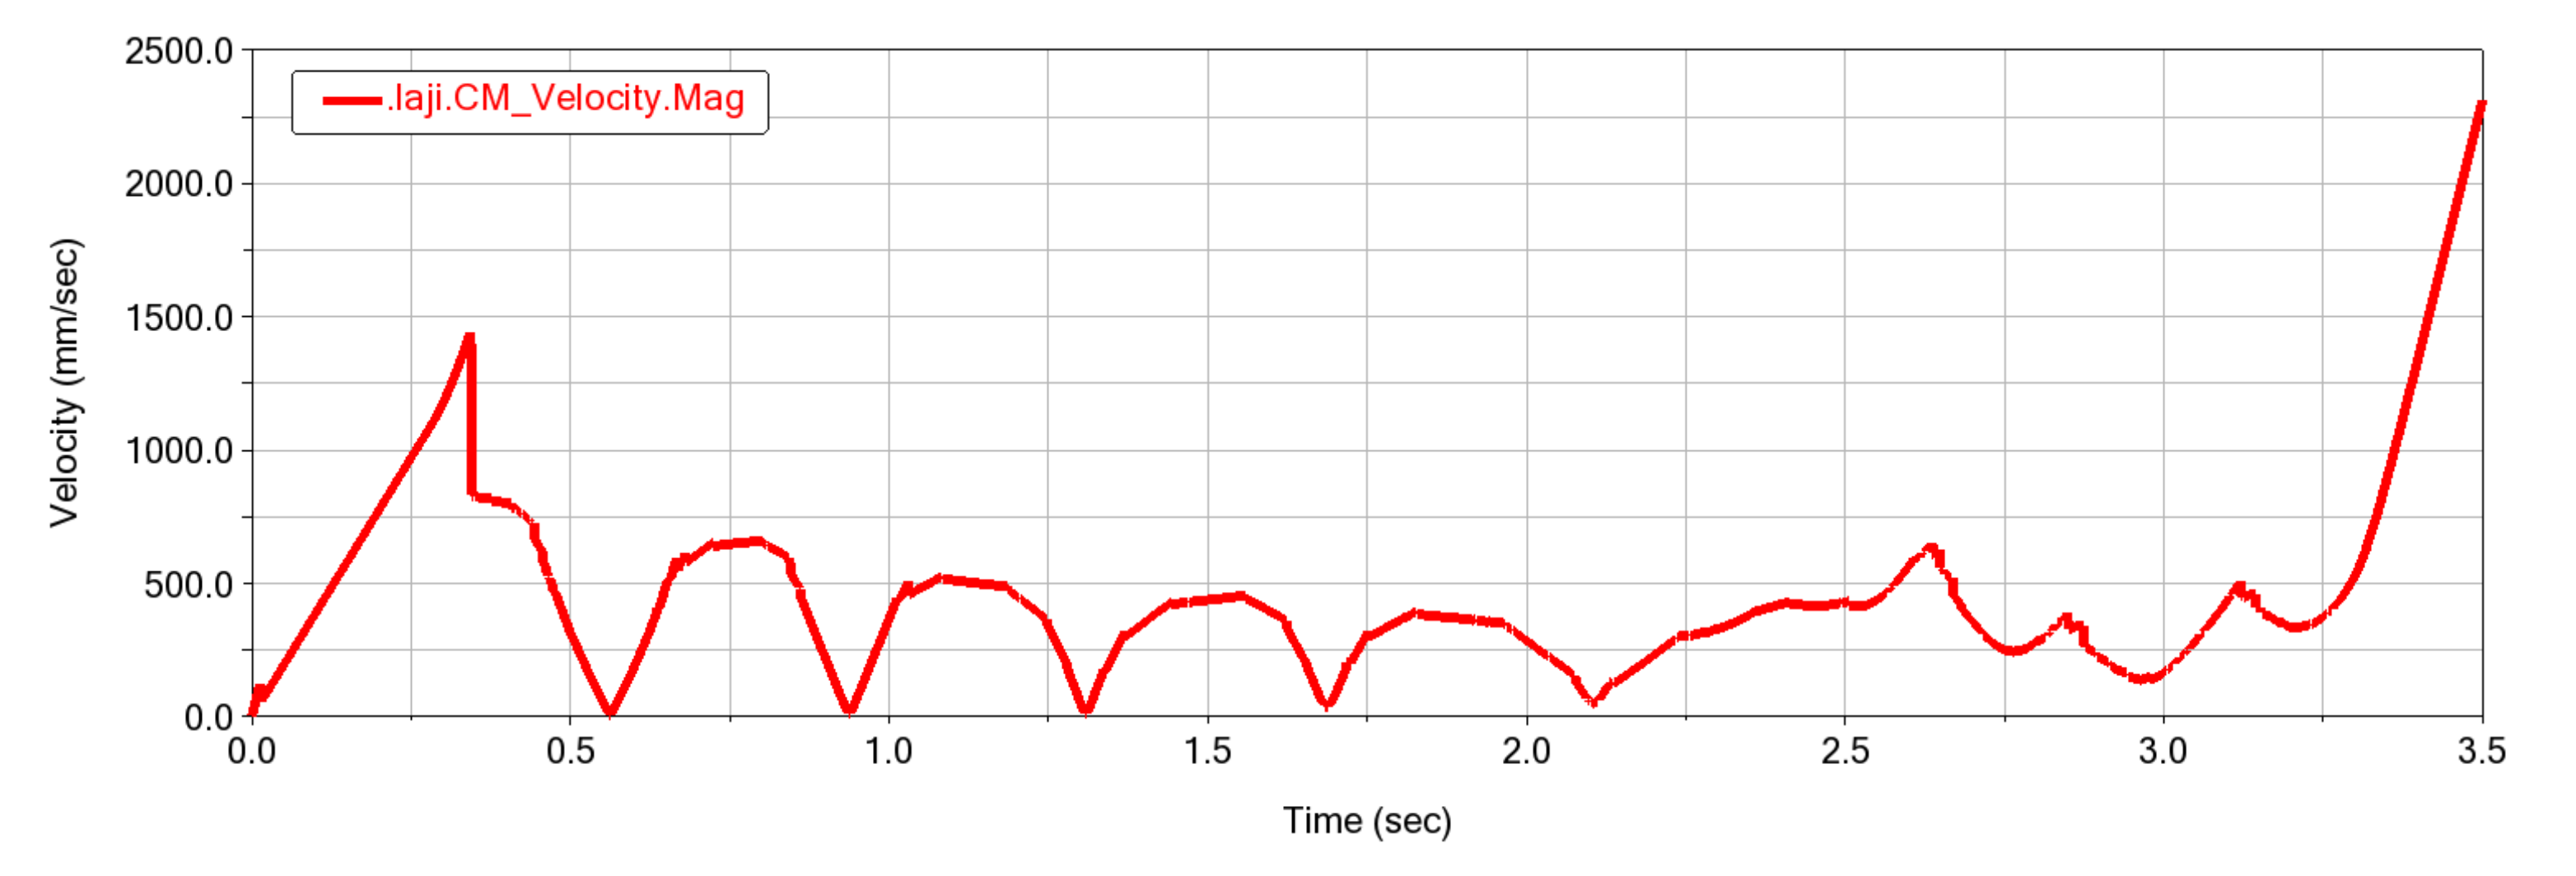
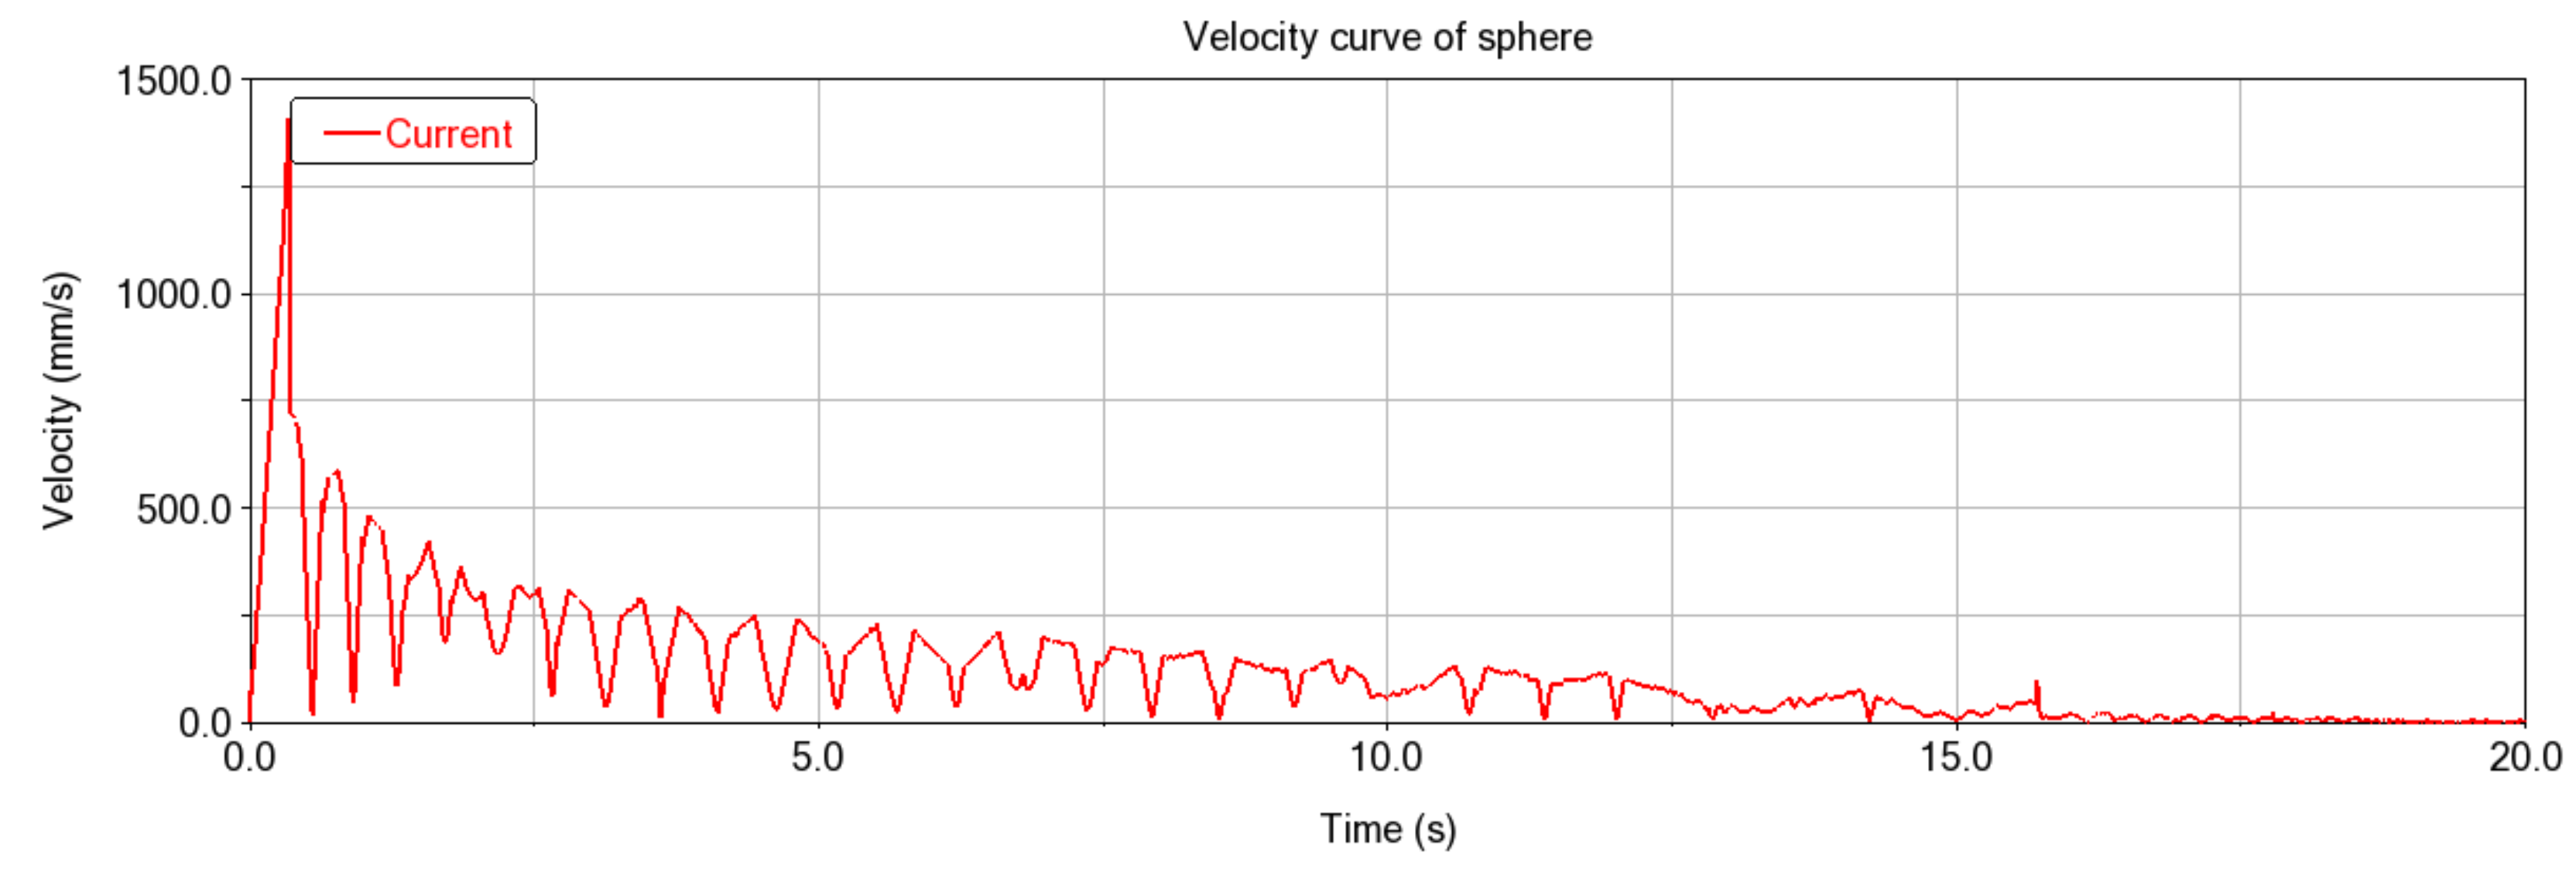
The waste velocity curves presented in Figure 15 and Figure 16 revealed that the waste reached the identification platform at an initial speed of about 1.02 m/sec at t = 0.28 s. The maximum velocity of the waste for the period between 0–2 s was at t = 0.34 s when the waste reached the central area of the platform for the first time. The waste velocity decreased from 1441 mm/s to 828 mm/s, owing to the vertical reaction force at the bottom of the platform. Subsequently, the waste velocity continued to change along the waveform, and the peak values gradually decreased to a small value. The findings showed that the identification platform reached the preset stable rotational speed after only 0.5 s in the flipping process (Figure 17). Notably, the acceleration time was short, and the required torque was small.
5.6. Verification of Numerical Modeling Procedure by Analysis of Velocity Curve of a Prototype Waste and the Sorting Platform
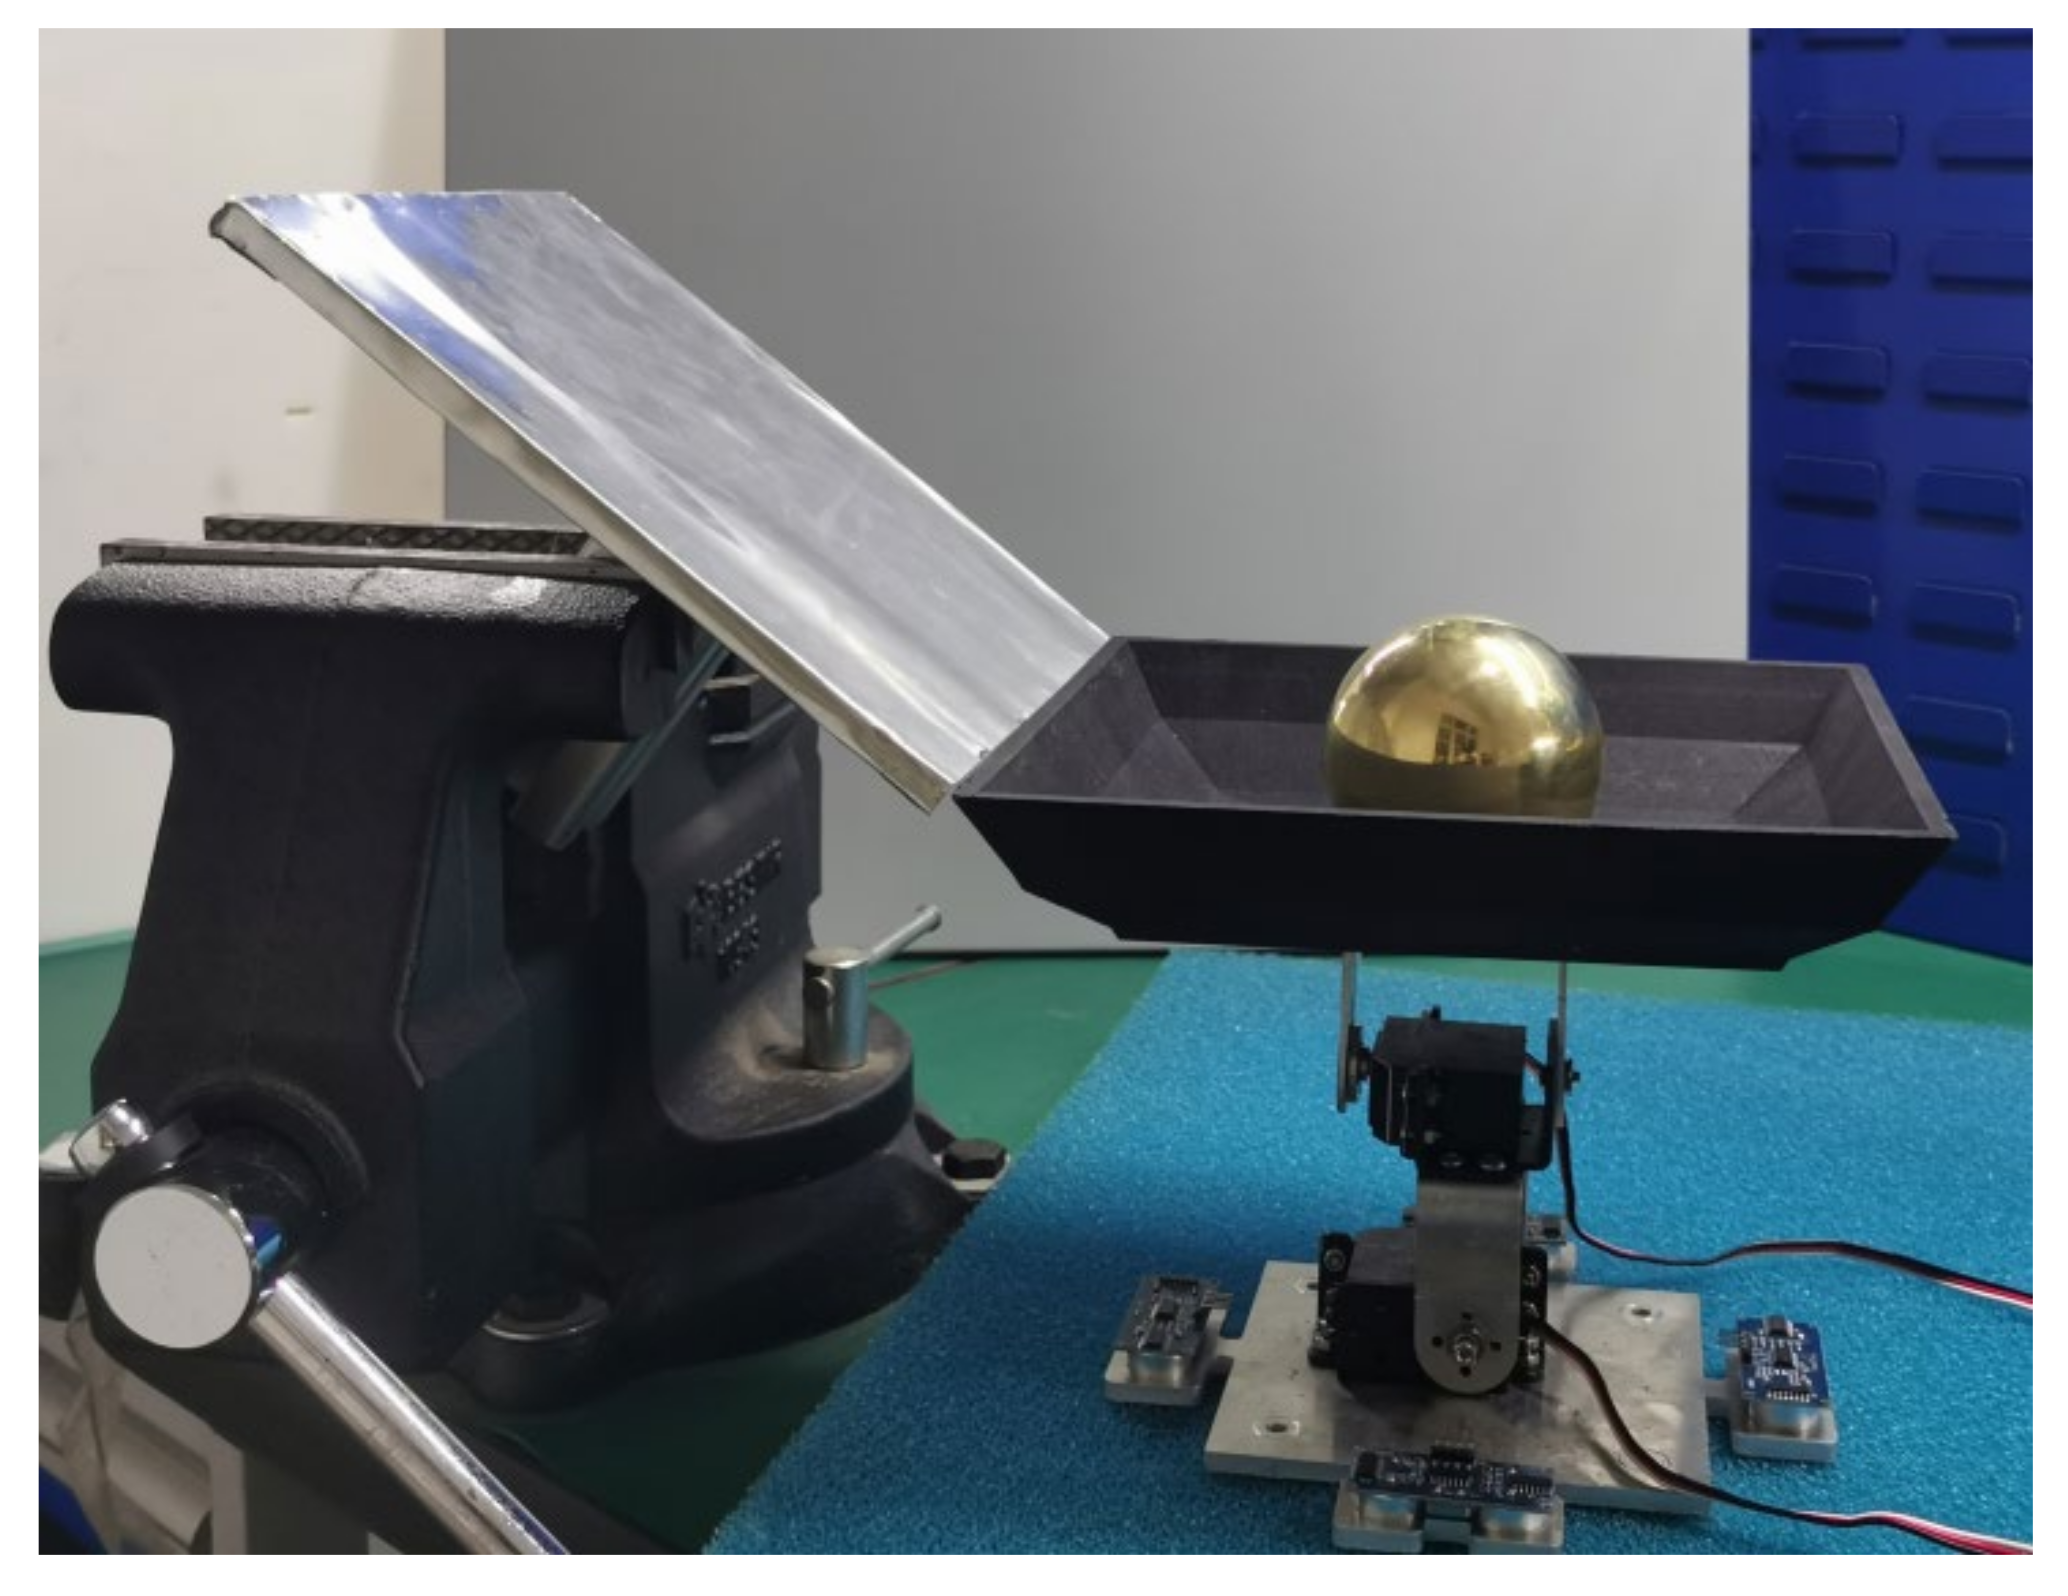
A prototype was fabricated and tested to verify the feasibility of the numerical modeling procedure. A representation of the experimental sorting mechanism is shown in Figure 18. The experimental setup mainly comprised the slideway, the two-DoF parallel platform, and the surveillance camera. The slideway consists of a stainless-steel sheet and a fixed bracket for angle adjustment. The inclination angle of the slideway was set to 15°, which was consistent with the simulation setting. The two-DoF parallel platform comprised the base, the driving steering gear, the rocker bracket, and the waste identification platform. Q235 steel was used for construction of the steering gear and identification platform. Moreover, Q345 steel was used for construction of the base. The platform was horizontal and stationary during the experiment. A surveillance camera was placed directly above the platform and shot vertically down to monitor the motion state of the sphere. The dimension parameters and process settings were similar to those used in the numerical simulation.
The velocity curve of sphere according to kinematic and dynamic simulation is presented in Figure 19. Analysis showed that the sphere stabilized after 18.68 s. The velocity curve of the sphere before stabilization assumed the shape of a simple harmonic vibration.
In the prototype test, the copper sphere was 80 mm in diameter. The copper sphere rolled down from the initial position on the slideway, at a 150 mm vertical height from the bottom of the garbage identification table. A stopwatch was used to determine the time taken for the copper sphere to stabilize at the identification platform. Ten measurements were conducted for the rolling of the copper sphere and the average was calculated. The measurements presented in Table 6 revealed that the average time taken for the spherical waste to stabilize was 19.698 s. The time taken for the spherical garbage or copper sphere to stabilize on the identification platform for prototype test and numerical simulation were 19.698 s and 18.68 s, respectively. The relative error was 5.4%, implying that the numerical modeling procedure was reliable.
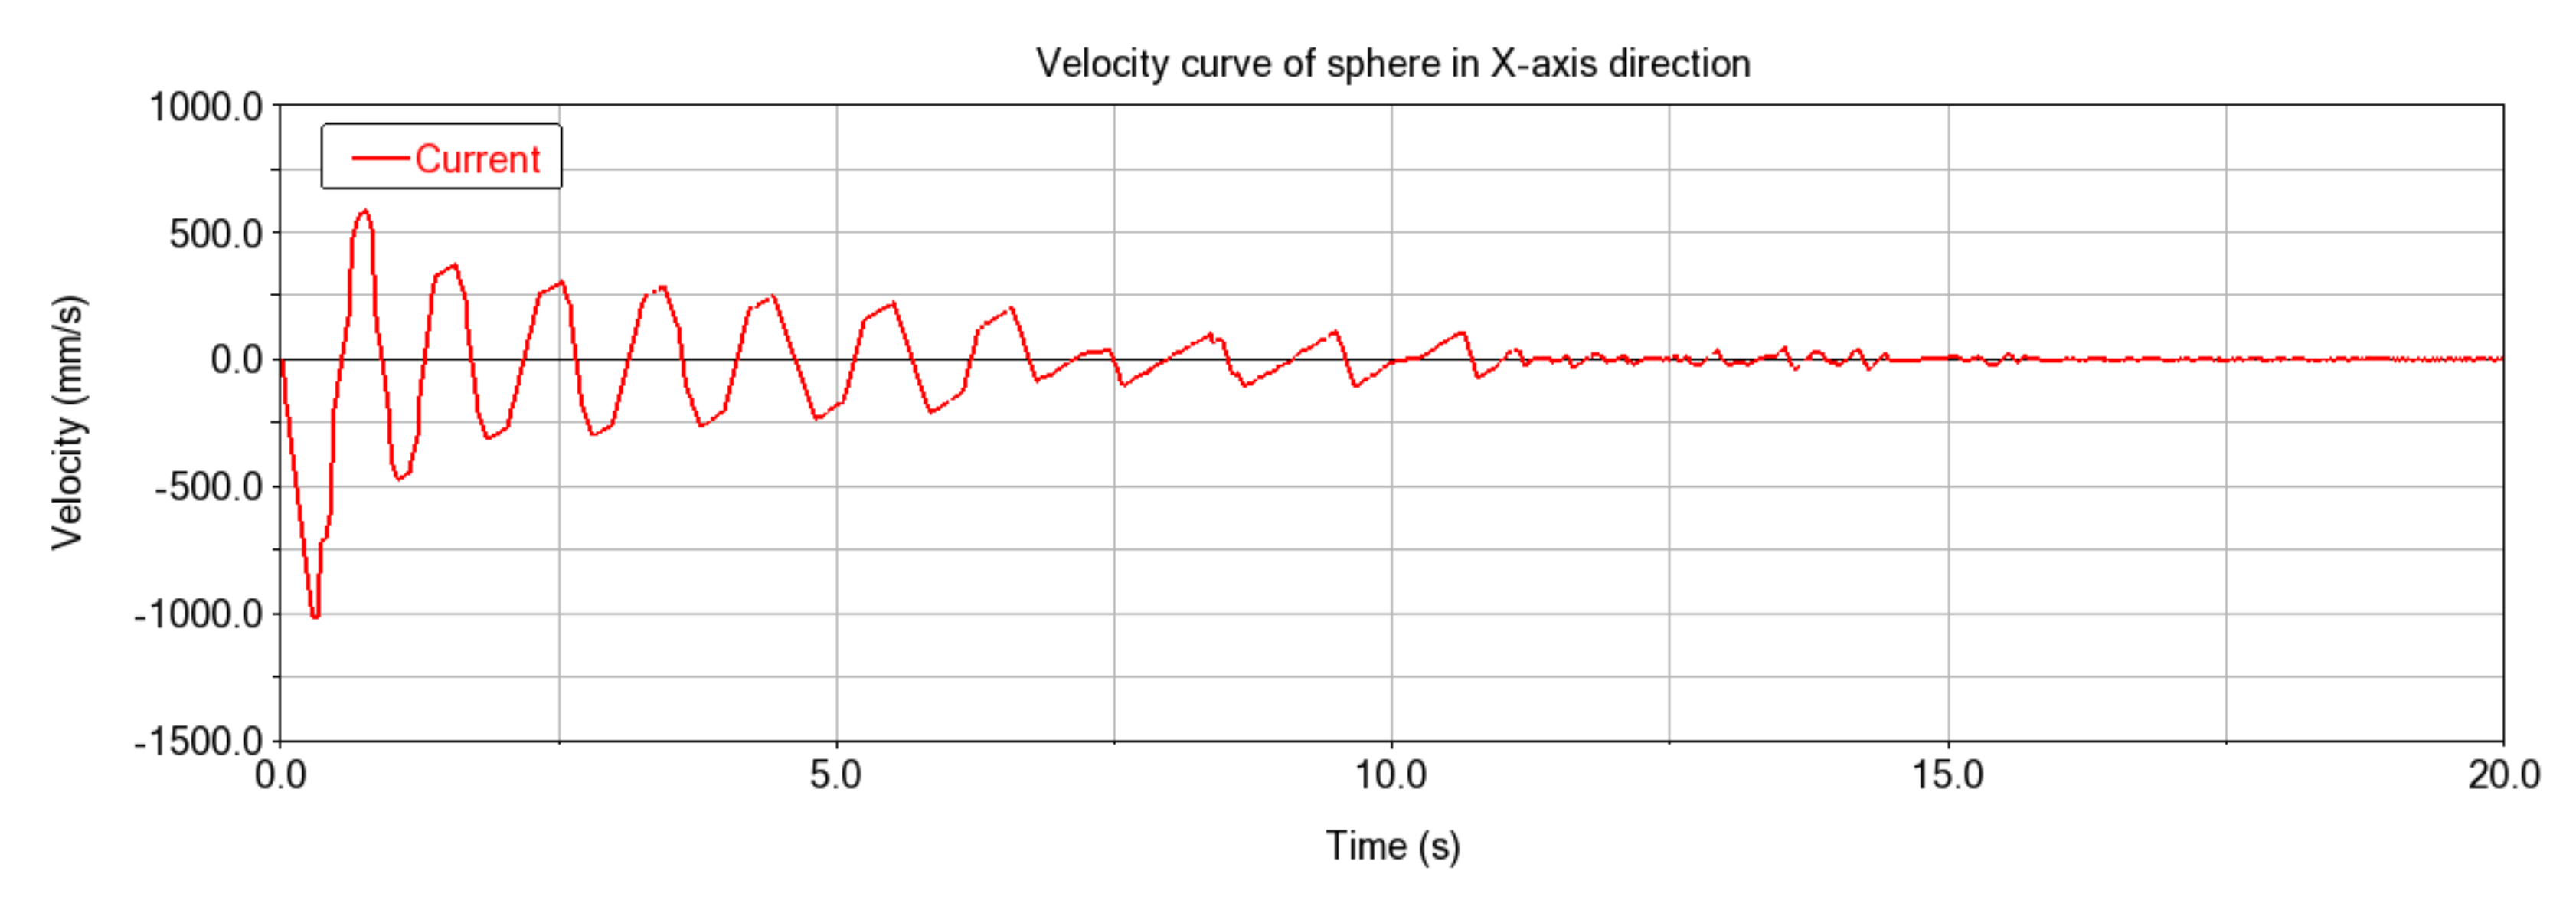
The velocity curve of the sphere in the x-axis direction obtained through kinematic and dynamic simulation is presented in Figure 20. The curve exhibited a sinusoidal waveform with decreasing amplitude centered around Vx = 0.
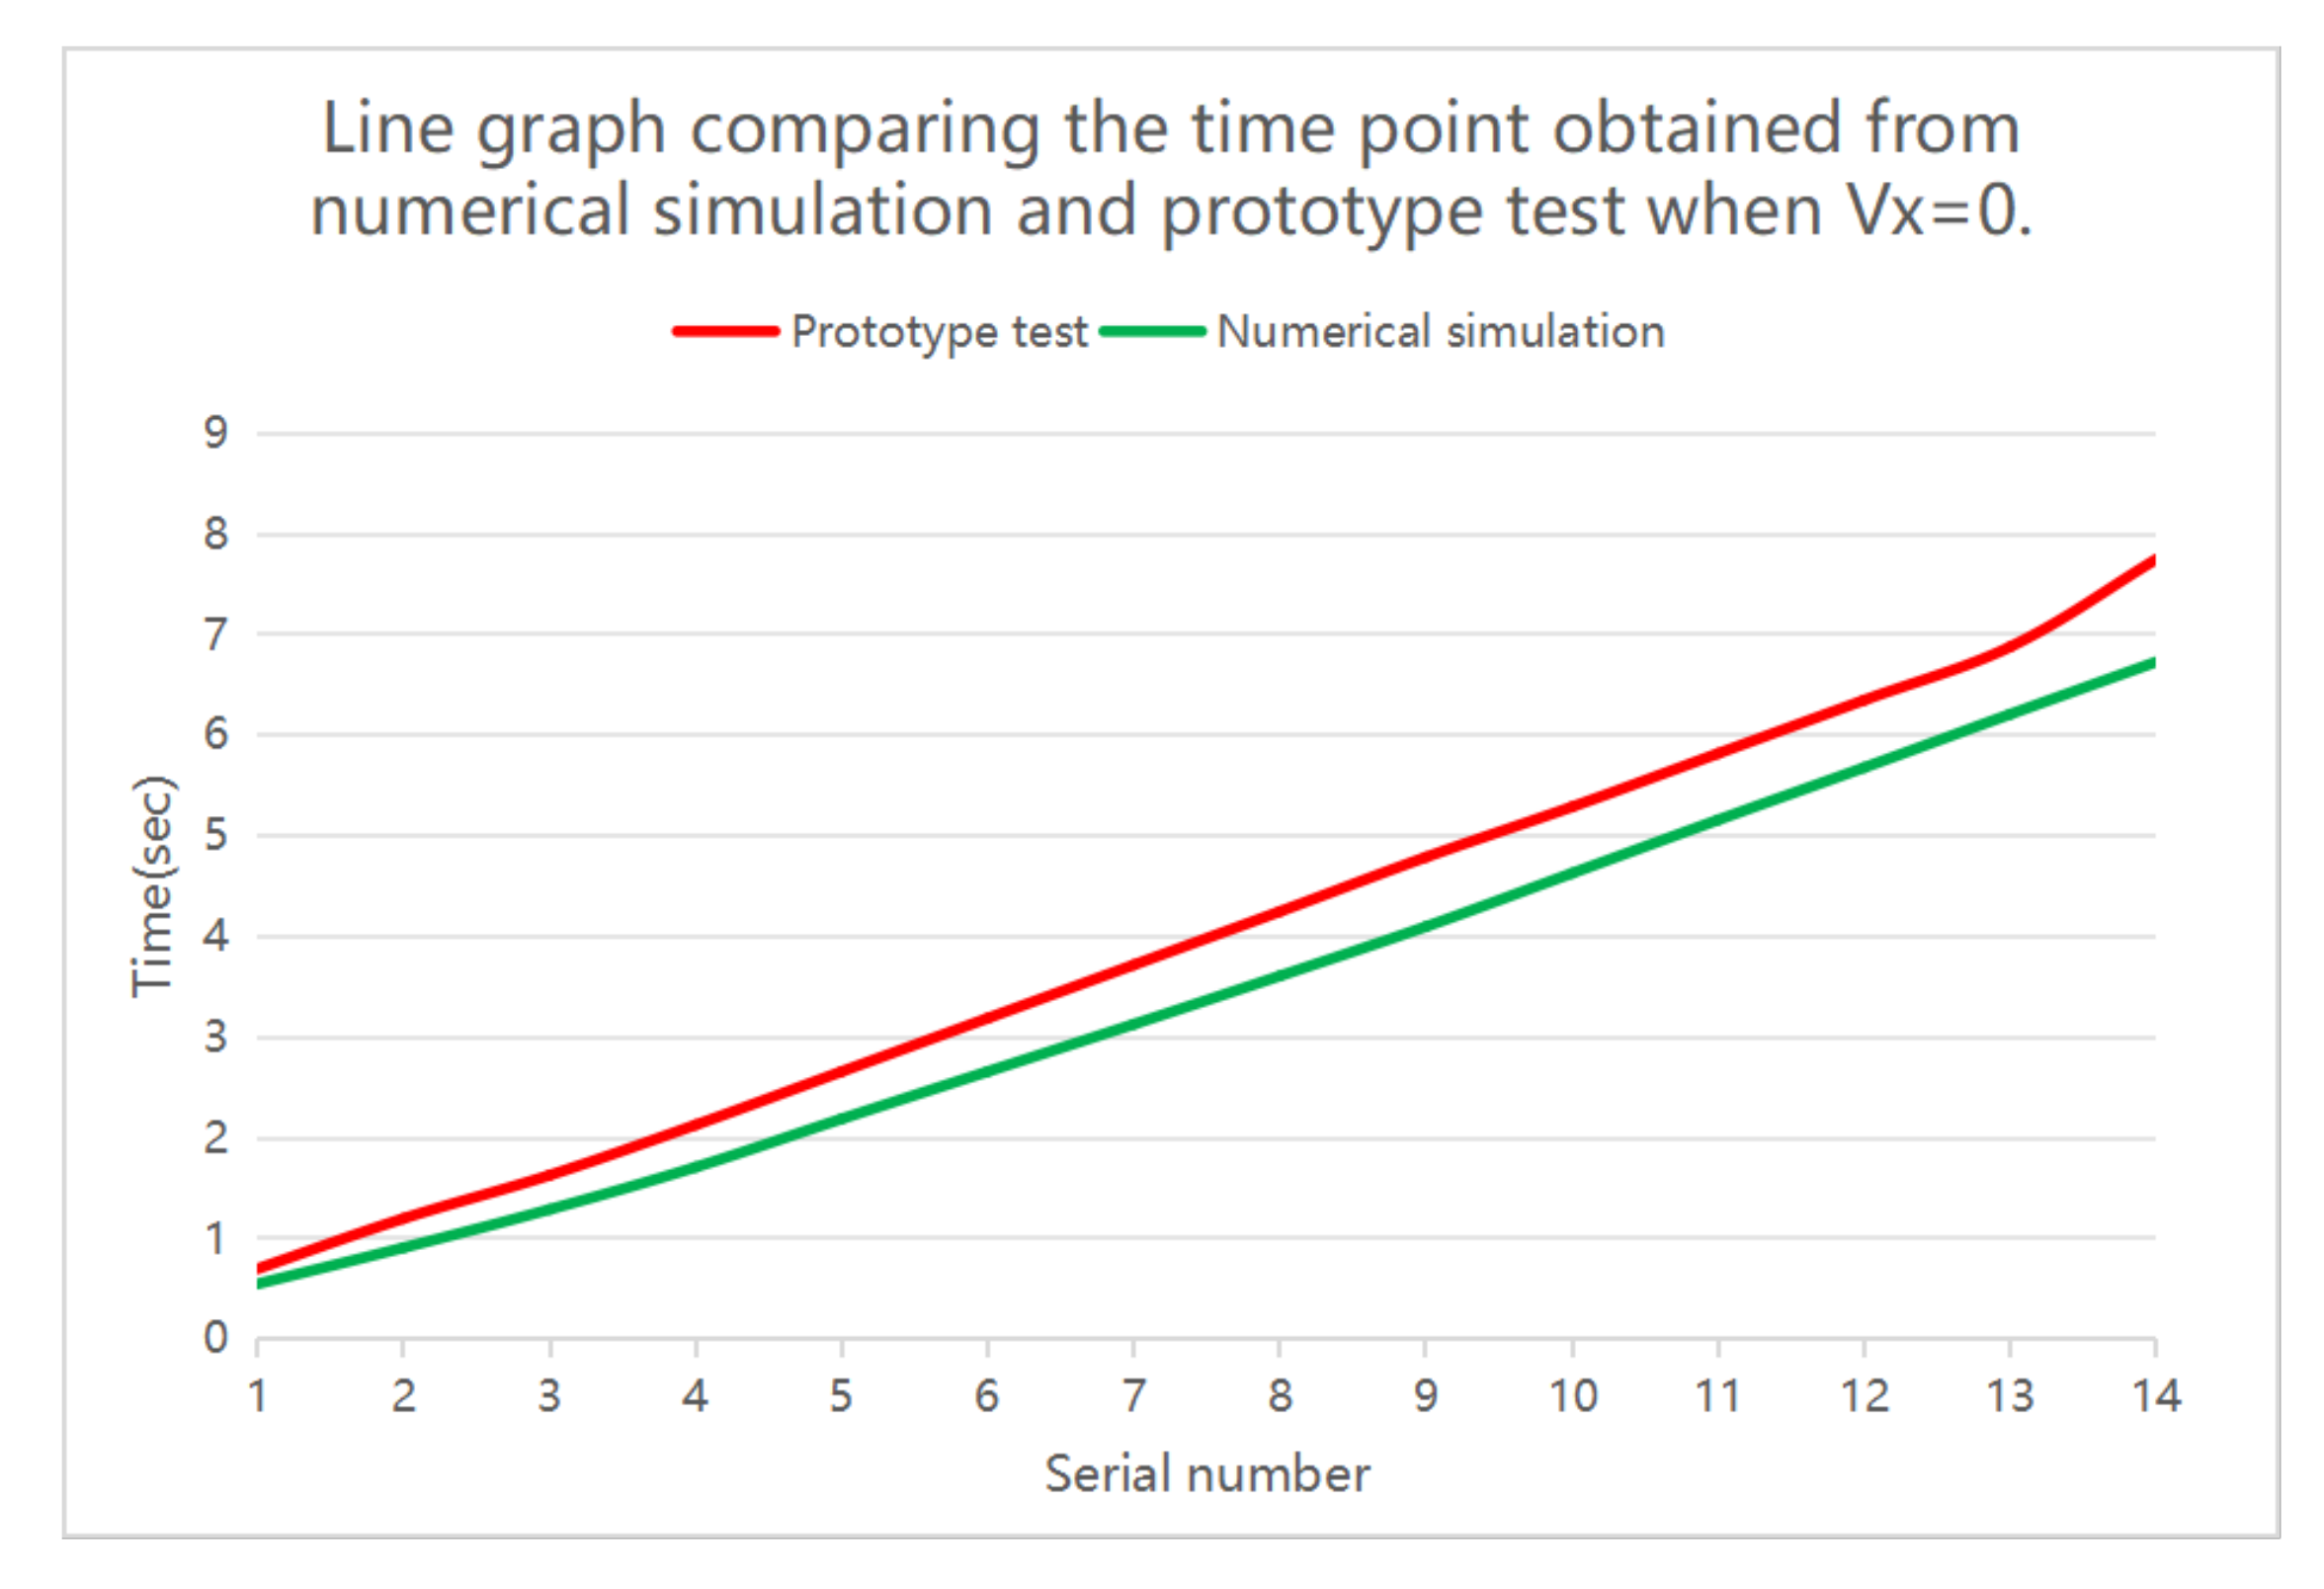
The video of the test obtained using the surveillance camera was processed based on frames, with the eighth group of measurement as subject. The time when the velocity in the x direction was zero was recorded in each reciprocating motion of the sphere, then compared with the time points obtained from numerical simulation under the same condition. A line graph comprising the first fourteen time points was generated to validate the numerical modeling procedure, which is shown in Figure 21.
In summary, the findings from the prototype testing indicate that the numerical modeling procedure using Adams software is reliable and can be implemented for waste management and sorting.
6. Multivariate Optimization of the Waste Separation and Sorting Mechanisms
6.1. Sensitivity Analysis
Waste movement can affect the color, shape, and other characteristics during waste identification [39]. Therefore, the stability of the waste should be maintained during image collection. In the present study, multi-variable optimization was conducted using the Adams software program [40,41] to shorten the time taken for stabilization of the waste to improve efficiency of the system. Sensitivity analysis was conducted firstly to describe and elucidate the waste separation and sorting mechanisms.
Local sensitivity analyses involved a small perturbation near input values to explore the effect on the output value [42]. Slideway obliquity, first-stage inclination angle, second-stage inclination angle, and third-stage inclination angle were set as the input values. The time taken for the spherical waste to stabilize at the center of the identification platform was set as the output value. Morris screening was used to carry out the local sensitivity analyses, which were carried out for the former four parameters [43]. The local sensitivity was calculated using the formula below:
where S denotes the sensitivity factor; represents the initial value of the output value; indicates the output; represents the percent change of input parameters relative to initial input; n denotes the running times.
The fixed step size of the parameter perturbation was set to 5% for second-stage inclination angle and third-stage inclination angle, as well as 10% for slideway obliquity and first-stage inclination angle. The value range and initial value are shown in Table 7.
The values of sensitivity factors are presented in Table 8. The sensitivity level of the four parameters was evaluated according to references [44]. The findings showed that all four parameters affect the output of the model as sensitivity factors, which can be applied as design variables in the following multivariate optimization.
6.2. Multivariate Optimization
The objective function and constraint equations are expressed as shown below:
where g denotes the time objective function, required to reach a minimum value; represents a design variable; indicates the constraint equation; m represents the number of constraint equations.
The optimization target was to reduce the time taken for the spherical waste to stabilize at the center of the identification platform. The measurement function MODEL_1. FUNCTION_MEA_2 is defined as follows:
The sensor was set, the MODEL_1. FUNCTION_MEA_2 function was called, and the threshold was set to 0. The simulation was terminated, and the time was recorded when the measurement function value was less than or equal to the threshold.
The slope angle of the slideway and the inclination angle of the three-stage slopes of the platform were selected for optimization. The bottom of the slideway and one side of the identification platform were in a coincident relationship, and the initial angle relative to the horizontal plane was 15° throughout the simulation. The allowable range was 15°–90°. The angles relative to the horizontal plane were 30°, 55°, and 66° from the bottom to the top for the three-stage slopes of the identification platform. The angles were varied by a range between 10° and 75° while maintaining the increasing trend. One optimization objective and four input variables were used in the simulation. The optimization variables are presented in Table 9.
6.3. Optimization Results
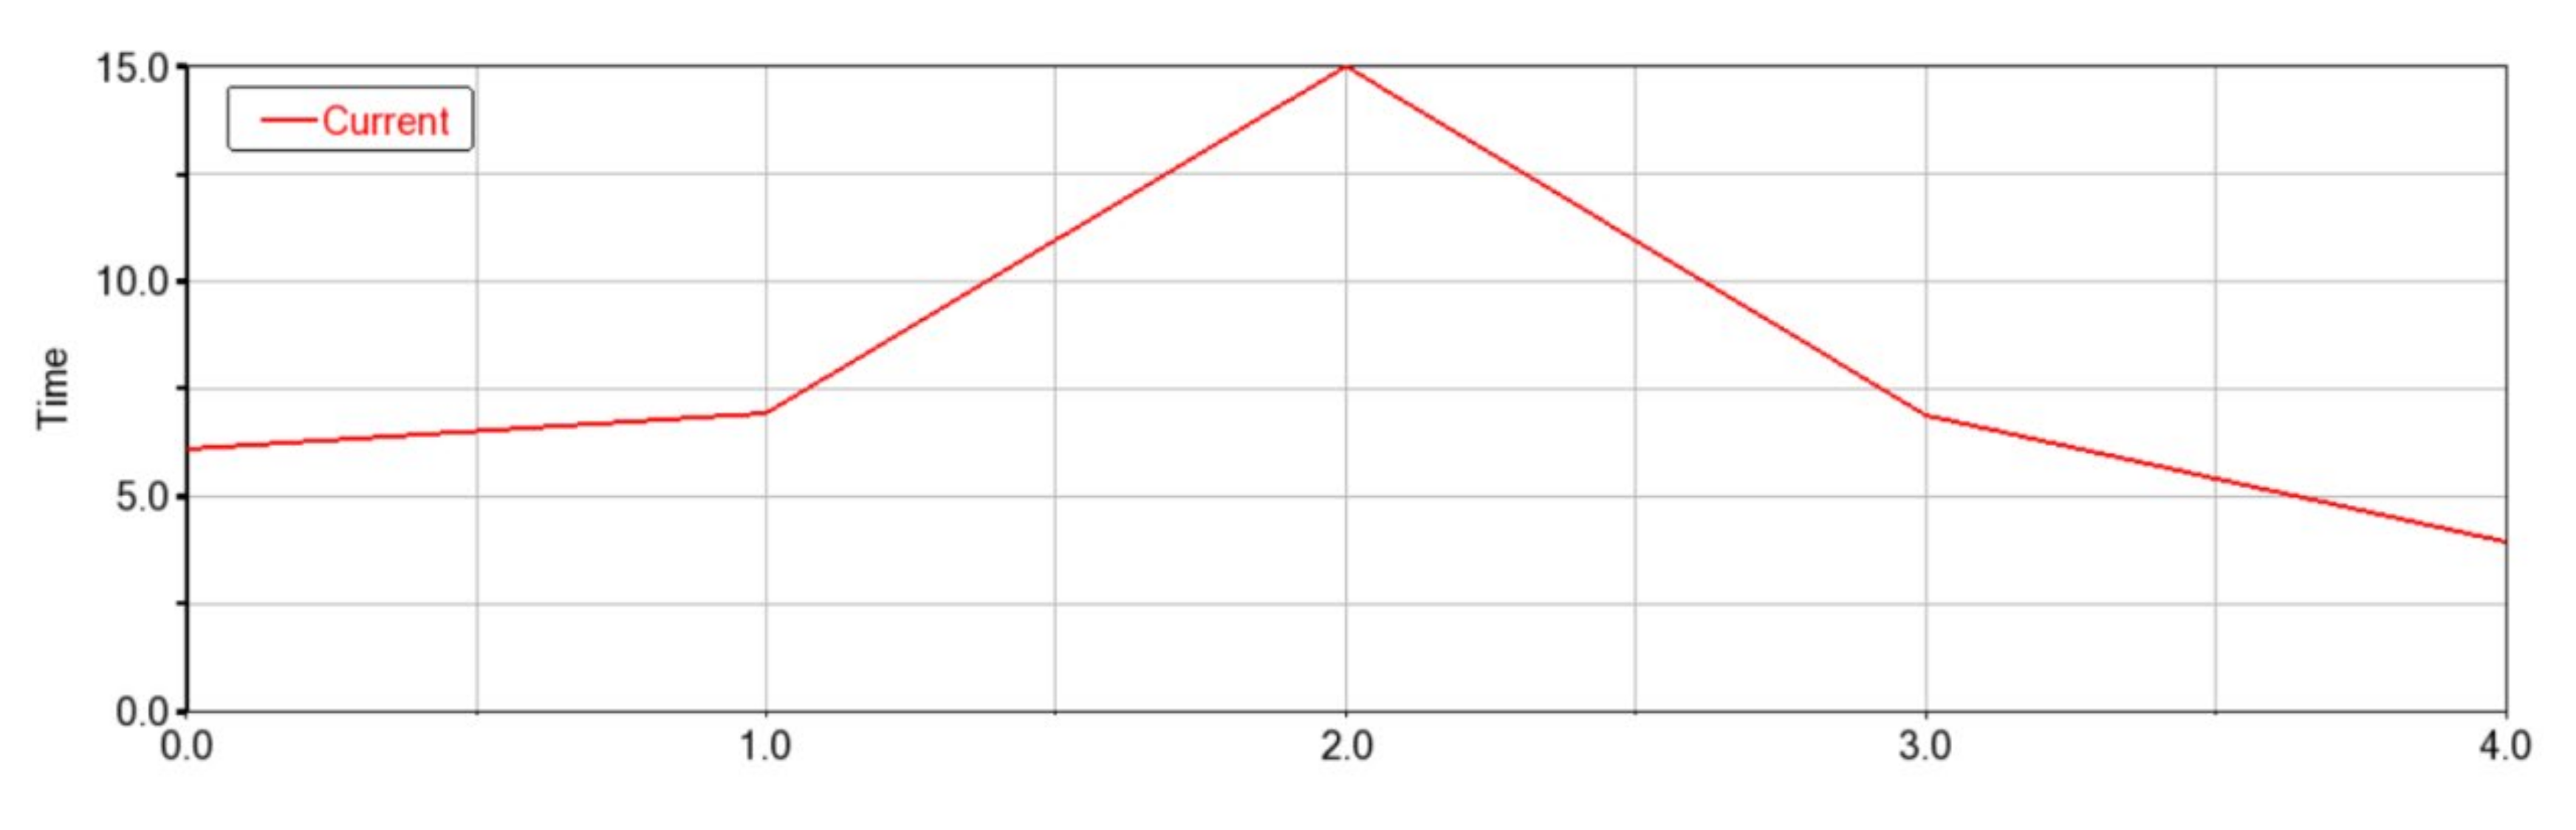
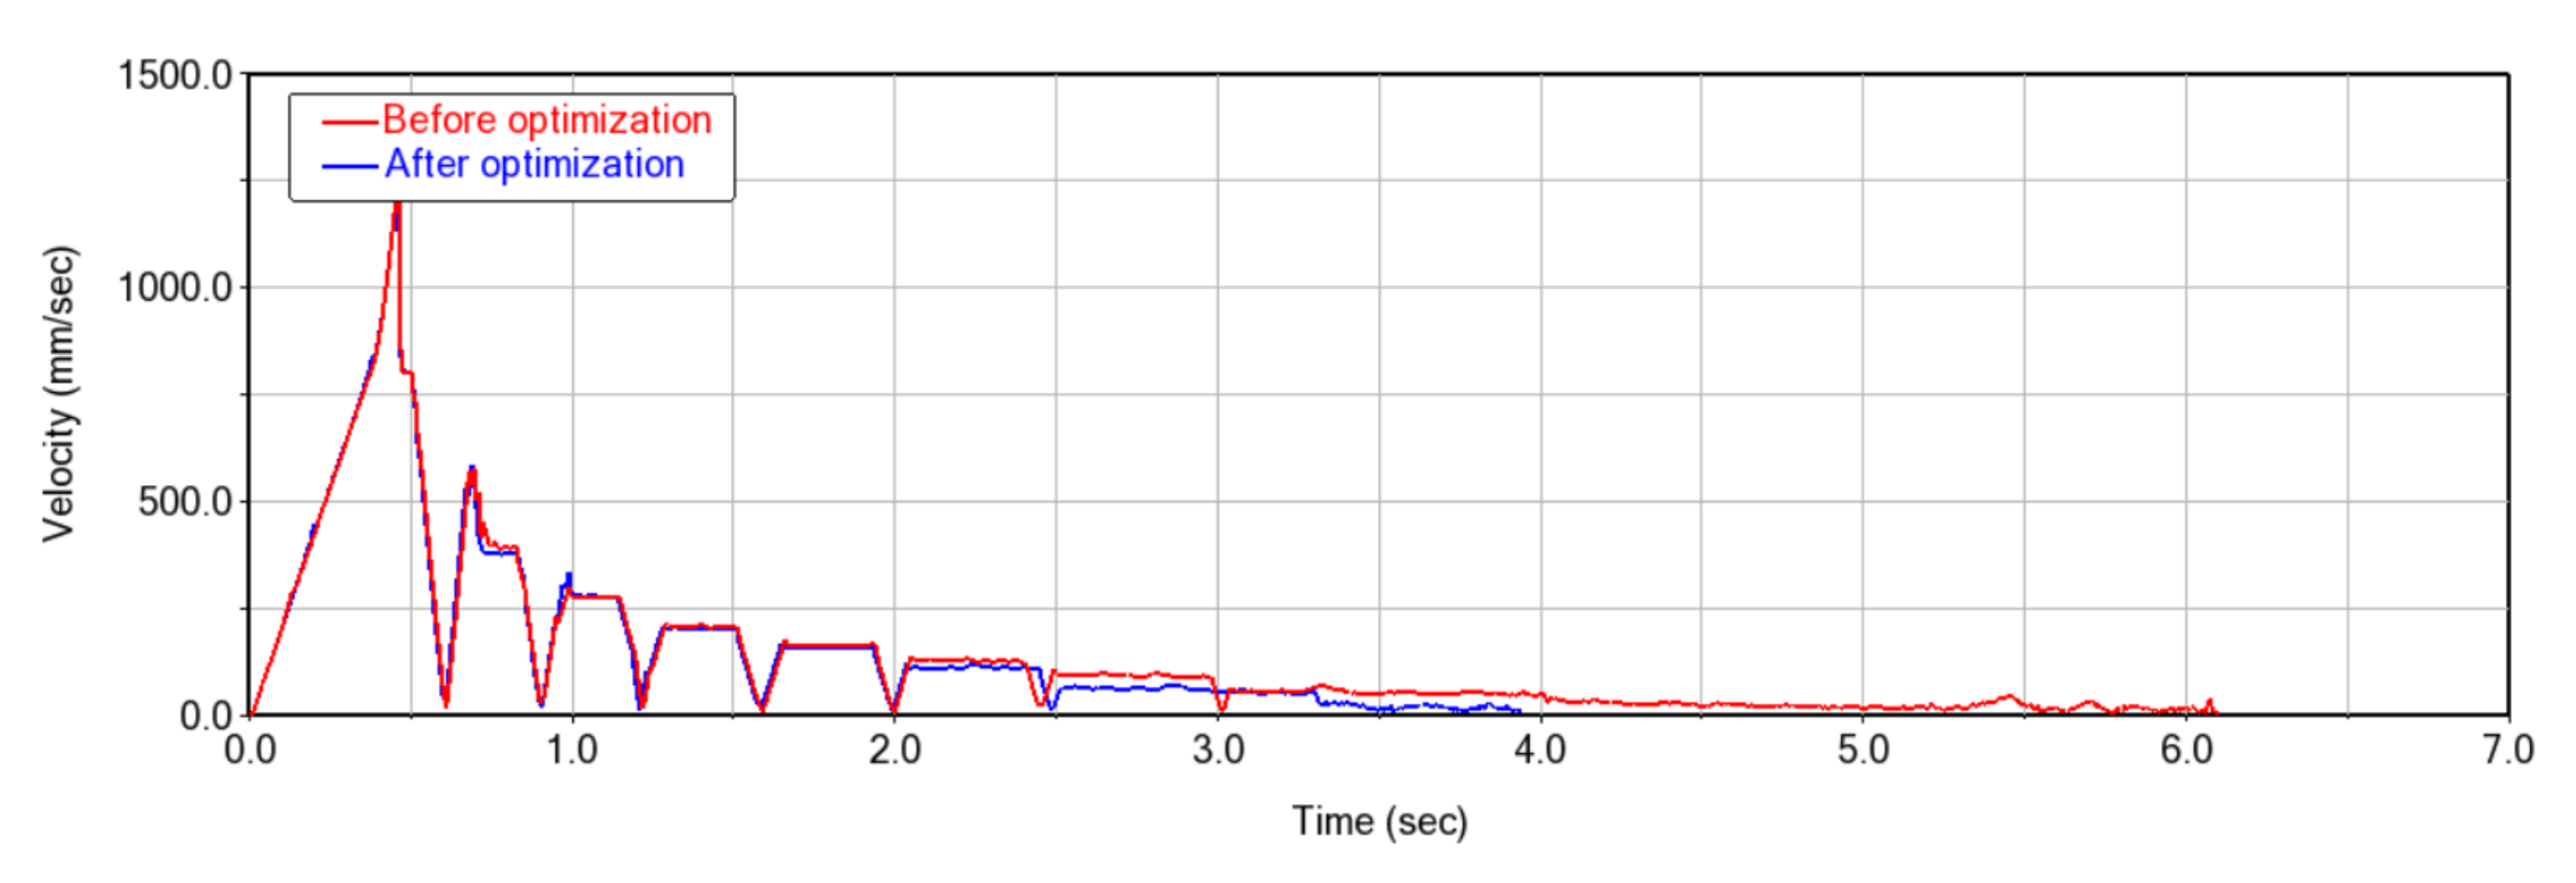
The optimization was completed after four iterations. The minimum time obtained after each iteration is presented in Figure 22. The shortest time was 3.94 s, which was 35.4% less compared with the time required for the original structure (6.09996 s). Time and variables before and after optimization are presented in Table 10.
The velocity curves of the spherical waste before and after optimization are shown in Figure 23. Each waveform represents a reciprocating movement cycle of the waste for the recognition platform. The motion of the waste in the first six reciprocating cycles was the same before and after optimization. The velocity of the waste for the seventh reciprocating motion was significantly reduced after optimization, with a reciprocating period of 0.8385 s, which was 0.2785 s longer relative to the period before optimization. Moreover, the waste velocity decreased to 0 mm/s at t = 3.09 s before optimization, whereas the time decreased to 0.657 s after optimization.
7. Conclusions
A waste separation and sorting equipment was designed for small-scale waste sorting systems in the present study. In addition, numerical simulation analysis was conducted, and the system structure was optimized. The major findings of this study are presented below.
- (1)
- Waste separation and sorting equipment was designed for small-scale waste sorting systems for effective disposal of multiple types of waste. Findings from the simulation and experiment indicated that the mechanisms met the strength and structural requirements. These findings provide a foundation for reliability evaluation of the mechanism and subsequent applications.
- (2)
- A dynamic simulation was performed to simulate the movement of spherical waste in the sorting mechanism. The simulation results revealed that all waste–including the waste with the most unstable spherical shapes–did not fall out of the identification platform. This implies that the waste identification platform was effective in receiving and handling different types of waste. The simulation displacement curves demonstrated that the waste was stabilized at the center of the identification platform within a short time, resulting in rapid and accurate waste image collection.
- (3)
- The designed waste sorting system achieved waste separation and feeding, as well as waste sorting and disposal using low amount of output power, implying that it is economical.
- (4)
- The waste sorting time was reduced by 35.4% after optimization, which significantly increased the operating efficiency of the system.
- (5)
- Although the automatic sorting and processing of multiple wastes was achieved through the conveyor belt, the equipment had some limitations. For example, the waste required artificial distribution in the various compartments of the conveyor belt. Moreover, the amount of garbage presented to the equipment was constrained by the length of the conveyor belt, therefore, it could not be mixed or packaged. In addition, the machine vision technology for monitoring dynamic targets and the image processing technology for managing blurred ghost images used in the algorithms were not been fully explored in the present study. Therefore, further studies should explore these techniques to further improve the system processing speed.
- (6)
- Static analysis, strength check, and simulation of the mechanism were conducted. Although a rough functional evaluation of the prototype was conducted, systematic and comprehensive experimental testing was not performed in this study. Further studies should be designed to conduct comprehensive experimental tests and evaluations of the prototype.
Author Contributions
Conceptualization, Z.X. and Y.H.; methodology, Z.X.; software, Z.X.; validation, Z.X., J.Z. and Y.H.; formal analysis, Z.X.; investigation, Z.X.; resources, J.Z.; data curation, Z.X.; writing—original draft preparation, Z.X.; writing—review and editing, J.Z. and Y.H.; visualization, Z.X.; supervision, Y.H.; project administration, Y.H.; funding acquisition, Y.H. All authors have read and agreed to the published version of the manuscript.
Funding
This research received no external funding.
Conflicts of Interest
The authors declare no conflict of interest.
References
- Pi, T.T.; Zhen, Y.F.; Xu, J.X. Why is garbage classification mandatory?—Analysis of policy changes of municipal solid waste classification from the perspective of multi-source theory. Environ. Conform. Assess. 2021, 13, 86–93. [Google Scholar]
- Sudha, S.; Vidhyalakshmi, M.; Pavithra, K.; Sangeetha, K.; Swaathi, V. An automatic classification method for environment: Friendly waste segregation using deep learning. In Proceedings of the 2016 IEEE Technological Innovations in ICT for Agriculture and Rural Development, Chennai, India, 15–16 July 2016; pp. 65–70. [Google Scholar]
- Carlos, B.L.J.; Alejandro, R.; Manuel, E. Automatic waste classification using computer vision as an application in colombian high schools. In Proceedings of the 6th Latin-American Conference on Networked and Electronic Media (LACNEM 2015), Medellin, Colombia, 23–25 September 2015. [Google Scholar]
- Na, S.; Heo, S.; Han, S.; Shin, Y.; Lee, M. Development of an artificial intelligence model to recognise construction waste by applying image data augmentation and transfer learning. Buildings 2022, 12, 175. [Google Scholar] [CrossRef]
- Lukka, T.J.; Tossavainen, T.; Kujala, J.V.; Raiko, T. Zenrobotics recycler–robotic sorting using machine learning. In Proceedings of the International Conference on Sensor-Based Sorting, Aachen, Germany, 11–13 March 2014; pp. 1–8. [Google Scholar]
- Donovan, J. Auto-trash sorts garbage automatically at the techcrunch disrupt hackathon. In Proceedings of the Techcrunch Disrupt Hackaton, San Francisco, CA, USA, 14–16 September 2016. [Google Scholar]
- Torres-García, A.; Rodea-Aragón, O.; Longoria-Gandara, O.; Sánchez-García, F.; González-Jiménez, L.E. Intelligent waste separator. Comput. Sist. 2015, 19, 487–500. [Google Scholar] [CrossRef]
- Zhang, S.; Chen, Y.; Yang, Z.; Gong, H. Computer vision based two-stage waste recognition-retrieval algorithm for waste classification. Resour. Conserv. Recycl. 2021, 169, 105543. [Google Scholar] [CrossRef]
- Huang, J.; Pretz, T.; Bian, Z. Intelligent solid waste processing using optical sensor-based sorting technology. In Proceedings of the 2010 3rd International Congress on Image and Signal Processing, Yantai, China, 16–18 October 2010; pp. 1657–1661. [Google Scholar]
- Koskinopoulou, M.; Raptopoulos, F.; Papadopoulos, G.; Mavrakis, N.; Maniadakis, M. Robotic waste sorting technology: Toward a vision-based categorization system for the industrial robotic separation of recyclable waste. IEEE Robot. Autom. Mag. 2021, 28, 50–60. [Google Scholar] [CrossRef]
- Dai, C.L.; Tang, L.J.; Xie, Z.H.; Xiao, O.; Wu, Y.L. An intelligent waste sorting system based on Easy-DL platform + Raspberry Pi. Internet Things Technol. 2021, 11, 67–70. [Google Scholar]
- Raghunandan, A.; Raghav, P.; Aradhya, H.R. Object detection algorithms for video surveillance applications. In Proceedings of the 2018 International Conference on Communication and Signal Processing, Chennai, India, 3–5 April 2018. [Google Scholar]
- Uijlings, J.R.R.; Van De Sande, K.E.A.; Gevers, T.; Smeulders, A.W. Selective search for object recognition. Int. J. Comput. Vis. 2013, 104, 154–171. [Google Scholar] [CrossRef] [Green Version]
- Ren, S.; He, K.; Girshick, R.; Zhang, X.; Sun, J. Object detection networks on convolutional feature maps. IEEE Trans. Pattern Anal. Mach. Intell. 2016, 39, 1476–1481. [Google Scholar] [CrossRef] [Green Version]
- Ren, S.; He, K.; Girshick, R.; Sun, J. Faster R-CNN: Towards Real-Time Object Detection with Region Proposal Networks. IEEE Trans. Pattern Anal. Machine Intell. 2017, 39, 1137–1149. [Google Scholar] [CrossRef] [Green Version]
- Fan, J.; Huo, T.; Li, X. A review of one-stage detection algorithms in autonomous driving. In Proceedings of the 2020 4th CAA International Conference on Vehicular Control and Intelligence, Hangzhou, China, 18–20 December 2020; pp. 210–214. [Google Scholar]
- Huiqiu, D. Trajectory tracking control of manipulator based on fuzzy adaptive uncertainty. J. Electr. Mach. Control. 2005, 3, 39–43. [Google Scholar]
- Stilman, M. Task constrained motion planning in robot joint space. In Proceedings of the 2007 IEEE/RSJ International Conference on Intelligent Robots and Systems, San Diego, CA, USA, 24–28 September 2017; pp. 3074–3081. [Google Scholar]
- Husin, Z.H.; Taujuddin, N.S.A.M.; Sari, S.; Ghani, A.R.A.; Norsuha, M.S.; Kogeethavani, R.; Aliah, B.S.N. Bacterial Leaf Blight (BLB) Disease Detection Using Hue, Saturation, Value (HSV) Band Threshold Method. In Proceedings of the 12th National Technical Seminar on Unmanned System Technology 2020; Springer: Singapore, 2022; pp. 403–420. [Google Scholar] [CrossRef]
- Fuentes-Alventosa, A.; Gómez-Luna, J.; Medina-Carnicer, R. GUD-Canny: A real-time GPU-based unsupervised and distributed Canny edge detector. J. Real-Time Image Process. 2022, 19, 591–605. [Google Scholar] [CrossRef]
- Wang, Z.; Jin, L.; Wang, S.; Xu, H. Apple stem/calyx real-time recognition using YOLO-v5 algorithm for fruit automatic loading system. Postharvest Biol. Technol. 2022, 185, 111808. [Google Scholar] [CrossRef]
- Hosseini, M.S.; Tuli, M.; Plataniotis, K.N. Exploiting Explainable Metrics for Augmented SGD. arXiv 2022, arXiv:2203.16723. [Google Scholar]
- Huang, T.; Cheng, M.; Yang, Y.; Lv, X.; Xu, J. Tiny Object Detection based on YOLOv5. In Proceedings of the 2022 the 5th International Conference on Image and Graphics Processing, Beijing, China, 7–9 January 2022; pp. 45–50. [Google Scholar]
- Subramani, T.; Sugathan, A. Finite element analysis of thin walled-shell structures by ANSYS and LS-DYNA. Int. J. Mod. Eng. Res. 2012, 2, 1576–1587. [Google Scholar]
- Luo, Y.R.; Wang, Q.Y.; Liu, Y.J.; Huang, C.X. Low cycle fatigue properties of steel structure materials Q 235 and Q 345. J. Sichuan Univ. Eng. Sci. Ed. 2012, 44, 169–175. [Google Scholar]
- Zhang, C.; Wang, R.; Zhu, L. Mechanical properties of Q345 structural steel after artificial cooling from elevated temperatures. J. Constr. Steel Res. 2021, 176, 106432. [Google Scholar] [CrossRef]
- Di, Q.H.; Ning, L.; Kun, Y.Y.; Shao, Y.Y. Microstructure and Mechanical Properties of Friction Stir Welded Q345 Steel. Mater. Trans. 2014, 55, 137–140. [Google Scholar]
- Ali, L.; Khan, S.; Iqbal, N.; Bashmal, S.; Hameed, H.; Bai, Y. An Experimental Study of Damage Detection on Typical Joints of Jackets Platform Based on Electro-Mechanical Impedance Technique. Materials 2021, 14, 7168. [Google Scholar] [CrossRef]
- Su, S.; Xuran, Z.; Wei, W.; Xiaohui, Z. Metal magnetic memory inspection of Q345 steel specimens with butt weld in tensile and bending test. J. Nondestruct. Eval. 2019, 38, 1–17. [Google Scholar] [CrossRef]
- Triyono, J.; Prabowo, A.R.; Sohn, J.M. Investigation of meshing strategy on mechanical behaviour of hip stem implant design using FEA. Open Eng. 2020, 10, 769–775. [Google Scholar]
- Wang, C.Y. Finite element analysis and optimization design of two axis stable platform. Manuf. Autom. 2011, 37, 89–91. [Google Scholar]
- Hroncova, D.; Frankovský, P.; Virgala, I.; Delyová, I. Kinematic analysis of the press mechanism using MSC Adams. Am. J. Mech. Eng. 2014, 2, 312–315. [Google Scholar] [CrossRef]
- Zhang, J.; Liang, X.; Zhang, Z.; Feng, G.; Zhao, Q.; Zhao, L.; He, G. A continuous contact force model for impact analysis. Mech. Syst. Signal Process. 2022, 168, 108739. [Google Scholar] [CrossRef]
- Teixeira, R.R.; Moreira, S.R.D.S.; Tavares, S.M.O. Multibody Dynamics Simulation of an Electric Bus. Procedia Eng. 2015, 114, 470–477. [Google Scholar] [CrossRef] [Green Version]
- Khan, S.; Khan, A.; Irfan, M.; Hussain, S.; Khan, S.; Hussain, S. Aerodynamic analysis and dynamic modeling of small horizontal axis wind turbine. In Proceedings of the ICRAI 2012, International Conference on Robotics and Artificial Intelligence, Rawalpindi, Pakistan, 22–23 October 2012; pp. 117–124. [Google Scholar] [CrossRef]
- Forghani, M.S.; Ritto, T.G. Stochastic Modeling of the Dynamics of a Wind Turbine Using Matlab and MSC. ADAMS. Mecánica Comput. 2013, 32, 615–630. [Google Scholar]
- Zhang, J.; Li, W.; Zhao, L.; He, G. A continuous contact force model for impact analysis in multibody dynamics. Mech. Mach. Theory 2020, 153, 103946. [Google Scholar] [CrossRef]
- Wang, C.-S.; Chiang, M.-H. A Novel Dynamic Co-Simulation Analysis for Overall Closed Loop Operation Control of a Large Wind Turbine. Energies 2016, 9, 637. [Google Scholar] [CrossRef]
- Xue, M.X.; Liu, S.R.; Wang, J. Dynamic multi-target recognition based on machine vision. J. Shanghai Jiaotong Univ. 2017, 51, 727–733. [Google Scholar] [CrossRef]
- Wang, Y.P.; Liang, J.M.; Zhou, X.F.; Zhang, G.; Chen, X.S. Dynamic Analysis and Structure Parameters Optimization of a Parallel Platform Based on ADAMS. In Applied Mechanics and Materials; Trans Tech Publications Ltd.: Bach, Switzerland, 2013; pp. 69–74. [Google Scholar] [CrossRef]
- Vahedi, A.; Jamali, A. Constraint optimization of nonlinear McPherson suspension system using genetic algorithm and ADAMS software. J. Vib. Control. 2021. [Google Scholar] [CrossRef]
- Chaudhry, A.A.; Buchwald, J.; Nagel, T. Local and global spatio-temporal sensitivity analysis of thermal consolidation around a point heat source. Int. J. Rock Mech. Min. Sci. 2021, 139, 104662. [Google Scholar] [CrossRef]
- Paleari, L.; Movedi, E.; Zoli, M.; Burato, A.; Cecconi, I.; Errahouly, J.; Pecollo, E.; Sorvillo, C.; Confalonieri, R. Sensitivity analysis using Morris: Just screening or an effective ranking method? Ecol. Modell. 2021, 455, 109648. [Google Scholar] [CrossRef]
- Lenhart, T.; Eckhardt, K.; Fohrer, N.; Frede, H.G. Comparison of two different approaches of sensitivity analysis. Phys. Chem. Earth Parts A/B/C 2002, 27, 645–654. [Google Scholar] [CrossRef]
Figure 1.
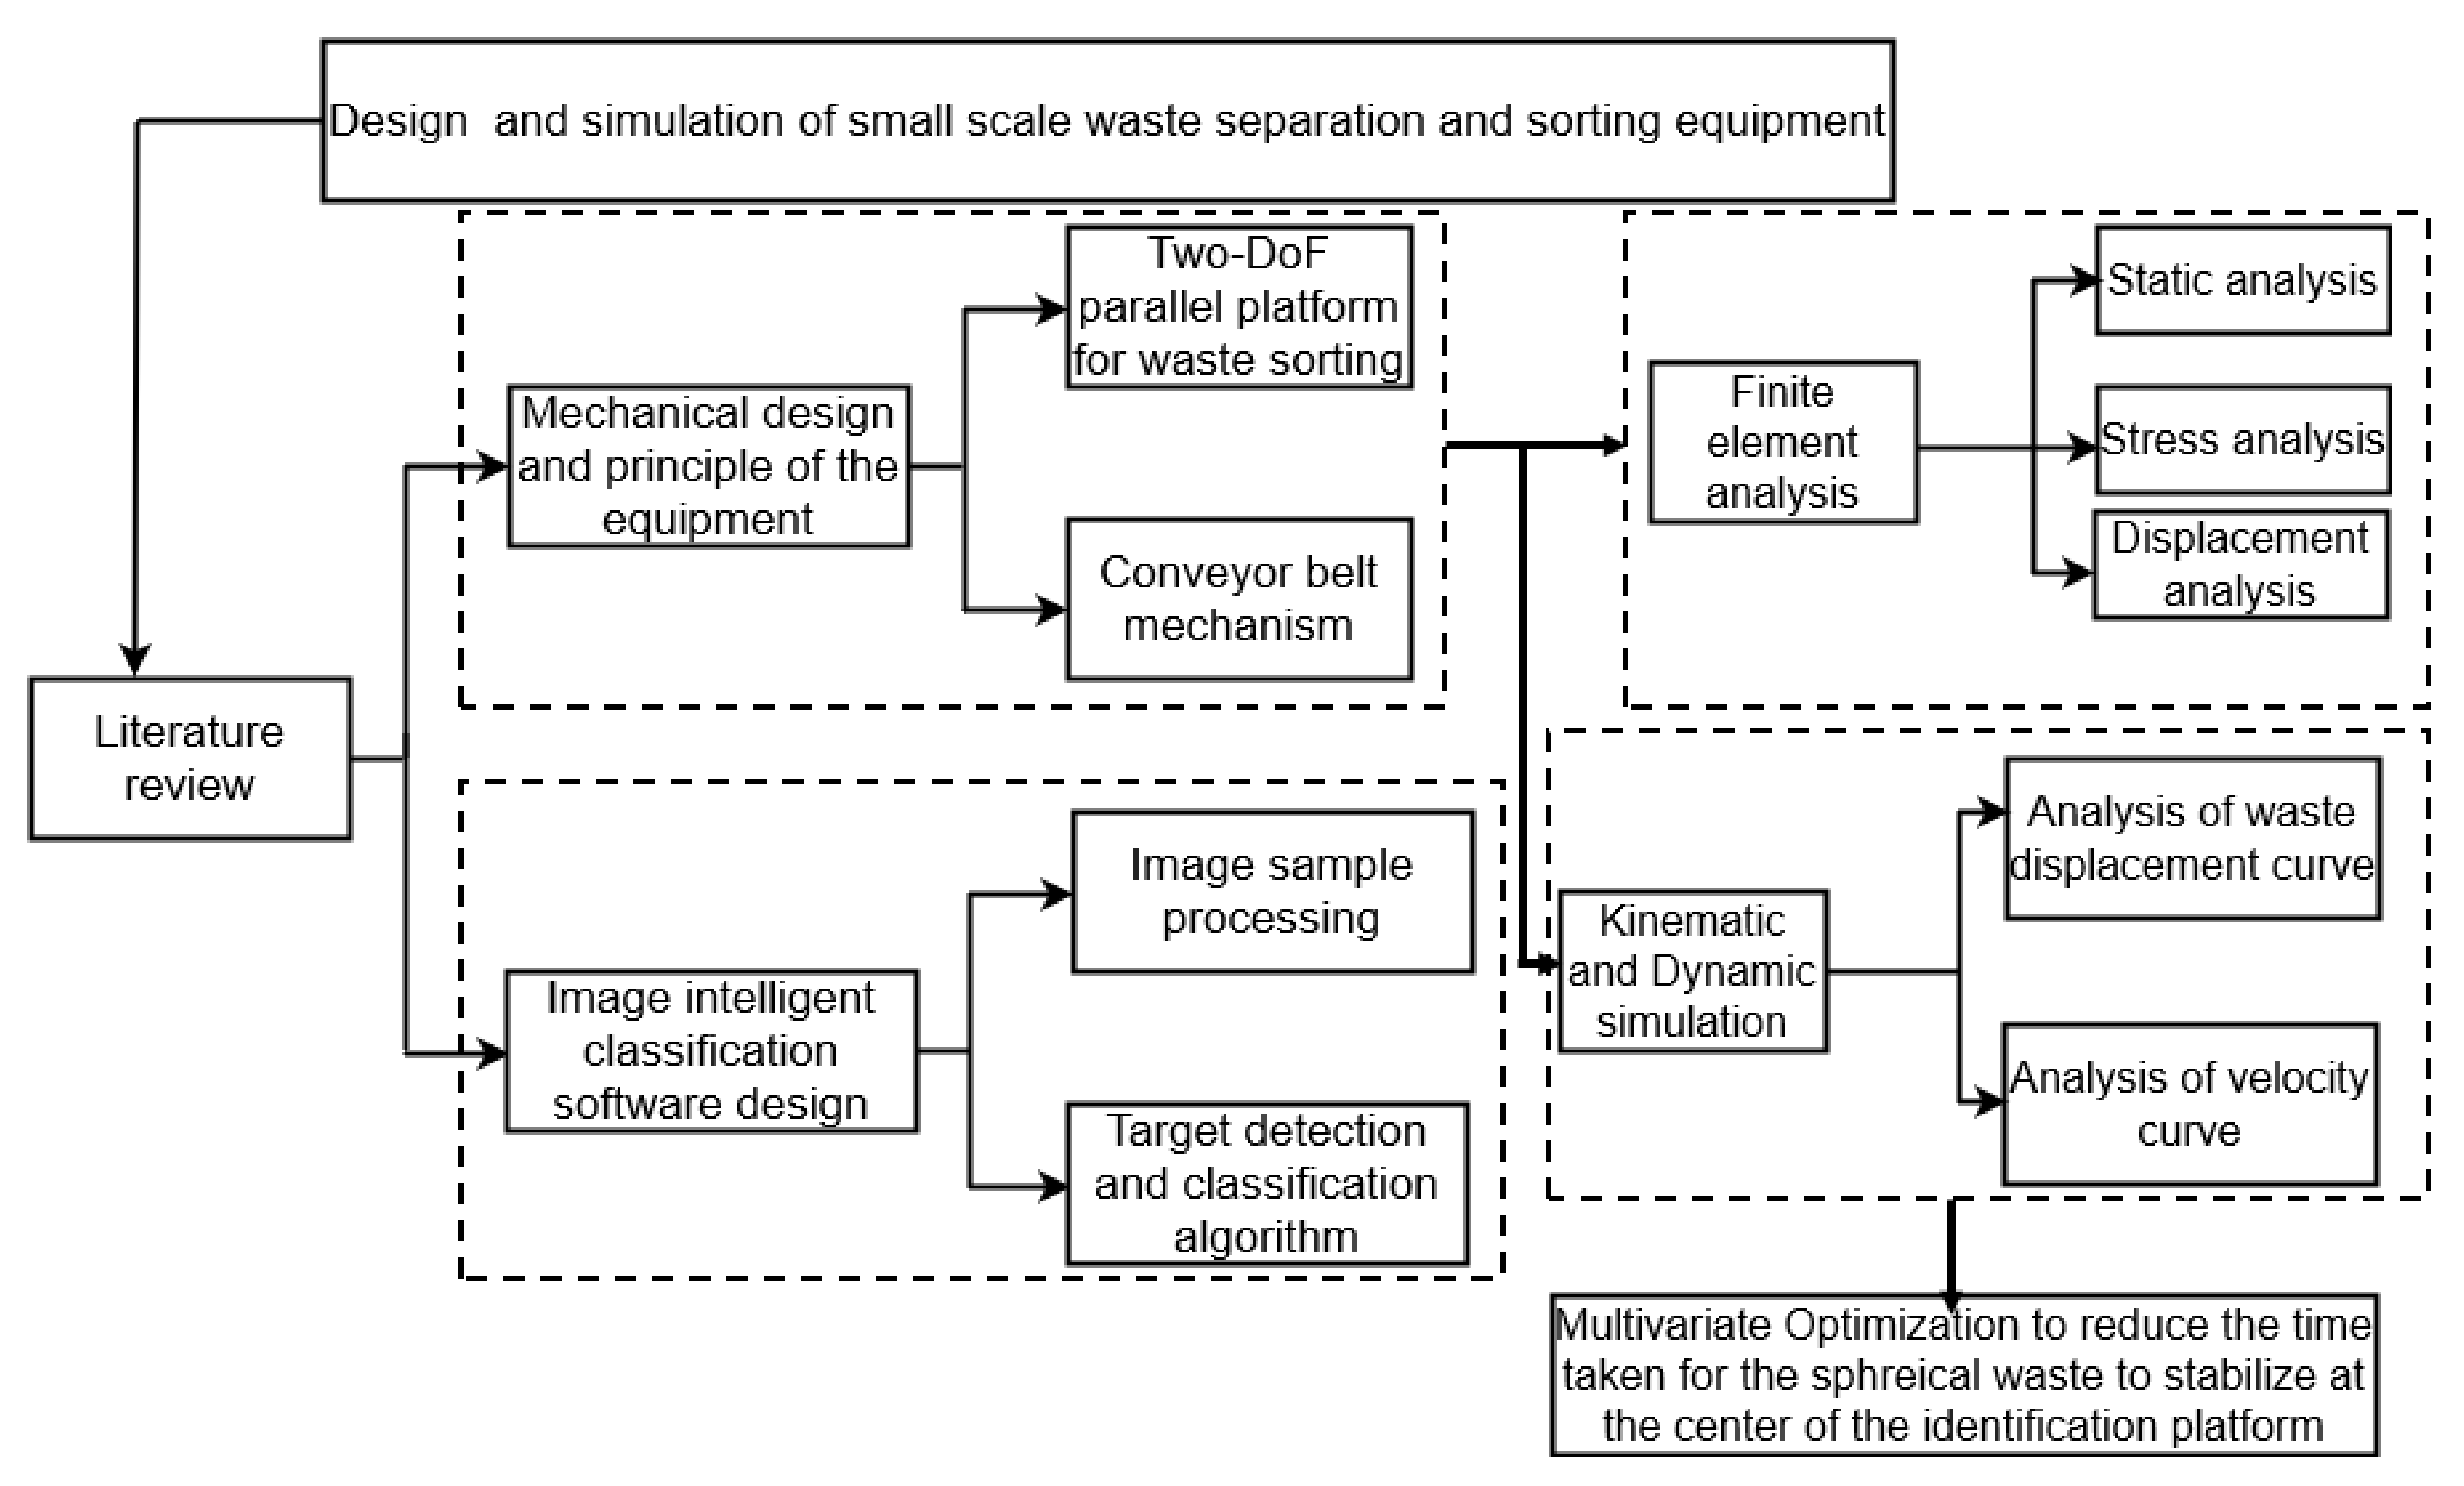
Schematic illustration of the study design. The schematic diagram shows the mechanical design, working principle, and software system design of waste management equipment. Finite element simulation and dynamic simulation of the waste separation process were carried out. Finally, the structural parameters were optimized to improve the efficiency of waste management equipment.
Figure 1.
Schematic illustration of the study design. The schematic diagram shows the mechanical design, working principle, and software system design of waste management equipment. Finite element simulation and dynamic simulation of the waste separation process were carried out. Finally, the structural parameters were optimized to improve the efficiency of waste management equipment.

Figure 2.
3D model of the waste separation mechanism and the sorting mechanism.

Figure 3.
Two-degree-of-freedom parallel platform. 1. Base, 2. Lower steering gear, 3. Upper steering gear, 4. Waste identification platform.
Figure 3.
Two-degree-of-freedom parallel platform. 1. Base, 2. Lower steering gear, 3. Upper steering gear, 4. Waste identification platform.

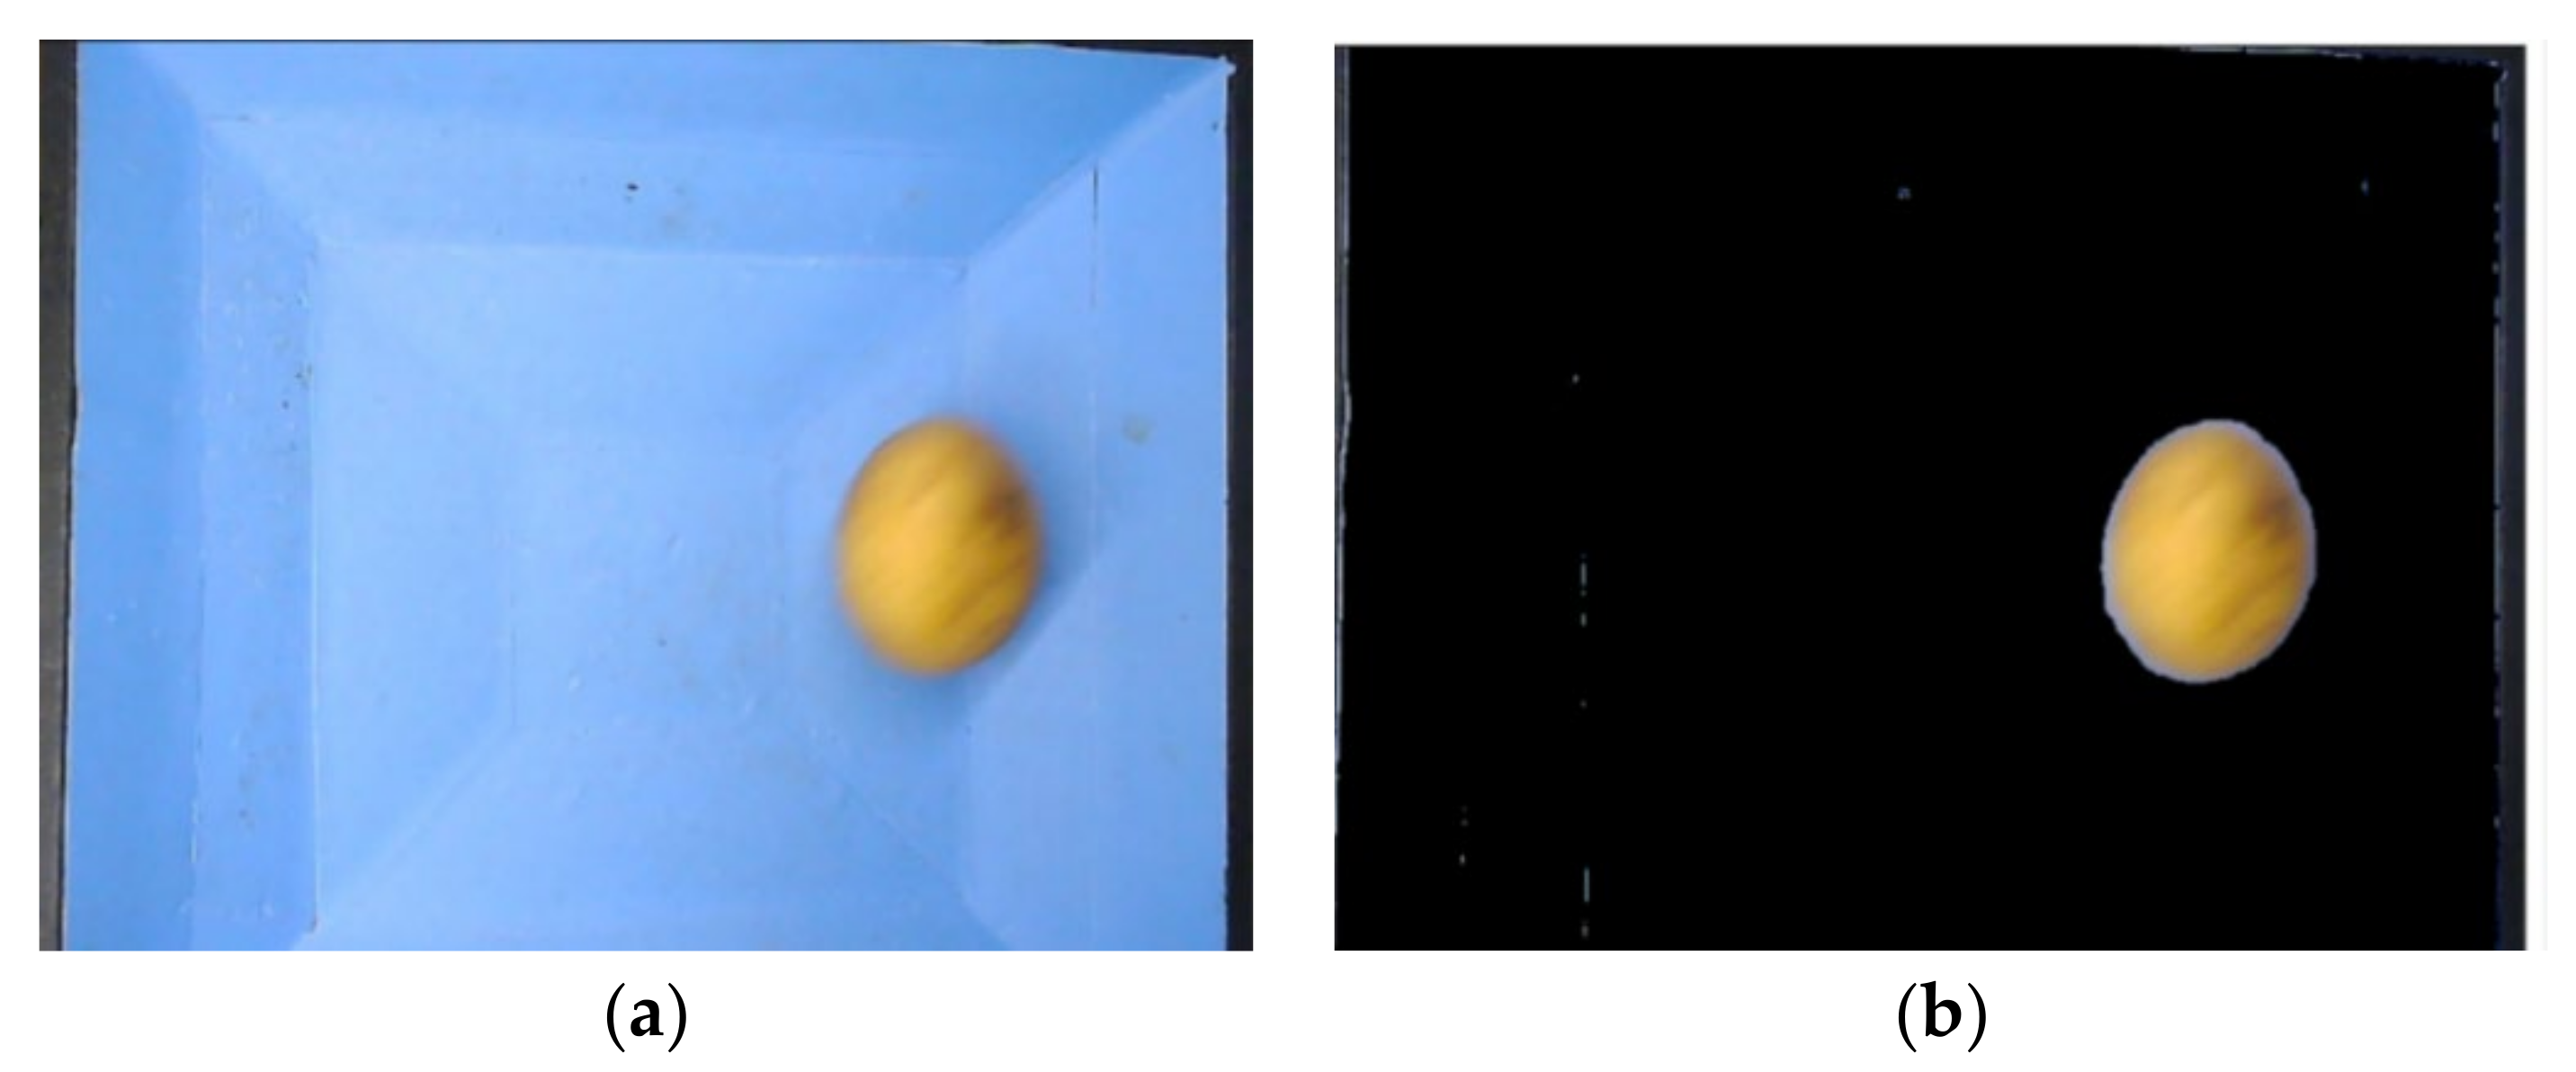
Figure 4.
Processing effects before and after color space separation and filtering. The sample is an image of a rolling potato taken with a 2-megapixel camera: (a) Pre-processing effect of color space separation and filtering. (b) Post-processing effect of color space separation and filtering; in the black background, the material entity is the main part, with some noise occurring in the background. The noise appears in the form of tiny white patches in the picture.

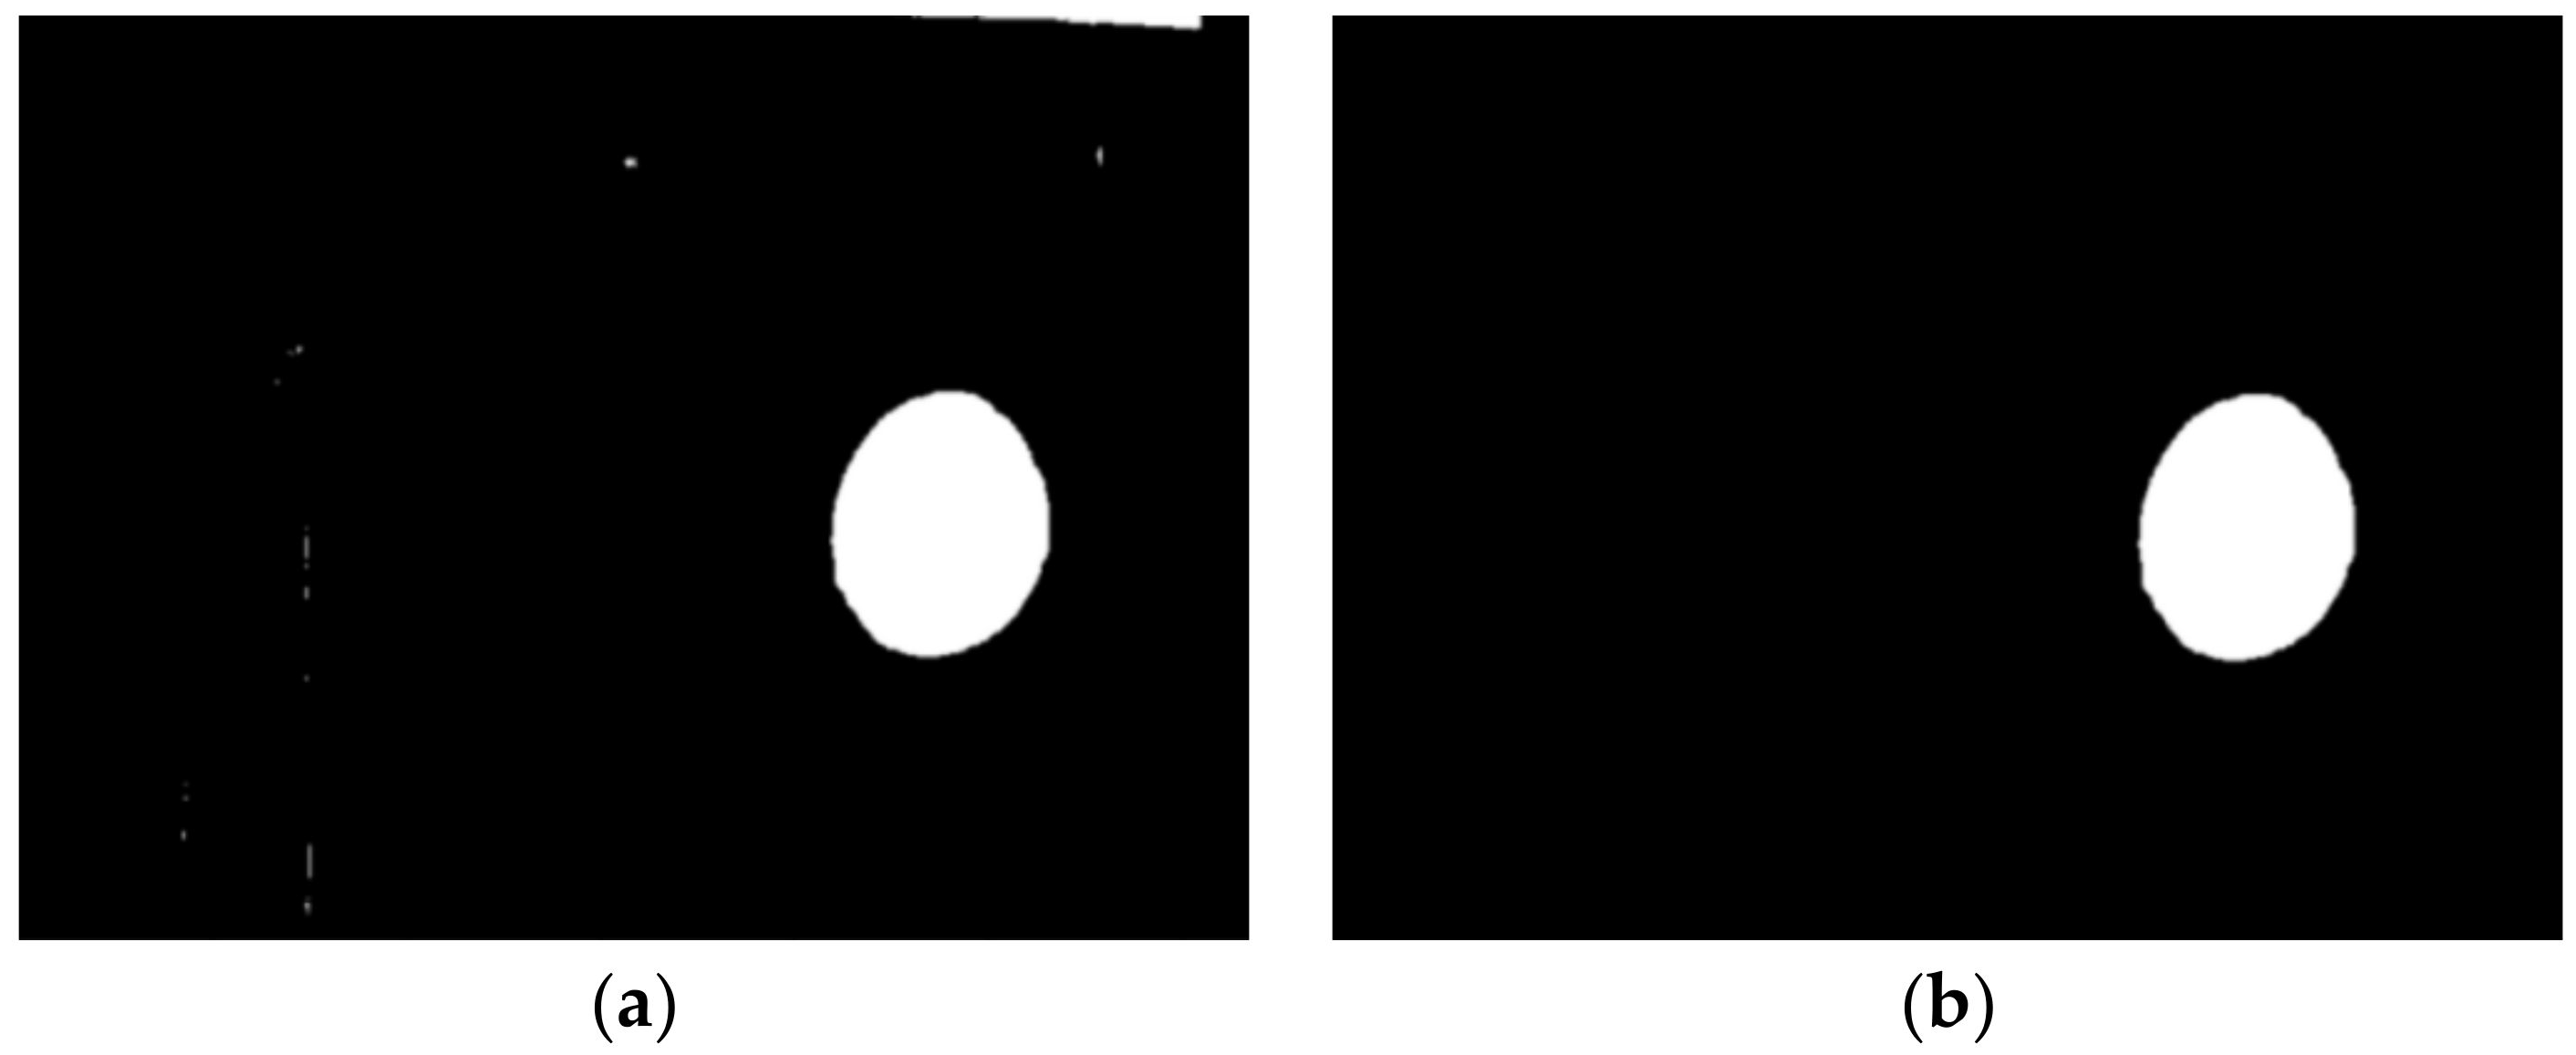
Figure 5.
Processing effect before and after noise processing: (a) Effect before noise processing; noise is detected, which is presented as the white patches occurring at the middle and edge of the figure. (b) Effect after noise processing; unnecessary or redundant interfering information in the image data is completely eliminated.

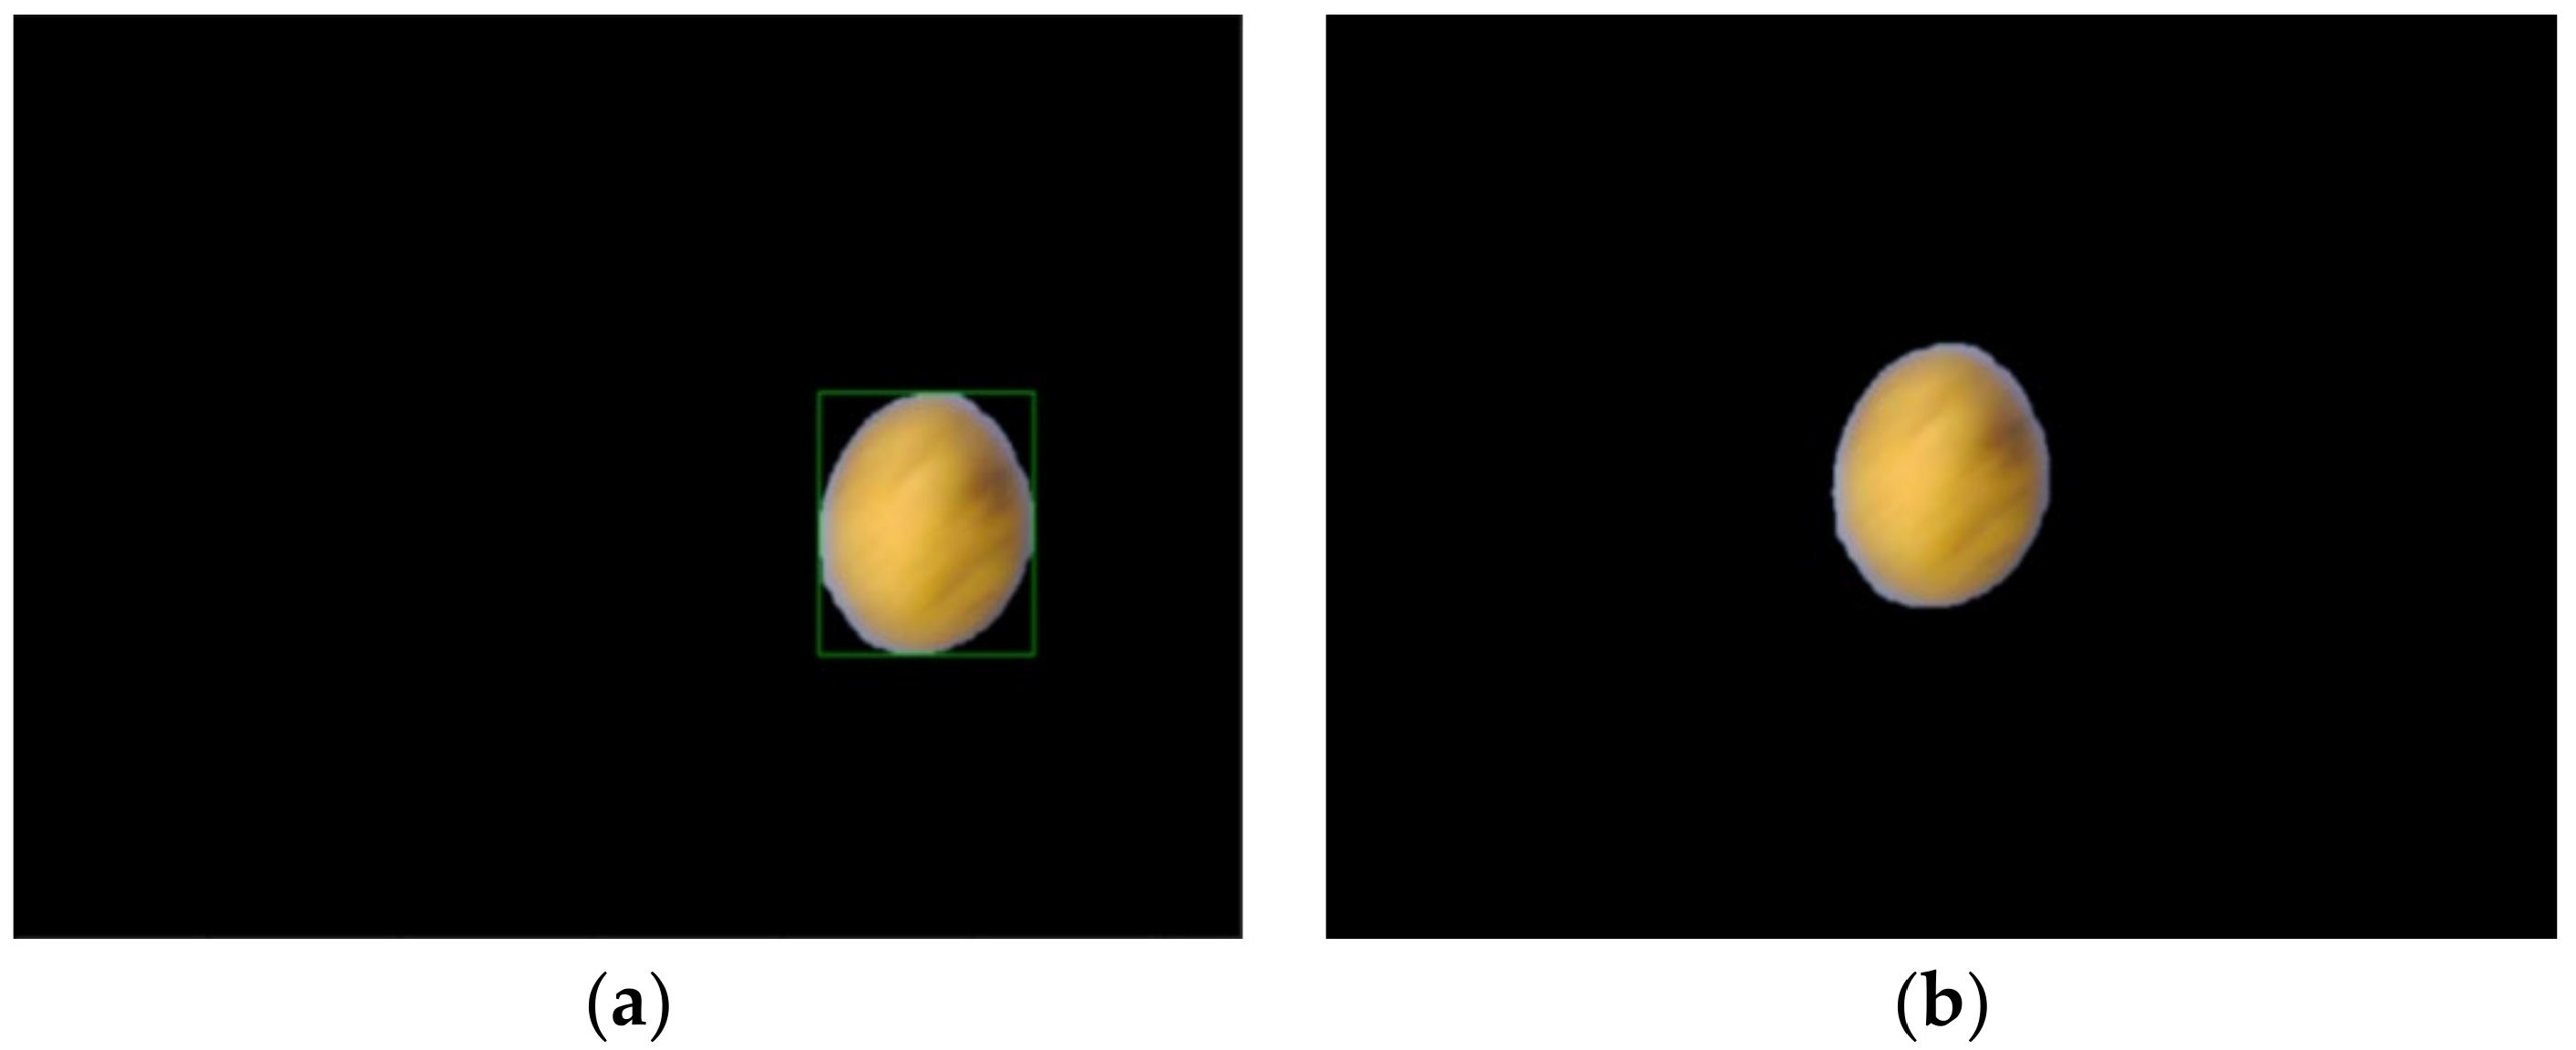
Figure 6.
Processing effect before and after the pattern centering conversion: (a) Effect before centering transformation; (b) Effect after centering transformation.
Figure 6.
Processing effect before and after the pattern centering conversion: (a) Effect before centering transformation; (b) Effect after centering transformation.

Figure 7.
Loss function curves for training and test sets of the YOLOv5 network. The x-axis and the y-axis represent the epochs experienced and the loss function value, respectively. The loss function value converges rapidly as the epoch grows.
Figure 7.
Loss function curves for training and test sets of the YOLOv5 network. The x-axis and the y-axis represent the epochs experienced and the loss function value, respectively. The loss function value converges rapidly as the epoch grows.

Figure 8.
Confusion matrix image of test set results. The prediction results of all test sets for the eight categories are consistent with the actual values.
Figure 8.
Confusion matrix image of test set results. The prediction results of all test sets for the eight categories are consistent with the actual values.

Figure 9.
Meshing quality. The overall quality of the mesh ranges between 0.85 and 1.

Figure 10.
Stress analysis.

Figure 11.
Displacement map of the platform.

Figure 12.
Servo drive function curve. The motor is driven by angular velocity. The x-axis and y-axis represent time and angular velocity, respectively. The angular velocity of the steering gear increases from 0 °/s to 50 °/s within 5 s.
Figure 12.
Servo drive function curve. The motor is driven by angular velocity. The x-axis and y-axis represent time and angular velocity, respectively. The angular velocity of the steering gear increases from 0 °/s to 50 °/s within 5 s.

Figure 13.
Coordinate system of the model.

Figure 14.
Displacement curve of the waste during the sorting process. The x-axis represents time, and the y-axis indicates the position coordinates of the material center of mass on each axis of the ground coordinate system: (a) X-axis direction; (b) Y-axis direction; (c) Z-axis direction.
Figure 14.
Displacement curve of the waste during the sorting process. The x-axis represents time, and the y-axis indicates the position coordinates of the material center of mass on each axis of the ground coordinate system: (a) X-axis direction; (b) Y-axis direction; (c) Z-axis direction.

Figure 15.
Waste velocity curve. The x-axis represents time, and the y-axis denotes the size of the garbage combined velocity.
Figure 15.
Waste velocity curve. The x-axis represents time, and the y-axis denotes the size of the garbage combined velocity.

Figure 16.
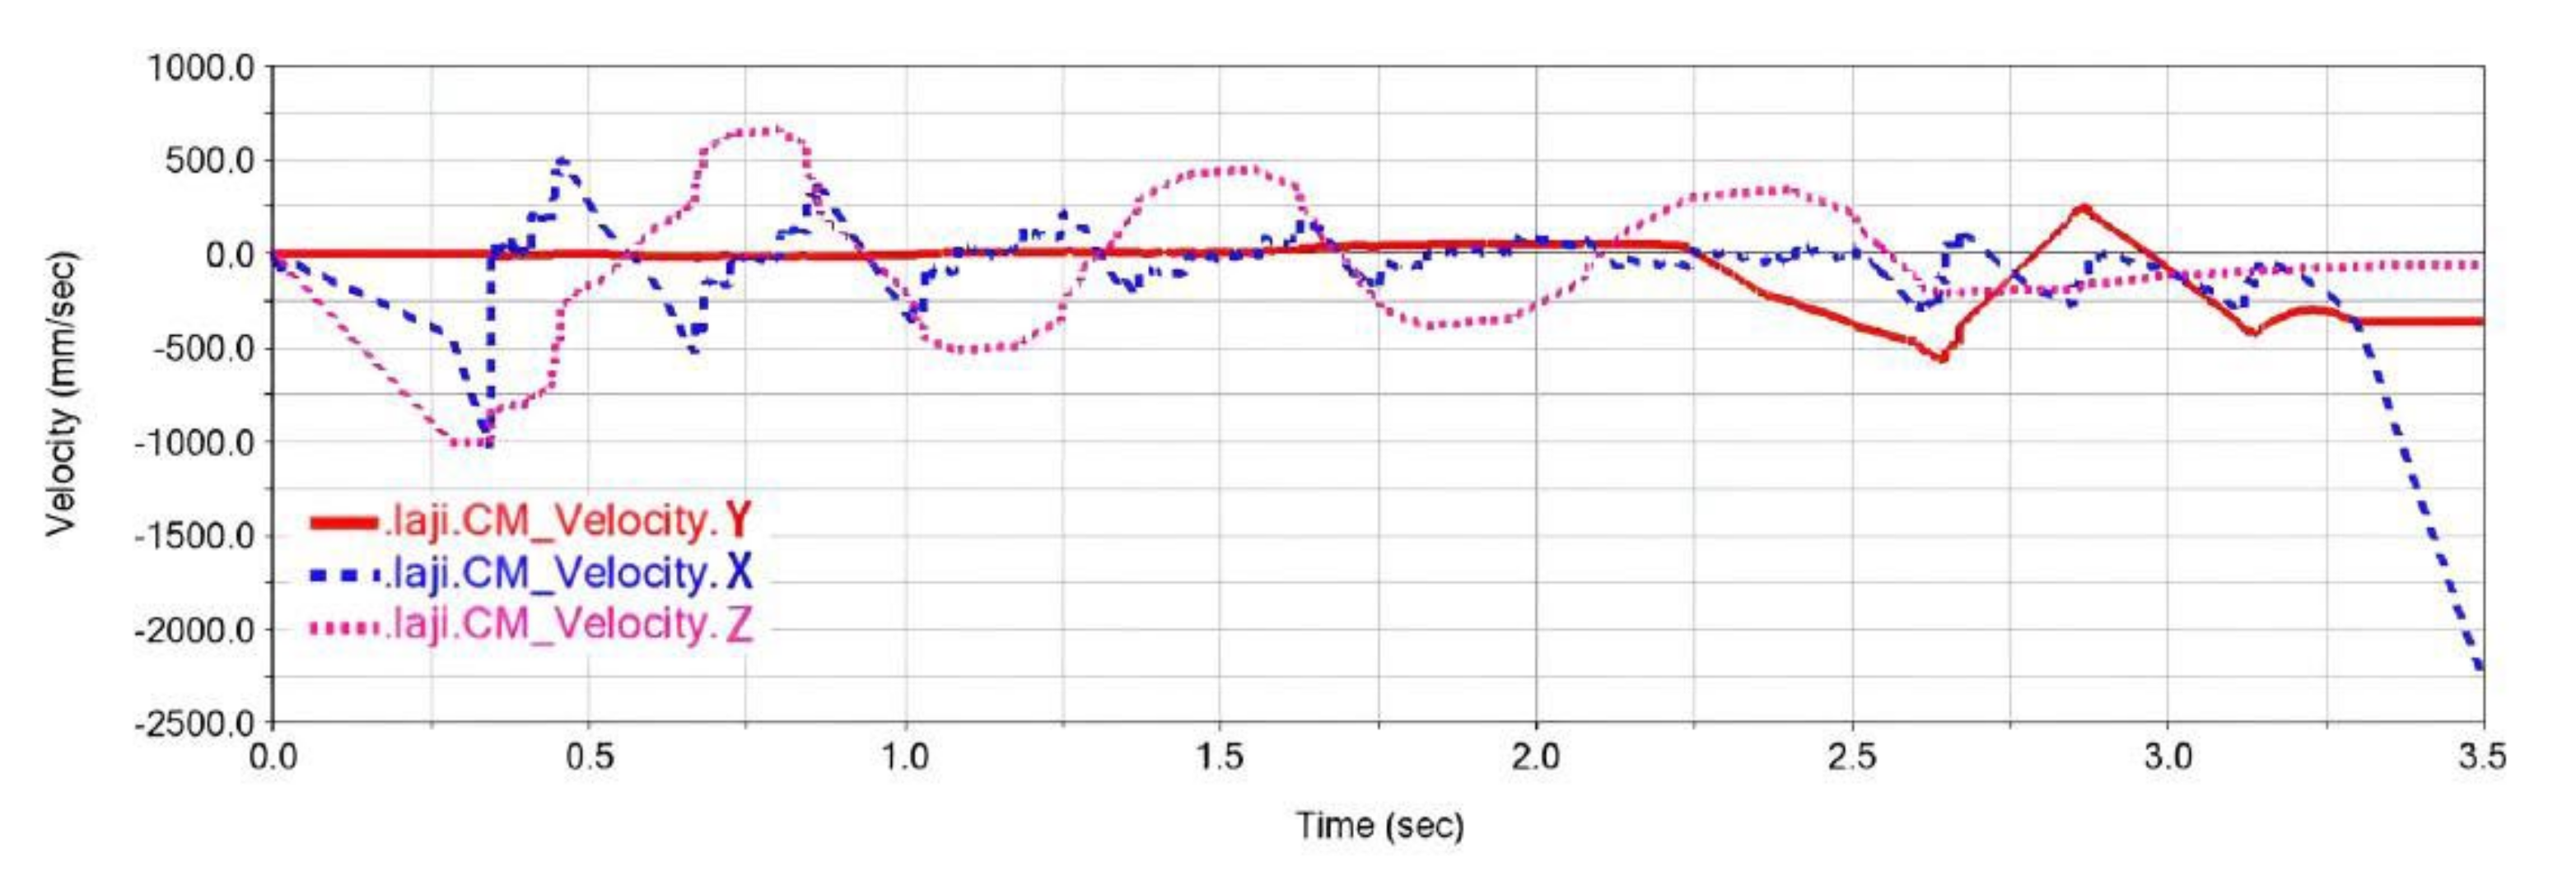
Comparison of the sub-velocity curves of the garbage along with the x, y, and z directions. The sub-velocity of the garbage along the y-axis is stable before the sorting device performs the dumping action, and there is a small deviation around vy = 0. The sub-velocity curve of the garbage along with the x-axis and z-axis assumes a wave shape.
Figure 16.
Comparison of the sub-velocity curves of the garbage along with the x, y, and z directions. The sub-velocity of the garbage along the y-axis is stable before the sorting device performs the dumping action, and there is a small deviation around vy = 0. The sub-velocity curve of the garbage along with the x-axis and z-axis assumes a wave shape.

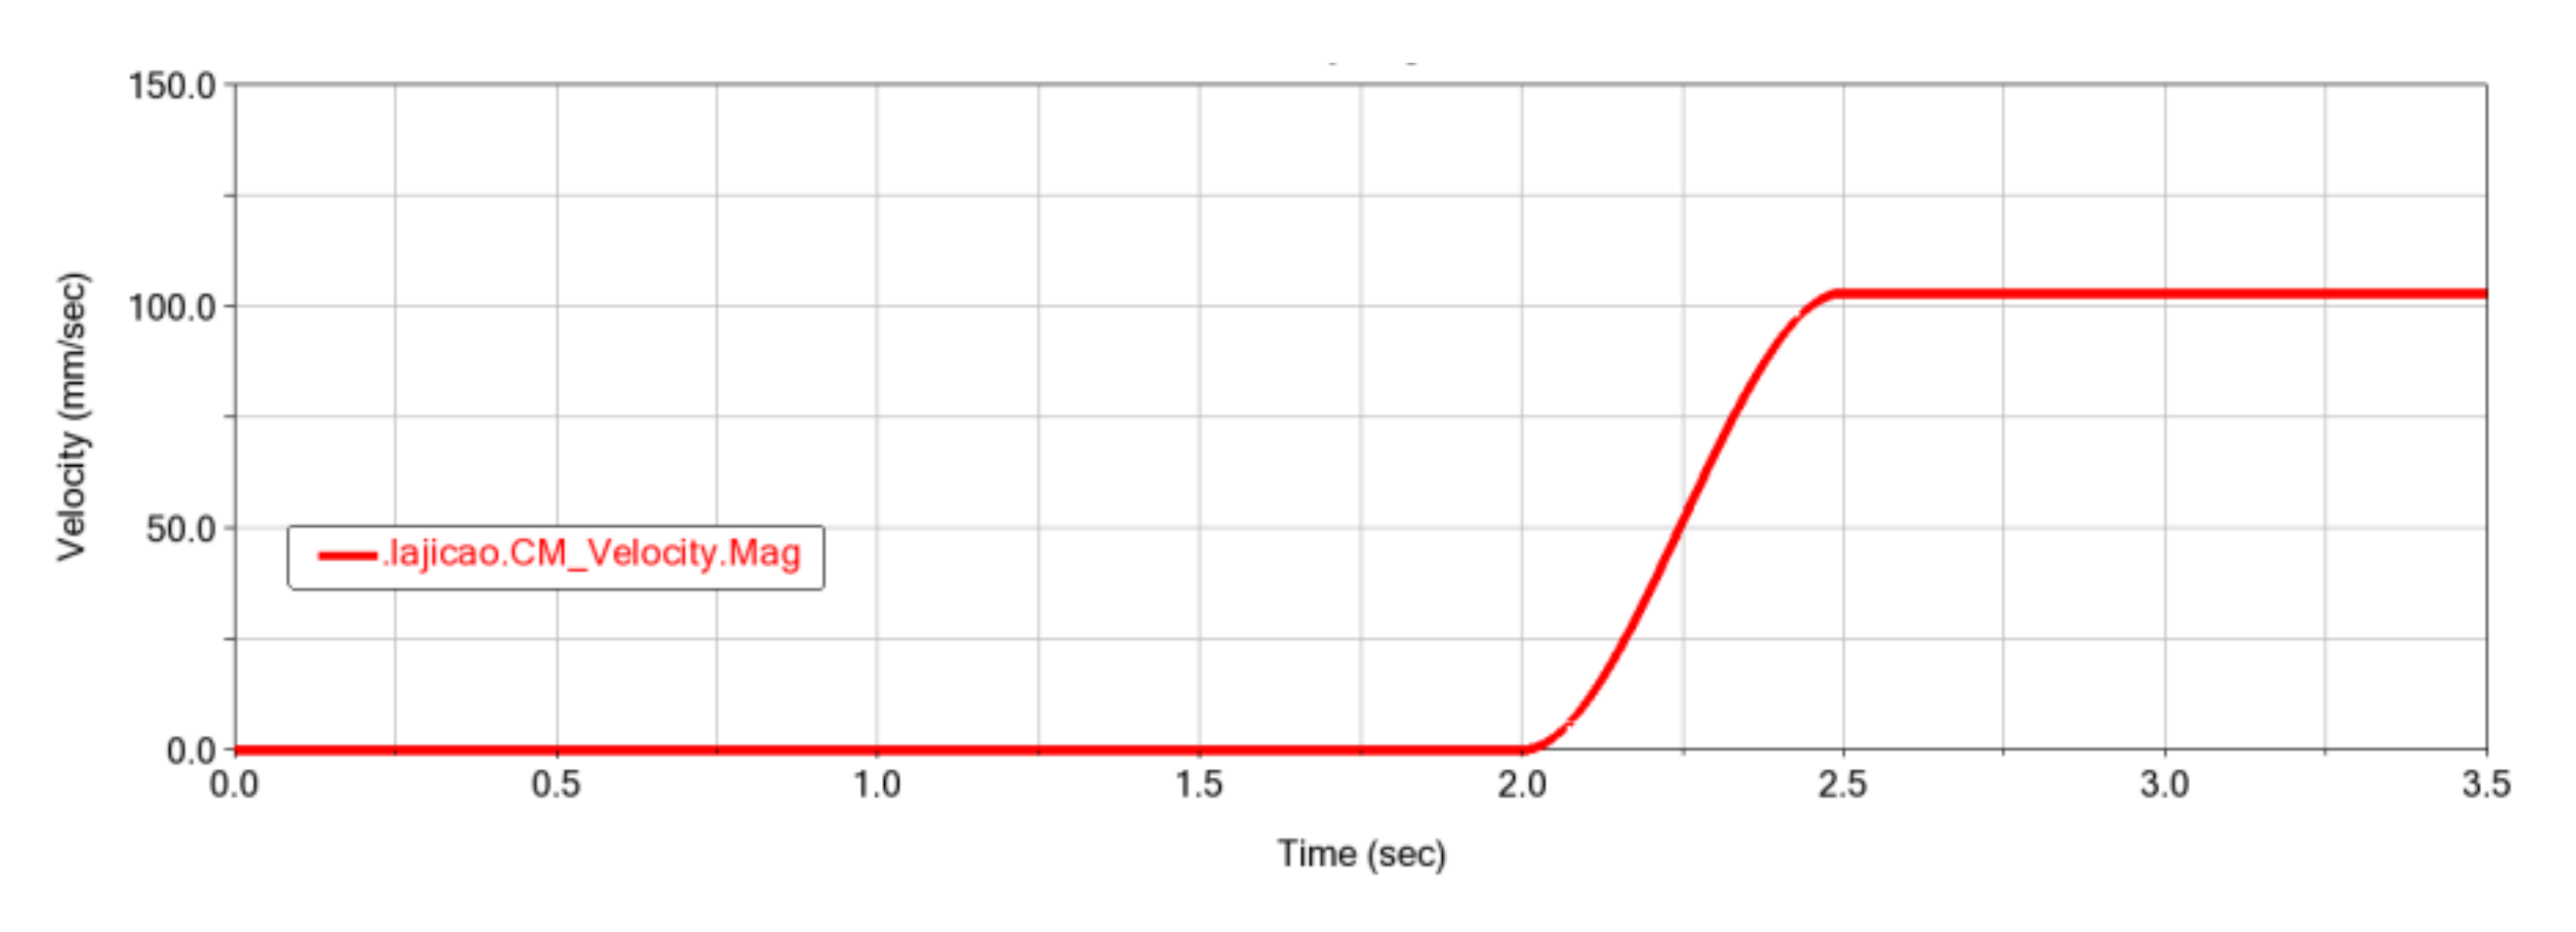
Figure 17.
Flipping speed of the sorting mechanism.

Figure 18.
A representation of the experimental sorting mechanism. It comprises the slideway, the two-DoF parallel platform, and the surveillance camera.
Figure 18.
A representation of the experimental sorting mechanism. It comprises the slideway, the two-DoF parallel platform, and the surveillance camera.

Figure 19.
The velocity curve of the sphere. The x-axis represents time, and the y-axis denotes the size of the garbage combined velocity. It takes 18.68 s for the sphere to stabilize.
Figure 19.
The velocity curve of the sphere. The x-axis represents time, and the y-axis denotes the size of the garbage combined velocity. It takes 18.68 s for the sphere to stabilize.

Figure 20.
A velocity curve of the sphere in the x-axis direction.

Figure 21.
Line graph comparing the time point obtained from numerical simulation and prototype test when Vx = 0. The x-axis represents serial number of the time point, and the y-axis denotes the time when the velocity of sphere becomes zero in the x-axis direction. The maximum absolute error of the 14 points is 1.02 s, with a relative error of 13%. The absolute error of other time points is below 0.67 s, which satisfies the requirements of the prototype.

Figure 22.
Variation curve of the optimization target in the iterative process. The x-axis represents the number of iterations, and the y-axis indicates the time taken by the spherical material to fall from the top of the slideway to stably rest at the center of the identification table, which represents, the objective function value.

Figure 23.
Comparison of the velocity of the spherical waste before and after optimization. The time taken by the spherical material to roll down from the top of the slideway to the stable and stationary position at the center of the identification table was shorter after optimization, and the speed convergence effect significantly improved.


Table 1.
Material properties of each component for the mechanisms.
| Component | Material | Density (g/cm³) | Elastic Modulus (GPa) | Poisson’s Ratio | Tensile Strength (MPa) | Yield Strength (MPa) |
|---|---|---|---|---|---|---|
| Base | Q345 | 7.86 | 209 | 0.29 | 620 | 345 |
| Steering arm | Q235 | 7.85 | 205 | 0.29 | 460 | 235 |
| Waste identification platform | Q235 | 7.85 | 205 | 0.29 | 460 | 235 |
Table 2.
Calculated values of the objects under the condition of different mesh quantities.
| Mesh Quantity | Maximum Static Stress (MPa) | Maximum Displacement (mm) |
|---|---|---|
| 29,636 | 49.285 | 0.0439 |
| 31,778 | 37.456 | 0.0465 |
| 43,797 | 25.244 | 0.0393 |
| 87,963 | 20.001 | 0.0287 |
| 119,415 | 18.521 | 0.0311 |
| 165,115 | 18.524 | 0.0307 |
Table 3.
Number and types of the restraint pairs of the waste sorting mechanism.
| Type | Number | DoF Constraint |
|---|---|---|
| Rotary hinge pair | 2 | 5 |
| Fixed hinge pair | 5 | 6 |
Table 4.
Parameter values of the impact function.
| Contact Entities | Stiffness Coefficient | Exponent of Force | Maximum Damping Coefficient | Depth (mm) |
|---|---|---|---|---|
| Spherical waste and slideway | 5000.0 | 1.5 | 50 | 0.1 |
| Spherical waste and platform | 5000.0 | 1.5 | 100 | 0.1 |
Table 5.
Friction coefficients of the spherical waste and the sorting system.
| Static Coefficient | Dynamic Coefficient | Static Slip Velocity (mm/s) | Dynamic Slip Velocity (mm/s) |
|---|---|---|---|
| 0.8 | 0.85 | 0.1 | 1.0 |
Table 6.
Time taken for the spherical waste to stabilize at the identification platform.
| SERIAL NUMBER | 1 | 2 | 3 | 4 | 5 | 6 | 7 | 8 | 9 | 10 | Average |
|---|---|---|---|---|---|---|---|---|---|---|---|
| Measurement (s) | 19.80 | 20.51 | 18.45 | 19.02 | 20.78 | 20.88 | 19.53 | 19.64 | 18.81 | 19.56 | 19.698 |
Table 7.
Variation range and initial value of four parameters.
| Parameters | Variation Range | Initial Value | Fixed Step Size |
|---|---|---|---|
| Slideway obliquity | 15°/90° | 15° | 10% |
| First-stage inclination angle | 10°/30° | 10° | 10% |
| Second-stage inclination angle | 30°/55° | 40° | 5% |
| Third-stage inclination angle | 55°/75° | 55° | 5% |
Table 8.
Calculated values of sensitivity factors and evaluation of sensitivity level.
| Parameters | Sensitivity Factor | Sensitivity Level |
|---|---|---|
| Slideway obliquity | −0.3175 | Sensitive |
| First-stage inclination angle | −0.53125 | Sensitive |
| Second-stage inclination angle | 0.35375 | Sensitive |
| Third-stage inclination angle | −0.681 | Sensitive |
Table 9.
Values of the optimization variables.
| Input Variables | Initial Value | Variation Range |
|---|---|---|
| Slideway obliquity | 15° | 15°/90° |
| First-stage inclination angle | 21° | 10°/30° |
| Second-stage inclination angle | 55° | 30°/55° |
| Third-stage inclination angle | 75° | 55°/75° |
Table 10.
Waste sorting time and variables before and after optimization.
| Before Optimization | After Optimization | |
|---|---|---|
| OBJECTIVE-Time | 6.0999 s | 3.94 s |
| Slideway obliquity | 15° | 15.0011° |
| First-stage inclination angle | 30° | 30° |
| Second-stage inclination angle | 55° | 54.9995° |
| Third-stage inclination angle | 66° | 66.1187° |
Publisher’s Note: MDPI stays neutral with regard to jurisdictional claims in published maps and institutional affiliations. |
© 2022 by the authors. Licensee MDPI, Basel, Switzerland. This article is an open access article distributed under the terms and conditions of the Creative Commons Attribution (CC BY) license (https://creativecommons.org/licenses/by/4.0/).
Share and Cite
MDPI and ACS Style
Xu, Z.; Zhang, J.; He, Y. Design and Simulation of Small-Scale Waste Separation and Sorting Equipment. Processes 2022, 10, 1020. https://0-doi-org.brum.beds.ac.uk/10.3390/pr10051020
AMA Style
Xu Z, Zhang J, He Y. Design and Simulation of Small-Scale Waste Separation and Sorting Equipment. Processes. 2022; 10(5):1020. https://0-doi-org.brum.beds.ac.uk/10.3390/pr10051020
Chicago/Turabian StyleXu, Ziheng, Jiajia Zhang, and Yuhui He. 2022. "Design and Simulation of Small-Scale Waste Separation and Sorting Equipment" Processes 10, no. 5: 1020. https://0-doi-org.brum.beds.ac.uk/10.3390/pr10051020
Note that from the first issue of 2016, this journal uses article numbers instead of page numbers. See further details here.