Article

Improvement of As(V) Adsorption by Reduction of Granular to Micro-Sized Ferric Hydroxide

1
Barcelona Research Center in Multiscale Science and Engineering-EEBE, Department of Chemical Engineering, Technical University of Catalonia (UPC), Av. Eduard Maristany 16, 08019 Barcelona, Spain
2
Eurecat, Centre Tecnològic de Catalunya, Water, Air and Soil Unit, Pça. de la Ciència 2, 08243 Manresa, Spain
3
Department of Materials Science and Metallurgical, EEBE, Technical University of Catalonia (UPC), Av. Eduard Maristany 16, 08019 Barcelona, Spain
*
Author to whom correspondence should be addressed.
Submission received: 24 April 2022 / Revised: 14 May 2022 / Accepted: 20 May 2022 / Published: 22 May 2022
(This article belongs to the Special Issue Novel Adsorbent for Environmental Remediation)

Abstract

:
The remediation of groundwater containing arsenic is a problem that has been addressed using adsorption processes with granulated materials in columns, but the remediation itself could be improved by using micro-sized adsorbents in stirred systems. In this study, arsenate (As(V)) batch adsorption experiments were performed using granular ferric hydroxide (GFH) and two derived micro-sized materials. Reduced-size adsorbents were produced by energetic ball milling, giving final sizes of 0.1–2 µm (OF-M samples) and ultra-sonication, producing final sizes of 2–50 µm (OF-U samples). Equilibrium isotherm studies showed that the Langmuir model was a good fit for the three sorbents, with the highest maximum adsorption capacity (qmax) for OF-U and the lowest for OF-M. The adsorption of the two groundwater samples occurred according to the obtained equilibrium isotherms and indicated the absence of interfering agents for the three adsorbents. Batch kinetics tests in stirred beakers followed a pseudo second-order model and indicated that the kinetics of the OF-U sorbent was faster than the kinetics of the GFH sorbent. The tests also showed an increase in the qe values for the reduced-size sorbent. The application of ultrasonication to the GFH produced an increase of 23 % in the qmax and b term and an increase of 34-fold for the kinetic constant (k2) in the stirred batch systems tested. These results suggest that this new approach, based on ultra-sonication, has the potential for improving the adsorption of arsenic in groundwater.

1. Introduction

The presence of arsenic in groundwater is a worldwide problem [1,2,3,4] and is related to geological factors [5], acid mine drainage (AMD) generation from mining activities [1,6], or to spent pyrites in brownfields [7]. With the possible exception of the latter case, where contamination sites can be located, arsenic contamination is diffuse and its effects extend to groundwater bodies. The most important arsenic removal methods can be divided into technologies that are integrated into the current water treatment processes and need to be optimized and specific technologies addressed to arsenic removal. The first group of methods includes oxidation of arsenic (to ensure arsenic as As(V) species); enhanced coagulation/filtration [1,2,8,9]; and enhanced lime softening [2]. The last two methods produce metal hydroxides as secondary products from coagulants (ferric and aluminum salts) or softening reactants (lime) that finally sorb As(V) species. The arsenic is removed from water through the sludge obtained from the coagulation-flocculation or softening processes [1]. These technologies are less feasible for groundwater because they are difficult to apply in the field [8] and groundwater normally does not require coagulation or softening steps.
The second group of methods includes membrane technologies; ion exchange; and adsorption [1,2,8,9]. Reverse osmosis and nanofiltration membranes are able to efficiently separate soluble arsenic from water as a concentrated solution using a high-pressure process. In this alternative, the produced water yield can be low and the membranes require a pretreatment of water to avoid long-term fouling and scaling problems and sometimes a post-treatment to supply the lost mineral salts [2]. Anion-exchange technologies remove arsenate and other anions from the water. As sulfate is usually present in excess in AMD or groundwater in contact with pyrite minerals, the interference of this anion could be an important drawback to this alternative. Adsorption is an easy-operated and widely-used efficient technique that is more selective than anion-exchange for arsenic removal due to an important diversity of classical and new materials and could be used to overcome specific problems such as the excess of sulfate mentioned.
To address the groundwater contamination problem, in situ remediation methods based on the adsorption of arsenic such as permeable reactive barriers (PRBs) [10] or reactive zones barriers (RZBs) can be used. The RZB methods use suspensions of small-sized materials including nanomaterials (NMs) [11,12,13] that are more effective in removing As(V) than PRB at the lab and field scales due to the superior adsorption capacity of NMs [8,14]. However, this approach can be expensive when considering the great extension of the affected groundwater. It can also be impacted by new unlocated releases, creating a rebound effect of the arsenic in groundwater. The impact of the NMs involved in the remediation on water bodies is another potential limitation of this type of application.
Alternatives for groundwater remediation include on site methods such as pump and treat methods, which could be very good options for remediation based on the point-of-use concept [9], focusing attention on the efficiency of the amount of water that must be used in that moment. The adsorption of arsenic with granular iron-based materials such as granular ferric hydroxide (GFH) in columns is a well-known, available, and cost-effective technology applied to many types of waters including groundwater [3,14,15,16]. Through fixing the optimal operative parameters, the adsorption can be better controlled than in the case of in situ methods. However, the mass transfer of arsenic from the groundwater to adsorbents such as GFH in a column is limited [17,18,19], and the competitive effects of some oxyanions present in the water could be an additional problem [1,9,20,21], giving an early breakthrough of arsenic. Long-term clogging effects in the column could also decrease the effectiveness of arsenic removal [16].
To improve the arsenic adsorption, some references have shown that micro-sized iron hydroxide particles can increase the adsorption capacity [19,22,23] and that processes operated using these small particles in stirred systems increase the arsenic-adsorbent mass-transfer [17,19,22] when compared to the GFH in columns. In the case of iron-based NMs, several reports have shown that the maximum adsorption capacity is clearly increased in stirred batch systems by reducing the particle size within the nanometer range [10,13,14]. These small sizes are easily operated in stirred batch processes and are an alternative that could also be combined in hybrid methods [3,9,17,24,25] for better arsenic removal.
The top–down reduction of a bulk material is a useful method to obtain micro-sized particles and precisely compare the effect of the reduction in the material size on the adsorption. Energetic ball milling methods have been shown to reduce the material sizes of iron [26,27] close to the nanoscale range and ultra-sonication methods have been recently used as a new alternative to produce micro-sized ferric hydroxide [28]. To achieve our objectives, this study focused on: (i) reducing the size of a commercial granular adsorbent (GFH) using energetic ball milling and ultra-sonication; (ii) the determination of the positive effect of size reduction on the arsenic adsorption equilibrium; (iii) the use of the adsorbents to check potential interferences of the synthetic water and groundwater during equilibrium; and (iv) test in a stirred batch process the best adsorbent vs. the GFH and modeling the arsenic adsorption kinetics.

2. Materials and Methods

2.1. Reagents and Adsorbent Preparation

Nitric acid (HNO3) 96% and sodium sulfate (Na2SO4) were analytical grade and obtained from Panreac, Spain. The dissolutions, dilutions, suspensions, and particle synthesis (milling and ultra-sonication) were performed using deionized (DI) water (Merck-Millipore, Elix 70, Darmstadt, Germany).
The commercial, low-cost GFH adsorbent Ferrosorp GW ® (HeGo Biotec GmbH, Giessen, Germany) was used as the initial material. This adsorbent was obtained from an industrial byproduct based on Fe(OH)3 [29] and contained 6.3% calcium [28]. The pHPZC of GFH was 8.43, which was similar to the equilibrium pH (8.6) using an adsorbent concentration of 1 g/L of [28].
This GFH adsorbent (hereafter OF-G) was size-reduced using two methods: a milling process and disaggregation by ultrasonic waves, which have been described in detail in a previous report [28]. The first method involved a two-step milling process, in which the first step consisted of dry milling, using a hammer mill (MF 10 basic microfine grinder drive, IKA-Werke GmbH, Staufen, Germany) at 6000 rpm. A total of 250 g of the GFH sample was passed through this mill three times and sieved at 100 µm. In the second milling step, 6 g of this pre-milled sample was placed in a 250 mL carbon steel vial, along with 200 g of S110 spherical high-carbon steel shots (Pometon S.p. A, Maerne, Italy), and 150 mL of DI water. The material was milled at 250 rpm for 5 h using a Planetary ball mill (Fritsch GmbH, P-5, Mahlen und Messen, Idar-Oberstein, Germany). After milling, the slurry was separated from the steel grinding balls using a 75 µm sieve. The retained material was washed several times with DI water over the recovered slurry until reaching a final volume of 500 mL. The slurry was dried overnight in an oven at 100 °C (J.P. Selecta, Digiheat, Abrera, Spain) and the dry solid was disaggregated using an agate mortar.
The second method used for the size reduction was disaggregation by ultrasonic waves. For this purpose, around 5 g of solid GFH was mixed with DI water in a 250–500 mL volumetric flask and sonicated for 5 min at 20 kHz in a lab ultrasonic cleaner (ATU Ultrasonidos, ATM40-2L-CD, Paterna, Spain). The suspension was centrifuged at 4000 rpm for 5 min to remove the supernatant water. The solid was dried and disaggregated as in the milling method (see above).The milled particles were named as OF-M and the particles obtained from the ultrasonic process were named as OF-U.

2.2. Groundwater and Synthetic Samples

Two groundwater samples with arsenic were obtained from the Nitrastur site (Langreo, Asturias, NW Spain), which is a 20 Ha brownfield that has been extensively studied through the EU projects I+DARTS [7,30], NANOREM [12,31], and Reground [11,32]. The groundwater was sampled in spring of 2016 during the Reground project and was extracted from the central part of the site. In this location, pyrite ash is abundant (2.7 m of superficial made ground layer) and most As is in the form of arsenate (As(V)) [7]. The samples were obtained from two conventional monitoring wells (N1 and CW3) at 2 m below ground level. The characterization of these groundwater samples showed a pH value of 6.9 for N1 and 6.6 for CW3 and the concentration of As was 2.02 mg/L for N1 and 2.72 mg/L for CW3. The detail of the position of the samples N1 and CW3 and the literature results of the composition of groundwater surrounding these two samples from the present work are given in Section S1 of the Supplementary Materials (Figure S1 and Table S1 [33,34,35]). This information shows that the characterization was consistent with the site, phosphate was absent, and sulfate was the only potential interferent that could compete with arsenate [1,9,21].
Synthetic samples were prepared from a 1000 mg/L As(V) standard for ICP TraceCERT® (Sigma Aldrich, Buchs, Switzerland) in a matrix of 3–5% HNO3. The synthetic samples used in the adsorption studies were prepared by the dilution of the As(V) standard in DI water alone or in DE with a sulfate concentration of 500 mg/L. These synthetic samples had a pH of around 5 and were not buffered to avoid potential interferences with the added anions.
This information (pH, redox conditions, and ionic strength) of the synthetic and groundwater samples was summarized (see Table S2 in the Supplementary Materials) to elaborate a predominance diagram (see Figure S2 in the Supplementary Materials) with the software SPANA [36] in order to understand the speciation of arsenic in the equilibrium dissolution. The results clearly show that the predominant expected species in equilibrium (with a measured value of equilibrium pH in the range 8.6–9.4) was HAsO42-. This result is consistent with several previous publications [2,10,14,37].

2.3. Characterization of the Adsorbents

Characterization of the adsorbent solids the OF-G, OF-M, and OF-U used in this study work has been previously described [28]. The general morphology and individual particle size were studied by scanning electron microscopy (SEM) (Zeiss, Gemini ultra plus, Jena, Germany) equipped with energy-dispersive X-ray spectroscopy (EDS) (Oxford Instruments, X-MAX 50 mm2, Abingdon, UK). Sample preparation involved two steps: (1) deposition and room evaporation over aluminum pins, and (2) sample metallization with Au–Pd 30 s at 18 mA (Quorum, Emitech SC7620 mini sputter, Laughton, UK).
The granulometry of the suspensions was analyzed using laser diffraction spectrometry for the OF-M samples (Beckman Coulter, LS 13320, Brea, CA, USA) and with a Malvern Panalytical Mastersizer 3000 (Malvern Panalytical Ltd., Malvern, UK) for the OF-U samples in DI water.
The nitrogen Brunauer–Emmett–Teller (BET) specific surface area (SSA) was measured (Micromeritics ASAP 2020, Aachen, Germany). Degassing was carried out for several hours at a maximum temperature of 100 °C. The sample preparation for this analysis involved drying 1 g of the slurry, which was performed at 60 °C in a biological incubator (Raypa, Incuterm Digit, Terrassa, Spain) for 72 h. Thereafter, a dried cake was obtained, which was crushed to a fine powder using a manual agate mortar. The above-mentioned drying procedure was performed in a negative pressure lab cabinet to avoid exposure to the nano powder.
The zeta potential of 1 g/L suspensions of OF-M and OF-U was measured using 0.01 M analytical grade NaCl (Panreac, Castellar del Vallès, Spain) at equilibrium pH and dynamic light scattering detection (Brookhaven Instruments, NanoBrook Zeta Pals; Holtsville, New York, NY, USA).

2.4. Batch Adsorption Procedures and Characterization of Samples

Two procedures were used in the batch adsorption tests: 50 mL stirred tubes and 2 L stirred beakers. The first procedure was used as a screening step to study the equilibrium of several types of water samples with the three adsorbents and elucidate the effect of the size reduction and the potential role of the interferences. In this procedure, the synthetic arsenic solutions (0.2–4.7 mg As/L) were prepared by diluting the As(V) standard in DI water in several steps to perform the equilibrium studies. In some samples, instead of DI water, a 500 mg/L SO42- solution in DI water was used. The two samples of groundwater (N1) and (CW3) were also studied for arsenic elimination. In this procedure, the three solids (OF-G, OF-M, OF-U) were tested. Equilibrium batch tests were performed by maintaining in contact replicate experiments of 50 mL quantities of arsenic dissolutions in Falcon tubes with 25–200 mg weighted amounts of each adsorbent (Sartorius AG, Practum 513-S, Göttingen, Germany). The experiments were run for 120 h at room temperature, with vertical stirring at 50 rpm (Heidolph GmbH, REAX 20, Schwabach, Germany) under dark conditions. The suspensions obtained were centrifuged (J. P. Selecta, Centronic-BLT, Abrera, Spain), operating at 4000 rpm for 5 min. Two additional 94 h leaching experiments using 200 mg of OF-G and OF-U in 50 mL of DI water without arsenic were also performed to obtain a background leaching matrix (BLM) to test their potential effect on arsenic elimination.
The second procedure was focused on the study of kinetics comparing the two better adsorbents from the first procedure, but at a higher volume of water, and using several series that included the periodical addition of As(V) to the batch. In this procedure, borosilicate glass beakers were filled with 1.5 L of synthetic arsenic dissolution at 4 mg As/L in DI water for the study of the adsorption kinetics using the OF-G and OF-U solids.
A propeller stirrer (Heidolph RZR-1) equipped with a PTFE screw propeller at the maximum speed (255 rpm measured by using a digital tachometer (ST-6236B, Reed Instruments, Wilmington, DE, USA) was used for this procedure.
Three different series of adsorption experiments were performed to determine the kinetics. In the first series, 0.75 g of the OF-G adsorbent was added at the initial time to the stirred beaker and 10 mL samples were extracted in the following 24 h. After this time, the batch was spiked with more arsenic (3 mL of 1000 mg/L Standard). This cycle was repeated three times, ending after 74 h. This experiment allowed us to characterize the OF-G kinetics. The pH of the equilibrium samples was measured with a pH-meter (Crison, GLP22, Alella, Spain).
In the second series, the initial sorbent in the stirred system was 1.5 g of OF-G and samples of 10 mL were extracted in the following 48 h. After 48 h, all of the beakers were ultra-sonicated for 15 min (Ultrasons, J. P. Selecta, Abrera, Spain) and stirred again under the same conditions for an additional 24 h. The objective of this experiment was to change the solid from the OF-G to a solid similar to the OF-U in order to study its effect on adsorption.
The third series of experiments used 1.5 g of the OF-U adsorbent added to the stirred beaker and samples of 10 mL were extracted after the first 48 h. After 48 h, the batch was spiked with more arsenic (3 mL of 1000 mg/L Standard) and, after 24 h, a second similar spiking was performed. This experiment was conducted to study the OF-U kinetics.
In both procedures (tubes and beakers), the supernatant solution was filtered with a regenerated cellulose (RC) 0.2 µm filter, acidified with 200 µL of concentrated nitric acid and analyzed using ICP-OES (Model 5110, Agilent Technologies, Santa Clara, CA, USA) with a quantitation limit of 5 μg/L or ICP/MS (Model 7800, Agilent Technologies, Santa Clara, CA, USA) with a quantitation limit of 0.15 μg/L. The ICP-OES used 12 L/min of plasma flow and 1 L/min of auxiliary flow with a power of 1.2 kW and the following operating parameters: 3 replicates; 15 s of stabilization time; axial viewing mode, and concentric nebulizer type with a flow of 0.7 L/min. The quantitation signal was the average of the wavelengths 188.980, 193.696, and 197.198 nm, and the read time was 7 s.
The ICP/MS used He gas at 5 mL/min with the following instrumental parameters: 3 points per peak; monitored isotopes (m/z): As (75), and Ge (72) as the internal standard, and integration time/mass 0.6 s.

2.5. Isotherm and Kinetic Modeling Studies

The adsorption of As(V) onto the solids in the case of the stirred tubes was calculated from the following mass balance expression [17]:
q q o = ( C o C ) · V m
where qo and q are the amount of arsenic adsorbed onto the solid at the initial time and at time t, respectively (mg/g); Co and C are the concentrations of arsenic (mg/L) at the initial time and at time t; V is the volume of dissolution in the batch experiment (L); and m is the mass of the solid adsorbent in the experiment [g]. For all of the experiments in tubes, the adsorbent was new and therefore, qo = 0. In the case of the stirred beaker experiments, the same batch was resampled each time I, and thus Equation (1) can be re-written as:
q i q i 1 = ( C i 1 C i ) · V i 1 m i 1
where the index i−1 indicates the parameter at the previous time and i at the current time, starting from i = 1. With the experiments of the adsorbent OF-U, Equation (2) is valid with a constant Vi−1/mi−1 ratio equal to the initial ratio. For OF-G, after the extraction of a volume vi, it can be assumed that mi−1 is the same as that of the initial value and that Vi is given by:
V i = V i 1 v i

2.5.1. Isotherm Studies

When the samples reached equilibrium, qe and Ce were obtained with Equation (1). The Freundlich (Equation (4)) and Langmuir (Equation (5)) isotherms were used to fit the experimental equilibrium data of the arsenic concentration [2,22,37].
q e = K F ·   C e 1 / n
q e = q m a x ·   b · C e 1 + b · C e
where KF (mg1 –1/n·(L)1/n/g) is the Freundlich adsorption capacity and 1/n is the adsorption intensity, which are constants that can be obtained by fitting log Ce vs. log qe. In the Langmuir isotherm, a fixed number of accessible sites on the adsorbent surface is assumed and is related to qmax, the maximum adsorption capacity (mg/g). The Langmuir model also assumes a reversible adsorption–desorption process with an equilibrium constant given by b, the binding constant (L/mg). The Langmuir model was fitted using the linearization of Equation (5), which is given by Equation (6) [2].
C e q e = 1 q m a x · b + C e q m a x
As the slope of the linearization of Equation (6) is the inverse of qmax, the confidence intervals for the slopes were calculated using Windows Excel® software to determine whether the qmax values were the same for the three adsorbents [28]. For the linearized models, the 95% confidence interval (CI) for a regression parameter p, CIp, is given by Equation (7).
C I p = p ± t ( 0.025 ,   n 2 ) · s e
where t(0.025, n−2) is the two-tailed Student t value for a significance level of α = 0.05 and n−2 degrees of freedom (n is the number of fitting points) and se is the standard error for p. The extremes of this interval are the lower and the upper confidence levels (LCL and UCL, respectively). This CI calculation was applied in this paper to other parameters (e.g. recovery in BLM matrix or removal ratios), but using t ( 0.025 ,   n 1 ) .
The removal of arsenic ηe (mass %) in the equilibrium can be given by Equation (8)
η e = 100 · ( C o C e ) C o
where the tern Ce can be expressed from the experimental concentrations giving ηexp or from the theoretical (fitted) concentrations combining Equations (1) and (5), giving ηfit. The ratio of these two removal parameters, applied to samples with different matrices, could be a good index to assess whether there are interferences that affect the arsenic removal. Combining Equation (8) and mass balance (1), the removal ratio (RR) can be obtained.
R = η e , e x p η e , f i t = ( C o C e ,   e x p ) ( C o C e ,   f i t ) = q e , e x p q e , f i t

2.5.2. Kinetic Studies

The following pseudo first- (Equation (10)) and pseudo second-order (Equation (11)) models [2,38] were fitted in stirred beaker experiments to identify the kinetic orders:
q q o = ( q e q o ) · ( 1 exp ( k 1 · t ) )
q q o =   k 2 · ( q e q o ) 2 · t 1 + k 2 · ( q e q o ) · t
where k1 is the first-order kinetic constant (h−1) and k2 is the second-order kinetic constant (g/mg·h). The terms qo and qe are defined in Equations (1), (4), and (5).
Equations (10) and (11) can be linearized to give the respective Equations (12) and (13) [2].
L n   ( q e q ) = L n   ( q e q o ) k 1 · t
t q q o = 1 k 2 · ( q e q o ) 2 + t ( q e q o )
Regression using the linear forms may be inappropriate to obtain an accurate value of k2 in Equation (13) because of the intercept error, as noted by [28,39] for the case of phosphate. As an alternative, nonlinear models using Equation (11) can be applied [40].
The methodology used here for nonlinear regression for pseudo second-order models involved the direct fitting of n experimental data pairs (texp, qexp) to Equation (11) by using the values of qe and k2, which minimize the sum of squared errors, SSerr.
S S e r r = i = 1 n [ q e x p q f i t ] 2
To apply nonlinear regression, the Solver function in Microsoft Excel™ software with the GRG nonlinear solving method was used to minimize the SSerr as the objective function.

3. Results and Discussion

3.1. Characterization of Sorbents

The SEM microphotographs of the OF-G, OF-M, and OF-U solids are shown in Figure S3 and the characterization properties (size, BET and z-potential) are shown in Table S3, both in Section S3 in the Supplementary Materials.
Figure S3a shows a close view of the OF-G sample (parent adsorbent) with different high surface structures (flake crystals, micropores) that seem to be the main components responsible for the high BET specific surface. The macro grain size of the OF-G sample was in the mm range, but the internal structure provided a high specific surface. Figure S3b for the OF-M adsorbent showed a sub-micron size with the surface destroyed by milling. The internal BET area was reduced to half and size was small and uniform. The OF-U sample in Figure S3c shows micro-sized grains with some heterogeneous surfaces. The internal surface was retained but the size was smaller than that of OF-G. A small amount of the surface was lost compared to that of OF-G.
Table S3 shows that the z-potential of the three suspensions of solids was similar at equilibrium pH, with low negative values (slight positive-charged surface). These z-potential values indicated the low stability of the suspension under these operating conditions. This was corroborated by visual qualitative sedimentation tests with the OF-G and OF-U samples. The samples of 1 g OF-U/100 mL DI water showed easy separation after 20 min and transparent dissolution at 70 min. The measured equilibrium pH of the solids in the z-potential tests ranged from 8.6 to 9.4. These values were similar to those of pHPZC, which corroborated the slight positive-charged surface measured by the z-potential. These values were already previously observed for GFH [41].

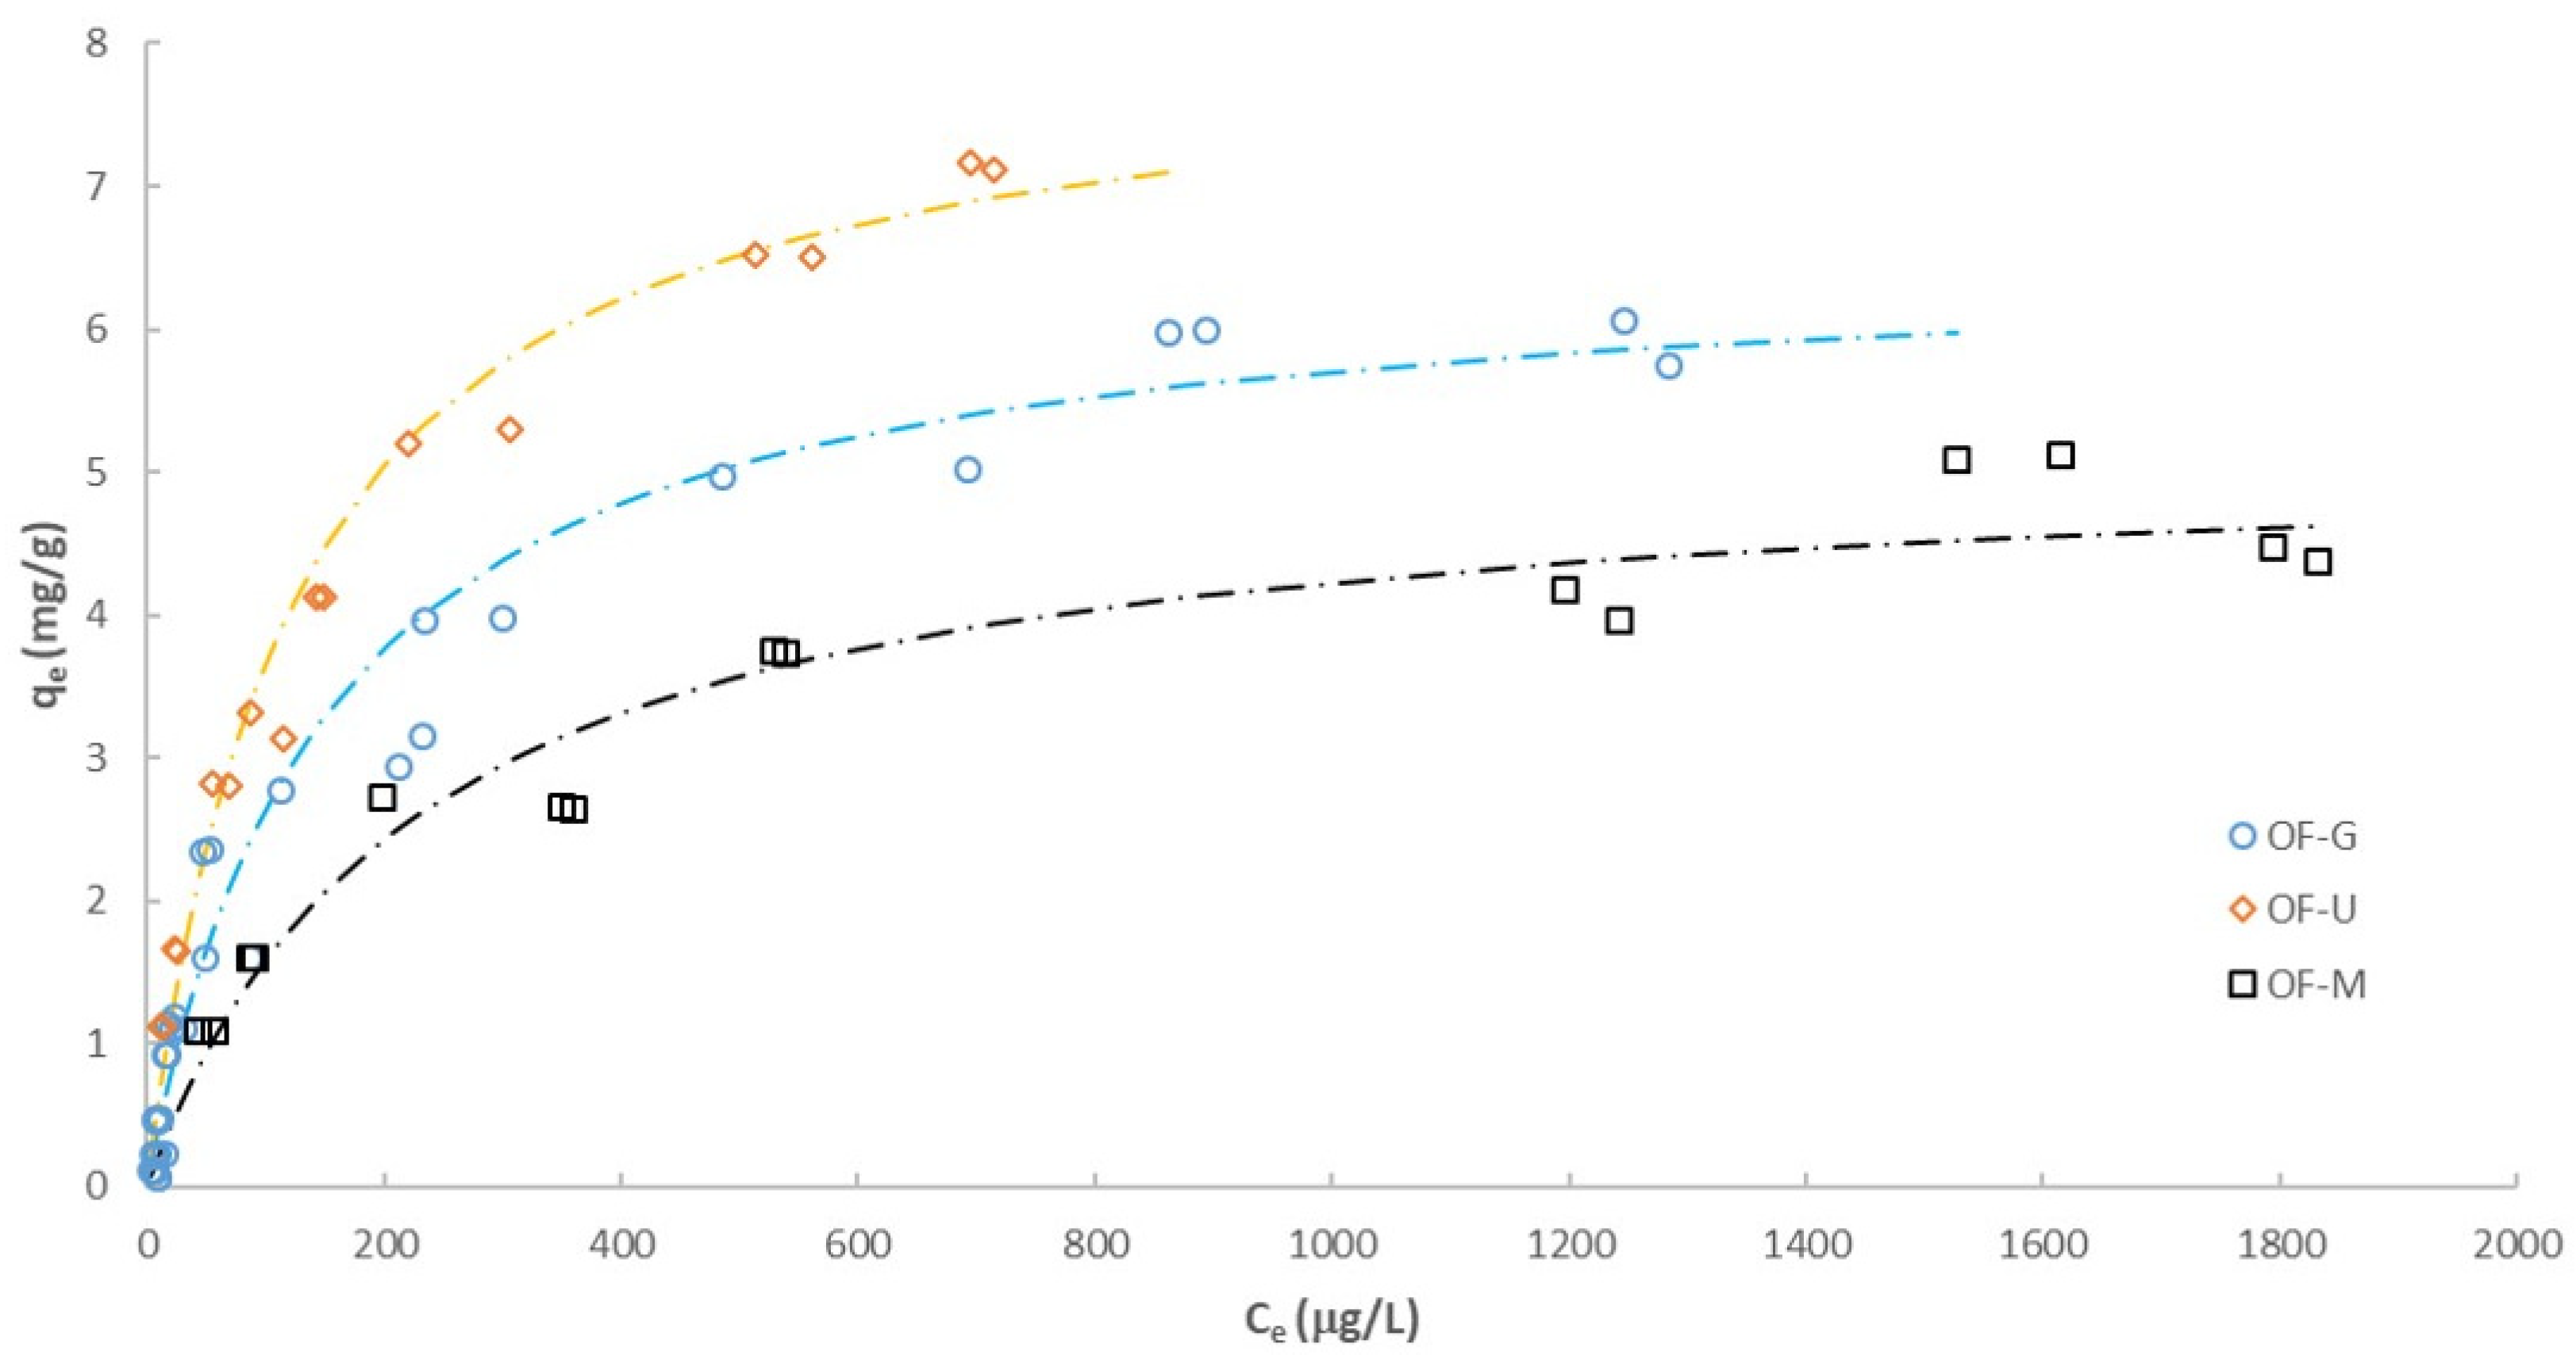
3.2. Adsorption Isotherms for the Three Adsorbents

Figure 1 shows the experimental equilibrium points of the isotherms for the synthetic samples in the DI water. Table 1 shows the fitting parameters for the Freundlich and Langmuir models applied to the experimental points.
Table 1 indicates the good to reasonable fit for the two models, but a better correlation was obtained with the Langmuir model and so was chosen to fit the curves in Figure 1.
The isotherm of the OF-G sample showed a better adsorption capacity than the results obtained in other studies using synthetic GFH [37], but was inferior to other GFH [17,22,23]. To statistically determine whether qmax (the asymptote of Langmuir model) was the same, the slope of linear fit (i.e. 1/qmax) was compared by calculating the confidence interval (CI) for the three adsorbents. The results showed that the CIs did not overlap, and thus qmax followed the order OF-U > OF-G > OF-M (Table S4 in the Supplementary Materials). The binding constant, b, showed the same trend as qmax. As b is indicative of the adsorption/desorption ratio, this means that in the OF-U adsorbent, there was an increase in the occupied sites vs. the OF-G and OF-M adsorbents, thus becoming a stronger adsorbent. If we compare the initial slope of the adsorption (qmax·b), the OF-M value was 50% of the OF-G value and the OF-U value was 150% greater than the OF-G value. This indicates the adsorption improvement of OF-U at low concentrations.
These results show that there was a loss of capacity of milled solid (OF-M) when compared to the parent material (OF-G). This could be explained by the significant loss of BET internal surface (micropore surface) [28]. For OF-U, there was an improvement in the qmax, which was consistent with previous studies on As(V) sorption [22,23,37]. Usman et al. [22] and Banerjee et al. [23] showed, respectively, an improvement of 3.2- and 4-fold on q equilibrated with 10 µg/L of As(V) when the micro-sized fraction was compared to the parent GFH. Pham et al. [37] showed an improvement of more than 11-fold in qmax when GFH was ground to 0.7–1 mm particle sizes. These results may be due to the release of the internal specific area of OF-G that was not available during the time frame of the equilibrium experiment. This suggests that the equilibrium time needed for OF-G could be longer than that needed for the reduced materials, as discussed by Usman et al. [22]. Despite the improvement, the qmax values of the micro-sized OF-U were still low compared to the iron-based nanoparticle adsorbents [10,14].
To determine whether the removal of arsenic was linked to adsorption rather than other mechanisms (e.g. precipitation in the solution), triplicate samples of 4 mg/L of the As(V) standard were prepared in three different matrices: 50% of the background leaching matrix (BLM) obtained from OF-G and 50% of DI water; 50% of the background leaching matrix (BLM) obtained from OF-U and 50% of DI water; and 100% DI water. These solutions were stirred for 120 h following the previously described procedure and the percentage of the concentration of As(V) in each BLM matrix referring to the concentration of As(V) in DI water was statistically analyzed using ICs. The IC of the % was 100.75 ± 1.96 for the OF-G BLM and 100.41 ± 0.98 for the OF-U BLM. These results showed that arsenic removal was not influenced by the matrix composition of the experiments and neglected important removal mechanisms as precipitation in the dissolution (e.g. potential formation of scorodite or other precipitates).

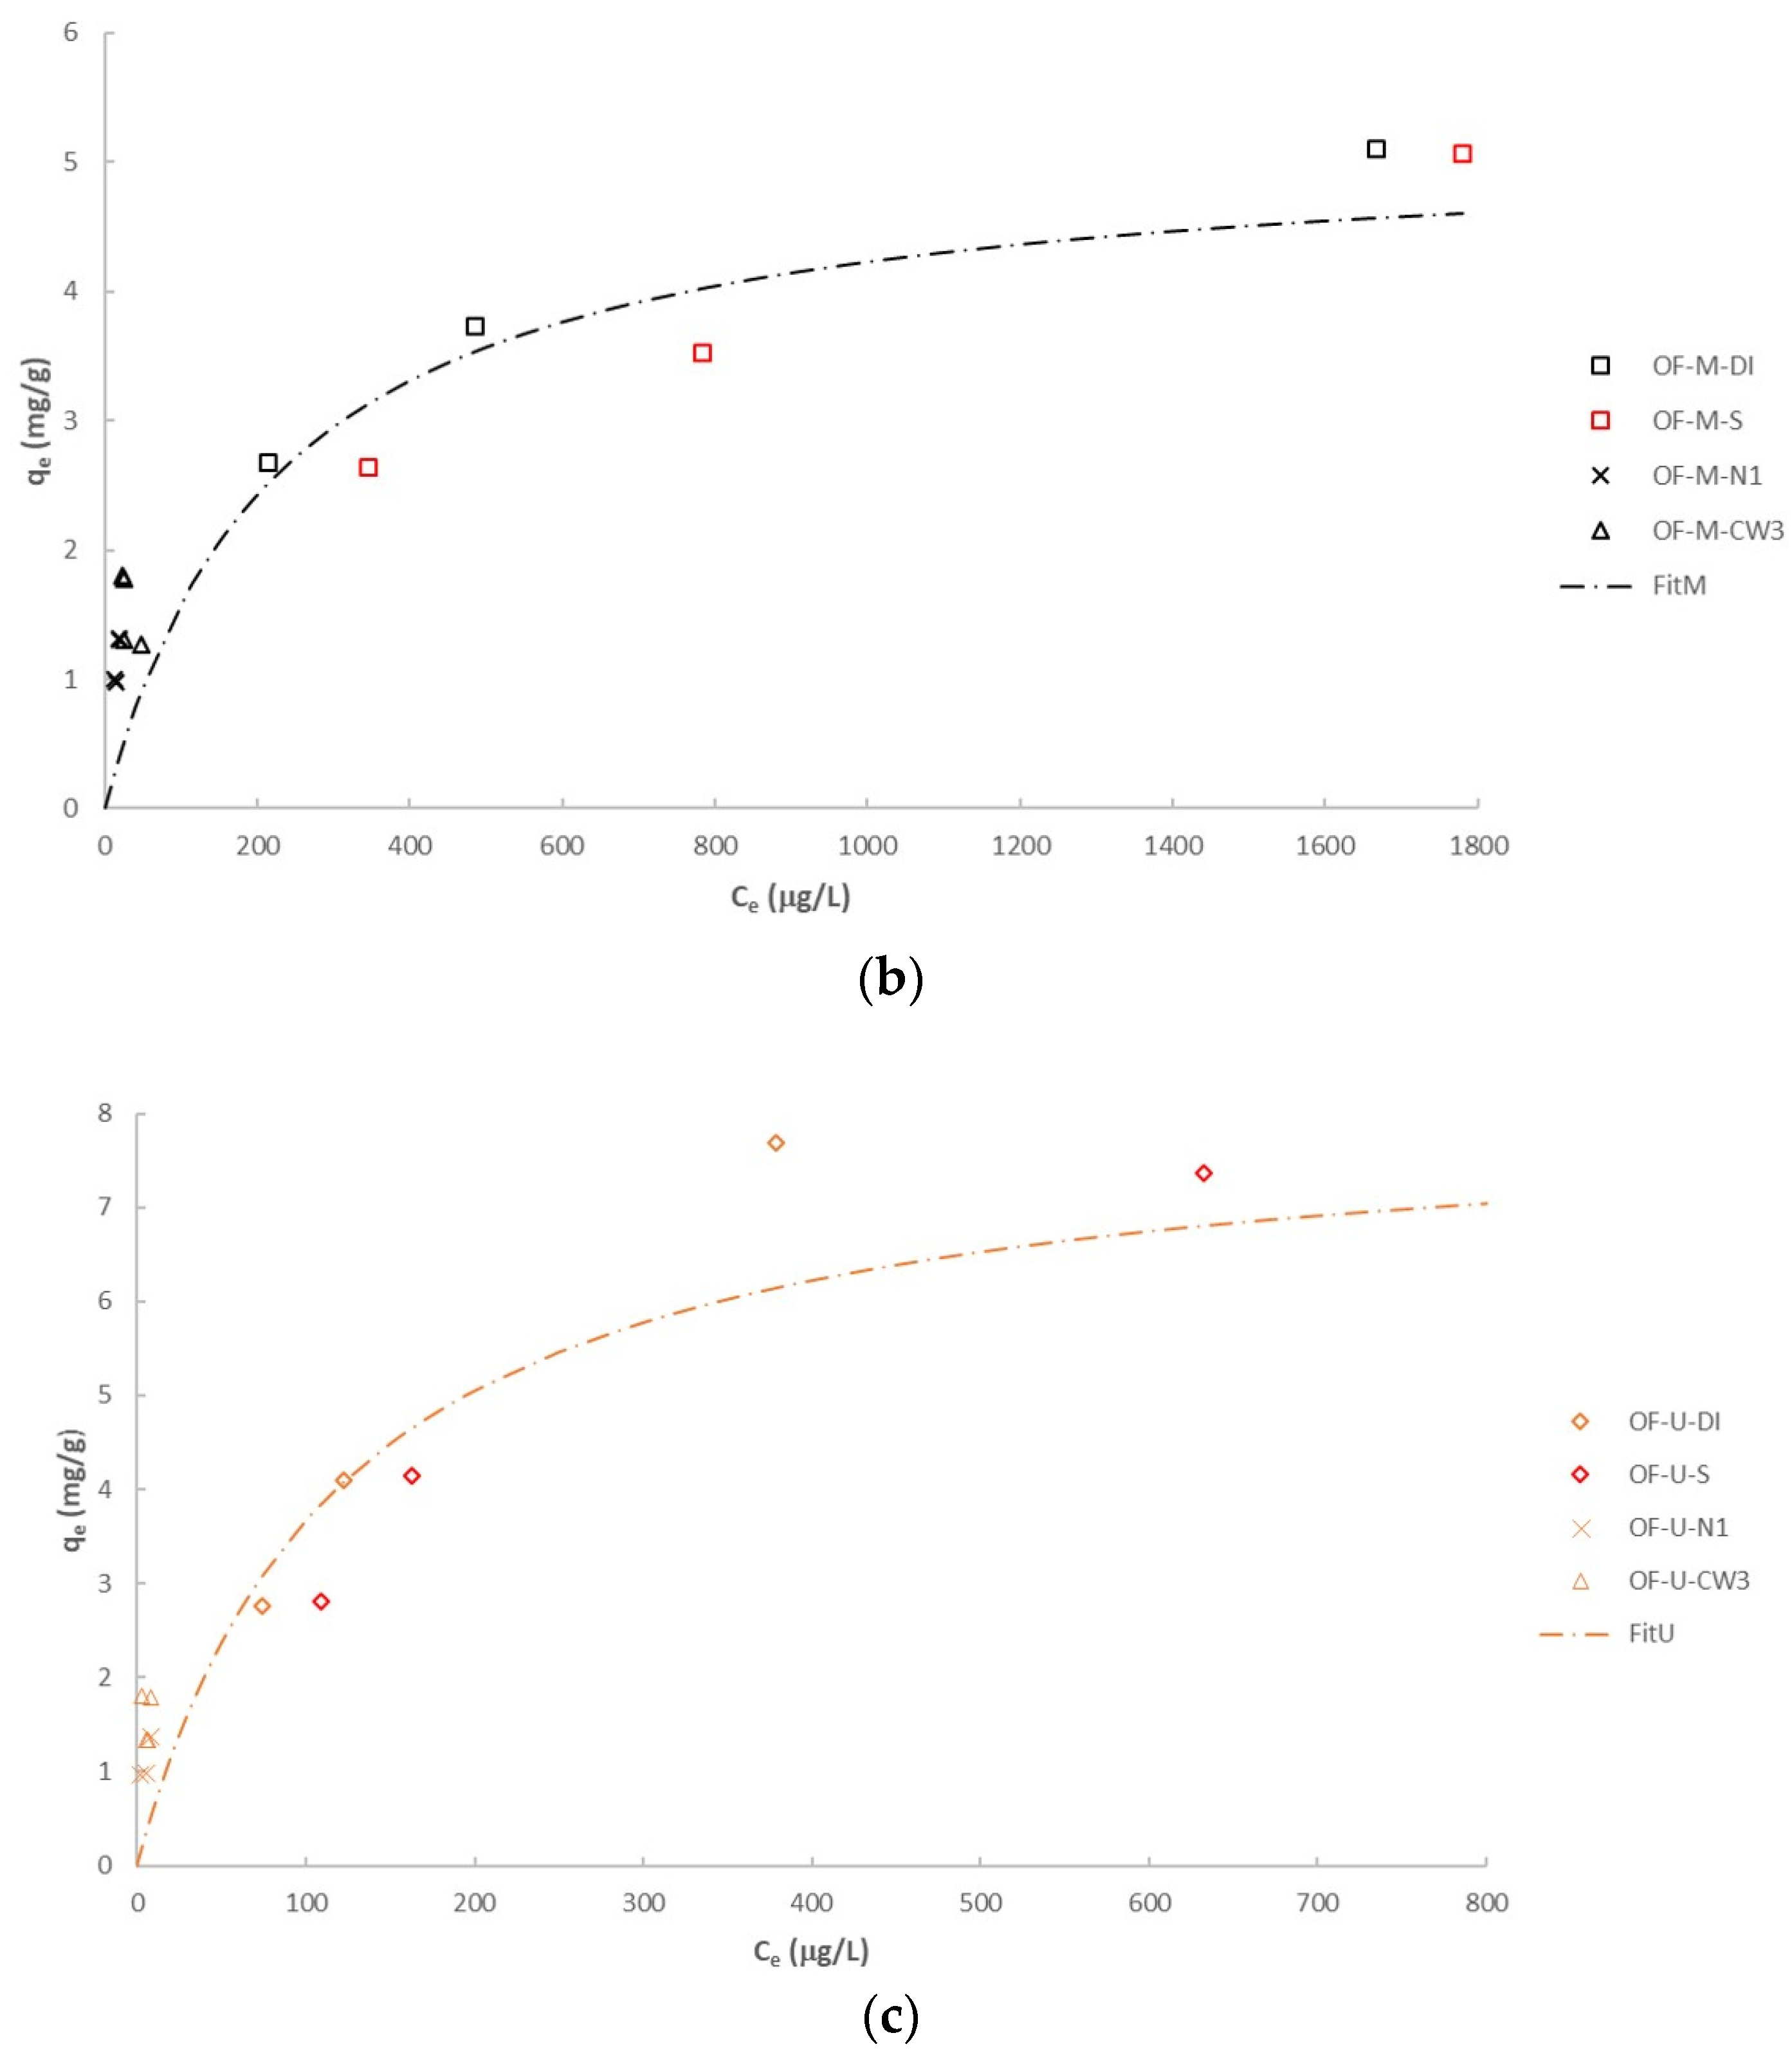
3.3. Adsorption Isotherm for Synthetic Samples and Groundwater Samples

Additional equilibrium experiments with the synthetic samples (DI water matrix and DI water+ 500 mg/L sulfate matrix) as well as with the groundwater samples (N1 and CW3) were performed to test for potential interferences.
Figure 2a–c show the plots for the equilibrium experiments of the two kinds of samples: the synthetic (DI water (DI) and DI water + 500 mg/L sulfate matrix (S)) and the groundwater samples (N1 and CW3) for the three adsorbents. These samples were compared with the respective curves of the model presented in Figure 1.
These figures show the positive and negative deviations from the isotherm that appeared, similar to Figure 1 (synthetic samples with DI water). Each point was the result of the experiments with different adsorption masses and different initial concentrations that give a theoretical equilibrium. The details of the range of experimental removal of arsenic ηe (mass %) for each matrix are shown in Table 2.
Results of the removal of the synthetic samples (DI and S) showed the same trend observed in the equilibrium experiments ηe, exp OF-U > ηe, exp OF-G > ηe, exp OF-M. The differences in the removal for an adsorbent with different matrices were attributed to the initial concentration of arsenic and the mass of the adsorbent used.
To assess the role of interferences, the CI of the average parameter RR (Equation (9)) was calculated for the synthetic and groundwater samples. Theoretical removal from the isotherm and mass balance was obtained. A lack of interference should show a CI of RR that includes 1 and, if important interferences are present, the CI of RR should be below 1. Table 3 summarizes the study results for the three adsorbents. The data showed that the removal of arsenic in the equilibrium was independent of the matrices and was close to the theoretical value obtained for each isotherm. The neutral effect of sulfate as an interferent in arsenic adsorption has been previously reported [20].

3.4. Adsorption Mechanism

In the case of the adsorbents, it has been mentioned that its surface in equilibrium conditions is weakly positively charged because the equilibrium pH is close to pHPZC for OF-G and the zeta potential of the three adsorbents is low (Table S3 in the Supplementary Materials). Under these conditions, a neutral surface could be assumed. From the theoretical speciation study, the HAsO42− species was seen to be predominant in all of the equilibrium samples. Several authors have studied the interaction between ferric hydroxide and As(V). Drever [42] presents the mechanistic models for the adsorption of inorganic species onto metal hydr(oxide) as a surface complexation model. Guan et al. [41] used Fourier transform infrared spectroscopy (FTIR), and extended X-ray absorption fine structure (EXAFS) methods with high loads of As(V) adsorbed onto the GFH at different pH and found the formation of bidentate binuclear complexes at the surface at a pH over 6. Pham et al. [37] also studied As(V) adsorbed onto GFH using FTIR and confirmed the change in surface speciation with pH used in the surface complexation models.
From these references, it can be assumed that the complexation of HAsO42- species with two hydroxyl groups from the surface Fe–OH to form (Fe–)2HAsO4 and 2OH-. The arsenic complex formed is an inner-sphere complex with the arsenic atom in the central part, two oxygens linked to the two surface irons, and the rest of the oxygen and hydrogen atoms in the outer part [2,10,14,37].

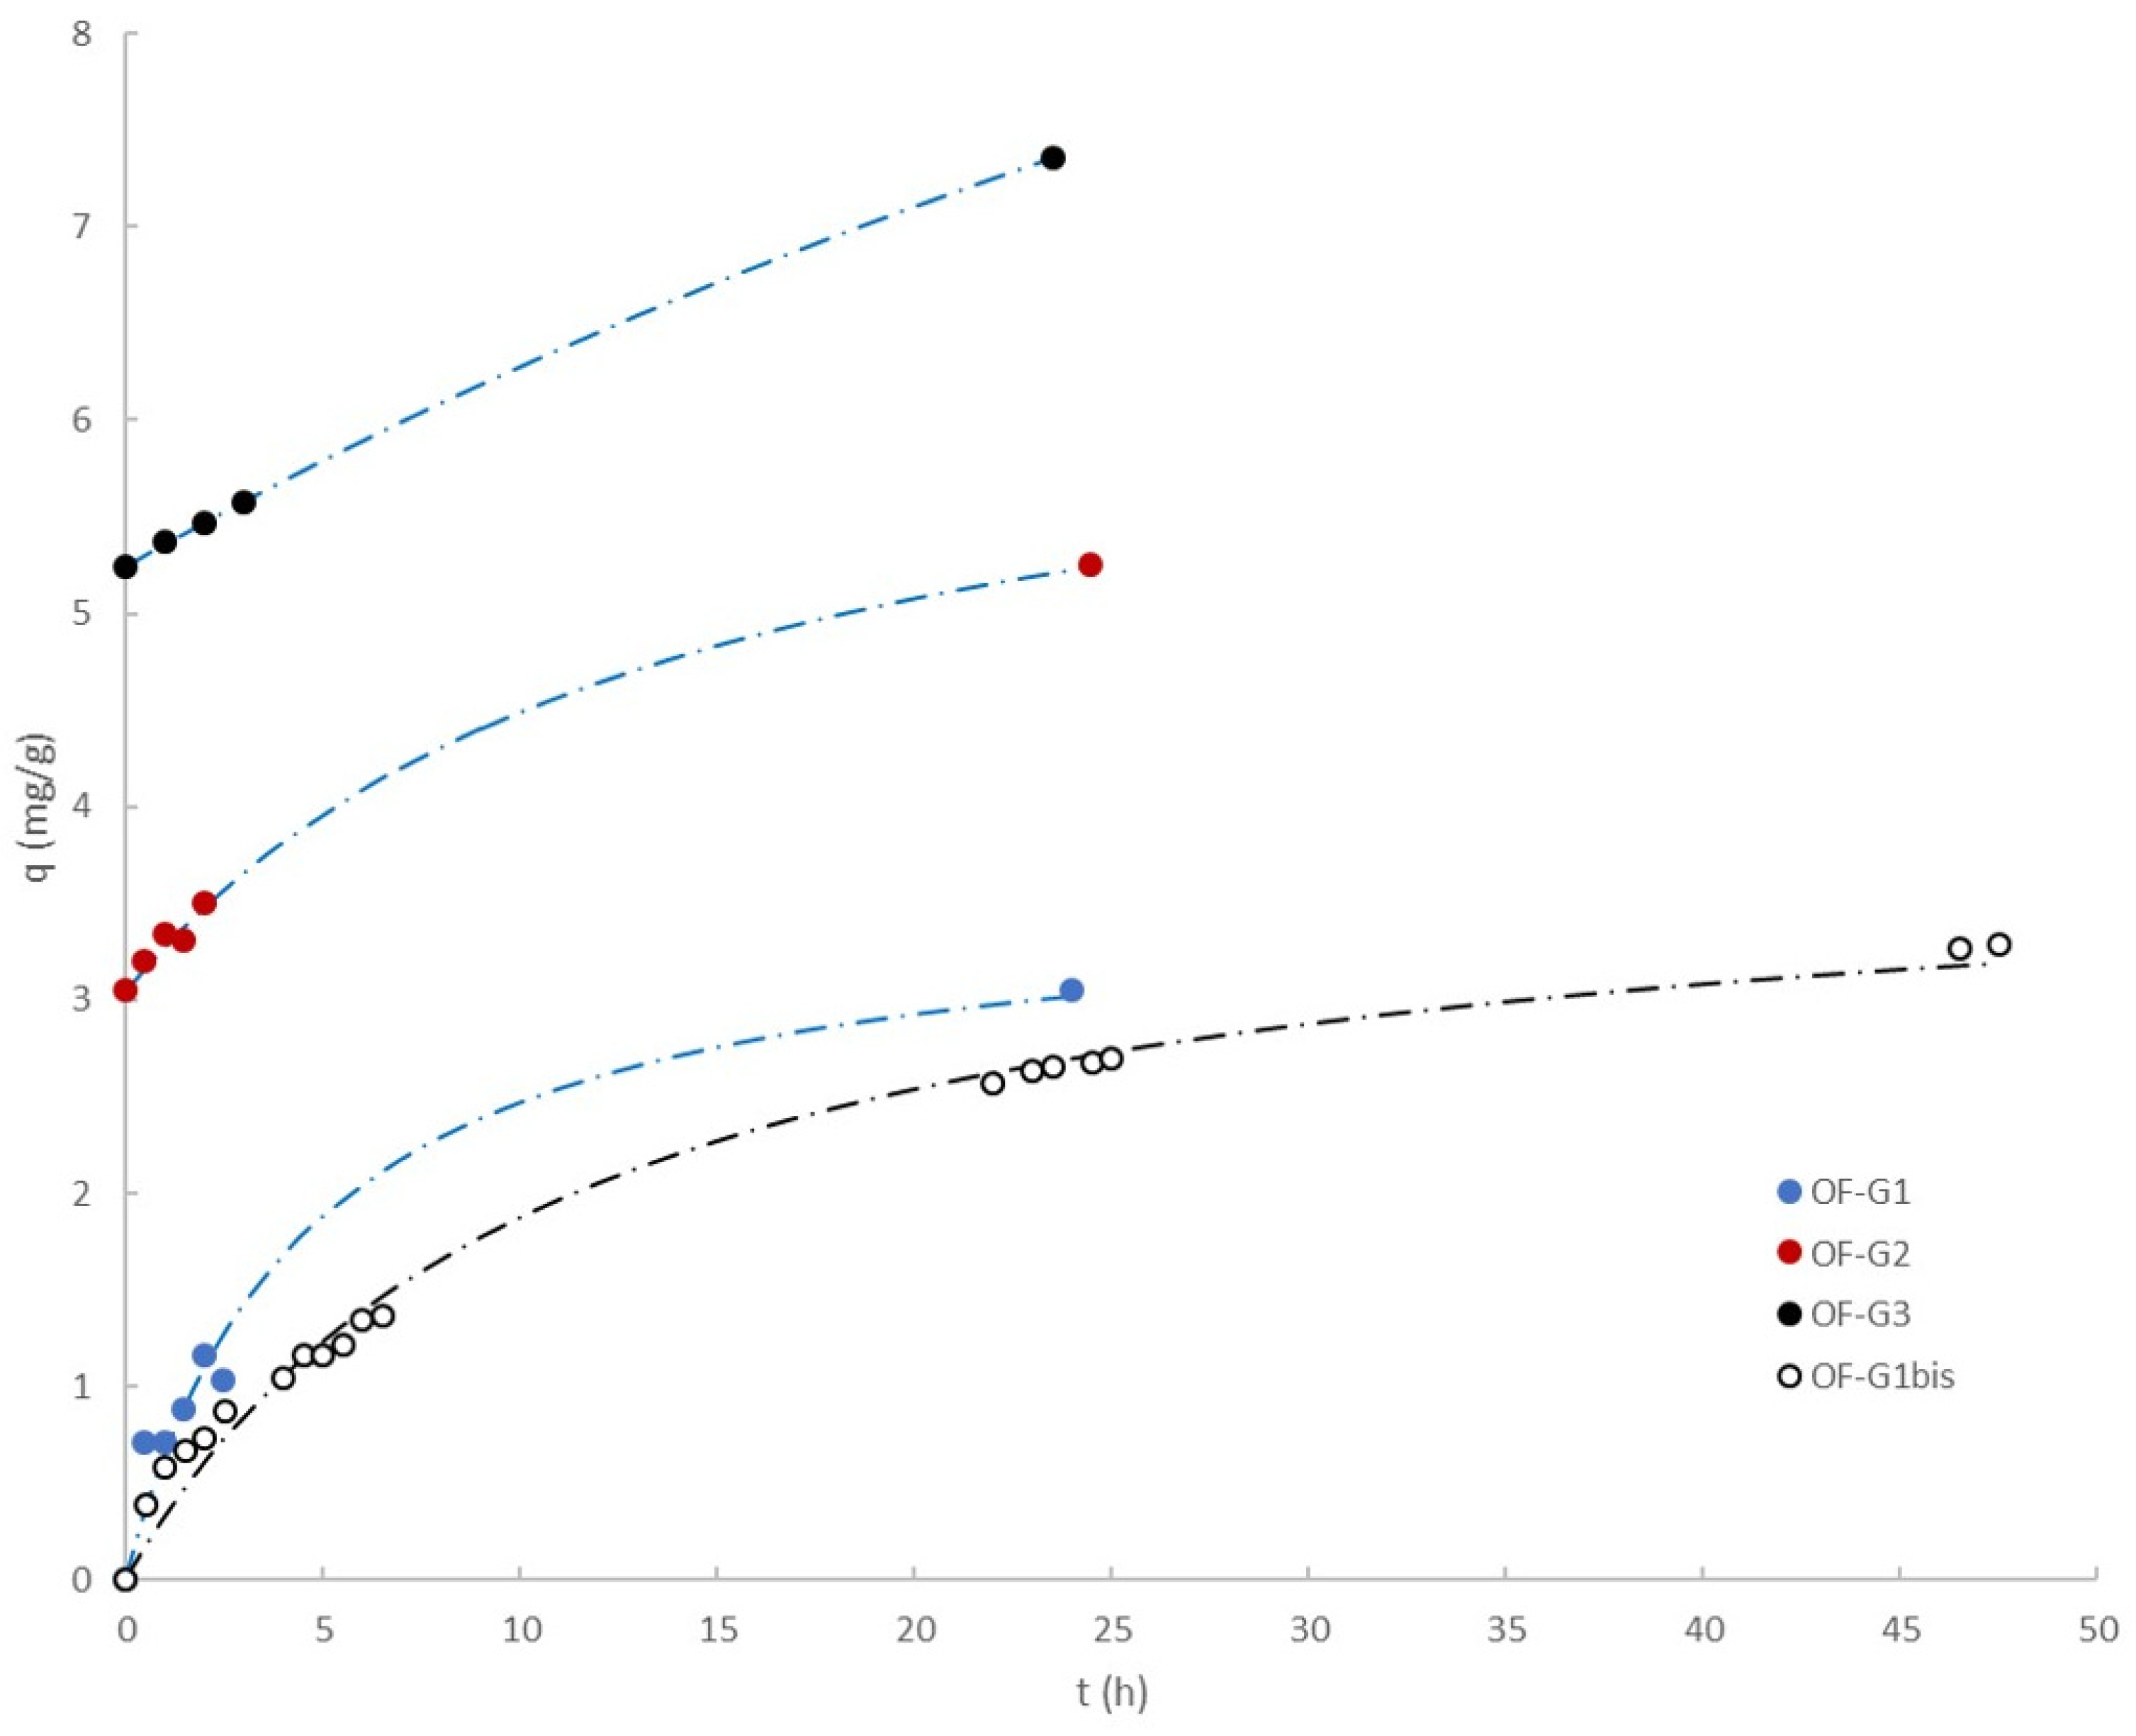
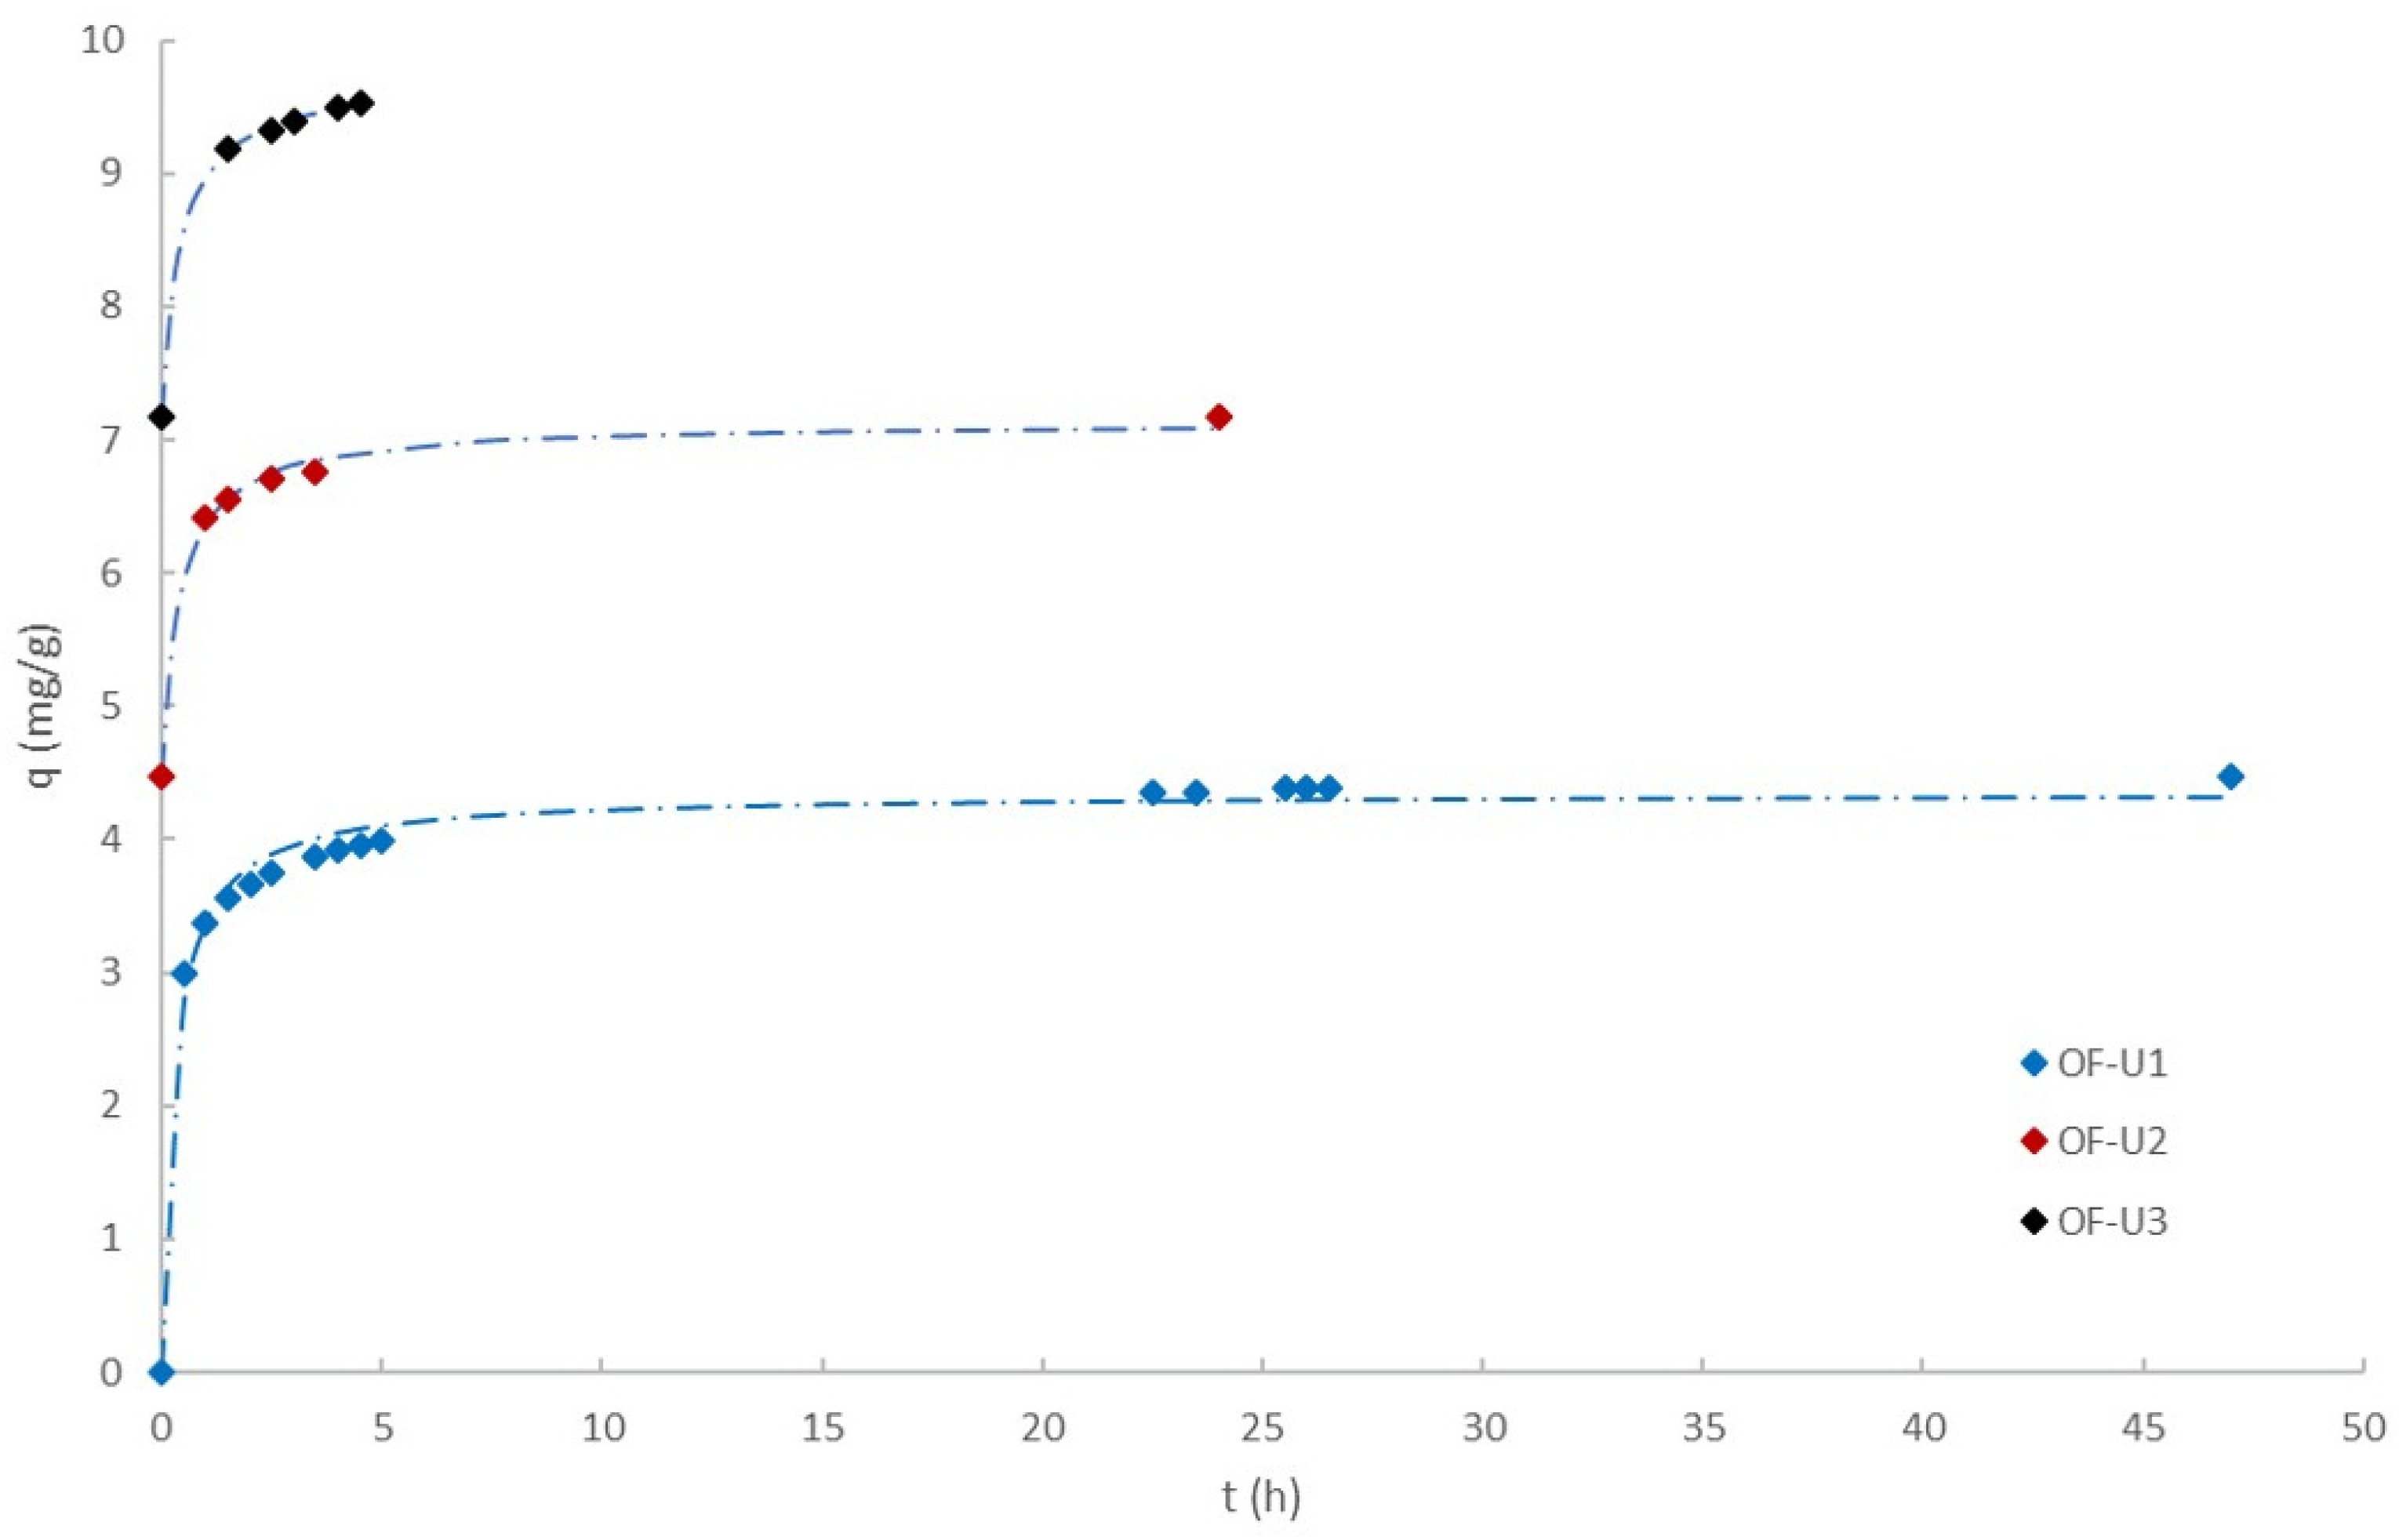
3.5. Adsorption Kinetics for the OF-G and OF-U Adsorbents

After the described tests, the OF-M was discarded and kinetic experiments using higher volumes of synthetic samples in DI water with OF-G and OF-U were performed. The behavior of these two adsorbents was different under stirring conditions, as seen in Figure 3.
The OF-G solid (granular) remained in the bottom-middle portion of the beaker (Figure 3a), while that of OF-U (sonicated) formed a homogeneous suspension (Figure 3b). Due to this distribution, it was possible to sample a solution separated from the solid in OF-G, and a mixture of the solution and solid (suspension) in OF-U. This means that the ratio increasing the solid/dissolution in the OF-G experiments was considered and was assumed to be constant in the OF-U experiments. Equations (3) and (4) were used for the calculation of q as a function of the stirring time.
Figure 4 shows the experimental results from the kinetics performed with the OF-G adsorbent (first and second series) and Table S5 (Supplementary Materials). The fitting parameters for the pseudo first- and pseudo second-order models were applied to the experimental points in Figure 4.
In the first series, the experiments for OF-G1, OF-G2, and OF-G3 were run consecutively after spiking the dissolution with As(V). The first experiment (OF-G1) started with a new adsorbent (qo = 0) and in each consecutive experiment, the adsorbent had a qo value that corresponded to the final conditions from the previous experiment. Due to the arsenic spiking, the qe values also increased (see values obtained from the Langmuir equilibrium in Table S5), but were limited by the qmax. As a consequence, qe-qo and the rates decreased when the experiments of these series advanced. The second series (OF-G1bis) was run using the same conditions as OF-G1, but with a double mass of the adsorbent. In both cases, qe from the Langmuir isotherm were similar (see Table S5). All of the curves showed that after 24 h, the experiments had not reached equilibrium.
The fitting of the pseudo first-order kinetics using linearization needs an iteration to obtain the qe value because qe is used for the fitting and is obtained at the same time from the regression parameters (see Equation (12)). For all of the OF-G experiments, except for OF-G1, it was possible to fit this model (see Table S5). The datasets that did not have a satisfactory fit were those in which the difference between the qe value used in the fitting and the regression values exceeded 0.5 mg/g. In the case of OF-G3, the fitted value of qe (and the last experimental value of q in Figure 4) exceeded the qmax obtained in equilibrium in the tubes and k1 was very different from that of OF-G2 and OF-G1bis.
The fitting of the pseudo second-order kinetics was performed using linearization and nonlinear methods. In both cases, the fitting parameters (qe and k2) were similar. The R2 values for the linearized pseudo first- and pseudo second-order models were similar, but the nonlinear pseudo second-order model parameters were chosen to compare with the OF-U experiments. After the OF-G1bis experiment concluded (48 h of contact time), sonication of the reactor was performed to check the effect on the kinetics after 24 additional hours, but no noticeable effect was observed (only a slight increase of 0.2 mg/g after 24 h)
Figure 5 shows the kinetics with the OF-U adsorbents and Table S6 (Supplementary Materials) describes the analysis of the fitting parameter values. An important difference between Figure 4 and Figure 5 is that equilibrium was reached in a few hours and the rates were higher.
For these experiments, it was not possible to fit the pseudo first-order models, but the pseudo second-order linear and nonlinear models fitted well and produced similar qe values. The fitted qe values were similar to the qe values obtained in the Langmuir fitting, with the exception of the qe value for OF-U3. This was even higher than the qmax obtained in the Langmuir isotherm, and was similar to what happened for OF-G3. These high q values were obtained after 72 h or 96 h of contact time and could be related to an increase in the qmax for the difference in the stirring conditions or to an accumulative error linked to the calculation of qo.
The nonlinear pseudo second-order was better than the linear pseudo second-order to define the fitting of the experiments in the first hours of the kinetics (fitting of k2 values), similar to the observations made in previous studies [28]. Unlike the OF-G experiments, the values of k2 in the OF-U experiments were in a narrow interval (0.793 to 0.931 g/mg·h), showing that the k2 was similar and independent of the initial charge of the adsorbent.
Experiments OF-G1bis and OF-U1 were performed under the same conditions, except for the adsorbent type, and could be compared together with experiment OF-G1, similar to OF-G1bis (see Table 4).
The results from the OF-U1 sample allowed us to see an increase of 23% for qmax and an increase of 34-fold for the kinetic constant (k2) vs. OF-G1bis. The increase in the k2 for the adsorption of phosphate when comparing the same solids of OF-U and OF-G was 5.6-fold in a previous study [28] without differences in qmax.
The kinetics of As(V) adsorption in the stirred batch reactors (150 rpm) with GFH and other adsorbents such as tetravalent manganese feroxyhyte (TMF) with two micro-sized adsorbents (1–250 and 1–63 µm) was studied previously [17] and showed similar differences for the TMF kinetics as observed in the present work. The same pattern in the adsorption of As(V) was also observed using differential column batch reactor (DCBR) experiments with GFH (2–0.6 mm) and micro-sized (110–150 µm) adsorbents [19]. The DCBR are equivalent to the stirred batch reactors when the flow is high, providing an equivalent evolution of As(V) with time, as demonstrated in the present work. By developing the proper modeling, these two studies [17,19] allowed us to conclude that intraparticle diffusion decreased when the size of the adsorbent was reduced. This important increment of k2 can be explained because in stirring systems with a reduced particle size, the intraparticle diffusion effect, which is important inside the GFH, was reduced and this increased the overall kinetics.

4. Conclusions

In this study, three different solids (GFH and two micro-sized materials obtained from the GFH) were evaluated as feasible adsorbents of arsenic in groundwater. The key findings were:
  • Equilibrium studies showed that milling GFH (OF-M samples) decreased the maximum adsorption capacity and this may have resulted from the loss of the specific surface area. The results also indicated that micro-sized GFH obtained from ultrasonication (OF-U) had a 23% increase in the maximum adsorption capacity and a 23% increase in binding constant compared to the GFH. This was possibly linked to the release of an accessible internal area from GFH. The three adsorbents fitted well to the Langmuir isotherm models.
  • The equilibrium adsorption results and the elimination of arsenic were not influenced by an excess of sulfate (500 mg/L) or representative matrices present in groundwater from a brownfield site. These data showed that competitive interferences in the equilibrium were not important for the three studied adsorbents.
  • The kinetics of arsenic adsorption with GFH was improved when the adsorbent was ultrasonicated to micro-size levels. The nonlinear pseudo second-order was satisfactorily fitted to the results of the multi-spiking experiments. A large increase of 34-fold for arsenic adsorption (k2 ) was obtained after reducing the size of GFH using ultra-sonication. This behavior was attributed to the reduction in intraparticle diffusion in the micro-sized vs. granulated adsorbents.
The next steps of the research will consist of the further optimization of kinetics using higher-speed stirrers with the OF-U adsorbent with the final objective to combine tailored adsorption with membranes in a hybrid method to develop point-of-use strategies.

Supplementary Materials

The following supporting information can be downloaded at: https://0-www-mdpi-com.brum.beds.ac.uk/article/10.3390/pr10051029/s1, Figure S1: Simplified plot of the groundwater samples around the N1 and CW3 wells; Table S1: Preliminary information on the contaminated groundwater samples from the Nitrastur site; Table S2: pH, redox conditions, and ionic strength of the studied samples; Figure S2: Theoretical speciation of the studied samples; Figure S3: SEM microphotographs (a) OF-G (initial GFH), (b) OF-M (milled), and (c) OF-U (ultra-sonicated); Table S3: Size, BET area, and zeta potential at equilibrium pH; Table S4: 95% confidence interval (CI) for the qmax fitting parameters; Table S5: Fitting parameters for the pseudo first- and pseudo second-order adsorption kinetics models for the OF-G adsorbent; Table S6: Fitting parameters for the pseudo first- and pseudo second-order adsorption kinetics models for the OF-U sorbent.

Author Contributions

Conceptualization, V.M. and I.J.; Methodology, V.M., L.F.-R. and J.A.B.; Investigation, L.F.-R., A.G., B.D. and D.R.; Resources, V.M. and I.J.; Writing—original draft preparation, V.M.; Writing—review and editing, I.J. All authors have read and agreed to the published version of the manuscript.

Funding

This research was funded by the Spanish Ministry of Science, Innovation, and Universities and Agencia Estatal de Investigación/European Regional Development Plan. (Grant CGL2017-87216-C4-3-R). Researchers from Eurecat were financially supported by a Torres Quevedo grant (PTQ-2019-010503) for L.F.R. and by the Catalan Government through the funding grant ACCIÓ-Eurecat (Project PRIV2019-20-MICONANO) to D.R and I.J.

Data Availability Statement

The data presented in this study are available on request from the corresponding author.

Acknowledgments

The authors thank Nerea Otaegi and Ekain Cagigal from Tecnalia Research and Innovation for the supply of groundwater samples from the Nitrastur site as well as Diego Baragaño and Beatriz González from Oviedo University for the background information of the Nitrastur site. The authors thank HeGo Biotec GmbH for supplying the Ferrosorp GW® samples.

Conflicts of Interest

The authors declare no conflict of interest. The funders had no role in the design of the study; in the collection, analyses, or interpretation of data; in the writing of the manuscript, or in the decision to publish the results.

References

  1. Shakoor, M.B.; Nawaz, R.; Hussain, F.; Raza, M.; Ali, S.; Rizwan, M.; Oh, S.E.; Ahmad, S. Human health implications, risk assessment and remediation of As-contaminated water: A critical review. Sci. Total Environ. 2017, 601–602, 756–769. [Google Scholar] [CrossRef] [PubMed]
  2. Sarkar, A.; Paul, B. The global menace of arsenic and its conventional remediation—A critical review. Chemosphere 2016, 158, 37–49. [Google Scholar] [CrossRef] [PubMed]
  3. Singh, R.; Singh, S.; Parihar, P.; Singh, V.P.; Prasad, S.M. Arsenic contamination, consequences and remediation techniques: A review. Ecotoxicol. Environ. Saf. 2015, 112, 247–270. [Google Scholar] [CrossRef] [PubMed]
  4. Shankar, S.; Shanker, U.; Shikha. Arsenic contamination of groundwater: A review of sources, prevalence, health risks, and strategies for mitigation. Sci. World J. 2014, 2014, 1–18. [Google Scholar] [CrossRef] [PubMed]
  5. Li, S.; Wang, W.; Liu, Y.; Zhang, W. xian Zero-valent iron nanoparticles (nZVI) for the treatment of smelting wastewater: A pilot-scale demonstration. Chem. Eng. J. 2014, 254, 115–123. [Google Scholar] [CrossRef]
  6. Paikaray, S. Geochemistry of Acid Mine Drainage. Mine Water Environ. 2015, 34, 181–196. [Google Scholar] [CrossRef]
  7. Gallego, J.R.; Rodríguez-Valdés, E.; Esquinas, N.; Fernández-Braña, A.; Afif, E. Insights into a 20-ha multi-contaminated brownfield megasite: An environmental forensics approach. Sci. Total Environ. 2016, 563–564, 683–692. [Google Scholar] [CrossRef]
  8. Nicomel, N.R.; Leus, K.; Folens, K.; Van Der Voort, P.; Du Laing, G. Technologies for arsenic removal from water: Current status and future perspectives. Int. J. Environ. Res. Public Health 2015, 13, 62. [Google Scholar] [CrossRef]
  9. Mondal, P.; Bhowmick, S.; Chatterjee, D.; Figoli, A.; Van der Bruggen, B. Remediation of inorganic arsenic in groundwater for safe water supply: A critical assessment of technological solutions. Chemosphere 2013, 92, 157–170. [Google Scholar] [CrossRef]
  10. Maity, J.P.; Chen, C.Y.; Bhattacharya, P.; Sharma, R.K.; Ahmad, A.; Patnaik, S.; Bundschuh, J. Advanced application of nano-technological and biological processes as well as mitigation options for arsenic removal. J. Hazard. Mater. 2021, 405, 123885. [Google Scholar] [CrossRef]
  11. Mohammadian, S.; Krok, B.; Fritzsche, A.; Bianco, C.; Tosco, T.; Cagigal, E.; Mata, B.; Gonzalez, V.; Diez-Ortiz, M.; Ramos, V.; et al. Field-scale demonstration of in situ immobilization of heavy metals by injecting iron oxide nanoparticle adsorption barriers in groundwater. J. Contam. Hydrol. 2021, 237, 103741. [Google Scholar] [CrossRef] [PubMed]
  12. Castaño, A.; Prosenkov, A.; Baragaño, D.; Otaegui, N.; Sastre, H.; Rodríguez-Valdés, E.; Gallego, J.L.R.; Peláez, A.I. Effects of in situ Remediation With Nanoscale Zero Valence Iron on the Physicochemical Conditions and Bacterial Communities of Groundwater Contaminated With Arsenic. Front. Microbiol. 2021, 12, 643589. [Google Scholar] [CrossRef] [PubMed]
  13. Montalvo, D.; Vanderschueren, R.; Fritzsche, A.; Meckenstock, R.U.; Smolders, E. Efficient removal of arsenate from oxic contaminated water by colloidal humic acid-coated goethite: Batch and column experiments. J. Clean. Prod. 2018, 189, 510–518. [Google Scholar] [CrossRef]
  14. Siddiqui, S.I.; Naushad, M.; Chaudhry, S.A. Promising prospects of nanomaterials for arsenic water remediation: A comprehensive review. Process Saf. Environ. Prot. 2019, 126, 60–97. [Google Scholar] [CrossRef]
  15. Mohan, D.; Pittman, C.U. Arsenic removal from water/wastewater using adsorbents—A critical review. J. Hazard. Mater. 2007, 142, 1–53. [Google Scholar] [CrossRef]
  16. Akter, A.; Ali, M.H. Arsenic contamination in groundwater and its proposed remedial measures. Int. J. Environ. Sci. Technol. 2011, 8, 433–443. [Google Scholar] [CrossRef] [Green Version]
  17. Usman, M.; Zarebanadkouki, M.; Waseem, M.; Katsoyiannis, I.A.; Ernst, M. Mathematical modeling of arsenic (V) adsorption onto iron oxyhydroxides in an adsorption-submerged membrane hybrid system. J. Hazard. Mater. 2020, 400, 123221. [Google Scholar] [CrossRef]
  18. Sperlich, A.; Schimmelpfennig, S.; Baumgarten, B.; Genz, A.; Amy, G.; Worch, E.; Jekel, M. Predicting anion breakthrough in granular ferric hydroxide (GFH) adsorption filters. Water Res. 2008, 42, 2073–2082. [Google Scholar] [CrossRef]
  19. Badruzzaman, M.; Westerhoff, P.; Knappe, D.R.U. Intraparticle diffusion and adsorption of arsenate onto granular ferric hydroxide (GFH). Water Res. 2004, 38, 4002–4012. [Google Scholar] [CrossRef]
  20. Chiavola, A.; D’Amato, E.; Gavasci, R.; Sirini, P. Arsenic removal from groundwater by ion exchange and adsorption processes: Comparison of two different materials. Water Sci. Technol. Water Supply 2015, 15, 981–989. [Google Scholar] [CrossRef]
  21. Jageerani, S.; Balouch, A.; Addullah; Muhammad Mahar, A.; Ahmed Mustafai, F.; Rajar, K.; Tunio, A.; Sabir, S.; Samoon Muhammad, K. Arsenic Remediation by Synthetic and Natural Adsorbents. Pakistan J. Anal. Environ. Chem. 2017, 18, 18–36. [Google Scholar] [CrossRef]
  22. Usman, M.; Katsoyiannis, I.; Mitrakas, M.; Zouboulis, A.; Ernst, M. Performance evaluation of small sized powdered ferric hydroxide as arsenic adsorbent. Water 2018, 10, 957. [Google Scholar] [CrossRef] [Green Version]
  23. Banerjee, K.; Nour, S.; Selbie, M.; Prevost, M.; Blumenschein, C.D.; Chen, H.; Amy, G.L. Optimization of Process Parameters for Arsenic Treatment with Granular Ferric Hydroxide. In Proceedings of the AWWA Annual Conference, Anaheim, CA, USA, 15–19 June 2003. [Google Scholar]
  24. Usman, M.; Katsoyiannis, I.; Rodrigues, J.H.; Ernst, M. Arsenate removal from drinking water using by-products from conventional iron oxyhydroxides production as adsorbents coupled with submerged microfiltration unit. Environ. Sci. Pollut. Res. 2021, 28, 59063–59075. [Google Scholar] [CrossRef] [PubMed] [Green Version]
  25. Chiavola, A.; D’Amato, E.; Sirini, P.; Caretti, C.; Gori, R. Arsenic Removal from a Highly Contaminated Groundwater by a Combined Coagulation-Filtration-Adsorption Process. Water. Air. Soil Pollut. 2019, 230, 1–12. [Google Scholar] [CrossRef]
  26. Ribas, D.; Pešková, K.; Jubany, I.; Parma, P.; Černik, M.; Benito, J.A.; Martí, V. High reactive nano zero-valent iron produced via wet milling through abrasion by alumina. Chem. Eng. J. 2019, 366, 235–245. [Google Scholar] [CrossRef]
  27. Ribas, D.; Cernik, M.; Martí, V.; Benito, J.A. Improvements in nanoscale zero-valent iron production by milling through the addition of alumina. J. Nanopart. Res. 2016, 18, 1–11. [Google Scholar] [CrossRef] [Green Version]
  28. Martí, V.; Jubany, I.; Ribas, D.; Benito, J.A.; Ferrer, B. Improvement of Phosphate Adsorption Kinetics onto Ferric Hydroxide by Size Reduction. Water 2021, 13, 1558. [Google Scholar] [CrossRef]
  29. Kunaschk, M.; Schmalz, V.; Dietrich, N.; Dittmar, T.; Worch, E. Novel regeneration method for phosphate loaded granular ferric (hydr)oxide—A contribution to phosphorus recycling. Water Res. 2015, 71, 219–226. [Google Scholar] [CrossRef]
  30. Baragaño, D.; Boente, C.; Rodríguez-Valdés, E.; Fernández-Braña, A.; Jiménez, A.; Gallego, J.L.R.; González-Fernández, B. Arsenic release from pyrite ash waste over an active hydrogeological system and its effects on water quality. Environ. Sci. Pollut. Res. 2020, 27, 10672–10684. [Google Scholar] [CrossRef]
  31. Otaegui, N.; Cagigal, E. NanoRem pilot site—Nitrastur, Spain: Remediation of arsenic in groundwater using nanoscale zero-539 valent iron. NanoRem Bull. 2017, 12, 1–6. Available online: https://www.claire.co.uk/NanoRem (accessed on 17 April 2022).
  32. Mollenkopf, M.; Fritzsche, A.; Montalvo, D.; Diez-Ortiz, M.; González-Andrés, V.; Smolders, E.; Meckenstock, R.; Totsche, K.U. Exposure of humic acid-coated goethite colloids to groundwater does not affect their adsorption of metal(loid)s and their impact on Daphnid mobility. Sci. Total Environ. 2021, 797, 149153. [Google Scholar] [CrossRef] [PubMed]
  33. Díez, M.; Gonzalez, V.; Janer, J.; Cabellos, J. Report on Exposure Levels at Relevant Conditions. Reground H2020 EU Project, 544 Deliverable 4.2. v.1. 2017. Available online: https://www.fabiodisconzi.com/open-h2020/projects/196810/deliverables.html (accessed on 17 April 2022).
  34. Díez, M.; Gonzalez, V.; Janer, J.; Cabellos, J. Report on Risk Assessment under Accidental Conditions Reground H2020 EU Project, 547 Deliverable 4.4 v.2. 2018. Available online: https://www.fabiodisconzi.com/open-h2020/projects/196810/deliverables.html (accessed on 17 April 2022).
  35. Baragaño, D.; University of Oviedo, Oviedo, Spain. Personal communication, 2022.
  36. Puigdomènech, I.; Colàs, E.; Grivé, M.; Campos, I.; García, D. A tool to draw chemical equilibrium diagrams using SIT: Applications to geochemical systems and radionuclide solubility. MRS Online Proc. Libr. 2014, 1665, 111–116. [Google Scholar] [CrossRef]
  37. Pham, T.T.; Ngo, H.H.; Tran, V.S.; Nguyen, M.K. Removal of As (V) from the aqueous solution by a modified granular ferric hydroxide adsorbent. Sci. Total Environ. 2020, 706, 135947. [Google Scholar] [CrossRef] [PubMed]
  38. Yeo, K.F.H.; Li, C.; Zhang, H.; Chen, J.; Wang, W.; Dong, Y. Arsenic Removal from Contaminated Water Using Natural Adsorbents: A Review. Coatings 2021, 11, 1407. [Google Scholar] [CrossRef]
  39. Zhang, L.; Du, C.; Du, Y.; Xu, M.; Chen, S.; Liu, H. Kinetic and isotherms studies of phosphorus adsorption onto natural riparian wetland sediments: Linear and non-linear methods. Environ. Monit. Assess. 2015, 187, 1–11. [Google Scholar] [CrossRef]
  40. Draper, N.R.; Smith, H. Applied Regression Analysis; John Wiley & Sons: New York, NY, USA, 1998; ISBN 0471170828. [Google Scholar]
  41. Guan, X.H.; Wang, J.; Chusuei, C.C. Removal of arsenic from water using granular ferric hydroxide: Macroscopic and microscopic studies. J. Hazard. Mater. 2008, 156, 178–185. [Google Scholar] [CrossRef]
  42. Drever, J.I. The Geochemistry of Natural Waters, 3rd ed.; Prentice Hall: Bergen County, NJ, USA, 1997; ISBN 0132727900. [Google Scholar]
Figure 1. Experimental values and fitted isotherms for the three tested adsorbents (dotted lines correspond to Langmuir isotherms, see Table 1).
Processes 10 01029 g001
Figure 2. The adsorption comparison of the samples with different matrices. Adsorbents: (a) OF-G, (b) OF-M, (c) OF-U (dotted lines Langmuir model, see Table 1). Series: DI, DI water; S, Sulfate 500 mg/L; N1 and CW3, groundwater samples.
Processes 10 01029 g002aProcesses 10 01029 g002b
Figure 3. Stirring of the experiments: (a) OF-G experiments. (b) OF-U experiments.
Processes 10 01029 g003
Figure 4. The kinetic experiments with the OF-G adsorbent. Experiments OF-G1, OF-G2, and OF-G3 belong to the same series and were reset to zero time after arsenic spiking. Experiment OF-G1bis is a separate series. Fitted curves used nonlinear pseudo second-order kinetics.
Processes 10 01029 g004
Figure 5. The kinetic experiments with the OF-U adsorbent. Experiments OF-U1, OF-U2, and OF-U3 belong to the same series and were reset to zero time after the As spiking. Fitted curves used nonlinear pseudo second-order kinetics.
Processes 10 01029 g005
Table 1. The fitting parameters for the Freundlich and Langmuir models.
OF-GOF-MOF-U
Freundlich model
R2 0.80150.94490.9818
KF(mg1−1/n·(L)1/n/g)8.6724.0359.072
n(-)1.4062.5542.209
Langmuir model
R2 0.96950.97630.9845
qmax(mg/g)6.5625.1878.100
b(L/mg)6.7134.3928.259
Table 2. The experimental removal of arsenic ηe, exp (mass %) for the experiments in Figure 2.
MatrixAdsorbent Mass
(mg)
Initial Conc (mg/L)OF-GOF-MOF-U
DI25–754.2274.1–97.460.5-94.991.0–98.2
S25–754.3171.9–96.058.7-92.085.3–97.5
N175–1002.0298.9–99.399.0-99.499.6-–99.9
CW375–1002.7298.8–99.398.8-99.399.8–99.9
Table 3. The assessment of interferences for the synthetic and groundwater studied samples. CIs for the RRs in each studied case.
Matrixn t ( 0.025 ,   n 1 ) OF-GOF-MOF-U
DI34.3031.02 ± 0.101.04 ± 0.131.03 ± 0.15
S34.3031.00 ± 0.101.00 ± 0.191.01 ± 0.08
N143.1821.01 ± 0.011.02 ± 0.011.01 ± 0.01
CW343.1821.01 ± 0.011.04 ± 0.011.01 ± 0.01
Table 4. The conditions and fitting parameters for the nonlinear pseudo second-order adsorption kinetics models for the OF-U sorbent.
ParameterUnitsOF-G1bisOF-G1OF-U1
Initial V(L)1.51.51.5
m(g)1.50.751.5
qo(mg/g)000
NExp. points19716
qe Langmuir(mg/g)3.7673.8584.443
qmax Langmuir(mg/g)6.5626.5628.100
qmax ratio(-)111.23
Pseudo second-order (nonlinear)
qe(mg/g)3.9323.5874.337
k2(g/mg.h)0.02330.06120.793
k2 ratio(-)12.6334.03
Publisher’s Note: MDPI stays neutral with regard to jurisdictional claims in published maps and institutional affiliations.

