Article

Optimization of Macroalgal Density and Salinity for Nutrient Removal by Caulerpa lentillifera from Aquaculture Effluent

by
B.V.A.S. Manori Bambaranda
1,2,*,
Nophea Sasaki
1,*,
Anong Chirapart
3,
Krishna R. Salin
4 and
Takuji W. Tsusaka
1
1
Department of Development and Sustainability, School of Environment, Resources and Development, Asian Institute of Technology, Pathumthani 12120, Thailand
2
Department of Animal Science, Faculty of Animal Science and Export Agriculture, Uva Wellassa University, Passara Road, Badulla 90000, Sri Lanka
3
Department of Fishery Biology, Faculty of Fisheries, Kasetsart University, Bangkok 10900, Thailand
4
Department of Food, Agriculture and Bioresources, School of Environment, Resources and Development, Asian Institute of Technology, Pathumthani 12120, Thailand
*
Authors to whom correspondence should be addressed.
Submission received: 11 March 2019 / Revised: 5 May 2019 / Accepted: 5 May 2019 / Published: 21 May 2019
(This article belongs to the Special Issue Wastewater Treatment Processes)

Abstract

:
Determining the optimum levels of macroalgal density and salinity for removing aquaculture effluent has gained increasing research interest in recent years because of the growing concerns over environmental sustainability. Here, we determined the effects of macroalgal density and salinity on the uptake of NO2, NO3, NH3, and PO43− by Caulerpa lentillifera from the effluent of Poecilia latipinna using spectrophotometry. Laboratory experiments were conducted to measure nutrient uptake at five different macroalgal density levels (10, 20, 30, 40, and 50 g/L) and three salinity levels (20, 30, and 40 ppt) with and without aeration. Quadratic regression analysis revealed significant nonlinear and linear effects of macroalgal density on the uptake of NO2, NO3, NH3, and PO43−, where the maximum uptake was predicted to occur at the macroalgal densities of 31.6, 33.3, 50.0, and 20.0 g/L, respectively. Likewise, the effects of salinity on the uptake of NO2, NO3, NH3, and PO43− were significant and nonlinear where the maximum uptake was predicted to occur at the salinity levels of 29.1, 30.7, 29.5, and 29.5 ppt, respectively. The result of the effects of aeration was mixed but somewhat indicated a positive effect on the nutrient uptake within the 24 h period. Our results could help aquaculturists to minimize the excessive nutrients by C. lentillifera from aquaculture effluent while achieving long-term sustainable aquaculture production.

1. Introduction

Aquaculture effluent contains high quantities of dissolved inorganic nutrients such as nitrites (NO2), nitrates (NO3), ammonia (NH3), and phosphates (PO43−) [1,2]. The discharge of untreated aquaculture effluent creates serious environmental problems because this effluent contains high level of nutrients [3,4]. For instance, enrichment of water by inorganic nutrients (phosphorus and nitrogen) results in harmful algal blooms, deterioration of water quality, and reduction in populations of fish and other aquatic animals due to the hypoxia (low oxygen level) [4,5,6,7]. Reducing the concentrations of nutrients in aquaculture effluent is needed before discharge to the nearby water [8]. Management of aquaculture effluent is therefore important for maintaining environmental soundness of any aquaculture facility as well as the legality of aquaculture practices and their long-term sustainability [9,10]. This is because aquaculture farmers or facilities are required to strictly follow water quality standards and effluent management procedures in order to reduce the pollutant concentrations including NO2, NO3, NH3, and PO43−. The aquaculture licenses can be cancelled if any violation of these standards is reported [9,10].
There are various methods for treatment of wastewater, such as sedimentation, sand filtration, mechanical filtration, and biological treatment using bio filters, trickling filters, rotating biological contactors, fluidized bed reactors, nitrification, and denitrification [2,11]. However, most of these methods are not appropriate for aquaculture effluent treatment and are expensive because of the high suspended solid content [12]. Alternatively, environmentally friendly methods such as biological treatment using living organisms have become increasingly popular [5,8]. Use of algae for nutrient removal in effluent treatment (commonly known as Phycoremediation) was found to be an effective method [9]. In recent years, the use of different macroalgal species for wastewater treatment has gained increasing research interest, as such a method is simple to operate and is environmentally sustainable, user-friendly, and cost-effective [6,13]. Macroalgae are able to uptake the inorganic nutrients (NO2, NO3, NH3, and PO43−) and thereby gradually remove their concentrations in the water [14,15,16].
Previous studies found that the process of effluent water treatment using macroalgae can be optimized by adjusting physical factors (e.g., light, temperature, water motion), chemical factors (e.g., effluent nutrient concentration, salinity), and biological factors (e.g., individual diversity within a species, nutritional history of macroalgae, and growth stages of macroalgae) [7,14,17,18,19,20,21]. Other studies reported that the efficiency in nutrient removal by macroalgae depends on such factors as stocking density, salinity, tank depth, water turnover, and biomass harvesting frequency [14,19,21,22,23]. Of these, macroalgal density, salinity, and aeration can be controlled at farm levels depending on objectives of the aquaculture management [16,20,23]. As a decline in nutrient uptake and macroalgal growth occurs when macroalgal density and salinity are too high or too low [16,24,25,26,27,28], it indicates the non-linear effects of these factors on nutrient uptake. Therefore, it is critical to determine the optimum levels of macroalgal density and salinity for the effective applications of macroalgae for aquaculture effluent treatment [16,18,20,24,25,26]. In addition to macroalgal density and salinity, some species can affect the photosynthetic performance and nutrient uptake, suggesting that there is also a need to determine the effects of aeration on nutrient uptake, because understanding such effects may have direct implications for effective management of the aquaculture farm [27].
Selection of macroalgal species may affect the success of effluent treatment. Previous studies suggest that selection of an appropriate macroalgal species for effluent treatment may need to take into consideration such factors as bioremediation capacity, growth rate, availability, ease of cultivation, ability to grow in a wide range of conditions, nutrient storage efficiency in algal tissues, and knowledge of life stages of macroalgae [5,29]. Caulerpa lentillifera J. Agardh is a fast-growing green macroalgal species naturally found in many countries, and it can be cultivated for any purpose [16,30,31,32]. It was reported that this species has high nutrient uptake capacity in marine fish aquaculture effluent treatment [17]. Some studies found that this species is also resistant to a wide range of salinity and adaptable to a variety of environments [32,33]. Of particular interest in Thailand, C. lentillifera is cultivated by many shrimp farmers in their aquaculture ponds for effluent treatment because of its high nutrient removal capacity [30]. Nevertheless, previous studies of C. lentillifera on nutrient uptake focused mainly on comparing the feasibility of its use with red macroalgae and other Caulerpa species as biofilters [15,17]. Although this species has been used to treat the effluent, very few studies have been attempted to analyze the optimum levels of such uptakes under various conditions [34,35]. However, information on optimum levels is still lacking, making it impossible to apply the appropriate amount of the C. lentillifera in the farm for maintaining the water quality. As fishes release different excretes, fishes can also affect the nutrient concentrations [2,6], indicating that any study to determine the optimum levels of nutrient uptake needs to include real effluent from the fish to ensure that the results are useful for real-world applications. Until recently, however, no such study had been conducted.
The objective of this study was to determine the optimum levels for macroalgal density and salinity levels for nutrient removal by C. lentillifera from aquaculture effluent from Poecilia latipinna Lesueur (Sailfin molly). P. latipinna is a popular ornamental fish species [36]. Sailfin molly is a live bearer, and this species can survive in wide ranges of environmental conditions, including varied salinity levels (0–80 ppt) [37,38]. Sailfin molly inhabits lakes, ponds, streams, salt marshes, estuaries, and coastal waters, which have different salinity levels [37,39]. This study also examined whether aeration significantly influences nutrient uptake through controlled laboratory experiments in Thailand. Regression analysis was performed to analyze the effects of different factors on nutrient uptake. The findings of this study can strengthen laboratory level evidence to inform the aquaculture sector stakeholders and farmers for better treatment of the aquaculture effluent and improvement of the wastewater management while mitigating pollution in aquatic environments.

2. Materials and Methods

2.1. Fish Collection and Acclimatization for Experiment

Sailfin mollies (P. latipinna) of 3–5 cm in size in freshwater (0–0.5 ppt) were procured from an ornamental fish dealer in Bangkok, Thailand in December 2017 and transported to the Algal Bioresources Research Center, Kasetsart University. Three outdoor plastic tanks (1 m × 0.6 m × 0.5 m size) were filled with 0 ppt of water salinity filtered using a 2 mm polyester fiber filter and 150 L of water. Each tank was aerated with filtered air using a diaphragm blower and provided 50% of aeration rate using air controllers and air stones. Forty individuals of P. latipinna [at 1:1 (20:20) male: female ratio] were stocked per tank [37]. Ten live fish samples from each tank were weighed, and the feeding rate was calculated. Fish weights were measured every ten days, and fish feed amounts were adjusted according to the body weight. Fish were fed twice a day with Sakura floating type fish feed at 4% of their body weight, and uneaten feed was removed from the fish tanks after approximately 5–7 min using a fine fish hand net. Bottom siphoning of the tanks was applied once a day, and tanks were refilled with filtered seawater to maintain the total volume of water in each tank at 150 L.
After one week, water salinity of P. latipinna tanks was raised by 5 ppt every three days from 0 ppt to 30 ppt by adding filtered, concentrated seawater purchased from a salt farm located in Samutsakorn province, Thailand. After this acclimatization process, the tanks were maintained at 30 ppt water salinity and 150 L water volume. Water salinity in fish tanks was measured twice a day using a refractometer (S/Mill-E; ATAGO, Japan). Water samples (1 L) were collected from each fish tank daily at 9:00 before feeding and siphoning to determine the nutrient content of water. The water samples were filtered through GF/C Whatman filter papers (0.45 µm), and filtrate was analyzed for dissolved NO2, NO3, NH3, and PO43− concentrations in three replicates following the standard methods for examination of water and wastewater—namely, the cadmium reduction method, the naphthylethylenediamine method, the phenate method, and the ascorbic acid method—using a portable UV-visible spectrophotometer (Shimadzu UV-1061) based on the absorption of nutrient component at the wavelengths of 543 nm, 543 nm, 640 nm, and 880 nm, respectively [40].
Effluent was collected from the fish rearing tanks seven days after the completion of the acclimatization process, by which time the dissolved nutrient concentrations exceeded the standards in Thailand. NH3-N (ammonia nitrogen) and total phosphorus are two of the main parameters included in the effluent standards, for which the maximum permitted values are 1.1 mg-N/L and 0.4 mg-P/L, respectively [41].

2.2. Macroalgae Collection and Pre-Culture

C. lentillifera samples were collected from a macroalgal farm located in Petchaburi province, Thailand in January 2018. Macroalgae were selected after removing visible epiphytes and rinsing with filtered seawater and were transferred to the laboratory at Algal Bioresources Research Center, Kasetsart University. C. lentillifera was precultured in a growth chamber, which contained the tanks and light, for seven days using 10 L Provasoli Enriched Seawater medium (PES) under controlled conditions of temperature (27 ± 0.5 °C), salinity (30 ppt), photon flux density (105 µ mol photons m−2 s−1), and a photoperiod of 12:12 h light: dark cycle.

2.3. Application of Macroalgal Density

Fresh specimens of C.lentillifera consisting of similar sized erect branches were selected as macroalgal samples, and five macroalgal stocking density levels (10, 20, 30, 40, and 50 g/L) were tested by following completely randomized design (CRD) in triplicate. The collected effluent from P. latipinna fish rearing tanks was filtered through 0.45 µm GF/C Whatman filter papers. Experiments were performed in non-reactive plastic containers (0.06 m × 0.06 m × 0.15 m size) with the 300 mL filtered aquaculture effluent. Separate experimental units were used to determine the hourly uptake, and macroalgae were removed every hour up to 24 h. Uptake of NO2, NO3, NH3, and PO43− was measured by the spectrophotometric methods [40].
The experiment was conducted at constant temperature (27 °C), salinity (30 ppt), light intensity (105 µ mol photons m−2 s−1), and a photoperiod of 12:12 h light: dark cycle.

2.4. Application of Salinity and Aeration

After the measurements of nutrient uptake at different macroalgal stocking density levels, the second experiment was conducted to measure the uptake of NO2, NO3, NH3, and PO43− by C. lentillifera from the fish effluent at different salinity levels and with and without aeration. Three salinity levels of 20 ppt, 30 ppt, and 40 ppt were tested by following CRD in triplicate. The aeration was supplied by bottom aeration using 0.75 m long airline tubing of 4 mm internal diameter connected to a diaphragm blower at 10 cm/s water flow velocity following Madsen et al. [29]. The macroalgal samples were taken from the laboratory culture maintained at 30 ppt and directly used for the experiment. Based on the results of the experiment conducted on macroalgal density, 30 g/L, which showed the highest uptake of NO2, NO3, and PO43− among the five macroalgal density levels, was used for this experiment where salinity levels were altered. The experiments were conducted under the same laboratory conditions as described in Section 2.3.
Photosynthetic efficiency was used as a supplementary measurement to gauge whether physiological activities of macroalgae were affected by salinity and aeration. Photosynthesis efficiency was measured by pulse-amplitude-modulated (PAM) fluorometry using the yield value of chlorophyll fluorescence following Wedchaparn et al. [19]. In PAM, denoting the minimum fluorescence value as F0 and the maximum amount of fluorescence as Fm, Fv is defined as the difference between Fm and F0. Then, Fv/Fm provides a measure of photosynthetic efficiency [42]. The initial photosynthesis efficiency was measured, keeping macroalgal samples under the dark condition for 30 min prior to measuring photosynthesis efficiency rates using the Junior-PAM chlorophyll fluorometer. Triplicate was used for each level of salinity.

2.5. Measurement of Nutrient Uptake

The nutrient uptake efficiency (NUE hereafter) for each nutrient was calculated using the Formula [43] as follows:
N U E = { ( c i c f ) / c i } × 100
where NUE is in %, and c i and c f are the initial and the final concentrations (mg/L) of each nutrient. Nutrient uptake by macroalgae was measured based on the reduction in the concentration of a given nutrient in the culture medium [44]. Temporal variation of the nutrient concentration elaborates the nutrient removal due to nutrient uptake.

2.6. Inferential Analysis

NUE data were tested using one-way ANOVA followed by Tukey’s HSD (honesty significant difference) test to compare NUE at five different macroalgal density levels and three salinity levels [45]. The independent variables were macroalgal density and salinity levels, while the dependent variable was NUE. The two-sample t test was performed to compare NUE with and without aeration. For the t test, the independent variable was aeration, while the dependent variable was NUE. IBM SPSS 23 was used to obtain these statistics.
The outputs of the descriptive and inferential analyses suggest general tendencies in the likely effects of the controllable factors on NUE, which are formally examined by the regression analysis.

2.7. Regression Analysis

As the descriptive statistics suggest that the effects of macroalgae macroalgal density and salinity are nonlinear, quadratic terms of these variables were included in the multiple linear regression model [46] as follows:
y i = β 0 + β 1   x 1 i + β 2 x 1 i 2 + β 3 x 2 i + β 4 x 2 i 2 + β 5 x 3 i + ε i
where y i refers to NUE (%), x 1 is macroalgal density (g/L), x 2 is water salinity (ppt), and x 3 is the dummy variable for aeration (1 with aeration, 0 without).
Suppose the first order coefficient is β1 and the second order coefficient is β2, then the first-order condition is given by the following formulas.
y x = β 1   X * + 2 β 2 X * = 0
X * = β 1 2 β 2
It must be noted that the maximum value of the dependent variable can be found only if β 2 is negative and statistically significant (i.e., the second-order condition is met with negativity).
Since the variables were measured over multiple points in time, the random effect model [47,48] was employed to control for unobservable time-invariant heterogeneity. In addition, the OLS (ordinary least squares) model was employed for a robustness check, where the standard errors were clustered to account for repeated measurements [49].
To indicate the maximum NUE, predicted values of NUE corresponding to the optimum levels of input variables were obtained using the following equation for each nutrient:
Y ^ = β 0 ^ + β 1 ^ X 1 * + β 2 ^ X 1 * 2 + β 3 ^ X 2 * + β 4 ^ X 2 * 2 + β 5 ^
where Y ^ refers to predicted maximum NUE (%), X 1 * and X 2 * are the critical values obtained for macroalgal density (g/L) and salinity (ppt), respectively, and β 0 ^ to β 5 ^ are the estimated coefficients as in Equation (2). STATA 15 was used for these regression analyses [50].

3. Results

3.1. Macroalgal Density

3.1.1. Relationship between Nutrient Concentration and Algal Density

The changes over time in concentrations of NO2, NO3, NH3, and PO43− for different levels of macroalgal density are presented in Figure 1. Among the discrete levels of density applied, the highest reduction in concentration for three nutrient components (NO2, NO3, and PO43−) occurred at 30 g/L density, while the highest concentration reduction for NH3 was at 40 g/L macroalgal density. Increasing trends in removal of NO2 and NO3 were observed from 10 g/L to 30 g/L of macroalgal density. Concentration reduction remained higher at 40 g/L and 50 g/L than at 10 g/L and 20 g/L. As for NH3, the highest concentration reduction was observed at 40 g/L. However, at higher densities, concentration was higher due to the comparatively low nutrient uptake. As for PO43−, the reduction in concentration gradually increased with macroalgal density, and the highest reduction was observed at 30 g/L. The reduction in concentration was smaller at 40 g/L and 50 g/L than at 10 g/L and 20 g/L, which contrasted with the cases of the other inorganic ions.

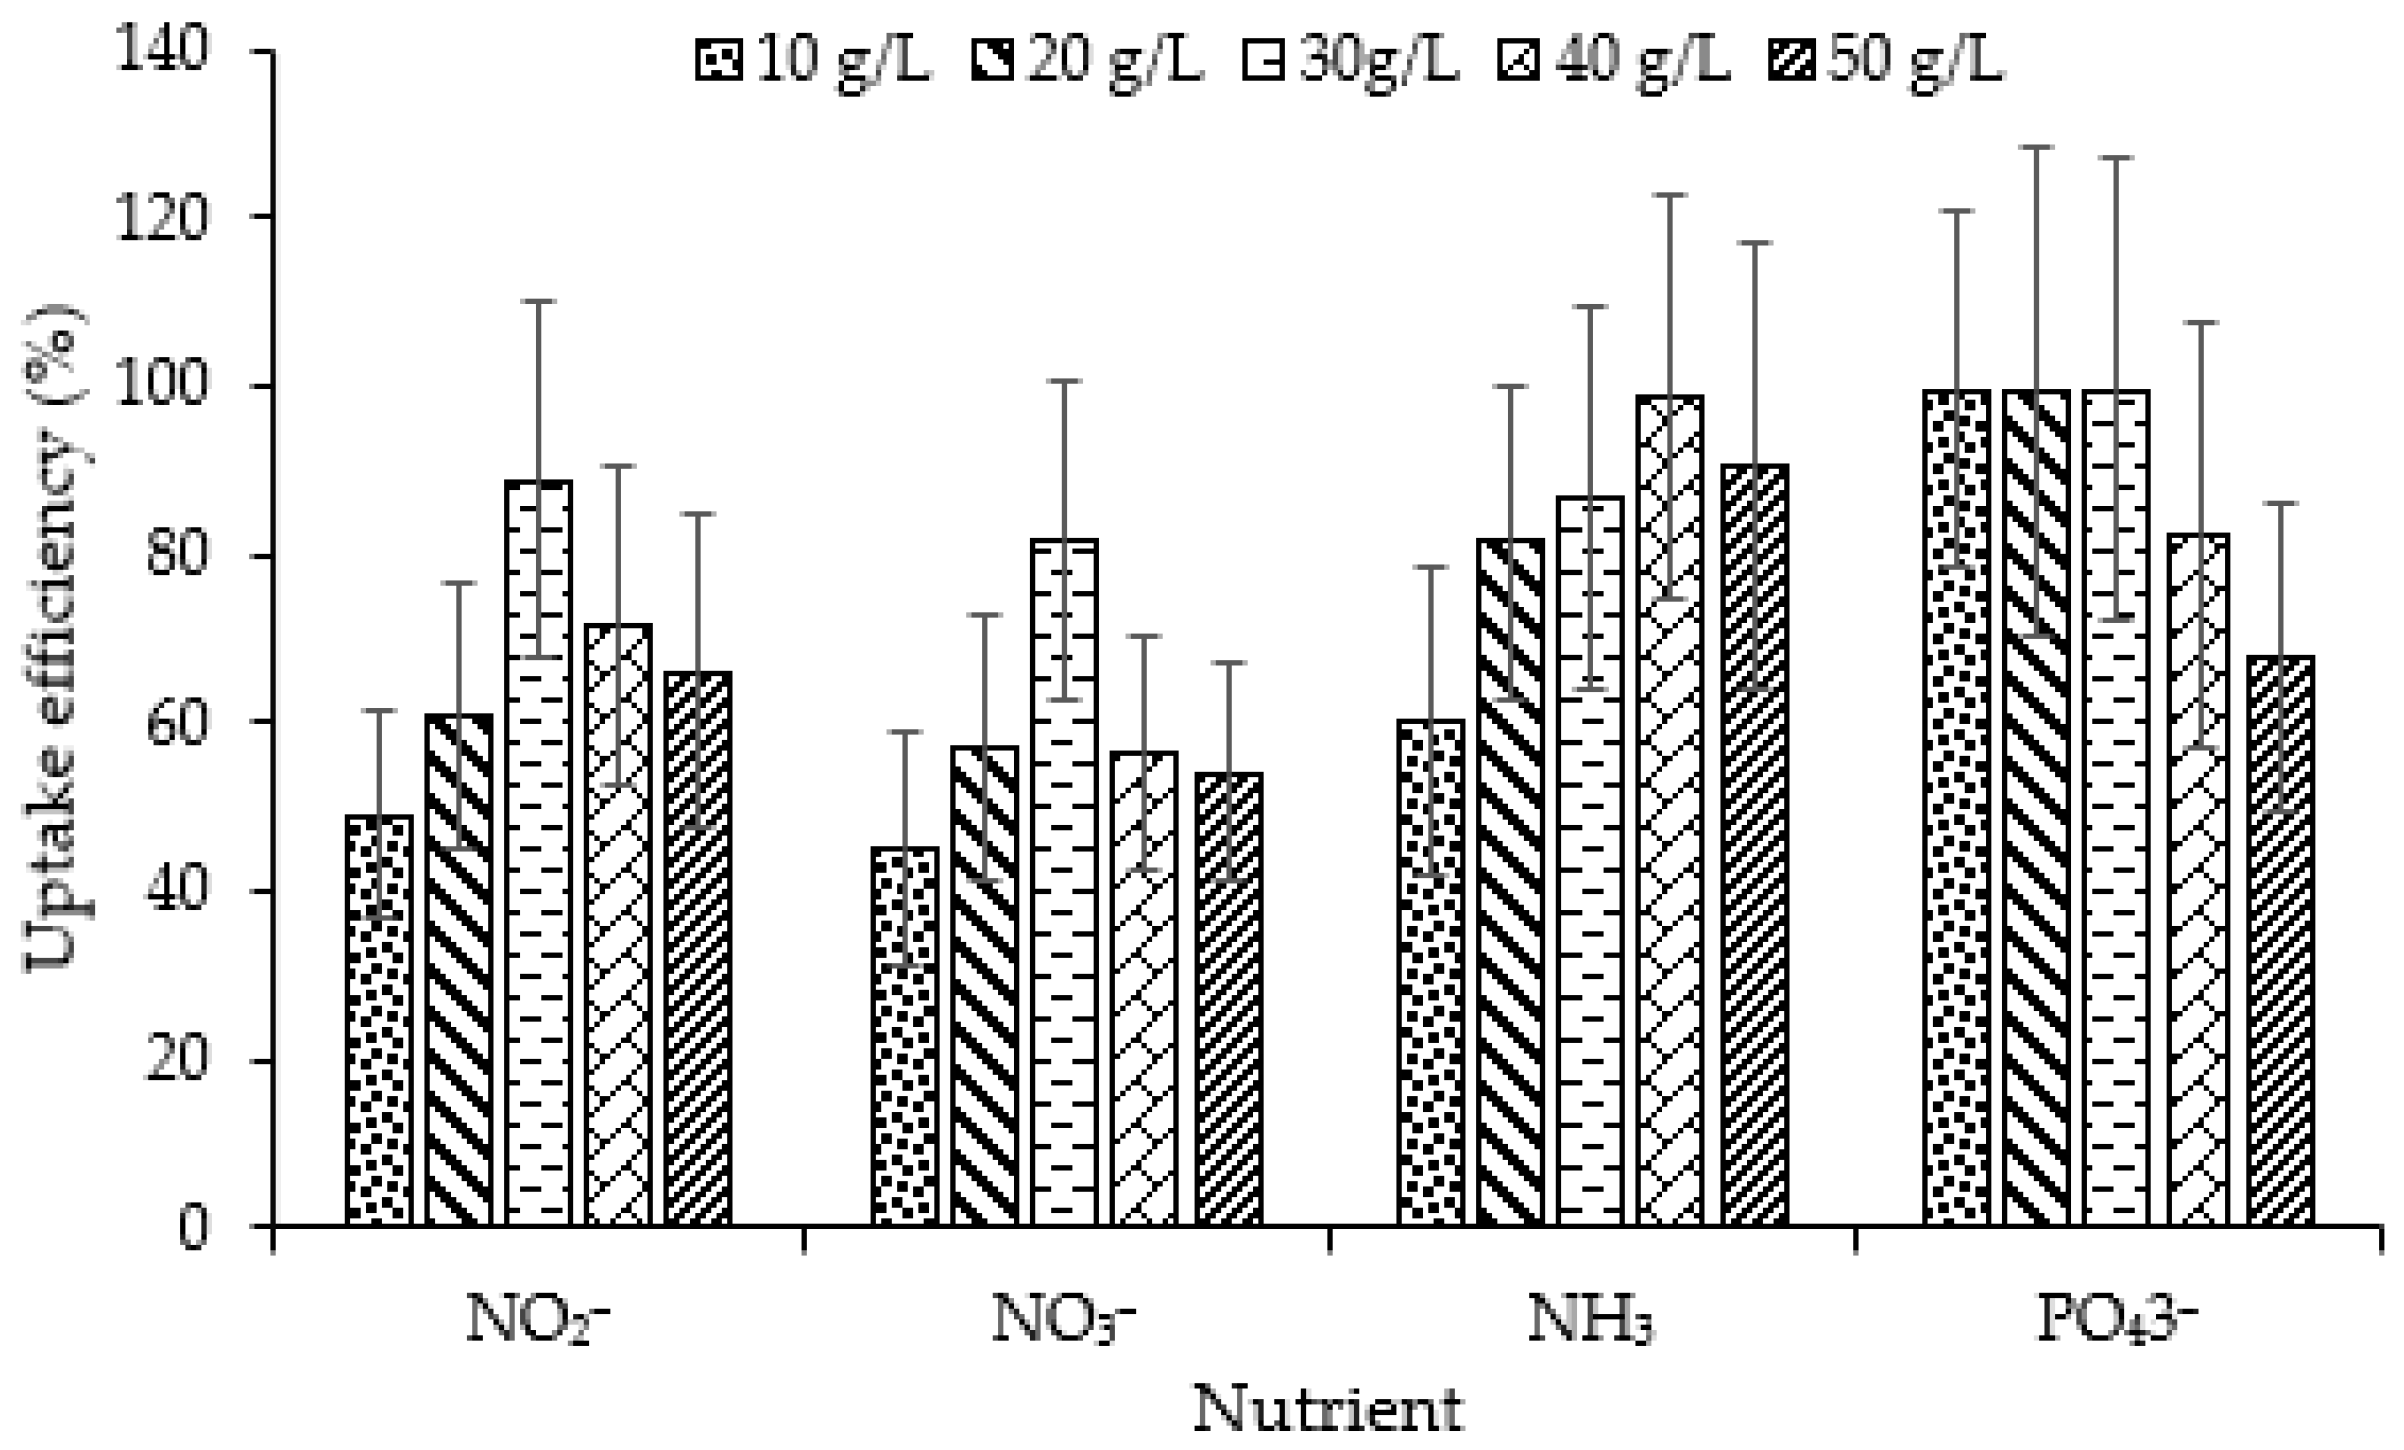
3.1.2. Relationship between Nutrient Uptake Efficiency and Macroalgal Density

NUE for NO2, NO3, and PO43− during the 24 h period took the highest values (88.8%, 81.7%, and 99.8%, respectively) at 30 g/L. In contrast, the highest NUE for NH3 (98.8%) during the 24 h was observed at 40 g/L (Figure 2). Table 1 shows that there was a statistically significant difference in NUE across the five macroalgal density levels. The Tukey’s test result shows that NUE for NO2, NO3, and PO4 was higher at 30 g/L than that at the other levels, while for NH3, 40 g/L exhibited the highest NUE (Table 2).

3.2. Salinity and Aeration

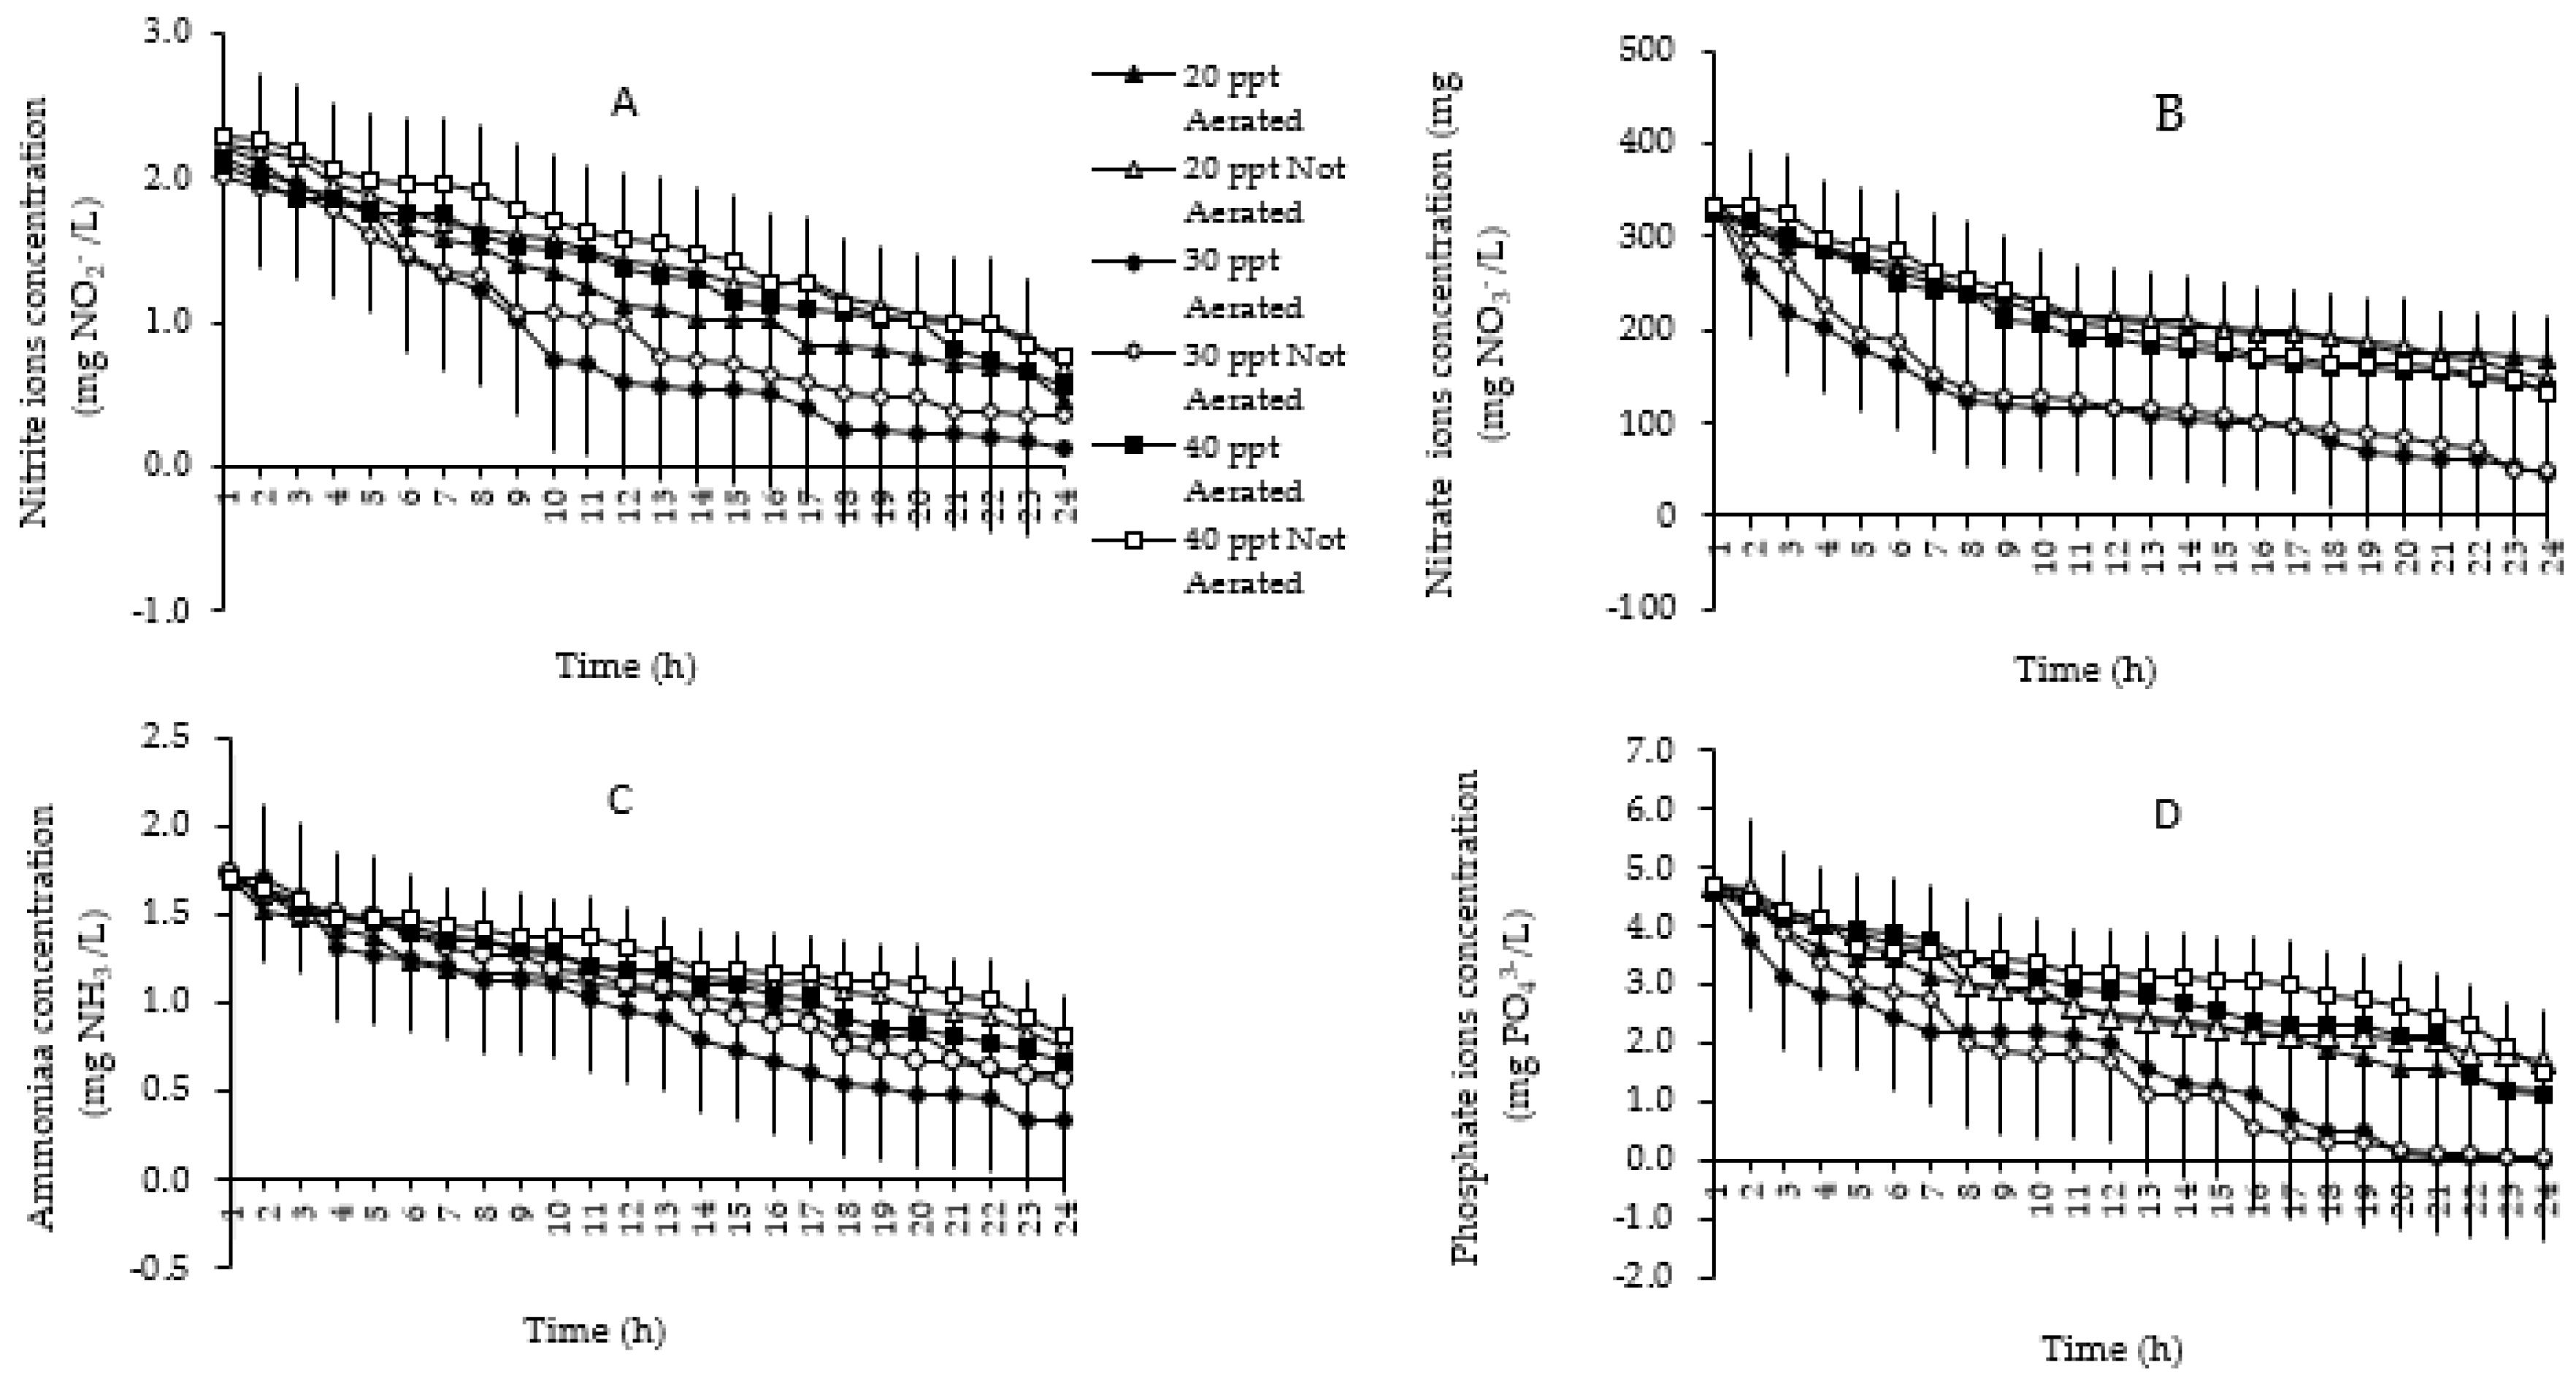
3.2.1. Relationship between Nutrient Concentration and Salinity and Aeration

The changes over time in concentrations of NO2, NO3, NH3, and PO43− at three salinity levels with and without aeration during 24 h are presented in Figure 3. The set of line graphs shows that the concentrations of NO2, NO3, NH3, and PO43− were lowest at salinity level of 30 ppt and higher at 20 ppt and 40 ppt. The results showed a nonlinear correlation between nutrient uptake by C. lentillifera and level of salinity. Furthermore, the nutrient concentration seemed lower with aeration than without aeration, suggesting a positive correlation between nutrient uptake and aeration except PO43−.

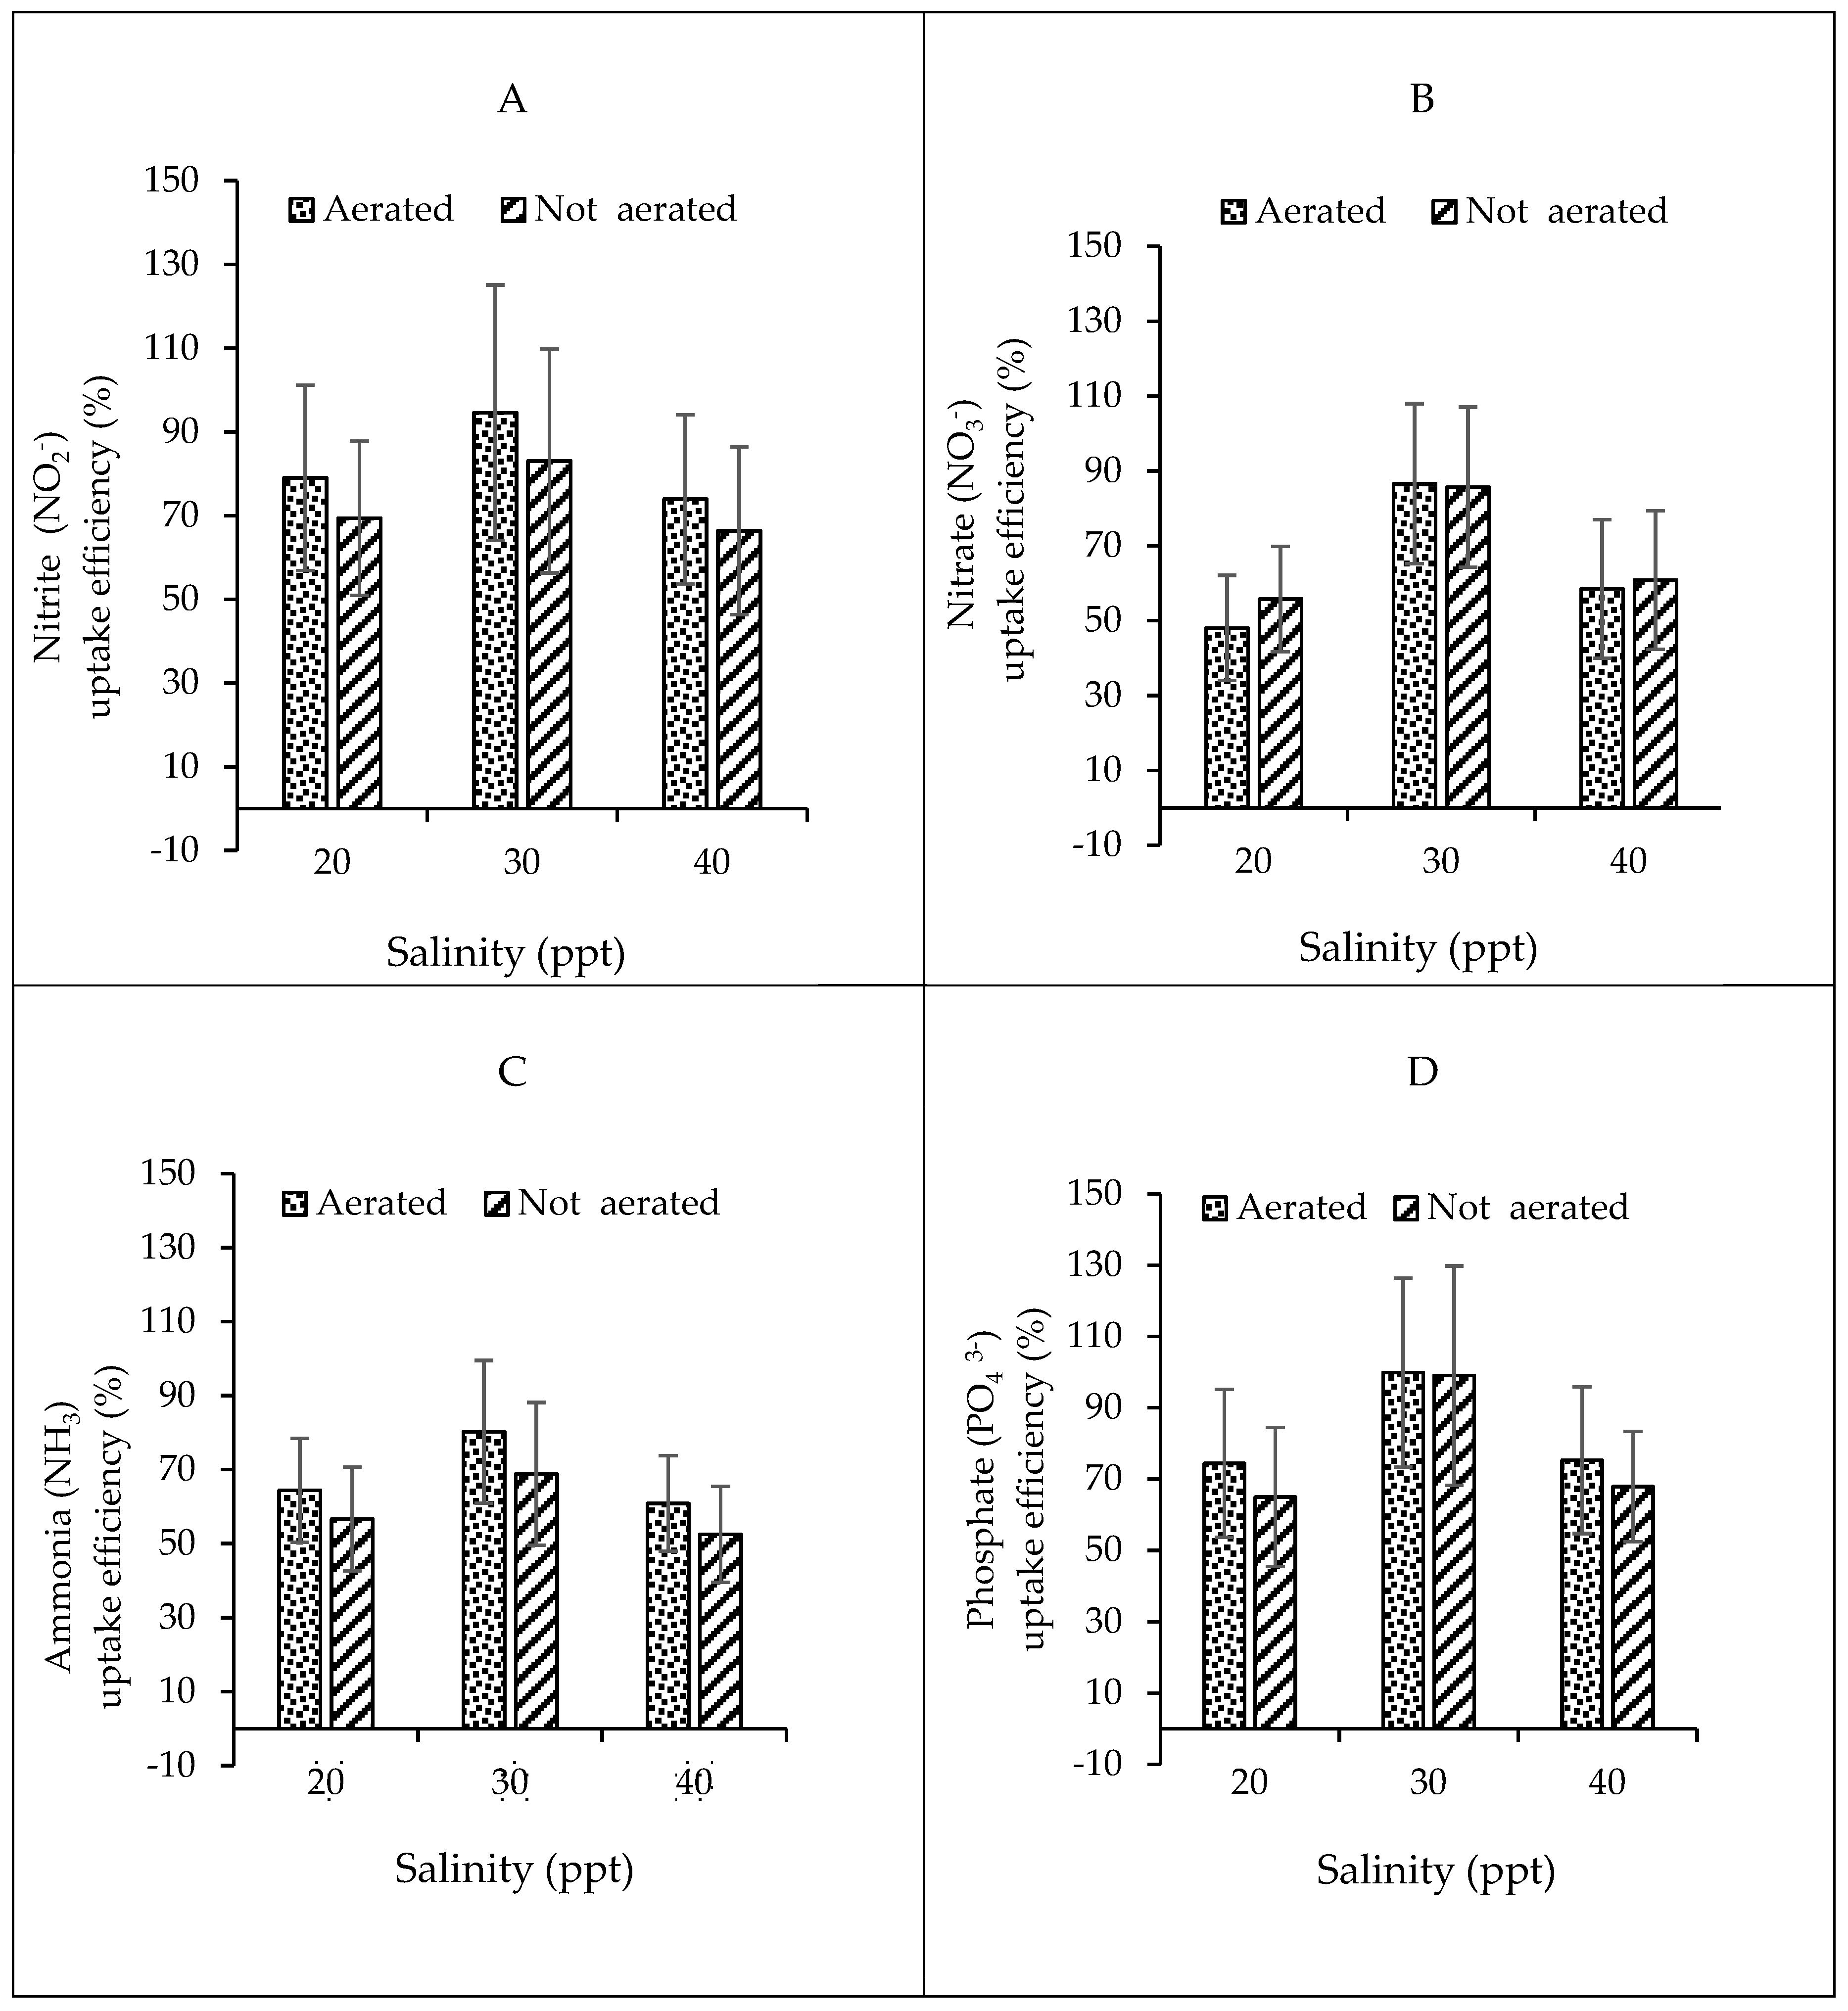
3.2.2. Relationship between Nutrient Uptake Efficiency and Salinity and Aeration

The NUE for NO2, NO3, NH3, and PO43− by C. lentillifera was highest at 30 ppt salinity level during the 24 h period (Figure 4). The NUE was higher when the medium was aerated than it was when non-aerated. The efficiency seemed highest at 30 ppt salinity level and higher with aeration than without aeration. The lowest NUE for NO2, NO3, NH3, and PO43− was at 40 ppt in non-aerated, 20 ppt in aerated, 40 ppt in non-aerated, and 20 ppt in non-aerated conditions, respectively. According to Table 1, there was a statistically significant difference in NUE across the three salinity levels. The Tukey’s test showed that NUE was significantly higher at 30 ppt salinity level than at the two other levels for all four nutrients (Table 3). There was no significant difference in NUE by aeration except for NO2 at 20 ppt salinity, for which NUE was higher with aeration (Table 1).

3.2.3. Relationship between Photosynthesis affected by Salinity and Aeration

Figure S1 shows the photosynthesis efficiency (Fv/Fm) of C. lentillifera at different salinity levels with and without aeration. The efficiency seemed highest at the 30 ppt salinity level and higher with aeration than without aeration. The Fv/Fm values at 20 ppt, 30 ppt, and 40 ppt with aeration were 0.73, 0.78, and 0.69, respectively, while the Fv/Fm values at the three salinity levels (20 ppt, 30 ppt, and 40 ppt) without aeration were 0.69, 0.76, and 0.64, which were lower than with aeration.

3.2.4. Effects of Various Factors on Nutrient Uptake Efficiency

Table 4 shows the results of quadratic regression analysis using the random effect model and the OLS robust model. The estimated coefficients of the quadratic terms indicate that, in general, there were nonlinear effects of macroalgal density and salinity on nutrient uptake efficiency by C. lentillifera. The only exception was the coefficients of the second-degree term of macroalgal density for NH3, for which we herein provide interpretations for both linear and nonlinear effects, since the p-values were not extremely large. The negative coefficients of the quadratic terms exhibited inverted U-shaped response to macroalgal density and salinity, where NUE took the maximum value at critical levels of density and salinity on the continuous scale.
Table 5 summarizes the critical values of density and salinity for each nutrient along with the predicted maximum values of NUE. The optimum macroalgal density was found to be in the range of 20 to 34 g/L depending on the nutrient. PO43− had the lowest optimum macroalgal density of 20.03 g/L, while NO3 had the highest optimum of 33.25 g/L. NO2 lay in the middle at 31.58 g/L. The results indicated that the effect of macroalgal density on NUE for NH3 was different from that for the other three nutrients. The p-values of the second-order term of macroalgal density were 0.214 for the random effect model and 0.135 for OLS. If we considered it as statistically insignificant, it implied linear effects within the existing data range. Hence, 50 g/L macroalgal density was adopted for the calculation of the maximum NUE. If we considered it as statistically significant, it implied nonlinear effects, and the optimum macroalgal density was 51.12 g/L. In either case, the estimated critical values equal to or higher than 50 g/L may seem odd when compared with Figure 3. Nonetheless, the concentration seeming lower for 50 g/L than in 40 g/L in Figure 3 does not provide robust evidence because of the relatively large standard deviation at 50 g/L and the fact that Figure S1 (see Supplementary Section) is based on bivariate analysis not capable of controlling for the covariate factors. Under the linear effect scenario, NH3 exhibited the predicted NUE of 98.16%, which was higher than that for the other nutrients. PO43− attained higher maximum NUE than that for NO2 and NO3. The optimum salinity levels for NO2, NO3, NH3, and PO43− were 29.09 ppt, 30.68 ppt, 29.53 ppt, and 29.48 ppt, respectively. Hence, the lowest optimum salinity was found for NO2, while the highest optimum salinity was obtained for NO3. Effect of aeration was basically insignificant on average, holding other variables constant (Table 2). However, the statistical significance was relatively high for NO2, NO3, and NH3. In particular, for NO3, the random effect model indicated a significant coefficient, suggesting that aeration caused NUE of NO3 to increase by 9.28% on average.

4. Discussion

The results clearly indicate the significant and nonlinear effects of macroalgal density on NUE for NO2, NO3 and PO43−, while the effect of macroalgal density on NH3 NUE could be linear (Table 4). The effect of salinity level on NUE was significant and nonlinear for all four nutrients studied (Table 4). The influence of aeration was evident for NO3, weakly evident for NO2 and NH3, and absent for PO43− (Table 4).
In the application of macroalgae for bioremediation, the optimum macroalgal density is a main factor that should be used by farmers to obtain effective results [20,23]. The nonlinear effect found of macroalgal density on NUE (except NH3) by C. lentillifera in our study (Table 4) confirms a previous study by Macchiavello and Bulboa [28]. The linear effect on NH3 might have been due to the passive diffusion of NH3 [14]. Passive diffusion could be decreased when the macroalgal density increased further and the ability to uptake through boundary layers declined at overloaded conditions [14,21].
Nutrient uptake by C. lentillifera was limited at lower and higher macroalgal density levels, which was presumably because of limited and inadequate macroalgal biomass at lower density and self-shading at higher density, affecting the uptake of light-sensitive ions such as NO2, NO3, and PO43− [20,21]. With the reduction in photosynthesis, nutrient uptake decreased due to low demand for nutrients [28,51]. Changes over time in nutrient concentration provide vital information in deciding the duration to be applied of implementation. Although in our laboratory experiments, constant temperature, salinity, light intensity, and photoperiod were used, in actual farm conditions, these parameters may be different from the levels used in our study. The optimum levels can vary according to the fluctuation of these factors. Moreover, in this study, limited water volume and filtered effluent samples were used. In actual farms, the effluent bioremediation process must be implemented for large quantities of effluent, which may contain other microorganisms and micro and macro algae that can interfere with nutrient uptake. Therefore, in addition to our results, further research in outdoor conditions involving on-farm trials is required prior to applying these results.
With respect to salinity levels, nonlinear effects were documented by Choi et al. [26] for Ulva pertusa using six different salinity levels, namely, 5, 15, 20, 25, 34 and 40 ppt on the uptake of NO3 and PO43− for a 7-day period, where the maximum uptake was observed at the intermediate salinity level of 20 ppt. They attributed their result to the stress conditions and the low tolerance of the species to extreme conditions of salinity. Because of the stress condition at lower and higher salinity levels, photosynthesis efficiency declines, resulting in decreased nutrient uptake due to low demand for nutrients [28,51]. The optimum salinity levels found in our study (Table 5) are compatible with the salinity ranges mentioned in some previous studies. Guo et al. [16] reported that although C. lentillifera could survive salinity of 20–50 ppt, 35 ppt was the optimum salinity level to attain the maximum growth rate of this species, which does not fall within the range of our results. A study in Thailand showed that the optimal salinity level for C. lentillifera was in the rage of 25–30 ppt [35]. Rabia [32] also stated that C. lentillifera culture demonstrated a relatively high growth rate within the salinity range of 29–37 ppt, and that this species was stenohaline, being sensitive to changes in salinity. This range included our range of 29–31 ppt. According to our results (Table 4 and Table 5), C. lentillifera can be used only for a limited range of salinity levels for the purpose of nutrient removal. The C. lentillifera bioremediation system for effluent treatment can be implemented in ponds or in other culture units for fish and aquatic animals that can tolerate similar salinity levels. In aquaculture farms, different salinity levels are used based on the culture system and the salinity tolerance of fish and other aquatic animals. The salinity levels of aquaculture effluent may be different from the levels obtained in this study and may need to be adjusted by farmers. Therefore, the application of this macroalgal species is more appropriate for marine and brackish water aquaculture farms, where it is easy to obtain seawater to adjust salinity levels.
Our result (Table 4) indicates that the nutrient uptake might be positively affected by aerated medium in comparison to non-aerated medium. Caines et al. [22] showed that an eight-hour period of continuous no aeration condition during the night had no effect on the growth or the uptake of NH4+ and PO43− by red macroalgal species Chondrus crispus and Palmaria palmata cultured in finfish effluent. Moreover, our study did not find evidence of correlation between aeration and photosynthesis efficiency. Msuya and Neori [23] argued that the effects of aeration or water velocity of the medium on uptake of TAN (NH3 and NH4+) by Ulva lactuca were significant under laboratory conditions only when nutrient concentration was low. However, for small scale farmers, it may be difficult to apply aeration to enhance the nutrient uptake when the culture units are big ponds or without aeration facility, because the maintenance cost of the aquaculture farm may increase if farmers use an aerated bioremediation system.
There were four major limitations in our study. First, we conducted the measurements under controlled conditions. Under the on-farm environments, nutrient uptake by macroalgae should be affected by different physical, chemical, biological, and socioeconomic factors that were not captured by our laboratory experiments. Second, the effluent for water quality analysis was obtained from Sailfin molly rearing tanks. The actual on-farm conditions of effluent may differ from our effluent conditions. Third, our study focused on three controllable factors and four nutrients. Hence, other chemical, physical, and biological factors, and other nutrients such as heavy metals and organic matters are beyond the scope of the current study, which requires further research in the future. Fourth, stocking density can be expressed as a function of water volume or as culture area. The determination of optimum macroalgal density was conducted using the unit of mass of macroalgae per volume of water (i.e., g/L). The results may differ depending on the bottom surface area of the experimental unit, even if the volumes are the same.
As aquaculture systems often generate high amounts of effluent, affecting fish production and imposing various negative impacts on the environments [2,9,10], our findings of the optimum levels of macroalgal density and salinity for removing excessive nutrients from aquaculture effluent can be applied to treat the effluent and restore the aquaculture environment, particularly in Thailand, where approximately 15,000 km2 of water have been affected by effluent [52]. Our findings can also contribute to the achievement of the United Nation’s Sustainable Development Goal 6 Target 6.3 on water quality and wastewater through the use of macroalgal species improve water quality as well as fish productivity [53].

5. Conclusions

The optimum levels of macroalgal density and salinity for four nutrients (NO2, NO3, NH3, and PO43− in the aquaculture effluent from Poecilia latipinna were determined using C. lentillifera in the experimental unit containing the effluent of P. latipinna under controlled conditions in a laboratory of 300 mL medium for 24 h. For macroalgal density, optimum levels for these four nutrients were found at 31.6, 33.3, 50.0, and 20.0 g/L, respectively. Our findings suggest that nutrient uptake by C. lentillifera was nonlinearly influenced by macroalgal density and the optimal level of macroalgal density. Similarly, optimum levels for salinity for removing the four nutrients above were 29.1, 30.7, 29.5, and 29.5 ppt, respectively. Nutrient uptake was nonlinearly affected by water salinity, where low and high salinity decreased the nutrient uptake. However, our findings found the mixed effects of aeration on nutrient uptake, indicating that aeration is a minor factor affecting the nutrient uptake.
With our findings on optimum levels of macroalgal density and salinity, and if field experiments can be successfully implemented, aquaculture farmers or owners can apply the findings to treat effluent in their farms for maintaining the appropriate nutrient levels as required by the government authority. Therefore, it is recommended that field experiments be conducted before the actual implementation to remove the nutrients in the aquaculture effluent.

Supplementary Materials

The following are available online at https://0-www-mdpi-com.brum.beds.ac.uk/2227-9717/7/5/303/s1, Figure S1: Photosynthesis efficiency (fv / fm) at three salinity levels at initial (0 h) and final (24 h) nutrient uptake with and without aeration, with 30 g/L Caulerpa lentillifera density.

Author Contributions

B.V.A.S.M.B. carried out the experiments and drafted the paper. N.S., A.C., and K.R.S. contributed to conceptualization, methodology, review, and editing. T.W.T. significantly contributed to the analysis of data, review, and editing.

Funding

This research received no external funding.

Acknowledgments

The first author accredits Uva Wellassa University of Sri Lanka for supporting her Ph.D. study and the Asian Institute of Technology (AIT), Thailand for providing fellowship. Special thanks extend to Nicolas Faysse for his helpful comments and suggestions in designing this study and reviewing the manuscript. The authors thank the staff of Algal Bioresources Research Center, Kasetsart University for the assistance rendered during the conduct of our laboratory experiments.

Conflicts of Interest

The authors declare no conflict of interest.

References

  1. Chung, I.K. The development of environmentally sound integrated polyculture system. Min. Sci. Tech. Project #M6-0203-00-0041-02-A01-00-021-00. Cultivation of Gracilaria parvispora (Rhodophyta) in shrimp-farm effluent ditches and floating cages in Hawaii: A two-phase polyculture system. Aquaculture 2002, 193, 239–248. [Google Scholar]
  2. Turcios, A.E.; Papenbrock, J. Sustainable treatment of aquaculture effluents-What can we learn from the past for the future? Sustainability 2014, 6, 836–856. [Google Scholar] [CrossRef]
  3. Chopin, T.; Buschmann, A.H.; Halling, C.; Troell, M.; Kautsky, N.; Neori, A. Integrating seaweeds into marine aquaculture systems. A key toward sustainability. J. Phycol. 2001, 37, 975–986. [Google Scholar] [CrossRef]
  4. Boyd, C.E.; Tucker, C.; Mcnevin, A.; Bostick, A.; Katherine, B.; Clay, J. Indicators of Resource Use Efficiency and Environmental Performance in Fish and Crustacean Aquaculture. Rev. Fish. Sci. 2007, 15, 327–360. [Google Scholar] [CrossRef]
  5. Khan, F.A.; Ansari, A.A. Eutrophication: An ecological vision. Bot. Rev. 2007, 71, 449–482. [Google Scholar] [CrossRef]
  6. Chopin, T.; Cooper, J.A.; Reid, G.; Cross, S.; Moore, C. Open-water integrated multitrophic aquaculture: Environmental biomitigation and economic diversification of fed aquaculture by extractive aquaculture. Rev. Aquac. 2012, 4, 209–220. [Google Scholar] [CrossRef]
  7. Phang, S.; Chu, W.; Rabiei, R. Phycoremediation. In The Algae World; Sahoo, D., Seckbach, J., Eds.; Springer: Esrael, Israel, 2015; Volume 26, pp. 357–381. [Google Scholar]
  8. Haseena, M.; Malik, M.F.; Javed, A.; Arshad, S.; Asif, N.; Zulfiqar, S.; Hanif, J. Water pollution and human health. J. Environ. Risk Assess. Remediat. 2017, 3, 16–19. [Google Scholar] [CrossRef]
  9. Mugg, J.; Serrano, A.; Liberti, A.; Rice, M.A. Aquaculture Effluents: A Guide for Water Quality Regulators and Aquaculturists; NRCA Publication, University of Massachusetts Dartmouth: North Dartmouth, MA, USA, 2000. [Google Scholar]
  10. Boyd, C.E. Guidelines for aquaculture effluent management at the farm-level. Aquaculture 2003, 226, 101–112. [Google Scholar] [CrossRef]
  11. Rijn, J.V. The potential for integrated biological treatment systems in recirculating fish culture—A review. Aquaculture 1996, 139, 181–201. [Google Scholar] [CrossRef]
  12. Jones, A.B.; Dennison, W.C.; Preston, N.P. Integrated treatment of shrimp effluent by sedimentation, oyster filtration and macroalgal absorption: A laboratory scale study. Aquaculture 2001, 193, 155–178. [Google Scholar] [CrossRef]
  13. Devi, I.R.P.; Gowri, V.S. Biological Treatment of Aquaculture Discharge Waters by Seaweeds. J. Ind. Pollut. Control 2007, 23, 135–140. [Google Scholar]
  14. Lobban, C.S.; Harrison, P.J. Seaweed Ecology and Physiology; Cambridge University Press: Cambridge, UK, 1994; pp. 163–240. [Google Scholar]
  15. Paul, N.A.; De Nys, R. Promise and pitfalls of locally abundant sea-weeds as biofilters for integrated aquaculture. Aquaculture 2008, 281, 49–55. [Google Scholar] [CrossRef]
  16. Guo, H.; Yao, J.; Sun, Z.; Duan, D. Effects of salinity and nutrients on the growth and chlorophyll fluorescence of Caulerpa lentillifera. Chin. J. Oceanol. Limnol. 2015, 33, 410–418. [Google Scholar] [CrossRef]
  17. Liu, H.; Wang, F.; Wang, Q.; Dong, S.; Tian, X. A comparative study of the nutrient uptake and growth capacities of seaweeds Caulerpa lentillifera and Gracilaria lichenoides. J. Appl. Phycol. 2016, 28, 3083–3089. [Google Scholar] [CrossRef]
  18. Manríquez-Hernández, J.A.; Duston, J.; Garbary, D.J. Effect of irradiance on bioremediation capacity of the red algae Chondrus crispus and Palmaria palmata. Aquac. Int. 2016, 24, 39–55. [Google Scholar] [CrossRef]
  19. Wedchaparn, O.; Ayisi, C.L.; Huo, Y.; He, P. Effects of different light intensity fluctuations on growth Rate, Nutrient Uptake and Photosynthetic Efficiency of Gracilaria asiatica. J. Fish. Aquat. Sci. 2015, 10, 533–542. [Google Scholar]
  20. Manríquez-Hernández, J.A. Interaction of Irradiance and Stocking Density on Nutrient Uptake by Red Macroalgae. Implications for Bioremediation of Fish Farm Effluents. Master’s Thesis, Dalhousie University Halifax, Halifax, NS, Canada, 2013. [Google Scholar]
  21. Barr, N.G.; Kloeppel, A.; Rees, T.A.V.; Scherer, C.; Taylor, R.B.; Wenzel, A. Wave surge increases rates of growth and nutrient uptake in the green seaweed Ulva pertusa maintained at low bulk flow velocities. Aquat. Biol. 2008, 3, 179–186. [Google Scholar] [CrossRef]
  22. Caines, S.; Manríquez-Hernández, J.A.; Duston, J.; Corey, P.; Garbary, D.J. Intermittent aeration affects the bioremediation potential of two red algae cultured in finfish effluent. J. Appl. Phycol. 2014, 26, 2173–2181. [Google Scholar] [CrossRef]
  23. Msuya, F.E.; Neori, A. Effect of water aeration and nutrient load level on biomass yield, N uptake and protein content of the seaweed Ulva lactuca cultured in seawater tanks. J. Appl. Phycol. 2008, 20, 1021–1031. [Google Scholar] [CrossRef]
  24. Lapointe, B.E.; Tenore, K.R. Experimental outdoor studies with Ulva fasciata Delile. I. Interaction of light and nitrogen on nutrient uptake, growth, and biochemical composition. J. Exp. Mar. Biol. Ecol. 1981, 53, 135–152. [Google Scholar] [CrossRef]
  25. Fong, P.; Boyer, K.E.; Desmond, J.S.; Zedler, J.B. Salinity stress, nitrogen competition, and facilitation: What controls seasonal succession of two opportunistic green macroalgae? J. Exp. Mar. Biol. Ecol. 1996, 206, 203–221. [Google Scholar] [CrossRef]
  26. Choi, T.S.; Kang, E.J.; Kim, J.H.; Kim, K.Y. Effect of salinity on growth and nutrient uptake of Ulva pertusa (Chlorophyta) from an eelgrass bed. Algae 2010, 25, 17–26. [Google Scholar] [CrossRef]
  27. Msuya, F. Effects of stocking density and additional nutrients on growth of the commercially farmed seaweeds Eucheuma denticulatum and Kappaphycus alvarezii in Zanzibar Tanzania. TaJONAS 2013, 4, 605–612. [Google Scholar]
  28. Macchiavello, J.; Bulboa, C. Nutrient uptake efficiency of Gracilaria chilensis and Ulva lactuca in an IMTA system with the red abalone Haliotis rufescens. Lat. Am. J. Aquat. Res. 2014, 42, 523–533. [Google Scholar] [CrossRef]
  29. Madsen, J.D.; Chambers, P.A.; James, W.F.; Koch, E.W.; Westlake, D.F. The interaction between water movement, sediment dynamics and submersed macrophytes. Hydrobiologia 2001, 444, 71–84. [Google Scholar] [CrossRef]
  30. Ratana-Arporn, P.; Chirapart, A. Nutritional Evaluation of Tropical Green Seaweeds Caulerpa lentillifera and Ulva reticulata. Kasetsart J. (Nat. Sci.) 2006, 181, 97–106. [Google Scholar]
  31. Paul, N.A.; Neveux, N.; Magnusson, M.; de Nys, R. Comparative production and nutritional value of “sea grapes” the tropical green seaweeds Caulerpa lentillifera and C. racemosa. J. Appl. Phycol. 2014, 26, 1833–1844. [Google Scholar] [CrossRef]
  32. Rabia, M.D.S. Cultivation of Caulerpa lentillifera Using Tray and Sowing Methods in Brackishwater Pond. Environ. Sci. 2016, 4, 23–29. [Google Scholar] [CrossRef]
  33. McHugh, D.J. A Guide to the Seaweed Industry; Food and Agriculture Organization of United Nations: Rome, Italy, 2003. [Google Scholar]
  34. Chokwiwattanawanit, A. Efficiency of the Macroalgae Caulerpa lentillifera and Acanthophora spicifera for the Treatment of Nitrogen Compound from Shrimp Pond Effluent. Master’s Thesis, Environmental Science, Graduate School, Chulalongkorn University, Bangkok, Thailand, 2000. [Google Scholar]
  35. Pariyawathee, S.; Songsangjinda, P.; Deraxbudsarakom, S.; Tuntichodok, P.; Chiayvareesajja, S. Optimum condition of environmental factors for growth of sea grape (Caulerpa lentillifera: J. Agardh). Thai Fish Gaz 2003, 56, 443–448. (In Thai) [Google Scholar]
  36. Ghosh, A.; Mahapatra, B.K.; Datta, N.C. Ornamental fish farming - successful small-scale business in India. Aquacult. Asia 2003, 8, 14–16. [Google Scholar]
  37. Gonzalez, R.J.; Cooper, J.; Head, D. Physiological responses to hyper-saline waters in sailfin mollies (Poecilia latipinna). Comp. Biochem. Physiol. Mol. Integr. Physiol. 2005, 142, 397–403. [Google Scholar] [CrossRef] [PubMed]
  38. Nordlie, F.G.; Haney, D.C.; Walsh, S.J. Comparisons of salinity tolerances and osmotic regulatory capabilities in populations of sailfin molly (Poecilia latipinna) from brackish and fresh waters. Copeia 1992, 741–746. [Google Scholar] [CrossRef]
  39. Chen, W.Y.C.K.T. Salinity-dependent expression of the branchial Na + / K + / 2Cl2 cotransporter and Na + / K + ATPase in the sailfin molly correlates with hypoosmoregulatory endurance. J. Comp. Physiol. B 2011, 181, 953–964. [Google Scholar]
  40. APHA. Standard Methods for the Examination of Water and Wastewater, 21st ed.; American Public Health Association/American Water Works Association/Water Environment Federation: Washington, DC, USA, 2005. [Google Scholar]
  41. The Ministry of Natural Resources and Environment, Thailand. Coastal Aquaculture Effluent Standard in Thailand. B.E. 2004, 121, 2547. [Google Scholar]
  42. Kang, Y.H.; Shin, J.A.; Kim, M.S.; Chung, I.K. A preliminary study of the bioremediation potential of Codium fragile applied to seaweed integrated multi-trophic aquaculture (IMTA) during the summer. J. Appl. Phycol. 2008, 20, 183–190. [Google Scholar] [CrossRef]
  43. Kang, Y.H.; Park, S.R.; Chung, I.K. Biofiltration efficiency and biochemical composition of three seaweed species cultivated in a fish-seaweed integrated culture. Algae 2011, 26, 97–108. [Google Scholar]
  44. Tremblay-Gratton, A.; Boussin, J.C.; Tamigneaux, É.; Vandenberg, G.W.; Le François, N.R. Bioremediation efficiency of Palmaria palmata and Ulva lactuca for use in a fully recirculated cold-seawater naturalistic exhibit: Effect of high NO3 and PO4 concentrations and temperature on growth and nutrient uptake. J. Appl. Phycol. 2018, 30, 1295–1304. [Google Scholar] [CrossRef]
  45. Tsusaka, T.W.; Msere, H.W.; Gondwe, L.; Madzonga, O.; Clarke, S.; Siambi, M. Assessing the Post-harvest Constraints in Smallholders’ Groundnut Production: A Survey in Central Malawi. Res. J. Agric. Sci. 2016, 6, 213–226. [Google Scholar]
  46. Tsusaka, T.W.; Otsuka, K. The changing effects of agro-climate on cereal crop yields during the green revolution in India, 1972 to 2002. J. Sustain. Dev. 2013, 6, 11–36. [Google Scholar] [CrossRef]
  47. Tsusaka, T.W.; Otsuka, K. The changes in the effects of temperature and rainfall on cereal crop yields in sub-saharan africa, a country level panel data study, 1989 to 2004. Environ. Econ. 2013, 4, 70–80. [Google Scholar]
  48. Seetha, A.; Tsusaka, T.W.; Munthali, T.W.; Musukwa, M.; Mwangwela, A.; Kalumikiza, Z.; Manani, T.; Kachulu, L.; Kumwenda, N.; Musoke, M.; et al. How immediate and significant is the outcome of training on diversified diets, hygiene and food safety? An effort to mitigate child undernutrition in rural Malawi. Public Health Nutr. 2018, 21, 1156–1166. [Google Scholar] [CrossRef] [Green Version]
  49. Vossler, C.A. Panel Data with Serial Correlation (38862) 2012. Available online: https://mpra.ub.uni-muenchen.de/38862/1/MPRA_paper_38862.pdf (accessed on 15 June 2018).
  50. StataCorp. Stata: Release 15. Statistical Software; StataCorp LLC: College Station, TX, USA, 2017. [Google Scholar]
  51. Matos, J.; Costa, S.; Rodrigues, A.; Pereira, R.; Sousa Pinto, I. Experimental integrated aquaculture of fish and red seaweeds in Northern Portugal. Aquaculture 2006, 252, 31–42. [Google Scholar] [CrossRef]
  52. Prathumchai, N.; Polprasert, C.; Englande, A.J. Phosphorus leakage from fisheries sector. A case study in Thailand. Environ. Pollut. 2016, 219, 967–975. [Google Scholar] [CrossRef]
  53. UN-Water, Consolidated Technical Input from UN Agencies on Water and Sanitation Related Indicators. 2015. Available online: https://sustainabledevelopment.un.org/content/documents/2076Consolidated%20Technical%20inputs.pdf (accessed on 21 April 2019).
Figure 1. Changes over time in concentrations of nitrite (NO2) (A), nitrate (NO3) (B), ammonia (NH3) (C), and phosphate (PO43− ) (D) with Caulerpa lentillifera at five macroalgal density levels, 30 ppt salinity, without aeration. The error bars indicate standard deviations. n = 3.
Processes 07 00303 g001
Figure 2. Nutrient uptake efficiency (NUE) for nitrite (NO2), nitrate (NO3), ammonia (NH3), and phosphate (PO43) with Caulerpa lentillifera at five macroalgal density levels, 30 ppt salinity, without aeration. The error bars indicate standard deviations. n = 3
Processes 07 00303 g002
Figure 3. Changes over time in concentrations of nitrite (NO2) (A), nitrate (NO3) (B), ammonia (NH3) (C), and phosphate (PO43−) (D) at three salinity levels with and without aeration at 30 g/L Caulerpa lentillifera density. The error bars indicate standard deviations. n = 3.
Processes 07 00303 g003
Figure 4. NUE of nitrite (NO2) (A), nitrate (NO3) (B), ammonia (NH3) (C), and phosphate (PO43) (D) at three salinity levels with and without aeration with 30 g/L Caulerpa lentillifera density. The error bars indicate standard deviations. n = 3.
Processes 07 00303 g004
Table 1. ANOVA for different macroalgal density and salinity levels and two-sample t test for aeration.
NutrientMacroalgal DensitySalinityAeration
20 ppt Salinity30 ppt Salinity40 ppt Salinity
F Statistic
(df, df)
p ValueF Statistic
(df, df)
p Valuet Statistic
(df)
p Valuet Statistic
(df)
p Valuet Statistic
(df)
p Value
NO2−49.445
(4, 115)
0.000 ***4.714
(2, 69)
0.000 ***2.625
(46)
0.011 **1.082
(46)
0.3610.551
(46)
0.989
NO334.431
(4, 115)
0.000 ***1.919
(2, 69)
0.000 ***−0.655
(46)
0.8930.633
(46)
0.6080.353
(46)
0.591
NH37.453
(4, 115)
0.000 ***5.738
(2, 69)
0.000 ***1.772
(46)
0.5110.851
(46)
0.2451.273
(46)
0.129
PO43−49.445
(4, 115)
0.000 ***12.484
(2, 69)
0.000 ***0.693
(46)
0.941−0.020
(46)
0.4830.892
(46)
0.087*
Independent variables: macroalgal density (10 g/L, 20 g/L, 30 g/L, 40 g/L, and 50 g/L), salinity (20 ppt, 30 ppt, and 40 ppt), aeration (with, without). Dependent variable: NUE (%); df = degree of freedom. The t test on aeration pertains to NUE with aeration minus NUE without aeration. Thus, a positive t statistic is linked to larger NUE with aeration. ***, **, and * indicate p < 0.01, < 0.05, and < 0.10, respectively.
Table 2. Tukey’s HSD (honesty significant difference) test results for five different macroalgal density levels.
Macroalgal DensityMean Difference
(p Value)
NO2NO3NH3PO43−
10 g/L20 g/L−12.623 *−11.930 **−6.697−0.441
(0.052)(0.040)(0.725)(1.000)
30 g/L−50.237 ***−55.618 ***−36.917 ***−0.506
(0.000)(0.000)(0.000)(1.000)
40 g/L−30.209 ***−20.047 ***−69.377 ***48.751 ***
(0.000)(0.000)(0.000)(0.000)
50 g/L−19.542 ***−18.030 ***−26.623 ***84.751 ***
(0.000)(0.000)(0.000)(0.000)
20 g/L30 g/L−37.613 ***−43.687 ***−29.949 ***−0.065
(0.000)(0.000)(0.000)(1.000)
40 g/L−17.585 ***−8.116−62.409***49.192 ***
(0.002)(0.302)(0.000)(0.000)
50 g/L−6.918−6.099−19.655 ***85.192 ***
(0.557)(0.592)(0.006)(0.000)
30 g/L40 g/L20.028 ***35.571 ***−32.460***49.258 ***
(0.000)(0.000)(0.000)(0.000)
50 g/L30.695 ***37.588 ***10.293085.258 ***
(0.000)(0.000)(0.356)(0.000)
40 g/L50 g/L10.666
(0.142)
2.016
(0.989)
42.754 ***
(0.000)
35.999 ***
(0.000)
Dependent variable: NUE (%). ***, **, and * indicate p < 0.01, < 0.05, and < 0.10, respectively.
Table 3. Tukey’s HSD results across three different salinity levels.
Salinity (ppt)Mean Difference in Nutrient Uptake Efficiency (NUE) (%)
(p Value)
NO2NO3NH3PO43−
2030−21.252 ***−24.943 ***−10.854 *−24.157 ***
(0.003)(0.000)(0.056)(0.002)
40−3.100−0.7734.3648.269
(0.871)(0.989)(0.615)(0.442)
304018.152 **24.170 ***15.218 ***32.427 ***
(0.012)(0.000)(0.004)(0.000)
***, **, and * indicate p < 0.01, < 0.05, and < 0.10, respectively.
Table 4. Regression results on the determinants of nutrient uptake by Caulerpa lentillifera.
Explanatory VariableEstimated Coefficients (p-Value)
NO2NO3NH3PO43−
Random EffectOLS
Robust
Random
Effect
OLS
Robust
Random
Effect
OLS
Robust
Random
Effect
OLS
Robust
Macroalgal Density
(g/L)
3.7873 ***
(0.000)
3.7690 ***
(0.000)
3.9996 ***
(0.000)
4.1216 ***
(0.000)
1.5823 **
(0.024)
1.7576 **
(0.020)
1.6914 ***
(0.008)
1.6931 ***
(0.023)
Macroalgal Density2−0.0590 ***
(0.000)
−0.0587 ***
(0.000)
−0.0616 ***
(0.000)
−0.0636 ***
(0.000)
−0.0143
(0.214)
−0.0172
(0.135)
−0.0422 ***
(0.000)
−0.0422 ***
(0.002)
Salinity
(ppt)
9.4015 ***
(0.000)
9.4348 ***
(0.003)
11.1777 ***
(0.000)
11.9808 ***
(0.001)
14.6871 ***
(0.000)
11.9196 ***
(0.000)
18.3915 ***
(0.000)
18.3613 ***
(0.000)
Salinity2−0.1616 ***
(0.000)
−0.1620 ***
(0.003)
−0.1778 ***
(0.000)
−0.1953 ***
(0.001)
−0.2487 ***
(0.006)
−0.2031 ***
(0.000)
−0.3119 ***
(0.000)
−0.3114 ***
(0.000)
Aeration
(1 = aerated,
0 = not aerated)
5.8334
(0.147)
6.2539
(0.140)
9.2832 *
(0.067)
6.4778
(0.121)
8.1866
(0.168)
4.1534
(0.259)
0.9241
(0.780)
0.8847
(0.795)
Constant−1.4759 ***
(0.000)
−1.4850 ***
(0.003)
−1.8919 ***
(0.000)
−1.9868 ***
(0.001)
−2.0492 ***
(0.000)
−1.6456 ***
(0.001)
−2.1547 ***
(0.000)
−2.1498 ***
(0.000)
Num. of observations257257268268270270261261
Goodness of fitWald χ 2 = 65.64 ***
(p = 0.000)
F-statistic = 12.37 ***
(p = 0.005)
R2 = 0.2148
Wald χ 2 = 65.64 ***
(p = 0.000)
F-statistic = 11.19 ***
(p = 0.0005)
R2 = 0.2597
Wald χ 2 = 31.48 ***
(p = 0.000)
F-statistic = 9.30 ***
(p = 0.008)
R2 = 0.2258
Wald χ 2 = 1648.73 ***
(p = 0.000)
F-statistic = 325.89 ***
(p = 0.000)
R2 = 0.2874
Dependent variable: NUE (%) ***, **, and * indicate p < 0.01, < 0.05, and < 0.10, respectively. Note: OLS = ordinary least squares.
Table 5. Critical values of macroalgal density and salinity and the corresponding predicted maximum uptake.
ParametersRandom EffectOLS Robust *
NO2NO3NH3PO43−NO2NO3NH3PO43−
Critical values of
Macroalgal density (g/L)
31.5833.2550.00 120.0331.4234.3351.12 220.04
Critical values of
Salinity (ppt)
29.0930.6829.5329.4829.1130.6829.3529.48
Predicted NUE (%)56.1060.3398.1675.0556.3867.2351.17 374.66
1 The p-value of the quadratic term of macroalgal density for NH3 was 0.214. We considered it as statistically insignificant and used macroalgal density = 50 g/L, since the effect was found to be positive and linear within the existing data range. 2 The p-value of the quadratic term was 0.135. We treated it as statistically significant in the calculation of the critical value. If we treated it as insignificant, then we would use density = 50 g/L. 3 Assume the effect of macroalgal density was nonlinear. If it were linear, then the predicted maximum NUE would be 100.99% which would mean 100% in practice.

