Determination of Holmquist–Johnson–Cook Constitutive Parameters of Coal: Laboratory Study and Numerical Simulation

School of Emergency Management and Safety Engineering, China University of Mining and Technology (Beijing), Beijing 100083, China
*
Authors to whom correspondence should be addressed.
Processes 2019, 7(6), 386; https://0-doi-org.brum.beds.ac.uk/10.3390/pr7060386
Submission received: 22 April 2019
/
Revised: 16 June 2019
/
Accepted: 17 June 2019
/
Published: 21 June 2019
(This article belongs to the Special Issue Advances in Condition Monitoring, Optimization and Control for Complex Industrial Processes)
Abstract
:The main sensitivity parameters of the Holmquist–Johnson–Cook constitutive model for coal were obtained from a variety of tests such as uniaxial compression, uniaxial cyclic loading, splitting and triaxial compression tests, as well as the indirect derivation equation of a briquette. The mechanical properties of briquettes under dynamic impact were investigated using a split Hopkinson pressure bar experiment. Based on the experimental measurement of the Holmquist–Johnson–Cook constitutive model, the numerical simulation of briquette was performed using ANSYS/LS-DYNA software. A comparison between experimental and simulation results verified the correctness of simulation parameters. This research concluded that the failure of briquette at different impact velocities started from an axial crack in the middle of the coal body, and the sample was swollen to some extent. By the increase of impact velocity, the severity of damage in the coal body was increased, while the size of the coal block was decreased. Moreover, there was good compliance between experimental and simulated stress wave curves in terms of coal sample failure and fracture morphology at different speeds. Finally, the parameters of the validated Holmquist–Johnson–Cook constitutive model were applied to the numerical simulation model of the impact damage of heading face and the process of coal seam damage in the roadway was visually displayed. The obtained results showed that the Holmquist–Johnson–Cook constitutive model parameters suitable for the prominent coal body were of great significance for the improvement and exploration of the occurrence mechanism of coal and rock dynamic disasters.
1. Introduction
China is the largest energy consumer in the world and its main energy resource is coal. With the increase in the depth and intensity of coal mining activities, a variety of coal-rock dynamic disasters such as coal and gas outbursts, rock bursts, and large-scale pressure on stope, have become more serious and safety production problems have also arisen [1,2]. Coal and gas outbursts and rock bursts are common dynamic disasters in coal mine rocks. Due to their sudden and transient vibration and great destructive characteristics, these phenomena often cause serious casualties and resource waste, which seriously restrict the national economic development of China [3].
In order to understand the mechanism of coal rock dynamic disasters such as rock bursts, researchers have recently carried out a large number of experimental studies on the dynamic and static mechanical properties of coal. Xue [4] carried out orthogonal experiments of triaxial stress with CH4 seepage, and a complete stress–strain relationship and the corresponding evolution of volumetric strain and permeability were obtained. Cai [5] carried out multistage uniaxial compression creep tests on lean and raw coal samples and found that in the multistage creep process, the coal samples were first hardened, then weakened, and finally failed due to crack growth. Li’s [6] tests on gas seepage in raw coal under three paths were carried out with a seepage tester under triaxial stress conditions. It was found that the permeability was subjected to the dual influence of stress and damage accumulation.
Currently, split Hopkinson pressure bar (SHPB) technology is widely applied in the investigation of the dynamic mechanical properties of materials [7,8,9]. Zhao [7] used an SHPB system to measure the semi-circular bending of incision and investigated the crack propagation fractal characteristics of coal seams under impact loads. His results showed that the existence of bedding had a significant impact on crack propagation. Feng [8] used SHPB to carry out dynamic load tests on coal samples and analyzed their dynamic and energy consumption characteristics. Li [9] used SHPB to study the impact failure of coal at impact velocities of 4.174–17.652 m/s and investigated the variation of different mechanical parameters such as stress, strain, incident energy, and dissipated energy.
Due to the limitations of experimental methods and equipment, the existing experimental findings on coal impact damage are seriously insufficient, and it is impossible to accurately determine stress and strain changes inside coal rock samples at the impact moment [4,5,6,7,8,9,10]. However, through numerical simulations, the deformation and stress changes of coal during coal and gas outbursts could be visualized [11,12,13,14], and dynamic load tests carried out under limited laboratory conditions were supplemented and improved. The Holmquist–Johnson–Cook (HJC) constitutive model is a concrete constitutive model based on large strain, a high strain rate, and high pressure that was proposed by Holmquist [15]. This constitutive model has been successfully applied to the numerical simulation of dynamic impact damage of concrete, rock, and other materials [16,17,18,19]. Due to the similarity of the mechanical properties and dynamic failure processes of coal and rock, the HJC constitutive model could be used to numerically simulate the impact damage of coal.
Considering the similar mechanical properties of coal rock, ordinary rock, and concrete materials, Xie [20] used the HJC constitutive model to test coal samples. He also used finite element software LS-DYNA (one of the most commonly used explicit simulation software for the numerical simulation of explosion and shock) numerical simulation to demonstrate the SHPB process of coal impact failure at different impact velocities and found that simulation results were consistent with experimental measurements. Li and Wang [21,22] employed the HJC constitutive model to numerically simulate a SHPB experiment and passive confining pressure test of coal using LS-DYNA. The stress waveform of coal rock samples during the impact test, the oscillation of stress waves, and the damage of the test specimen were reproduced, and it was found that simulation results complied well with experimental findings.
Many researchers have provided HJC constitutive model parameters for various concretes, but to the best of our knowledge, no parameter values have been proposed for coal. In the numerical simulation of coal, basic parameters can be directly obtained, and the remaining parameters are generally considered to be the same as concrete model parameters, which decreases the accuracy of numerical simulation results. Therefore, it is essential to understand the mechanism of coal/rock dynamic disasters by studying the dynamic mechanical parameters of coal to propose a systematic method to determine HJC constitutive model parameters for coal outbursts.
In this paper, the parameters of the HJC constitutive model for briquette are studied using experimental and numerical simulation methods. HJC constitutive model parameters for briquette were obtained through a series of experiments. SHPB experiments were carried out and the impact damage of coal was numerically simulated using ANSYS/LS-DYNA software. Numerical simulation results and experimental findings were analyzed to verify the reliability of the HJC constitutive model parameters for briquette. The validated HJC constitutive model parameters were applied to the numerical simulation of the impact damage of tunnel face, and the failure process of coal seam in the roadway was visually displayed. The research findings are of great significance for improving and exploring the mechanism of coal-rock dynamic disasters.
2. Parameters of the HJC Constitutive Model
The HJC constitutive model contains 19 parameters and two additional parameters exist in LS-DYNA software, for a total of 21 parameters [15]. These parameters were divided into five categories: basic parameters, strength parameters, pressure parameters, damage parameters, and software parameters (Table 1).
In order to obtain specific values for the 21 parameters of the coal HJC constitutive model shown in Table 1, uniaxial compression, uniaxial cyclic loading, and splitting and triaxial compression tests were carried out according to previously reported methods [23,24]. Some other parameters could not be obtained because of the limitations of experimental conditions and lack of experimental data. Due to the low sensitivity of some parameters, coal HJC constitutive model parameters could be used for estimating the values [20].
3. Coal Sample Preparation
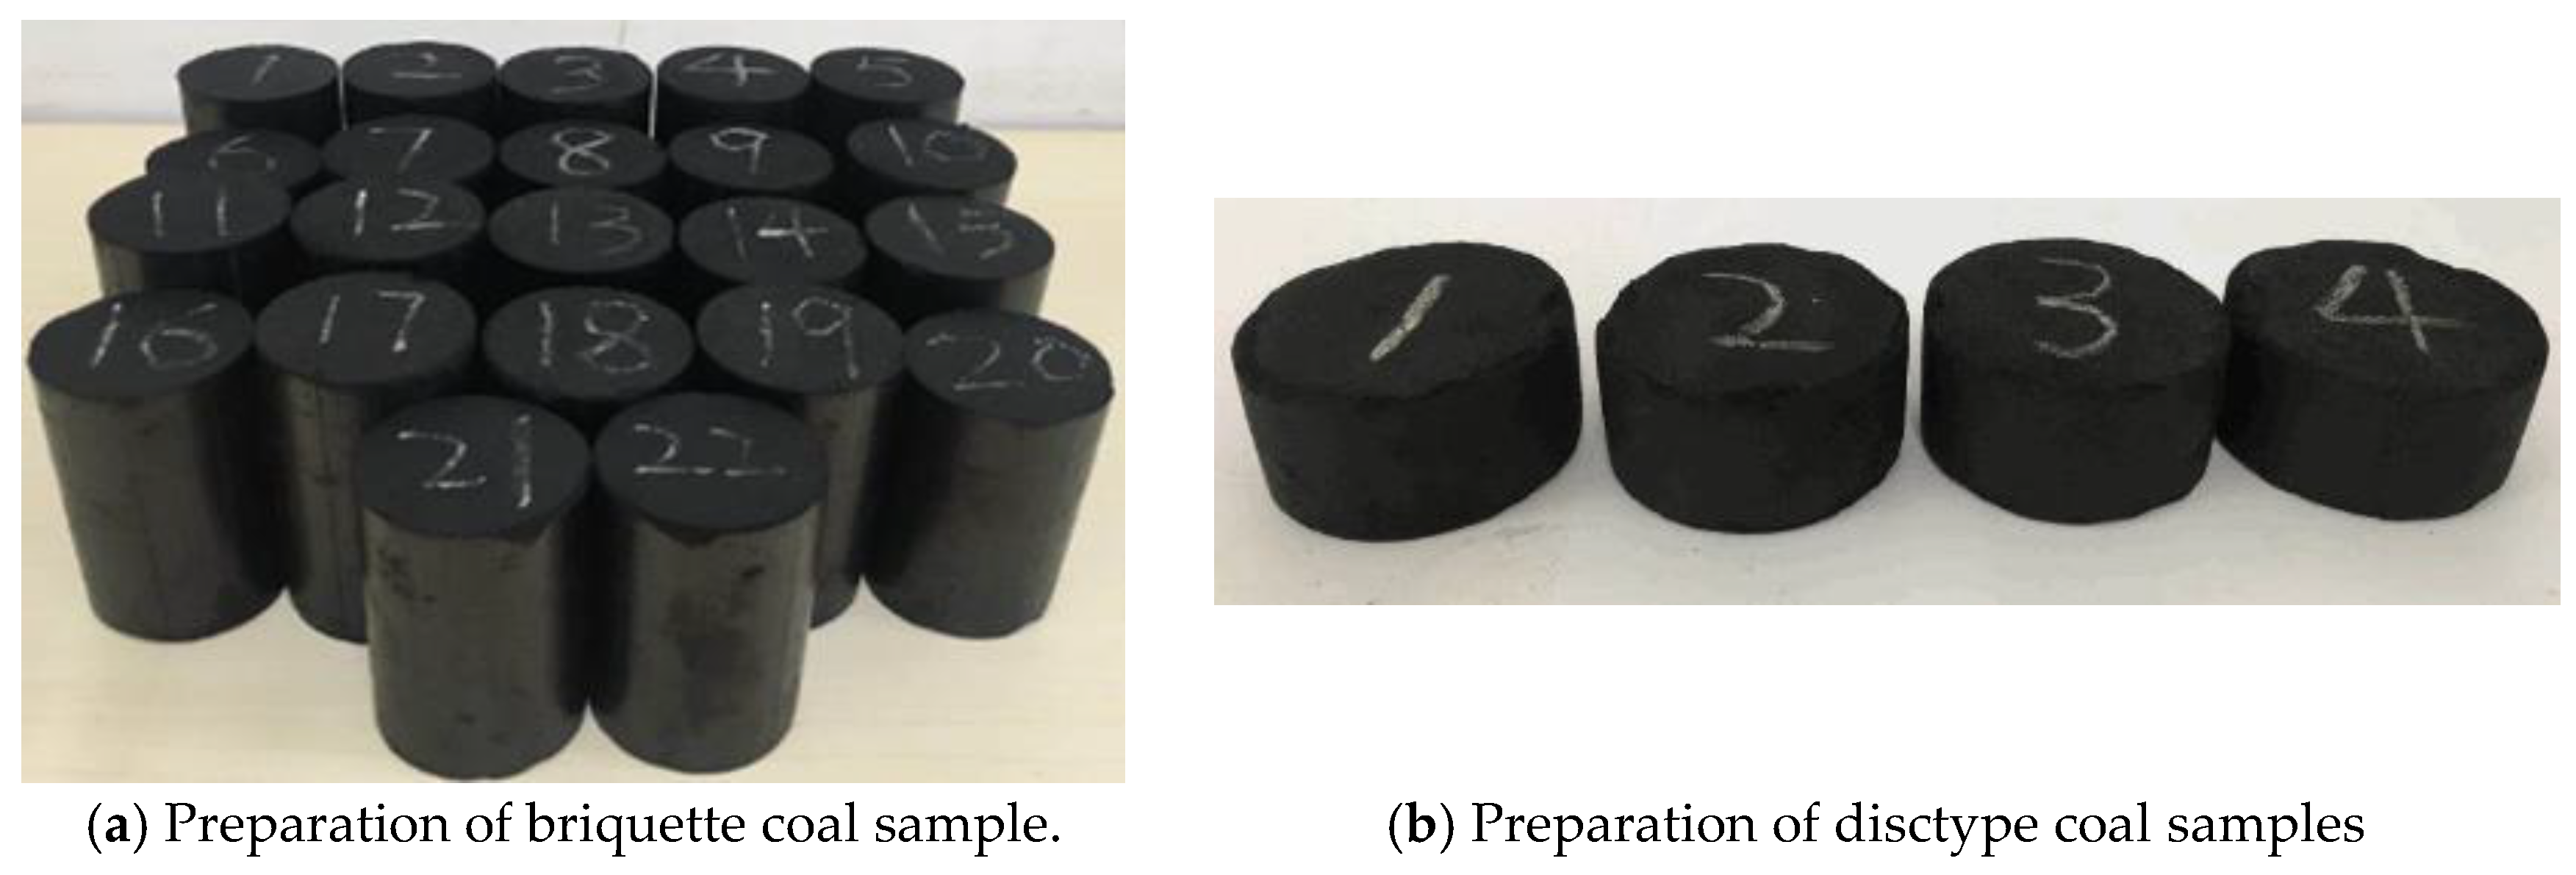
The coal samples used in this research were obtained from Yongcheng Cheji Coal Mine, Henan Province, China, which is an outburst coal seam. The coal samples were high-quality anthracite with ultra-low sulfur, ultra-low phosphorus, medium ash, and high calorific values. The coal moisture Mad was 0.81%, ash content Ad was 11.6%, and total volatile Vdaf was 9.07%. A large-volume coal mass was crushed using a heavy hammer, and the obtained pieces were placed in a ball mill to be pulverized. The pulverized coal sample with particle diameter of 0.25 mm or below was screened out [25]. To achieve the strength required for the experiment, 1000 g pulverized coal and 200 g coal tar were uniformly mixed to prepare coal samples. Standard cylindrical coal samples with a diameter of 50 mm and length of 100 mm as well as disc-shaped coal samples with a diameter of 50 mm and thickness of 25 mm were obtained by pouring the prepared pulverized coal into separate molds and pressing them under a pressure of 250 KN on a WAW-type electro-hydraulic servo press device (Jinan Tianchen Testing Machine Manufacturing Co., Ltd., Licheng District, Jinan City, Shandong Province, China). A total of 22 cylindrical and 4 disc-shaped coal samples were prepared (Figure 1), and the basic parameters of the briquettes were assumed to be as summarized in Table 2 and Table 3.
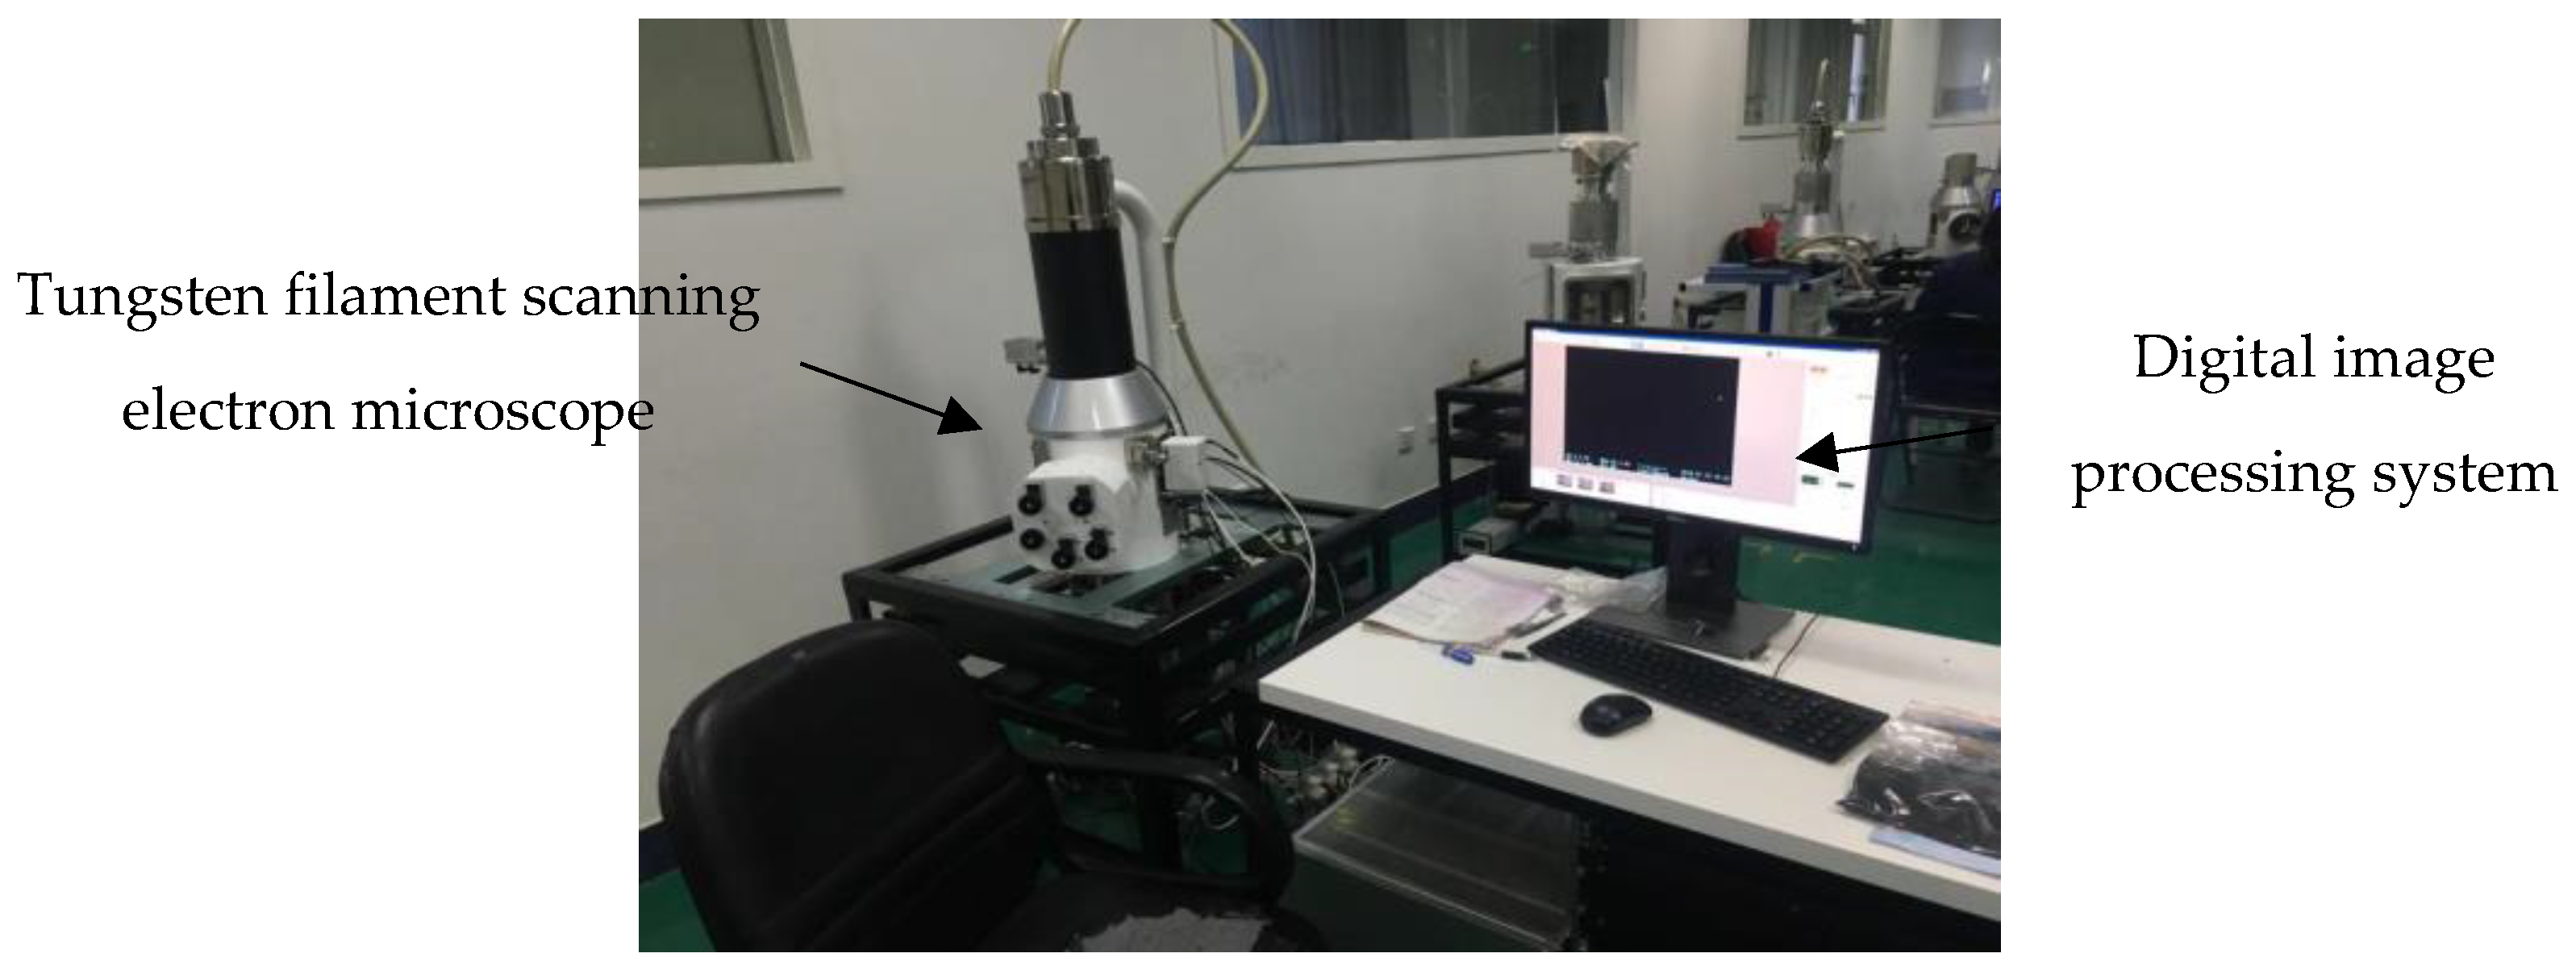
As shown in Figure 2, a compression-mirror analysis was conducted on press-formed briquette samples using a KYKY-EM6200 tungsten filament scanning electron microscope.
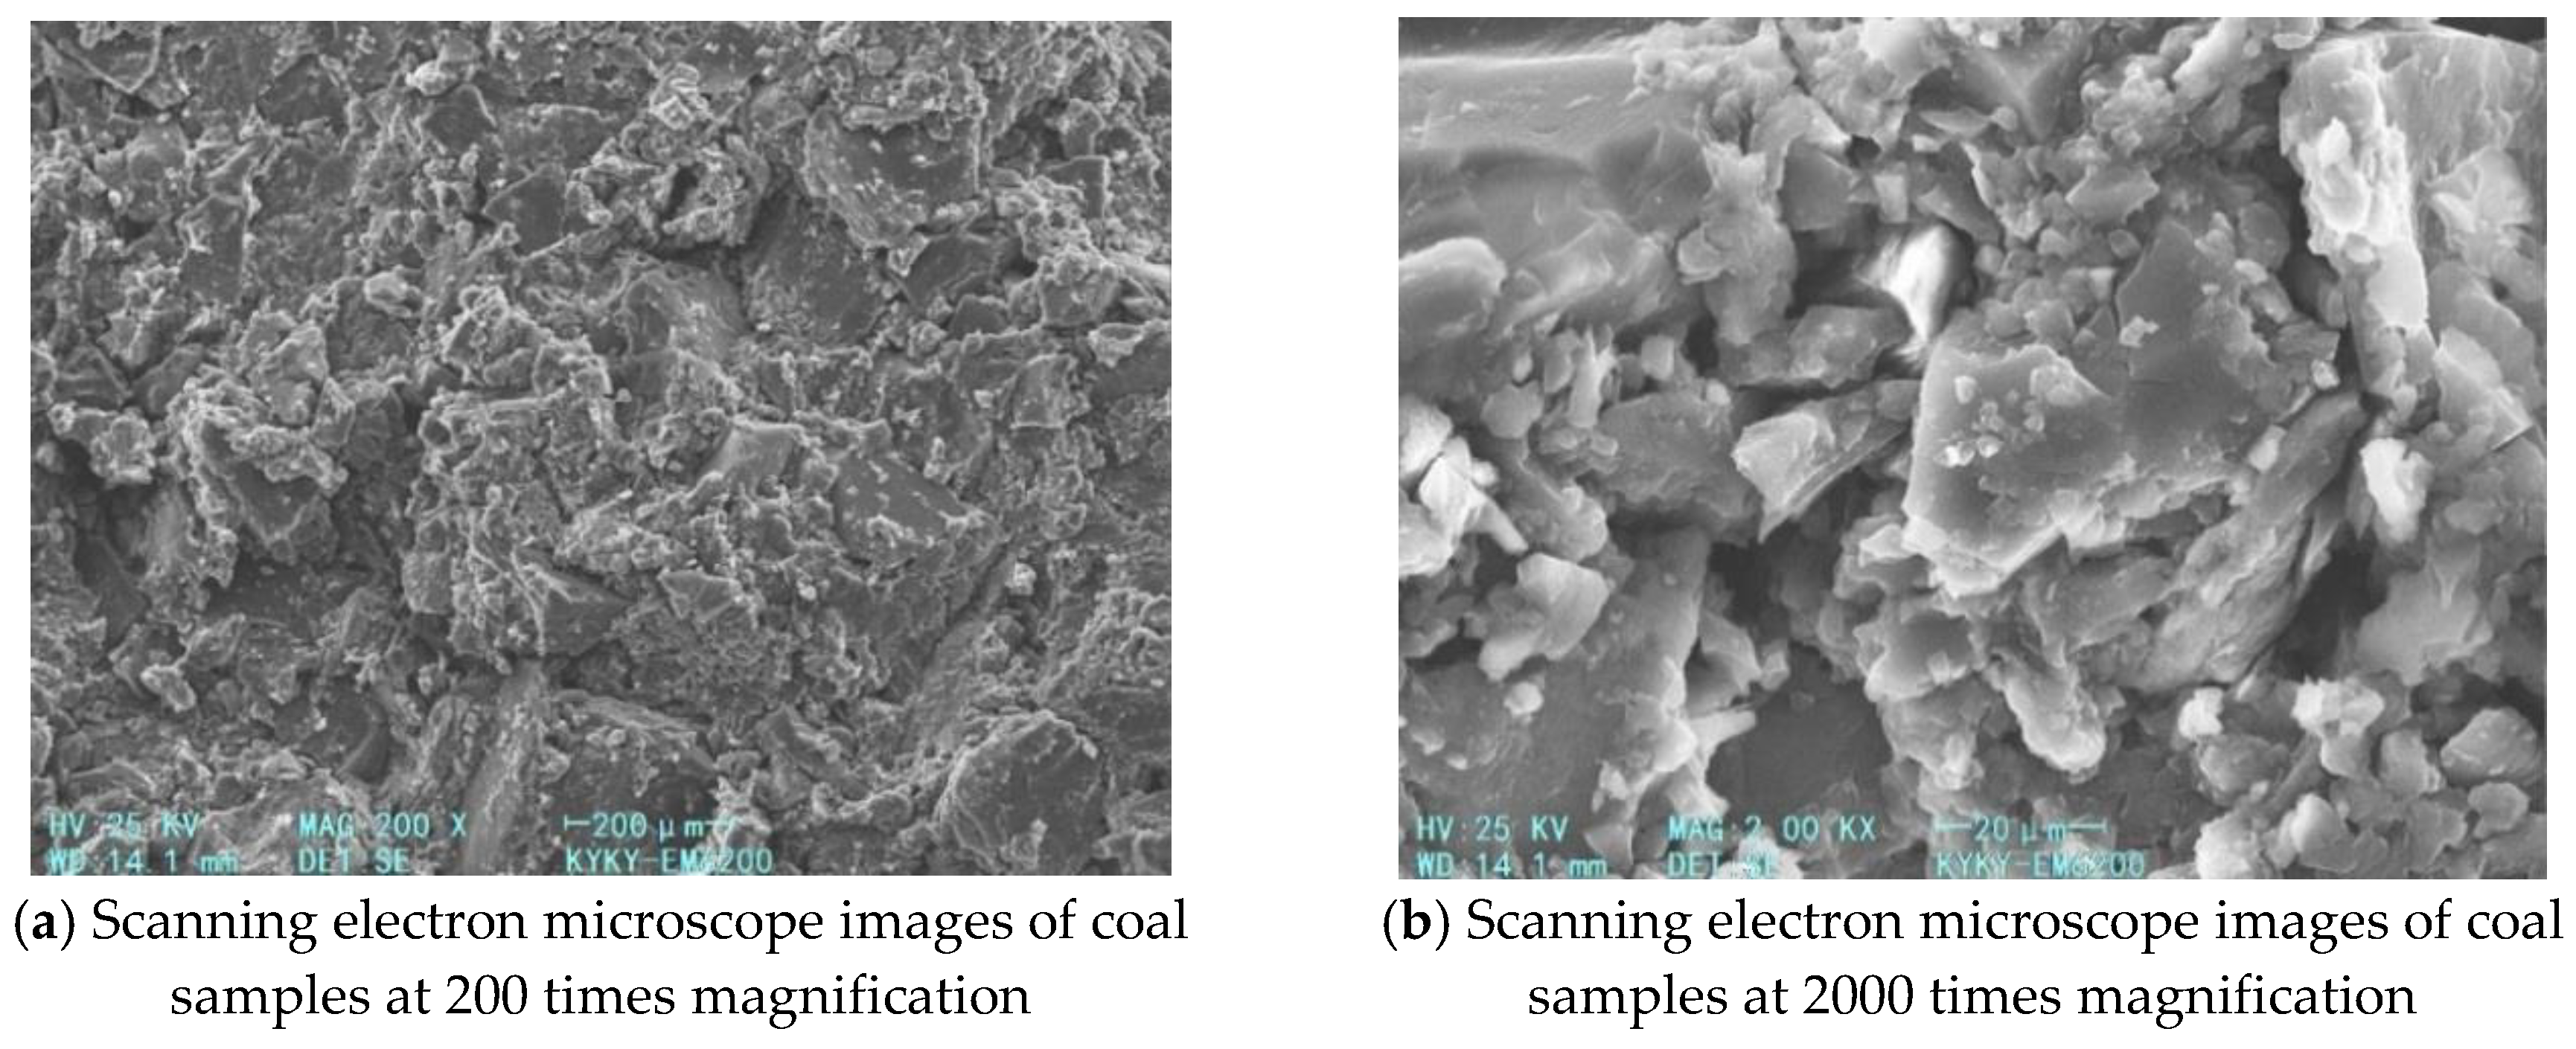
The strength of a briquette sample is closely related to its microstructure. If the gel content of the briquette sample is high, crystal development is enhanced, crystal distribution is more uniform, and briquette sample strength is higher [26]. The microstructure of the prepared briquette can be visually evaluated using scanning electron microscopy, as shown in Figure 3. It can be seen that the microstructure of coal samples had changed from granular to lamellar, and irregularly shaped crystals and gels were evenly distributed throughout the layered structure, indicating that the prepared briquette samples were well cemented, with high uniformity and strength. A large number of on-site experiments have shown that most prominent dangerous coal seams contain soft delamination with severe structural damage [27]. The structural strength of briquette samples conformed to soft stratification properties with high uniformity.
4. Determination of Coal HJC Constitutive Model Parameters
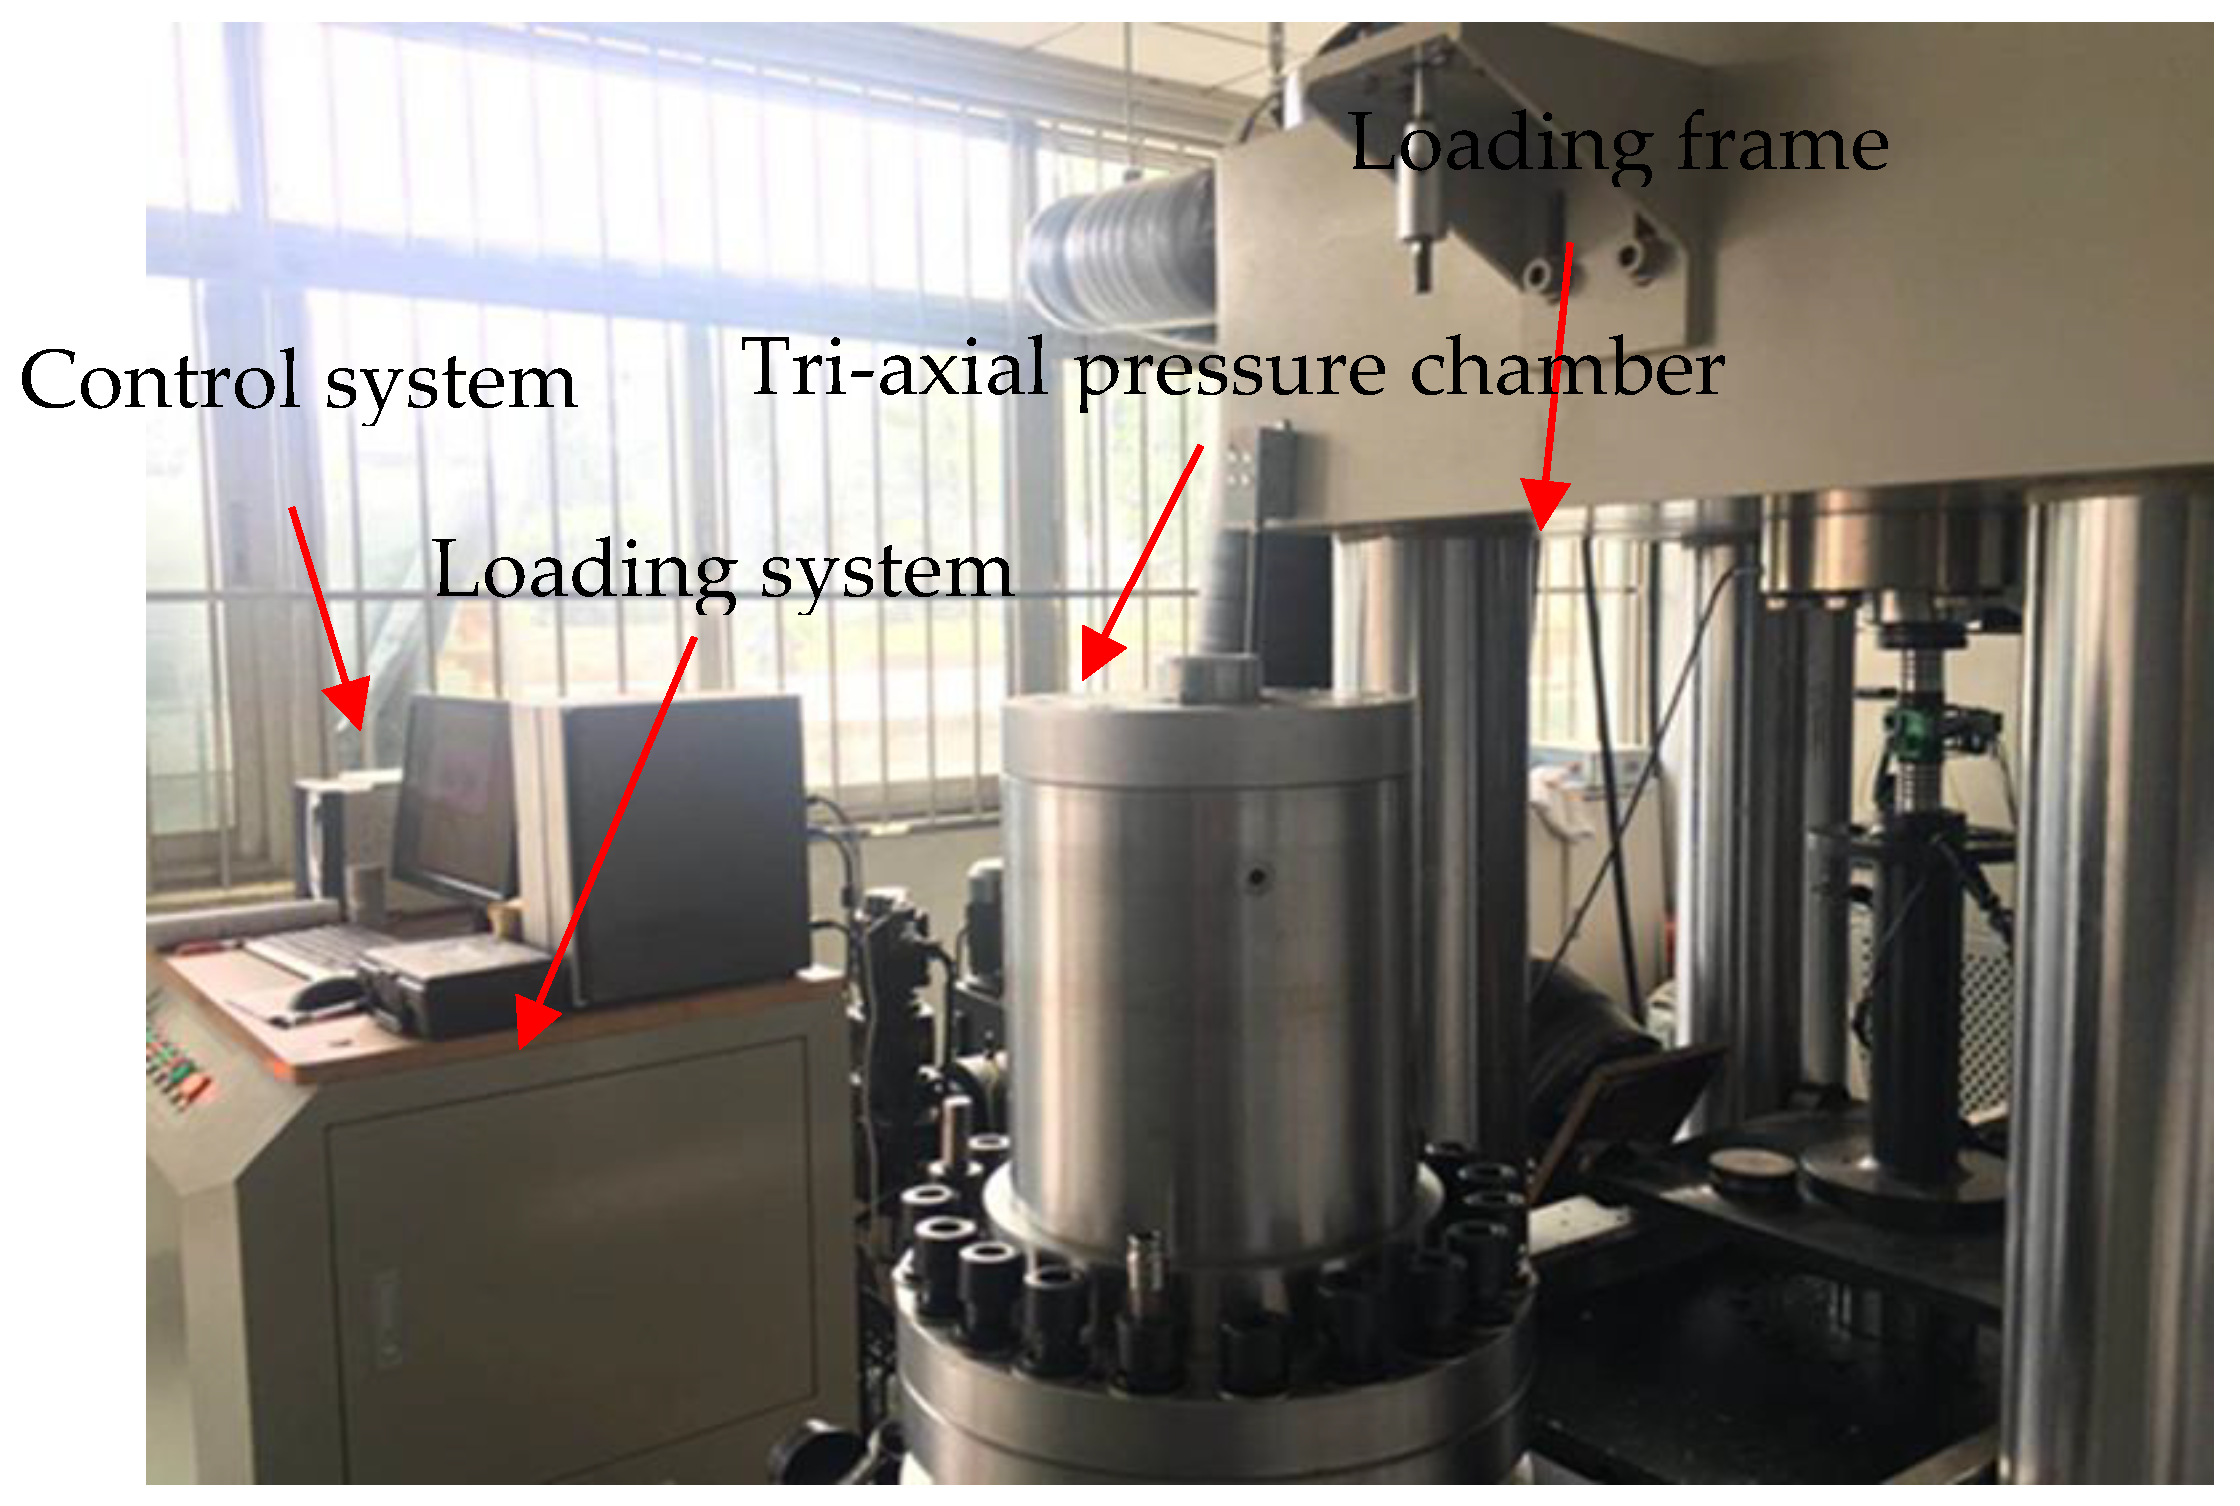
The parameter values of the HJC constitutive model for coal were obtained from experimental tests, equation derivations, and literature references. Uniaxial compression and cyclic loading experiments as well as splitting and triaxial compression tests were performed using a multifunctional three-axis testing machine in the State Key Laboratory of Geotechnical Mechanics and Underground Engineering at the China University of Mining and Technology (Beijing) (Figure 4).
4.1. Determination of the Value of Parameter
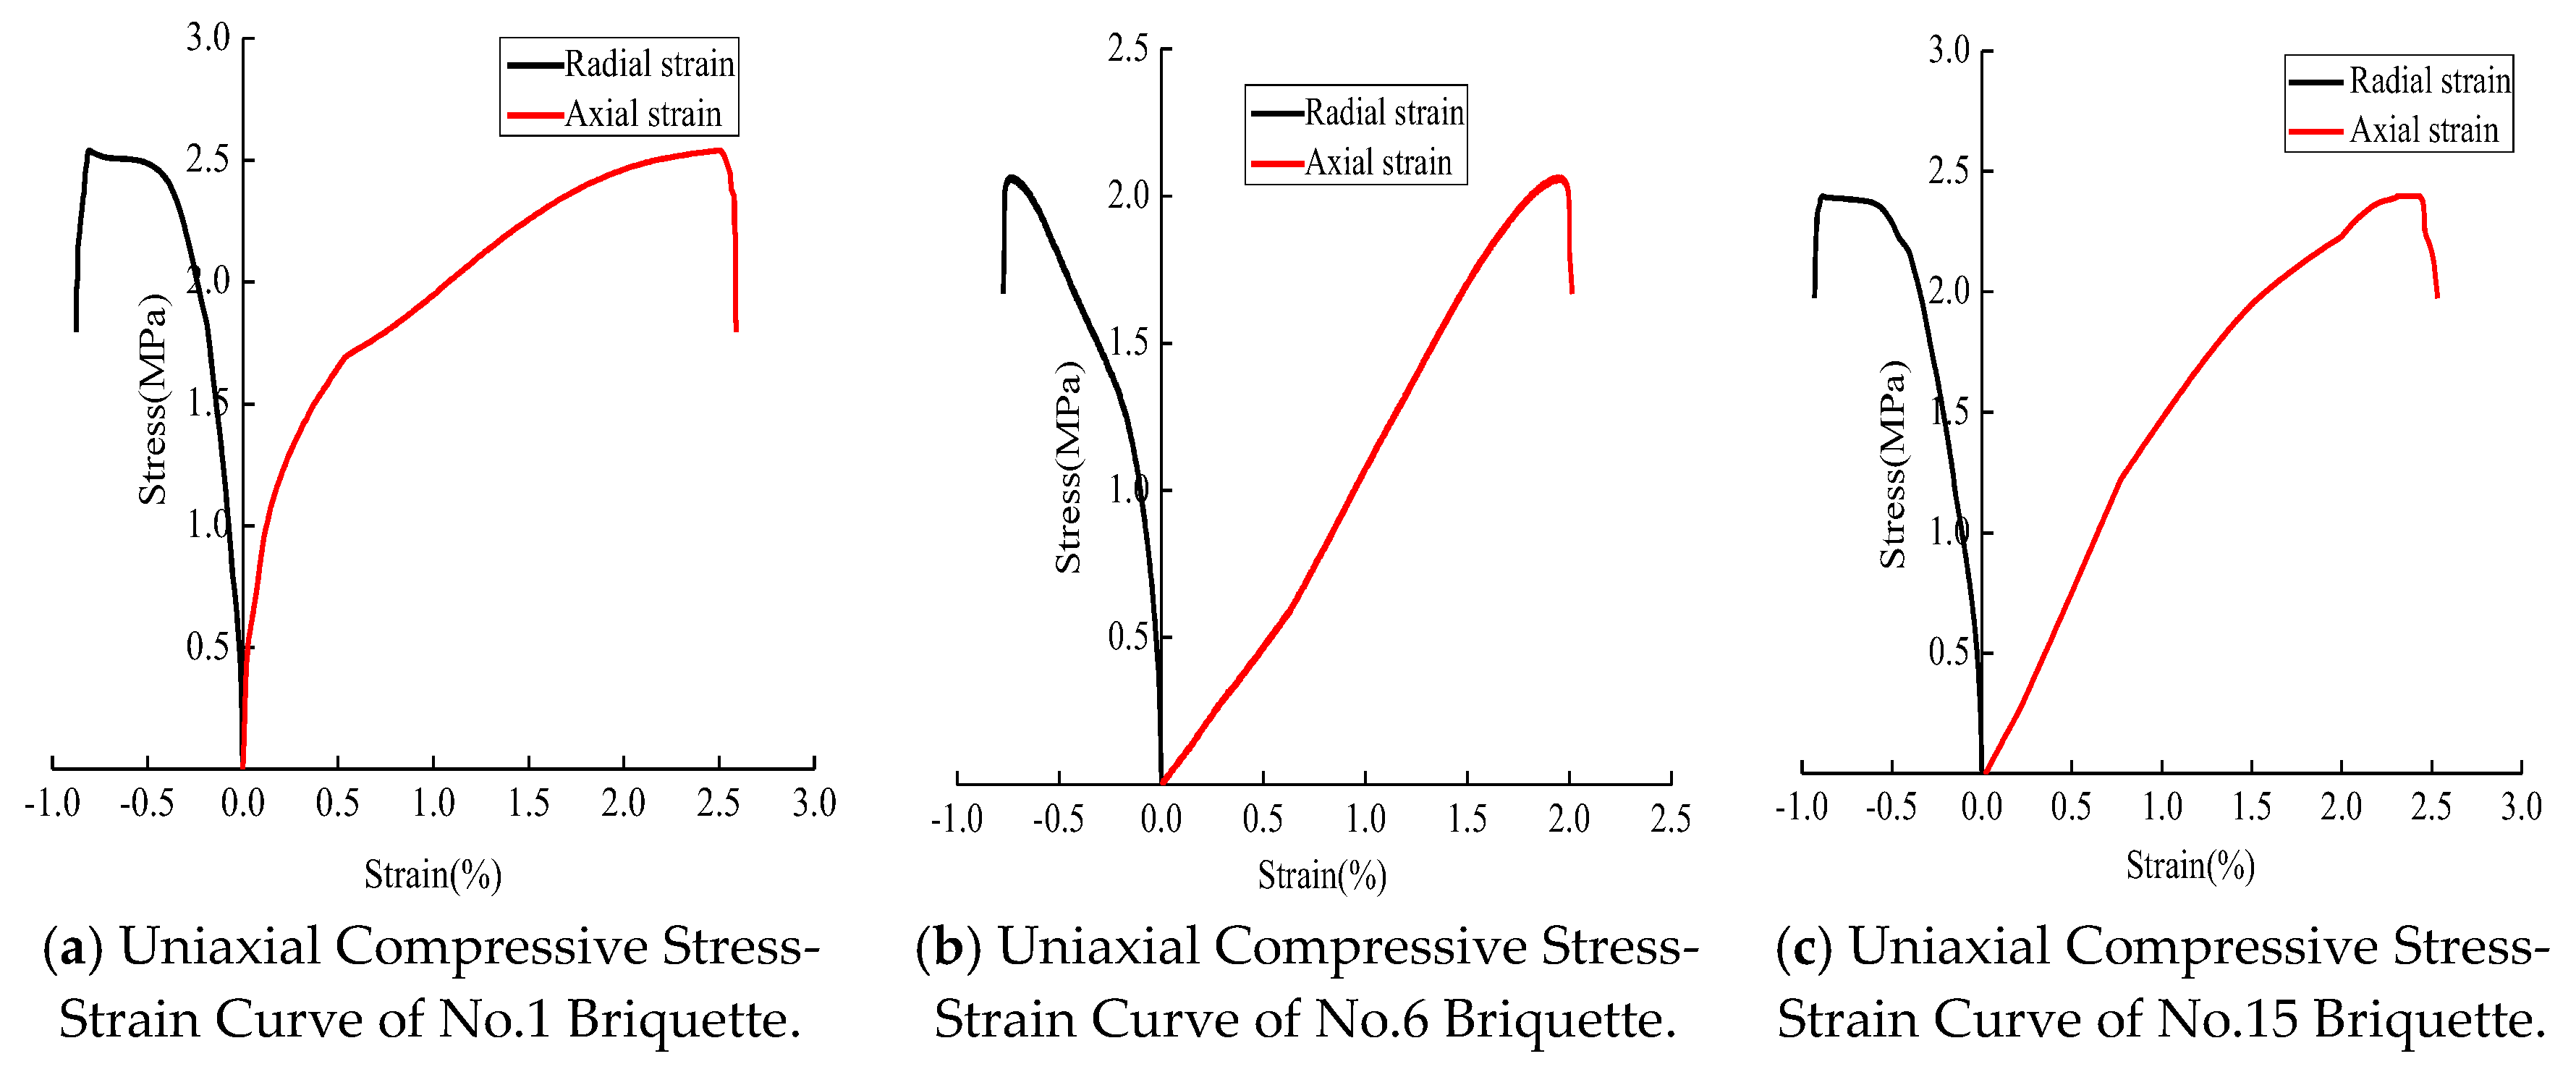
The value of the uniaxial compressive strength parameter was obtained through a uniaxial compression test. Five uniaxial compression tests were carried out, and three sets of effective data were obtained. Based on the obtained data, the stress–strain curves of briquette samples under uniaxial compression were plotted. The curves are shown in Figure 5.
As shown in Table 4, the value of the uniaxial compressive strength parameter of the sample was obtained from the peak point of the stress–strain curve.
According to the experimental results presented in Table 4, the mean value of the three samples was considered as the value of uniaxial compressive strength parameter for the briquette sample, which was 2.33 MPa.
4.2. Determination of the Value of Parameter T
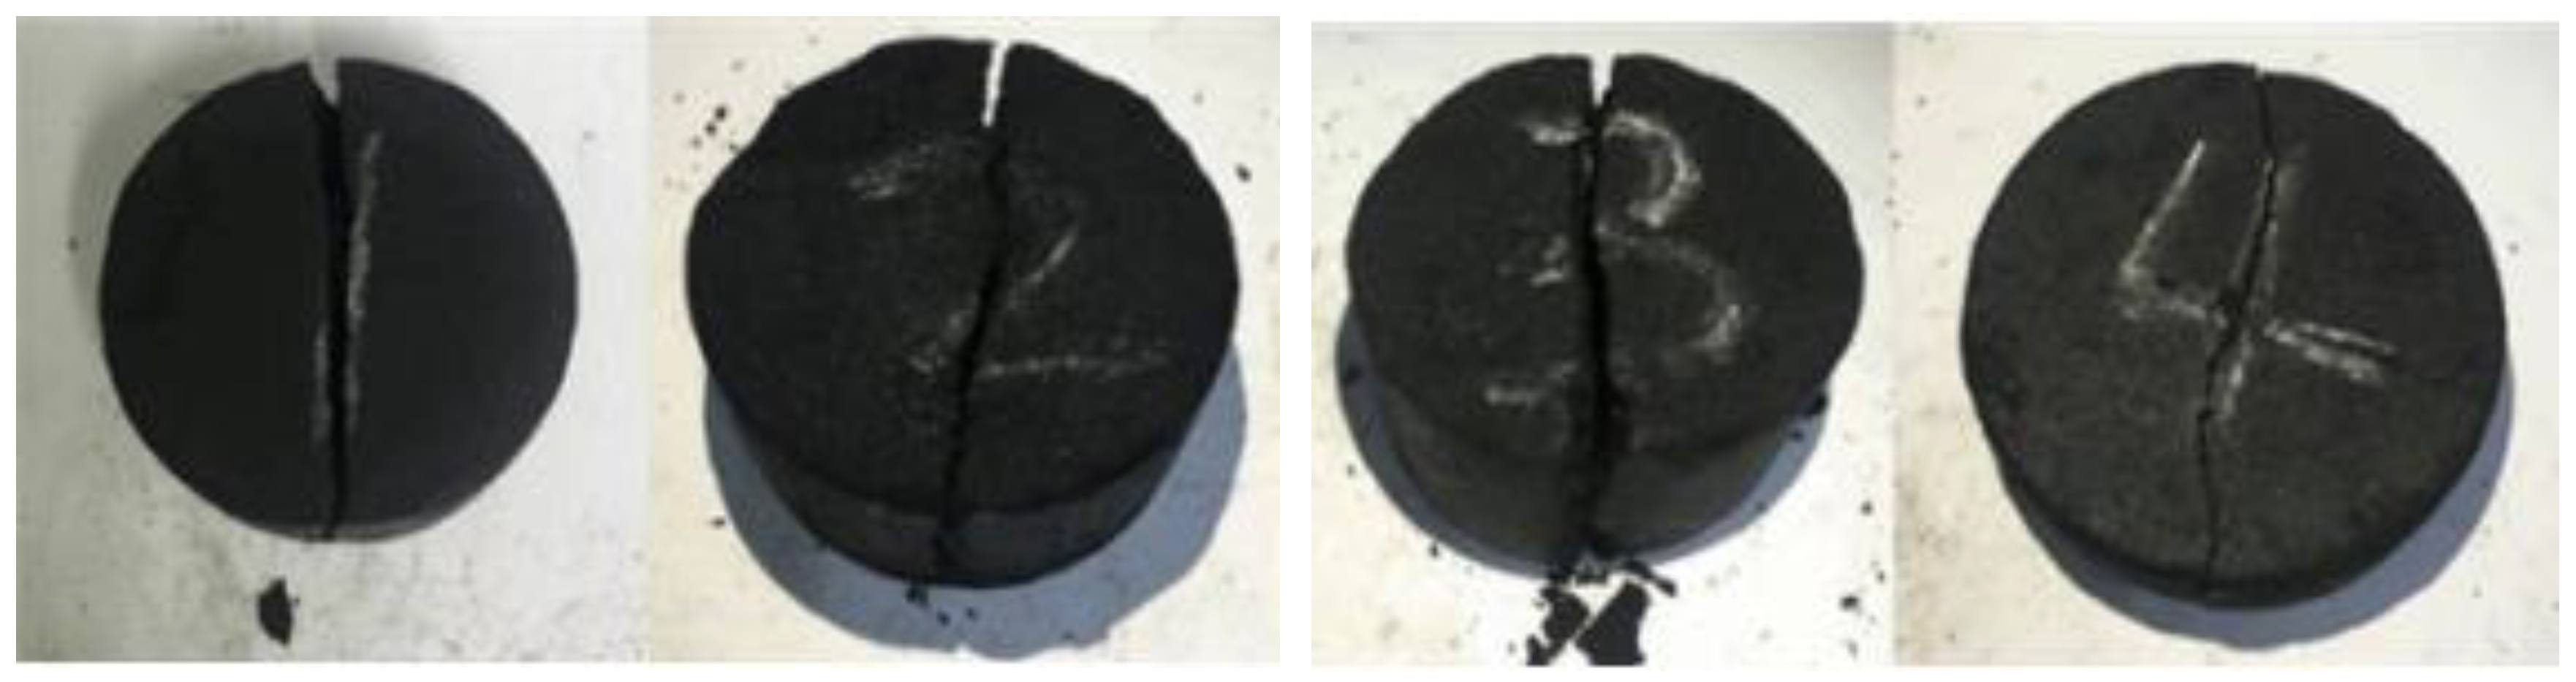
A splitting test was required to obtain the value of the uniaxial tensile strength parameter T. The test equipment used for the splitting of coal samples was the same as that used for the uniaxial compression test. Samples were disc-shaped with a diameter of 50 mm and length of 25 mm. The axial load was applied by displacement control at a rate of 0.05 mm/min. When a crack appeared on the surface of the coal sample, the experiment was finished. Sample damage resulting from the four splitting experiments is shown in Figure 6.
The load P at the failure point of the sample was obtained from the splitting test, and the tensile strength T of the sample was calculated using the equation , where d and h are the diameter and length of the sample, respectively. The values of load P and tensile strength T at the fracture points of different samples are summarized in Table 5.
According to experimental results presented in Table 5, the mean value of the four samples was considered as the tensile strength of briquette sample, which was 0.55 MPa.
4.3. Determination of the Values of Parameters , D1 and D2
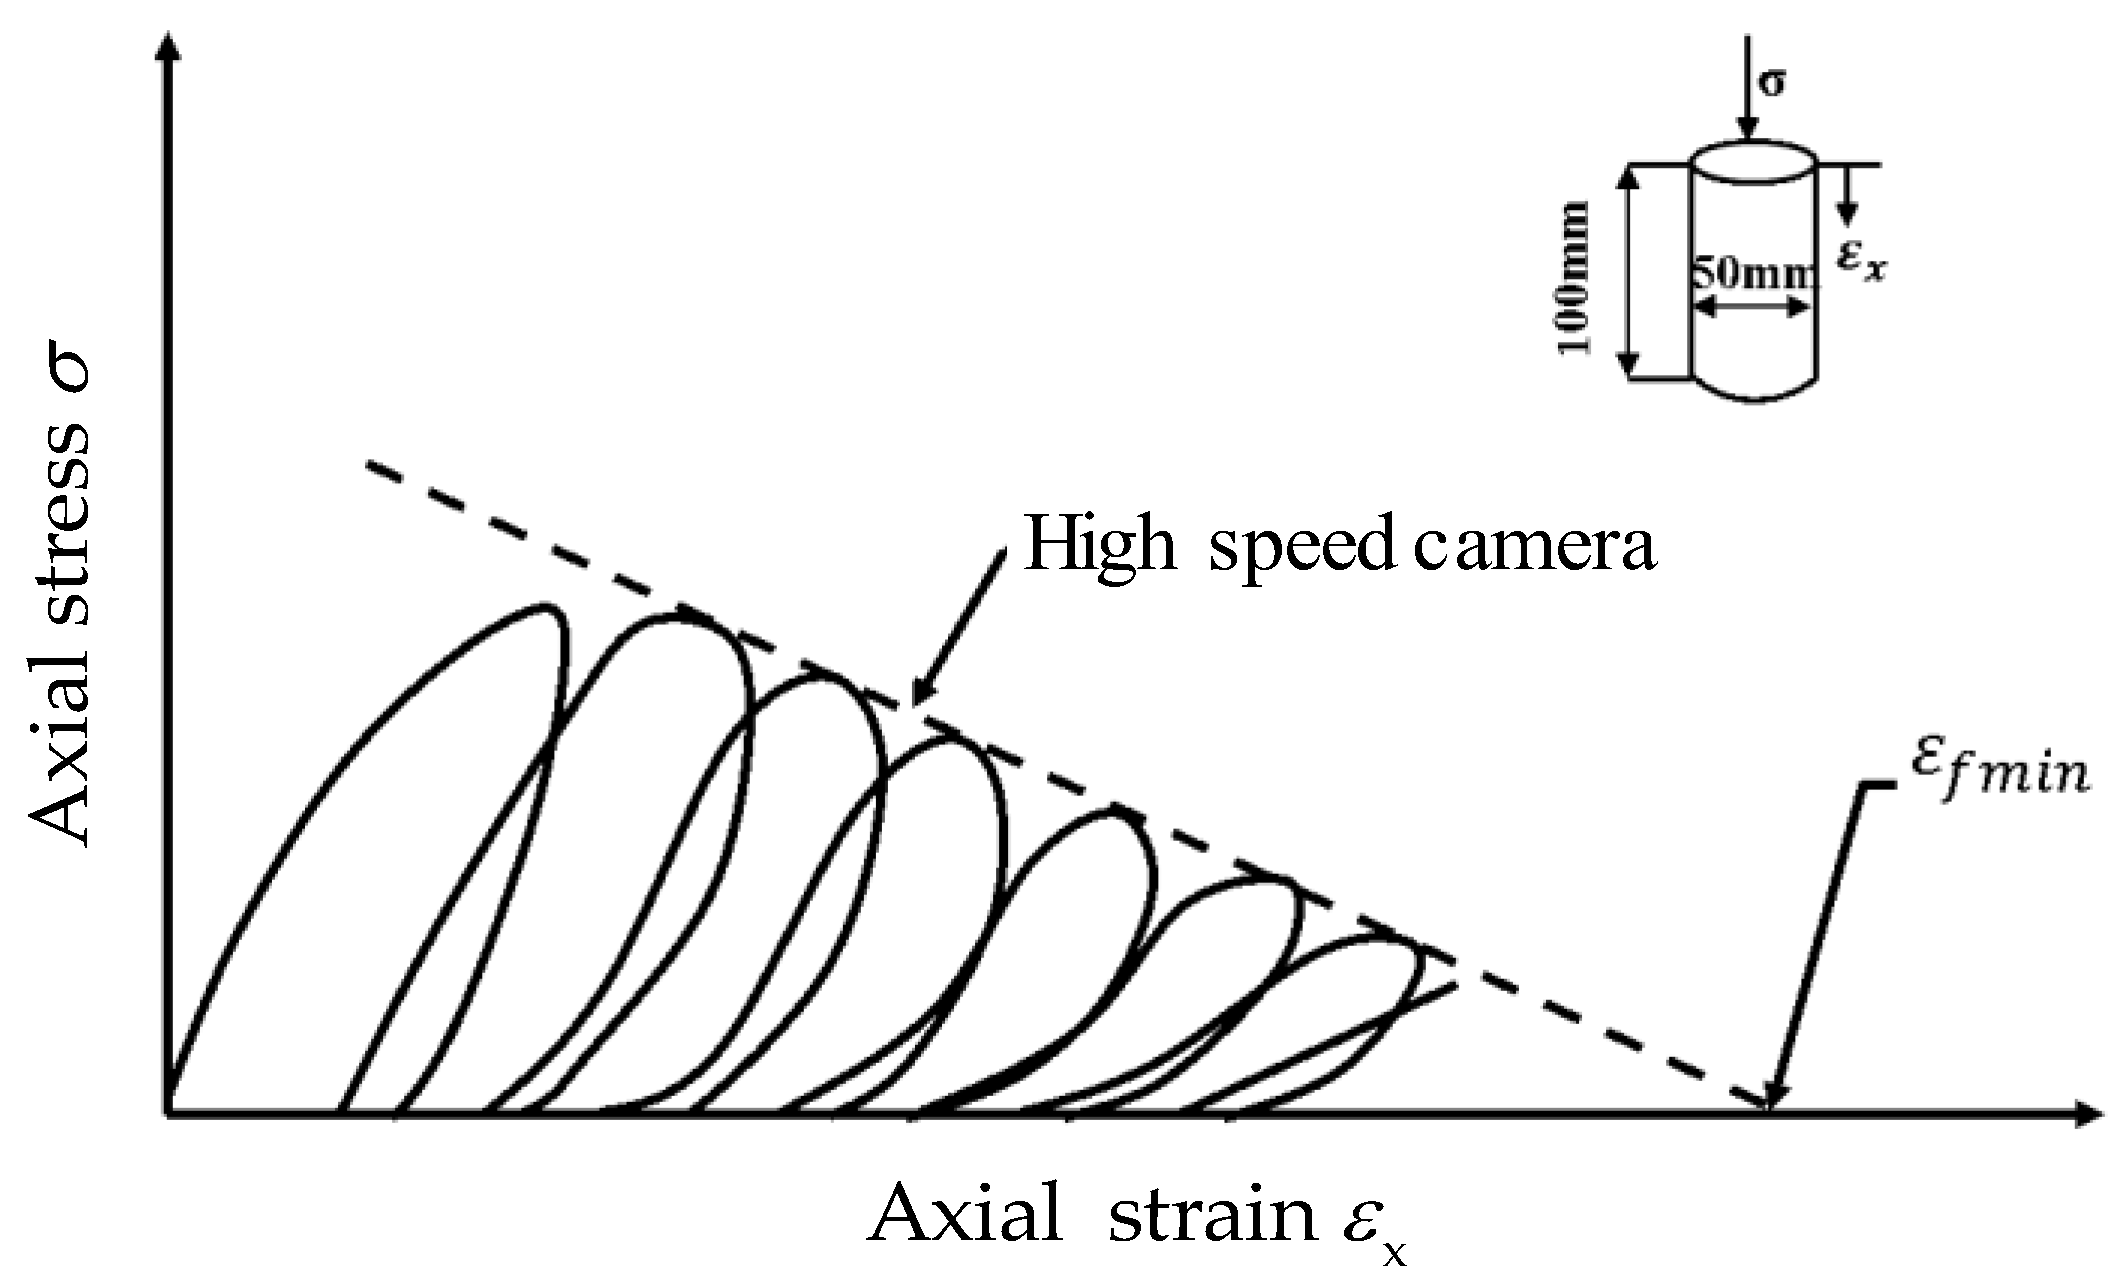
Damage constant is the plastic strain at the moment when the minimum strength fracture of the material is achieved. The acquisition method is given in the literature [15] (Figure 7). Determination of the value of parameter required a uniaxial compression cycle loading experiment, and a hypothetical failure interface was defined based on the curve drawn by the experimental results. The failure interface revealed that when the axial strain reached the intersection of the interface and the strain axis, the sample lost its strength completely, and the strain value was equal to the value of . When the equivalent fracture strain was achieved, and could be calculated as . If , then . Due to the lack of real data, we assumed that D2 = 1.0.
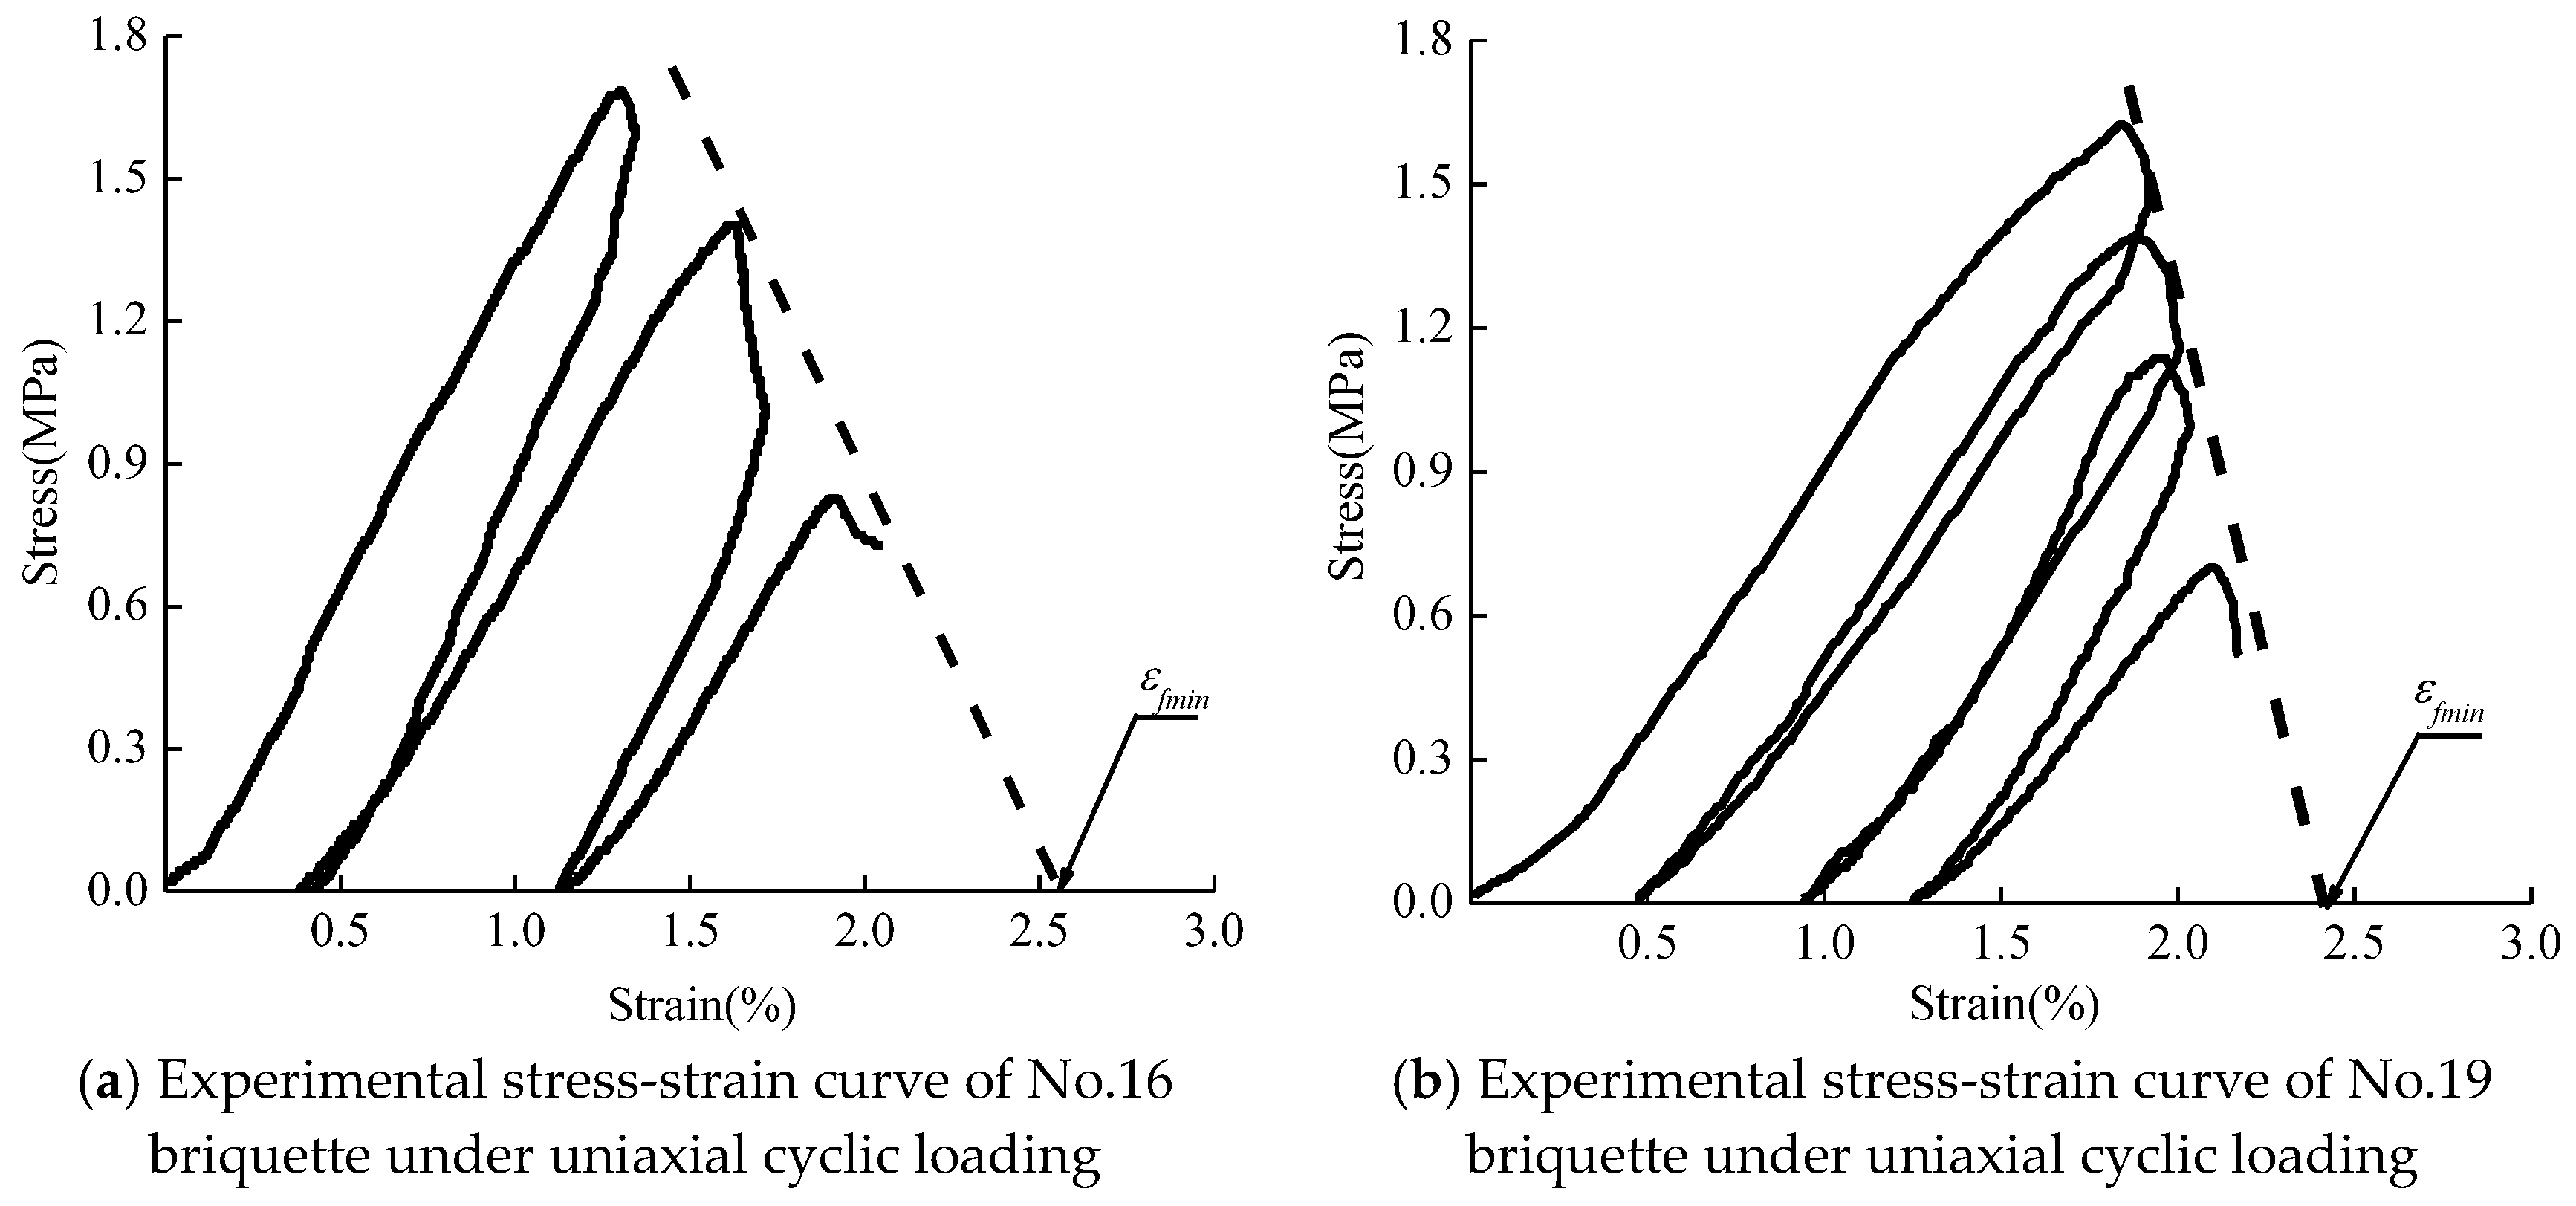
In this test, cylindrical samples with a diameter of 50 mm and length of 100 mm were used. During the loading process, the briquette samples were first loaded to 70% of their uniaxial compressive strength and then unloaded to zero at the same rate. Then, loading was repeated and its intensity was decreased by 10% at each cycle until the sample was destroyed. Uniaxial cyclic loading experiments were repeated for 5 test specimens. Due to operational error, only two sets of effective data were obtained. According to the experimental data, the stress–strain curve of the uniaxial compression cycle loading experiment was plotted, as shown in Figure 8.
A hypothetical failure interface was obtained on the stress–strain curve, and its intersection with the strain axis was considered to be the value of . The parameter values obtained by the above method are summarized in Table 6.
According to the results presented in Table 6, the damage parameter takes the average of the values obtained for the two sets of samples, which is 0.025. = 0.0131 and = 1.0 were obtained according to the method described above.
4.4. Determination of the Values of Parameters B and N
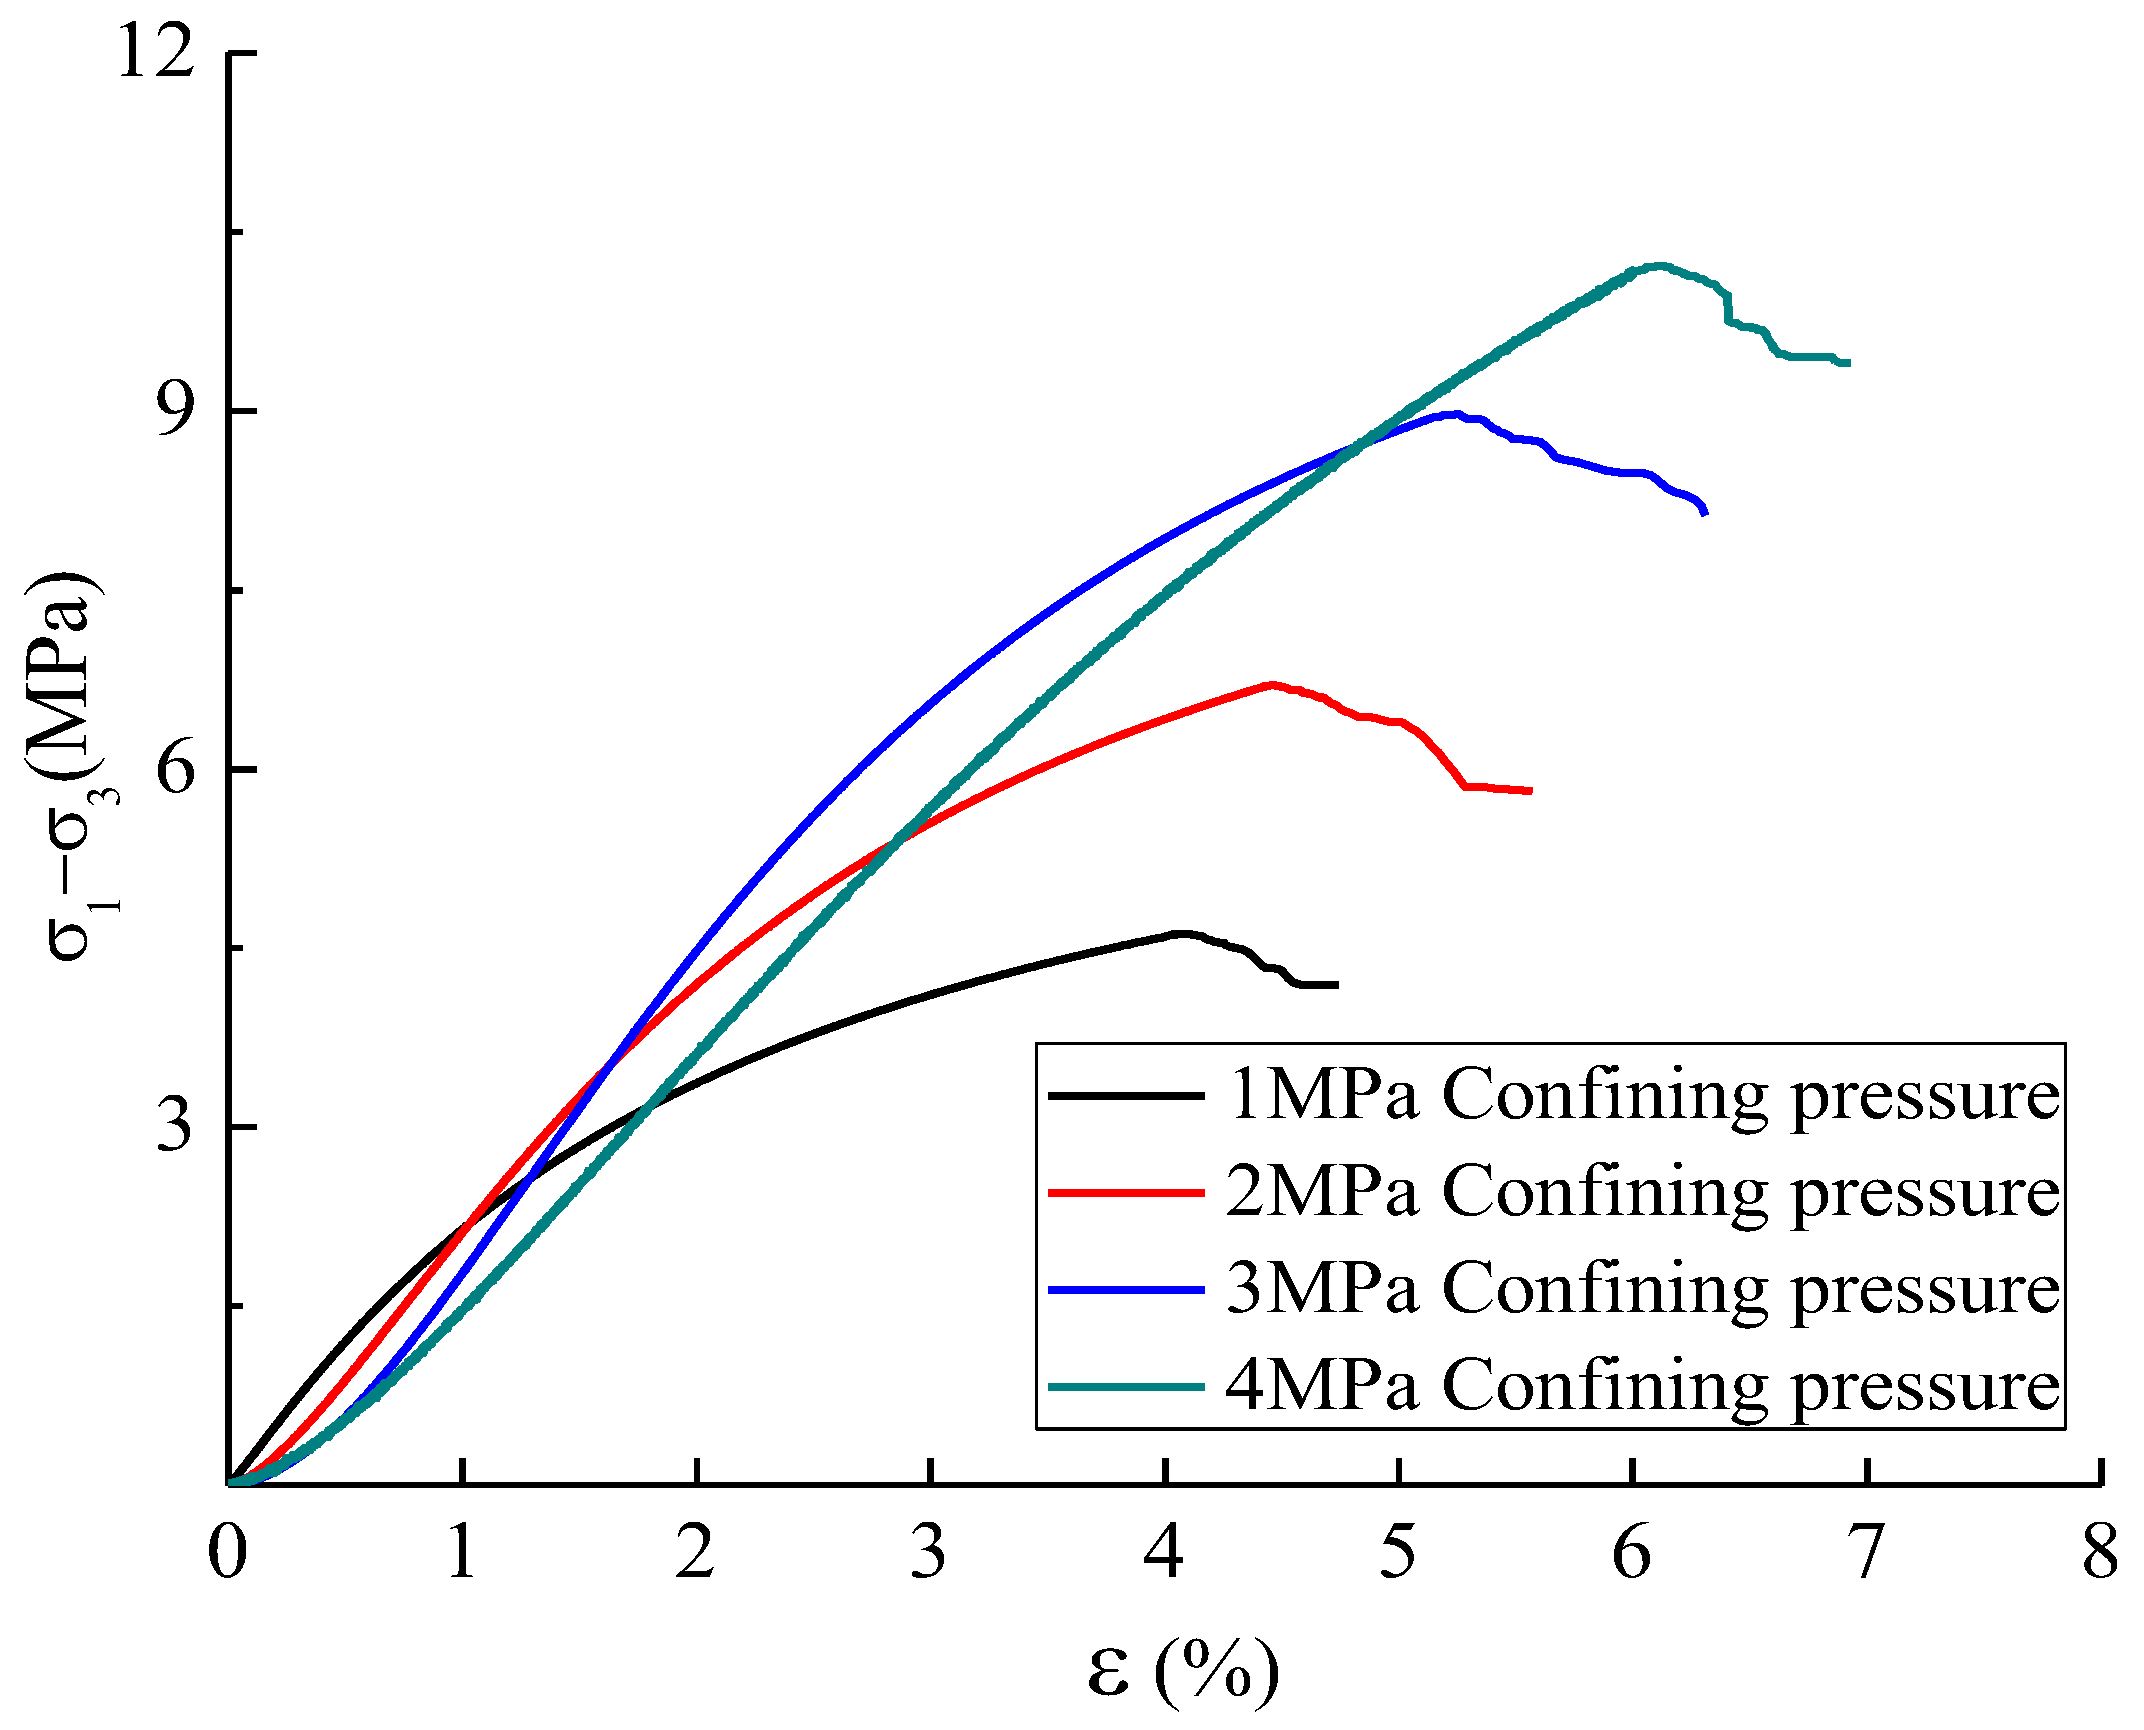
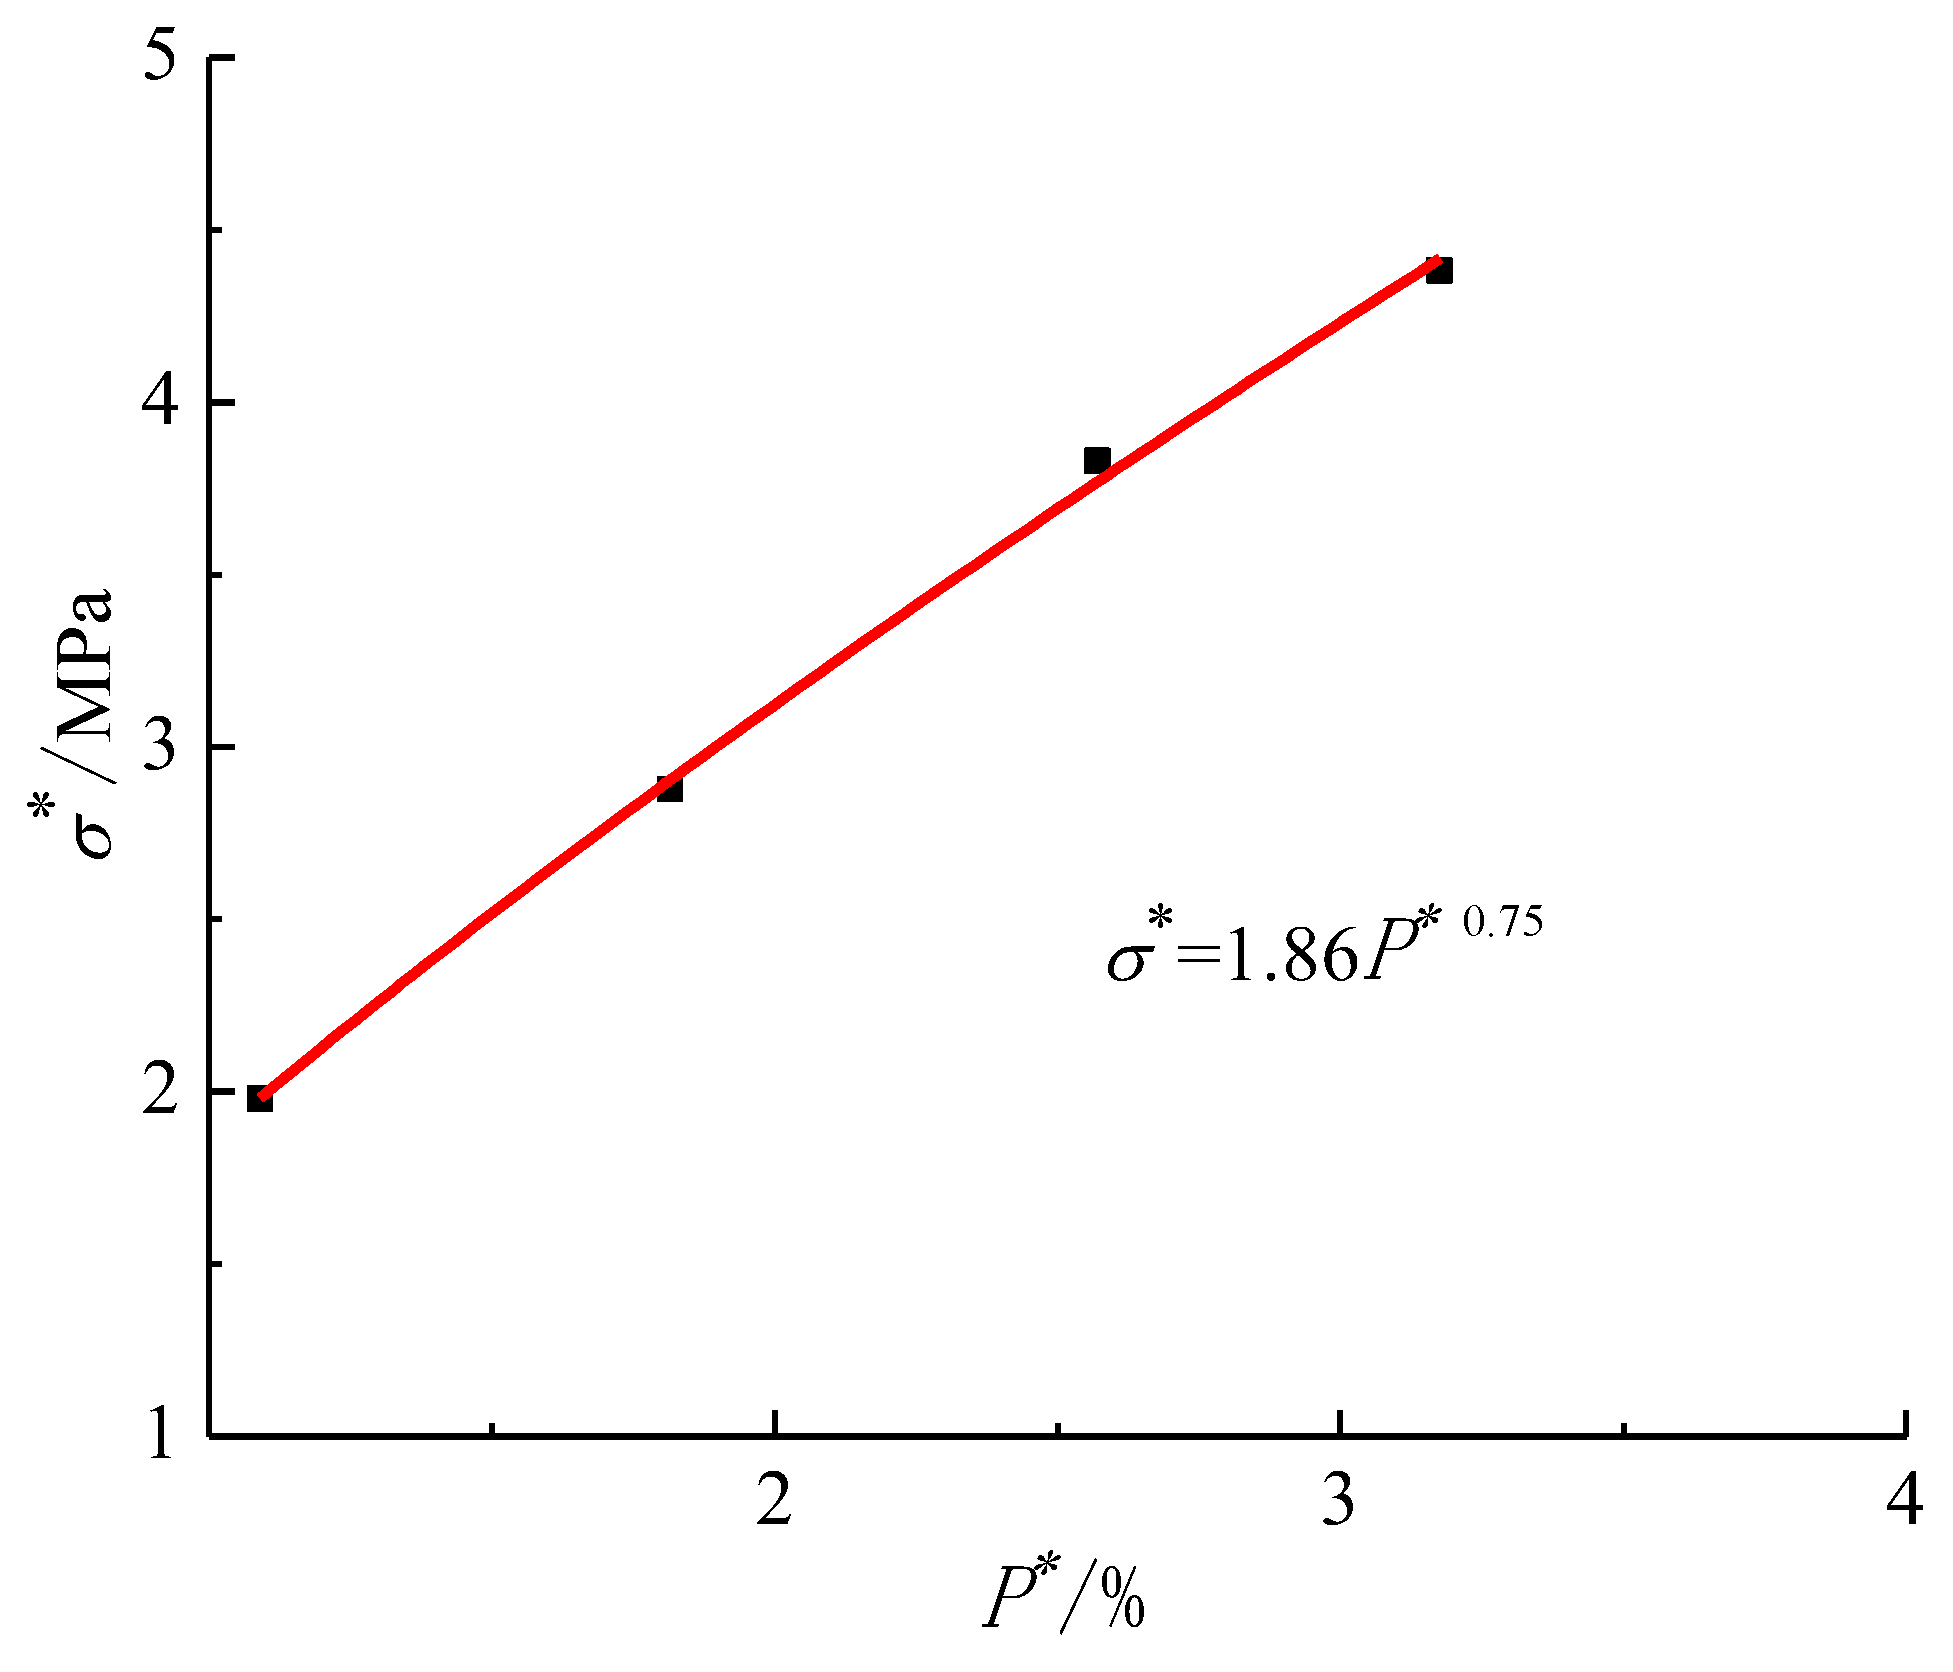
Normalized pressure hardening coefficient B and pressure hardening index N were obtained by triaxial compression experiments. In these experiments, the confining pressure was set at . First, the three axes coordinately load to the values of the confining pressure, and then the confining pressure was kept constant at . In the next stage, a load was applied along the axial direction until the sample failed, and the peak value of axial stress was recorded. The calculation of the normalized pressure hardening coefficient B and pressure hardening index N required hydrostatic pressure P and principal stress difference , respectively. The hydrostatic pressure P and principal stress difference were calculated as and , respectively. A series of values were obtained by normalizing the values of according to the equations and . The obtained values were fitted by equation to obtain the values of B and N.
A triaxial compression test was performed using confining pressure at the rate of 0.02 MPa/s. After a stabilization period, the axial load was applied at the rate of 0.1 mm/min until the sample failed. Since the strength of the briquette sample was not high, excessively high confining pressures could break the sample. Therefore, confining pressure gradients were set at 1, 2, 3, and 4 MPa. The principal stress difference–axial strain curves of the samples using the experimental data obtained under different confining pressures are shown in Figure 9.
The value of hydrostatic pressure P was calculated by equation , and a series of values were obtained. The obtained main stress difference and hydrostatic pressure P were normalized to obtain a series of values (Table 7).
4.5. Determination of the Values of the Remaining Parameters
The average density of the coal samples , the elastic modulus E, Poisson’s ratio , volume pressure at crushing point , and volumetric strain at crushing point were mainly derived indirectly using different equations. Based on the data shown in Table 2, the average density of the briquette samples was 1.228 g/cm3. According to the data summarized in Table 4, the mean value of the three samples was taken as the elastic modulus and Poisson’s ratio of the briquette samples, which were 101.56 MPa and 0.36, respectively. Shear modulus G was calculated using the equation to be 37.34 MPa. Based on previous literature, the value of P was calculated to be 0.78 MPa using the equation [14], where uniaxial compressive strength was considered to be 2.33 MPa. Volumetric strain at crushing point was obtained to be 0.0064 using the equation , where the bulk modulus K was calculated according to the equation , where the elastic modulus E and Poisson’s ratio were assumed to be 101.56 MPa and 0.36, respectively.
The 11 parameters in the HJC constitutive model for coal were determined by experimental measurements and different equations. Pressure at compaction point , volume strain at compaction point , pressure constants , , and , normalized cohesive strength A, strain rate coefficient C, maximum normalized intensity , and some other parameters were determined using a flying impact test [28]. The remaining parameters were not accessible due to their low sensitivity and limited experimental conditions. Therefore, their values were considered to be similar to those provided in [20]. Thus, the values of all parameters in the HJC constitutive model were determined, and the results are shown in Table 8.
5. SHPB Experiment and Numerical Simulation Analysis
5.1. SHPB Experimental Device
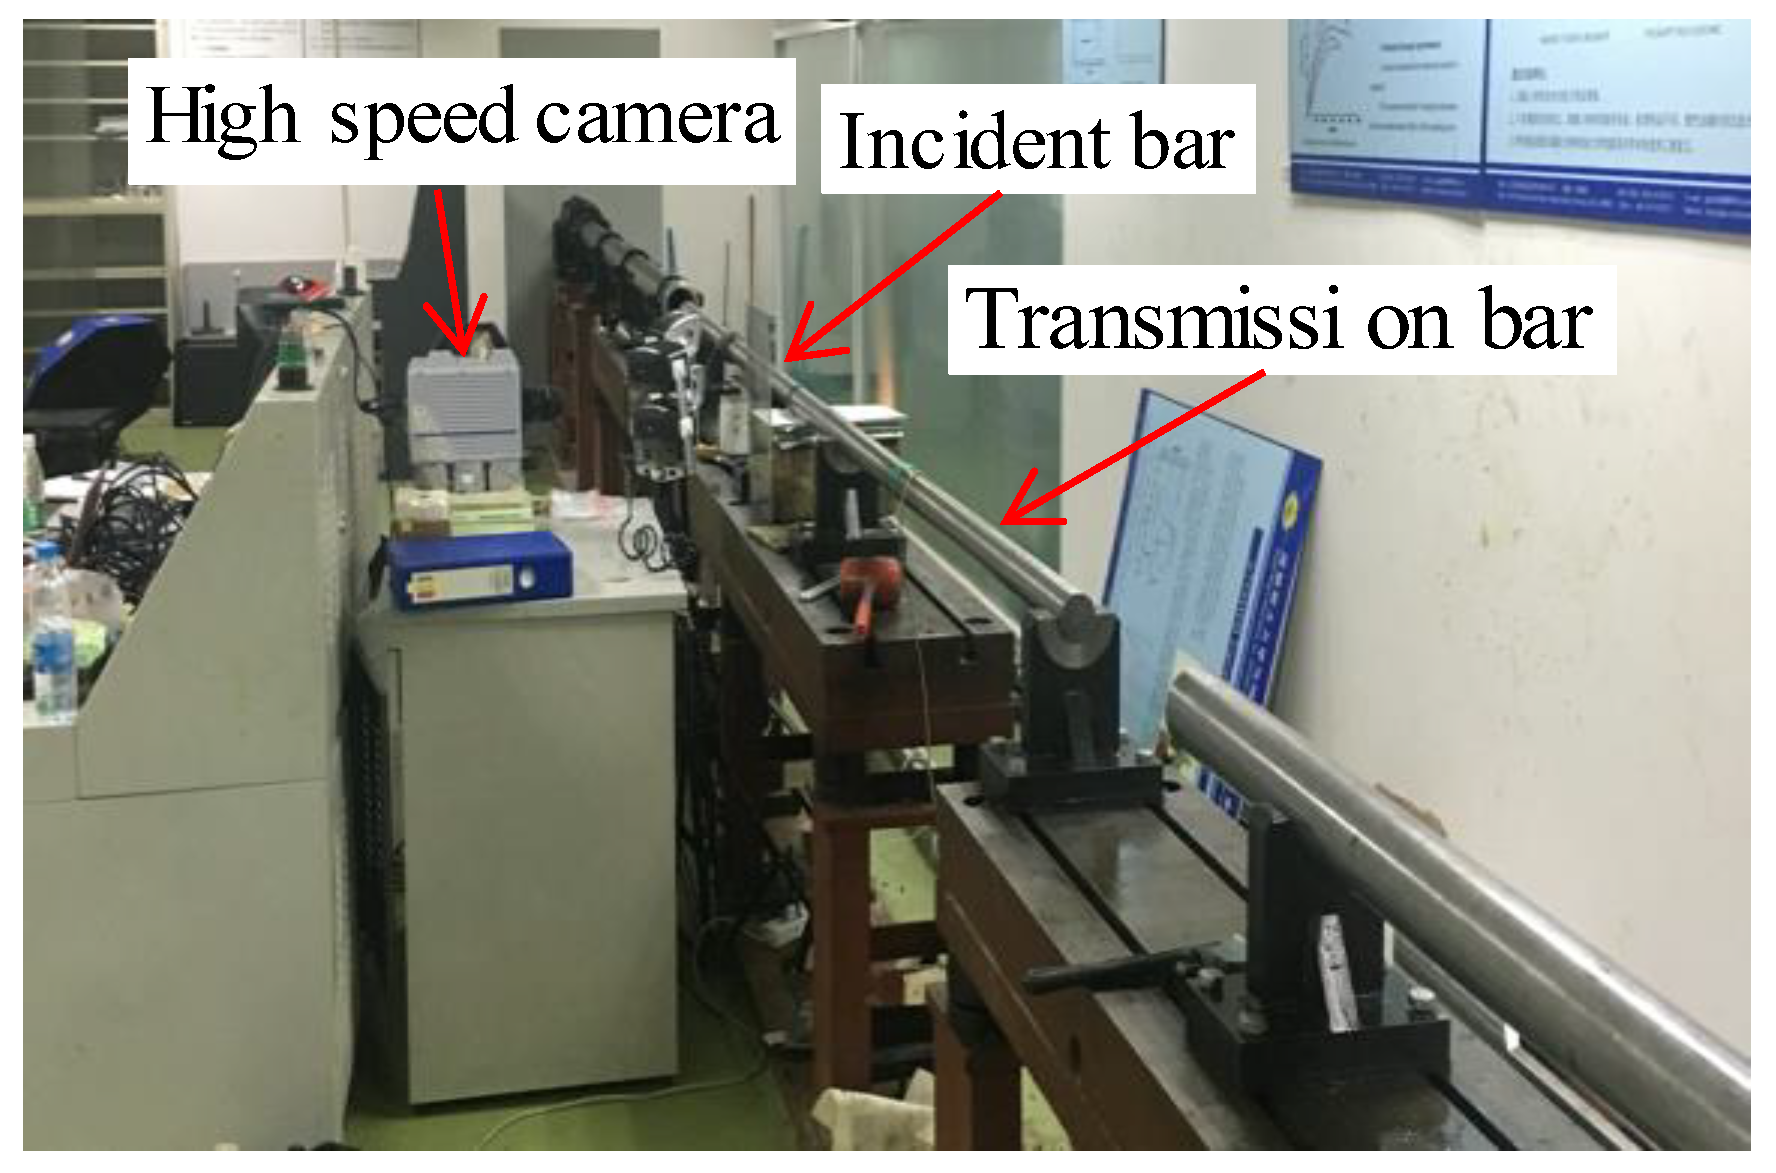
Dynamic impact tests on coal samples were carried out using an SHPB test device at China University of Mining and Technology (Beijing). The SHPB device consisted of a striking rod (bullet), an incident rod, and a projection rod. As shown in Figure 11, the bullet was a 540-mm long heavy double hammer-spun cone with a cone ratio of 310:100:130 [29]. As shown in Figure 12, the experimental and projection rods had a diameter of 75 mm and length of 2000 mm, and the tested coal sample was sandwiched between incident and projection rods. The SHPB experiment used coal briquettes with a diameter of 50 mm and length of 25 mm.
5.2. Establishment of Finite Element Model
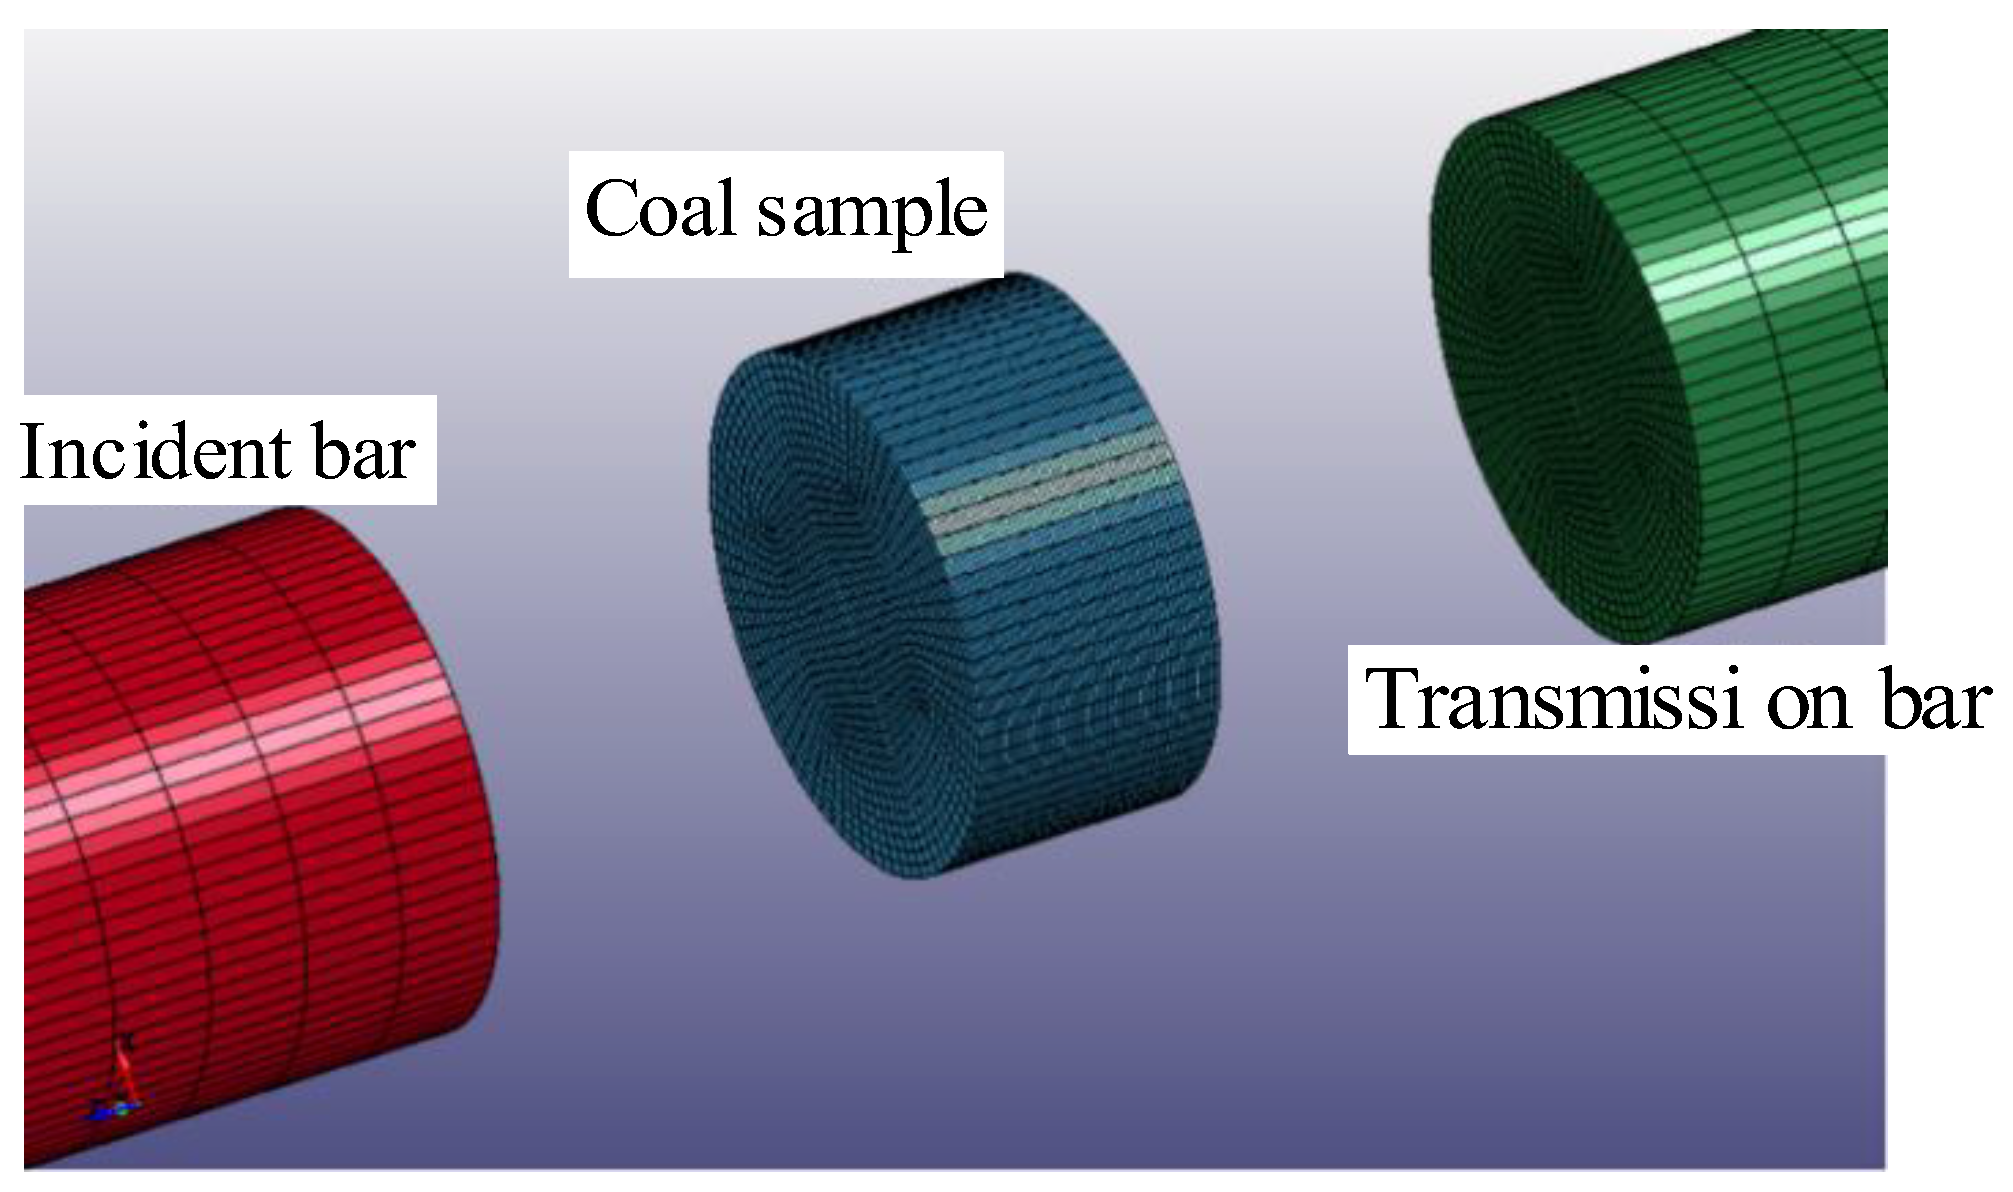
The finite element model in this work was built according to actual sizes and the components were all three-dimensional solid elements (Solid164). The finite element model was meshed, and the bullet, incident and transmission rods were divided into 15 parts along the radial direction. The bullet was divided into 40 parts along the axial direction, and incident and transmission rods were divided into 200 parts along the axial direction. To more intuitively reflect the impact damage of the test piece, it was finely meshed and was divided into 30 and 20 parts along radial and axial directions, respectively (Figure 13).
The material models of the bullet and compression bars were selected from linear elastic material models. The main parameters and their values were as follows: density 7800 kg/m3, elastic modulus 2.06 GPa, and Poisson’s ratio 0.36. The coal sample was input into the HJC constitutive model and its parameter values were determined according to specific values listed in Table 8. The bullet was attached to the incident rod through an automatic contact between the two faces and the pressure bar was attached through an erosive contact with the test piece. During numerical simulation, the friction between contact surfaces was ignored. The value of 2 was taken as the contact stiffness penalty function factor f.
5.3. Waveform of the Stress Wave
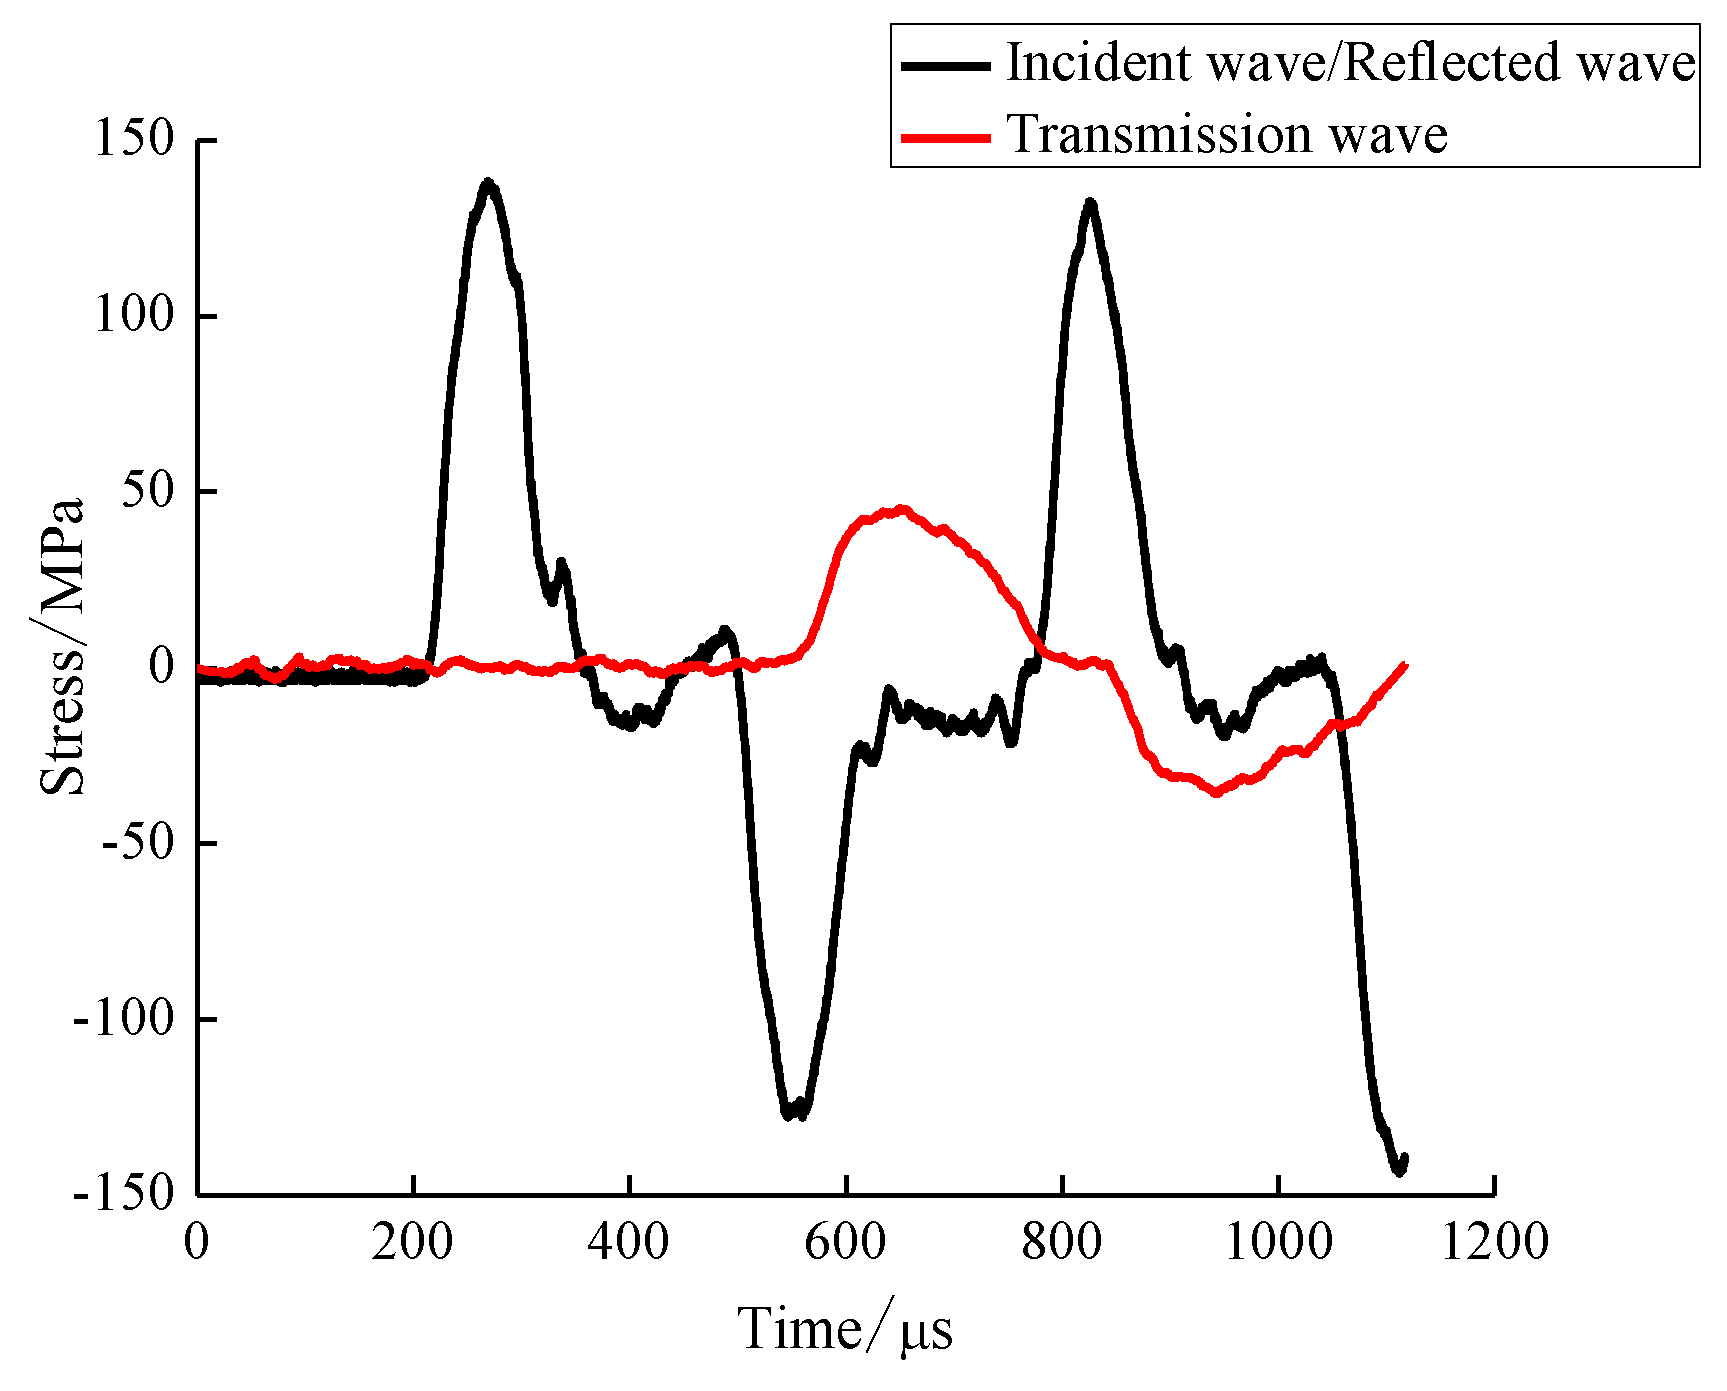
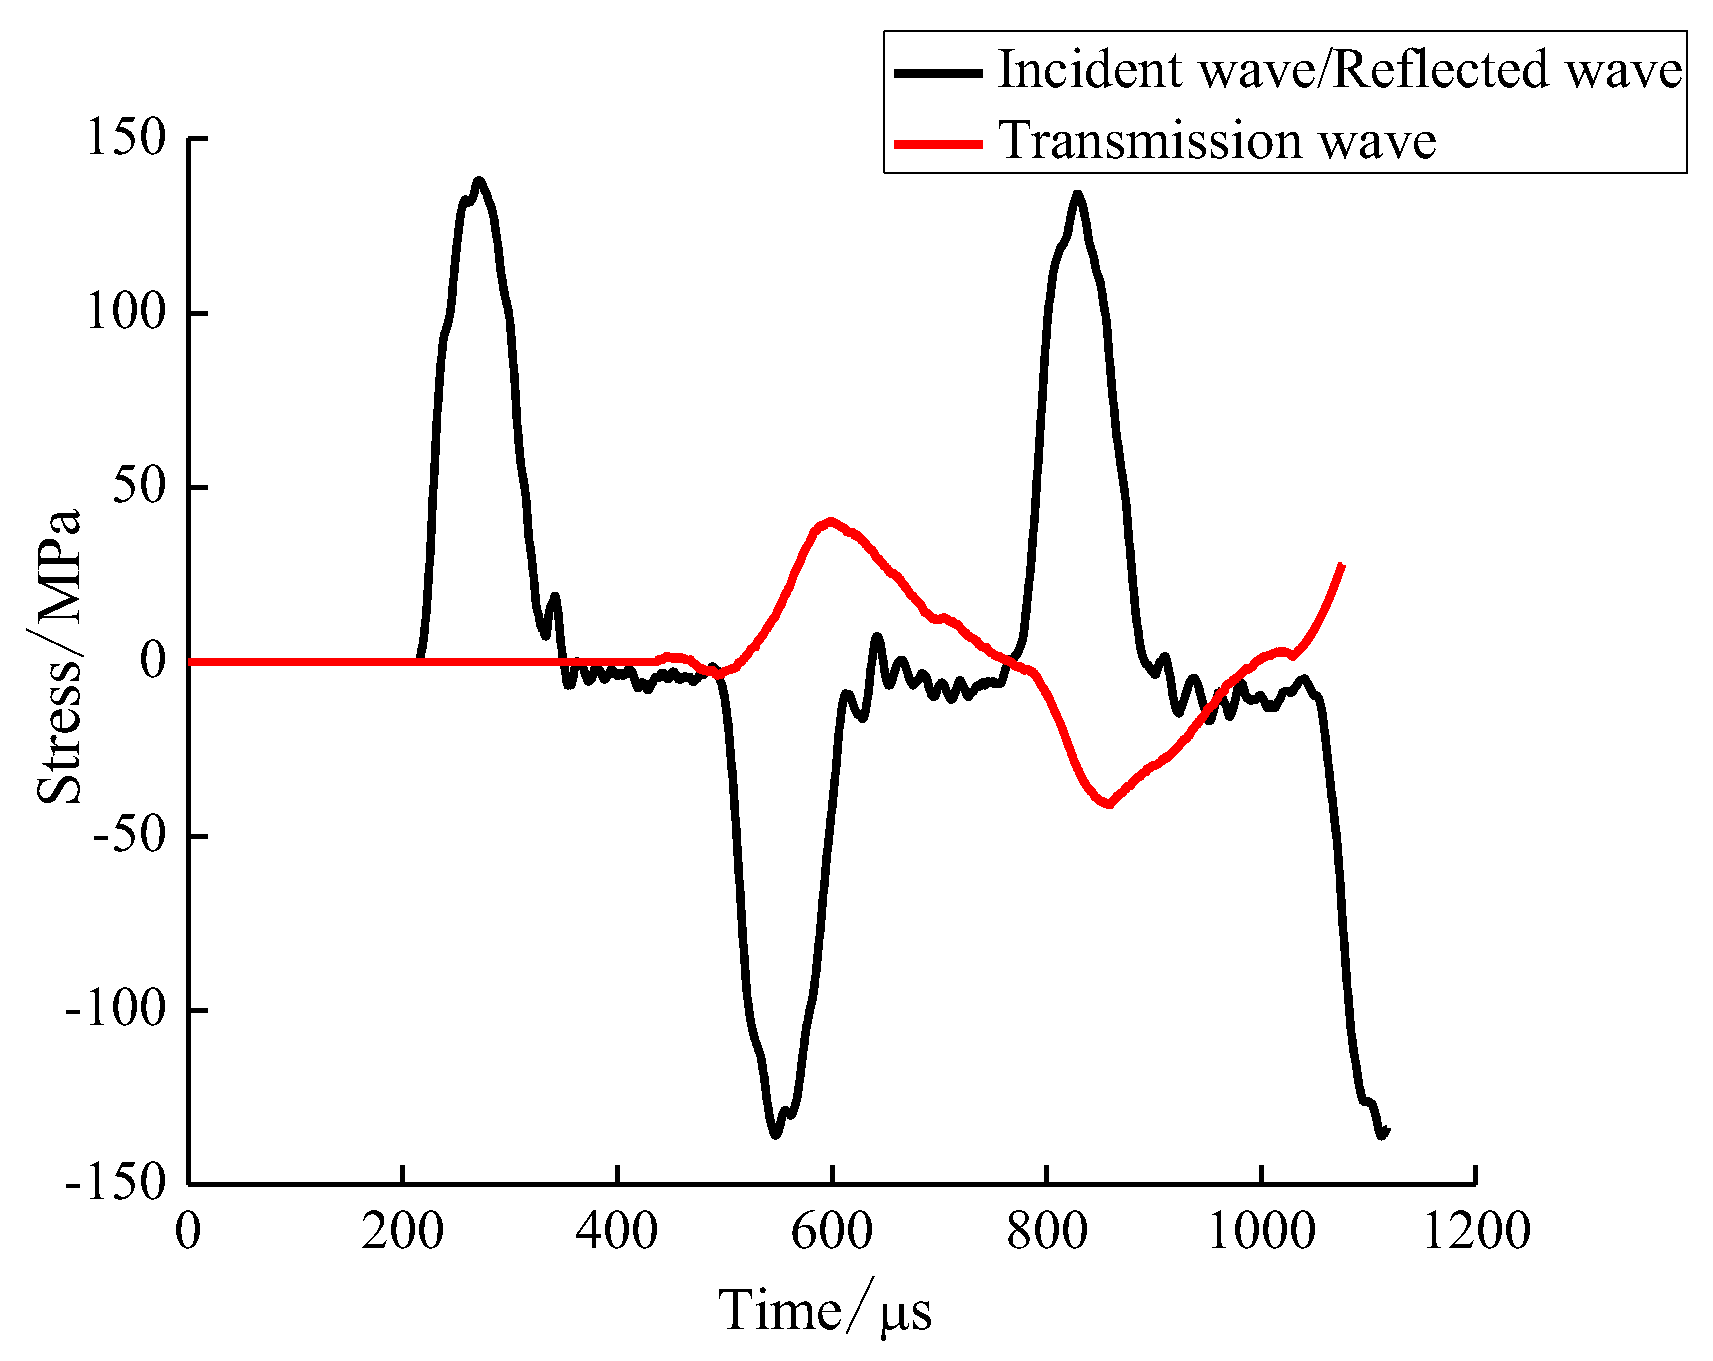
In order to allow comparison with the experimental results, impact velocities in the numerical simulation were set at 4.732 and 7.267 m/s. Here, taking the stress waveform diagram of the incident rod and the middle of the projection rod at the impact velocity of 7.267 m/s as examples, experimental data and numerical simulation results were compared. The obtained results are shown in Figure 14 and Figure 15.
It can be seen from Figure 14 and Figure 15 that the experimentally measured stress wave curve complied well with that drawn using simulation results, but there was a slight difference in curve volatilities. This was because the stress wave decayed with time during the propagation of the rod, and the components used in the experiment had inevitable little defects, which caused the stress wave to be weakened during propagation. Numerical simulation was carried out under ideal conditions. The end face of the rod was flat, and frictional force was neglected. Therefore, the stress wave obtained by numerical simulation was not attenuated, and the obtained stress wave curve was smoother; however, the peak value of the stress wave obtained by numerical simulation was slightly greater than that measured in real time. Although there were some differences between the simulation and experimental results obtained for the stress wave, they were generally consistent. Therefore, simulation results were considered to be accurate and reasonable.
5.4. Analysis of Coal Rock Damage
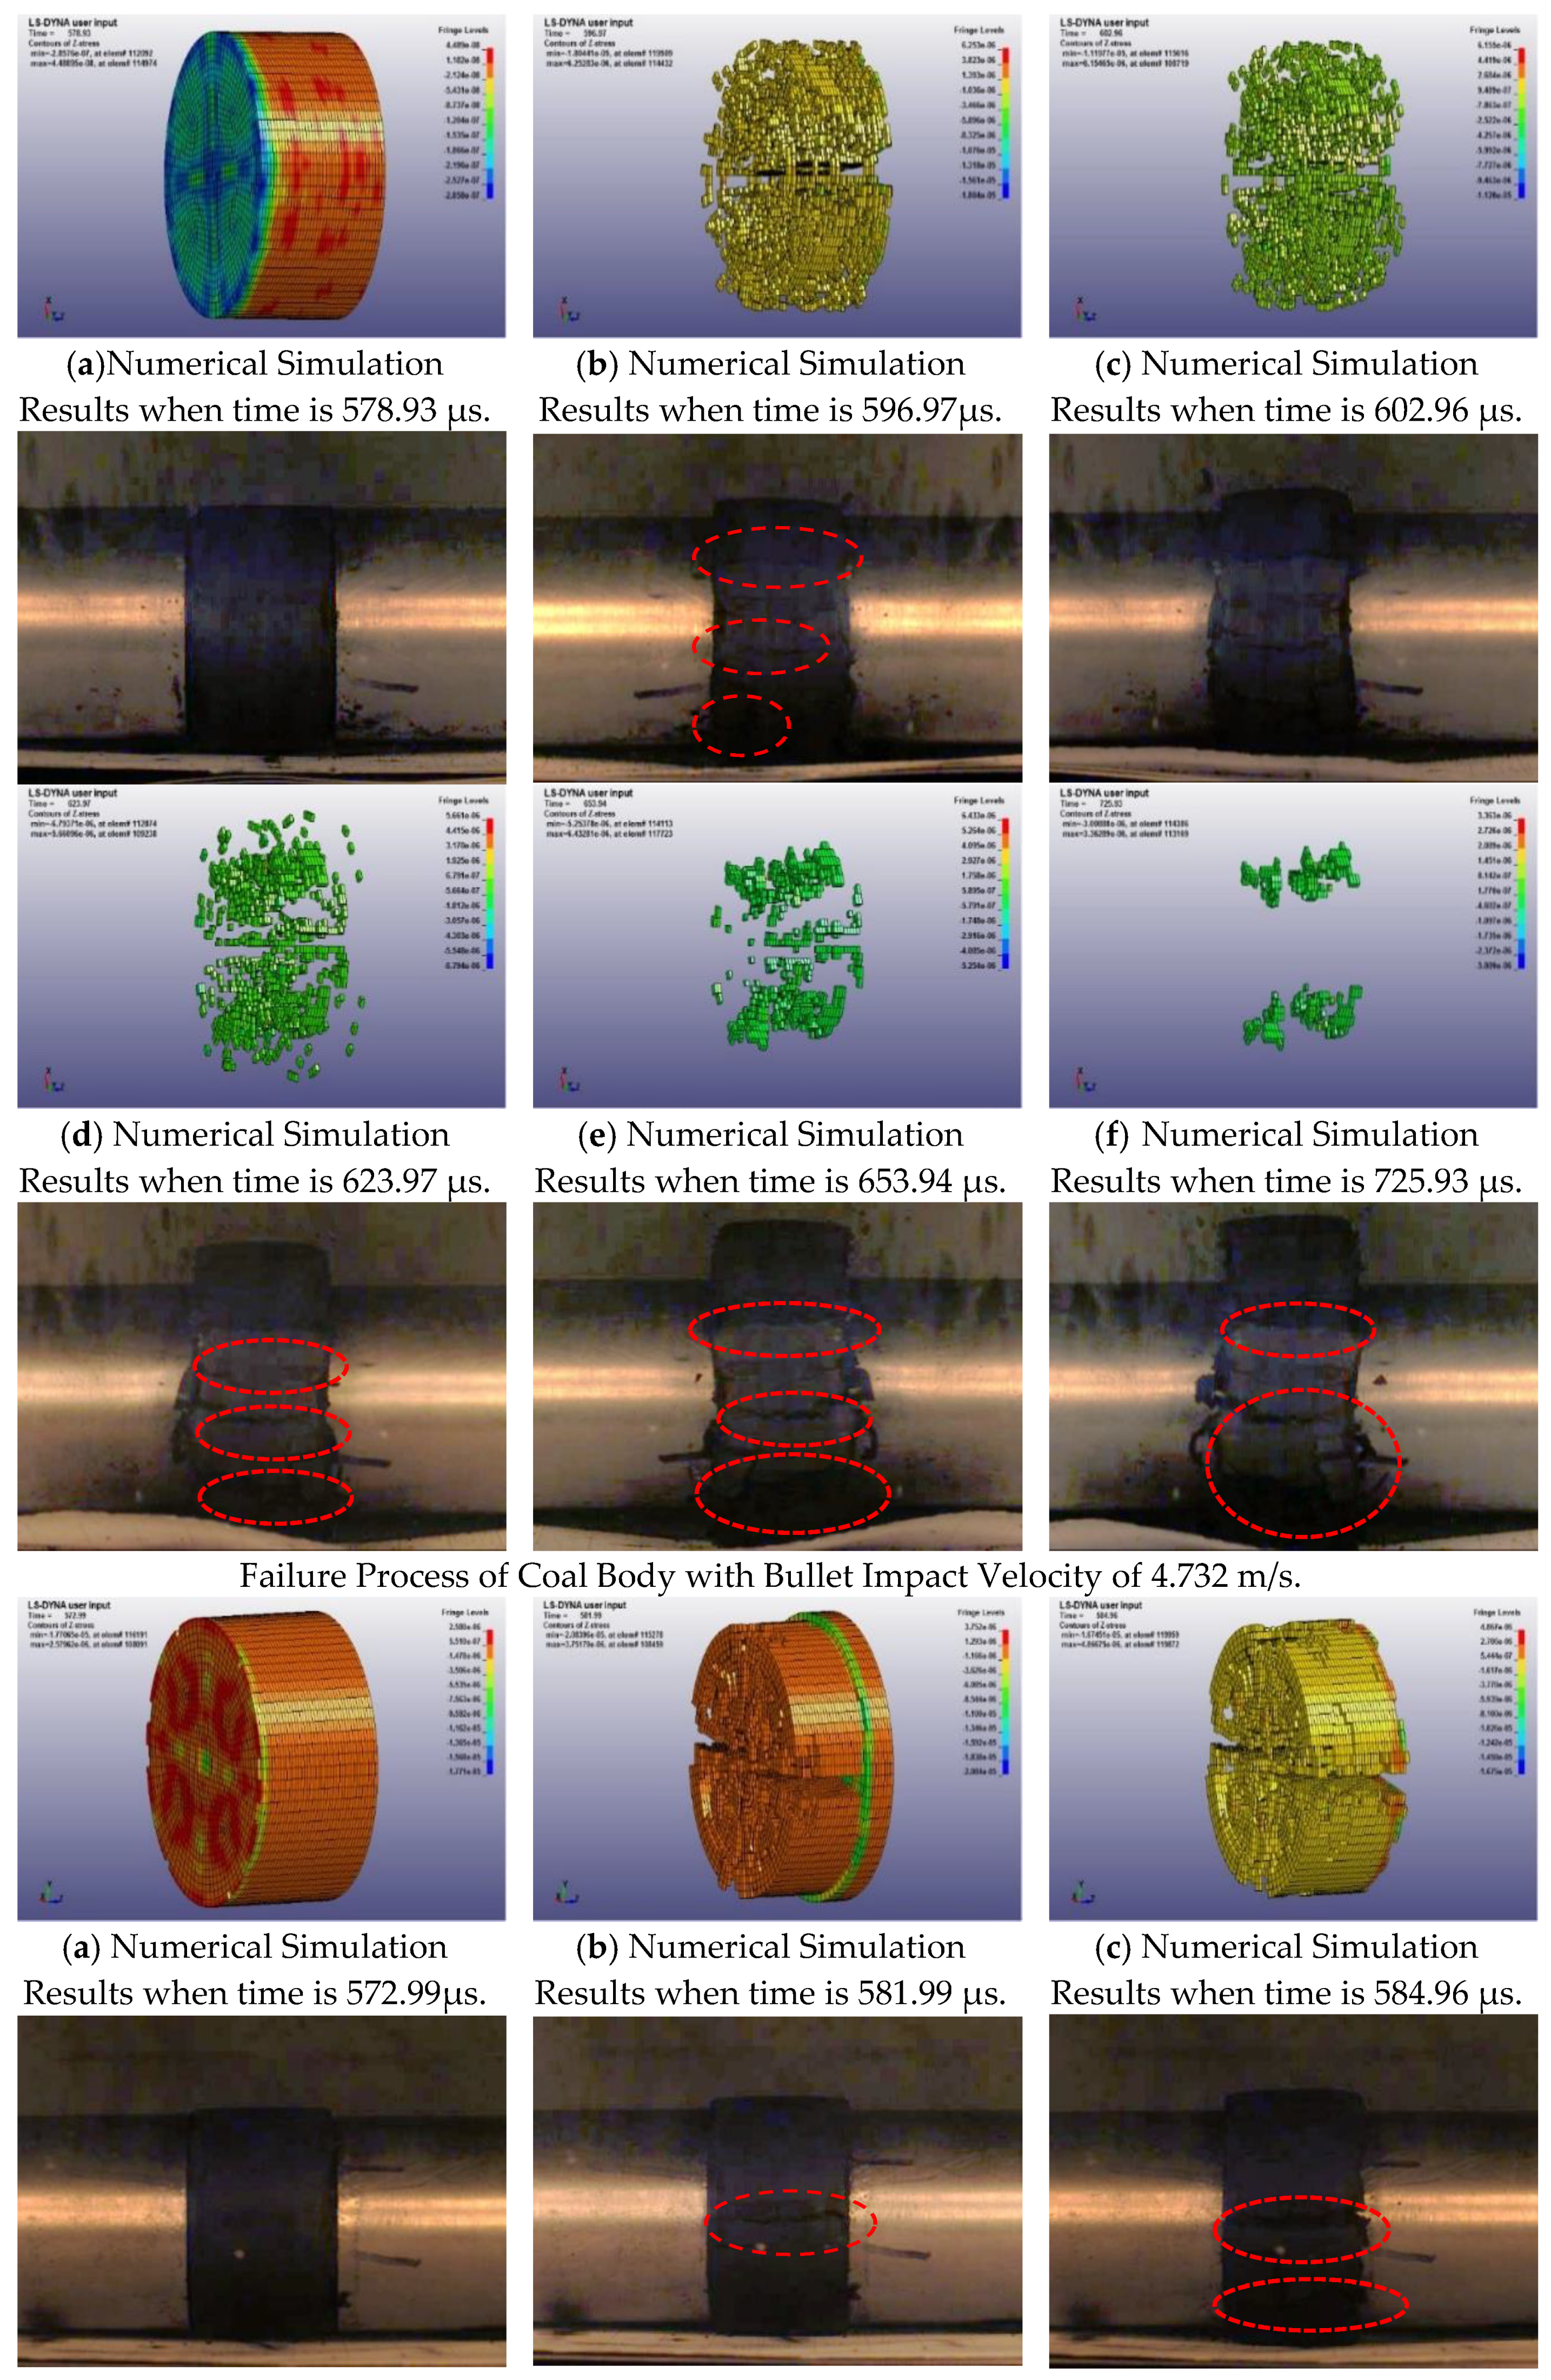
The damage process of the coal-rock SHPB experiment was captured with high-speed photography and compared to the simulated damage process, as shown in Figure 16.
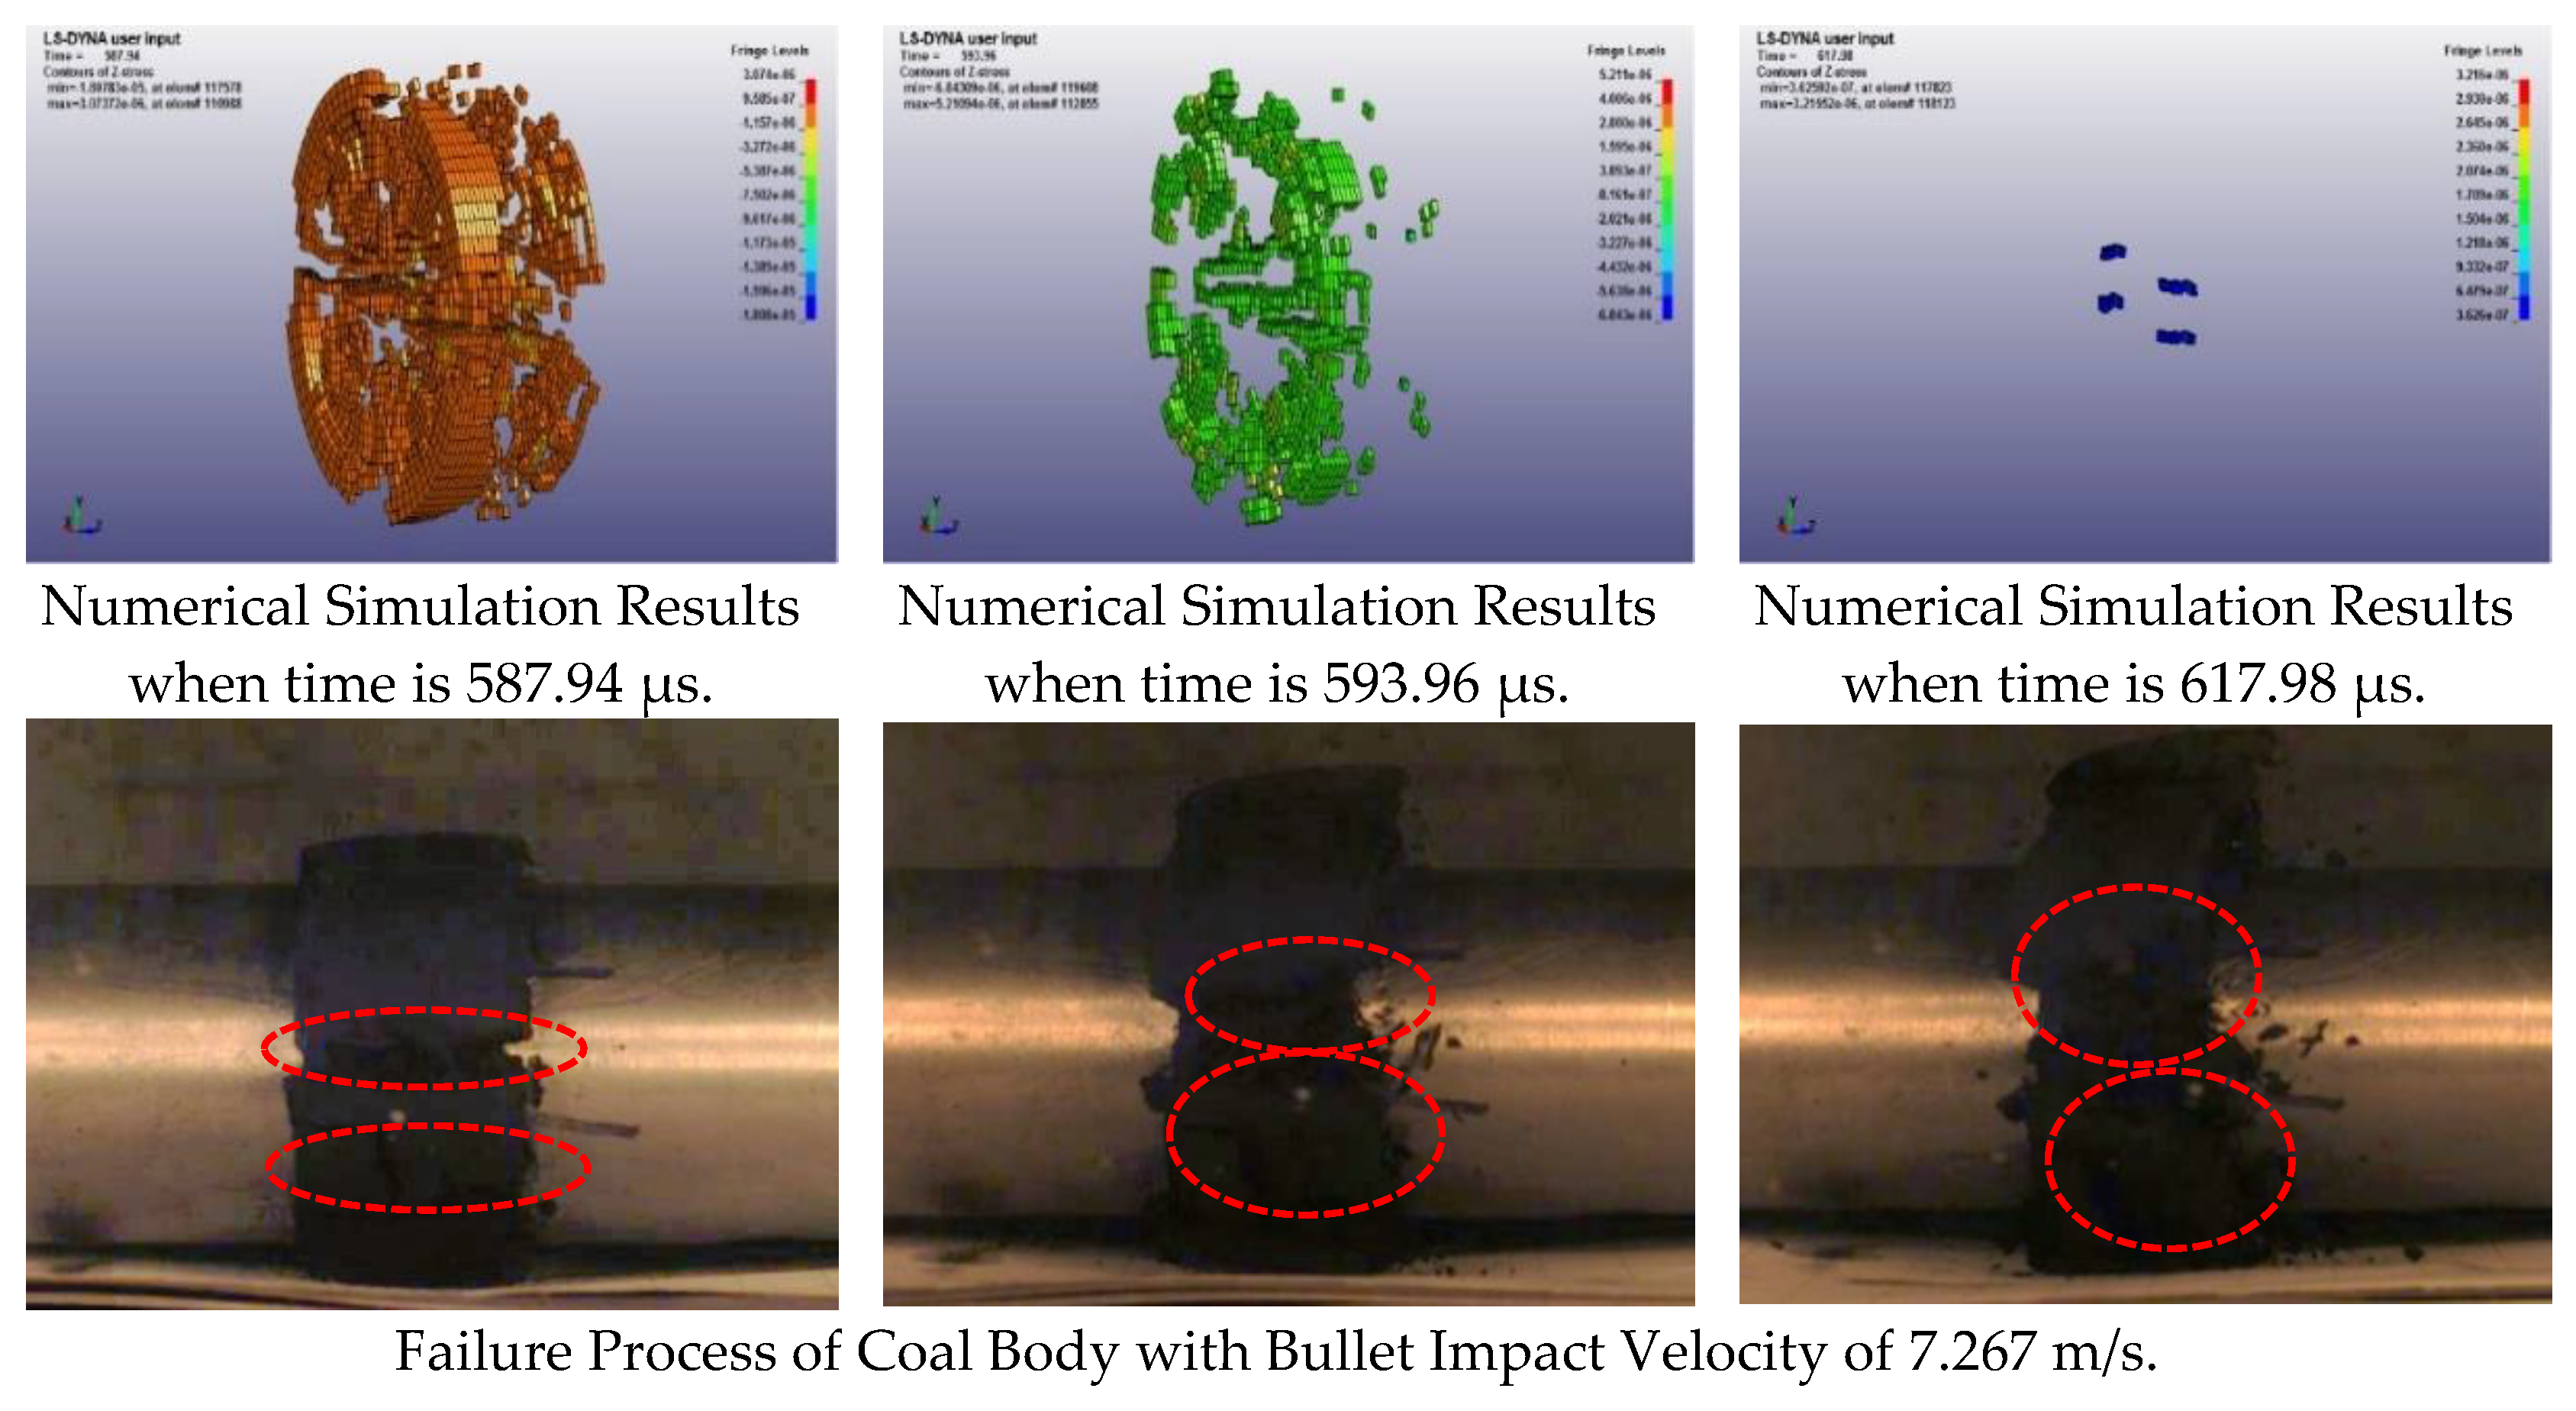
Figure 16 shows that at the impact velocity of 4.732 m/s, the stress wave started to contact the coal sample at t = 578.93 μs. When t = 596.97 μs, a part of the coal body failed and obvious axial cracks appeared in the middle of the sample. When t = 623.97 μs, the number of surface cracks in the coal sample, and therefore the damage intensity, increased. When t = 725.93 μs, the coal sample broke into small pieces. When the impact velocity was 7.267 m/s, the stress wave started to contact the coal sample at t = 572.99 μs, and the coal body partially failed due to the propagation of the compressive stress wave. Radial cracks occurred at t = 584.96 μs, and when t = 583.96 μs, the internal stress of the sample gradually changed from compressive to tensile stress. At t = 617.98 μs, the coal sample was severely damaged and fell into pieces. At different impact velocities, axial cracks began to appear in the coal samples, which ultimately resulted in the failure of samples.
It can be seen from the high-speed images that when the impact velocity was 4.732 m/s, the sample was compressed by pressure, the coal was laterally deformed, and many transverse cracks were created parallel to the direction of stress wave propagation (indicated with a red circle in the Figure 16). With the development of cracks, the whole sample appeared to expand, and eventually, damage occurred under the joint action of upper crack expansion and the lower slip shear of the coal body. When the impact velocity was 7.267 m/s, first a through crack was created in the sample (shown by a red circle in Figure 16). Secondly, due to the large incident energy and high velocity of the bullet, the deformation of the coal continued to increase, and the crack expanded rapidly. Finally, the sample underwent compression expansion under impact loading, which caused tensile damage. As the speed continued to increase, the coal sample underwent a “comminuted” rupture, producing a large amount of fine granular coal dust. The severity of coal body damage positively correlated with the impact velocity, while the size of the coal block was decreased.
Comparing the experimental and simulated failure processes at impact velocities of 4.732 and 7.267 m/s revealed their high consistency. In general, numerical simulation using measured briquette HJC constitutive model parameters had a strong similarity to experimental findings, which verified the applicability of the HJC constitutive model parameters of briquette samples to simulate the failure process of coal samples under the impact of a dynamic load.
6. Numerical Simulation of Impact Damage on Heading Face
A coal-rock dynamic disaster refers to a strong dynamic phenomenon in which the surrounding coal and rock masses in an underground mining space are rapidly destroyed and a large amount of energy is suddenly released [30]. The HJC constitutive model parameters for briquette samples shown in Table 8 were applied in the numerical simulation of coal-rock dynamic hazards caused by rock bursts or blasting impact disturbances. Taking Yongcheng Cheji Coal Mine as an example, the impact damage surface of the excavation face was established. A numerical simulation model was used to verify the applicability of the HJC constitutive model parameters for briquette.
6.1. Model Establishment
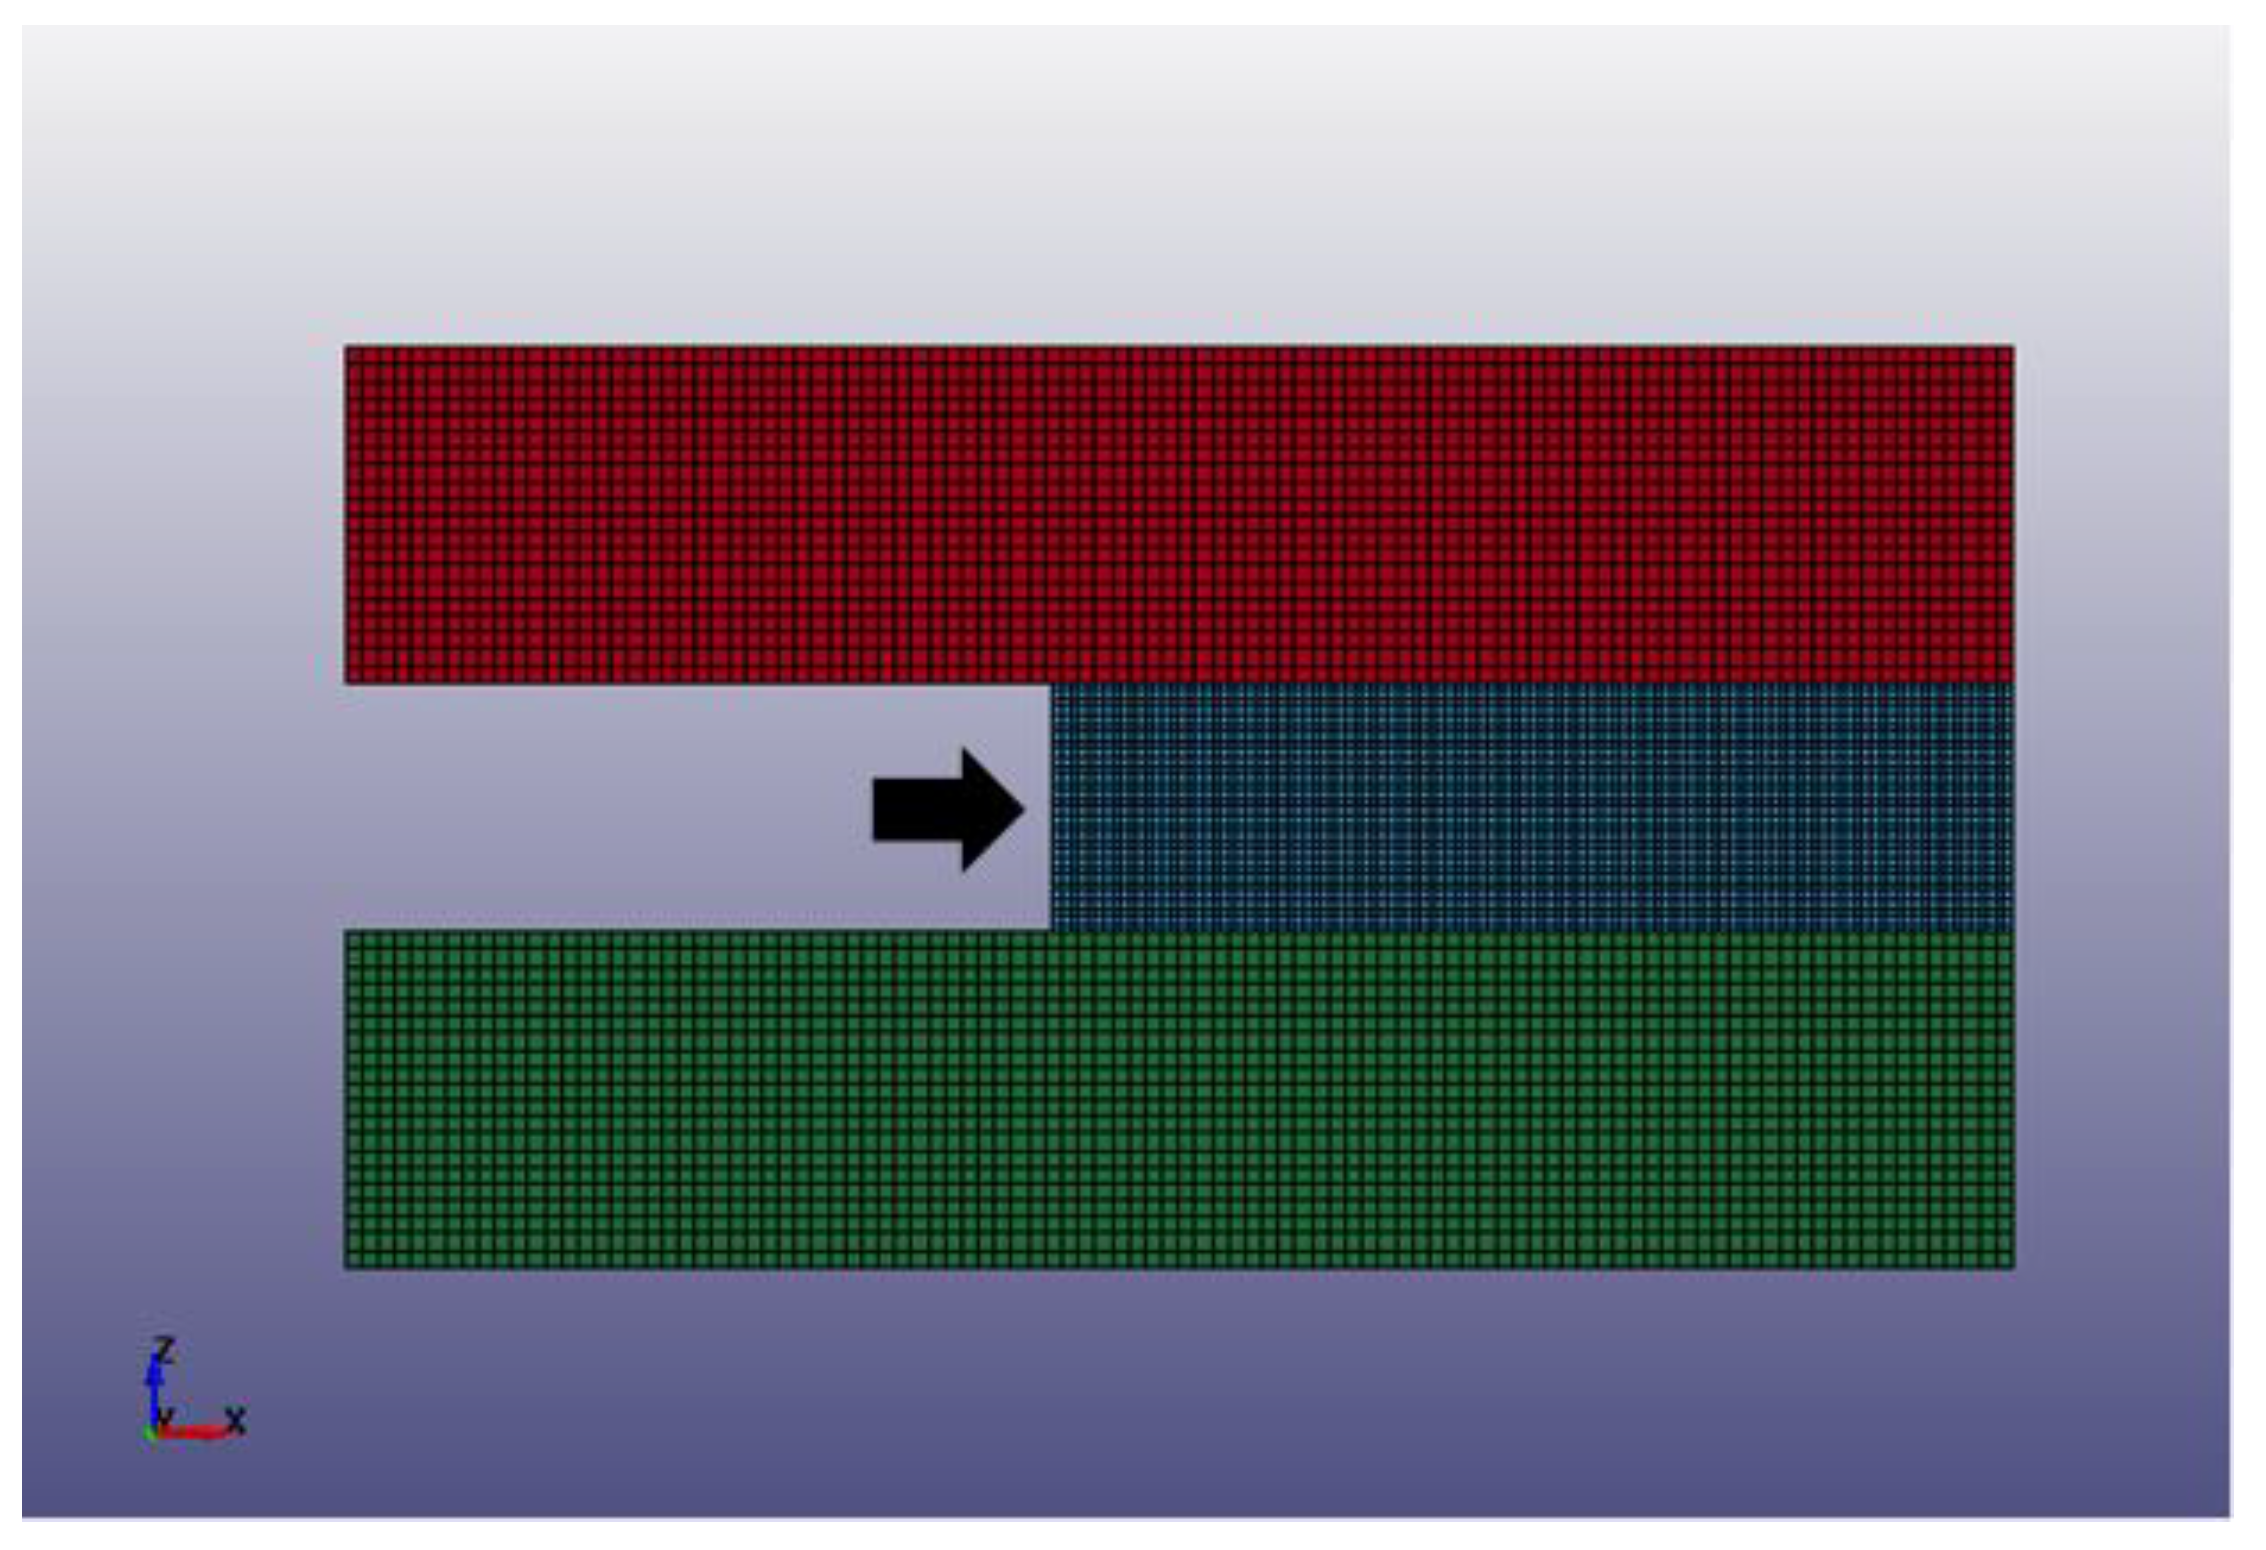
The coal-rock layer was too thick or the size was too large, which increased the difficulty of meshing and the solution time. Therefore, the model was simplified. In the impact damage model developed for the tunnel face, the length and height of the roof and floor rock layers were considered to be 20 and 4 m, respectively. The length and height of the coal seam were 20 and 3 m, respectively (Figure 17), and the roadway size was 8 m. In order to simplify calculations, the rock layers of the top and bottom plates adopt an elastoplastic model with a density of 2500 kg/m3, an elastic modulus of 18 Gpa, and a Poisson’s ratio of 0.3 [31]. Coal seam was set based on the HJC constitutive model parameters for briquette shown in Table 8.
Considering the influence of ground stress on underground roadways, the maximum vertical ground stress of the roadway at 450 m depth for Yongcheng Cheji Coal Mine was measured to be 15.22 MPa. Therefore, during the simulation, a vertical static load was applied to the coal seam. The stress wave disturbance generated by excavation blasting was simplified into a semi-sinusoidal pulse, and based on the dynamic stress–strain curve obtained from the briquette SHPB experiment, 20 MPa was taken as the peak value for a half-sinusoidal pulse.
6.2. Numerical Simulation of Impact Damage on Heading Face
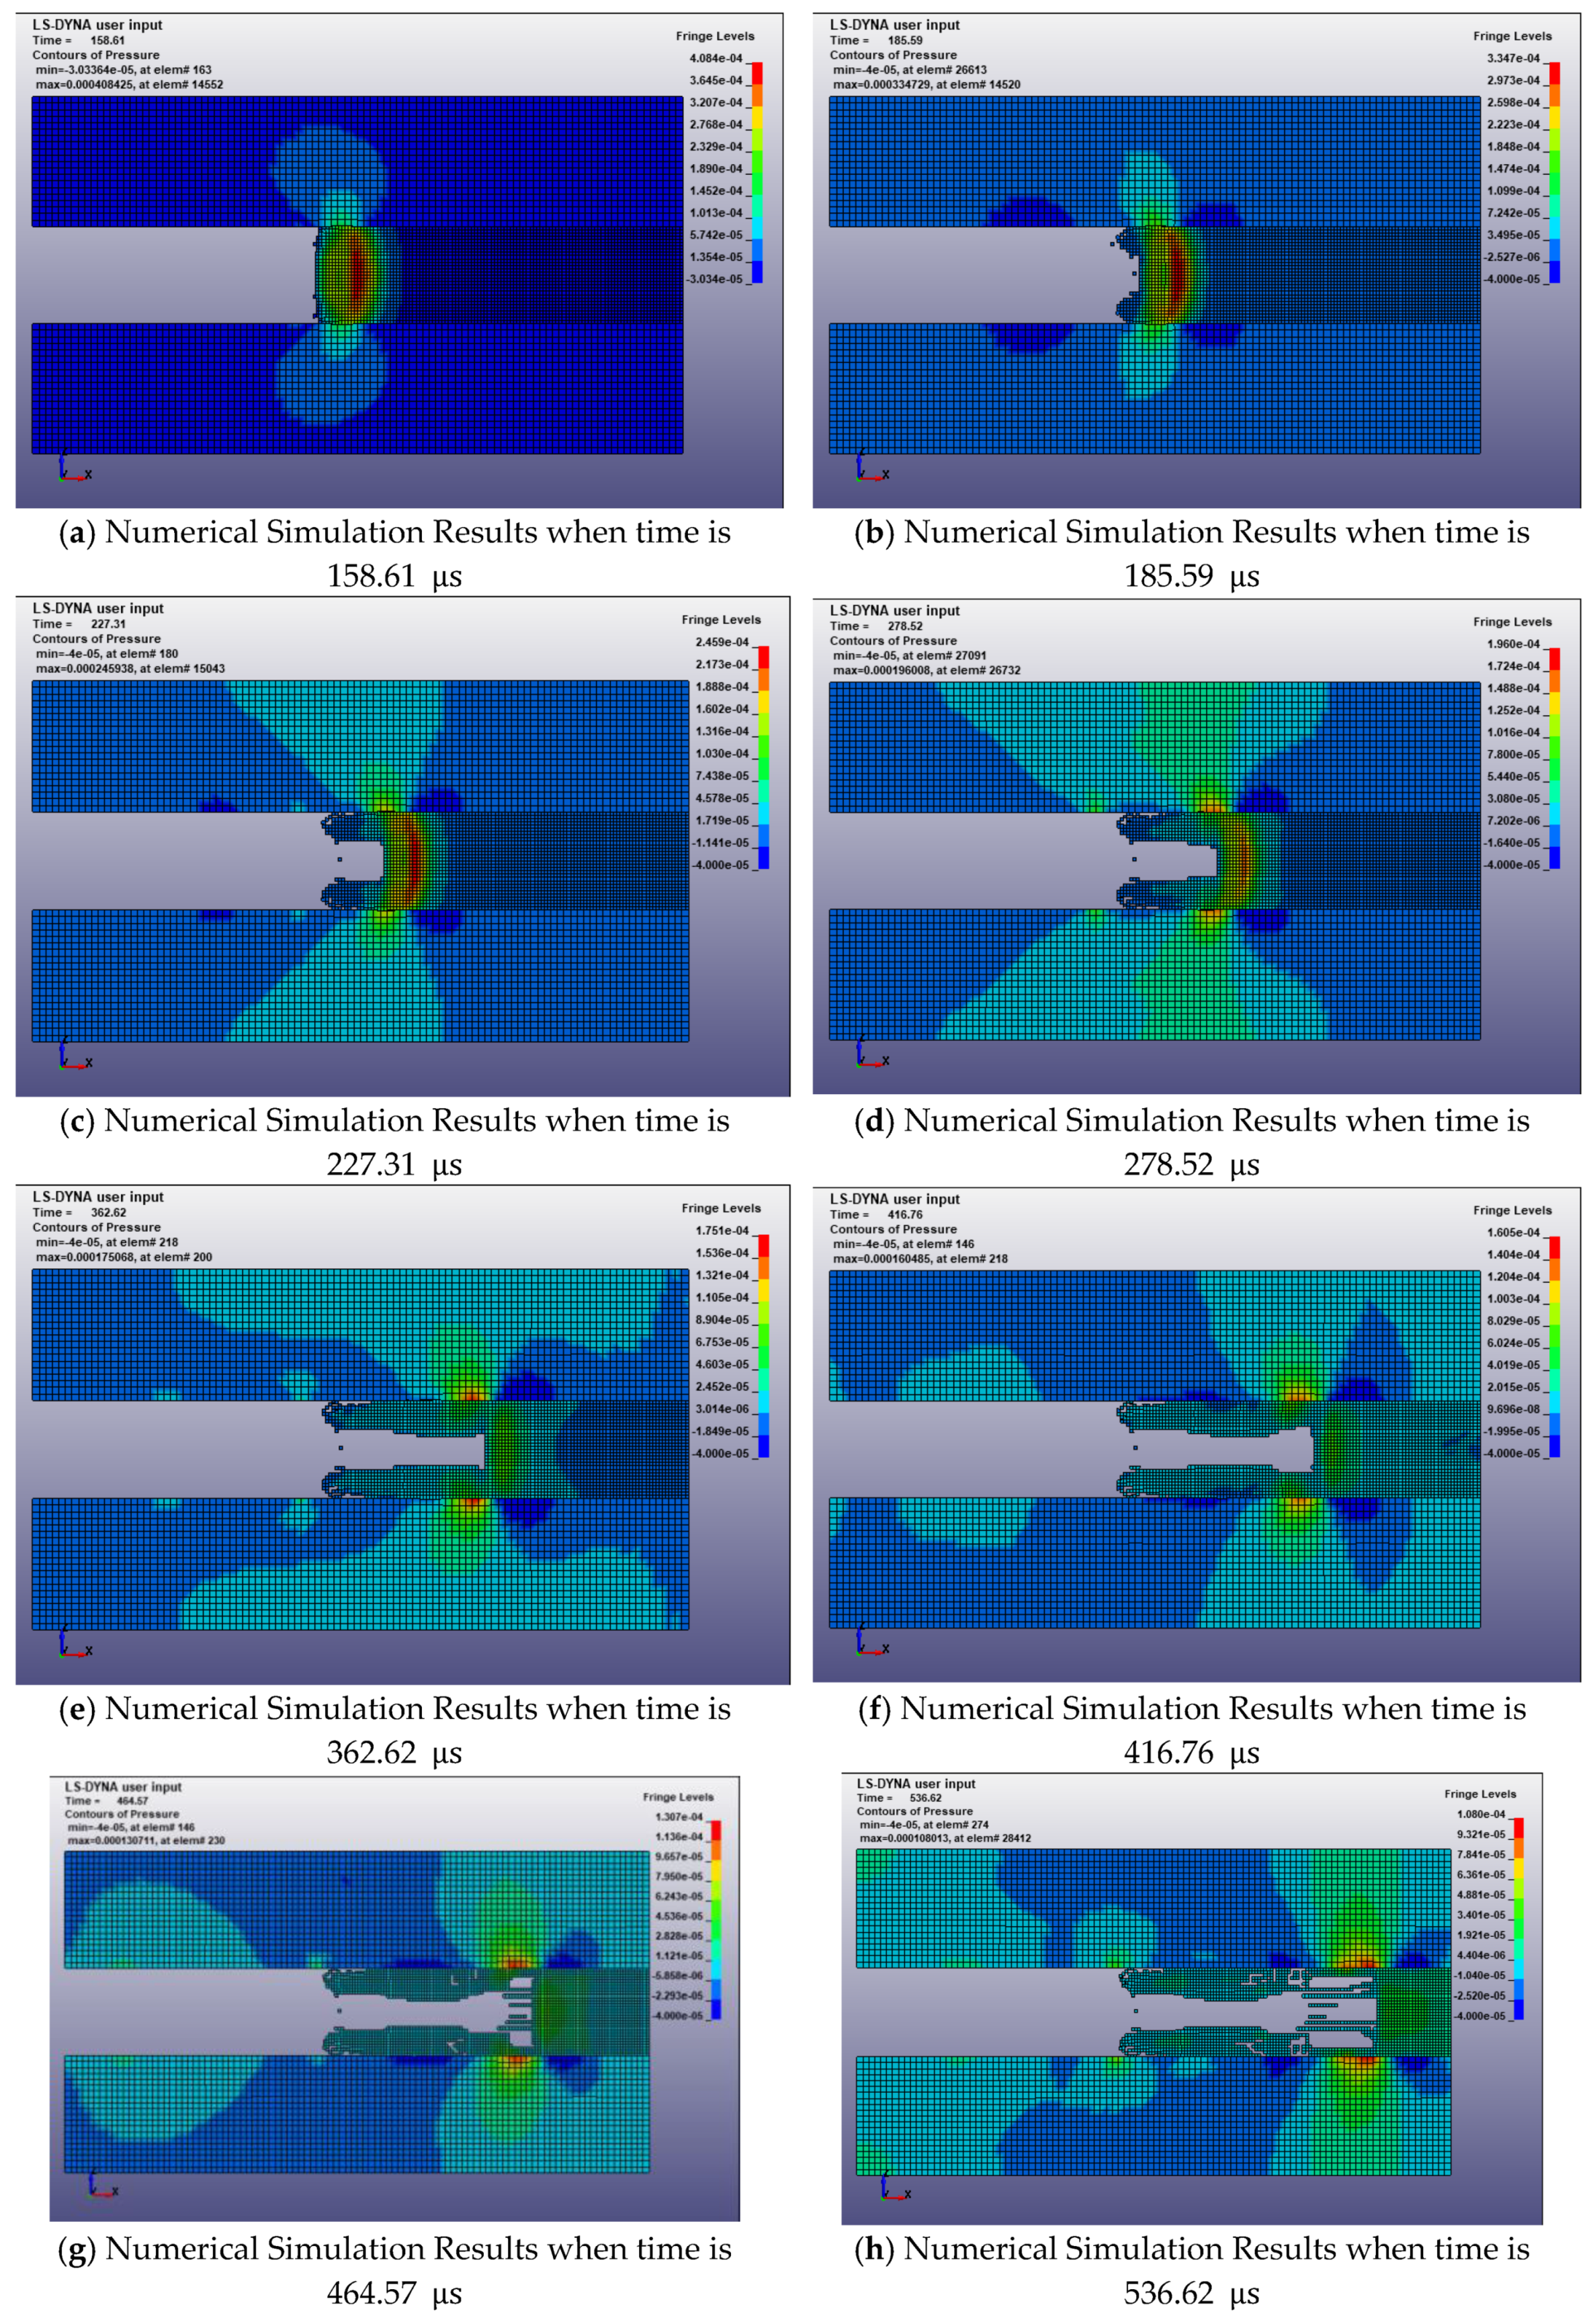
In underground blasting operations, the shockwave generated by blasting releases huge amounts of energy to the surrounding area, which may cause the deformation, cracking, and even destruction of roadways and other structures. Explosion energy can loosen or destroy coal rock masses in the process of shockwave release and propagation. The numerical simulation of the impact damage of the tunneling face predicts the power of the disaster caused by the head. Numerical simulation results are shown in Figure 18.
Figure 18 clearly shows the destruction process of the coal seam in the roadway. As can be seen, at t = 158.61 μs, the spreading stress wave contacted the coal seam and triggered its failure. When t = 227.31 μs, the coal seam was cracked by the action of the compressive stress wave, which continued to propagate deep into the coal seam. At t = 278.52 μs, the crack gradually expanded and the coal seam was notched. When t = 416.76 μs, the size of the gap generated in the coal seam was increased with by the propagation of stress wave. Finally, when t = 536.62 μs, a large cavity was formed deep in the coal seam as the gap was increased.
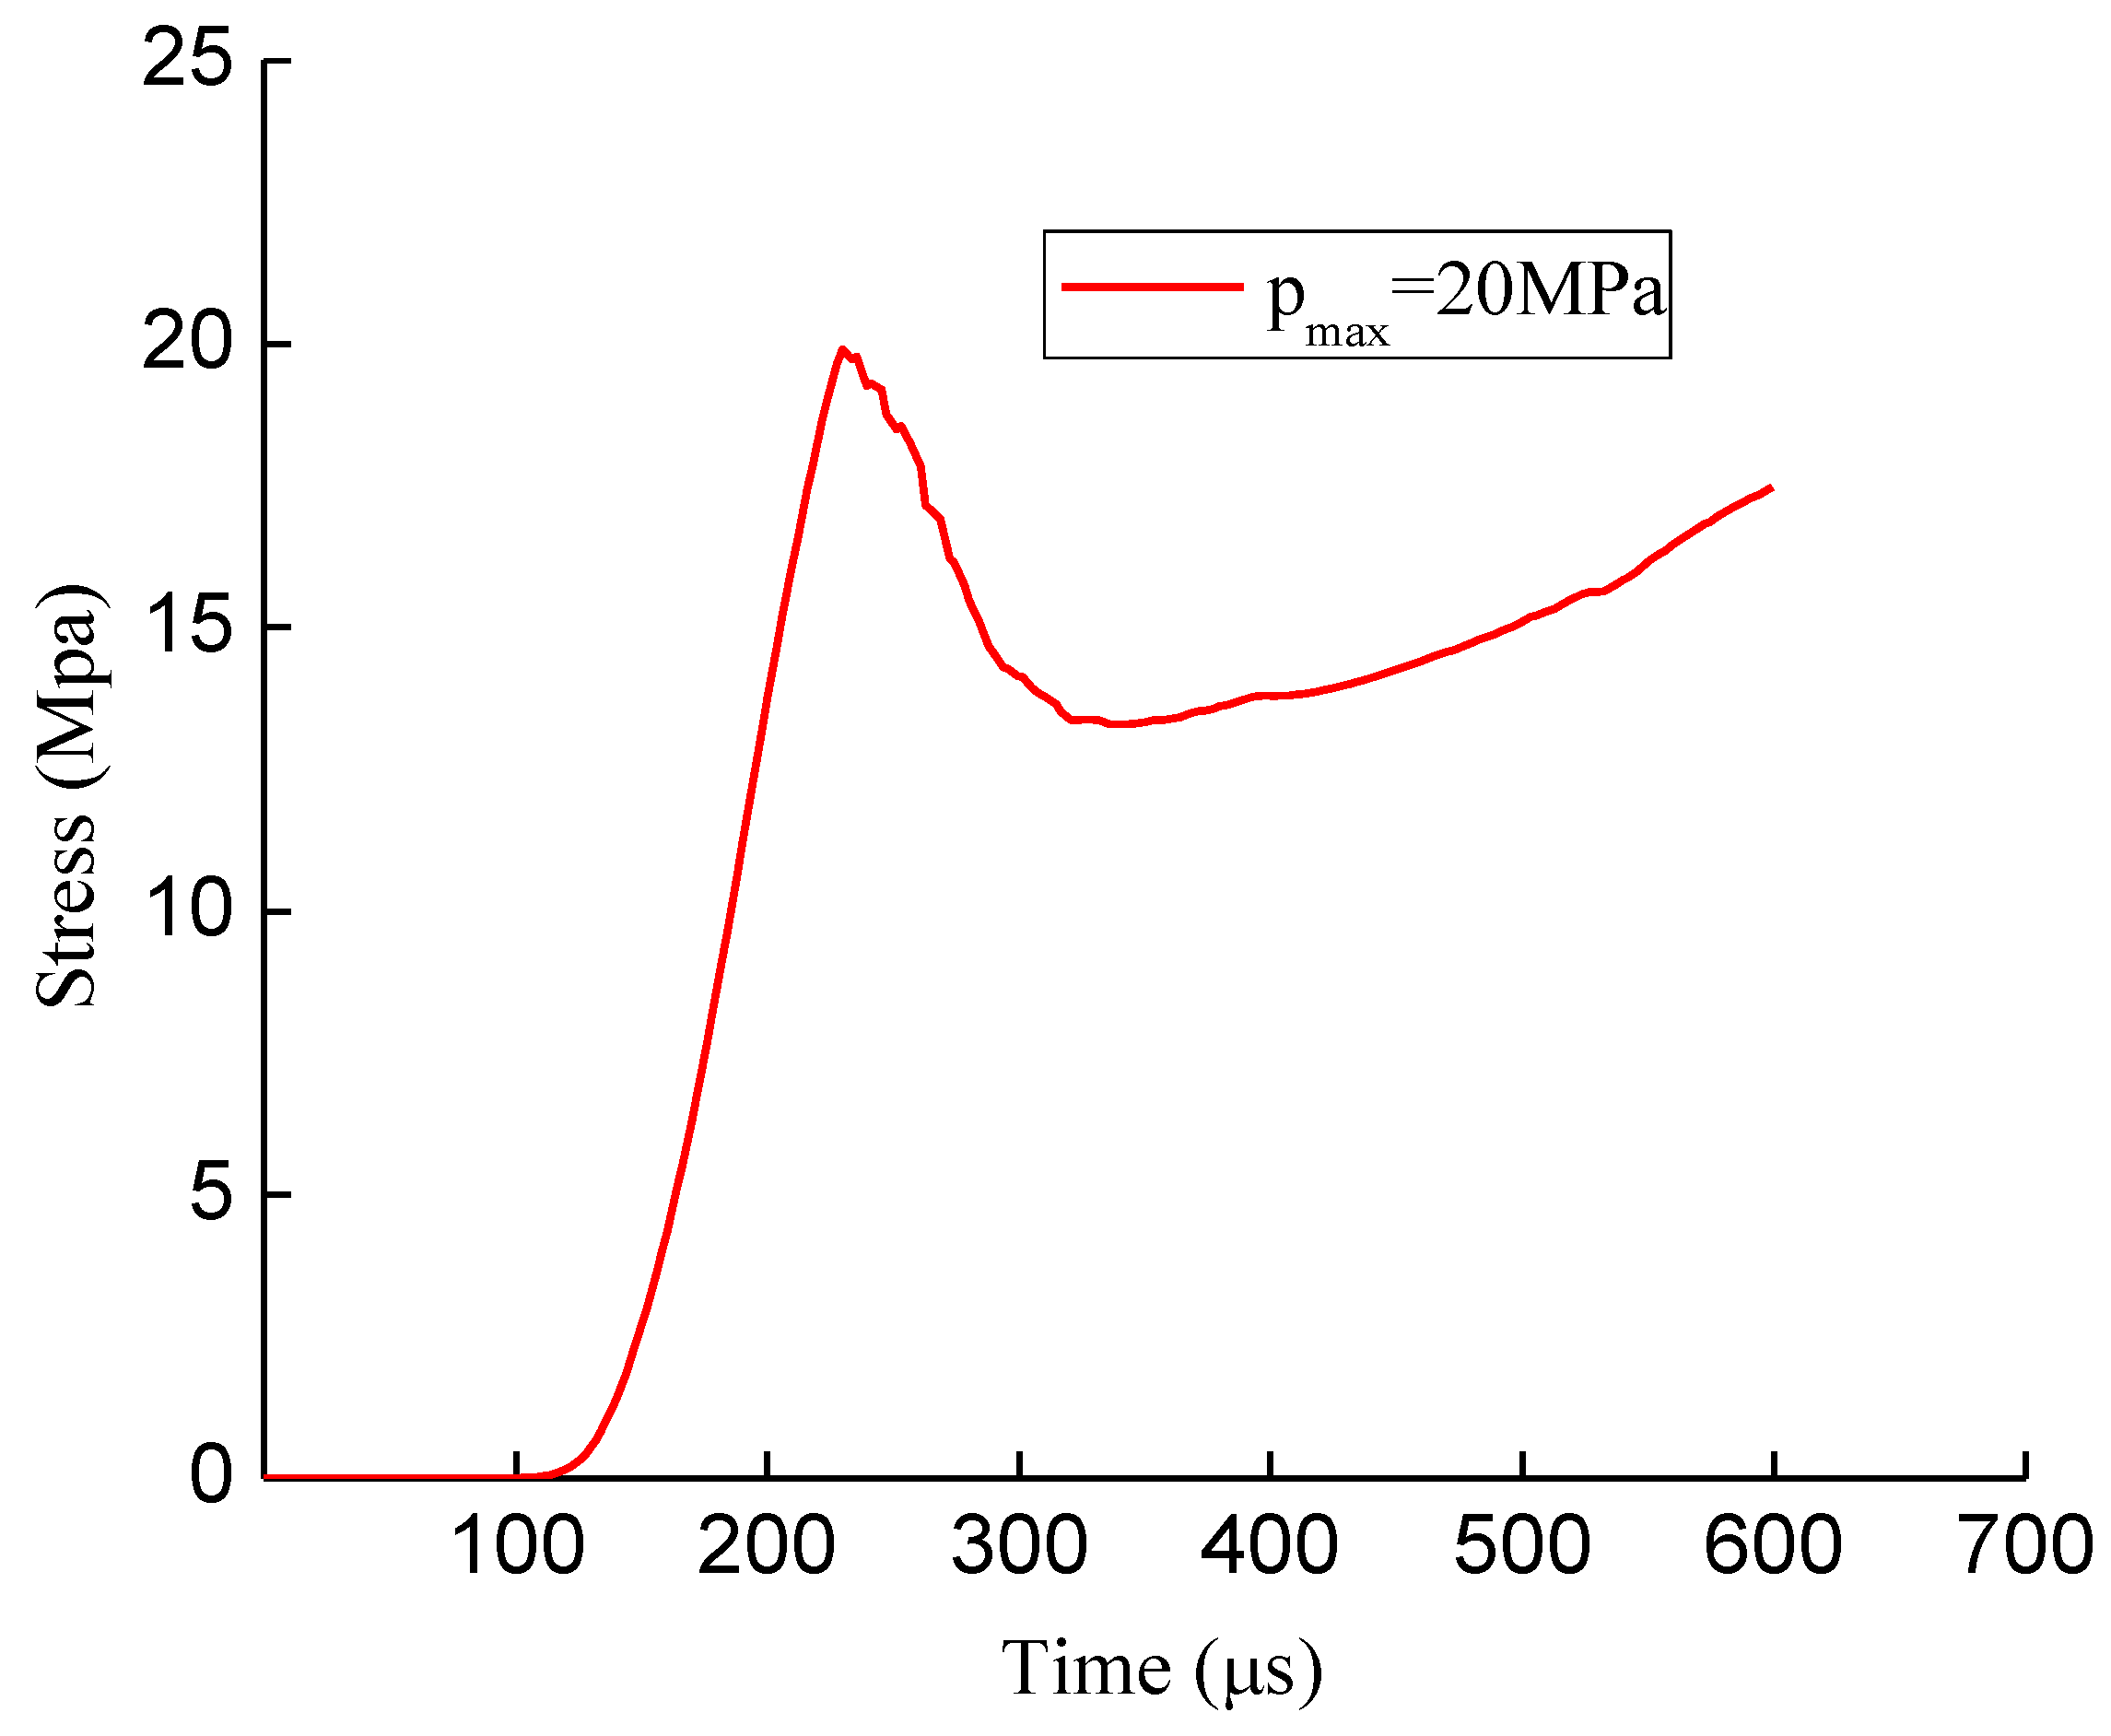
The stress time-history curve of the coal seam in a two-dimensional model is shown in Figure 19. As can be seen, first the coal seam was cracked and destroyed by the propagation of the stress wave. The curve first rose sharply to the yield point and then began to fall. Then, as the stress wave propagated deep into the coal seam, the curve began to rise again and the coal seam was destroyed.
7. Conclusions
Through SHPB experiments of briquette combined with experimentally measured HJC constitutive parameters and ANSYS/LS-DYNA software results, the following conclusions can be drawn:
- (1)
- Through direct experimental measurements and indirect equation derivations, the main sensitivity parameters of the coal HJC constitutive model were obtained, which were of great importance in understanding the occurrence mechanism and predicting coal-rock dynamic disasters.
- (2)
- The failure of coal briquettes at different impact velocities started with the creation of axial cracks in the middle of the coal body. The destructed coal body included slip failure, tensile failure caused by compression expansion, and crack expansion and slip shear joint failure phenomena.
- (3)
- The fracture morphology of the briquette samples was different at different impact velocities. As the impact velocity increased, the severity of coal body damage increased and the size of the coal block decreased. At lower speeds, coal samples were intact and cracks appeared only on the surface. At higher impact velocities, however, coal samples underwent “comminuted” rupture, producing a large amount of fine granular coal dust.
- (4)
- The numerical simulation of the SHPB experiment was carried out using the experimentally measured parameters of the HJC constitutive model for briquette. The simulated and experimentally measured stress wave curves complied well. Comparing the experimental and numerical simulation results obtained for coal sample failure and fracture morphology at different impact velocities (4.732 and 7.267 m/s) revealed that all coal samples produced axial cracks starting from the middle of the coal body and then failed. The experimental and numerical simulation results for the coal sample crushing process and fracture results were similar.
- (5)
- The validated parameter values of the HJC constitutive model were applied to the numerical model of tunneling impact damage, which visually showed the process of coal seam damage in a roadway. It was observed that the simulation of the failure of coal samples under the impact of dynamic loads was possible using HJC constitutive model parameter values.
Author Contributions
B.X. conceived and designed the research; Z.Y. performed the experiment and wrote the manuscript. Y.D. undertook data curation; Z.Z. was responsible for software; X.Z. reviewed and edited the manuscript.
Funding
This research was supported by the National Natural Science Foundation of China (51404277, 51274206) and the State Key Laboratory Cultivation Base for Gas Geology and Gas Control (Henan Polytechnic University) (WS2018B08). This support is greatly acknowledged and appreciated.
Acknowledgments
Y.Y., J.J.Z., and S.Z.F. are acknowledged for their valuable technical support.
Conflicts of Interest
The authors declare no conflict of interest.
References
- Li, X.J.; Liu, B.Q. Status of research and analysis on coal and gas outburst mechanism. Coal Geol. Explor. 2010, 38, 7–13. [Google Scholar]
- Gong, F.Q.; Ye, H.; Luo, Y. The Effect of high loading rate on the behaviour and mechanical properties of coal-rock combined body. Shock Vib. 2018, 2018. [Google Scholar] [CrossRef]
- He, X.Q.; Dou, L.M.; Mu, Z.L. Continuous monitoring and warning theory and technology of rock burst dynamic disaster of coal. J. China Coal Soc. 2014, 39, 1485–1491. [Google Scholar]
- Xue, D.; Zhou, J.; Liu, Y.; Zhang, S. A strain-based percolation model and triaxial tests to investigate the evolution of permeability and critical dilatancy behavior of coal. Processes 2018, 6, 127–149. [Google Scholar] [CrossRef]
- Cai, T.T.; Feng, Z.C.; Jiang, Y.L. An improved hardening-damage creep model of lean coal: A theoretical and experimental study. Arab. J. Geosci. 2018, 11, 645. [Google Scholar] [CrossRef]
- Li, Q.; Liang, Y.; Zou, Q. Seepage and damage evolution characteristics of gas-bearing coal under different cyclic loading–unloading stress paths. Processes 2018, 6, 190–210. [Google Scholar] [CrossRef]
- Zhao, Y.X.; Gong, S.; Zhang, C.G.; Zhang, C.G.; Zhang, Z.N.; Jiang, Y.D. Fractal characteristics of crack propagation in coal under impact loading. Fractals-Complex Geom. Patterns Scaling Nat. Soc. 2018, 26. [Google Scholar] [CrossRef]
- Feng, J.J.; Wang, E.Y.; Shen, R.X.; Chen, L.; Li, X.L.; Xu, Z.Y. Investigation on energy dissipation and its mechanism of coal under dynamic loads. Geomech. Eng. 2016, 11, 657–670. [Google Scholar] [CrossRef]
- Li, C.W.; Wang, Q.F.; Lv, P.Y. Study on electromagnetic radiation and mechanical characteristics of coal during an SHPB test. J. Geophys. Eng. 2016, 13, 391–398. [Google Scholar]
- Gao, Z.; Ding, S.X.; Cecati, C. Real-time fault diagnosis and fault-tolerant control. IEEE Trans. Ind. Electron. 2015, 62, 3752–3756. [Google Scholar] [CrossRef]
- Zhang, C.; Zhang, L.; Tu, S.H. Experimental and Numerical Study of the Influence of Gas Pressure on Gas Permeability in Pressure Relief Gas Drainage. Transp. Porous Media 2018, 134, 995–1015. [Google Scholar] [CrossRef]
- Xie, J.; Xu, J.; Wang, F. Mining-induced stress distribution of the working face in a kilometer-deep coal mine-a case study in Tangshan coal mine-a case study in Tangshan coal mine. J. Geophys. Eng. 2018, 15, 2060–2070. [Google Scholar] [CrossRef]
- Liu, Q.L.; Wang, E.Y.; Kong, X.G.; Li, Q.; Hu, S.B.; Li, D.X. Numerical simulation on the coupling law of stress and gas pressure in the uncovering tectonic coal by cross-cut. Int. J. Rock Mech. Min. Sci. 2018, 103, 33–42. [Google Scholar] [CrossRef]
- Li, C.W.; Ai, D.H.; Sun, X.Y.; Xie, B.J. Crack identification and evolution law in the vibration failure process of loaded coal. J. Geophys. Eng. 2017, 14, 975–986. [Google Scholar] [CrossRef]
- Holmquist, T.J.; Johnson, G.R. A computational constitutive model for glass subjected to large strains, high strain rates and high pressures. J. Appl. Mech. 2011, 78. [Google Scholar] [CrossRef]
- Iqbal, M.A.; Kumar, V.; Mittal, A.K. Experimental and numerical studies on the drop impact resistance of prestressed concrete plates. Int. J. Impact Eng. 2016, 11, 657–670. [Google Scholar] [CrossRef]
- Kong, X.Z.; Fang, Q.; Wu, H.; Peng, Y. Numerical predictions of cratering and scabbing in concrete slabs subjected to projectile impact using a modified version of HJC material model. Int. J. Impact Eng. 2016, 95, 61–71. [Google Scholar] [CrossRef]
- Islam, M.J.; Swaddiwudhipong, S.; Liu, Z.S. Penetration of concrete targets using a modified Holmquist-Johnson-cook material model. Int. J. Comput. Methods 2012, 9. [Google Scholar] [CrossRef]
- Yuan, P.; Ma, Q.; Ma, D. Stress uniformity analyses on nonparallel end-surface rock specimen during loading process in SHPB tests. Adv. Civ. Eng. 2018, 2018. [Google Scholar] [CrossRef]
- Xie, B.J. Experimental research on characteristics of coal impact damage. China Univ. Min. Technol. Beijing 2013, 3, 56–60. [Google Scholar]
- Li, C.W.; Wang, J.G.; Xie, B.J. Numerical simulation of SHPB tests for coal by using HJC model. J. Min. Saf. Eng. 2016, 33, 158–164. [Google Scholar]
- Li, C.W.; Wang, J.G.; Xie, B.J. Numerical analysis of split hopkinson pressure bar test with passive confined pressure for coal. J. Min. Saf. Eng. 2014, 31, 957–962. [Google Scholar]
- Chen, J.L.; Li, X.D.; Liu, K.X. Experimental research on parameters of constitutive model for a cement mortar. Acta Sci. Nat. Univ. Pekin. 2008, 5, 689–694. [Google Scholar]
- Ren, G.M.; Wu, H.; Fang, Q.; Zhou, J.W. Determinations of HJC constitutive model parameters for normal strength concrete. J. Vib. Shock 2016, 35, 9–16. [Google Scholar]
- Wang, K.; Jiang, Y.F.; Xu, C. Mechanical properties and statistical damage model of coal with different moisture contents under uniaxial compression. Chin. J. Rock Mech. Eng. 2018, 37, 1070–1079. [Google Scholar]
- Chen, L.J.; Chai, Y.Y.; Zhu, C.H. Study of micro-structure of briquette. J. China Coal Soc. 1997, 3, 82–84. [Google Scholar]
- Chen, Y.G.; Liu, C.D.; Zhong, S. Research on the influences of soft layer on coal thickness & coal and gas outburst. Ind. Saf. Environ. Prot. 2013, 39, 42–45. [Google Scholar]
- Li, Y.; Li, H.P.; Wu, X.T. Research on the HJC dynamic constitutive model for concrete. J. Hefei Univ. Technol. (Nat. Sci.) 2009, 32, 1244–1248. [Google Scholar]
- Xie, B.J.; Wang, X.Y.; Lu, P.Y. Dynamic properties of bedding coal and rock and the SHPB testing for its impact damage. J. Vib. Shock. 2017, 36, 117–124. [Google Scholar]
- Lu, J.G.; Wang, T.; Ding, W.B. Induction mechanisms of coal bumps caused by thrust faults during deep mining. J. China Coal Soc. 2018, 43, 405–416. [Google Scholar]
- Qin, H. Study on mechanism of roadway surrounding rock instability and rock burst. China Univ. Min. Technol (Beijing). 2008, 5, 77–81. [Google Scholar]
Figure 1.
Preparation of briquette coal sample.

Figure 2.
KYKY-EM6200 tungsten filament scanning electron microscope.

Figure 3.
Scanning electron microscope images of the prepared coal samples.

Figure 4.
Multifunctional triaxial testing machine.

Figure 5.
Uniaxial compression stress–strain curve.

Figure 6.
Splitting test specimen failure morphologies.

Figure 7.
The acquisition method for parameter .

Figure 8.
Experimental stress–strain curve of uniaxial cyclic loading.

Figure 9.
Curves of different principal stresses at different confining pressures.

Figure 10.
Curve of B and N fitting values.

Figure 11.
Spinning cone bullet.

Figure 12.
50 mm split Hopkinson pressure bar (SHPB) experimental device.

Figure 13.
Establishment of the finite element model.

Figure 14.
Experimental results (v = 7.267 m/s).

Figure 15.
Simulation results (v = 7.267 m/s).

Figure 16.
Dynamic change process of the impact failure of a coal body.


Figure 17.
Establishment of a two-dimensional coal and rock mass model including a roadway.

Figure 18.
Excavation surface impact damage process ( = 20 MPa).

Figure 19.
Time-history curve of coal seam stress in a 2D model.


Table 1.
Holmquist–Johnson–Cook (HJC) constitutive model material parameter classification.
| Category | Parameter Name | Symbol |
|---|---|---|
| Basic material parameters | Density | |
| Shear modulus | G | |
| Quasi-static uniaxial compressive strength | ||
| Maximum stretching hydrostatic pressure | T | |
| Material strength parameters | Normalized cohesive strength | A |
| Normalized pressure hardening coefficient | B | |
| Pressure hardening index | N | |
| Strain rate coefficient | C | |
| Maximum normalized intensity | ||
| Material pressure parameters | Volume pressure at crushing point | |
| Volumetric strain at crushing point | ||
| Pressure at compaction point | ||
| Volumetric strain at compaction point | ||
| Pressure constant | ||
| Pressure constant | ||
| Pressure constant | ||
| Material damage parameters | Minimum plastic strain at material failure point | |
| Damage parameter | ||
| Damage parameter | ||
| Software parameter | Reference strain rate | |
| Failure type |
Table 2.
Parameters of cylindrical briquette coal samples.
| Sample No | Quality/g | Length/mm | Diameter/mm | Density/g.cm−1 |
|---|---|---|---|---|
| XM-01 | 258.4 | 100.50 | 51.70 | 1.225 |
| XM-02 | 256.7 | 100.46 | 51.60 | 1.222 |
| XM-03 | 255.1 | 100.52 | 51.60 | 1.214 |
| XM-04 | 257.3 | 100.20 | 51.70 | 1.223 |
| XM-05 | 255.6 | 100.27 | 51.70 | 1.214 |
| XM-06 | 250.4 | 95.40 | 51.70 | 1.250 |
| XM-07 | 251.5 | 96.25 | 51.58 | 1.251 |
| XM-08 | 255.0 | 99.40 | 51.62 | 1.226 |
| XM-09 | 256.3 | 97.37 | 51.60 | 1.259 |
| XM-10 | 254.5 | 96.60 | 51.60 | 1.260 |
| XM-11 | 252.0 | 99.78 | 51.70 | 1.203 |
| XM-12 | 251.9 | 100.25 | 51.65 | 1.199 |
| XM-13 | 254.4 | 100.06 | 51.60 | 1.216 |
| XM-14 | 254.0 | 99.60 | 51.57 | 1.221 |
| XM-15 | 253.9 | 100.34 | 51.70 | 1.205 |
| XM-16 | 252.7 | 95.70 | 51.67 | 1.259 |
| XM-17 | 255.1 | 100.40 | 51.60 | 1.215 |
| XM-18 | 252.6 | 98.15 | 51.57 | 1.232 |
| XM-19 | 253.7 | 98.32 | 51.70 | 1.229 |
| XM-20 | 253.9 | 98.28 | 51.60 | 1.236 |
| XM-21 | 254.1 | 99.95 | 51.60 | 1.216 |
| XM-22 | 250.8 | 96.07 | 51.70 | 1.244 |
Table 3.
Parameters of disc-type briquette samples.
| Sample No | Quality/g | Length/mm | Diameter/mm |
|---|---|---|---|
| YP-01 | 68.3 | 25.40 | 52.30 |
| YP-02 | 68.7 | 26.24 | 52.36 |
| YP-03 | 68.2 | 25.18 | 52.00 |
| YP-04 | 68.0 | 24.64 | 52.40 |
Table 4.
Uniaxial compression test results.
| Sample No. | Compressive Strength/MPa | Peak Axial Strain/10−2 | Peak Radial Strain/10−2 | Elastic Modulus/MPa | Poisson’s Ratio |
|---|---|---|---|---|---|
| XM-01 | 2.54 | 2.51 | −0.81 | 101.19 | 0.32 |
| XM-06 | 2.05 | 1.95 | −0.75 | 105.13 | 0.38 |
| XM-15 | 2.39 | 2.43 | −0.89 | 98.35 | 0.37 |
Table 5.
Sample tensile strength values.
| Sample No | Failure Load/KN | Length/mm | Diameter/mm | Tensile Strength/MPa |
|---|---|---|---|---|
| YP-01 | 1.133 | 25.40 | 52.30 | 0.54 |
| YP-02 | 1.136 | 26.24 | 52.36 | 0.53 |
| YP-03 | 1.243 | 25.18 | 52.00 | 0.60 |
| YP-04 | 1.080 | 24.64 | 52.40 | 0.53 |
Table 6.
Value of Parameter .
| Sample No | Average Value | |
|---|---|---|
| XM-16 | 0.026 | 0.025 |
| XM-19 | 0.024 |
Table 7.
Normalized principal stress difference and hydrostatic pressure .
| Principal Stress Difference/MPa | Hydrostatic Pressure/MPa |
|---|---|
| 1.979 | 1.090 |
| 2.876 | 1.815 |
| 3.830 | 2.570 |
| 4.382 | 3.176 |
Table 8.
Coal HJC constitutive model parameter values.
| /g.cm−3 | G/Pa | /Pa | A | B | C | N | D1 | D2 | ||
| 1.228 | 37.34 × 10⁶ | 2.33 × 10⁶ | 0.4 | 1.86 | 0.005 | 0.75 | 7.0 | 0.0131 | 1.0 | 0.025 |
| T/Pa | /Pa | /Pa | /Pa | /Pa | /Pa | |||||
| 5.5 × 10⁵ | 7.8 × 10⁵ | 0.0064 | 1 × 10⁹ | 0.12 | 8.5 × 10¹⁰ | 1.7 × 10¹¹ | 2.08× 10¹¹ | 60 | 0.04 | |
© 2019 by the authors. Licensee MDPI, Basel, Switzerland. This article is an open access article distributed under the terms and conditions of the Creative Commons Attribution (CC BY) license (http://creativecommons.org/licenses/by/4.0/).
Share and Cite
MDPI and ACS Style
Xie, B.; Yan, Z.; Du, Y.; Zhao, Z.; Zhang, X. Determination of Holmquist–Johnson–Cook Constitutive Parameters of Coal: Laboratory Study and Numerical Simulation. Processes 2019, 7, 386. https://0-doi-org.brum.beds.ac.uk/10.3390/pr7060386
AMA Style
Xie B, Yan Z, Du Y, Zhao Z, Zhang X. Determination of Holmquist–Johnson–Cook Constitutive Parameters of Coal: Laboratory Study and Numerical Simulation. Processes. 2019; 7(6):386. https://0-doi-org.brum.beds.ac.uk/10.3390/pr7060386
Chicago/Turabian StyleXie, Beijing, Zheng Yan, Yujing Du, Zeming Zhao, and Xiaoqian Zhang. 2019. "Determination of Holmquist–Johnson–Cook Constitutive Parameters of Coal: Laboratory Study and Numerical Simulation" Processes 7, no. 6: 386. https://0-doi-org.brum.beds.ac.uk/10.3390/pr7060386
Note that from the first issue of 2016, this journal uses article numbers instead of page numbers. See further details here.