1. Introduction
Biopharmaceuticals represent a growing fraction of pharmaceutical production and can be used for the treatment of many diseases such as cancer, rheumatism, or nephrogenic anemia. Biopharmaceutical production processes consist of drug substance and drug product manufacturing. Drug substance (DS) manufacturing involves the production of the active pharmaceutical ingredient (API) through upstream cell cultivation and purification processes. On the other hand, drug product (DP) manufacturing involves compounding of the API to the final concentration and sterile filling into vials or syringes.
The equipment used in drug manufacturing processes must satisfy certain quality requirements of cleanliness and sterility to be ready for production [
1]. New trends of shifting to small-scale and multiple-product production have increased work of change-over operations that are conducted to maintain equipment readiness for production between different batches or products. To realize flexible and efficient production, new technologies, e.g., continuous technology or single-use technology (SUT) are applied [
2,
3], which have increased the number of possible process alternatives. Continuous technology is actively investigated both in small molecule drug manufacturing [
4] and biopharmaceutical manufacturing [
5] through modeling [
6] and experimental approaches [
7]. SUT, another newly applied technology, uses disposable resin-made equipment requiring less time for change-over operations and cleaning validation. SUT can replace the conventional multi-use technology (MUT) featuring reusable stainless steel equipment, which requires cleaning and sterilization for change-over.
The choice between process alternatives involving SUT and MUT equipment is multifaceted. The two technologies feature different characteristics in terms of investment, operational risks, and quality challenges. SUT requires lower initial investment but higher running costs to replace the disposable equipment, whereas MUT requires higher initial investment to install the equipment but lower running costs. Maintaining a constant inventory of the sterile manufacturing equipment is an important scheduling decision, which is required to avoid the supply risks of SUT equipment and production interruptions. Various environmental concerns emerge depending on the chosen equipment technology, e.g., emissions form production and disposal of the resin-made equipment versus the utility consumption associated with the cleaning and sterilization processes required for the stainless-steel equipment. In addition, different quality issues arise with each technology, such as chemical compounds leaching from resin material into the drug solution for SUT, and cross-contamination due to failures in the cleaning procedure for MUT. Therefore, the optimal implementation of available technologies requires multi-criteria decision-making. Previous studies have evaluated these technology options using a single evaluation indicator, with a focus on DS manufacturing, such as with economic or environmental evaluations [
8,
9,
10,
11]. The authors have also presented a framework for the multi-objective evaluation of equipment choice in sterile filling applications of DP manufacturing [
12,
13]. Another layer of complexity in the decision-making process is the consideration of hybrid equipment technology alternatives combining both resin-made and stainless-steel-made equipment in the same process. One hybrid technology option was considered in a previous work that applies stainless-steel-made fermentation tank and other resin-made equipment [
14]. Ha.S., S.B., and Hi.S., part of the authors of this paper, have also previously developed algorithms for the systematic generation of alternatives and technology choice between SUT, MUT, and hundreds of hybrid alternatives [
15]. However, to navigate the complex decision-making process, tools are needed to facilitate the generation of various alternatives, the multi-layered comprehensive assessment of the generated alternatives, and the analysis and visualization of the results.
The evolution of decision-support and process design tools has revolutionized the bulk chemical industry. The use of such tools, e.g., Aspen Plus and HYSYS [
16,
17], for process static and dynamic simulation has allowed the investigation and analysis of complex processes at different design stages. Specific features of the pharmaceutical industry have limited expanding the use of the same tools. Pharmaceutical production is often carried out in relatively small-scale batches and involves more complex chemical and biological interactions where data can sometimes be unavailable. In addition, another difference in pharmaceutical production is the change-over operations required to ensure equipment readiness. In recent years, the maturing understanding of the processes in the biopharmaceutical sector has led to the development of more appropriate design tools for the pharmaceutical industry. The Aspen Batch Process Developer is a recipe-driven process simulator used for the modeling and design of batch processes that enable economic and environmental evaluation [
18]. SIMBIOPHARMA is a prototype tool developed for the assessment of equipment technology options and production strategies with focus on DS manufacturing [
19]. Other commercial tools are also available such as BioSolve [
20] and Hakobio [
21]. BioSolve is a stand-alone cost evaluation tool, while Hakobio is an online tool for plant layout design and estimated area calculation especially with disposable equipment with a limited analysis function inside the process. On the other hand, DP manufacturing has not been fully addressed by such tools, due to the different nature of the processes involved. DP processes combine physical and chemical processes at compounding and filtration with other mechanical assembly line processes, like processes at the sterile filling stage. A decision support and process design tool is still required in this field.
Our current work presents a decision-support tool for DP manufacturing processes of biopharmaceuticals, considering the choice of SUT, MUT, and hybrid alternatives as equipment materials to be the key decision. The tool provides a comprehensive multi-objective evaluation of several critical aspects including economic, environmental, quality, and supply robustness considerations. The tool “
TECHoice” (/tɛktʃɔɪs/), is derived from the combination of “technology” and “choice”. Several versions of the tool currently exist. A full offline version in MATLAB is developed for use in a local environment. A free access prototype online version applying Hypertext Transfer Protocol (HTTP), which is the focus of this work, is also available. The online feature of this version allows a wider reach for the tool and its underlying models within the academic and industrial communities. A built-in database is included in this version, offering default parameters and properties to aid efforts especially in earlier process development and design stages. A licensed, extended online version of the tool is also currently under development to implement the full range of features and functionalities of the current offline version. The online tool can be accessed from this Uniform Resource Locator (URL):
http://www.pse.t.u-tokyo.ac.jp/TECHoice/ (tested with Google Chrome Version 75.0.3770.100). Our current study focuses on presenting the online prototype version of the tool, describing: the background setup, the range of input functions, visualization of the output, and its role in the analysis of the results. The development of the tool allows potential industrial users access to the models and algorithms developed in an academic field.
2. Overview of the Tool “TECHoice”
2.1. Process and Equipment Technology Description
The manufacturing process for which the tool is developed is the sterile filling process of biopharmaceutical drug product manufacturing.
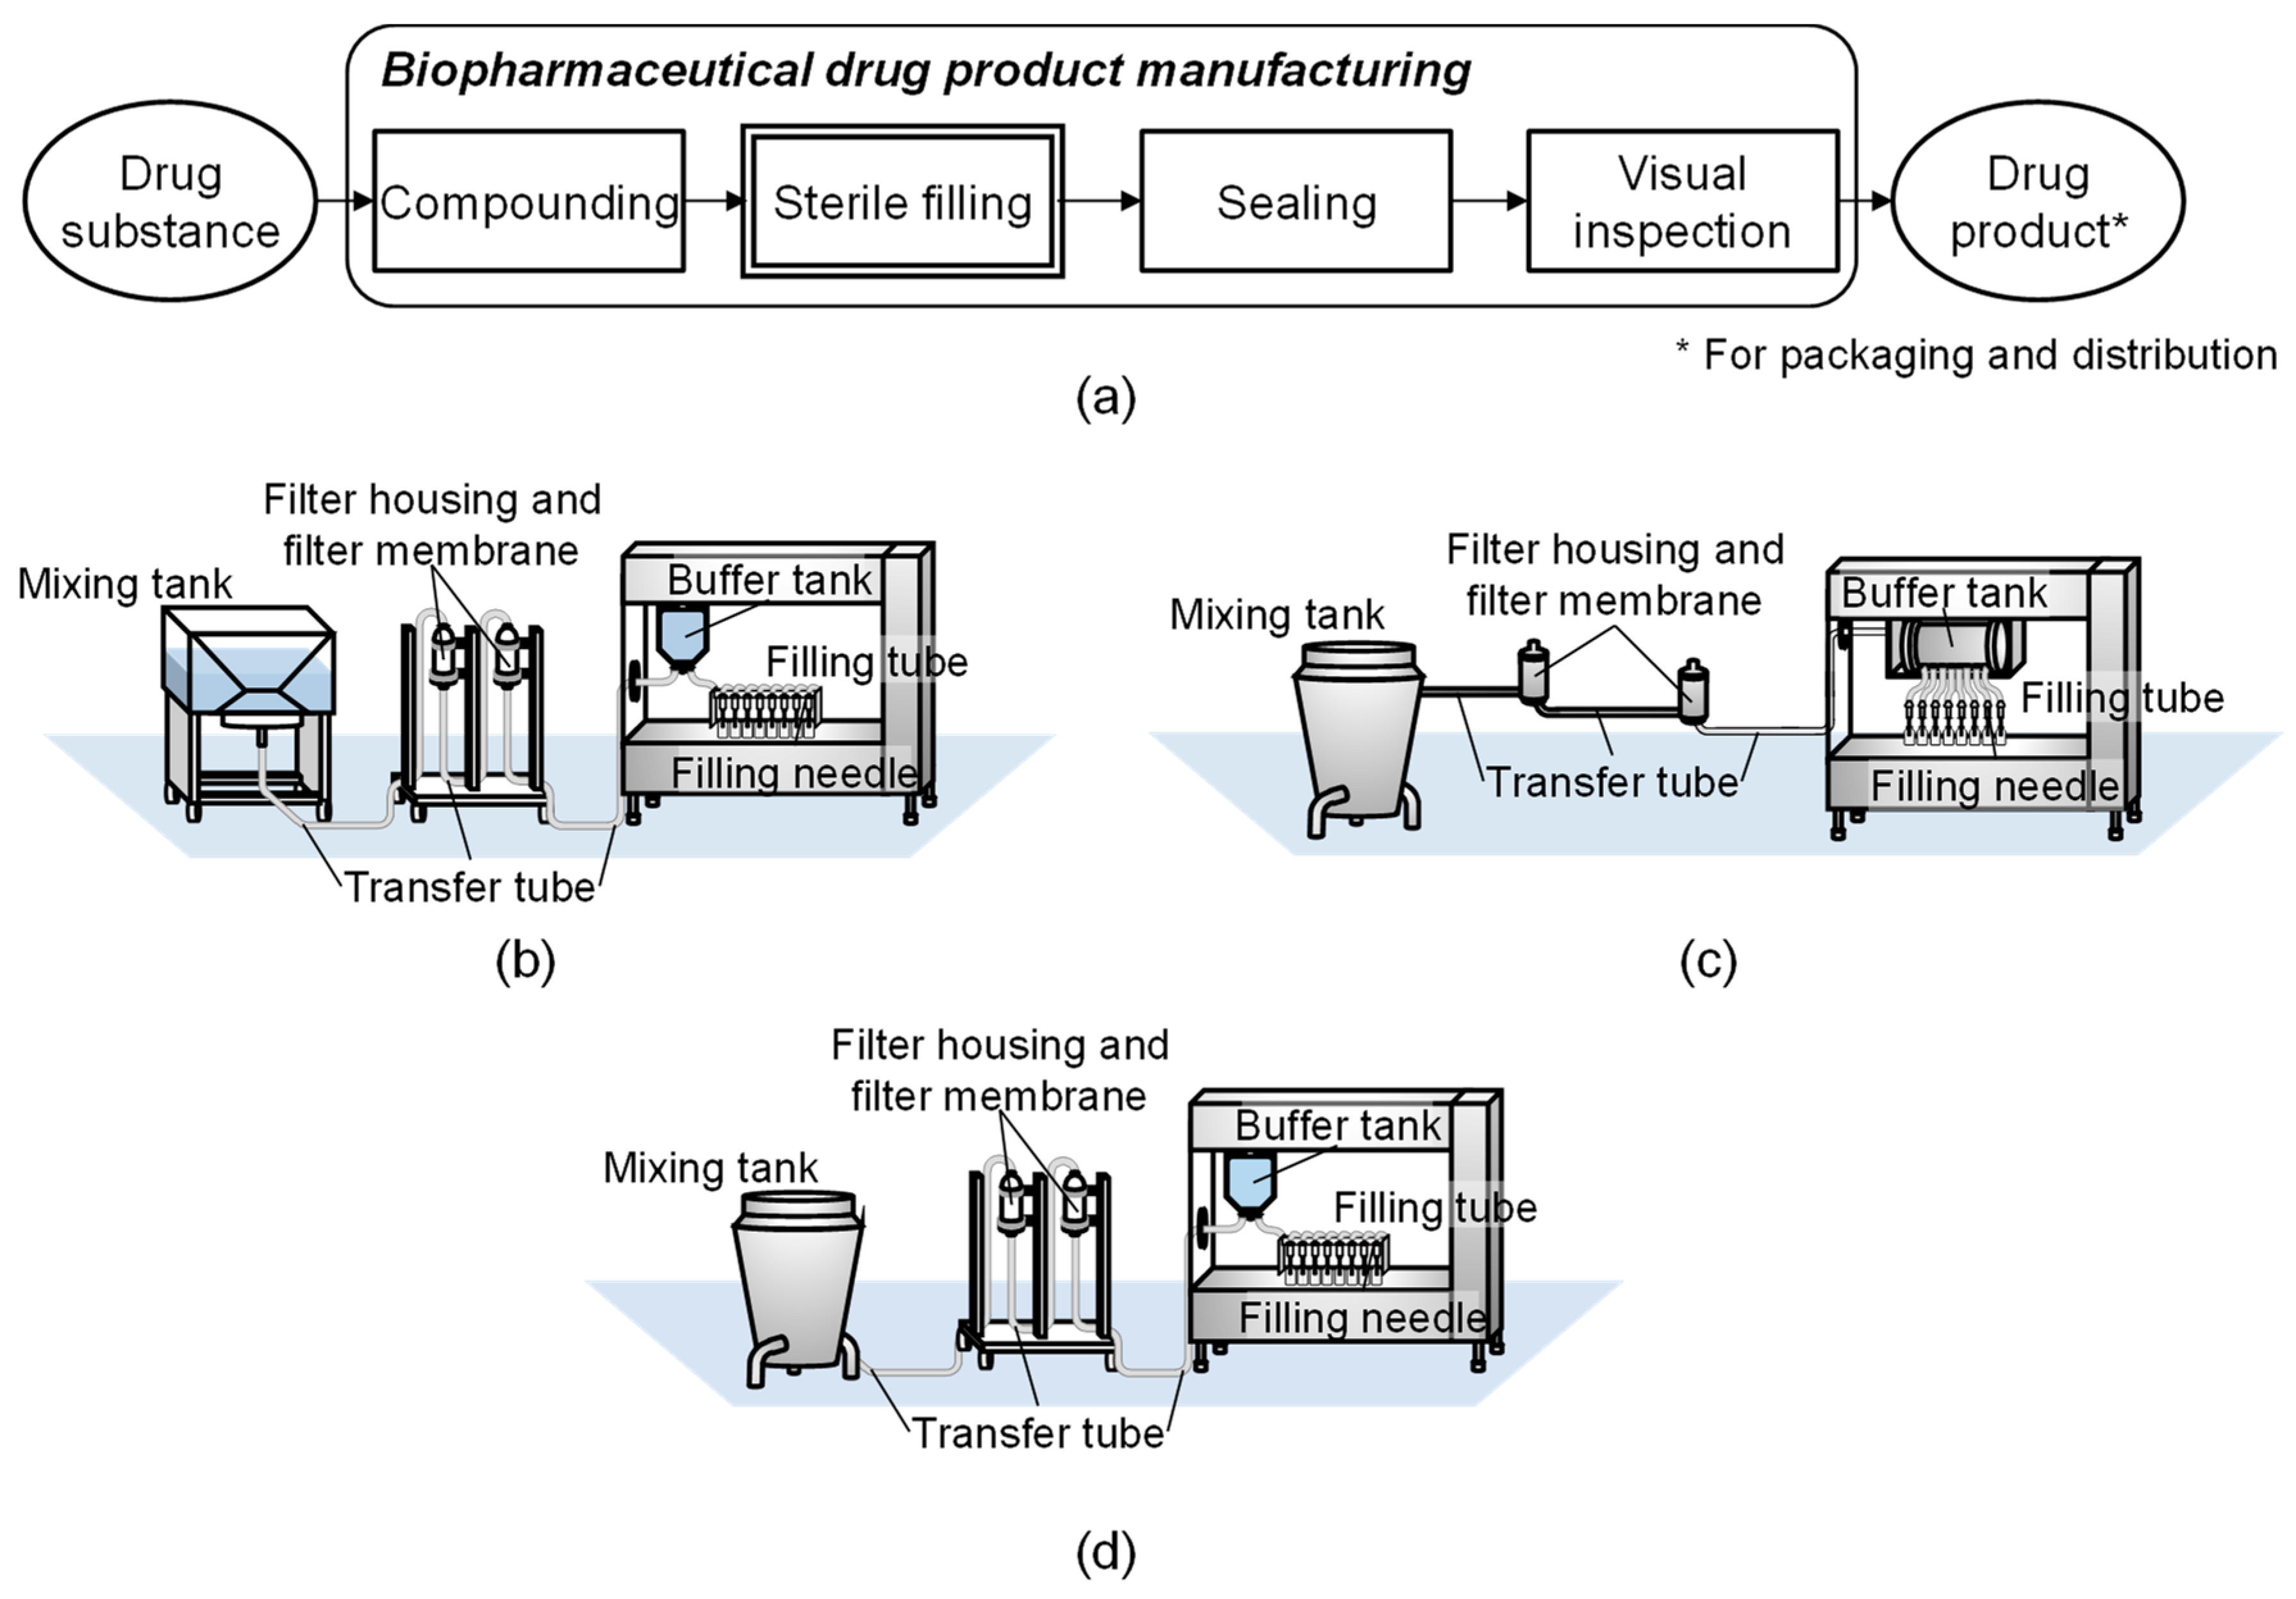
Figure 1 shows a flow of typical biopharmaceutical drug product manufacturing processes with sterile filling. The configurations of full SUT, full MUT, and HYB—a common hybrid plant—are also shown in
Figure 1 [
15]. Sterile filling processes typically involve nine unit operations: retention, two-time-filtration, buffering, filling, and four-time transfer between unit operations. A piece of equipment is allocated to each unit operation with the exception of the filtration unit operations where two pieces of equipment, a filter housing and a filter membrane, are assigned to one operation. Therefore, eleven pieces of equipment are used in sterile filling processes. The two filter membranes and the set of filling tubes can only be resin-made, thus leaving eight pieces of equipment having two options for equipment material (resin or stainless steel). This yields a total of 256 process alternatives: SUT, MUT with stainless steel equipment wherever possible, and 254 available hybrid alternatives.
SUT, MUT, and hybrid technologies have different characteristics in terms of various aspects, as shown in
Table 1. SUT requires shorter time for a change-over operation, which involves assembling and dismantling disposable equipment, but requires a larger number of operators as the operation is manually conducted. MUT, on the other hand, requires a longer time for cleaning and sterilization of the fixed stainless steel facility, i.e., clean-in-place (CIP) and sterilize-in-place (SIP) processes, using media such as water for injection and pure steam. As the operation is automated, the required number of operators is less than those required for SUT. The equipment installed for MUT requires larger investment cost and larger manufacturing area compared to SUT, which uses disposable and flexible resin-made equipment. In SUT, leachables—chemical compounds released from the resin—are a typical concern, while residue caused by cross-contamination from previous drug production, is a typical concern of MUT. Different reasons can cause manufacturing delays in SUT and MUT, affecting supply robustness. For example, delay in transportation of disposables from vendors to pharmaceutical manufacturing companies is a concern in the case of SUT, and equipment failure requiring extensive maintenance is a concern for MUT.
2.2. Need for the Tool
An intensive discussion with experts from the ISPE (International Society of Pharmaceutical Engineering) Japan community of practice “PharmaPSE COP” identified the appropriate application phase, data needs, and the impediments to exposure within the community. The discussions confirmed the existence of a gap in the available tools to support decision-making in DP manufacturing, but especially highlighted the need in earlier design stages.
This tool thus aims to support the equipment technology choice, which is an important decision that affects the initial investment and manufacturing area design for pharmaceutical manufacturing companies. At such early process development phases, data are usually scarcer, and therefore, this tool offers default design options for users to best explore the possible design landscape. The tool can be used by industrial or academic research groups dedicated to investment decisions as a first indication at early decision phases.
Figure 2 shows the different pharmaceutical production stages and the intended use phase for this tool.
Another important need addressed by the tool is its convenience and accessibility due to its online feature. Several versions of the tool exist, offering different functionalities for various users. The complete version of the tool is currently written in MATLAB R2018b (The MathWorks, Inc., Natick, MA, United States). Several formats for algorithm delivery were reviewed and evaluated, such as directly using the MATLAB (.m) files or compiling them into executables (.exe) using the AppDesigner supplied by Mathworks. However, such formats may be inconvenient for industrial users since proprietary software, such as MATLAB, is sometimes unavailable or with a restricted number of licenses. Furthermore, the installation of software and contents from outside the company is normally prohibited for data security reasons. Therefore, a version of the tool was then implemented as an online web application, allowing easy access from anywhere without the need for periodical updates by users.
2.3. Key Features
Currently, two versions of the equipment technology choice decision-support tools are available: a full offline version in MATLAB and a free access prototype online version. A licensed extended online version is currently under development. The prototype online version is the focus of this work.
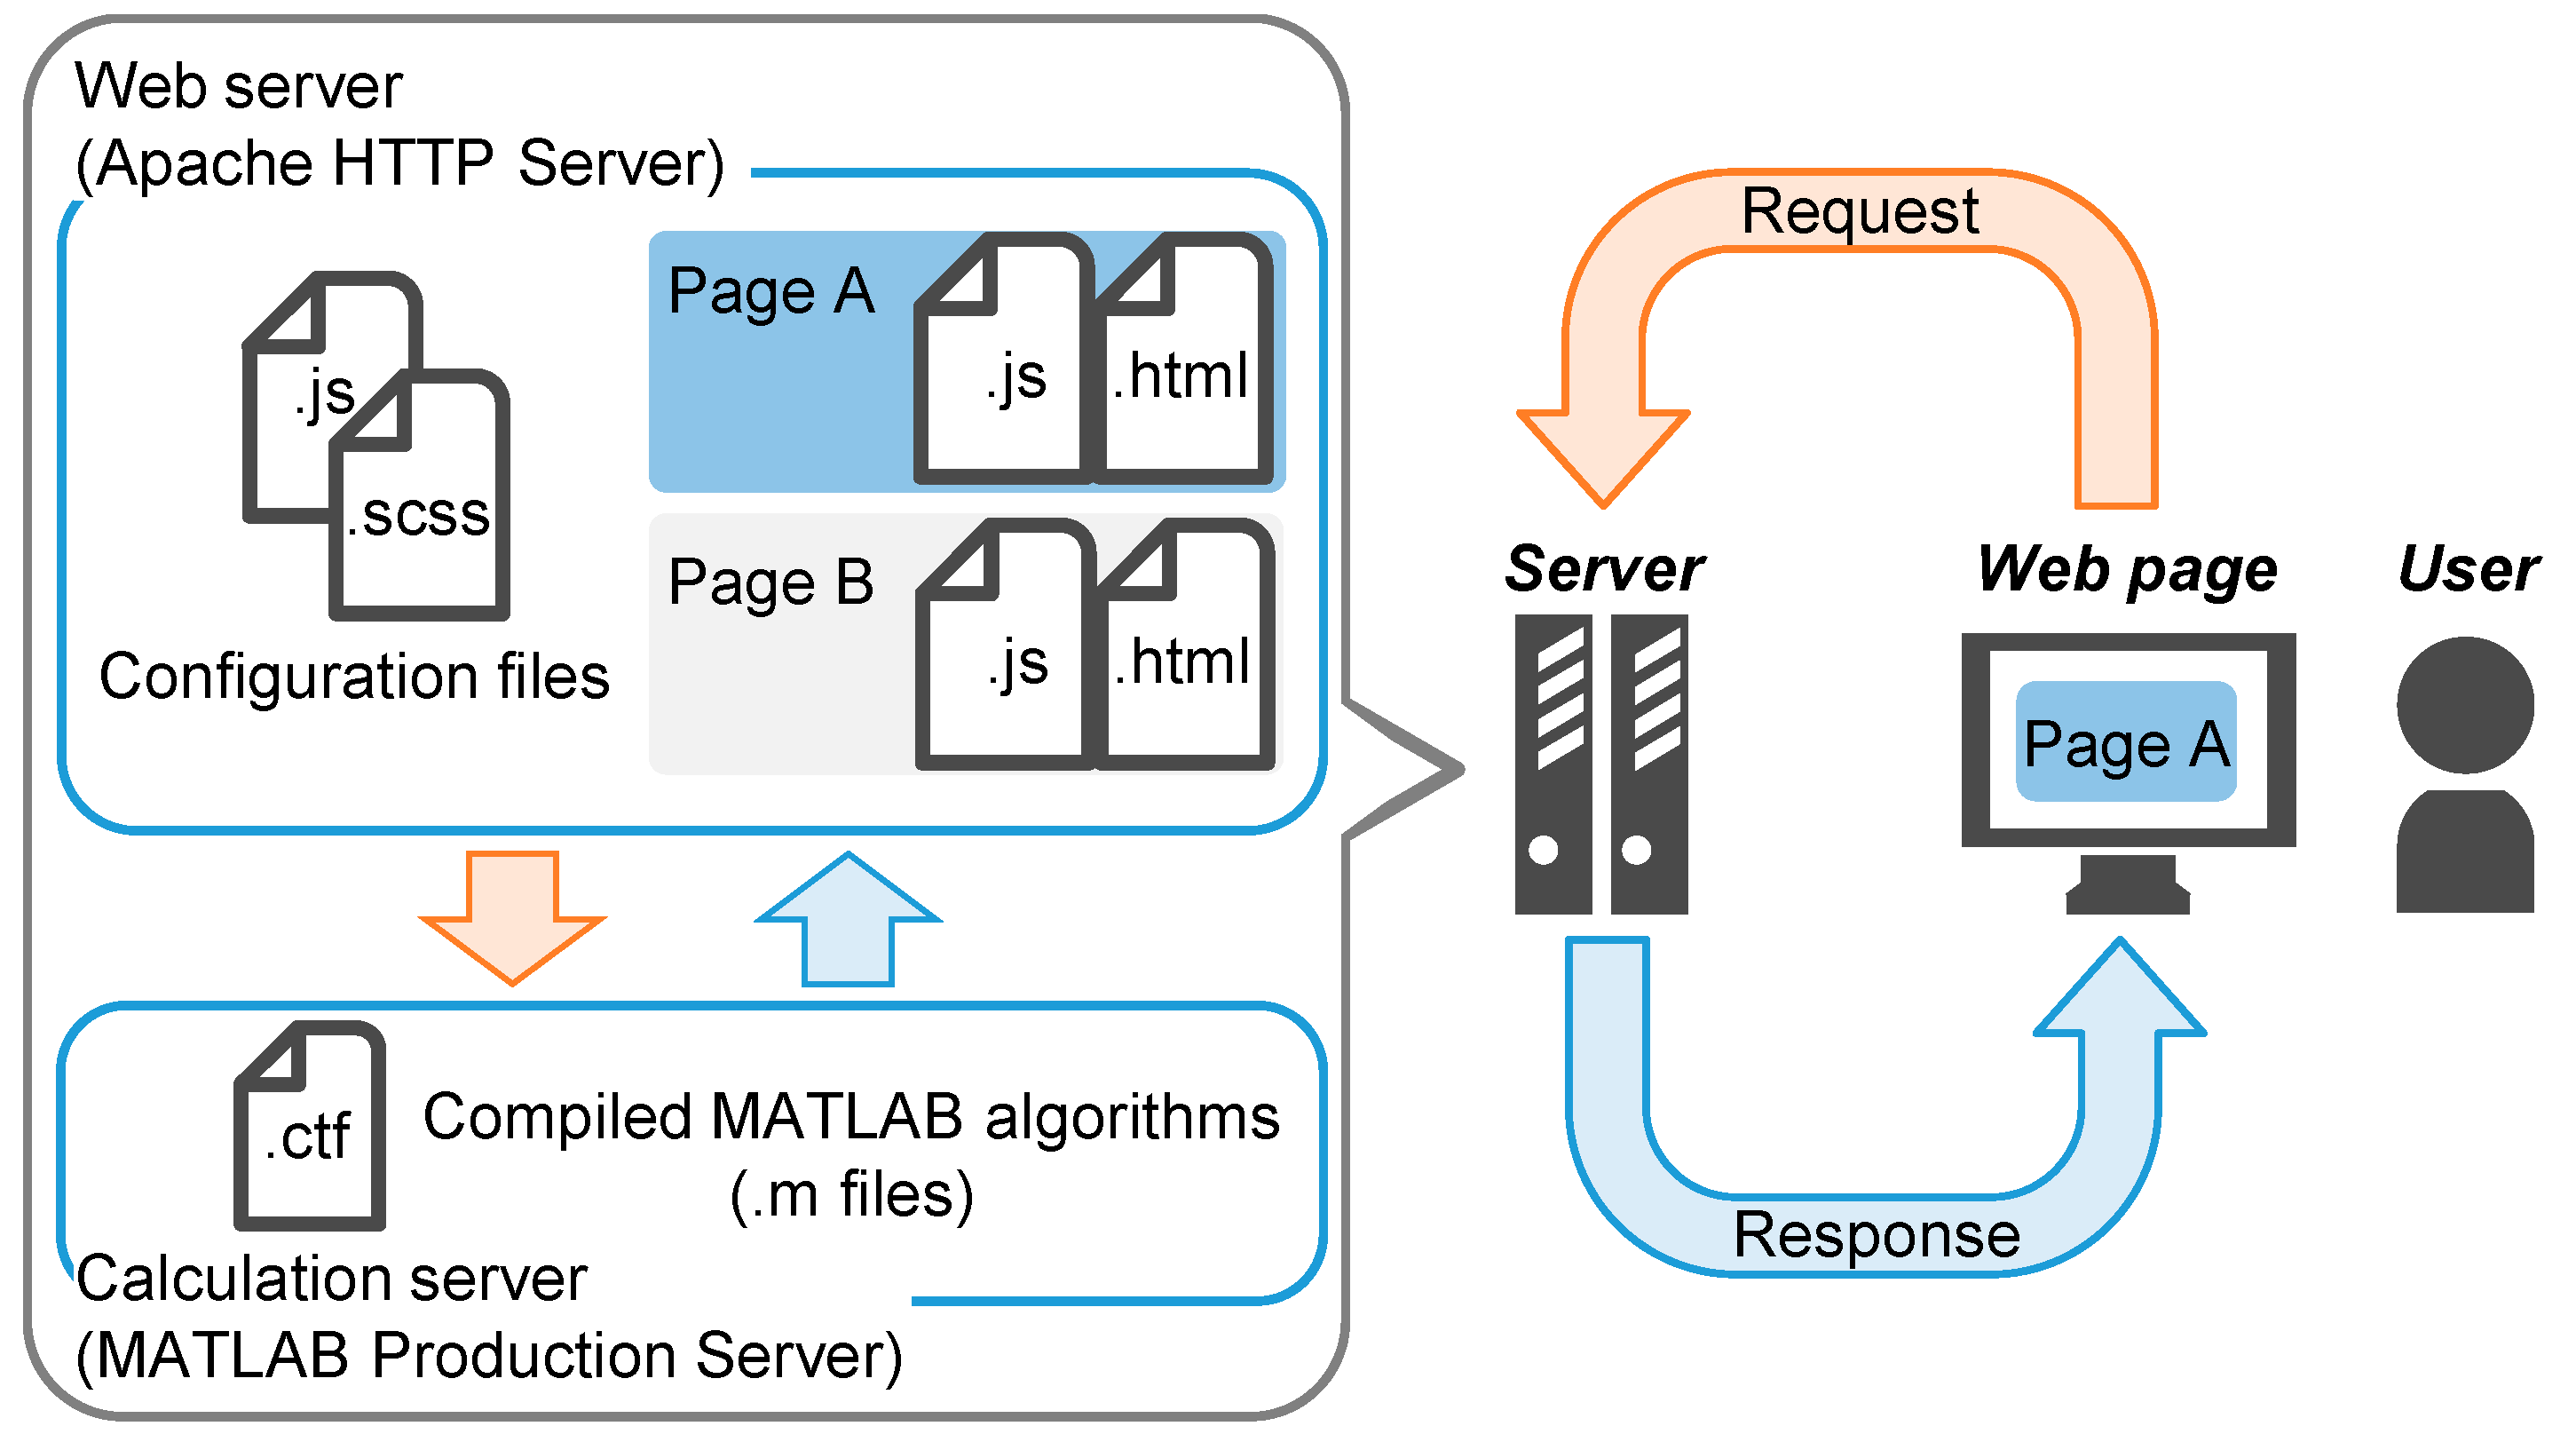
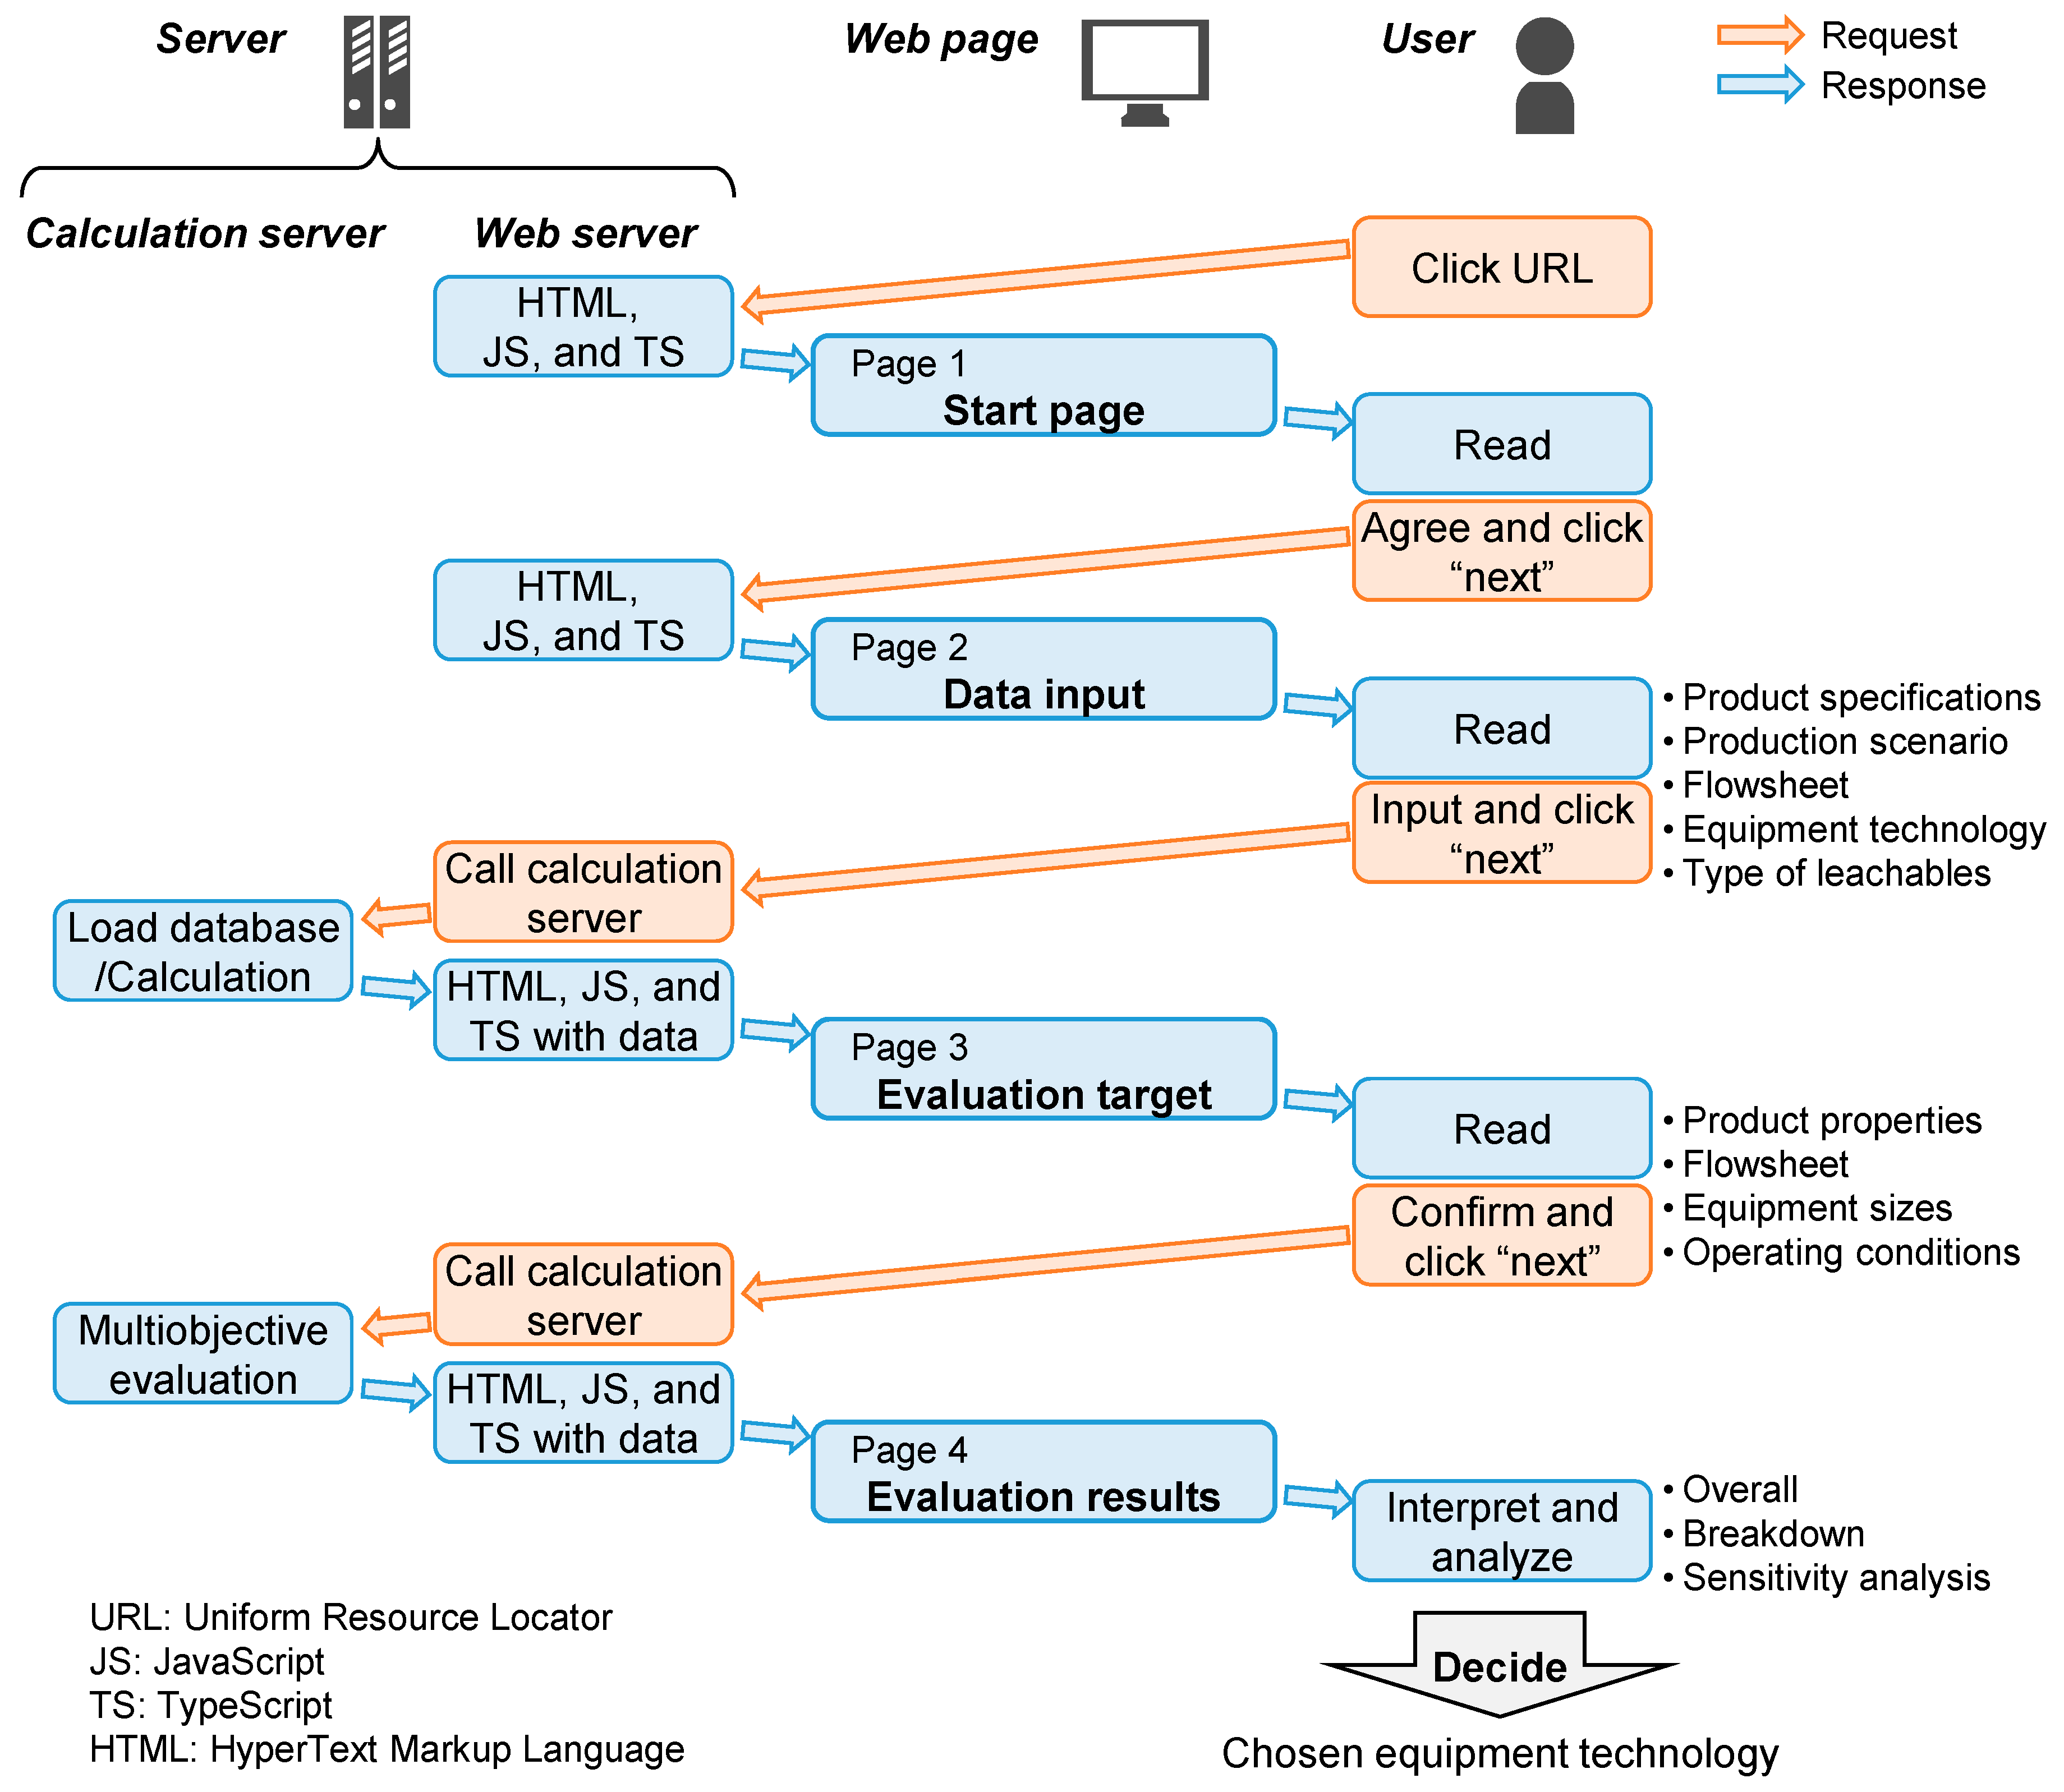
The online prototype version of the tool applies HTTP, which enables data communication between users and servers. User interactions on a web browser are sent as requests to a web server as shown in
Figure 3. If any calculations are needed, the webserver sends a request to another calculation server, the web server receives the calculation results as a response, and the results are displayed on the user’s web browser. An Apache
® HTTP Server Version 2.4 (The Apache Software Foundation, Forest Hill, MD, United States) is used as the web server, and a MATLAB Production Server
TM (MPS) [
22] is used as the calculation server installed on a Windows Server 2016 operating system.
Source codes are written in TypeScript (TS), JavaScript (JS), and HyperText Markup Language (HTML) for the user interface of data input and output visualization. These codes are developed and compiled to be built on the web server. MATLAB codes have been developed based on the in-house algorithms for the offline version of the tool and compiled to be built on MPS.
2.4. Built-in Database
Generally, each user must input values for parameters in their tested cases. However, if the data is not available or the user is using the tool for exploration of alternatives rather than for a specific case, the tool then offers default values that can be used from a built-in database. The availability of default values for key model parameters is an especially useful feature for academic users who do not have access to industrial data. Data have been collected from various sources and online databases to serve as default values for model parameters.
Table 2 shows the categories of database parameters with some examples and their sources. More details regarding the values used and their sources can be found in our previous work [
13]. With respect to the data collected from industrial experts, average values of the data range provided by the experts have been used in this tool as default parameters, which can be freely used by anyone. Influential default parameters from the database, if selected by users, are displayed on the “evaluation target” page in the tool for confirmation by the users or target audience.
In the online prototype version of the tool, parameters listed in
Table 2 are fixed to the default values without the possibility of any user-induced changes. This option will only be available in the full licensed version. Currently, users only specify the production scenario, e.g., project lifetime, annual production volume (per plant), production mode, and number of products per year, in addition to the filling volume of the containers, e.g., vials.
2.5. Algorithms and Models
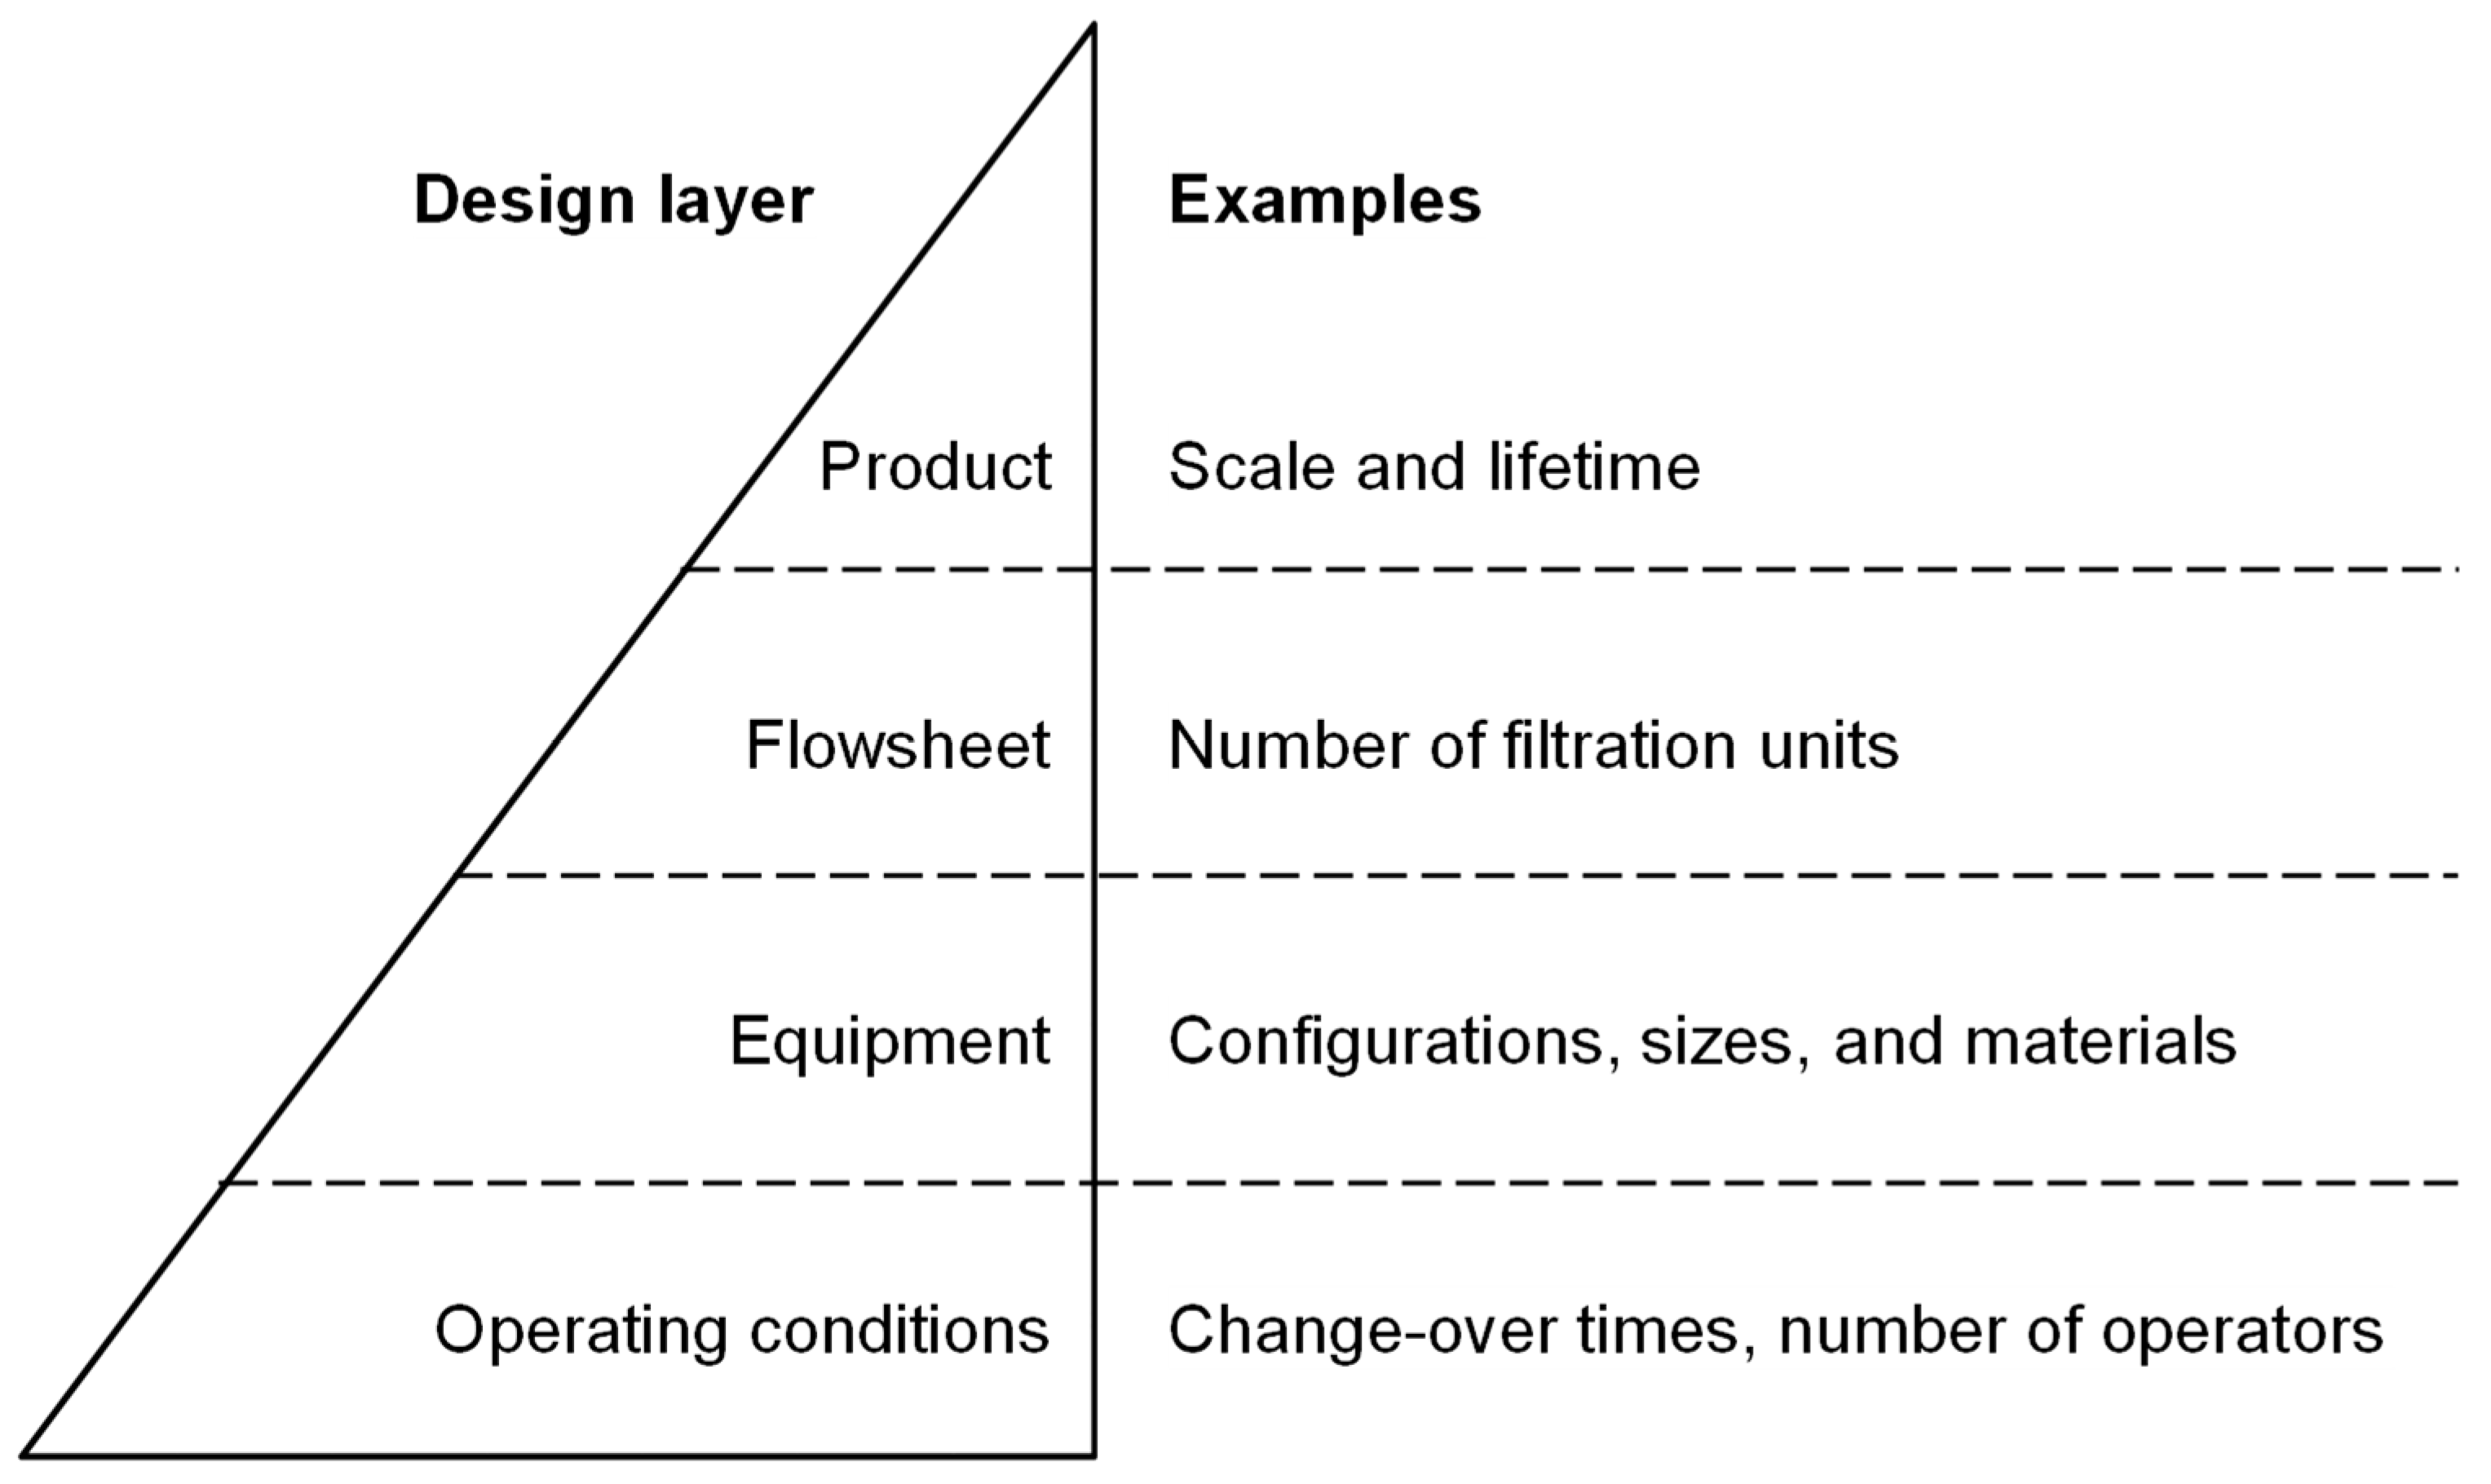
The algorithms and models implemented in the tool are based on a framework developed for generating and evaluating alternatives for sterile filling processes of drug product manufacturing [
15]. The framework is composed of four decision layers as shown in
Figure 4: product, flowsheet, equipment, and operating conditions. Each of the layers has some parameters with discrete options or a range of values. The order of the layers from “product” to “operating conditions” follows the decision order, i.e., the parameters in the “product” layer are determined earlier than those in the “flowsheet” layer. When all of the options and values of the parameters are specified, one process alternative is defined.
In this work, parameters, such as filling volume, lifetime, production volume, and number of products, belong to the “product” layer. Once the user specifies these parameters in the prototype version of the tool, the options or values of parameters on the “flowsheet” layer are fixed to the default setting from the database. On the “equipment” layer, equipment configuration and sizes are fixed to the default values. The full offline version of the tool varies the equipment material for each of the unit operations in the process yielding a maximum of 256 alternatives. The prototype online tool only displays results for the SUT, MUT, and most common industrial hybrid alternative (HYB), shown in
Figure 1d, which has a stainless steel mixing tank and resin-made equipment everywhere else. On the “operating conditions” layer, users can define the production mode as either campaign or alternating. Campaign production implies producing the same product in back-to-back batches, whereas alternating production implies producing a different product with each batch. Operating parameters, such as batch sizes and filling time, are calculated based on the data chosen in the previous decision layers.
The generated alternatives are evaluated on the basis of four indicators. The economic aspect
Eco [JPY] uses net present value, and the environmental aspect
Env [kg-CO
2] uses life cycle CO
2 emissions, as indicators. The product quality indicator
PQ [–] evaluates the impact of patient exposure to leachables and the potential risk of patient exposure to residues. The supply robustness indicator
SR [–] describes the risk of production delays. For detailed model assumptions and equations, see our previous work [
13,
15]. Ultimately, the evaluated results with four indicators are aggregated to one indicator, total score
T [–], given by:
where different weighting factors:
weconomy,
wenvironment,
wsupply, and
wquality, are used for economic impact, environmental impact, supply robustness, and product quality, respectively. Here,
Eco’,
Env’, and
SR’ are the maximum values of economic impact, environmental impact, and supply robustness among evaluated 256 alternatives, respectively.
PQ is an aggregated value of two different product quality impacts that are leachables
Lea [–] and residue
Res [–] given by:
where
wleachables and
wresidue are the weighting factors of leachables and residue, respectively. The parameters
Lea’ and
Res’ are the maximum values of leachables and residue impacts among evaluated 256 alternatives, respectively.
2.6. Tool Architecture and Key Input Parameters
The prototype tool evaluates SUT, MUT, and HYB using multi-objective indicators.
Figure 5 shows the architecture of the tool “
TECHoice” which comprises four web pages.
“Start page” as a front page to show an explanation of the tool and the data management policy;
“Data input” as a data entry form of, e.g., product specifications and production scenario;
“Evaluation target” as a value confirmation page of physical properties of the drug product solution, the choice of flowsheet, operating conditions, equipment configuration, sizes, and material;
“Evaluation results” as a page showing the overall results, category results breakdown, and sensitivity analysis.
The main input parameters of the tool are product specifications, such as filling volume, and production scenario, e.g., project lifetime, annual production volume, production mode, and number of products per year. The possible ranges of the input parameters are shown in
Table 3. According to the user input data on the second page, the physical properties of the drug product solution and the flowsheet are loaded from the built-in database, and equipment sizes and operating conditions, such as batch size and filling time, are calculated. After users confirm the results on the third page, multi-objective evaluation is conducted with four indicators: economic and environmental impacts as well as product quality and supply robustness, where price data, emission data, or properties of leachables are loaded from the built-in database for the calculation. Overall results and a breakdown of the results for each of the four indicators are shown for both SUT and MUT on the last page. The current version of the tool offers different components of the economic and environmental results (disposables, labor, utilities, and investment). However, despite individual equipment costs being a part of the calculation, their values are not accessible in the current version. This feature will only be available in the licensed online version. The total score, which integrates values of all the four indicators, is shown for SUT, MUT, and HYB using weighting factors that reflect the indicator priorities of the user. The total score determines the final technology choice where a smaller score value indicates a better technology option. The results are sometimes sensitive enough to the indicator weighting factors to change the choice of the preferred equipment technology. Therefore, the final page has a function that can be used to display results of the sensitivity analysis to the weighting factors. The default setting is equal weighting among the four indicators. Discrete options can be chosen to test the sensitivity in some cases, such as “economy first” which allocates a minimum weighting factor of 0.1 to all indicators other than the economic aspect (allocated 0.7). Similarly, cases of “environment first”, “supply first”, “quality first”, and “supply and quality first” are also evaluated.
3. Case Study
We conducted a case study to demonstrate the use of the tool with four different production scenarios. The following sections outline the details and visualization of “
TECHoice” from page 1, “start page”; page 2, “data input”; page 3, “evaluation target”; to page 4, “evaluation results”. Screenshots (as of 11 July 2019) of all four pages are shown in the
Appendix A.
3.1. Start Page
This is the front page depicting an explanation of the tool, such as purpose, target, and key input parameters, and the data management policy as shown in
Figure A1. The users click the “next” button after agreeing with the terms.
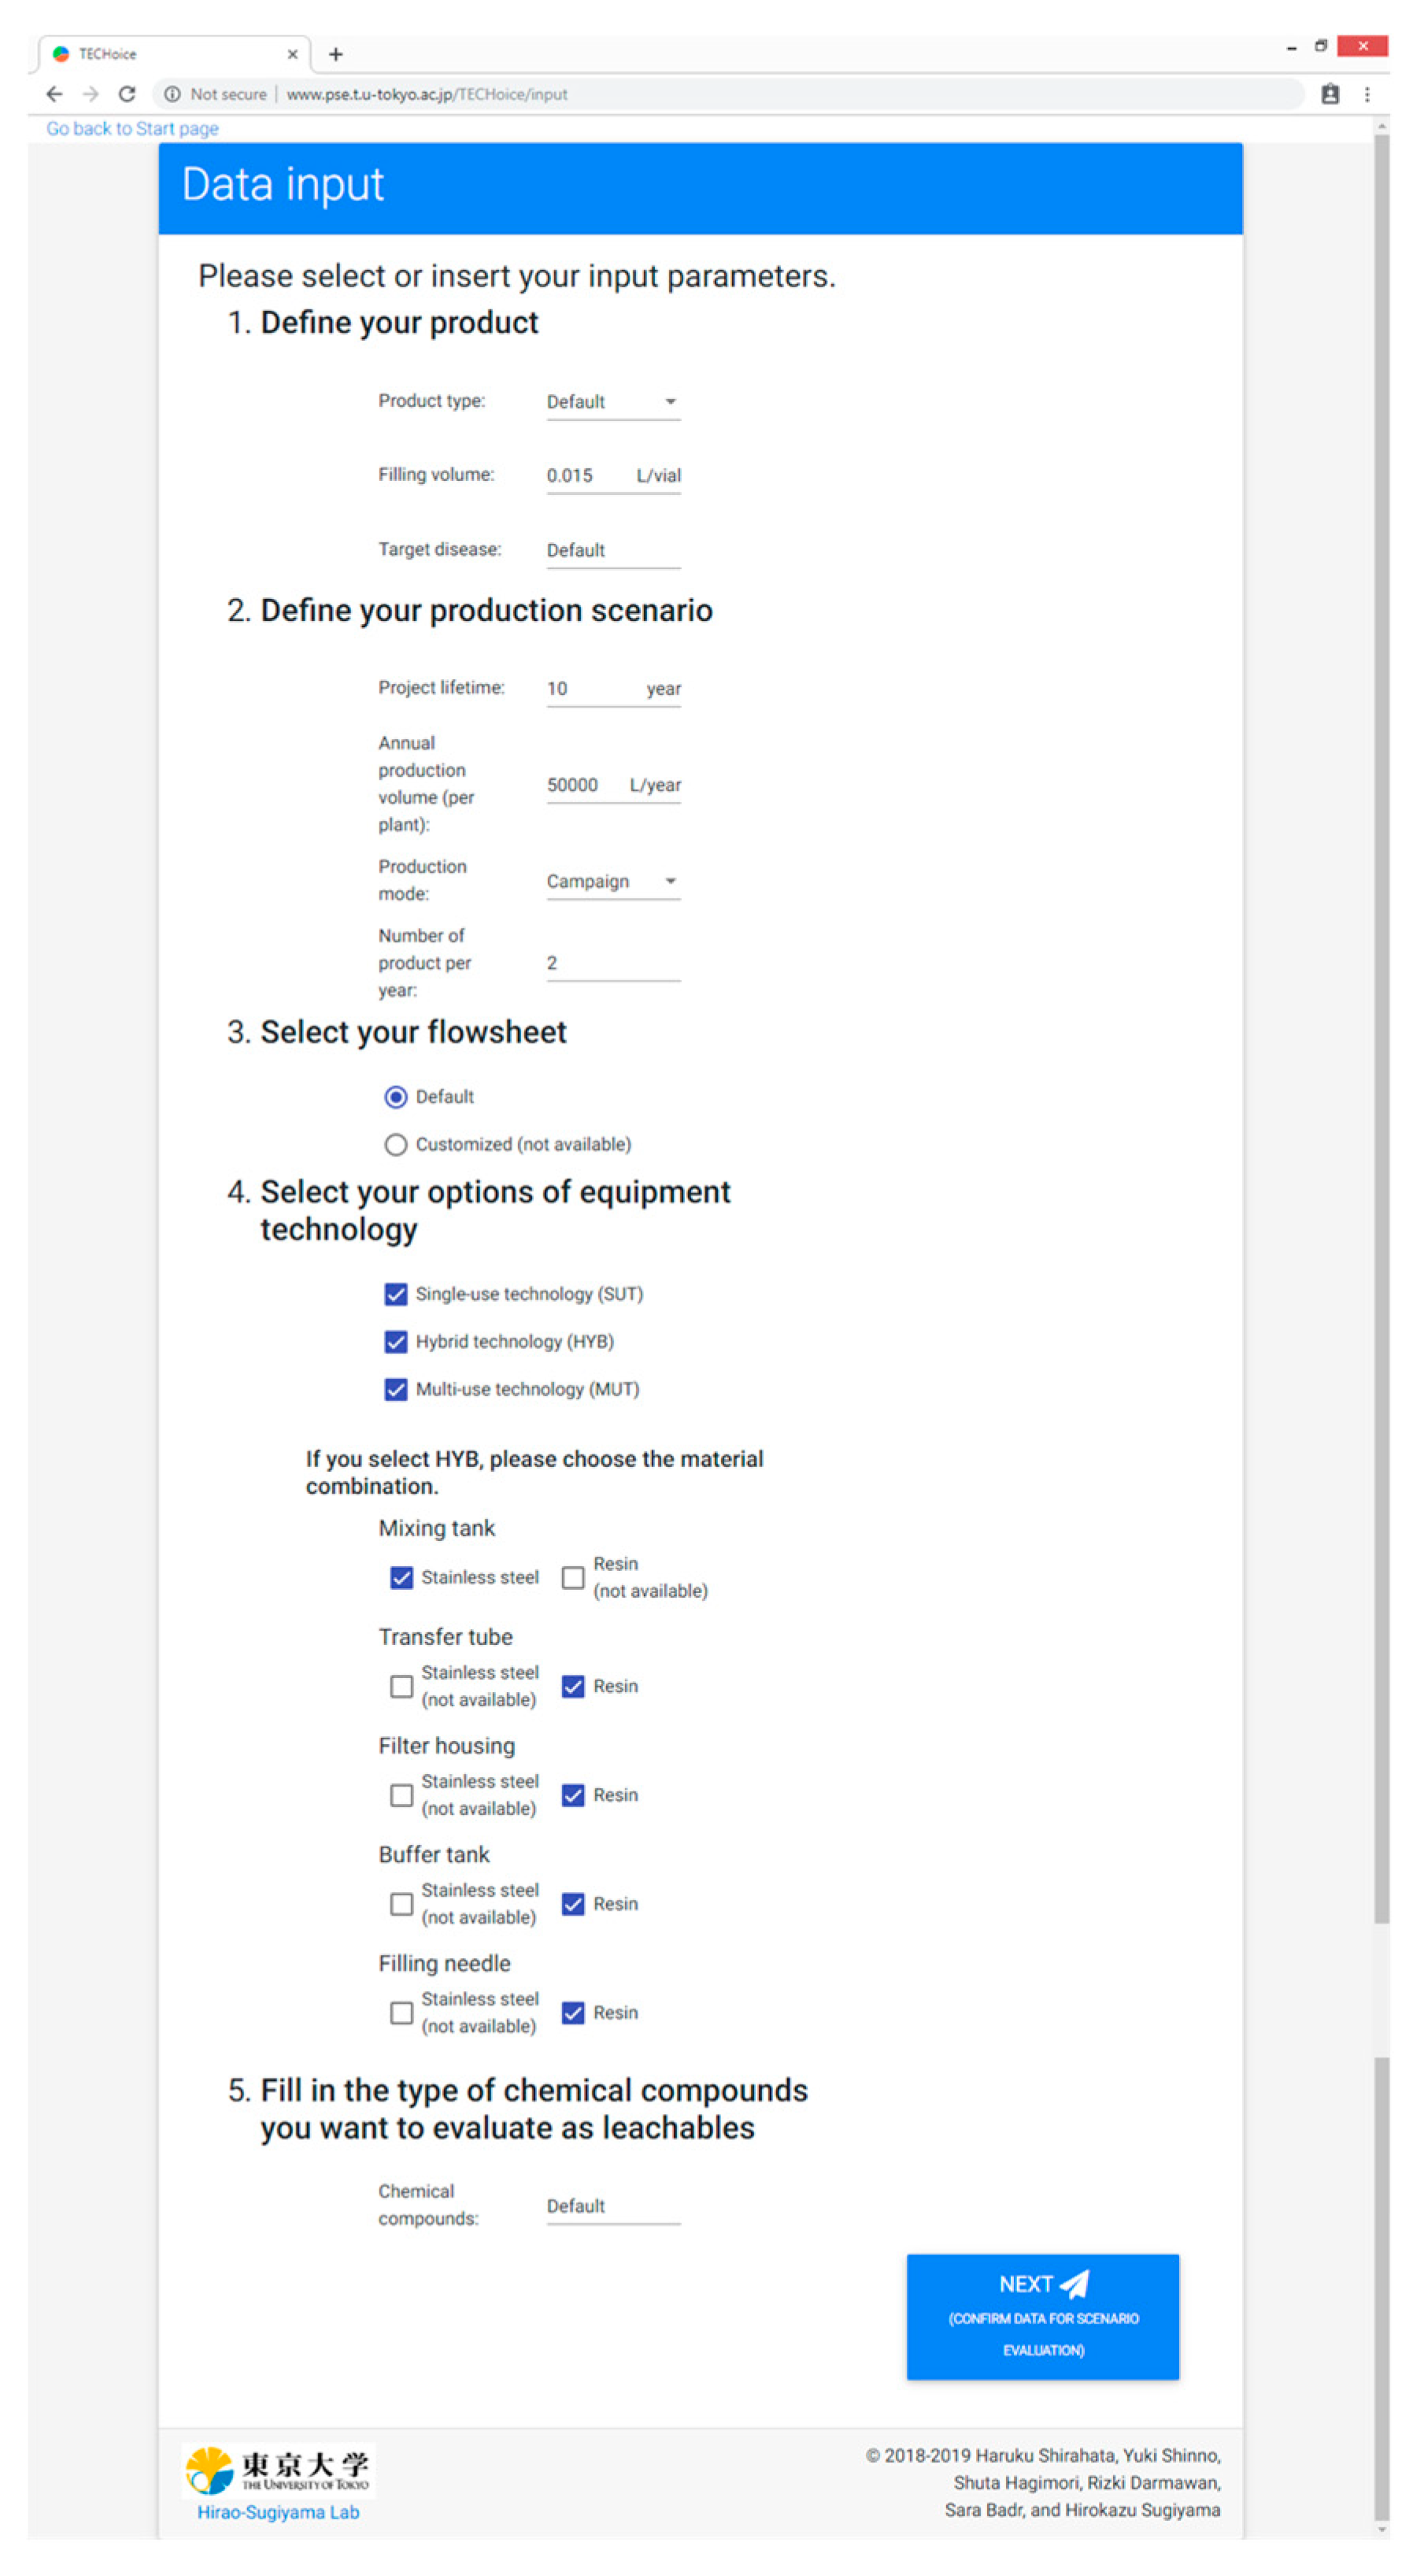
3.2. Data Input
The purpose of the page is for users to insert their input parameters. There are five sections where users are required to fill in values or choose options: “Define your product”, “Define your production scenario”, “Select your flowsheet”, “Select your options of equipment technology”, “Fill in the type of chemical compounds you want to evaluate as leachables” as shown in
Figure A2.
In this case study, input parameters of four production scenarios were demonstrated.
Table 4 shows the list of input values for each scenario. The tested scenarios are defined as follows:
Scenario A: large-scale in campaign production mode with minimal change-over;
Scenario B: large scale in alternating production mode with maximal change-over;
Scenario C: small-scale in campaign production mode with minimal change-over;
Scenario D: small-scale in alternating production mode with maximal change-over.
In this case study, minimal and maximal change-overs were taken as two and ten products, respectively.
In the product definition section, a monoclonal antibody for bowel cancer with the filling volume of 0.015 L/vial was assumed. The default drug product solution properties were taken to be the same as water in the prototype version. The target disease is used to estimate the potential patient demand size, which is used to evaluate the supply robustness indicator in the tool. The default flowsheet was assumed to have the same process as explained in
Section 2.1. Three types of equipment technologies were considered: SUT, MUT, and HYB. The prototype version of the tool takes stearic acid as the default compound leaching from resin-made equipment since it is a common example of leachables.
3.3. Evaluation Target
The purpose of this page is for the users to confirm their input values, values from database, default assumptions, and intermediate calculation results. This page is composed of five sections: “Product data”, “Flowsheet data”, “Equipment data”, “Operating conditions”, and “Evaluation parameters”.
Table 5 shows some of the intermediate calculation results of batch size, filling time, and annual number of batches, in addition to default values from the database, such as required time for change-over and number of operators. Since alternating production features more time-intensive product-to-product changeover operations, it can therefore accommodate a smaller number of annual batches (Scenarios B and D) compared to campaign production modes (Scenarios A and C). The scenarios with larger annual production volume (Scenarios A and B) were assigned larger batch sizes to fit into the fixed annual working time. The filling time was proportional to the batch size due to the fixed pumping speed. The number of batches calculated for Scenario C was higher than expected for a realistic industrial production case. In this prototype version, however, no error messages will be displayed for such a case. The full version will display a warning message.
3.4. Evaluation Results
The purpose of this page is to visualize the multi-objective evaluation results for interpretation and choice of technologies. The page has five sections: “Overall”, “Result for SUT”, “Result for MUT”, “Total score”, and “Sensitivity analysis”.
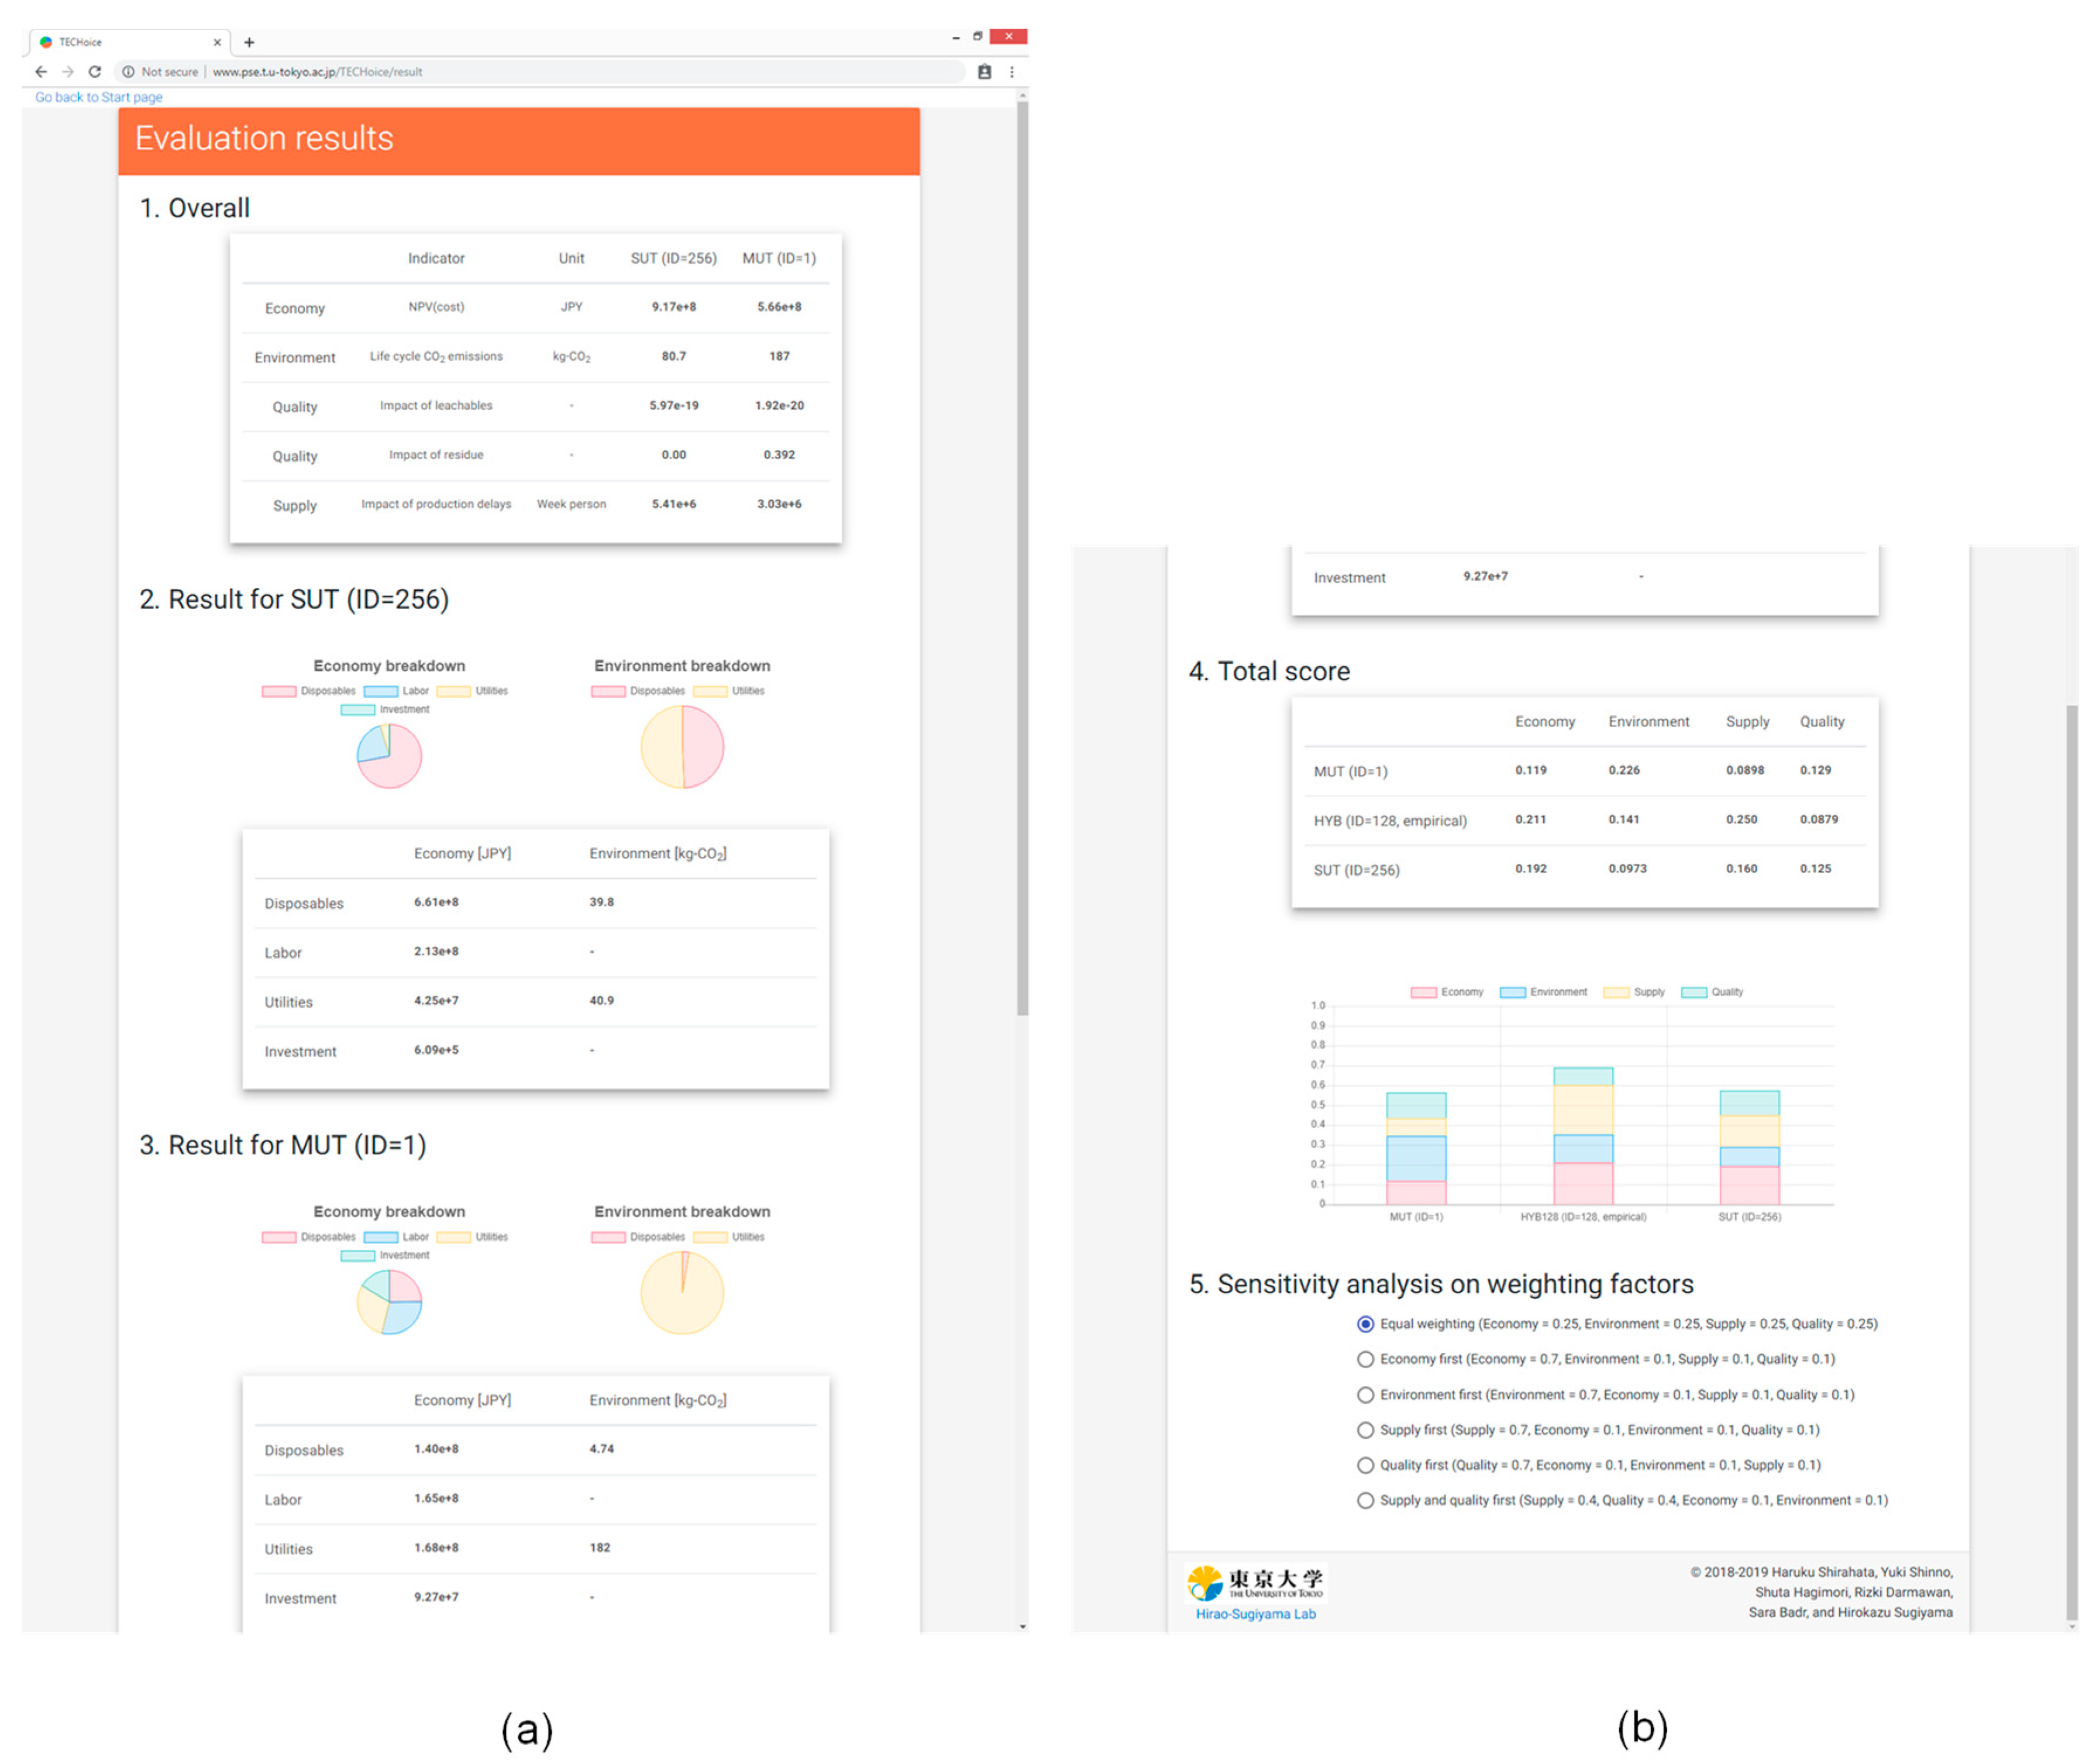
3.4.1. Overall/ Result for SUT/ Result for MUT
In
Section 1, indicator values for the economic and environmental impacts, product quality, and supply robustness aspects are shown in the form of a table. The next two sections show the breakdown of the economic and environmental impacts of SUT and MUT in pie charts in terms of the contribution of disposables, labor, utilities, and investment costs.
The breakdown of economic and environmental impacts of Scenario A (large-scale in campaign production mode with two products) and D (small-scale in alternating production mode with ten products) are shown in
Table 6. The breakdown of the economic impact results showed similar common trends between scenarios A and D. SUT incurs a large cost for purchasing disposable equipment and minimal investment costs due to the lack of fixed stainless steel equipment. The overall results showed that the economic impact of SUT was larger than that of MUT in Scenario A, and the impact of MUT was larger than that of SUT in Scenario D. Scenario A had a larger annual number of batches which led to more change-over in disposable equipment, causing the larger cost of SUT. Labor cost in SUT was larger for Scenario A due to the larger number of operators compared to MUT. Scenario D, however, featured frequent product-to-product change-over operations in the alternating production mode. Given that the time for product-to-product change-over of MUT is longer than that of SUT, operator working hours were longer in this scenario leading to higher labor costs for MUT.
The breakdown of the environmental results showed similar common trends between Scenarios A and D. The impact from disposables was larger in SUT compared to MUT, where the contribution of utility consumption was large for both SUT and MUT. The environmental impact of utility consumption stems from the energy required for heating, ventilation, and air conditioning (HVAC) to keep the manufacturing area clean. In the environmental impact calculation, manufacturing area and time are the key parameters affecting process utility consumption. In the default setting, MUT with fixed piping is assumed to have double the size of manufacturing area compared to SUT with flexible tube, causing the impact of utilities in MUT to be larger than that in SUT.
3.4.2. Total Score
In
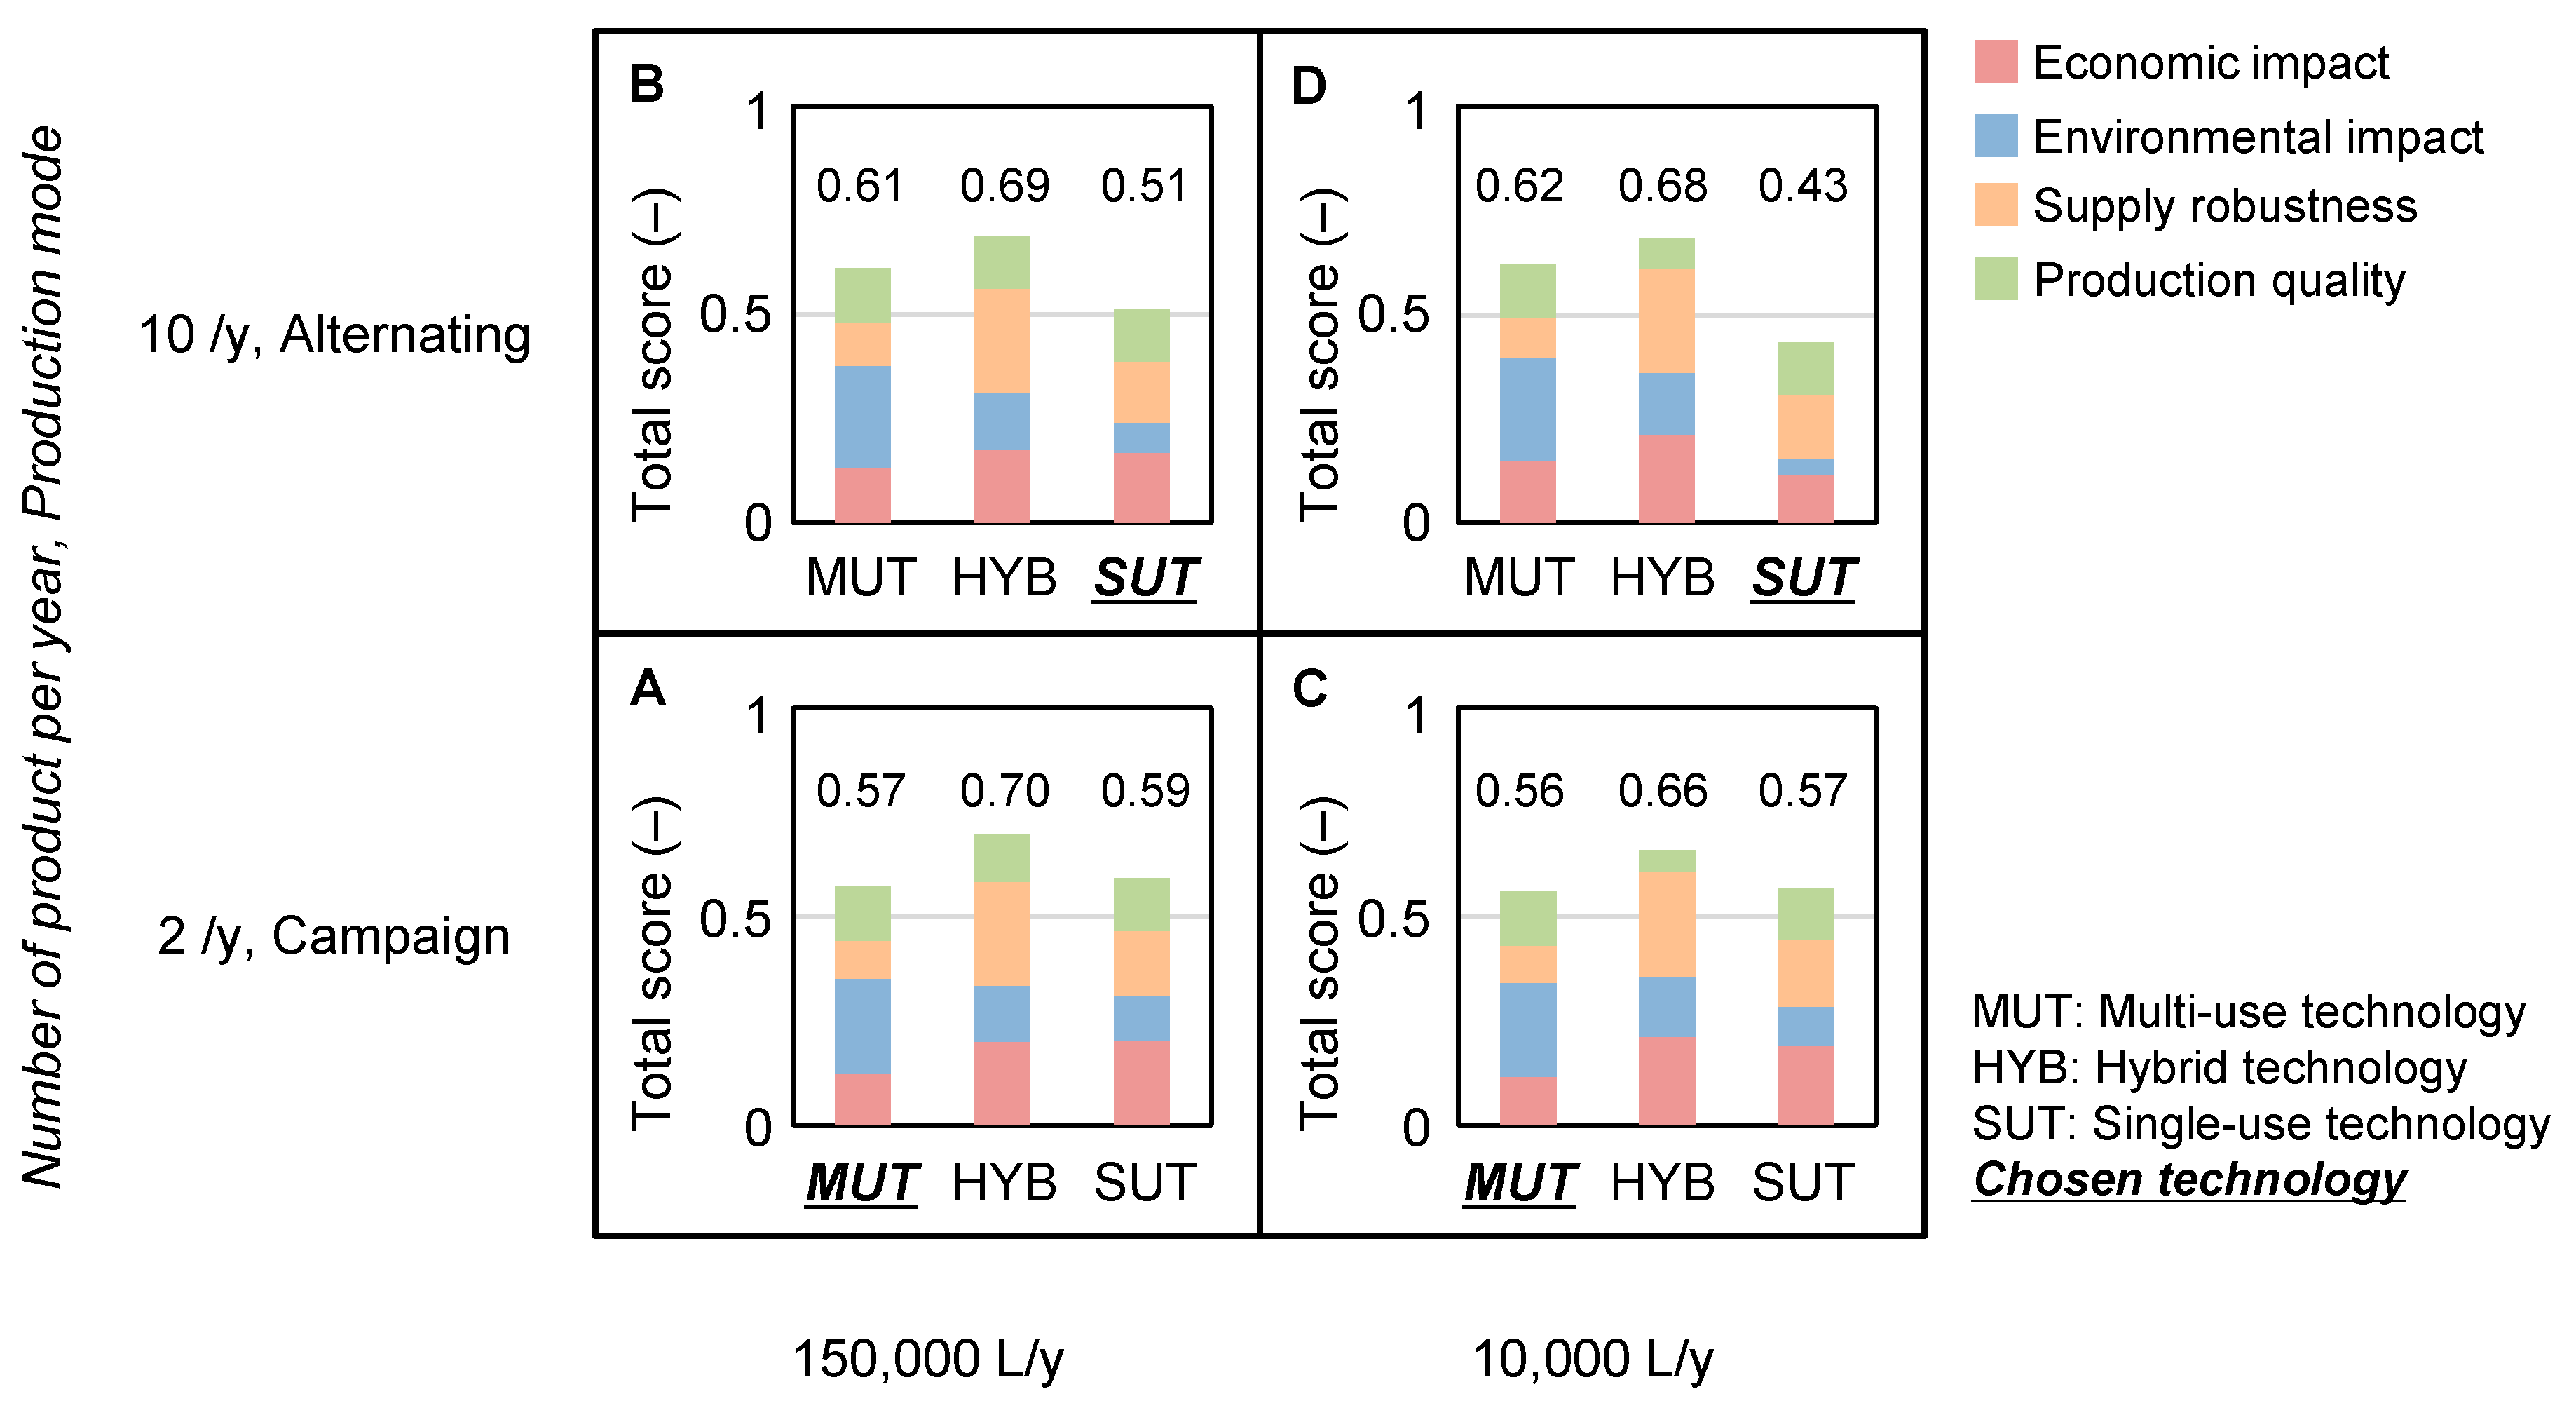
Section 4, the total score, an aggregated value of all the four evaluation results, is shown in a stacked bar chart for the three evaluated alternatives: SUT, MUT, and HYB.
Figure 6 shows the results of the total score of the four tested scenarios. The alternative with the smallest total score is to be chosen. In the case of alternating production of ten products (B, D), SUT was chosen as the best alternative regardless of the annual production volume. In the case of campaign production with two products (A, C), MUT was the best alternative regardless of the annual production volume. The difference in the total score between SUT and MUT in Scenarios A and C is too small to make a decision with confidence. Individual indicators, however, show different profiles between SUT and MUT. In this case, the weighting factors of the different indicators play a significant role in the final decisions, and a more in-depth analysis of the individual indicators’ results is required. Among the four tested scenarios, the decision with the highest certainty was the choice of SUT in Scenario D as indicated by a difference in the total score of SUT compared to the others. To finalize the decision, the values of the weighting factors were varied for this scenario to test the effect of the variance on the conclusion.
3.4.3. Sensitivity Analysis
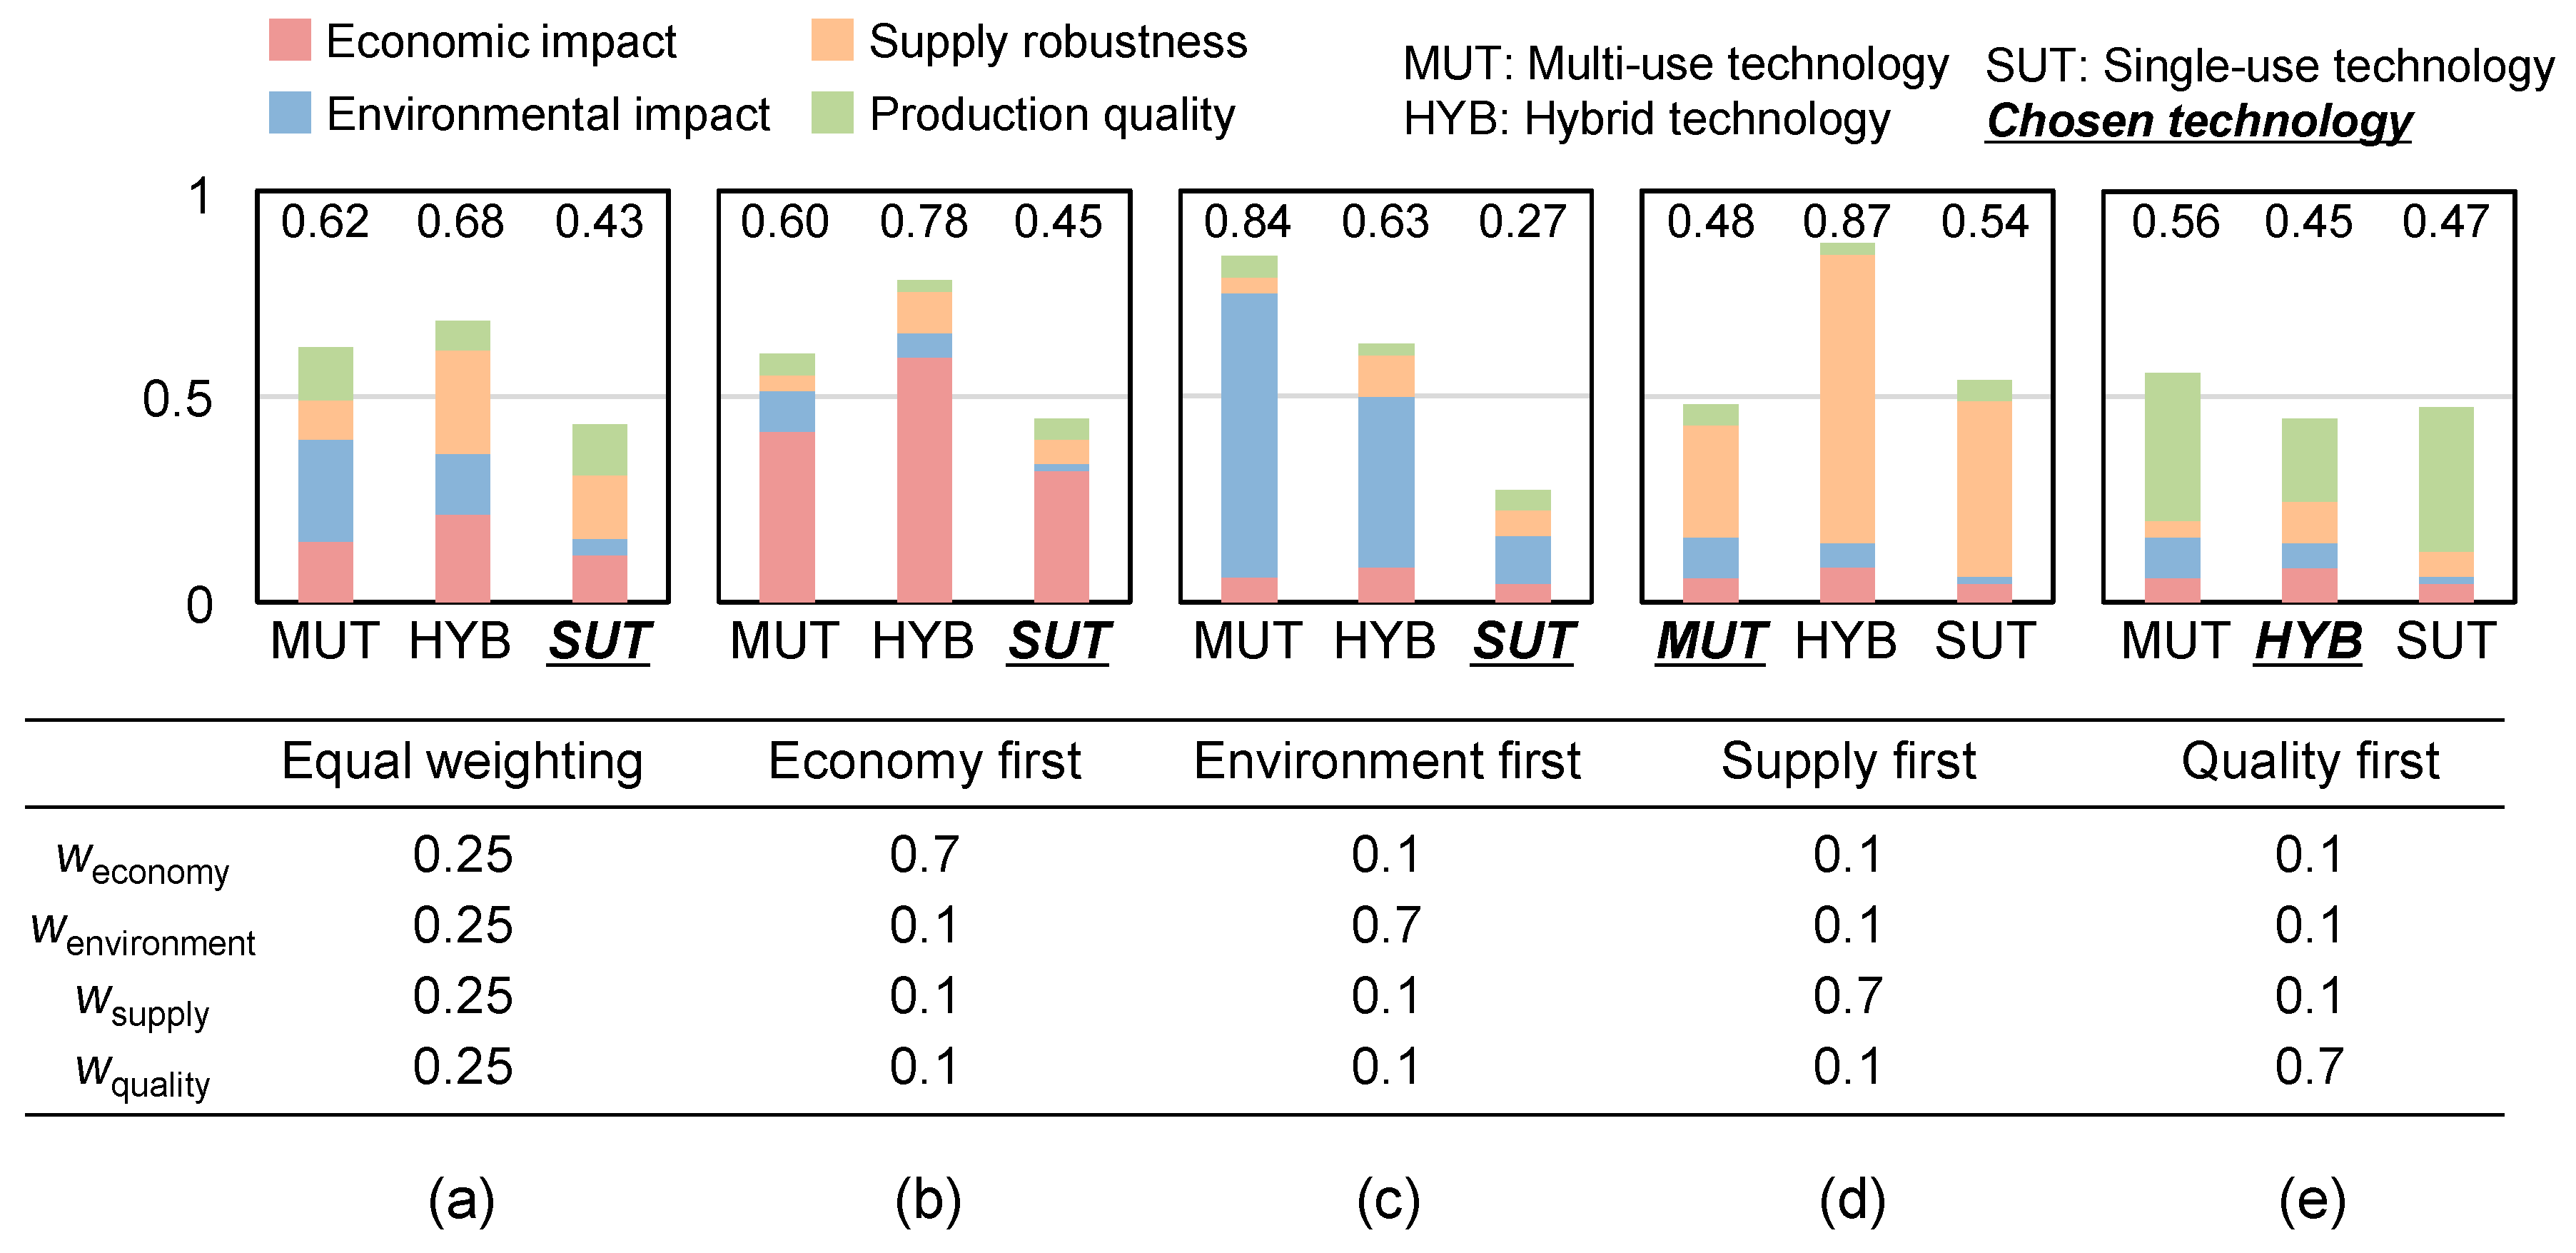
The sensitivity analysis function is embedded below the stacked bar charts of total score, where users can choose six different combinations of weighting factors depending on the priority of aspects: equal weighting, economy first, environment first, supply first, quality first, supply and quality first. The bar charts showing the results of the total score change according to the change with the total score calculated from the selected combination of weighting factors.
Figure 7 shows the results of the sensitivity analysis to the impact of weighting factors on the assessment results for Scenario D (small-scale in alternating production mode with ten products). Weighting factors of the four indicators were discretely changed. The default combination used in the assessment is equal weighting factors (
w = 0.25) for all indicators (same as the results already shown in
Figure 6). Equal weighting of the indicators showed SUT as the best alternative for Scenario D. When supply robustness was prioritized, the total score of MUT was the smallest due to the lower probability of delays due to equipment failures than delays due to supply failure of the disposable equipment. HYB was the best when product quality was prioritized. The impact of product quality is the aggregated effect of leachables and residues, where the effect of leachables was the largest in SUT, second largest in HYB, and the smallest in MUT. On the other hand, the effect of residue was the largest in MUT, second largest in HYB, and the smallest in SUT. When the product quality impact was calculated using Equation (2) with the same weighting factors for leachables and residue, the impact of HYB became the smallest among the three alternatives. The HYB alternative has a smaller exposure to leachables compared to SUT since it employs a stainless steel mixing tank, which is the equipment with the largest area and residence time, and thus the highest contribution to leachable concentration in the system. Residue concentration is assumed to be a function of only the contact surface area rather than the residence time. Since the mixing tank’s area in this scenario is smaller than all other equipment combined, the expected residue concentration is therefore smaller in the HYB alternative compared to MUT. The combined effect of leachables and residue was also smaller compared to either SUT or MUT.
4. Discussion
The equipment technology choice among SUT, MUT, and HYB can thus be made based on the analysis presented in the case study for each scenario. Users can form a comprehensive picture of the possible range of assessment results. The advantages of the tool include flexibility in changing input parameters as well as visualization of the multi-objective evaluation and sensitivity analysis results. The tool with these benefits establishes a basis for a platform that connects academically developed models and algorithms to users in the industrial community with real production decisions.
The prototype tool can still be extended to a full online version offering more functionalities, alternatives, and analysis features. For example, flexibility of input parameters could be upgraded. Only “default” values are allowed for “product type” and “flowsheet” in the current version. In the extended version, more “customized” choices will be allowed. In addition, in the prototype version no error messages are shown regardless of values or options that users selected, e.g., negative values of input parameters, such as project lifetime or annual production volume. Warnings are not given for unrealistic production conditions, e.g., unrealistic batch numbers or batch sizes. Disposable mixing tanks higher than 2000 L are not available, however, SUT options with higher batch sizes would not get a warning message.
Output visualization will be improved to display results for other hybrid alternatives and to show a more detailed breakdown of indicator results. In the current version, only results of SUT, MUT, and an empirical hybrid alternative can be seen in full detail. More extensive sensitivity analysis can help users identify critical process parameters of different design stages. The uncertainty analysis concerning the influence of various model parameters and their ranges on the results will be the focus of our next publication, which aims to parameterize and landscape at different design phases. Technical updates can also be expected, e.g., for the user interface to visualize the results of the extended sensitivity analysis, or security updates for the input data.


