Fast Screening Methods for the Analysis of Topical Drug Products

1
Faculty of Pharmacy, University of Coimbra, Pólo das Ciências da Saúde, Azinhaga de Santa Comba, 3000-548 Coimbra, Portugal
2
Coimbra Chemistry Center, Department of Chemistry, University of Coimbra, Rua Larga, 3004-535 Coimbra, Portugal
3
Laboratórios Basi, Parque Industrial Manuel Lourenço Ferreira, lote 15, 3450-232 Mortágua, Portugal
4
Centre for Neurosciences and Cell Biology (CNC), Faculty of Medicine, University of Coimbra, Rua Larga, 3004-504 Coimbra, Portugal
*
Author to whom correspondence should be addressed.
Processes 2020, 8(4), 397; https://0-doi-org.brum.beds.ac.uk/10.3390/pr8040397
Submission received: 29 February 2020
/
Revised: 24 March 2020
/
Accepted: 27 March 2020
/
Published: 29 March 2020
(This article belongs to the Special Issue Development and Characterization of Nanocarriers for Drugs)
Abstract
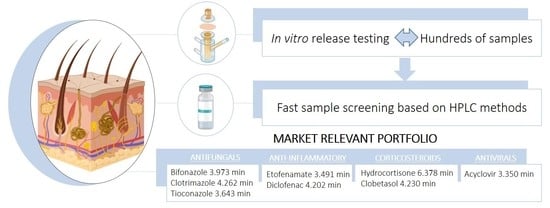
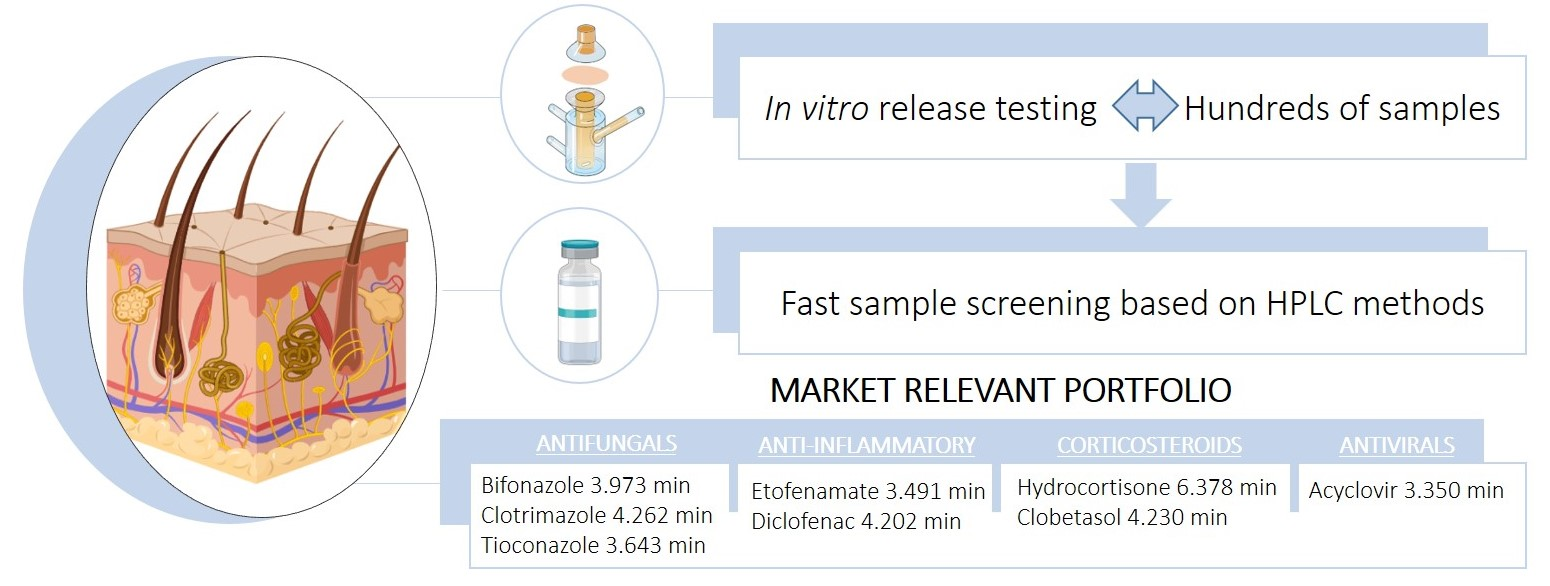
:Considering the recent regulatory requirements, the overall importance of in vitro release testing (IVRT) methods regarding topical product development is undeniable, especially when addressing particulate systems. For each IVRT study, several hundreds of samples are generated. Therefore, developing rapid reversed-phase high-performance liquid chromatography (RP-HPLC) methods, able to provide a real-time drug analysis of IVRT samples, is a priority. In this study, eight topical complex drug products exhibiting distinct physicochemical profiles were considered. RP-HPLC methods were developed and fully validated. Chromatographic separations were achieved on a XBridgeTM C18 (5 µm particle size, 150 mm × 2.1 mm), or alternatively on a LiChrospher® 100 RP-18 (5 µm particle size, 125 mm × 4.6 mm) at 30 °C, under isocratic conditions using UV detection at specific wavelengths. According to the physicochemical characteristics of each drug, different mobile phases were selected. Irrespective of the drug (hydrocortisone, etofenamate, bifonazole, clotrimazole, acyclovir, tioconazole, clobetasol, and diclofenac) and formulation, retention time values did not exceed 6.5 min. All methods were linear, specific, precise, and accurate at the intraday and interday levels, robust, and stable. These were successfully applied to establish product-specific IVRT profiles, thus providing a key database useful for topical pharmaceutical manufacturers.
1. Introduction
The market of skin drug delivery is projected to expand over the next five years [1,2]. Such a trend may certainly be boosted by the increasingly growing relevance of nanotechnology-based products. Reasons fueling this expansion include, among other factors, elderly population increase, demand for a superior topical therapeutic effect, and major patent expiration. Semisolid dosage forms intended for topical application enable prolonged in situ release, and for this reason are the preferred therapeutic vehicles when addressing topical conditions [3].
Semisolid dosage forms often use biphasic systems, such as oil-in-water emulsions, where the drug can be dispersed in both phases [4,5]. A complete microstructure characterization in such circumstances should include pH, rheological profile, polymorphism, active pharmaceutical ingredients, and globule size determination, together with a detailed understanding of both release kinetics and permeation behavior. In this context, even though semisolid preparations are one of the oldest classes of dosage forms, known for over 100 years, methods/general procedures able to fully characterize their microstructure/performance have been subjected to recent scientific and regulatory advances [4,6]. The standardization of these procedures will be even more complex with the introduction of nanosystems [7,8].
The European Medicine Agency (EMA) guideline on quality and equivalence of topical products as well as the US Food and Drug Administration’s (FDA) acyclovir draft guidance are clear regulatory examples, which reinforce the growing need to fully characterize topical products [9,10,11].
Among the diversity of methodologies available for semisolid microstructure characterization, in vitro release testing (IVRT) assumes particular relevance. IVRT shares the same scientific principles as the dissolution methods, since the active substance ingredient must be released before it becomes bioavailable in the skin. In this context, IVRT methods are able to characterize the pharmaceutical performance of a given topical product; they are highly sensitive to changes in microstructure, thus representing a valuable source of information throughout a topical product lifecycle from the early development phase, as a formulation screening tool, to the late-stage development and post-marketing phases, as a quality control specification [4,12,13,14].
Release testing is usually conducted in a vertical diffusion system that consists of a donor compartment where the formulation is applied, an artificial non-rate-limiting membrane that holds the product, and a receptor compartment fulfilled with the release media [15,16]. To standardize method conditions, release experiments should be temperature controlled and continuously stirred. This avoids the occurrence of stationary layers that limit drug diffusion and prevent homogenization of the drug within the receptor solution [11,17,18,19]. Moreover, prior to the release experiment, it is vital to perform solubility studies to assure the maintenance of sink conditions. Throughout IVRT studies, samples from the donor compartment are taken and processed by analytical methods such as reversed-phase high-performance liquid chromatography (RP-HPLC) in order to trace the release profile.
According to recent regulatory requirements, 12 replicates should be considered and sampling should be performed at least for 6 times within the linear portion of the drug release profile [9]. Therefore, for each IVRT study, from several dozen to hundreds of samples are generated, which demand rapid analysis to avoid stability issues and provide timely evaluation as well as real-time assessment of specification conformity. This assumes critical importance for routine decision making, especially when out-of-trend (OOT) or out-of-specification (OOS) results occur.
The present study aims to create a fully validated library of RP-HPLC methods, directed to the real-time drug analysis of eight blockbuster topical drug products. Furthermore, a framework for the development of IVRT studies, based on active pharmaceutical ingredient (API) physicochemical characteristics, is actively pursued. To the best of our knowledge, there is no literature reporting this methodological assembling to assist with fast screening in topical product development.
2. Materials and Methods
2.1. Materials
Micronized hydrocortisone, etofenamate, bifonazole, clotrimazole, acyclovir, tioconazole, clobetasol propionate, and sodium diclofenac were kindly supplied by Laboratórios Basi. Water was purified with a Millipore MILLI-Q reagent water system and filtered through a 0.22 µm nylon filter before use. All other chemicals were of analytical grade or equivalent.
For IVRT studies, eight topical products were included: 1% (w/w) hydrocortisone cream (Pandermil®, Edol, batch 180330); 5% (w/w) acyclovir cream (Zovirax®, GSK, batch C835128); 1% (w/w) bifonazole cream (Canespor®, Bayer, batch BXPJPTB); 0.5% (w/w) clobetasol cream (Dermovate®, GSK, batch G3030); 2% (w/w) diclofenac emulgel (Voltaren emulgelex®, GSK, batch UO4029A); 1% (w/w) tioconazole cream (Trosyd®, Pfizer, batch 1801TR); 10% (w/w) etofenamate gel (Traumon®, Bial, batch 3790251); and 1% (w/w) clotrimazole cream (Canesten®, Bayer, batch BXPJPXZ). All batches and the respective standards were kindly supplied by Laboratórios Basi (Mortágua, Portugal).
2.2. Instrumentation and Chromatographic Conditions
A Shimadzu LC-2010HT apparatus equipped with a quaternary pump (LC-20AD), an autosampler unit (SIL-20AHT), an oven (CTO-10AS), and a detector (SPD-M2OA) was employed to quantify all the drugs. Two columns were used for the analysis: a XBridgeTM C18 with 5 µm particle size, 2.1 mm internal diameter, and 150 mm length and a LiChrospher® 100 RP-18 with 5 µm particle size, 4.6 mm internal diameter, and 125 mm length. Both columns were supported with a SecurityGuard cartridge.
Chromatographic analysis for all analytes were conducted in isocratic mode at 30 °C. Table 1 summarizes the specific analytical conditions used for each drug product.
2.3. Preparation of Stock Solutions, Calibration Standards, and Quality Controls
All stock solutions were prepared by weighing approximately 10 mg of drug in 10 mL of an appropriate solvent, yielding ca. 1 mg/mL concentration.
Methanolic stock solutions were prepared for diclofenac, clobetasol, tioconazole, etofenamate, and clotrimazole. Alternatively, for bifonazole and hydrocortisone, acetonitrile stock solutions were prepared instead. For acyclovir, due to its high hydrophilicity, the stock solution was directly prepared in water. Two working standards were considered for each drug. These were prepared by further dilution of each stock solution with the corresponding release media used in IVRT studies. Table 2 summarizes the release media used for each drug. The rationale used for IVRT release media selection is carefully explained in Section 2.4.8.
Six to ten standard solutions were considered for each calibration curve. Moreover, as quality controls, five replicates of three different concentration standards were used.
Since the focus of the present work was to quantify IVRT samples, preliminary in vitro tests were performed to determine the appropriate range for the calibration standards. Table 3 summarizes the concentrations used for each molecule. In all cases, IVRT and standard samples were directly injected. All stock and working solutions were freshly prepared each day.
2.4. Method Validation
Validation studies were performed according to the International Council for Harmonization (ICH) guidelines for each drug substance [20,21]. These included system suitability, limits of detection, and quantification, linearity, accuracy, precision, robustness, and stability assessments.
2.4.1. System Suitability
System suitability was evaluated by injecting the same standard solutions six times. The following requirements were considered: relative standard deviation (RSD) of the detector response and retention time for all standard injections was not more than 2%, capacity factor (k’) was higher than 2, tailing factor (T) of drug peak was not more than 2.0, and theoretical plate number (N) was higher than 2000. These parameters were obtained by injecting five times an intermediate standard for each drug [22].
2.4.2. Limits of Detection and Quantification
A specific calibration curve obtained from six standard solutions was traced in order to determine the limits of detection (LOD) and quantification (LOQ).
The following expressions were used: LOD = 3.3 σ /S and LOQ = 10 σ /S, where σ is the standard deviation of the response and S the slope of the calibration curve [21].
2.4.3. Linearity
To test the linearity of the detector response, a set of six to ten calibration standards were prepared for each drug, in the corresponding release media. A specific range for each active substance was adopted, taking into account IVRT results. Please see Table 3.
At least four calibration curves were considered for each active substance. Linearity was determined through the calculation of a regression line, attained from the peak area as a function of the standard concentration, by the method of the least squares. To comply with regulatory requirements, curves that did not present a R2 of at least 0.99 were not considered [23].
2.4.4. Accuracy and Precision
Precision measures the closeness of agreement, i.e., the degree of scatter between a series of measurements obtained from multiple sampling of the same homogeneous sample. This validation parameter was assessed by repeatability (intraday) and intermediate precision (interday) for three days, of the established quality control (QC) standards. Five samples of each concentration level were prepared. The RSD determined at each concentration level should not exceed 15%, except for the lower concentrations, where a maximum of 20% was allowed [20,24].
To demonstrate accuracy, the closeness of agreement between the true value and the found value, Equation (1), was used. Afterwards, the mean bias percentage for the five replicates of the three QCs was calculated.
Equation (1):
2.4.5. Ruggedness
To prove the methods ruggedness, five duplicates of the quality control samples were alternatively analyzed using different HPLC equipment, a Shimadzu LC-10AD apparatus, equipped with a quaternary pump (LC-10AD), an autosampler unit (SIL-10ADVP), a CTO-10AVP oven, and a CBM-20 A detector.
2.4.6. Specificity and Selectivity
Specificity, viz., the ability to accurately measure the analyte in the presence of all potential sample components, was evaluated by comparing the chromatograms of three different control matrices: (i), blank receptor medium solution (negative control, Cn), (ii) quality control solutions prepared in receptor medium (positive controls, Cp), and (iii) release medium solution of an IVRT run conducted with the tested formulations (matrix positive control, Cpm). The main purpose of this assessment was to ensure that the integrity of each active substance retrieved from IVRT samples was not compromised by any formulation excipient.
The negative controls (Cn) were analyzed to confirm the absence of any detectable drug concentration. The mean retention time and concentration values (regarding the nominal concentrations) for the Cp and Cpm were used to set the acceptance criteria for the drug retention time, and the difference in both parameters should not exceed 15% [14].
2.4.7. Stability
Five replicates of quality control solutions were prepared to evaluate the stability of IVRT samples at room temperature storage (25 °C) for 24 h in the autosampler and in short-term storage at 4 °C for 72 h [24,25]. The same acceptance criteria established during precision and accuracy assessments were used.
2.4.8. Method Applicability: In Vitro Release Testing
Franz Cell Receptor Fluid Screening
The maintenance of sink conditions is crucial throughout the release experiments, therefore, screening different receptor media (co-solvents and pH effects), according to the active substance physicochemical profile, should be a priority concern [26].
In order to rationally establish solubility conditions to be tested, in silico studies were performed first. For that, the chemical structure of each API was introduced in Chemaxon® software (ChemAxon, Budapest, Hungary) in order to calculate the respective chemical descriptors, such as size, geometry, lipophilicity, solubility, and surface topology [27].
For solubility studies, the adopted protocol included weighing 60–100 mg of active substance into 2 mL flasks. These were then filled with the tested release medium and continuously stirred for 24 h in an oven (37 ± 0.1 °C). Afterwards, the samples were centrifuged, and the supernatant was filtered and appropriately diluted with a mobile phase. The active substance solubility in the different media was determined by RP-HPLC. The results were statistically compared using a two-way analysis of variance (ANOVA), with a Tukey multiple comparison test. The differences between the means were considered to be significant for values of p < 0.05. The statistical tests were applied using GraphPad Prism, version 6.01 (GraphPad Software, San Diego, CA, USA).
IVRT Studies
Release studies of the different drug products were conducted using static vertical Franz diffusion cells (PermeGear, Inc., PA, USA) with a diffusion area of 0.636 cm2 and a receptor compartment of 5 mL. All studies followed the indications provided in the Topical and Transdermal Drug Products—Product Performance Tests section of the United States Pharmacopoeia (USP) [23]. Briefly, 300 mg of the semi-solid formulations were applied in the donor compartment, separated from the receptor compartment by a polysulfone membrane (HT: 200 Tuffryn diameter 25 mm, pore size 0.45 µm, Pall Corporation, USA), previously soaked in distilled water for 30 min. Specific receptor media were used for each drug product, see Table 2. The receptor media was in all cases continuously stirred at 600 rpm and maintained at a temperature of 37 °C, while a circulating water bath maintained the membrane surface at 32°. Before the release experiments, the system was allowed to equilibrate for at least 30 min. Throughout the release studies, the donor compartment and the receptor sampling arm were carefully covered with Parafilm® to avoid unnecessary release media volatilization and to conduct all the release experiments under occlusive conditions. Samples of the receptor phase (300 µL) were withdrawn at 0.25, 0.5, 1, 2, 3, 4, 6, and 8 h.
After each collection, the same volume of medium was replaced with fresh receptor solution. The cumulative amount of drug released as a function of time was calculated in relation to the amount of formulation placed in the donor compartment using Equation (2):
where Cn corresponds to the drug concentration of the receptor medium at each sampling time, Ci to the drug concentration of the ith sample, A to the effective diffusion area, and V0 and Vi to the volumes of the receptor compartment and the collected sample, respectively. The release rates were calculated from the slope of the regression line obtained by plotting the cumulative amount of drug diffused per cm2 versus the square root of time [14,28,29].
Mass balance studies were also performed to characterize the extent of dose depletion during the IVRT. For that, the average cumulative amount released at the last sampling point (Qf) was divided by the actual amount of active substance placed in the diffusion cell, and multiplied by 100. An n = 12 was considered for each product.
3. Results and Discussion
3.1. Method Validation
3.1.1. System Suitability
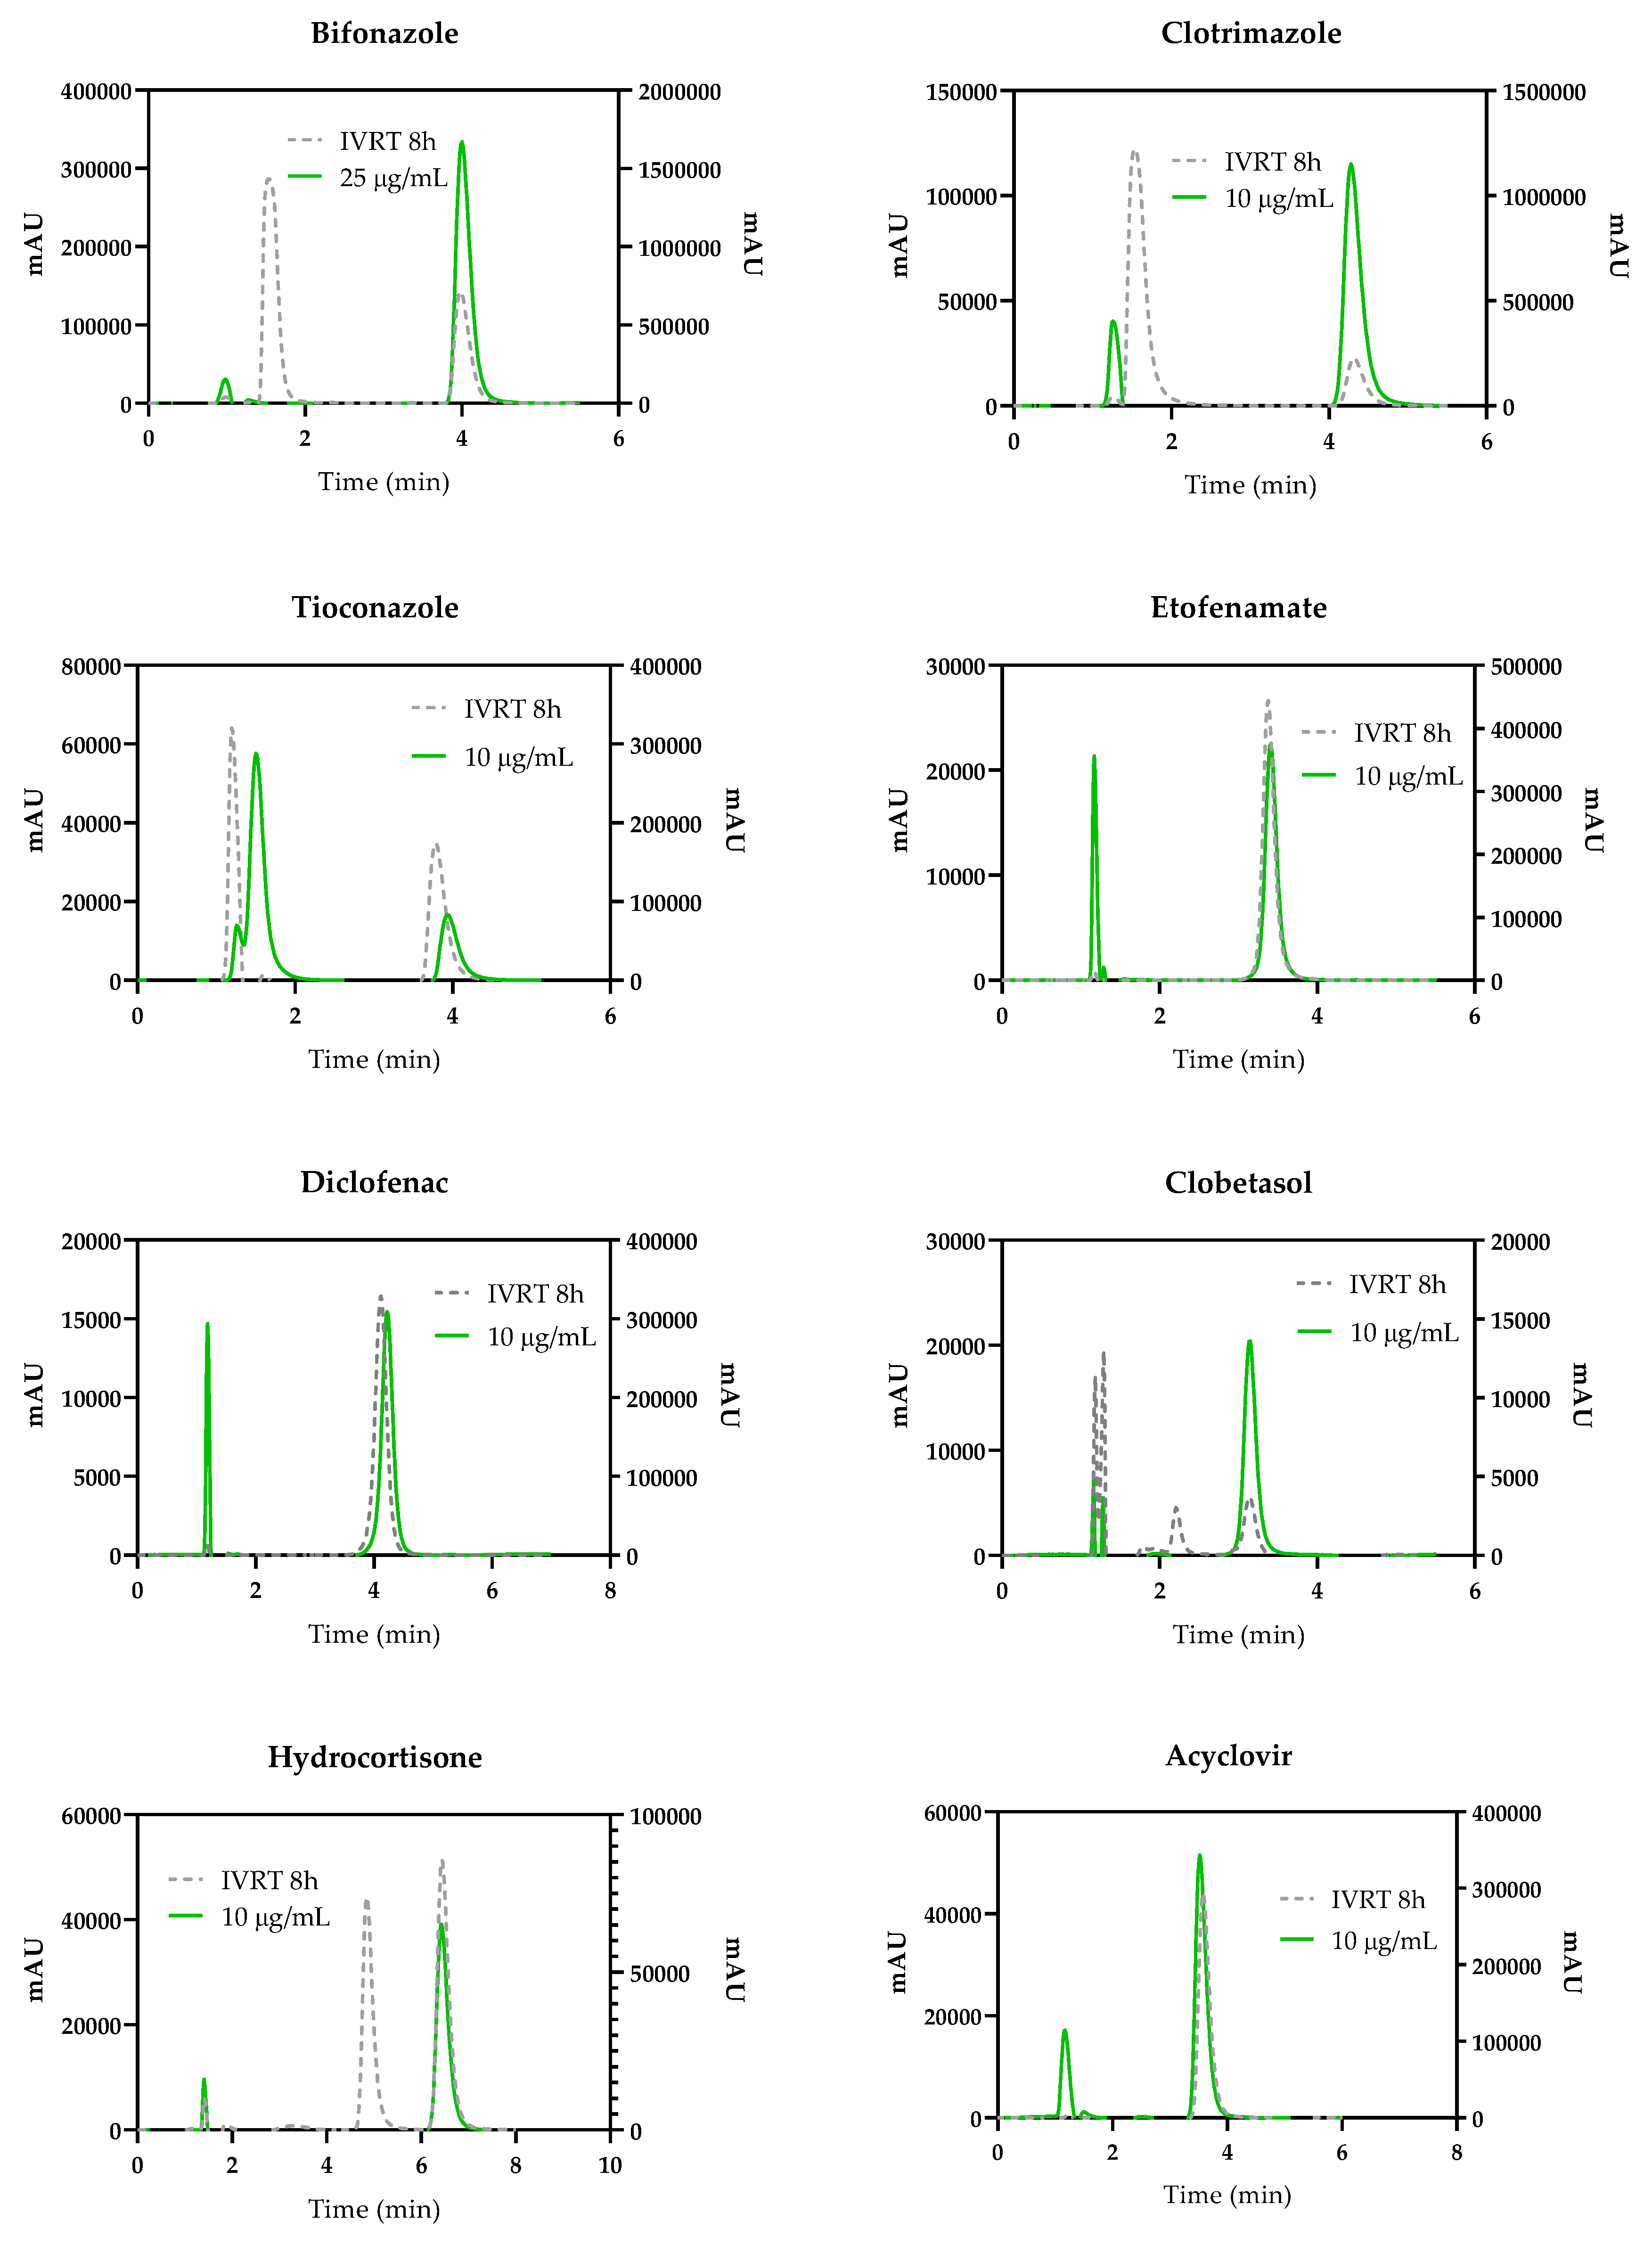
Chromatographic separation of all drugs in their respective release media was successfully achieved using the previously described analytical conditions, see Figure 1.
Please note that the products used in this study are complex formulations with multiple ingredients. Preservatives such as benzyl alcohol or methyl parahydroxybenzoate, present in some of the studied products, absorb in the UV region. For this reason, additional peaks are present in IVRT samples of bifonazole, clobetasol, and tioconazole (pertaining to benzyl alcohol) and in hydrocortisone (corresponding to methyl parahydroxybenzoate). In all cases, drug peaks were resolved from the additional components, thus highlighting the specificity of the proposed methods.
To further illustrate the chromatographic similarity between the standards and IVRT samples, the retention times are presented in Table 4.
System suitability tests aim to assess if the chromatograph and respective modules are able to generate acceptable accuracy and precision results. To provide quantitative data, several parameters should be taken into consideration. These include: number of theoretical plates, separation factor, resolution, tailing factor, and precision [30].
System suitability results and acceptance criteria are summarized in Table 5.
The precision of both peak area and retention time was compliant for all drugs, thus documenting the system’s ability to detect and analyze the compounds in their respective release media.
Column efficiency was also evidenced for all drugs, since the number of theoretical plates (T. Plates), tailing factor (T. Factor), and resolution were compliant with ICH criteria. Even though the capacity factor (k′) for acyclovir and clobetasol was slightly beneath 2.0, according to the British Pharmacopoeia, this value can still be accepted (k′ < 1.5) [31].
3.1.2. Limits of Detection and Quantification
3.1.3. Linearity
IVRT sample concentration is interpolated by using the regression results obtained from calibration curves. These are often calculated through the least squares method that estimates the correlation coefficient (R2) and the regression equation [24,32]. Table 7 depicts the results from linearity studies.
All R2 were superior to 0.99 and, therefore, evidence is provided regarding data quality and linearity in the proposed range.
3.1.4. Accuracy and Precision
Calibration curve quality should also be documented through the evaluation of precision and accuracy. Both parameters should be assessed at the intraday and interday levels.
According to our results, displayed in Table 8, RSD values did not exceed 15%, even for the lowest concentration QC. The same trend was also verified for the accuracy results.
These results substantiate that the developed methods are accurate, reliable, and reproducible, since they all met the acceptance recommendations.
3.1.5. Ruggedness
The ability of the method to provide reliable results despite minor variations in the analytical conditions can be defined as ruggedness or robustness. Nevertheless, both terms present slight differences [33]. ICH defines analytical method robustness as, “the measure of its capacity to remain unaffected by small, but deliberate variations in method parameters and provides an indication of its reliability during normal usage” [34]. Furthermore, ICH provides examples of such variations. These include mobile phase composition/pH variations, different columns, and different temperature analysis or flow rates [33,34]. USP defines ruggedness as a measure of reproducibility of the test results under the variation conditions normally expected from laboratory to laboratory and from analyst to analyst [35]. According to these compendial definitions, the term ruggedness is more accurate when considering two different equipment types. Table 9 summarizes robustness results.
Even though all results are in good acceptance with regulatory standards, some borderline results were verified for hydrocortisone, etofenamate, and clotrimazole.
3.1.6. Stability
Stability testing should mimic common sampling procedures, so as to provide reliable data analysis. The stability conditions assessed included autosampler and short-term stability. Results are presented in Table 10.
According to the results, it can be inferred that the analytes are stable under the studied conditions, since precision and accuracy requirements were met.
3.2. Method Applicability: IVRT
3.2.1. In Silico Studies: Using Chemical Predictors to Support IVRT Development
In order to determine the most appropriate conditions for solubility studies, the physicochemical properties of each molecule were firstly predicted in silico and used to infer their ionization, lipophilicity, permeability, and solubility status, please see Table 11.
The distribution coefficients (Log D) were determined within a physiological range of pH values compatible with skin application. The distribution coefficient is the appropriate descriptor for ionizable compounds, since it relates to the solubility of all chemical forms depending on the selected pH. Hydrocortisone, etofenamate, acyclovir, and clobetasol, as neutral actives, do not present changes in LogD at different pH values. By contrast, all antifungal drugs and diclofenac show opposite behaviors. For diclofenac, the Log D at 4.6 was higher than the Log D at 6.5, since the non-ionized form is predominant at an acidic pH [36]. As expected, the reverse situation is observed for all antifungal drugs, where an increase of pH is followed by an increase of the Log D. Bifonazole, tioconazole, and clotrimazole are mainly present in their ionized form at an acidic pH (1.7), however, this pH is not compatible with a dermal application.
According to the Lipinski rule of five, it is more likely for a compound to exhibit an enhanced permeability if the number of hydrogen bond donors/acceptors is no more than 5 or 10, respectively, the molecular weight does not exceed 500 Da, and the LogP is not more than 5. Hydrocortisone, etofenamate, acyclovir, clobetasol, and diclofenac comply with these requirements, while the other active substances (antifungals) are expected to have poorer permeability [27].
Regarding lipophilicity, different profiles can be identified. Hydrocortisone and acyclovir exhibit moderate lipophilicity (0 < LogP < 3), while the other compounds are predominantly more lipophilic. The solubility of the compounds was carefully inspected in order to select the most appropriate IVRT conditions. Acyclovir and hydrocortisone, as previously mentioned, display the highest intrinsic solubility amongst the studied drugs (acyclovir is very soluble and hydrocortisone is freely soluble) [37]. Moreover, the solubility of both actives is not affected by the pH. These reasons support the selection of PBS (pH = 7.4) as the release media during IVRT experiments. Nevertheless, taking into account the information displayed in the Topical and Transdermal Drug Products Product Performance Tests section in the USP, in which an IVRT method for a hydrocortisone cream is presented, a water/ethanol (70:30, v/v) release media is suggested [23]. Therefore, for hydrocortisone, this particular release media was considered.
Diclofenac and etofenamate can be classified as sparingly soluble, hence the effects of two co-solvents, ethanol and propylene glycol, were tested. Etofenamate Log D displays no alteration within the considered pH range, therefore, a pH =7.4 was solely considered. The solubility was then assessed in the following conditions: PBS/co-solvent 80:20 and 70:30, v/v. On the other hand, diclofenac solubility is impacted by the pH, consequently, screening studies were performed at a pH values of 3.6, 5.5, and 7.4 in the condition PBS/co-solvent 80:20, v/v [11].
Clobetasol is considered slightly soluble and its Log D is not affected by pH. Taking this into account, the following conditions were tested: PBS/ethanol 70:30 and 50:50, v/v.
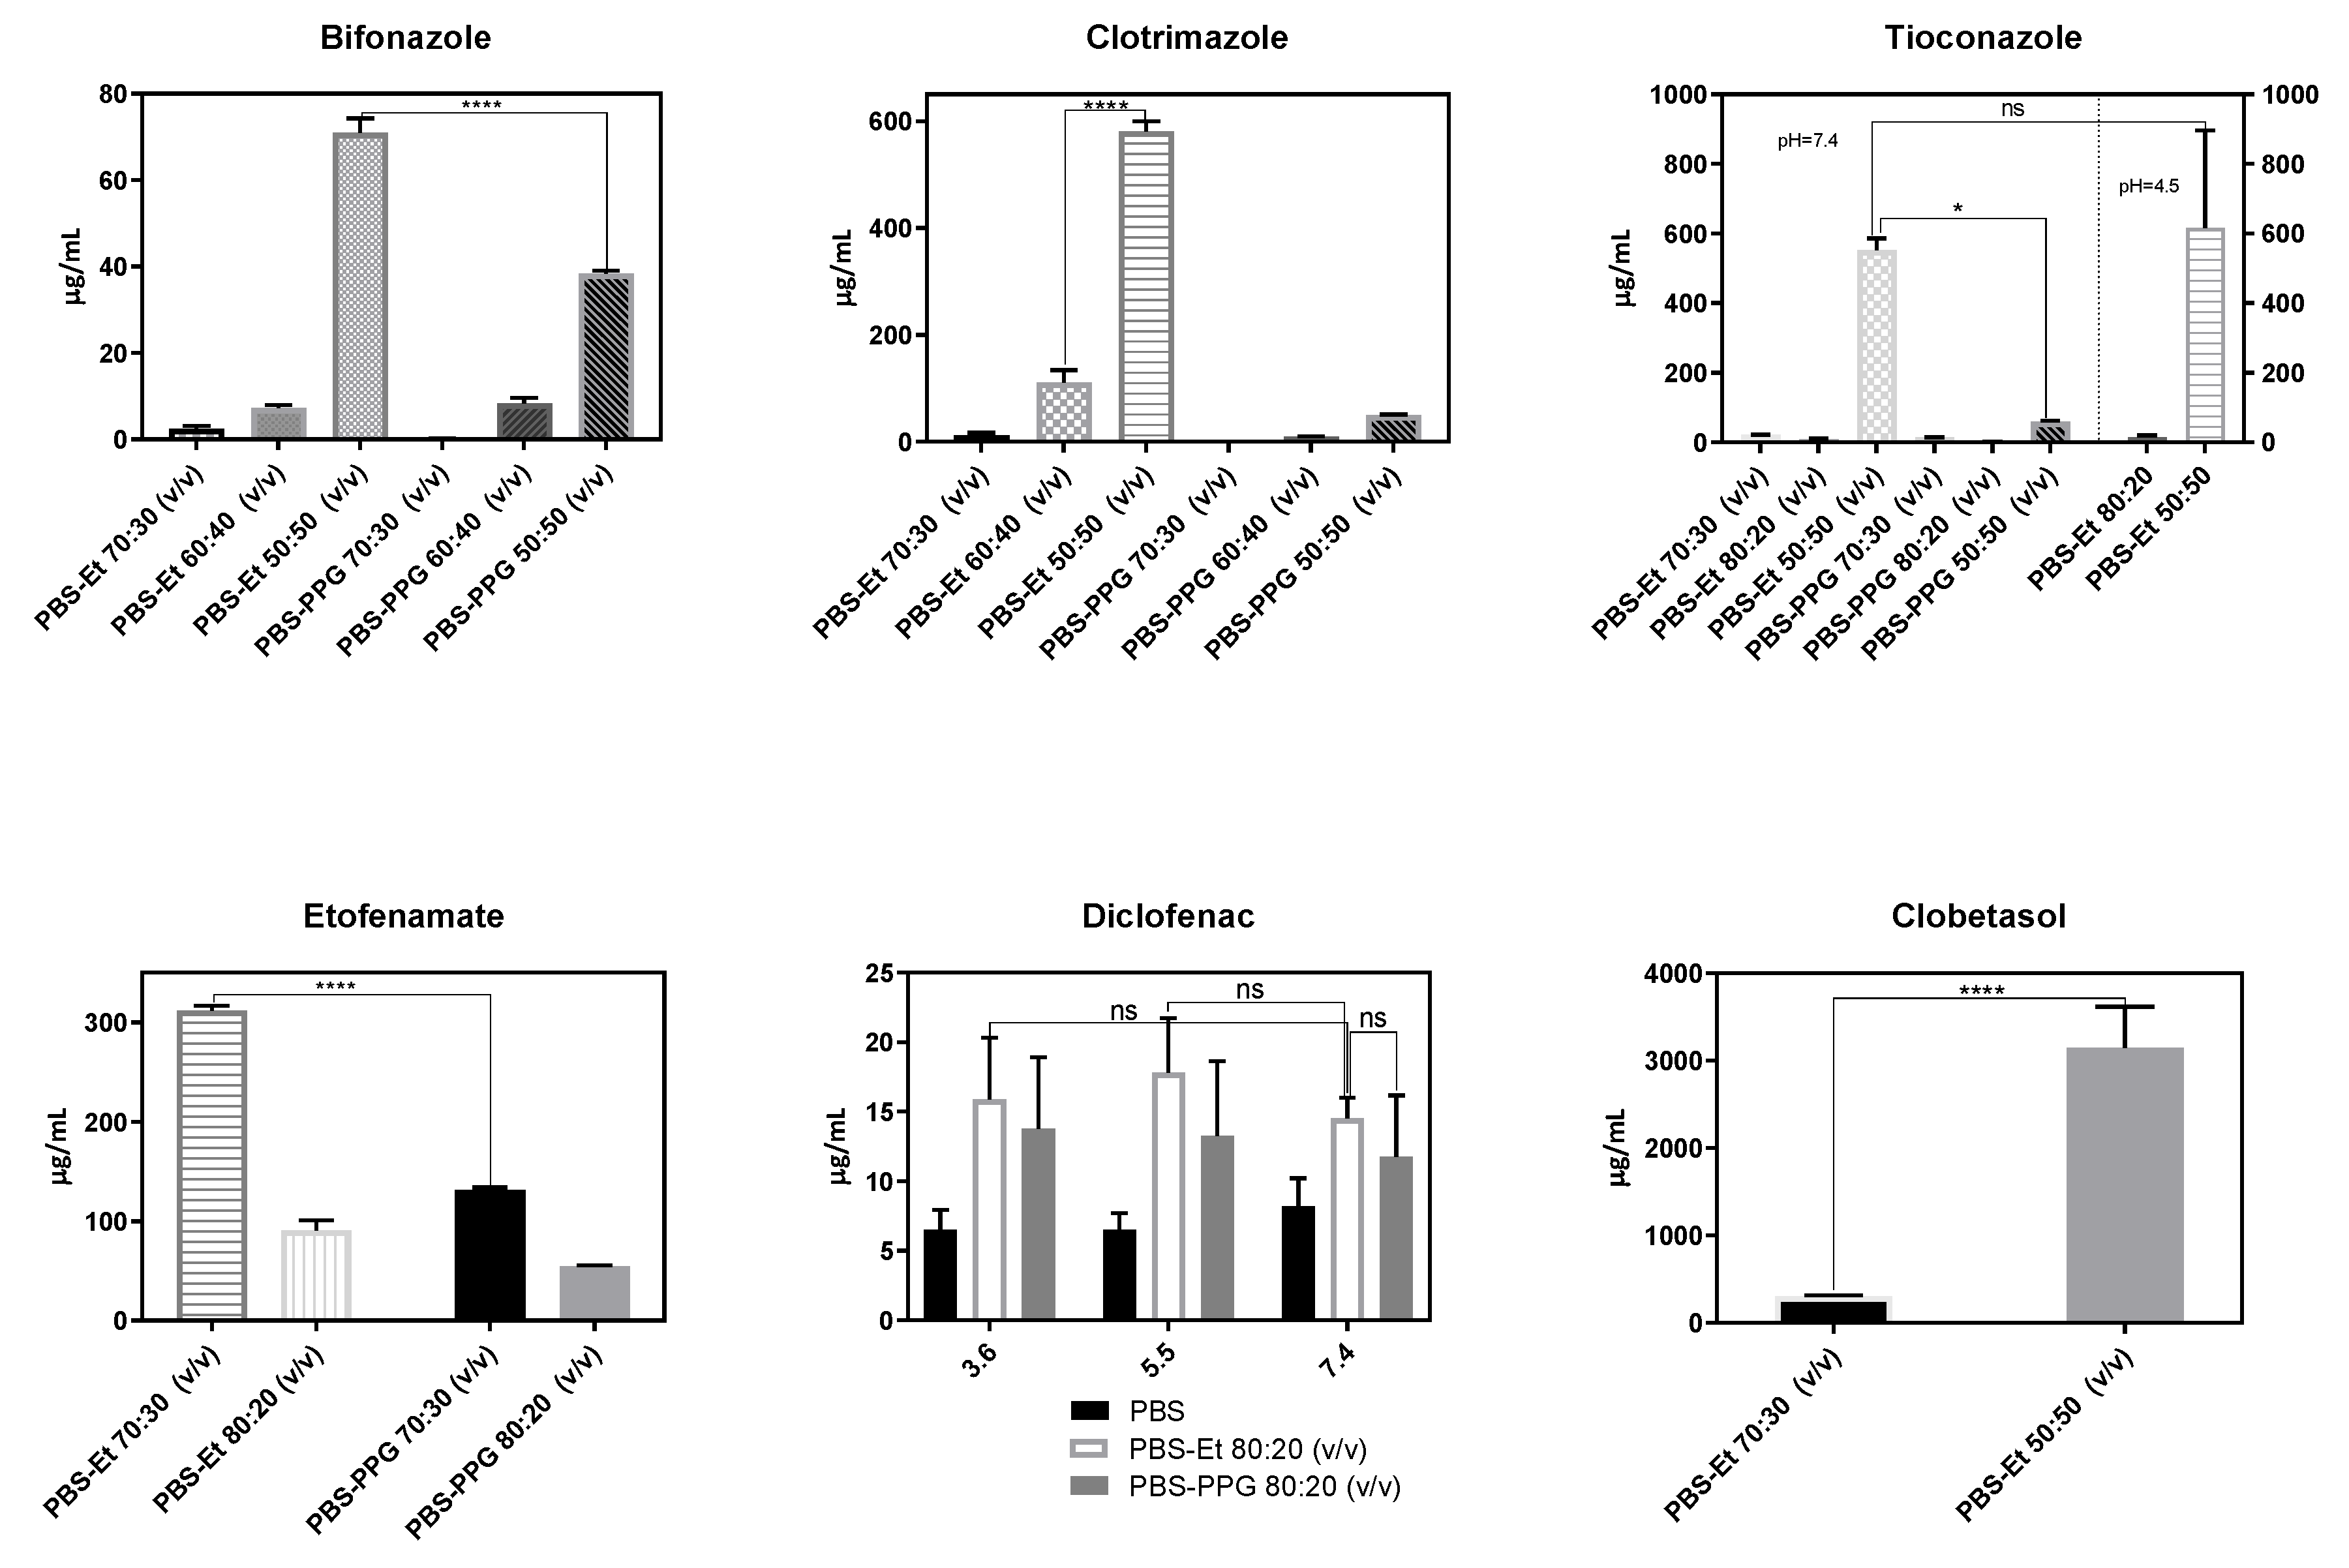
Antifungal molecules present the lowest solubility, as they are considered as very slightly soluble molecules. As previously mentioned, these molecules do not exhibit change in the Log D at a physiological pH compatible with skin application. However, for tioconazole, at a pH = 4.6, the molecule evidences some degree of solubility. Therefore, the effect of the same co-solvents was screened in the following conditions: PBS/co-solvent 70:30, 60:40, and 50:50, v/v, for both bifonazole and clotrimazole. Alternatively, for tioconazole, PBS/co-solvent ratios of 80:20, 70:30, and 50:50, v/v, were tested at a pH = 7.4. Since ethanol provided the highest solubility results, the PBS/ethanol 80:20 and 50:50, v/v, conditions were repeated, but at a pH of 4.5. Solubility results are presented in Figure 2.
Ethanol was herein selected due to its prevalence in the literature, while the selection of propylene glycol was mainly related to the presence of this component in the qualitative formulation of some products. In fact, among the polyvalent alcohols, propylene glycol is the most frequently used co-solvent in topical products [11,38]. Nevertheless, for all drugs, ethanol demonstrated a higher solubility.
For etofenamate, PBS/ethanol pH = 7.4 at a 70:30, v/v, ratio was selected as the release medium. For bifonazole, clotrimazole, and clobetasol, a 50:50, v/v, ratio of PBS/ethanol pH = 7.4 enabled the optimal solubility conditions. For tioconazole, the same media displayed good results, however, a pH = 4.5 was selected. Finally, for diclofenac, a PBS/ethanol 80:20, v/v, at a pH = 7.4 was selected. Please note that diclofenac conditions were already optimized in a previous study directed at IVRT method optimization [11].
3.2.2. IVRT
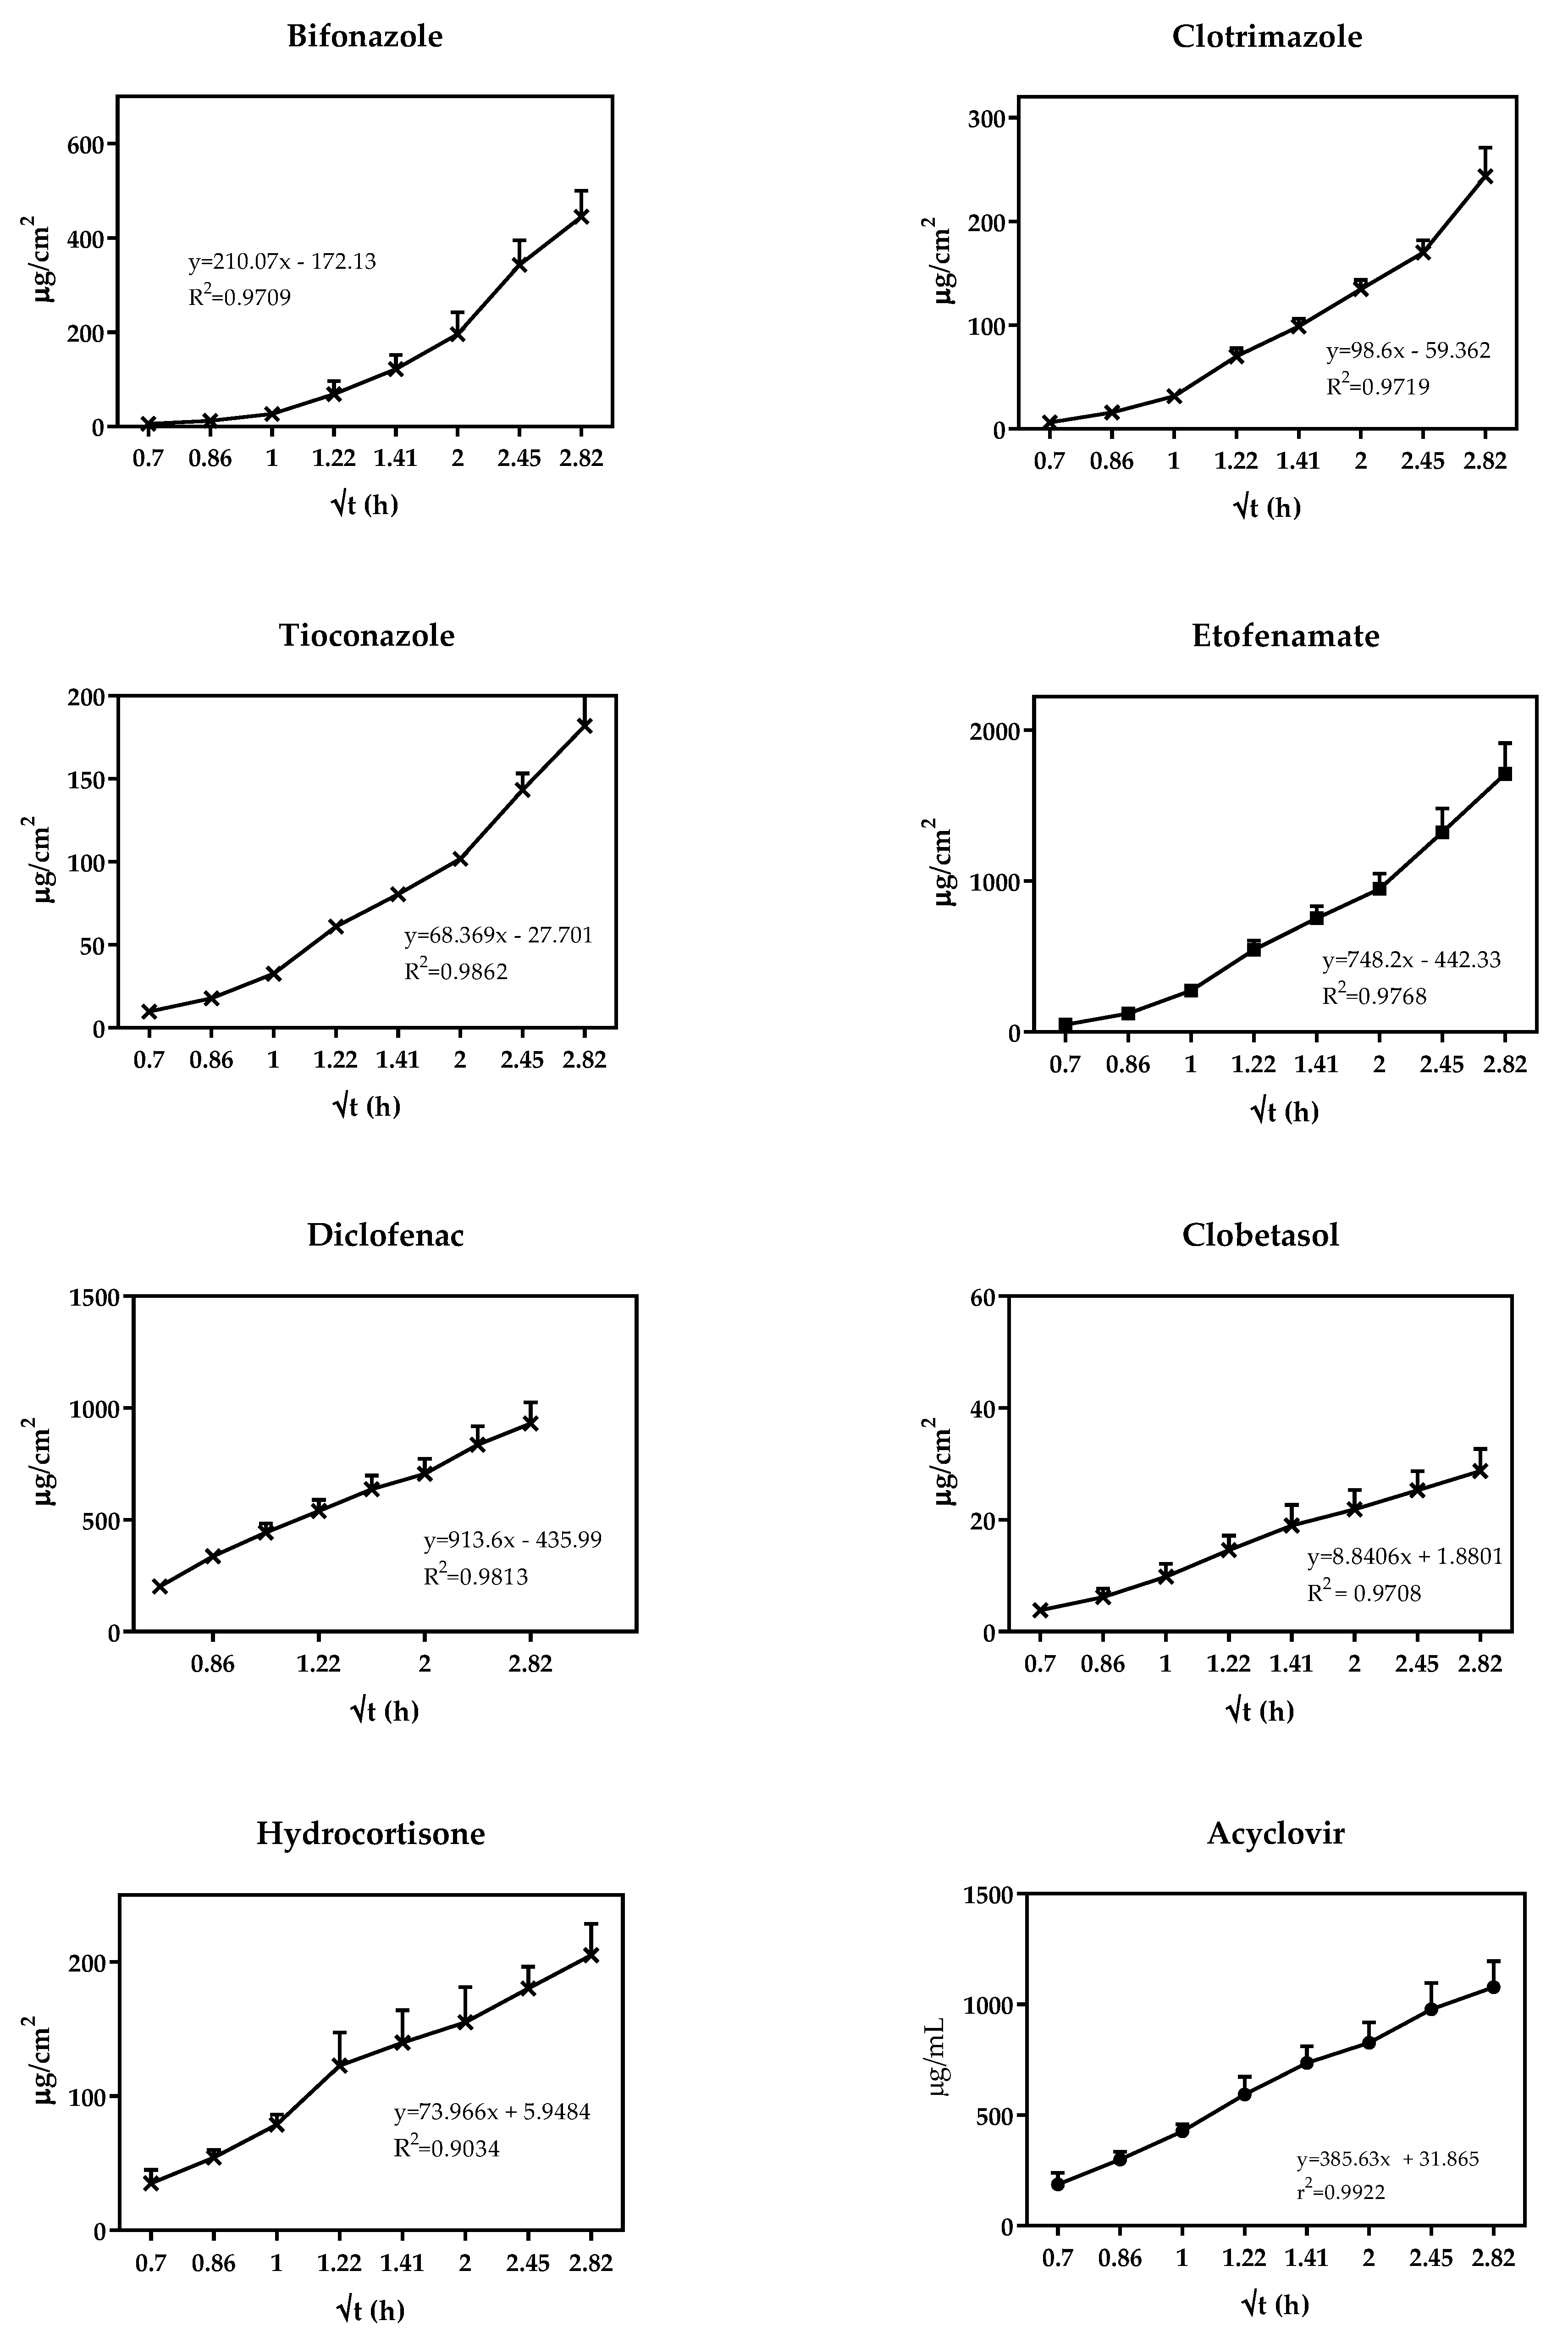
The release profile provides useful information on the pharmaceutical performance characteristics of topical products, including nanotechnology-based formulations, since the API must be released before it becomes bioavailable in the skin. Moreover, from both scientific and regulatory perspectives, IVRT methods are responsive to product microstructure, making them a useful tool to assess product similarity [4,39,40,41].
The analytical methods developed in this work were used to monitor drug concentrations in IVRT samples. Figure 3 shows the IVRT profiles.
4. Conclusions
Considering the current regulatory background, product performance evaluation techniques, such as IVRT, are becoming increasingly common in all stages of topical products’ lifecycles. In this context, one of the principal contributions of the present paper relies on the establishment of a portfolio of HPLC methods specifically tailored for commercially available topical products. The analytical methods presented here are specific, linear, accurate, reliable, and reproducible. Due to their simplicity and a high sample throughput potential, this database can constitute a useful tool for (i) fast screening of formulation performance, and (ii) timely analysis of batch compliance, supporting a routine implementation.
Lastly, an in silico approach was successfully developed to assist the IVRT design.
Author Contributions
Conceptualization, C.V.; Methodology, M.M.; Software, M.M.; Validation, M.M.; Formal Analysis, M.M.; Investigation, M.M.; Resources, C.V.; Data Curation, C.V.; Writing-Original Draft Preparation, M.M.; Writing-Review and Editing, C.V.; Visualization, C.V.; Supervision, C.V. and C.C.; Funding Acquisition, C.V. and C.C. All authors have read and agreed to the published version of the manuscript.
Funding
This research was funded by FCT (Fundação para a Ciência e a Tecnologia, Portugal) and Laboratórios Basi from Drugs R&D Doctoral Program. Grant number (PhD PD/BDE/135075/2017). The authors acknowledge the Coimbra Chemistry Centre, supported by FCT, through the projects PEst-OE/QUI/UI0313/2014 and POCI-01-0145-FEDER-007630.
Conflicts of Interest
The authors declare no conflict of interest.
Abbreviations
| ACV | Acyclovir |
| API | Active pharmaceutical ingredient |
| BFZ | Bifonazole |
| CLB | Clobetasol |
| CLT | Clotrimazole |
| CQA | Critical quality attribute |
| DF | Diclofenac |
| ETF | Etofenamate |
| LOD | Limit of detection |
| LOQ | Limit of quantification |
| QC | Quality control |
| RP-HPLC | Reversed phase high performance liquid chromatography |
| TCZ | Tioconazole |
| TP | Topical product |
| USP | United States Pharmacopoeia |
References
- Mordor, I. Dermatological Therapeutics Market | Growth, Trends, and Forecast (2019–2024). Available online: https://www.mordorintelligence.com/industry-reports/dermatological-therapeutics-market (accessed on 29 October 2019).
- Patere, S.; Newman, B.; Wang, Y.; Choi, S.; Vora, S.; Ma, A.W.K.; Jay, M.; Lu, X. Influence of Manufacturing Process Variables on the Properties of Ophthalmic Ointments of Tobramycin. Pharm. Res. 2018, 35, 179. [Google Scholar] [CrossRef] [PubMed]
- Simões, A.; Veiga, F.; Vitorino, C. Developing Cream Formulations: Renewed Interest in an Old Problem. J. Pharm. Sci. 2019, 108, 3240–3251. [Google Scholar] [CrossRef] [PubMed]
- Ethier, A.; Bansal, P.; Baxter, J.; Langley, N.; Richardson, N.; Patel, A.M. The Role of Excipients in the Microstructure of Topical Semisolid Drug Products. In The Role of Microstructure in Topical Drug Product Development; Langley, N., Michniak-Kohn, B., Osborne, D.W., Eds.; Springer International Publishing: Cham, Switzerland, 2019; pp. 155–193. ISBN 978-3-030-17355-5. [Google Scholar]
- Murthy, S.N. Characterizing the Critical Quality Attributes and In Vitro Bioavailability of Acyclovir and Metronidazole Topical Products. In Proceedings of the FDA workshop on Bioequivalence Testing of Topical Drug Products, Silver Spring, MD, USA, 20 October 2019. [Google Scholar]
- Mangas-Sanjuán, V.; Pleguezuelos-Villa, M.; Merino-Sanjuán, M.; Hernández, M.J.; Nácher, A.; García-Arieta, A.; Peris, D.; Hidalgo, I.; Soler, L.; Sallan, M.; et al. Assessment of the inter-batch variability of microstructure parameters in topical semisolids and impact on the demonstration of equivalence. Pharmaceutics 2019, 11, 503. [Google Scholar] [CrossRef] [PubMed] [Green Version]
- Soares, S.; Sousa, J.; Pais, A.; Vitorino, C. Nanomedicine: Principles, Properties, and Regulatory Issues. Front. Chem. 2018, 6, 1–15. [Google Scholar] [CrossRef] [PubMed]
- Simões, A.; Veiga, F.; Figueiras, A.; Vitorino, C. A practical framework for implementing Quality by design to the development of topical drug products: Nanosystem-based dosage forms. Int. J. Pharm. 2018, 548, 385–399. [Google Scholar] [CrossRef]
- EMA. Draft Guideline on Quality and Equivalence of Topical Products; EMA: Amsterdam, The Netherlands, 2018. [Google Scholar]
- Flühmann, B.; Ntai, I.; Borchard, G.; Simoens, S.; Mühlebach, S. Nanomedicines: The magic bullets reaching their target? Eur. J. Pharm. Sci. 2018, 128, 73–80. [Google Scholar] [CrossRef]
- Miranda, M.; Pais, A.A.; Cardoso, C.; Vitorino, C. aQbD as a platform for IVRT method development–A regulatory oriented approach. Int. J. Pharm. 2019, 572, 118695. [Google Scholar] [CrossRef]
- Shah, V.P.; Yacobi, A.; Ştefan Rădulescu, F.; Miron, D.S.; Lane, M. A science based approach to topical drug classification system (TCS). Int. J. Pharm. 2015, 491, 21–25. [Google Scholar] [CrossRef]
- Yacobi, A.; Shah, V.P.; Bashaw, E.; Benfeldt, E.; Davit, B.; Ganes, D.; Ghosh, T.; Kanfer, I.; Kasting, G.B.; Katz, L.; et al. Current Challenges in Bioequivalence, Quality, and Novel Assessment Technologies for Topical Products. Pharm. Res. 2014, 31, 837–846. [Google Scholar] [CrossRef]
- Tiffner, K.I.; Kanfer, I.; Augustin, T.; Raml, R.; Raney, S.G.; Sinner, F. A comprehensive approach to qualify and validate the essential parameters of an in vitro release test (IVRT) method for acyclovir cream, 5%. Int. J. Pharm. 2018, 535, 217–227. [Google Scholar] [CrossRef]
- Miranda, M.; Sousa, J.; Veiga, F.; Cardoso, C.; Vitorino, C. Bioequivalence of topical generic products. Part 1: Where are we now? Eur. J. Pharm. Sci. 2018, 123, 260–267. [Google Scholar] [CrossRef] [PubMed]
- Miranda, M.; Sousa, J.; Veiga, F.; Cardoso, C.; Vitorino, C. Bioequivalence of topical generic products. Part 2. Paving the way to a tailored regulatory system. Eur. J. Pharm. Sci. 2018, 122, 264–272. [Google Scholar] [CrossRef] [PubMed]
- Katragadda, U. Common Deficiencies-OGD Considerations. In Proceedings of the FDA workshop Complex Generic Drug Product Development Workshop, Maryland, MD, USA, 25 September 2019. [Google Scholar]
- Kikwai, L.; Tran, D.; Hauck, W.W.; Shah, V.P.; Stippler, E.S. Effect of Various Operational Parameters on Drug Release from a 1% Hydrocortisone Semisolid Dosage Form Using the Vertical Diffusion Cell Apparatus. Dissolution Technol. 2012, 19, 6–13. [Google Scholar] [CrossRef]
- Naik, P.; Shah, S.; Heaney, J.; Hanson, R.; Nagarsenker, M. Influence of Test Parameters on Release Rate of Hydrocortisone from Cream: Study Using Vertical Diffusion Cell. Dissolution Technol. 2016, 23, 14–20. [Google Scholar] [CrossRef]
- CDER. Validation of Chromatographic Methods; CDER: Washington, DC, USA, 1994. [Google Scholar]
- ICH. ICH Topic Q2 (R1) Validation of Analytical Procedures: Text and Methodology. Int. Conf. Harmon. 2005, 1994, 17. [Google Scholar]
- Kregar, M.L.; Dürrigl, M.; Rožman, A.; Jelcic, Z.; Cetina-Čižmek, B.; Filipović-Grčić, J. Development and validation of an in vitro release method for topical particulate delivery systems. Int. J. Pharm. 2015, 485, 202–214. [Google Scholar] [CrossRef]
- USP Topical and Transdermal Drug Products—Product Performance Tests. Pharmacopeial Forum 2009, 35, 12–28.
- Basso, J.; Mendes, M.; Cova, T.; Sousa, J.; Pais, A.A.C.C.; Vitorino, C. Analytical Quality by Design (AQbD) as a multiaddressable platform for co-encapsulating drug assays. Anal. Methods 2018, 10, 5659–5671. [Google Scholar] [CrossRef]
- Vitorino, C.; Alves, L.; Antunes, F.; Sousa, J.; Pais, A.A.C.C. Design of a dual nanostructured lipid carrier formulation based on physicochemical, rheological, and mechanical properties. J. Nanoparticle Res. 2013, 15, 15. [Google Scholar] [CrossRef]
- Baert, B.; Boonen, J.; Burvenich, C.; Roche, N.; Stillaert, F.; Blondeel, P.; Van Boxclaer, J.; De Spiegeleer, B. A new discriminative criterion for the development of Franz diffusion tests for transdermal pharmaceuticals. J. Pharm. Pharm. Sci. 2010, 13, 218–230. [Google Scholar] [CrossRef]
- Faria, M.J.; Machado, R.; Ribeiro, A.; Gonçalves, H.; Oliveira, M.E.C.R.; Viseu, T.M.; Das Neves, J.; Lúcio, M. Rational Development of Liposomal Hydrogels: A Strategy for Topical Vaginal Antiretroviral Drug Delivery in the Context of HIV Prevention. Pharmaceutics 2019, 11, 485. [Google Scholar] [CrossRef] [Green Version]
- Krishnaiah, Y.S.R.; Xu, X.; Rahman, Z.; Yang, Y.; Katragadda, U.; Lionberger, R.; Peters, J.R.; Uhl, K.; Khan, M. Development of performance matrix for generic product equivalence of acyclovir topical creams. Int. J. Pharm. 2014, 475, 110–122. [Google Scholar] [CrossRef] [PubMed]
- FDA. Guidance for Industry: Nonsterile Semisolid Dosage Forms: Scale-up and Postapproval Changes: Chemistry, Manufacturing, and Controls: In Vitro Release Testing and In Vivo Bioequivalence Documentation; FDA: Washington, DC, USA, 1997. [Google Scholar]
- Papadoyannis, I.N.; Samanidou, V.F. Validation of HPLC Instrumentation. J. Liq. Chromatogr. Relat. Technol. 2004, 27, 753–783. [Google Scholar] [CrossRef]
- Vitorino, C.; Sousa, J.; Pais, A.A.C.C. A rapid reversed-phase HPLC method for the simultaneous analysis of olanzapine and simvastatin in dual nanostructured lipid carriers. Anal. Methods 2013, 5, 5058–5064. [Google Scholar] [CrossRef]
- Gonçalves, J.; Alves, G.; Bicker, J.; Falcão, A.; Fortuna, A. Development and full validation of an innovative HPLC-diode array detection technique to simultaneously quantify lacosamide, levetiracetam and zonisamide in human plasma. Bioanalysis 2018, 10, 541–557. [Google Scholar] [CrossRef] [PubMed]
- Gonzalez, O.; Blanco, M.E.; Iriarte, G.; Bartolomé, L.; Maguregui, M.I.; Alonso, R.M.; Alonso, R.M. Bioanalytical chromatographic method validation according to current regulations, with a special focus on the non-well defined parameters limit of quantification, robustness and matrix effect. J. Chromatogr. A 2014, 1353, 10–27. [Google Scholar] [CrossRef]
- ICH. Validation of Analytical Procedures: Text and Methodology Q2(R1); ICH: Geneva, Switzerland, 2005. [Google Scholar]
- USP Validation of compendial methods. In United States Pharmacopeia and National Formulary; U.S. Pharmacopeia: Rockville, MD, USA, 2005; pp. 2748–2751. ISBN 1-889788-25-2.
- Carrer, V.; Guzmán, B.; Marti, M.; Alonso, C.; Coderch, L. Lanolin-Based Synthetic Membranes as Percutaneous Absorption Models for Transdermal Drug Delivery. Pharmaceutics 2018, 10, 73. [Google Scholar] [CrossRef] [Green Version]
- Council of Europe. Shutdown of European Pharmacopoeia, 9th ed.; Council of Europe: Strasburg, France, 2019.
- De Melo, E.K.S.; De Araujo, T.P.; Da Silva, J.W.V.; Chagas, S.; Bedor, D.C.G.; De Santana, D.P.; Leal, L.B. Metronidazole thermogel improves retention and decreases permeation through the skin. Braz. J. Pharm. Sci. 2017, 53, 1–9. [Google Scholar]
- Braddy, A.C.; Davit, B.M.; Stier, E.M.; Conner, D.P. Survey of International Regulatory Bioequivalence Recommendations for Approval of Generic Topical Dermatological Drug Products. AAPS J. 2014, 17, 121–133. [Google Scholar] [CrossRef] [Green Version]
- Chang, R.-K.; Raw, A.; Lionberger, R.; Yu, L. Generic Development of Topical Dermatologic Products, Part II: Quality by Design for Topical Semisolid Products. AAPS J. 2013, 15, 674–683. [Google Scholar] [CrossRef] [Green Version]
- Miranda, M.; Cardoso, C.; Vitorino, C. Quality and Equivalence of Topical Products: A Critical Appraisal. Eur. J. Pharm. Sci. 2019, 105082. [Google Scholar] [CrossRef] [PubMed]
- Higuchi, T. Rate of Release of Medicaments from Ointment Bases Containing Drugs in Suspension. J. Pharm. Sci. 1961, 50, 874–875. [Google Scholar] [CrossRef] [PubMed]
Figure 1.
Representative chromatograms of a standard solution (solid green line) and in vitro release testing (IVRT) samples acquired at 8 h (dashed grey line).
Figure 1.
Representative chromatograms of a standard solution (solid green line) and in vitro release testing (IVRT) samples acquired at 8 h (dashed grey line).

Figure 2.
Solubility of the active substances in each medium. The results are expressed as mean ± standard error of the mean (SEM) (4 ≤ n ≤ 7). Since the data are normally distributed (Shapiro-Wilk normality test), a two-way ANOVA with a Tukey multiple comparison test was employed to statistically compare the means. The differences among the means were considered significant for values of p < 0.1. PBS: phosphate based saline; PBS-Et: phosphate based saline/ethanol; PBS-PPG: phosphate based saline/propylenoglycol.

Figure 3.
IVRT profiles of the studied products. Results are expressed as mean ± SD (n = 12).


Table 1.
Analytical conditions. All developed methods are isocratic and relate to a 10 µL injection volume.
Table 1.
Analytical conditions. All developed methods are isocratic and relate to a 10 µL injection volume.
| Bifonazole | Column: XBridgeTM C18 5 µm (2.1 × 150 mm) |
| Mobile phase: Buffer solution (2 mL of phosphoric acid with 980 mL of ultrapurified water, adjusted to pH 3.2 ± 0.05 with trimethylamine) and acetonitrile (68:32, v/v) | |
| Flow: 0.5 mL/min | |
| Run time: 5.5 | |
| Wavelength: 210 nm | |
| Clotrimazole | Column: XBridgeTM C18 5 µm (2.1 × 150 mm) |
| Mobile phase: Methanol: 25 mM dipotassium hydrogen phosphate 75:25 m v/v, pH = 7.5 | |
| Flow: 0.4 mL/min | |
| Run time: 5.5 min | |
| Wavelength: 210 nm | |
| Tioconazole | Column: XBridgeTM C18 5 µm (2.1 × 150 mm) |
| Mobile phase: water: methanol (20:80, v/v) | |
| Flow: 0.4 mL/min | |
| Run time: 5.5 min | |
| Wavelength: 218 nm | |
| Etofenamate | Column: LiChrospher® 100 RP-18. 5 µm (4.6 mm × 125 mm) |
| Mobile phase: methanol: acetic acid 2% (80:20, v/v) | |
| Flow: 1 mL/min | |
| Run time: 5.5 min | |
| Wavelength: 287 nm | |
| Sodium diclofenac | Column: LiChrospher® 100 RP-18. 5 µm (4.6 mm × 125 mm) |
| Mobile phase: methanol: 2% acetic acid (75:25, v/v) | |
| Flow: 1 mL/min | |
| Run time: 7 min | |
| Wavelength: 280 nm | |
| Clobetasol proprionate | Column: LiChrospher® 100 RP-18. 5 µm (4.6 mm × 125 mm) |
| Mobile phase: methanol: 2% acetic acid (70:30, v/v) | |
| Flow: 0.35 mL/min | |
| Run time: 5.5 min | |
| Wavelength: 240 nm | |
| Hydrocortisone | Column: XBridgeTM C18 5 µm (2.1 × 150 mm) |
| Mobile phase: water and acetonitrile (75:25, v/v) | |
| Flow: 0.35 mL/min | |
| Run time: 8 min | |
| Wavelength: 247 nm | |
| Acyclovir | Column: XBridgeTM C18 5 µm (2.1 × 150 mm) |
| Mobile phase: water and methanol (95:5, v/v) | |
| Flow: 0.4 mL/min | |
| Run time: 6 min | |
| Wavelength: 247 nm |
Table 2.
Release media composition used for IVRT studies.
| Bifonazole | PBS/ethanol (50:50, v/v, pH = 7.4) |
| Clotrimazole | PBS/ethanol (50:50, v/v, pH = 7.4) |
| Tioconazole | PBS/ethanol (50:50, v/v, pH = 4.5) |
| Etofenamate | PBS/ethanol (70:30, v/v) |
| Diclofenac | PBS/ethanol (80:20, v/v, pH = 7.4) |
| Clobetasol | PBS/ethanol (50:50, v/v, pH = 7.4) |
| Hydrocortisone | Water/ethanol (70:30, v/v) |
| Acyclovir | PBS |
Table 3.
Concentrations used for calibration curve, quality control, and limits of detection (LOD) and limits of quantification (LOQ) standards.
Table 3.
Concentrations used for calibration curve, quality control, and limits of detection (LOD) and limits of quantification (LOQ) standards.
| Drug | Calibration Curve Standards (µg/mL) | Quality Control Standards (µg/mL) | LOQ and LOD Standards (µg/mL) |
|---|---|---|---|
| Bifonazole | 0.1, 0.5, 1, 2.5, 5, 10, 25, 50, 75, 100, and 150 | 0.25, 20, and 80 | The calibration curve standards were used |
| Clotrimazole | 0.05, 0.25, 0.5, 1, 5, 10, 25, 50, 75, and 100 | 0.1, 20, and 40 | 0.05, 0.25, 0.5,1, and 5 |
| Tioconazole | 0.1, 0.5, 1, 2.5, 10, 25, and 50 | 4, 8, and 16 | The calibration curve standards were used |
| Etofenamate | 10, 25, 50, 75, 100, and 200 | 20, 80, and 180 | 0.5, 1, 2, 2.5, 4, and 5 |
| Diclofenac | 10, 25, 75, 100, 150, and 200 | 20, 80, and 180 | 0.5, 1, 2, 2.5, 4, and 5 |
| Clobetasol | 0.1, 0.25, 0.5, 1, 2, 5, and 10 | 0.1, 1.5, and 4 | The calibration curve standards were used |
| Hydrocortisone | 2.5, 5, 10, 20, 25, and 50 | 3, 15, and 40 | 0.25, 0.5, 1, 2, and 2.5 |
| Acyclovir | 5, 10, 25, 50, 75, 100, 150, and 300 | 20, 80, and 200 | 0.25, 0.5, 1, 2, and 5 |
Table 4.
Retention times for standards (n = 45) and IVRT samples (n = 180).
| Standards | IVRT Samples | |
|---|---|---|
| Retention Time Mean (min) | ||
| BFZ | 3.947 ± 0.09 | 4.012 ± 0.06 |
| CLT | 4.315 ± 0.04 | 4.296 ± 0.02 |
| TCZ | 3.697 ± 0.11 | 4.064 ± 0.21 |
| ETF | 3.395 ± 0.02 | 3.390 ± 0.01 |
| DF | 4.166 ± 0.02 | 4.241 ± 0.01 |
| CLB | 4.241 ± 0.03 | 4.229 ± 0.04 |
| HC | 6.387 ± 0.02 | 6.438 ± 0.01 |
| ACV | 3.432 ± 0.07 | 3.506 ± 0.03 |
BFN: bifonazole, CLT: clotrimazole, TCN: tioconazole, ETF: etofenamate, DF: diclofenac, CLB: clobetasol, HC: hydrocortisone, ACV: acyclovir. Please note that tioconazole retention time fluctuations may be ascribed to the hydrophobic interactions established with the matrix’ (formulation) lipophilic components.
Table 5.
System suitability test parameters. System suitability was evaluated by injecting the same standard solution six times.
Table 5.
System suitability test parameters. System suitability was evaluated by injecting the same standard solution six times.
| Drug | Conc. | Retention Time (min) | Peak Area | T. Plates | K′ | T. Factor | Resolution | ||
|---|---|---|---|---|---|---|---|---|---|
| (µg/mL) | Mean | RSD | Mean | RSD | |||||
| BFZ | 50 | 3.973 | 0.09 | 9,135,580 | 0.08 | 1,898,400 | 3.057 | 1.684 | 2.09 |
| CLT | 50 | 4.262 | 0.07 | 8,701,986 | 0.13 | 1,721,502 | 2.393 | 1.634 | 4.10 |
| TCZ | 10 | 3.643 | 0.08 | 522,268 | 0.44 | 1,289,836 | 2.060 | 1.889 | 4.86 |
| ETF | 100 | 3.491 | 0.24 | 2,306,243 | 0.14 | 1,883,362.8 | 1.957 | 1.140 | 5.70 |
| DF | 100 | 4.202 | 0.05 | 2,188,617 | 0.42 | 1,598,293 | 2.628 | 1.177 | 5.67 |
| CLB | 2 | 4.230 | 0.19 | 96,246 | 1.12 | 1,368,004 | 1.812 | 1.703 | 7.50 |
| HC | 25 | 6.378 | 0.06 | 1,779,896 | 0.05 | 2,689,997 | 4.446 | 1.456 | 15.77 |
| ACV | 100 | 3.350 | 0.23 | 8,187,120 | 0.57 | 1,362,134 | 1.795 | 1.583 | 3.60 |
| Acceptance criteria | - | ≤2.0% | - | ≤2.0% | >1000 | >1000 | ≤2.0 | >2.0 | |
BFN: bifonazole, CLT: clotrimazole, TCN: tioconazole, ETF: etofenamate, DF: diclofenac, CLB: clobetasol, HC: hydrocortisone, ACV: acyclovir, Conc: concentration, T. Plates: theoretical plates, K′: capacity factor, T. Factor: tailing factor.
Table 6.
LOD and LOQ values.
| Drugs | LOD (ng/mL) | LOQ (ng/mL) |
|---|---|---|
| BFZ | 1.46 | 4.43 |
| CLT | 0.35 | 1.06 |
| TCZ | 14.05 | 42.59 |
| ETF | 0.44 | 1.33 |
| DF | 0.88 | 0.29 |
| CLB | 2.52 | 7.63 |
| HC | 0.05 | 0.15 |
| ACV | 0.04 | 0.12 |
BFN: bifonazole, CLT: clotrimazole, TCN: tioconazole, ETF: etofenamate, DF: diclofenac, CLB: clobetasol, HC: hydrocortisone, ACV: acyclovir.
Table 7.
Results obtained from the regression analysis using the least squares method for all studied drugs. Results are expressed as mean ± standard deviation (SD), n = 4. Please note that a weighted linear regression was performed on calibration data using 1/x2 as the weighting factor.
Table 7.
Results obtained from the regression analysis using the least squares method for all studied drugs. Results are expressed as mean ± standard deviation (SD), n = 4. Please note that a weighted linear regression was performed on calibration data using 1/x2 as the weighting factor.
| Drug | Mean R2 | Mean Slope | Mean Intercept |
|---|---|---|---|
| BFZ | 0.9984 ± 0.0007 | 71,972,704 ± 846,636 | 12,227,244 ± 6,063,944 |
| CLT | 0.9994 ± 0.0002 | 175,242 ± 5754 | 1659 ± 749 |
| TCZ | 0.9987 ± 0.0003 | 61,944 ± 2704 | 3271 ± 231 |
| ETF | 0.9988 ± 0.0008 | 23,376 ± 1055 | 56,591 ± 31,185 |
| DF | 0.9994 ± 0.0003 | 21,958 ± 106 | 10,595 ± 14,365 |
| CLB | 0.9970 ± 0.0008 | 52,833 ± 1014 | 1160 ± 429 |
| HC | 0.9999 ± 0.0001 | 72,492 ± 772 | −2643 ± 834 |
| ACV | 0.9996 ± 0.0001 | 73,690 ± 2119 | 10,926 ± 8039 |
BFN: bifonazole, CLT: clotrimazole, TCN: tioconazole, ETF: etofenamate, DF: diclofenac, CLB: clobetasol, HC: hydrocortisone, ACV: acyclovir.
Table 8.
Intraday and interday accuracy and precision results for all drugs. Results are expressed as mean ± SD (n = 5).
Table 8.
Intraday and interday accuracy and precision results for all drugs. Results are expressed as mean ± SD (n = 5).
| Intraday (n = 5) | Interday (n = 15) | ||||||
|---|---|---|---|---|---|---|---|
| Drug | Concentration CQ (µg/mL) | Measured Concentration (µg/mL) | Accuracy (%) | RSD (%) | Measured Concentration (µg/mL) | Accuracy (%) | RSD (%) |
| BFZ | 0.25 | 0.26 ± 0.02 | −5.41 | 7.97 | 0.26 ± 0.03 | −4.92 | 11.52 |
| 20 | 20.2 ± 0.4 | −1.22 | 1.93 | 20.2 ± 0.5 | −1.23 | 2.72 | |
| 80 | 82.5 ± 1.5 | −3.13 | 1.77 | 82.6 ± 2.9 | −3.33 | 3.52 | |
| CLT | 0.1 | 0.11 ± 0.01 | −3.25 | 12.28 | 0.11 ± 0.01 | −3.25 | 12.91 |
| 20 | 19.4 ± 0.4 | 9.07 | 1.86 | 19.5 ± 0.8 | 9.07 | 4.08 | |
| 40 | 38.9 ± 1.2 | 3.03 | 2.97 | 38.6 ± 2.8 | 3.56 | 7.37 | |
| TCZ | 4 | 3.82 ± 0.13 | 4.51 | 3.42 | 3.8 ± 0.29 | 5.06 | 7.76 |
| 8 | 7.68 ± 0.14 | 3.96 | 1.94 | 7.67 ± 0.30 | 4.19 | 3.94 | |
| 16 | 16.4 ± 0.4 | −2.30 | 2.42 | 16.4 ± 0.6 | −2.30 | 3.76 | |
| ETF | 20 | 20.9 ± 0.9 | −0.05 | 4.62 | 20.6 ± 2.1 | −0.03 | 10.27 |
| 80 | 79.2 ± 1.9 | 0.01 | 2.47 | 79.2 ± 2.6 | 0.01 | 3.49 | |
| 180 | 175 ± 3 | 0.03 | 2.11 | 175 ± 7 | −1.19 | 4.08 | |
| DF | 20 | 20.1 ± 0.3 | −0.01 | 1.52 | 20.1 ± 0.5 | −0.01 | 2.52 |
| 80 | 83.31 ± 0.99 | −0.04 | 1.17 | 83.3 ± 0.5 | −0.04 | 3.95 | |
| 180 | 181 ± 3 | −0.01 | 1.92 | 181 ± 4 | −1.26 | 2.41 | |
| CLB | 0.4 | 0.38 ± 0.02 | 3.75 | 7.22 | 0.39 ± 0.05 | 3.36 | 13.04 |
| 1.5 | 1.38 ± 0.09 | 7.69 | 7.01 | 1.38 ± 0.15 | 8.30 | 10.71 | |
| 4 | 3.75 ± 0.16 | 6.21 | 4.39 | 3.75 ± 0.27 | 6.31 | 7.11 | |
| HC | 3 | 3.18 ± 0.04 | −6.11 | 1.23 | 3.16 ± 0.17 | −5.23 | 5.53 |
| 15 | 15.11 ± 0.2 | −0.72 | 1.48 | 15.1 ± 0.3 | −0.67 | 2.04 | |
| 40 | 40.2 ± 0.2 | −0.61 | 0.54 | 40.2 ± 0.5 | −0.55 | 1.18 | |
| ACV | 20 | 20.7 ± 0.9 | −3.48 | 4.47 | 20.6 ± 1.3 | −2.84 | 6.27 |
| 80 | 80.2 ± 0.9 | −0.28 | 1.19 | 80.2 ± 1.4 | −0.22 | 1.80 | |
| 200 | 203 ± 1 | −1.72 | 0.56 | 204 ± 7 | −1.87 | 3.61 | |
BFN: bifonazole, CLT: clotrimazole, TCN: tioconazole, ETF: etofenamate, DF: diclofenac, CLB: clobetasol, HC: hydrocortisone, ACV: acyclovir.
Table 9.
HPLC method robustness. Results are expressed as mean ± SD (n = 4).
| Drug | Concentration CQ (µg/mL) | Mean Concentration (µg/mL) | Accuracy (%) | RSD (%) |
|---|---|---|---|---|
| BFZ | 0.25 | 0.26 ± 0.02 | 6.29 | 9.15 |
| 20 | 18.4 ± 0.8 | −8.05 | 4.44 | |
| 80 | 81.2 ± 0.5 | 1.49 | 0.59 | |
| CLT | 0.1 | 0.11 ± 0.01 | 9.03 | 9.85 |
| 20 | 17.5 ± 0.7 | −12.46 | 3.92 | |
| 40 | 35.6 ± 0.3 | −10.87 | 0.72 | |
| TCZ | 4 | 3.99 ± 0.07 | 0.13 | 1.71 |
| 8 | 7.56 ± 0.28 | 5.47 | 3.76 | |
| 16 | 16.0 ± 0.7 | −0.08 | 4.12 | |
| ETF | 20 | 22.9 ± 0.5 | 13.77 | 2.37 |
| 80 | 79 ± 1.4 | −0.93 | 1.75 | |
| 180 | 171 ± 0 | −4.95 | 0.24 | |
| DF | 20 | 21.0 ± 0.3 | 4.84 | 1.36 |
| 80 | 85.3 ± 1.0 | 6.62 | 1.21 | |
| 180 | 197 ± 10 | 9.18 | 5.05 | |
| CLB | 0.4 | 0.41 ± 0.05 | 3.59 | 11.75 |
| 1.5 | 1.37 ± 0.04 | −8.75 | 3.09 | |
| 4 | 3.61 ± 0.04 | −9.83 | 1.17 | |
| HC | 3 | 3.44 ± 0.06 | 14.67 | 1.86 |
| 15 | 15.2 ± 0.3 | 2.18 | 2.16 | |
| 40 | 40.1 ± 0.2 | 0.70 | 0.17 | |
| ACV | 5 | 4.59 ± 0.02 | −8.17 | 0.63 |
| 100 | 95.9 ± 0.1 | −4.02 | 0.08 | |
| 200 | 206 ± 0 | 2.94 | 0.12 |
BFN: bifonazole, CLT: clotrimazole, TCN: tioconazole, ETF: etofenamate, DF: diclofenac, CLB: clobetasol, HC: hydrocortisone, ACV: acyclovir.
Table 10.
Autosampler and short-term stability of quality control (QC). Results are expressed as mean ± SD (n = 5).
Table 10.
Autosampler and short-term stability of quality control (QC). Results are expressed as mean ± SD (n = 5).
| AUTOSAMPLER | SHORT TERM STABILITY | ||||||
|---|---|---|---|---|---|---|---|
| Drugs | Concentration CQ (µg/mL) | Mean Concentration (µg/mL) | Accuracy (%) | RSD (%) | Mean Concentration (µg/mL) | Accuracy (%) | RSD (%) |
| BFZ | 0.25 | 0.23 ± 0.01 | −8.43 | 6.29 | 0.29 ± 0.01 | 15.96 | 3.94 |
| 20 | 19.9 ± 0.3 | −0.29 | 1.64 | 20.7 ± 0.4 | 3.17 | 2.07 | |
| 80 | 84.2 ± 0.8 | 5.22 | 0.94 | 85.5 ± 0.8 | 6.83 | 0.96 | |
| CLT | 0.1 | 0.11 ± 0.01 | 7.67 | 5.37 | 0.10 ± 0.01 | −0.41 | 13.45 |
| 20 | 19.5 ± 0.2 | −2.68 | 0.94 | 20.2 ± 0.8 | 1.14 | 4.08 | |
| 40 | 38.7 ± 0.6 | −3.30 | 1.44 | 40.5 ± 3.3 | 1.26 | 8.10 | |
| TCZ | 4 | 3.41 ± 0.15 | −14.81 | 4.50 | 3.49 ± 0.18 | −12.73 | 5.19 |
| 8 | 7.76 ± 0.63 | −2.94 | 8.12 | 7.41 ± 0.35 | −7.33 | 4.75 | |
| 16 | 16.3 ± 0.3 | 1.72 | 1.57 | 17.4 ± 1.2 | 8.98 | 6.72 | |
| ETF | 20 | 21.9 ± 0.7 | −0.09 | 3.06 | 20.2 ± 0.1 | 1.03 | 0.75 |
| 80 | 92.8 ± 3.0 | −0.16 | 3.28 | 78.8 ± 1.7 | −1.54 | 2.20 | |
| 180 | 198 ± 5 | −0.10 | 2.66 | 178 ± 1 | −0.87 | 0.35 | |
| DF | 20 | 20.4 ± 0.6 | 2.01 | 3.00 | 20.0 ± 0.1 | 0.04 | 0.67 |
| 80 | 84.4 ± 2.7 | 5.50 | 3.20 | 82.3 ± 0.6 | 2.82 | 0.69 | |
| 180 | 180 ± 5 | −0.15 | 2.60 | 184 ± 0.0 | 2.05 | 0.20 | |
| CLB | 0.4 | 0.34 ± 0.01 | −14.13 | 2.70 | 0.33 ± 0.02 | −16.24 | 6.19 |
| 1.5 | 1.35 ± 0.03 | −10.01 | 2.02 | 1.41 ± 0.06 | −5.94 | 3.99 | |
| 4 | 3.72 ± 0.08 | −7.06 | 2.18 | 3.91 ± 0.21 | −2.24 | 5.43 | |
| HC | 3 | 3.06 ± 0.05 | 1.96 | 1.77 | 3.40 ± 0.05 | 13.36 | 1.66 |
| 15 | 15.1 ± 0.5 | 0.82 | 3.25 | 15.2 ± 0.3 | 1.24 | 2.04 | |
| 40 | 39.9 ± 0.3 | −0.31 | 0.79 | 40.1 ± 0.7 | 0.21 | 0.27 | |
| ACV | 20 | 21.8 ± 1.7 | 8.80 | 7.83 | 22.7 ± 0.3 | 13.50 | 1.42 |
| 80 | 87.6 ± 0.5 | 9.55 | 0.57 | 85.3 ± 0.8 | 6.59 | 0.93 | |
| 200 | 215 ± 0.0 | 7.78 | 0.14 | 209 ± 2 | 4.27 | 0.77 | |
BFN: bifonazole, CLT: clotrimazole, TCN: tioconazole, ETF: etofenamate, DF: diclofenac, CLB: clobetasol, HC: hydrocortisone, ACV: acyclovir.
Table 11.
In silico prediction of several physicochemical descriptors obtained from the molecule structure using Chemaxon software.
Table 11.
In silico prediction of several physicochemical descriptors obtained from the molecule structure using Chemaxon software.
| API | MW | Log P | S (mg/mL) | pKa | H donors | H Acceptors | Lipinski Rule | Log D | Solubility and pH (mg/mL) | ||||
|---|---|---|---|---|---|---|---|---|---|---|---|---|---|
| 4.6 | 6.5 | 7.4 | 4.6 | 6.5 | 7.4 | ||||||||
| CLT | 344.84 | 5.84 | 0.000703 | 6.26 | 0 | 1 | X | 5.3 | 5.7 | 5.8 | 0.03 | 0 | 0 |
| BFZ | 310.40 | 5.23 | 0.000791 | 6.36 | 0 | 1 | X | 4.7 | 5.07 | 5.2 | 0.05 | 0 | 0 |
| TCZ | 387.70 | 5.30 | 0.000552 | 6.48 | 0 | 2 | X | 4.72 | 5.1 | 5.3 | 4.6 | 0 | 0 |
| ETF | 369.34 | 4.86 | 0.0187 | 15.12 | 2 | 4 | C | 4.9 | 4.9 | 4.9 | 0.02 | 0.02 | 0.02 |
| DF | 296.15 | 4.26 | 0.0149 | 4.00 | 2 | 3 | C | 3.6 | 1.8 | 1.1 | 0.07 | 4.8 | 37.9 |
| CLB | 466.97 | 4.18 | 0.0017 | 13.59 | 1 | 4 | C | 4.2 | 4.2 | 4.2 | 0 | 0 | 0 |
| HC | 362.47 | 1.28 | 0.408 | 12.59 | 3 | 5 | C | 1.3 | 1.3 | 1.3 | 0.4 | 0.4 | 0.4 |
| ACV | 225.21 | −1.03 | 9.1 | 11.98 | 3 | 7 | C | −1.04 | −1.03 | −1.03 | 9.3 | 9.1 | 9.1 |
BFN: bifonazole, CLT: clotrimazole, TCN: tioconazole, ETF: etofenamate, DF: diclofenac, CLB: clobetasol, HC: hydrocortisone, ACV: acyclovir, S: intrinsic solubility (water at 25 °C), C: compliant, NC: non-compliant, MW: molecular weight.
© 2020 by the authors. Licensee MDPI, Basel, Switzerland. This article is an open access article distributed under the terms and conditions of the Creative Commons Attribution (CC BY) license (http://creativecommons.org/licenses/by/4.0/).
Share and Cite
MDPI and ACS Style
Miranda, M.; Cardoso, C.; Vitorino, C. Fast Screening Methods for the Analysis of Topical Drug Products. Processes 2020, 8, 397. https://0-doi-org.brum.beds.ac.uk/10.3390/pr8040397
AMA Style
Miranda M, Cardoso C, Vitorino C. Fast Screening Methods for the Analysis of Topical Drug Products. Processes. 2020; 8(4):397. https://0-doi-org.brum.beds.ac.uk/10.3390/pr8040397
Chicago/Turabian StyleMiranda, Margarida, Catarina Cardoso, and Carla Vitorino. 2020. "Fast Screening Methods for the Analysis of Topical Drug Products" Processes 8, no. 4: 397. https://0-doi-org.brum.beds.ac.uk/10.3390/pr8040397
Note that from the first issue of 2016, this journal uses article numbers instead of page numbers. See further details here.