Article

Comparative Study of Angiotensin I-Converting Enzyme (ACE) Inhibition of Soy Foods as Affected by Processing Methods and Protein Isolation

1
Minas Gerais State University, R. Ver. Geraldo Moisés da Silva, 308-434—Universitário, Ituiutaba 38302-182, MG, Brazil
2
Coastal Research and Extension, Mississippi State University, Starkville, MS 39762, USA
3
Department of Nutrition, University of Texas at San Antonio, San Antonia, TX 78023, USA
4
College of Science, Northeast Agricultural University, Harbin 150030, China
5
Departamento de Ciência e Tecnologia de Alimentos, Universidade Estadual de Londrina, Londrina 86057-970, PR, Brazil
6
Coastal Research and Extension Center, Department of Food Science Nutrition and Health Promotion, Mississippi State University, Starkville, MS 39762, USA
*
Author to whom correspondence should be addressed.
Submission received: 14 July 2020 / Revised: 3 August 2020 / Accepted: 7 August 2020 / Published: 12 August 2020

Abstract

:
Angiotensin converting enzyme (ACE) converts angiotensin I into the vasoconstrictor angiotensin II and eventually elevates blood pressure. High blood pressure is a major risk factor for heart disease and stroke. Studies show peptides present anti-hypertensive activity by ACE inhibition. During food processing and digestion, food proteins may be hydrolyzed and release peptides. Our objective was to determine and compare the ACE inhibitory potential of fermented and non-fermented soy foods and isolated 7S and 11S protein fractions. Soy foods (e.g., soybean, natto, tempeh, yogurt, soymilk, tofu, soy-sprouts) and isolated proteins were in vitro digested prior to the determination of ACE inhibitory activity. Peptide molecular weight distribution in digested samples was analyzed and correlated with ACE inhibitory capacity. Raw and cooked soymilk showed the highest ACE inhibitory potential. Bacteria-fermented soy foods had higher ACE inhibitory activity than fungus-fermented soy food, and 3 day germinated sprouts had higher ACE inhibition than those germinated for 5 and 7 days. The 11S hydrolysates showed higher ACE inhibitory capacity than 7S. Peptides of 1–4.5 kDa showed a higher contribution to reducing IC50. This study provides evidence that soy foods and isolated 7S and 11S proteins may be used as functional foods or ingredients to prevent or control hypertension.

1. Introduction

High blood pressure is a major risk factor for heart attacks and strokes [1]. Angiotensin converting enzyme (ACE) (peptidyl-dipeptidase, E.C. 3.4.15.1) plays a vital role in the regulation of blood pressure in the renin–angiotensin system. Inhibition of ACE is the dominant therapeutic approach to treat high blood pressure, since angiotensin II generation is inhibited and bradykinin is preserved. In this context, research is being developed in order to study the potential food-derived ACE inhibitors [2].
Soybean (Glycine max (L.) Merrill) is rich in proteins, and 11S and 7S proteins are two major proteins representing more than 70% of the total proteins [3] with the rest being lipoxygenases, trypsin inhibitors, lectins, lunasin, and other minor proteins. Soy isolates are composed mostly of 11S and 7S proteins and are used as protein ingredients in many processed food products. Peptides from soybean have been identified and characterized for their potential ACE inhibition [4,5]. Inhibitory peptides of ACE have been reported to exist in soy protein hydrolysates [6,7], fermented soy foods, such as soybean paste [8], tempeh and natto [6], and in non-fermented soy foods such as soybean-based infant formulas and soymilk [4,9,10].
Peptides and phenolic compounds released during food processing or in vitro digestion usually show a multifunctional nature including antioxidant, immunomodulatory, antimicrobial, antithrombotic, hypocholesterolemic, and anti-hypertensive potential [11]. However, foods must be digested before absorption can occur. Therefore, it is meaningful to conduct simulated in vitro digestion prior to the assay for ACE inhibition.
Many food processing technologies, employing various physical, chemical, enzymatic, biological, and engineering principles or a combination of these are used in making various fermented (natto, tempeh, and soy yogurt) and non-fermented soy foods or protein ingredients (soy isolates, protein hydrolysates, soymilk, tofu, and soy sprouts). The processing technologies have a major influence on the peptides and phenolic contents and compositions in the products.
In addition to the variability of processing methods, there are hundreds of soybean varieties with different protein and phenolic compositions. Therefore, due to the differences in raw materials, food processing methods and storage conditions, the ability of ACE inhibition of soy products reported in the literature is very difficult to compare, since the reported studies used different materials and methods. To attempt to understand how food processing and storage methods affect ACE inhibition of the products, the same soybean variety must be used. Thus far, a systematic study to compare the ACE inhibition of various commonly consumed soy products using one soybean variety is lacking.
Therefore, the objectives of this study were: (i) to investigate the ACE inhibitory activity of in vitro digested soy foods, such as soymilk, tofu, sprout, natto, tempeh and soy yogurt, made from the same soybean variety; (ii) to evaluate the effect of hydrolysis of 7S and 11S protein fractions on ACE inhibitory capacity; and (iii) to determine the correlation between ACE inhibitory capacity and peptide molecular size.

2. Materials and Methods

2.1. Soybean Material and Chemicals

The soybean cultivar Prosoy, harvested in 2012, was obtained from Sinner Brothers and Bresnahan Co. grown in Casselton, ND, USA. Raw soybean (RSoy) was stored in a cool and dry air-conditioned room (5 °C) prior to use.
Pepsin from porcine gastric mucosa, pancreatin from porcine pancreas, trypsin from porcine pancreas, α-chymotrypsin from bovine pancreas, captopril, hippuric acid (HA), ACE, N-α-hippuryl-L-histidyl-L-leucine (HHL), HPLC-grade trifluoroacetic acid (TFA) were purchased from Sigma–Aldrich (St. Louis, MO, USA).

2.2. Preparation of Soy Foods

2.2.1. Soymilk

Raw traditional soymilk (RTSoyM), cooked traditional soymilk (CTSoyM), raw cooked soymilk slurry (RSoyMS), and cooked soymilk slurry (CSoyMSF) were prepared. RTSoyM was prepared according to Zhang et al. [12]. For CSoyMSF, the soy slurry was subjected to the same cooking method as that used for soymilk (obtained by filtration first), followed by filtration through muslin cloth to separate the okara from the soymilk. Both types of soymilk (filtered the slurry then cooked, and cooked the slurry then filtered) were cooled in an ice bath, freeze-dried, and stored at −20 °C before analysis.

2.2.2. Tofu

Pressed tofu (PT) and filled tofu (FT) were prepared according to Meng et al. [13]. Both PT and FT were freeze-dried and stored at −20 °C before analysis.

2.2.3. Natto

Natto was prepared as reported by our previous study [14]. Bacillus natto culture was prepared from a commercial natto purchased from an Asian grocery store in Starkville, MS, USA. Natto (N) samples were stored at 4 °C for 2 (Nd2), 4 (Nd4), and 6 days (Nd6), then freeze-dried and stored at −20 °C before analysis.

2.2.4. Tempeh

Tempeh was prepared using starter culture, Rhizopus oryzae obtained from the Cultures for Health (Morrisville, NC, USA). Manufacturer’s recommended protocol was followed with minor modifications. Soybeans were soaked in water at 30 °C until pH reached 6.5, and were then washed, steamed for 15 min and dried on a mesh screen with an electric fan to evaporate the water of the beans. Soybeans were inoculated with the culture and packaged in zip lock bags with tiny holes that were manually poked with toothpicks. The sample was incubated at 31 °C for 48 h. Tempeh (T) samples were kept at 4 °C for 2 (Td2), 4 (Td4), and 6 days (Td6) before freeze-drying and then stored at −20 °C before analysis.

2.2.5. Soy Yogurt

Soy yogurt was made as follows: To make soymilk, the bean-to-water ratio used was 1:7 (w/w). Soymilk was sterilized at 121 °C for 5 min in glass bottles. When soymilk reached 40 °C, aseptic inoculation was conducted according to the manufacturer’s recommended rate with a yogurt culture (YC−087; Chr. Hansen Laboratory, Inc., Milwaukee, WI, USA) that contained strains of Streptococcus thermophilus and L. delbrueckii ssp. bulgaricus. The inoculated soymilk was poured into 500 mL sterile transparent plastic cups with lids (300 mL per cup) and incubated at 40 °C until the pH decreased to between 4.2 and 4.5. The soy yogurt (Y) samples were stored at 4 °C for 0 (Yd0), 2(Yd2), 6 (Yd6), and 8 days (Yd8) before freeze-drying and then stored at −20 °C before analysis.

2.2.6. Soybean Sprout

Soybean sprouts were prepared as reported by Kumari and Chang [15] using Freshlife Automatic Sprouter (Tribest Corporation, Cerritos, CA, USA). Raw sprouts (RS) germinated for 1, 2, 3, 5, and 7 days were designated as RSd1, RSd2, RSd3, RSd5, and RSd7, respectively. Meanwhile, a portion of each type of sprout was cooked using common household cooking practice according to Kumari and Chang [15]. The cooked sprouts (CS) were named as CSd1, CSd2, CSd3, CSd5, and CSd7, respectively. All sprouts were freeze-dried for further analysis.

2.3. Simulated In Vitro Digestion of Soy Foods

The freeze-dried soy foods were subjected to simulated in vitro gastrointestinal digestion using pepsin and pancreatin in sequence (done in duplicate). Freeze-dried soy foods (3 g) were put in a 50 mL conical flask containing 30 mL of distilled water and mixed for 30 s. For each sample, 0.3 mL of pepsin (10,000 units/mL) was added, mixed, and the pH was adjusted to 2.0 using 5 N HCl, before the flasks were incubated at 37 °C in a shaking water bath (220 rpm) for 2 h. The pH of the pepsin digests was adjusted to 8.0 using 5 N NaOH and 3 mL of pancreatin (40 mg/mL) was added to each flask. The pH was adjusted again to 8.0 using 5 N NaOH. Incubation was continued for 2 h. The digested sample was held in the boiling water for 15 min to inactivate the digestive enzymes, and then it was cooled and centrifuged (3000× g, 15 min). The digested sample was filtered, freeze-dried and stored at −20 °C until use. The freeze-dried digested samples were suspended in water and adjusted to 0.25 mg/mL (on dried basis) for ACE inhibitory activity.

2.4. Characterization of Digested Soy Foods

From the results of ACE inhibitory activity of all soy foods subjected to simulated in vitro digestion, the digested soy foods for each type of processing methods that gave a higher percentage of ACE inhibition were selected to represent that category of processing methods for further characterizations of ACE inhibitory capacity (IC50 = concentration of extracts required to inhibit 50% of the enzyme activity), soluble proteins, and peptide molecular weight (MW) distribution.

2.5. Preparation and Hydrolysis of 7S and 11S Fractions

To study the ACE inhibition effect of the major storage proteins, 7S and 11S fractions were isolated from low-temperature defatted soybean meal according to the method of Liu et al. [16] and were freeze-dried and stored at −20 °C. Before hydrolysis, to remove the effect of residual phenolic compounds in the soy proteins, the freeze-dried 7S and 11S fractions were suspended into 80% acetone, shaken overnight at 25 °C and centrifuged at 15,000× g for 30 min. The precipitates were dried in an oven at 40 °C for 48 h.
To study the relationships of the peptides produced after each digestive protease, and their resultant ACE inhibition potency, duplicated experiments were carried out in five steps with steps B, C, and D to study the stepwise effect of pepsin, trypsin, and α-chymotrypsin sequentially, and step E to study the combined effect of the two pancreatic proteases (trypsin and α-chymotrypsin) following pepsin digestion: (A) 7S and 11S fractions were suspended in deionized water (10 g into 100 mL); (B) the pH value was adjusted to 2 with 5 N HCl, 1 mL of pepsin (10,000 units/mL) was added, and the suspension was incubated at 37 °C in a shaking water bath (220 rpm) for 2 h; (C) the pH was adjusted to 8 using 5 N NaOH, 0.7 mL of trypsin (520,000–800,000 units/mL) was added, and incubation was continued for 2 h; (D) the pH was adjusted to 8 using 5 N NaOH, 0.4 mL of α-chymotrypsin (1600 units/mL) was added, and incubation was continued for additional 2 h; and (E) 7S and 11S fractions were suspended in deionized water (3 g into 30 mL in a flask), the pH value was adjusted to 2.0 with 5 N HCl, 0.3 mL of pepsin (10,000 units/mL) was added, and the flasks incubated at 37 °C in a shaking water bath (220 rpm) for 2 h; then the pH was adjusted to 8 using 5 N NaOH, 0.3 mL of trypsin (520,000–800,000 units/mL) and 0.3 mL of α-chymotrypsin (1600 units/mL) were added, and incubation was continued for 2 h. Aliquots of 30 mL were collected from the reaction mixtures after the completion of (B), (C), (D), and (E) steps, respectively. The collected mixtures were heated at 100 °C for 10 min to inactivate enzymes, and were labeled as follows: A—no hydrolyzed; B—hydrolyzed by pepsin for 2 h; C—hydrolyzed by pepsin for 2 h + trypsin for 2 h; D—hydrolyzed by pepsin for 2 h + trypsin for 2 h + α-chymotrypsin for 2 h; and E—hydrolyzed by pepsin for 2 h + (trypsin and α-chymotrypsin) for 2 h. The hydrolysates were cooled, freeze-dried and stored at −20 °C until use. These hydrolysates were suspended in water (10 mg/mL, on dried basis) for measuring ACE inhibitory capacity (IC50) and peptide MW distribution.

2.6. Determination of Angiotensin Converting Enzyme (ACE) Inhibitory Activity

In vitro ACE inhibitory activity was measured according to Cushman and Cheung [17] with modifications. N-α-hippuryl-L-histidyl-L-leucine (HHL) and ACE were dissolved in 100 mM borate buffer (pH = 8.3, 300 mM NaCl), at concentrations of 2.5 mM and 10 mU/mL, respectively. The reaction mixture containing 75 µL HHL, 35 µL sample, and 75 µL ACE was incubated at 37 °C in a shaking water bath (200 rpm) for 30 min. The reaction was stopped by heating at 85 °C for 15 min and 185 µL of water was added before injecting into the ultra-high-performance liquid chromatography (UHPLC) sample loop. The UHPLC analyses were performed to quantify the hippuric acid (HA) produced by the enzymatic hydrolysis of the HHL using a Thermo Scientific Dionex UltiMate 3000 RSLC UHPLC focused System (Thermo Scientific Dionex, Fürstenfeldbruck, Germany). Data acquisition was performed with Chromeleon 7 software. Separations were accomplished on a Waters UPLC column (CORTECS® UPLC®, C18 1.6 μm, 2.1 × 50 mm) and column temperature was maintained at 37 °C. The analytical procedure for quantification of HA by UHPLC was previously validated. The injection volume was 100 μL and the detection wavelength was set at 228 nm. The mobile phase consisted of a gradient of 0.1% TFA in water (A) and 0.1% TFA in acetonitrile (B). The flow rate was set at 0.176 mL/min, and the gradient profile was as follows: t0–0.96 min: linear gradient from 5% to 30% of B, and 95% to 70% of A; t0.96–1.60 min: linear gradient from 30% to 60% of B, and 70% to 40% of A; t1.60–1.90 min: curve 7 gradient from 60% to 70% of B, and 40% to 30% of A; t1.90–2.2 0 min: isocratic elution with 70% of B, and 30% of A; t2.20–2.60 min: linear gradient from 70% to 5% of B, and 30% to 95% of A; total time of 4 min. The HA control contained water instead of sample solution, and the blank sample contained buffer instead of ACE solution. The ACE inhibitory activity was calculated according to the following equation:
ACE inhibitory activity (%) = ((A − B)/(A)) × 100,
where A is HA from control containing water instead of sample solution and B is HA from sample reaction with the subtraction of sample blank. The concentration to inhibit ACE by 50 % (IC50) (mg/mL on dried basis) was calculated using GraphPad Prism software.

2.7. Determination of Peptide Molecular Weight Distribution

Molecular Weight Distribution of peptides from digested samples was analyzed by size exclusion chromatography [18] with modifications. Each sample was dissolved in water, at a concentration of 10 mg/mL (on dried basis) for 7 S and 11S hydrolysates, and 8.6 mg/mL (on dried basis) for digested soy foods. A 40 µL aliquot was injected onto the Superdex™ peptide 10/300 GL column (GE Healthcare, Piscataway, NJ, USA) coupled with an Agilent Technologies Chromatography 1200 series system (Agilent Technologies, Santa Clara, CA, USA), and eluted with 30% acetonitrile at a flow rate of 0.380 mL/min. The eluate was monitored at 214 nm. A calibration curve of MW was obtained with the following standards: cytochrome C (12,384 Da), aprotinin (6500 Da), vitamin B12 (1855 Da), and L-reduced glutathione (307 Da).

2.8. Determination of Soluble Proteins

Soluble proteins were measured by bicinchoninic acid (BCA) method [19] and expressed as micrograms/milligram of sample (µg/mg) on dried basis with bovine serum albumin (BSA) as a standard.

2.9. Statistical Analysis

The soy food preparation, in vitro gastrointestinal digestion and analyses were carried out in duplicate, duplicate and triplicate, respectively. One-way analysis of variance (ANOVA) tests followed by Tukey’s multiple comparisons test (α = 0.05) was carried out using the software program Statistic 10 (StatSoft, Tulsa, OK, USA). Differences among sample groups were visualized by principal component analysis (PCA).

3. Results and Discussion

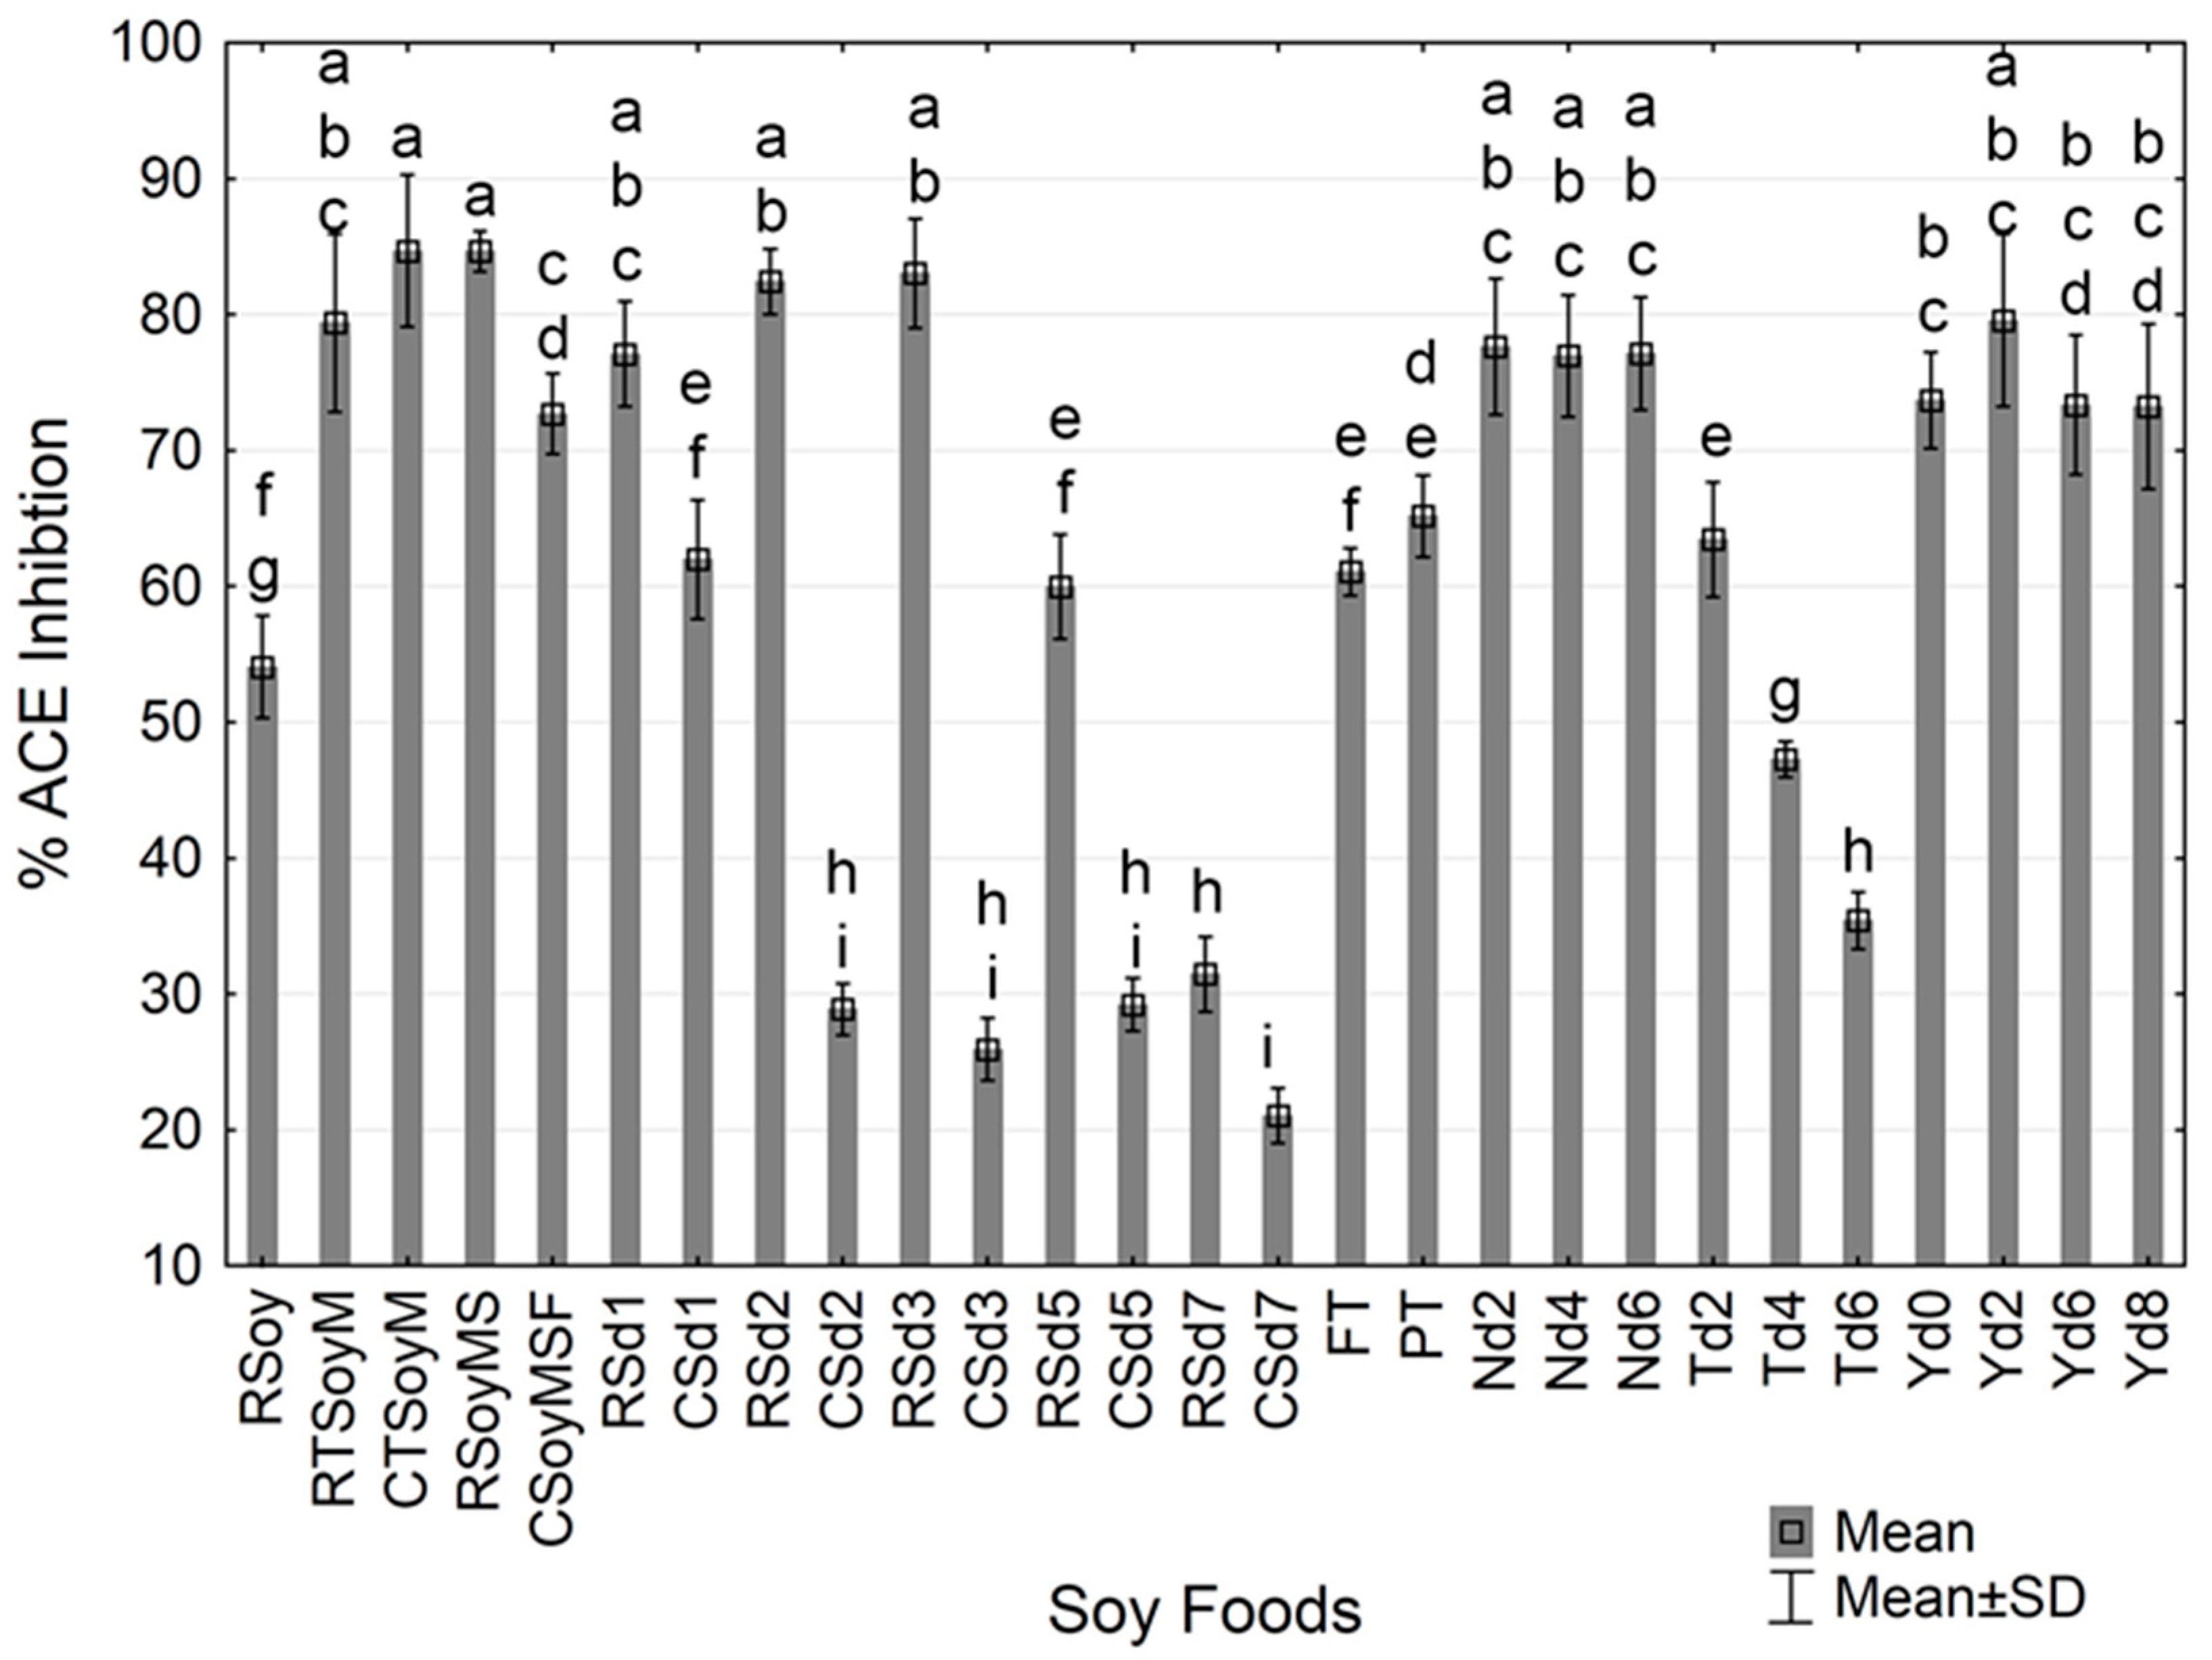
3.1. Angiotensin Converting Enzyme (ACE) Inhibitory Activity of Digested Fermented and Non-Fermented Soy Foods

The processing methods employed to manufacture soy foods, such as cooking, grinding, soaking, coagulation, germination, dilution, and fermentation, influenced the ACE inhibitory activity of the digested soy foods (Figure 1). Soymilk, tofu, and raw sprout germinated for 1, 2, and 3 days, and most fermented soy foods (all natto and yogurt products and Tempeh 2 day) had increased in % ACE inhibition as compared to raw soybean (RSoy). However, raw sprout germinated for 7 days (RSd7), cooked sprouts and tempeh stored for 6 days had lower % ACE inhibition than RSoy. The influence of the thermal treatment on ACE inhibitory activity was dependent upon the type of soy food as observed in the raw and cooked traditional soymilk (RTSoyM and CTSoyM), whose ACE inhibition percentage did not distinguish from each other. While the CSoyMSF (soymilk from filtered cooked slurry) showed a 14% reduction in the ACE inhibitory activity as compared to RSoyMS (raw soymilk slurry). The greatest impact of heat treatment on ACE inhibitory activity of sprouts was observed in the cooked sprout germinated for 3 days (CSd3), which showed a 69% reduction in comparison with its correspondent raw sprout (RSd3).
The thermal treatments applied in the preparation of the different soy foods, possibly, altered the protein structure in different ways, affecting the enzyme activity or hydrolysis sites on the peptide chains during in vitro digestion. Consequently, different peptides may be formed [20].
Germination time also significantly affected the ACE inhibition percentage of the sprouts with a 1.5 fold increase after 24 h of germination. The ACE inhibition remained constant through the third day and then decreased until the seventh day which showed about 42% smaller inhibition than RSoy. The increase in the % ACE inhibition followed by reduction could be attributed to the excessive hydrolysis of the proteins or to the breakdown of the complex phenolic compounds caused by long germination time followed by in vitro digestion. According to Zakharov et al. [21], at the beginning of germination, the proteins started to become hydrolyzed by endopeptidases to oligopeptides, and then were hydrolyzed by exopeptidases to free amino acids which could be used to synthesize new proteins and tissues. Yang and Li [22] found by sodium dodecyl sulfate polyacrylamide gel electrophoresis (SDS-PAGE) that α′ and α subunits of β-conglycinin (7S) and the acidic chains of glycinin (11S) were gradually degraded with germination time right after the soybean imbibition. During gastrointestinal digestion, the additional presence of exopeptidases and endopeptidases would further degrade these compounds [4].
The angiotensin converting enzyme inhibitory activity was dependent on the type of microorganisms used in the making of fermented soy foods. Bacteria and fungi were used in the solid-state fermentation to obtain natto and tempeh, respectively. Whereas, soy yogurt was fermented with bacteria by submersion fermentation. As observed in Figure 1, natto stored for 2 days (Nd2) showed an increase of 40% in the ACE inhibitory activity as compared to RSoy and remained constant until the sixth day of storage. Tempeh stored for 2 days (Td2) increased just 17% in the ACE inhibitory activity as compared to RSoy, and the activity decreased with the storage time. However, the ACE inhibitory activity of soy yogurt was 36% higher than RSoy and about 11% smaller than CTSoyM (cooked traditional soymilk) and remained unchanged during the storage.
The differences in the ACE inhibitory activity between natto and tempeh could be due to the presence of different enzymes, since fungi usually produce a wider range of extracellular enzymes than bacteria [23]. The proteases from Bacillus and Rhizopus strains may hydrolyze the main soy proteins into large peptides [8], and the subsequent hydrolysis of these peptides during in vitro digestion by digestive enzymes could lead to formation of different, smaller peptides. Therefore, the high % ACE inhibition and storage stability of natto and soy yogurt compared to tempeh indicated that bacteria could be more promising than fungi for production of fermented soy foods with better ACE inhibitory activity.

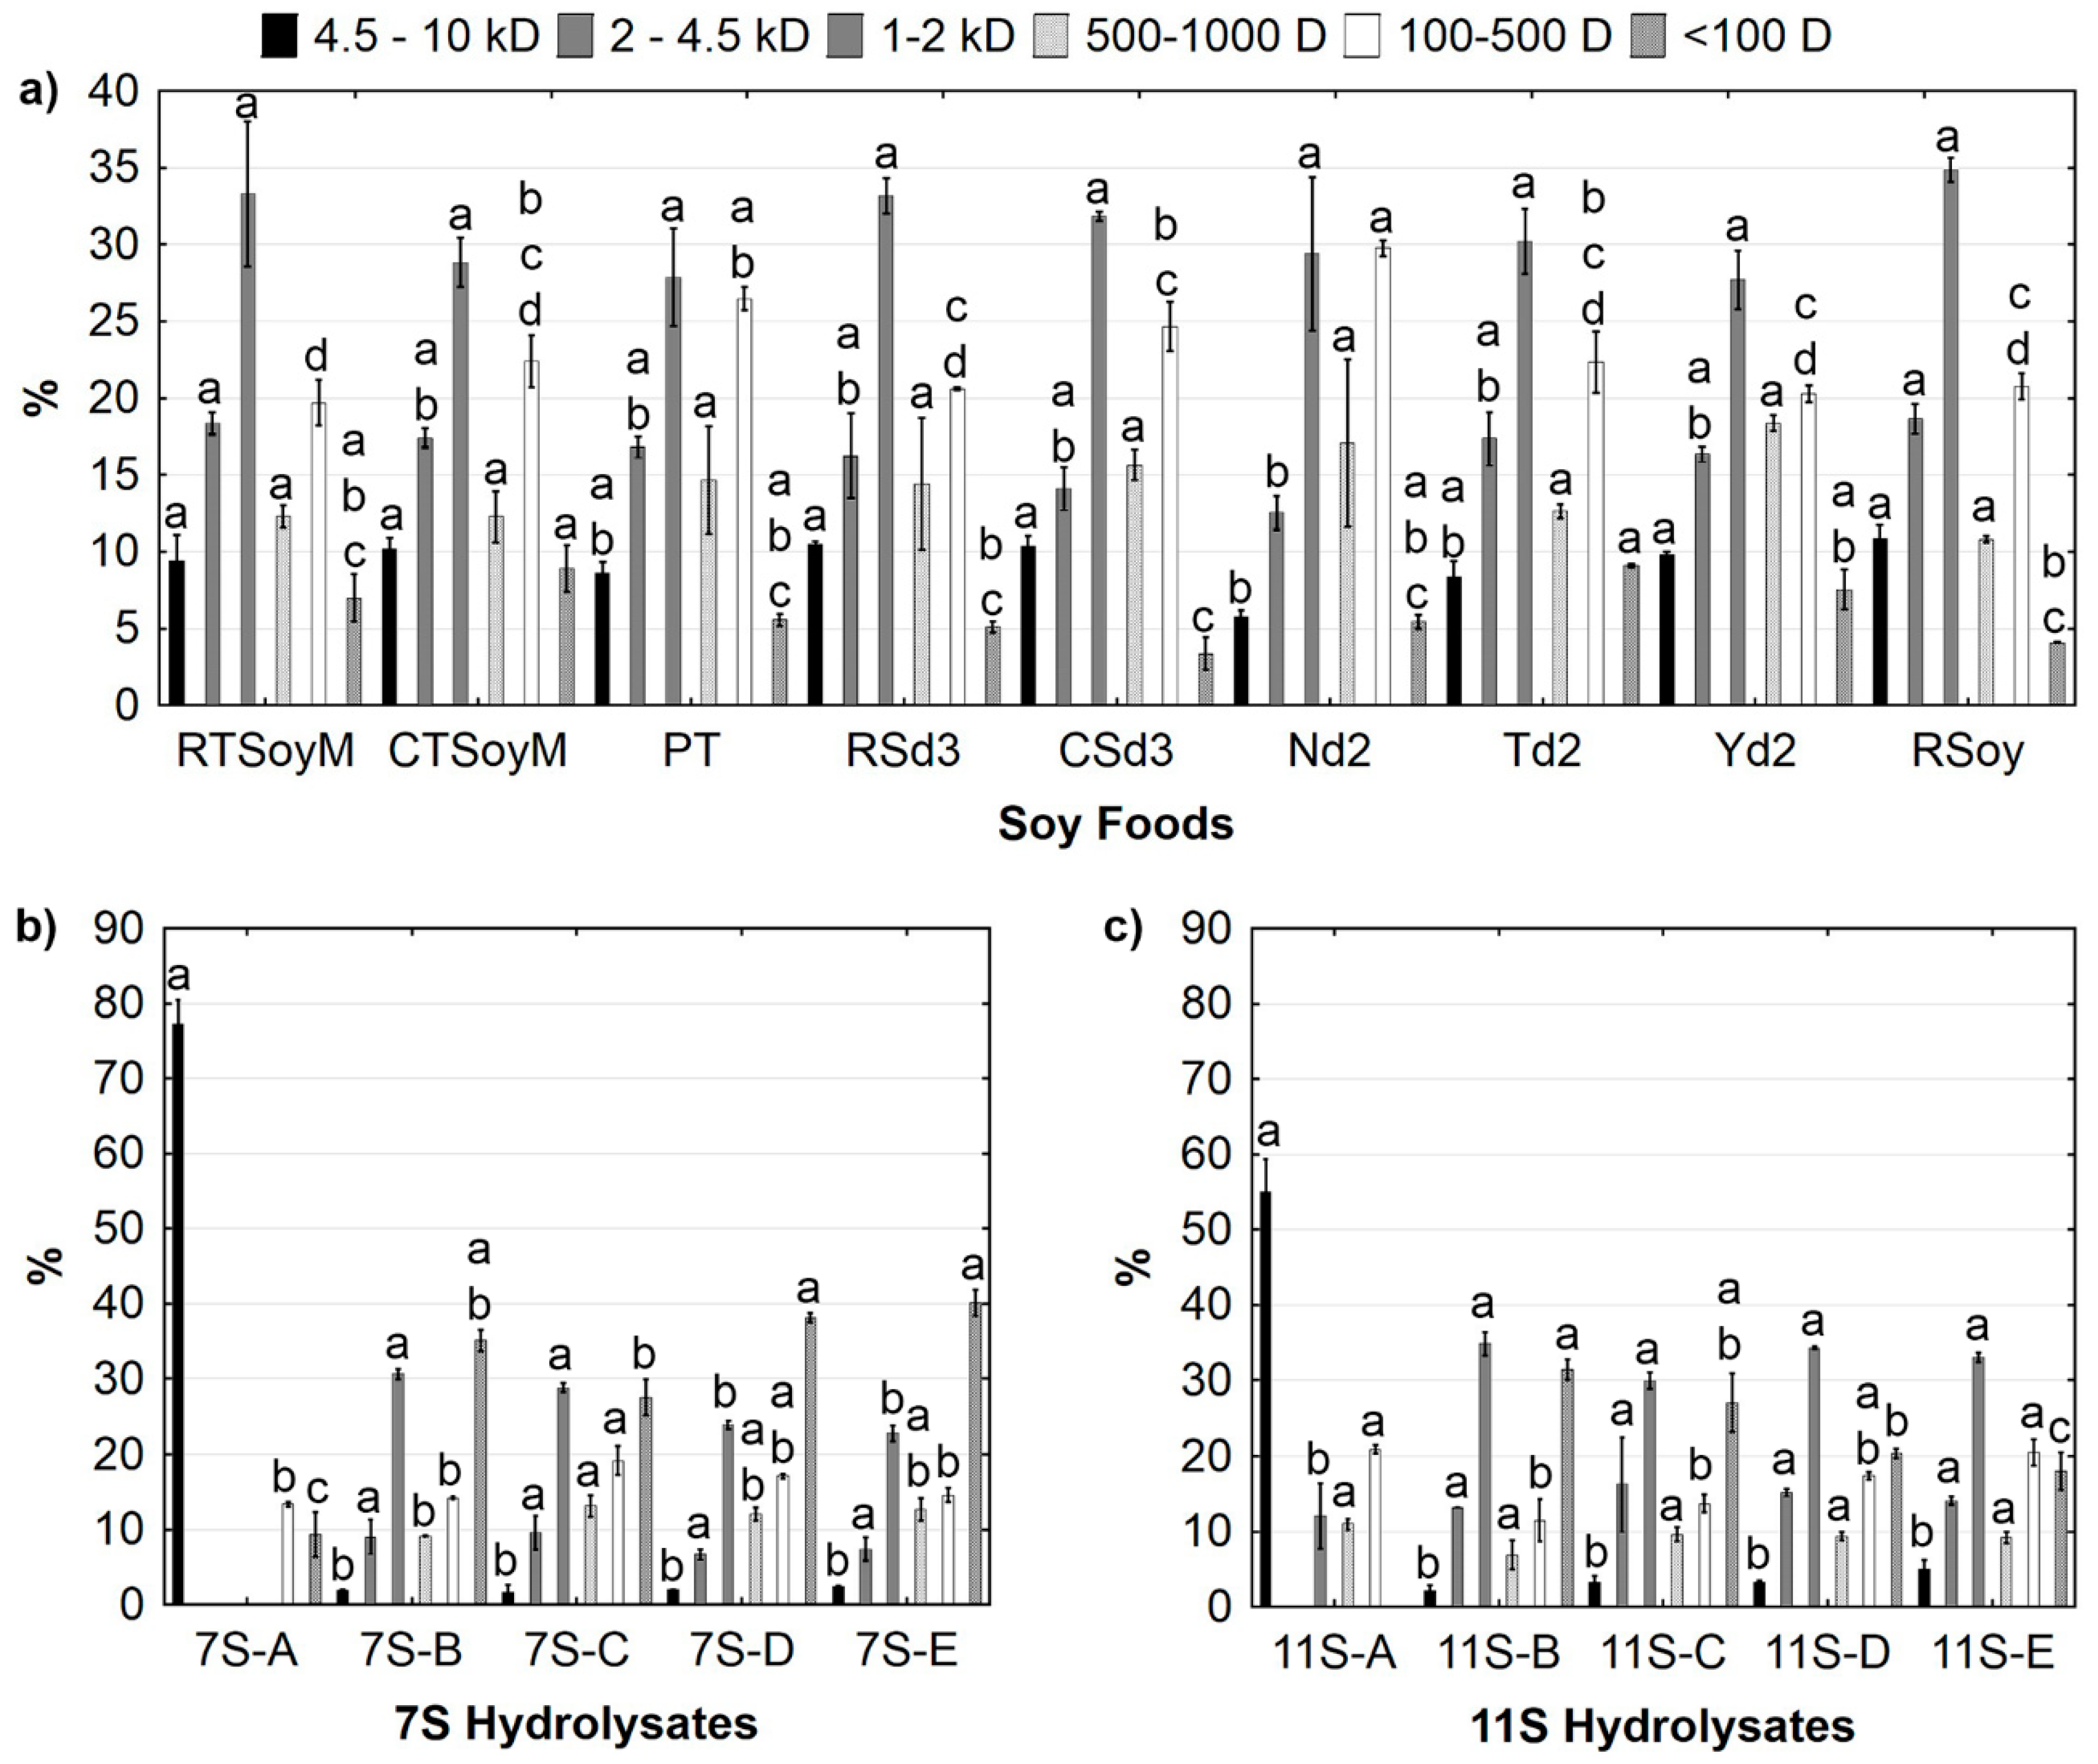
3.2. Characterization of Digested Soy Foods

Table 1 and Figure 2 show the ACE inhibitory capacity (IC50), soluble proteins, and peptide MW distribution of the representative digested soy foods that gave higher percentages of ACE inhibition in each food processing category. As shown in Table 1, soymilk exhibited the highest ACE inhibition with RTSoyM (raw traditional soymilk) and CTSoyM (cooked traditional soymilk) representing approximately 47% and 37% IC50 decreases, respectively, in comparison with RSoy (raw soybean).
However, when the soymilk was fermented into soy yogurt or made into pressed tofu (PT), the IC50 values were not significantly different from that of raw soybean (p > 0.05). The effect of solid-state fermentation on ACE inhibitory capacity was dependent on the specific type of microorganisms used in the making of soy foods. IC50 value of the natto 2 day (Nd2, made from Bacillus natto) was not significantly different from that of RSoy (raw soybean), whereas Td2 (made from Rhizopus species) showed a 1.36 fold increase in the IC50 value as compared with RSoy. The sprouting of soybean for 3 days (RSd3) reduced about 21% of the IC50 value in comparison with RSoy, but the cooking of sprout (CSd3) increased the IC50 value which was equivalent to that of RSoy thus eliminating the advantage of sprouting.
Comparing the IC50 values from different digested fermented and non-fermented soy foods from the seeds of the same soybean variety had not been reported in the literature. Our research agreed with the concept that ACE inhibition ability depended on the experimental protocol, protein extraction procedure, and differences in the peptide mixture compositions after digestion process [24].
The IC50 value of the synthetic inhibitor, captopril, was analyzed in our laboratory to verify ACE inhibition efficiency of the digested soy foods. Results showed captopril was a very strong inhibitor as compared with digested soy foods. The IC50 value of captopril was 1.05 nM, which was comparable to that reported by Lahogue et al. [25]. Our research is consistent with the report of Hayes and Tiwari [26] that bioactive peptides derived from natural sources needed higher concentrations than synthetic drugs to be effective.
The samples Nd2, Td2, RTSoyM, CTSoyM, and RSd3 showed relatively higher soluble proteins, while RSoy gave the lowest soluble proteins (Table 1) which reflected protein digestibility. Raw soy contains trypsin inhibitors and the native protein structure was compact and resistant to digestion by proteases. The soluble proteins content was influenced by heat treatment the same way as observed in the ACE inhibitory capacity. After the size exclusion chromatography, the separated peptides were grouped into six MW ranges: 4.5–10, 2–4.5, 1–2, 0.5–1, 0.1–0.5, and <0.1 kDa. Most of peptides (>70%) present in soy foods exhibited MW below 2 kDa, although the 1–2 kDa group was pre-dominant in the most of samples. As shown in Figure 2a, the processing had little effect on peptide MW distribution. Except Nd2, which showed about 47% and 43% lower than Rsoy in the 4.5–10 and 2–4.5 kDa ranges, respectively, all other soy foods exhibited similar MW distribution.
The relative content of peptides ranging from 1–2 and 0.5–1 kDa were similar among digested soy foods (p > 0.05). The highest percentages between 0.1 and 0.5 kDa were observed in the Nd2 and PT, which were 1.43 and 1.27-fold higher than RSoy, respectively, while no differences existed in the relative content of these peptides between other soy foods and RSoy. CTSoyM and Td2 showed higher percentages of compounds <0.1 kDa than RSoy. The compounds less than 0.5 kDa could be amino acids released by the simulated in vitro digestion. In addition to the protein structural factors (such as degrees of denaturation, unfolding and aggregations) that were induced by processing conditions, the differences in the peptide MW distribution could be due to the lack of specificity of the digestive enzymes and of the proteases which naturally present in different types of foods, particularly fermented foods [4].

3.3. Angiotensin Converting Enzyme (ACE) Inhibitory Capacity and Molecular Weight Distribution of 7S and 11S Hydrolysates

As shown in Table 2, each enzyme sequentially involved changed the ACE inhibitory capacity (A—no hydrolyzed; B—hydrolyzed by pepsin for 2 h; C—hydrolyzed by pepsin for 2 h + trypsin for 2 h; D—hydrolyzed by pepsin for 2 h + trypsin for 2 h + α-chymotrypsin for 2 h; and E—hydrolyzed by pepsin for 2 h + trypsin and α-chymotrypsin for 2 h), and the two major storage proteins also exhibited significant (p < 0.05) differences. The IC50 value of non-hydrolyzed 7S-A fraction was 2.16 fold higher than that of non-hydrolyzed 11S-A. Pepsin hydrolysis (B) for 2 h of 7S and 11S fractions reduced the IC50 value by about 32% and 24%, respectively. The IC50 values of 7S and 11S hydrolyzed by pepsin for 2 h + trypsin for 2 h (C) were approximately 81% and 84% smaller than those of 7S-A and 11S-A, respectively, and remained constant with addition of α-chymotrypsin for 2 h (D). No significant differences were observed between D and E hydrolysates of both 7S and 11S fractions, indicating sequential and simultaneous actions of trypsin and α-chymotrypsin had no differences on ACE inhibitory capacity. The IC50 value of 11S-E was about 85% smaller than that of 7S-C, indicating more potent of the 11S digest as compared to 7S protein digest. The differences in the IC50 values observed among 7S and 11S hydrolysates can be due to the differences in their structures, amino acid composition, and processing properties [27]. Furthermore, Gibbs et al. [6] found the biologically active peptides were mostly derived from glycinin (11S). The peptide YVVFK, which was resulted after the hydrolysis of the 11S protein, had been identified as a strong ACE inhibitor [4].
Hydrolysis of 7S and 11S proteins by different proteases resulted in distinct peptide MW distribution for each fraction (Figure 2b,c). Most of peptides (>80%) present in protein hydrolysates exhibited MW below 2 kDa. Similar results were found in soy protein isolate (SPI) and soy protein hydrolysate (SPH) after simulated digestion [7]. In the non-hydrolyzed fractions (A), peptides of 4.5–10 kDa made up 77% and 55% of 7S-A and 11S-A, respectively. With pepsin, these peptides reduced to less than 10% and were unchanged with the addition of other enzymes for both fractions (p > 0.05). The percentage of peptides between 2 and 4.5 kDa was constant in all 7S and 11S hydrolysates (B, C, D, and E).
Peptides between 1 and 2 kDa were not found in the non-hydrolyzed 7S-A, but higher percentages were observed in the 7S-B and 7S-C, and they decreased in the 7S-D and 7S-E. While in the 11S protein, the relative content of theses peptides increased 2.9 fold in the 11S-B and unchanged in the 11S-C and 11S-D. The percentage of peptides of MW ranging from 0.5 to1 kDa increased until 7S-C and remained unaltered in the 7S-D and 7S-E hydrolysates. However, the relative content of these peptides remained unchanged with hydrolysis of 11S fraction (p > 0.05). No differences were observed in the percentage of peptides ranging from 0.1 to 0.5 kDa between 7S-A and 7S-B, but it increased in the 7S-C and reduced in the 7S-D and 7S-E. In the 11S-A, the relative content of these peptides was 21%, decreasing to 12% in the 11S-B and increasing in the 11S-D and 11S-E. The amount of the substances with MW < 0.1 kDa was about 10% in the 7S-A and was above 35% in the 7S-B, D, and E. The highest percentages of compounds <0.1 kDa in the 11S hydrolysates found in the 11S-B and 11S-C, were 31% and 28%, respectively, and 11S-E had lower percentage than 11S-D.
The difference in the peptide MW distributions among 7S and 11S hydrolysates probably was due to the diversity of generated peptides from each fraction. Glycinin (11S) is a hexamer with a molecular mass of 320–380 kDa, and each monomer subunit involves one basic and one acidic polypeptide linked via disulfide bond [3]. Whereas, β-conglycinin (7S) is a trimeric glycoprotein containing approximately 4% of carbohydrate with a molecular mass of 180 kDa consisting of three subunits associated by hydrophobic and hydrogen bonding [28]. Gibbs et al. [6] found glycinin was the precursor for 95% of the peptides isolated in their experiments, while the β-conglycinin was found to be more resistant to proteolytic attack.

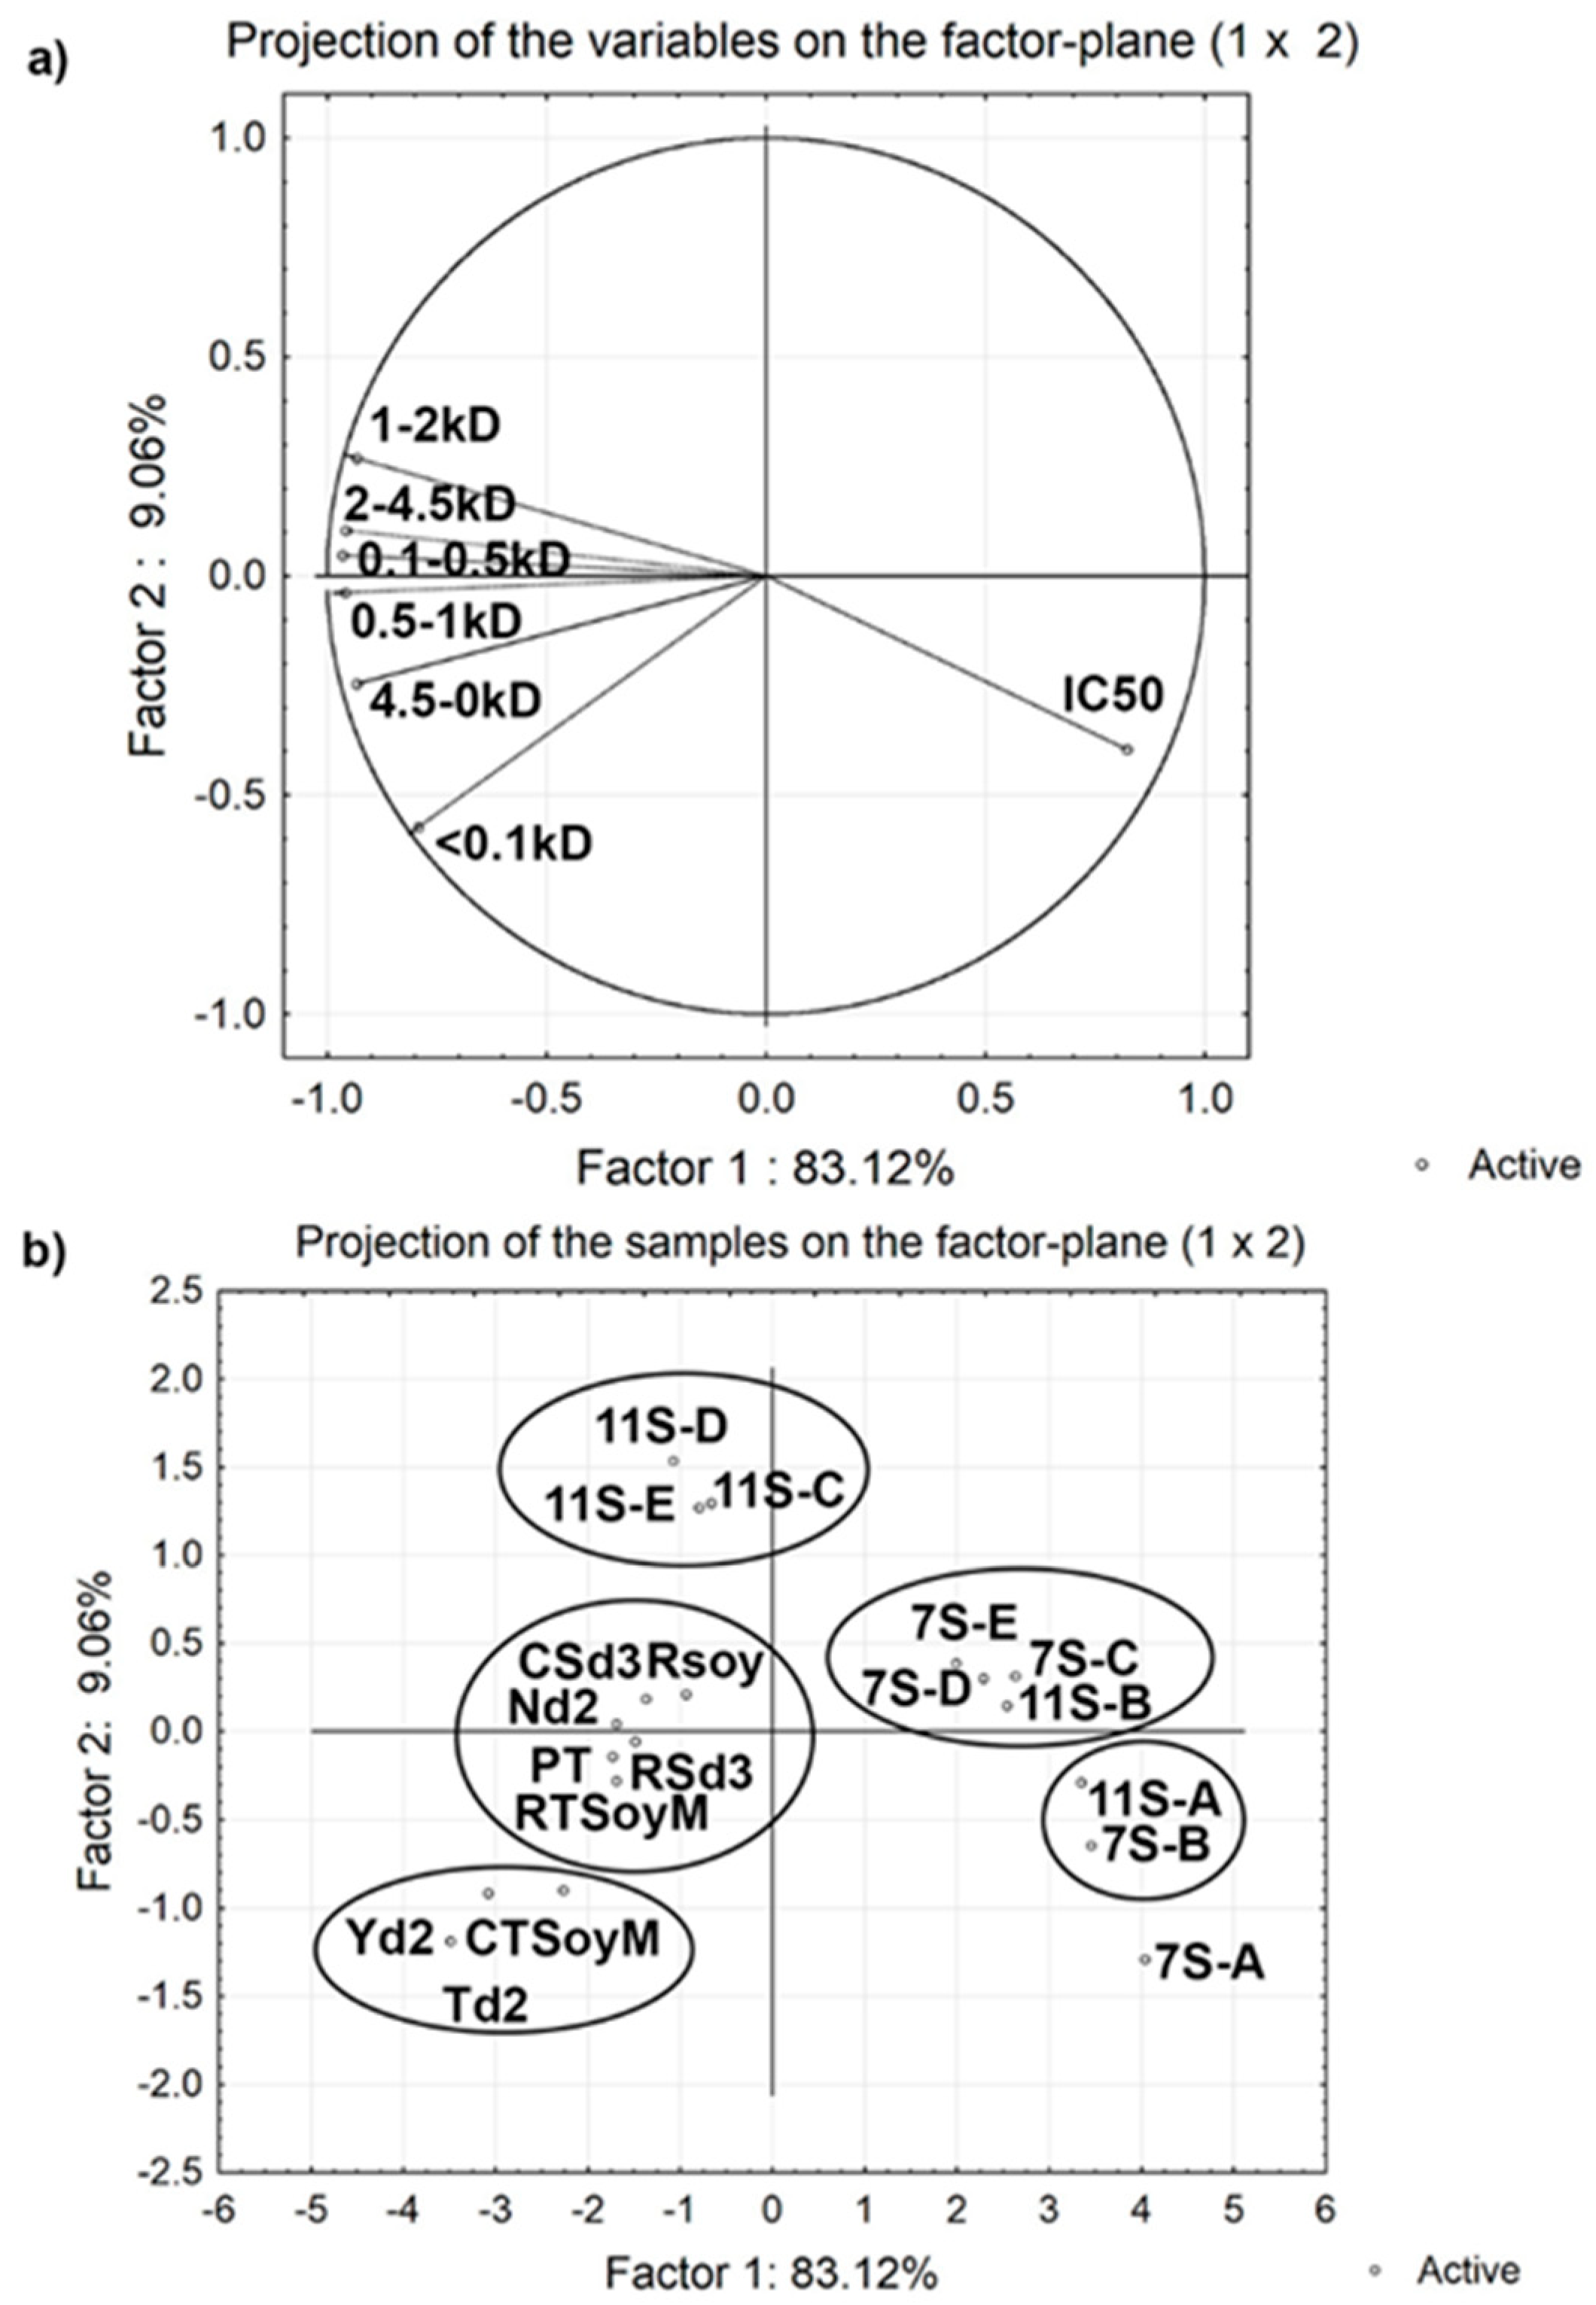
3.4. Effect of Molecular Weight of Peptides on Angiotensin Converting Enzyme (ACE) Inhibitory Activity

The principal component analysis (PCA) analysis was performed between peptide MW and IC50 values from simulated in vitro digested soy foods and 7S and 11S hydrolysates (Figure 3a,b). The projection on the factorial plane (FP1 × FP2) of peptide MW and IC50 values is shown in the Figure 3a, and the projection of the soy foods and 7S and 11S hydrolysates is shown in the Figure 3b. The percentages of variance among the samples were 83% and 9% for PCA axes 1 and 2, respectively. The vectors of FP1 that were close indicated that the variables were positively correlated with each other and, therefore, a positive correlation was observed between the peptides of different MW, except that the substances smaller than 0.1 kDa had a lower correlation with others. The vectors that form an angle close to 180° indicated a negative correlation and, thus, peptides between 1 and 2 kDa were those that most contributed to the reduction of the IC50 values, followed by the peptides between 2 and 4.5 kDa. Substances smaller than 0.1 kDa showed a weak negative correlation, indicating a smaller contribution to reducing the IC50 value (Figure 3a). This result was consistent with reports by Puchalska, García, and Marina [10], who found the most potent ACE inhibitory activity were observed in peptides with MW below 3 kDa. Although studied intensively, the structure−function relationship between the ACE inhibitory activity and peptides remained unclear. Moreover, the number of amino acids in the composition of potentially antihypertensive peptides was not known. It might vary from two to several amino acids. Wu, Aluko, and Nakai [29,30] studied models for ACE-inhibitory peptides through computational analysis, and indicated that for dipeptides, amino acid residues with a large bulk chain as well as hydrophobic side chains are preferred such as phenylalanine, tyrosine, and tryptophan. The structure of the carboxyl terminal of a dipeptide is more relevant to the potency of ACE inhibitory activity than N-terminal. For tripeptides, the most favorable structure is to include an aromatic amino acid residue in the C-terminal, and the hydrophobic amino acids such as leucine, tryptophan in the N-terminal. Besides, the tetrapeptide residues from the C-terminal end determined the potency of peptides that contained 4 to 10 amino acid residues.
Thus, additional studies on the identification of the active peptides of each type of soy foods should be performed in the future. In addition, it is necessary to clarify how the processing used to obtain soy foods affects the formation/degradation of bioactive peptides during the digestion through the human digestive tract.
Principal component analysis was used to group the samples according to the degree of similarity (Figure 3b), and the results showed that 7S-A, 7S-B, and 11S-A were located in the fourth quadrant and, therefore, were characterized by the higher IC50 values, and the 11S-A fraction was similar to 7S-B. The 11S-B was located in the first quadrant and grouped with 7S-C, D, and E. 11S-C, D, and E were grouped in the second quadrant, indicating that they were similar and with lower IC50 values. However, 11S-C, D, and E with low IC50 values did not show enough similarities to be clustered with the simulated in vitro digested soy foods. The digested soy foods Yd2, Td2, and CTSoyM were grouped in the third quadrant, whereas RTSoyM, RSd3, CSd3, PT, Nd2, and RSoy were clustered between quadrant 2 and 3. Therefore, results confirmed that the processing methods exerted an effect on protein hydrolysis during in vitro digestion and ACE inhibitory activity.
Considering the differences between digested soy foods and 7S and 11S hydrolysates, it was observed that peptides of MW between 1 and 4.5 kDa had a higher antihypertensive capacity. However, it was not possible to confirm that peptides in general were the only ones responsible for ACE inhibition activity, since results showed a lower IC50 value (53% less) of RTSoyM (a complex matrix) compared to 11S-E (isolated protein hydrolysate). For example, our previous research confirmed the higher ACE inhibitory activity of phenolics from various legume varieties [31]. Therefore, it is recommended to investigate the possibility of the presence of other types of compounds that have ACE inhibitory activity and if synergistic effects occur with other bioactive compounds. In addition, according to Capriotti et al. [4], extensive hydrolysis of soybean proteins during simulated gastrointestinal digestion generated a large number of peptides, some of which established biological activity. However, one should take into account that the in vivo digestion is a more complicated process than the in vitro model process, and the enzymes produced by the gut bacteria should also be considered.

4. Conclusions

The angiotensin converting enzyme (ACE) inhibitory properties of digested fermented and non-fermented soy and of hydrolysates of 7S and 11S fractions were reported for the first time in this study. Processing to manufacture soymilk, tofu, natto, tempeh, and soy yogurt improved the ACE inhibition after in vitro simulated gastrointestinal digestion. Raw and cooked traditional soymilk showed the highest anti-hypertensive activity. Among fermented soy foods, natto and soy yogurt had higher ACE inhibitory activity than tempeh. The germination time for 3 days was the most optimal to obtain sprouts with better anti-hypertensive activity. Hydrolysis of 7S and 11S fractions using pepsin followed by trypsin was enough for the released peptides with good ACE inhibitory capacity, and 11S hydrolysates were more powerful than 7S hydrolysates in ACE inhibition. Peptides between 1 and 4.5 kDa showed the highest ACE inhibitory activity. Further analysis is required for identification of peptides from digested soy foods with anti-hypertensive potential.

Author Contributions

Conceptualization, C.L.H. and S.K.C.C.; methodology, C.L.H., S.K.C.C., and Y.Z.; formal analysis, C.L.H.; investigation, C.L.H., J.X., and S.K.; resources, S.K.C.C.; writing—original draft preparation, C.L.H. and E.I.I.; writing—review and editing, C.L.H., S.K.C.C., E.I.I., Y.Z., J.X., and S.K.; supervision, S.K.C.C. All authors have read and agreed to the published version of the manuscript.

Funding

USDA-ARS SCA no. 58-6402-2729 contributed funding for this CRIS project no. MIS 501170.

Acknowledgments

Cíntia L. Handa. would like to thank Coordenação de Aperfeiçoamento de Pessoal de Nível Superior (CAPES) for exchange scholarship. Elza I. Ida. is a Conselho Nacional de Desenvolvimento Científico e Tecnológico (CNPq) Research Fellow. This work is a contribution of Mississippi Agricultural and Forestry Experiment Station, Mississippi State University.

Conflicts of Interest

The authors declare no conflict of interest.

References

  1. Merai, R.; Siegel, C.; Rakotz, M.; Basch, P.; Wright, J.; Wong, B.; Thorpe, P.; Thorpe, P. CDC grand rounds: A public health approach to detect and control hypertension. MMWR Morb. Mortal. Wkly. Rep. 2016, 65, 1261–1264. [Google Scholar] [CrossRef] [PubMed] [Green Version]
  2. Fitzgerald, R.J.; Murray, B.A. Bioactive peptides and lactic fermentations. Int. J. Dairy Technol. 2006, 59, 118–125. [Google Scholar] [CrossRef]
  3. Fukushima, D. Recent progress in research and technology on soybeans. Food Sci. Technol. Res. 2001, 7, 8–16. [Google Scholar] [CrossRef] [Green Version]
  4. Capriotti, A.; Caruso, G.; Cavaliere, C.; Samperi, R. Identification of potential bioactive generated by imulated gastrointestinal digestion of soybean seeds and soy milk proteins. J. Food Compos. Anal. 2015, 44, 205–213. [Google Scholar] [CrossRef]
  5. Gu, Y.; Wu, J. LC-MS/MS Coupled with QSAR modeling in characterizing of angiotensin I-converting enzyme inhibitory peptides from soybean proteins. Food Chem. 2013, 141, 2682–2690. [Google Scholar] [CrossRef] [PubMed]
  6. Gibbs, B.F.; Zougman, A.; Masse, R.; Mulligan, C. Production and characterization of bioactive peptides from soy hydrolysate and soy-fermented food. Food Res. Int. 2004, 37, 123–131. [Google Scholar] [CrossRef]
  7. Coscueta, E.R.; Campos, D.A.; Osório, H.; Nerli, B.B.; Pintado, M. Enzymatic soy protein hydrolysis: A tool for biofunctional food ingredient production. Food Chem. X 2019, 1, 100006. [Google Scholar] [CrossRef]
  8. Li, F.; Ohnishi-Kameyama, M.; Takahashi, Y.; Yamaki, K. Angiotensin I-converting enzyme inhibitory activities of chinese fermented soypaste and estimation of the inhibitory substances. J. Funct. Foods 2013, 5, 1991–1995. [Google Scholar] [CrossRef]
  9. Alauddin, M.; Shirakawa, H.; Hiwatashi, K.; Shimakage, A.; Takahashi, S.; Shinbo, M.; Komai, M. Processed soymilk effectively ameliorates blood pressure elevation in spontaneously hypertensive rats. J. Funct. Foods 2015, 14, 126–132. [Google Scholar] [CrossRef]
  10. Puchalska, P.; Concepción García, M.; Luisa Marina, M. Identification of native angiotensin-I converting enzyme inhibitory peptides in commercial soybean based infant formulas using HPLC-Q-ToF-MS. Food Chem. 2014, 157, 62–69. [Google Scholar] [CrossRef]
  11. Hernández-Ledesma, B.; García-Nebot, M.J.; Fernández-Tomé, S.; Amigo, L.; Recio, I. Dairy protein hydrolysates: Peptides for health benefits. Int. Dairy J. 2014, 38, 82–100. [Google Scholar] [CrossRef] [Green Version]
  12. Zhang, Y.; Guo, S.; Liu, Z.; Chang, S.K.C. Off-flavor related volatiles in soymilk as affected by soybean variety, grinding, and heat-processing methods. J. Agric. Food Chem. 2012, 60, 7457–7462. [Google Scholar] [CrossRef] [PubMed]
  13. Meng, S.; Chang, S.; Gillen, A.M.; Zhang, Y. Protein and quality analyses of accessions from the USDA soybean germplasm collection for tofu production. Food Chem. 2016, 213, 31–39. [Google Scholar] [CrossRef] [PubMed] [Green Version]
  14. Wei, Q.; Wolf-Hall, C.; Chang, K.C. Natto characteristics as affected by steaming time, bacillus strain, and fermentation time. J. Food Sci. 2001, 66, 167–173. [Google Scholar] [CrossRef]
  15. Kumari, S.; Chang, S.K.C. Effect of cooking on isoflavones, phenolic acids, and antioxidant activity in sprouts of prosoy soybean (glycine max). J. Food Sci. 2016, 81, C1679–C1691. [Google Scholar] [CrossRef]
  16. Liu, C.; Wang, H.; Cui, Z.; He, X.; Wang, X.; Zeng, X.; Ma, H. Optimization of extraction and isolation for 11S and 7S globulins of soybean seed storage protein. Food Chem. 2007, 102, 1310–1316. [Google Scholar] [CrossRef]
  17. Cushman, D.W.; Cheung, H.S. Spectophotometric assay and properties of the angiotensin I-converting enzyme of rabbit lung. Biochem. Pharmacol. 1971, 20, 1637–1648. [Google Scholar] [CrossRef]
  18. You, S.J.; Udenigwe, C.C.; Aluko, R.E.; Wu, J. Multifunctional peptides from egg white lysozyme. Food Res. Int. 2010, 43, 848–855. [Google Scholar] [CrossRef]
  19. Smith, P.K.; Krohn, R.I.; Hermanson, G.T.; Mallia, A.K.; Gartner, F.H.; Provenzano, M.D.; Fujimoto, E.K.; Goeke, N.M.; Olson, B.J.; Klenk, D. Measurement of protein using bicinchoninic acid. Anal. Chem. 1985, 150, 76–85. [Google Scholar] [CrossRef]
  20. Lourenço da Costa, E.; Antonio da Rocha Gontijo, J.; Netto, F.M. Effect of heat and enzymatic treatment on the antihypertensive activity of whey protein hydrolysates. Int. Dairy J. 2007, 17, 632–640. [Google Scholar] [CrossRef]
  21. Zakharov, A.; Carchilan, M.; Stepurina, T.; Rotari, V.; Wilson, K.; Vaintraub, I. A comparative study of the role of the major proteinases of germinated common bean (Phaseolus vulgaris L.) and soybean (Glycine max (L.) merrill) seeds in the degradation of their storage proteins. J. Exp. Bot. 2004, 55, 2241–2249. [Google Scholar] [CrossRef] [PubMed]
  22. Yang, M.; Li, L. Physicochemical, textural and sensory characteristics of probiotic soy yogurt prepared from germinated soybean. Food Technol. Biotechnol. 2010, 9862, 490–496. [Google Scholar]
  23. Kirk, T.K.; Gifford, O.; Drive, P.; Farrell, R.L. Enzymatic “combustion”: The microbial degradation of lignin. Microbiology 1987, 465–505. [Google Scholar] [CrossRef] [PubMed]
  24. Barbana, C.; Boye, J.I. Angiotensin I-converting enzyme inhibitory activity of chickpea and pea protein hydrolysates. Food Res. Int. 2010, 43, 1642–1649. [Google Scholar] [CrossRef]
  25. Lahogue, V.; Réhel, K.; Taupin, L.; Haras, D.; Allaume, P. A HPLC-UV method for the determination of angiotensin I-converting enzyme (ACE) inhibitory activity. Food Chem. 2010, 118, 870–875. [Google Scholar] [CrossRef]
  26. Hayes, M.; Tiwari, B.K. Bioactive carbohydrates and peptides in foods: An overview of sources, downstream processing steps and associated bioactivities. Int. J. Mol. Sci. 2015, 16, 22485–22508. [Google Scholar] [CrossRef] [Green Version]
  27. Nik, A.M.; Tosh, S.M.; Poysa, V.; Woodrow, L.; Corredig, M. Protein recovery in soymilk and various soluble fractions as a function of genotype differences, changes during heating, and homogenization. J. Agric. Food Chem. 2008, 56, 10893–10900. [Google Scholar] [CrossRef]
  28. Thanh, V.H.; Shibasaki, K. Major proteins of soybean seeds. subunit structure of beta.-conglycinin. J. Agric. Food Chem. 1978, 26, 692–695. [Google Scholar] [CrossRef]
  29. Wu, J.; Aluko, R.E.; Nakai, S. Structural requirements of angiotensin I-converting enzyme inhibitory peptides: Quantitative structure—Activity relationship study of Di- and tripeptides. J. Agric. Food Chem. 2006, 54, 732–738. [Google Scholar] [CrossRef]
  30. Wu, J.; Aluko, R.E.; Nakai, S. Structural requirements of angiotensin I-converting enzyme inhibitory peptides: Quantitative structure-activity relationship modeling of peptides containing 4-10 amino acid residues. QSAR Comb. Sci. 2006, 25, 873–880. [Google Scholar] [CrossRef]
  31. Zhang, Y.; Pechan, T.; Chang, S.K.C. Antioxidant and angiotensin-I converting enzyme inhibitory activities of phenolic extracts and fractions derived from three phenolic-rich legume varieties. J. Funct. Foods 2018, 42, 289–297. [Google Scholar] [CrossRef] [PubMed]
Figure 1. Percentage inhibition of angiotensin converting enzyme (ACE) of digested fermented and non-fermented soy foods. Results are expressed as the mean ± standard deviation. Sample concentration = 0.25 mg/mL in water (on dried basis). RSoy: raw soybean; RTSoyM: raw traditional soymilk; CTSoyM: cooked traditional soymilk; RSoyMS: raw soymilk slurry; CSoyMSF: cooked soymilk with okara and filtered; PT: pressed tofu; FT: filled tofu; RSd (1, 2, 3, 5, and 7): raw sprout germinated for 1, 2, 3, 5, and 7 days; CSd (1, 2, 3, 5, and 7): cooked sprout germinated for 1, 2, 3, 5, and 7 days; Nd (2, 4, and 6): natto stored for 2, 4, and 6 days; Td (2, 4, and 6): tempeh stored for 2, 4, and 6 days; and Yd (2, 4, 6, and 8): yogurt stored for 2, 4, and 6 days. Different lowercase letters over the bar are significantly (p < 0.05) different among samples.
Processes 08 00978 g001
Figure 2. Molecular weight distribution of peptides from the hydrolysates of the simulated in vitro digested soy foods (a), 7S protein (b), and 11S protein (c). RSoy: raw soybean; RTSoyM: raw traditional soymilk; CTSoyM: cooked traditional soymilk; PT: pressed tofu; RSd3: raw sprout germinated for 3 days; CSd3: cooked sprout germinated for 3 days; Nd2: natto stored for 2 days; Td2: tempeh stored for 2 days; and Yd2: yogurt stored for 2 days. 7S and 11S: A—no hydrolyzed; B—hydrolyzed by pepsin for 2 h; C—hydrolyzed by pepsin for 2 h + trypsin for 2h; D—hydrolyzed by pepsin for 2 h + trypsin for 2 h + α-chymotrypsin for 2 h; and E—hydrolyzed by pepsin for 2 h + trypsin and α-chymotrypsin for 2 h. Different lowercase letters over the bar denote significant differences among samples (p < 0.05) on the same range of peptide molecular weight.
Processes 08 00978 g002
Figure 3. Scatterplots of the principal component analysis (PCA): (a) representing 8 variables and (b) representing 9 soybean foods, 5 hydrolysates of 7S and 5 hydrolysates of 11S. RSoy: raw soybean; RTSoyM: raw traditional soymilk; CTSoyM: cooked traditional soymilkPT: pressed tofu; RSd3: raw sprout germinated for 3 days; CSd3: cooked sprout germinated for 3 days; Nd2: natto stored for 2 days; Td2: tempeh stored for 2 days; and Yd2: yogurt stored for 2 days. 7S and 11S: A—no hydrolyzed; B—hydrolyzed by pepsin for 2 h; C—hydrolyzed by pepsin for 2 h + trypsin for 2 h; D—hydrolyzed by pepsin for 2 h + trypsin for 2 h + α-chymotrypsin for 2 h; and E—hydrolyzed by pepsin for 2 h + trypsin and α-chymotrypsin for 2 h.
Processes 08 00978 g003
Table 1. Characteristics of the soy products after simulated in vitro digestion.
Digested Soy FoodsIC50 (mg/mL)Soluble Protein (µg/mg)
RSoy0.19 ± 0.01 d368.64 ± 4.25 d
RTSoyM0.10 ± 0.01 a546.36 ± 2.04 a,b
CTSoyM0.12 ± 0.01 a,b482.38 ± 18.82 a,b,c,d
PT0.20 ± 0.00 d432.00 ± 15.31 b,c,d
RSd30.15 ± 0.00 b,c562.46 ± 10.91 a
CSd30.20 ± 0.02 d381.32 ± 15.81 c,d
Nd20.16 ± 0.01 c,d569.60 ± 8.98 a
Td20.26 ± 0.00 e487.44 ± 2.57 a,b,c
Yd20.17 ± 0.01 c,d418.19 ± 8.07 c,d
Results are expressed as the mean ± standard deviation (on dried basis). Values followed by different superscript lowercase letters in the same column differ significantly (p < 0.05). IC50: concentration to inhibit angiotensin converting enzyme (ACE) by 50 %; RSoy: raw soybean; RTSoyM: raw traditional soymilk; CTSoyM: cooked traditional soymilk; PT: pressed tofu; RSd3: raw sprout germinated for 3 days; CSd3: cooked sprout germinated for 3 days; Nd2: natto stored for 2 days; Td2: tempeh stored for 2 days; and Yd2: yogurt stored for 2 days.
Table 2. Angiotensin convert enzyme (ACE) inhibitory capacity of the 7S and 11S hydrolysates.
SamplesIC50 (mg/mL)SamplesIC50 (mg/mL)
7S-A5.20 ± 0.13 a,A11S-A2.41 ± 0.38 a,B
7S-B3.55 ± 0.03 b,A11S-B1.84 ± 0.06 b,B
7S-C0.99 ± 0.01 c,A11S-C0.40 ± 0.04 c,B
7S-D1.20 ± 0.01 c,A11S-D0.21 ± 0.02 c,d,B
7S-E1.04 ± 0.01 c,A11S-E0.15 ± 0.07 d,B
Results are expressed as the mean ± standard deviation (on dried basis). Values followed by different superscript lowercase letters in the same column differ significantly (p < 0.05). Values followed by different superscript uppercase letters in the same row differ significantly (p < 0.05). IC50: concentration to inhibit ACE by 50%. 7S and 11S: A—no hydrolyzed; B—hydrolyzed by pepsin for 2 h; C—hydrolyzed by pepsin for 2 h + trypsin for 2 h; D—hydrolyzed by pepsin for 2 h + trypsin for 2h + α-chymotrypsin for 2 h; and E—hydrolyzed by pepsin for 2 h + trypsin + α-chymotrypsin for 2 h.

