1. Introduction
Microalgae are currently attracting a lot of interest as, in addition to their renewable nature, they produce valuable molecules [
1,
2]. In particular, lipids from microalgae have gained interest all over the world not only as potential substitutes for petroleum-based fuels, but also as building blocks in the chemical industry or edible oils for the food and health market [
3]. Species such as
Botryococcus braunii,
Schizochytrium sp.,
Parachlorella kessleri, and
Nannochloropsis sp. produce amounts of lipids between 25 and 75%, 50 and 77%, 41 and 65%, and 31 and 68%
DW, respectively [
4,
5,
6]. To extract these lipids, a cell disruption process is necessary after cell harvesting. Indeed, lipids are either located in cell structures or linked to cell membranes [
7,
8] and need to be released.
For several decades of research on microalgae, a certain number of processes of cell disruption have been tested and validated. These processes are usually classified according to their nature (i.e., mechanical or non-mechanical). Mechanical methods include bead milling, high speed or high-pressure homogenization, ultrasound, microwaves and pulsed electric fields. Non-mechanical methods consist of the use of chemical or enzymatic hydrolysis to break the cell membranes or increase their permeability [
9,
10,
11]. Among these cell disruption processes, this paper focuses on the three most commonly used: bead milling, ultrasound and microwaves processes.
The optimization of the operating conditions of the bead milling on cell disruption and the release of lipids, proteins and carbohydrates from different microalgae has been studied by different authors [
6,
7,
12]. The grinding process is achieved through mechanical compaction and shear stress of the solid surface of the beads with microalgae cells [
13]. The efficiency of cell disruption by bead milling depends on many parameters, including the geometry of the chamber and the agitator, the flow rate of the suspension, the biomass concentration, the agitator speed, the density and diameter of beads, the bead filling ratio, and the cell wall composition of microalgae strains [
7]. The results reported in the literature may be contradictory due to the interactions between the operating conditions [
13].
Ultrasound has been widely applied for protein extraction, chemical synthesis, emulsion production and cell disruption [
9,
11]. The potential of ultrasound to assist lipid extraction from microalgae has already been demonstrated in various studies [
14]. Cell disruption by this process takes place via two mechanisms, namely cavitation and mechanical-acoustic effects, induced by the ultrasound [
14]. The efficiency of the ultrasound depends also on various factors such as the power, the temperature, the viscosity, the suspension concentration, the cycle number, the process time, and the microalgae species [
9,
11].
Microwave-assisted extraction offers an alternative green method for cell disruption and extraction of compounds from microalgae. It has been evaluated for industrial-scale applications, revealing effective cell wall disruption with relatively low energy input, a rapid treatment time and the avoidance of the utilization of hazardous substances [
15]. Microwaves interact selectively with polar molecules and induce intracellular heating. This heat and pressure located in the cell walls lead to cell disruption allowing the extraction of intracellular compounds [
14]. As the other cell disruption processes mentioned above, the efficiency of the microwave process for lipid recovery also depends on several factors, namely residence time, temperature, agitation, suspension concentration, microalgae type, and microwave power [
9].
To the best of our knowledge, only a few studies have compared the effects of cell disruption processes on the recovery of lipids from microalgae [
10,
16,
17,
18,
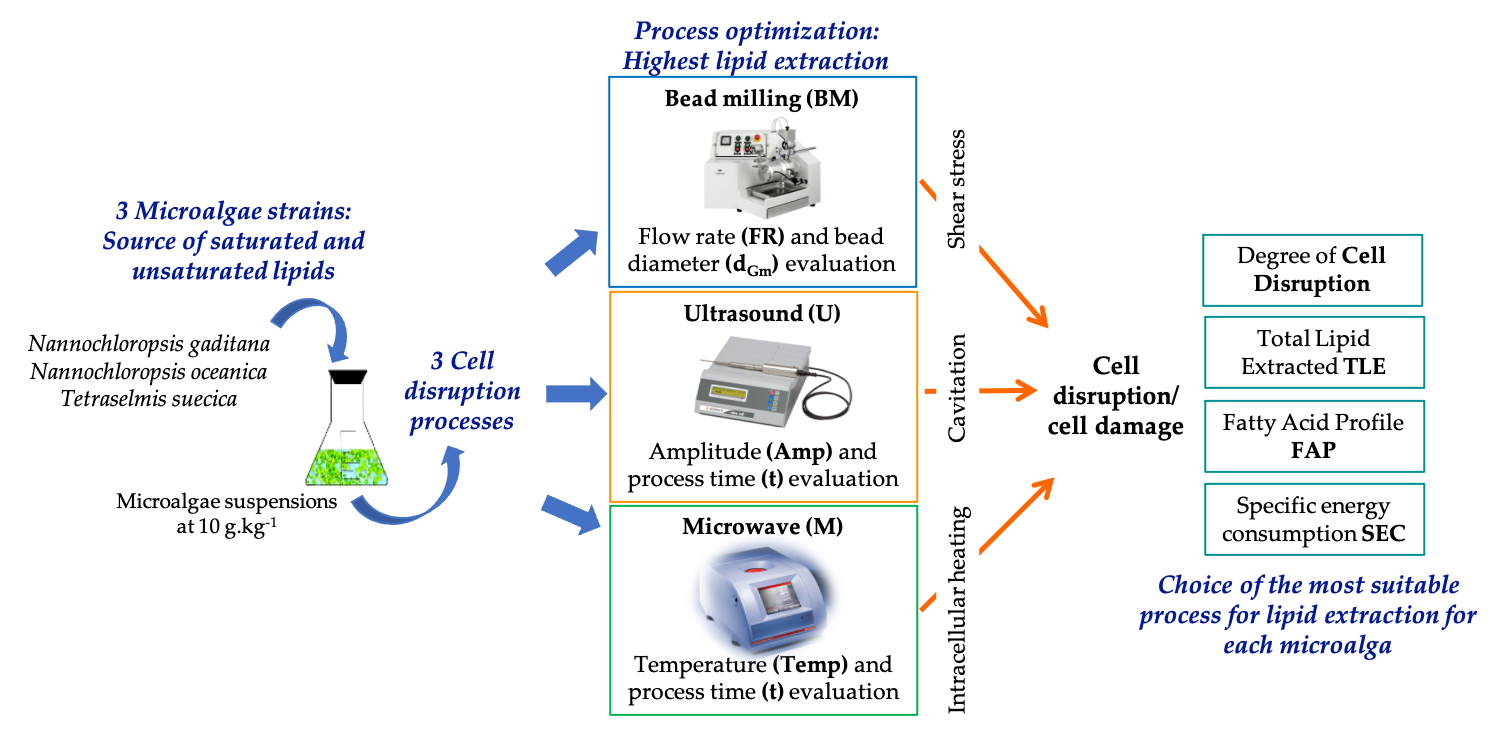
19]. In addition, these studies have mainly focused on a single operating condition for each cell disruption process, without considering the possible interactions of the different parameters that affect the efficacy of the cell disruption process. Thus, the objective of this paper is to conduct an optimization and a comparative study of three promising mechanical cell disruption processes—the bead milling, the ultrasound and microwave processes—to break or weaken the integrity of the cell walls and to increase lipid recovery. To highlight the importance of optimizing the disruption processes for each species of microalgae, three types of microalgae have been studied.
The choice of species was made to compare two species of the same genus and two genus with different structural characteristics. Thus, this study has been conducted on
Nannochloropsis oceanica,
Nannochloropsis gaditana and
Tetraselmis suecica, three species selected for their high lipid content and their differences in the composition of their membranes. Microalgae of the genus
Nannochloropsis [Eustigmatophyceae] have been widely studied in the literature for biofuel applications [
14]. Additionally,
Nannochloropsis species have been used in feed for aquaculture and for the recovery of valuable pigments and nutritive oils [
20]. These microalgae cells are spherical and small in size, ranging from 1 to 4 µm. The structure of their cell walls is composed of an inner layer of cellulose and an outer layer of algenane [
21]. The marine microalga
Tetraselmis [Chloroendrophyceae] is one of the few species to be used for the production of food supplements, due to its high intracellular content of proteins, lipids and polysaccharides [
22,
23]. The lipid content can reach up to 23% (%
w/
w DW) [
15].
Tetraselmis cells are oval and range in size from 7 to 25 µm [
21]. The cell walls of these microalgae consist of complex polysaccharides composed of galactose, xylose, rhamnose, mannose, and arabinose [
12].
Herein, we aimed at determining the most suitable disruption process for lipid extraction among the three processes studied (bead milling, microwaves and ultrasound) for each microalga (N. oceanica, N. gaditana and T. suecica). For this, initially, the operating conditions of the three processes were optimized to obtain the highest lipid recovery. The results of the optimization according to the disruption process and the species of microalgae were compared. Secondly, for each optimum of the three processes studied, the lipid profile of the fraction extracted, and the energy consumption induced by the process were determined.
3. Results
In total, three disruption processes (bead milling, microwave and ultrasound) were applied to three strains of microalgae (N. gaditana, N. oceanica and T. suecica) to improve the extraction of lipids. The effect of operating conditions was studied for each process. The percentage of cell disruption and the total lipids extracted in the microalgae suspensions were determined in order to choose the optimal operating conditions for each disruption process. For the optimal conditions of each disruption process and for each microalga, the fatty acid profile and the specific energy consumption were determined.
3.1. Effect of the Bead Milling Process on the Lipid Recovery
According to
Section 2.2.1, the operating conditions chosen for the optimization of the bead milling are the feed flow rate and the size of the beads. Thus, the effect of these two parameters on the percentage of cell disruption and the
TLE was studied.
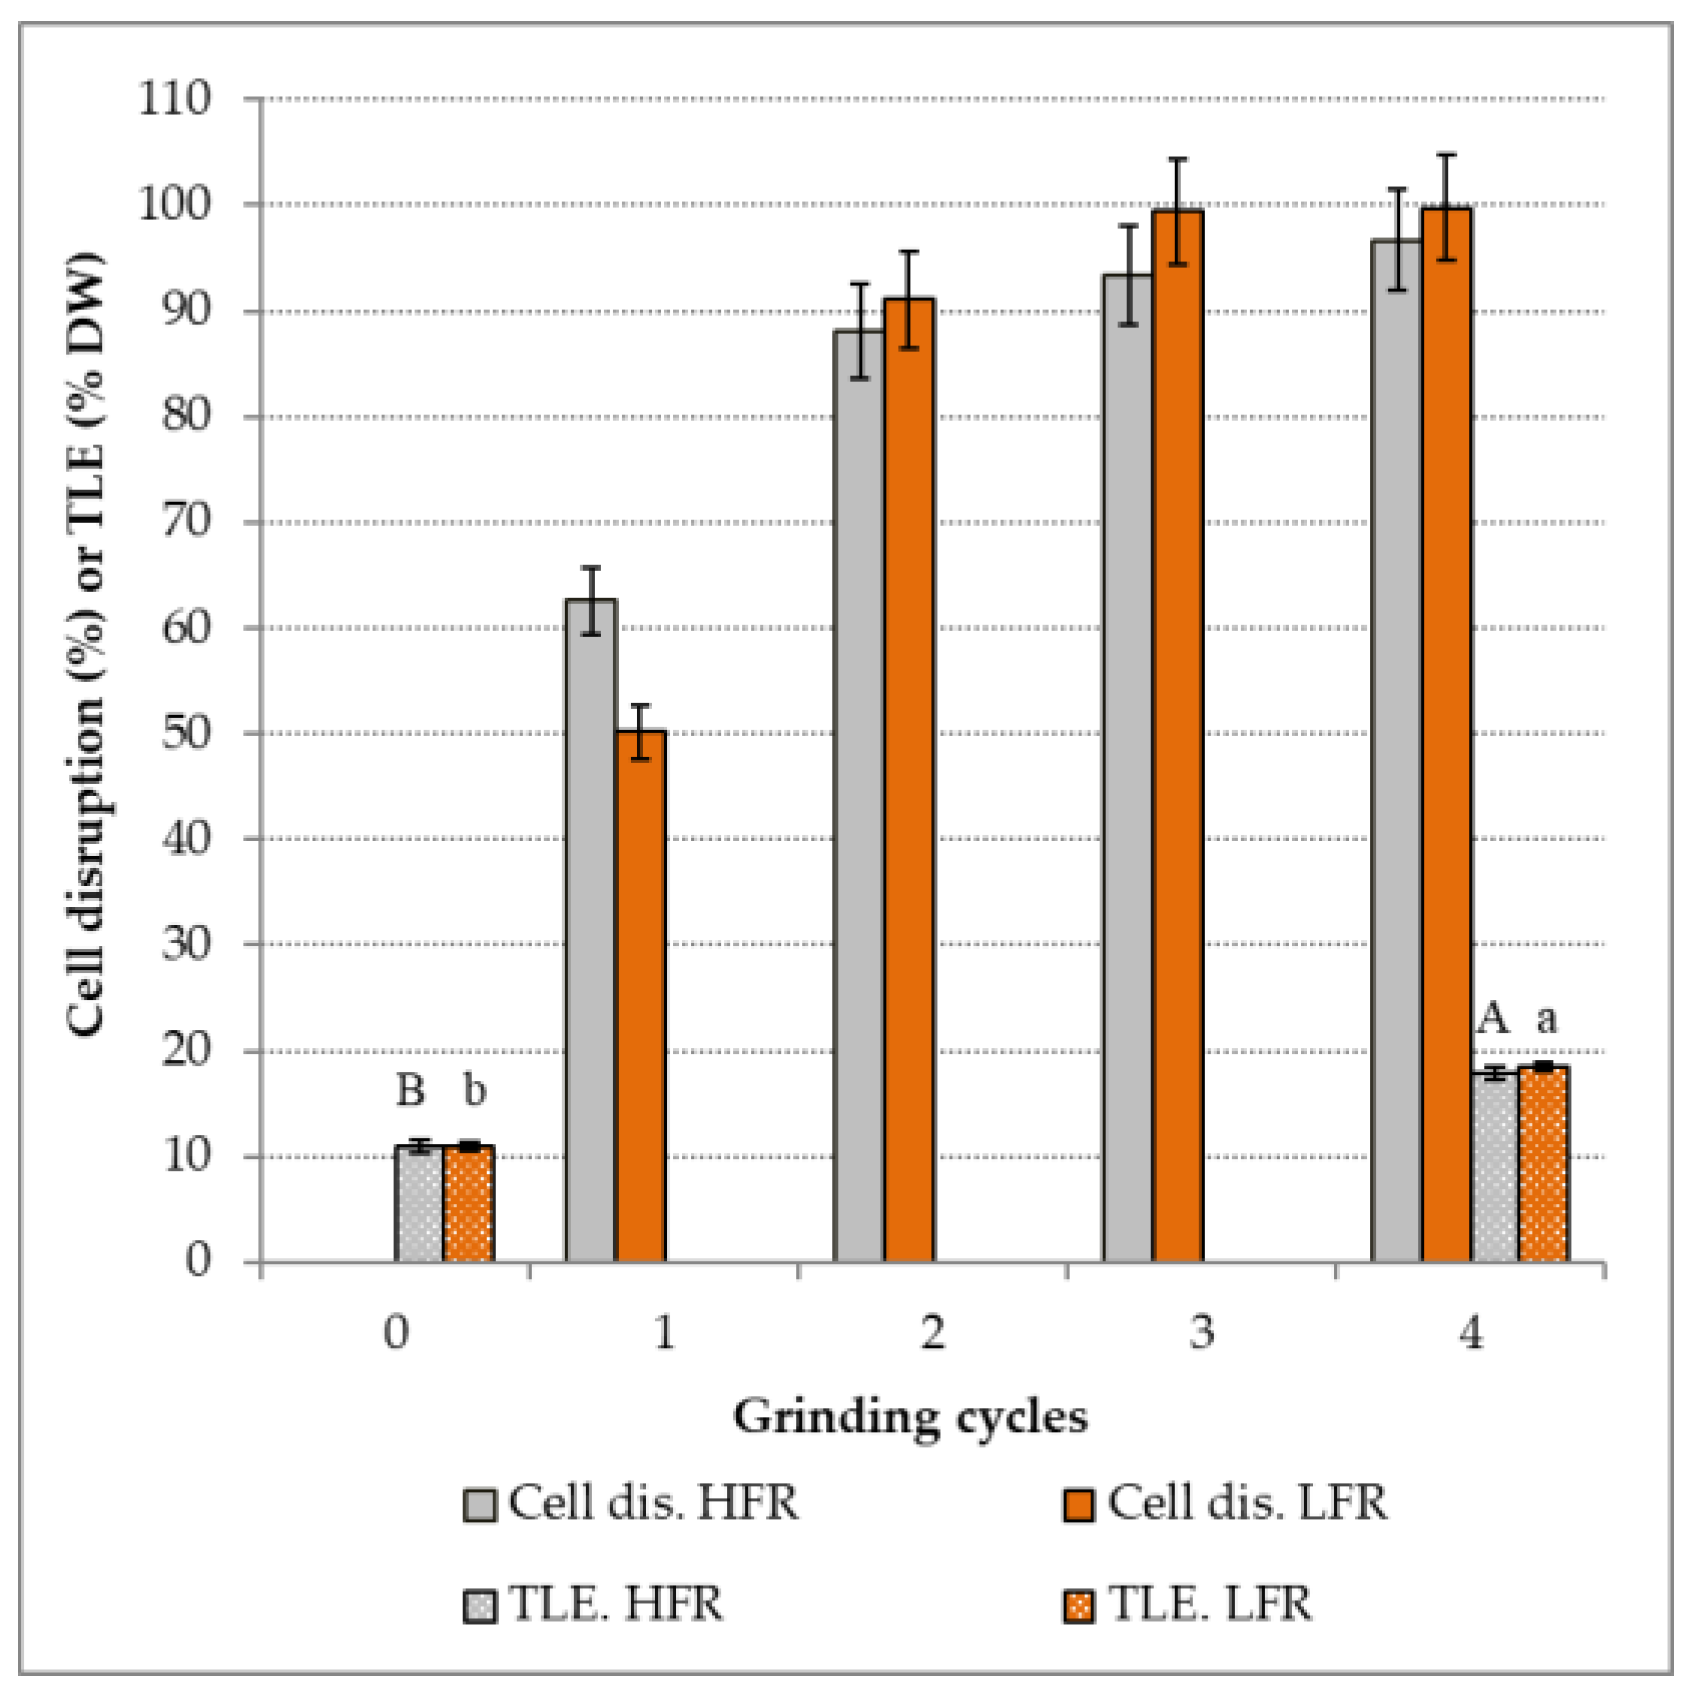
3.1.1. Effect of the Feed Flow Rate
The effect of the feed flow rate on the percentage of cell disruption and
TLE for
N. gaditana strain according to the number of grinding cycles is presented in
Figure 1.
A significant increase in the percentage of cell disruption is observed according to the number of grinding cycles until total rupture is obtained. Percentages of 93 ± 5% and 99 ± 5% were achieved, respectively, for the HFR and the LFR after three grinding cycles. Taking into account the uncertainties of 5%, it can be considered that after three grinding cycles, the cell disruption is complete. Our results are consistent with those obtained in the literature [
6]. Indeed, complete cell disruption was achieved with the same bead mill model used in this study on
Parachlorella kessleri. Cell disintegrations of 85 and 100% were obtained after, respectively, 3 and 5 cycles of grinding at a feed flow rate of 200 mL.min
−1 (glass beads of 1.3 mm, filling volume of 75%).
No significant difference on the percentage of cell disruption was found between
N. gaditana suspensions milled at HFR and LFR after two cycles. However, a tendency to increase the cell disruption is observed for the suspension milled at LFR. Results reported in the literature regarding the impact of the flow rate on cell disruption of microalgae shown better results at lower flow rates. Indeed, it has been reported a decrease of 6% on cell disruption by bead milling of
P. cruentum, when the feed flow rate increases from 48 mL.min
−1 to 170 mL.min
−1 (glass beads of 2.15 mm, 75% of filling volume and a rotational speed of 8 m.s
−1) [
13]. A general decrease on the degree of cell disruption for
C. vulgaris was also found when the feed flow rate was increased for different values of bead size, filling volume, stirring speed [
25]. These contradictory results can be explained by the presence either of an interaction between the feed flow rate and other operating conditions, or by an effect of the strain of microalgae treated. Thus, these findings confirm the need to study the effect of bead milling operating conditions for different strains of microalgae.
The
TLE for
N. gaditana suspension was measured before the grinding (control) and after four grinding cycles.
Figure 1 shows a significant 5% increase (%
DW) in
TLE after 4 cycles of bead milling whatever the feed flow rate. These results reveal that cell disruption by bead milling increased the quantity of lipids available for extraction. This positive effect of the bead milling on lipid extraction has also been observed from
Parachlorella keslerri and from
Yarrowia lipolityca yeast [
6,
29]. However, no significant difference was observed on the
TLE between the two values obtained with HFR and LFR.
Our results show that there is an impact of the bead milling on the percentage of cell disruption and on the TLE for N. gaditana suspension. Indeed, the bead milling enabled the liberation of lipids in the medium after a solvent extraction. However, no effect of the feed flow rate is noticed in this study. As HFR reduces residence time and therefore the energy consumption of the process, HFR value was chosen for bead milling tests performed on other microalgae. As well, as high values (93 ± 5%) of cell disruption were achieved with three grinding cycles, the number of grinding cycles was fixed to 3 for the upcoming experiments.
3.1.2. Effect of the Bead Size
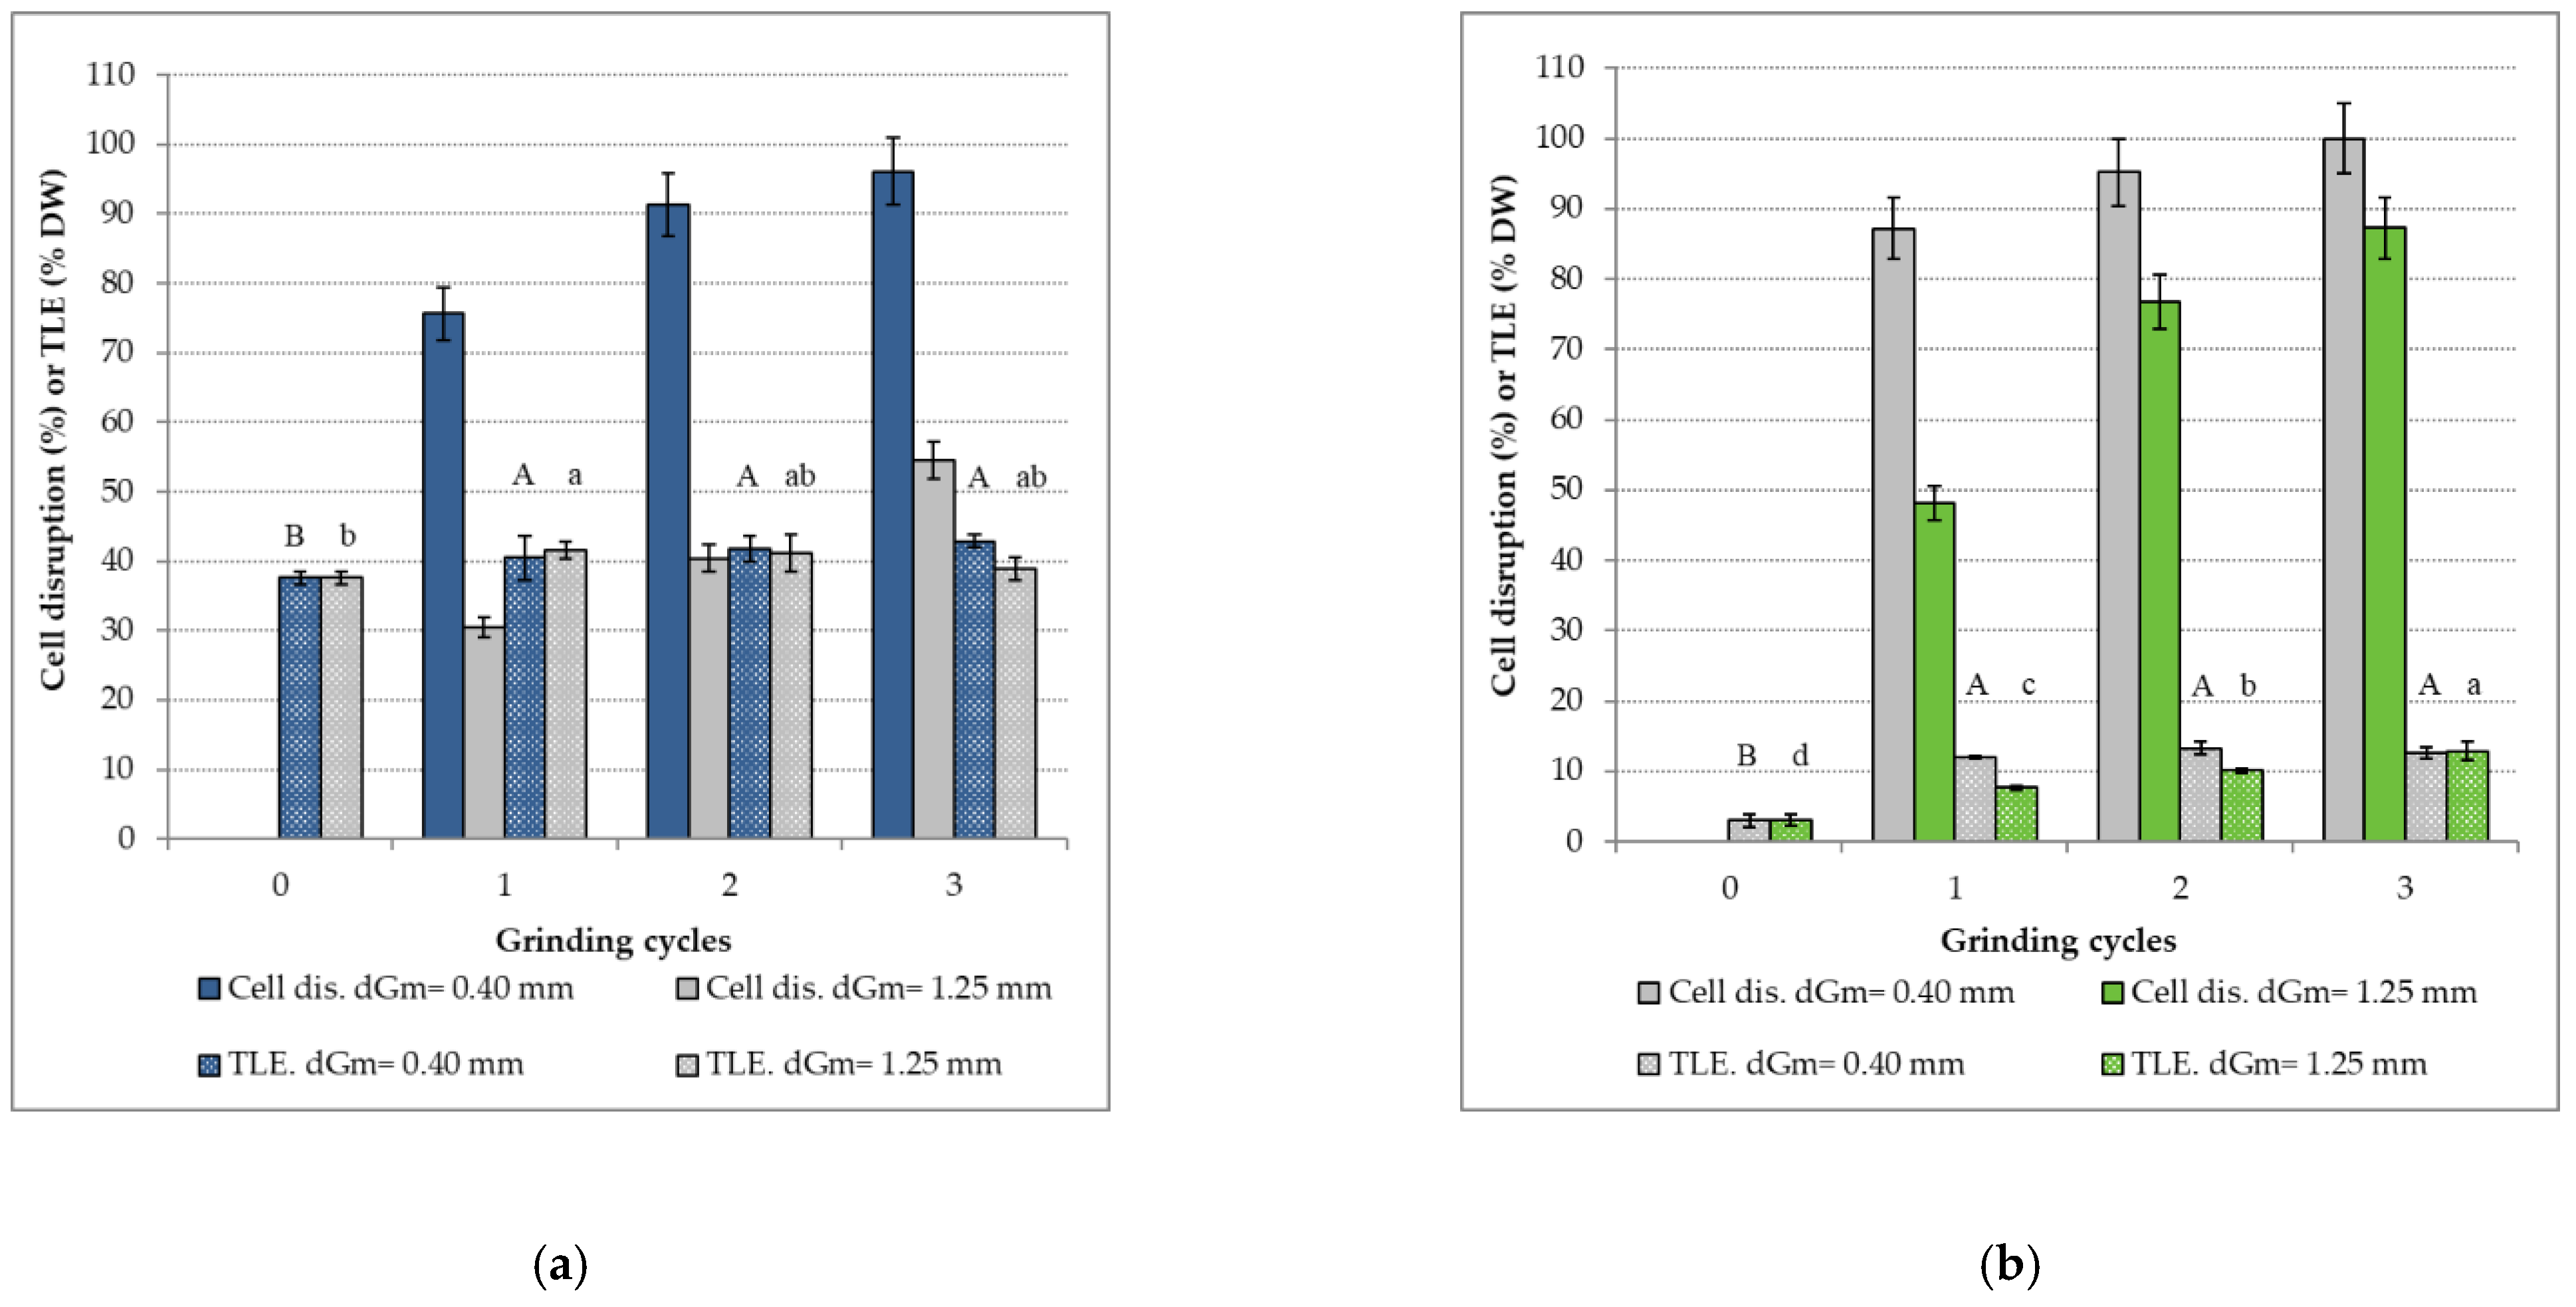
The effect of zirconia bead size on the percentage of cell disruption and
TLE for
N. oceanica and
T. suecica, according to the number of grinding cycles, is presented in
Figure 2. The minimum and maximum average diameters for zirconia beads were chosen: dGm = 0.40 mm and dGm = 1.25 mm.
Whatever the bead size, the bead milling leads to a cell disruption but with different efficiencies. Indeed, significant differences on the percentage of cell disruption for the two microalgae were found between the two bead sizes.
For N. oceanica, after a first grinding cycle, a percentage of cell disruption of 76 ± 5% is obtained with 0.4 mm beads, whereas this percentage is only 30 ± 5% with 1.25 mm beads. After three grinding cycles, whatever the size of the beads, the percentage of cell disruption increases. A percentage of 96% ± 5% is obtained with 0.4 mm beads, whereas with 1.25 mm beads, a disruption of only 55% is noticed.
For
T. suecica, the difference in percentage of cell disruption between the two bead sizes is lower than for
N. oceanica. Indeed, for 0.4 mm beads, an increase between the first and the third cycles from 87 ± 5% to 100 ± 5% is noticed, whereas an increase from 48 ± 5% to 87 ± 5% is observed for 1.25 mm beads. The disruption can be considered as complete for 0.4 mm beads after three grinding cycles. Our results are in accordance with the literature. Indeed, an optimal disintegration, for
T. suecica, by using bead size 0.3–0.4 mm was observed [
7].
An effect of the bead size on the cell disruption is then confirmed as the use of small beads induces an increase in the number of particles for the same filling volume. Thus, stress events (i.e., impact or compression and shear), as well as their intensity, are amplified, resulting in greater efficiency of the disruption process [
13,
26]. The effect of the bead size on the cell disruption of
Nannochloropsis sp. was also studied [
26]. As a result, they observed that smaller zirconia beads (0.3–0.4 mm) were more efficient in cell disruption (>98%) rather than the greater beads (0.7–0.8 mm and 1.8–2.0 mm) under optimal conditions (disintegration time of 40 min, circumferential speed of 2.3 m.s
−1, a concentration in microalgae of 15% m/v and 60% of grinding filling).
Results in
Figure 2 show that the effect of bead size varies according to the microalgae species. The effect of small beads is more noticeable on
N. oceanica than on
T. suecica. This could be associated with the different structural compositions and resistances of their cell walls. Indeed,
Nannochloropsis strain has a bilayer structure consisting in a cellulosic inner wall protected by an outer hydrophobic algenane layer [
20]. The resistance of algenanes and the small size of
Nannochloropsis cells make it difficult to weaken or break cell membranes [
21]. For
T. suecica strain, its cell wall consists in complex polysaccharides made up of galactose, xylose, rhamnose, mannose, and arabinose [
12], which is easier to deconstruct by disruption processes. Thus, one can assume that
T. suecica possess a weaker cellular structure than
N. oceanica. These results are in accordance to those that compared the resistance to shear damage between
Chlorella vulgaris,
Neochloris oleoabundans and
Tetraselmis suecica [
7], demonstrating a higher resistance of
N. oleoabundans, followed by
C. vulgaris and lastly
T. suecica.
Concerning the TLE, a significant increase was noticed with 0.4 mm beads for the two microalgae. For N. oceanica, which is richer in lipids, the TLE value for the control sample was of 38 ± 1% (%DW). After three grinding cycles, a TLE of 43 ± 1% (%DW) is reached. Although the increase remains low, herein we almost reach the total lipid content reported by the supplier (46%) for this microalgae strain. Since the TLE of the control sample is already high, one would think that the cell wall membrane became more permeable during the freezing process, which facilitated the release of lipids during solvent extraction. No significant increase in the TLE is noticed with 1.25 mm beads.
For T. suecica, the TLE varies from 3 ± 1% (%DW) for the control to 13 ± 1% (%DW) for a grinding with 0.4 mm beads, from the first grinding cycle. A same value of TLE is obtained with 1.25 mm beads, after three grinding cycles. The bead milling process improved the extraction of lipids by solvents, reaching the maximal content of lipids that can be extracted from this microalga, according to the supplier.
3.2. Effect of the Microwave Process on the Lipid Recovery
A CCF design with two factors at three levels has been carried out to optimize the cell disruption of microalgae by microwaves. The response studied is the total lipids extracted (
TLE) after treatment. As indicated in
Section 2.2.2, a power of 100 W is given as a set point. The independent variables studied are the temperature applied to the suspension of microalgae and the time of treatment.
Quadratic models were used to predict the
TLE for
N. gaditana and
N. oceanica during microwave treatment. The non-significant coefficients (
p > 0.05) (
Supplementary data. Figures S1, S2) were removed to obtain reduced models (
Supplementary data. Tables S2, S5).
TLE can be predicted by Equation (4) for
N. gaditana and Equation (5) for
N. oceanica.
with R
2 = 0.914 and R
2adj = 0.893
with R
2 = 0.980 and R
2adj = 0.956
The temperature and its quadratic term have a significant and positive effect on the
TLE, while the treatment time and the interaction term between the two factors have no effect on
TLE from
N. gaditana (Equation (4)). Thus, greater exposure time will not result in higher lipids extraction and high temperature was enough to destabilize the cell membrane and improve lipid extraction even applied few minutes, under the operating conditions of this study. This cell wall distortion and collapse of some cells due to microwaves was already observed by scanning electron microscopy after applying a microwave treatment at 100 °C for 5 min of a suspension of
C. vulgaris [
17].
The temperature and its quadratic term have significant effect, but the latter has a negative impact on
TLE from
N. oceanica (Equation (5)). A possible degradation on lipids can be induced at higher temperatures [
21]. The interaction term and the quadratic term of the treatment time are significant and have a positive effect on
TLE from
N. oceanica.
The determination coefficients for both models are superior to 0.9, and the two models show a good correlation between the experimental data and the predicted data. The models were statistically assessed using analysis of variance (ANOVA) (
Supplementary data. Tables S3, S6). The first F-test performed corresponds to a comparison between the variance of the regression and the variance of the model residuals. P-values are less than 0.05 for the two strains which indicates a validation of the model. The second F-test performed corresponds to a comparison between the replicate error and the model error. P-values obtained are equal to 0.734 for
N. gaditana and 0.432 for
N. oceanica which indicates a good fit of experimental data to the values predicted by the models.
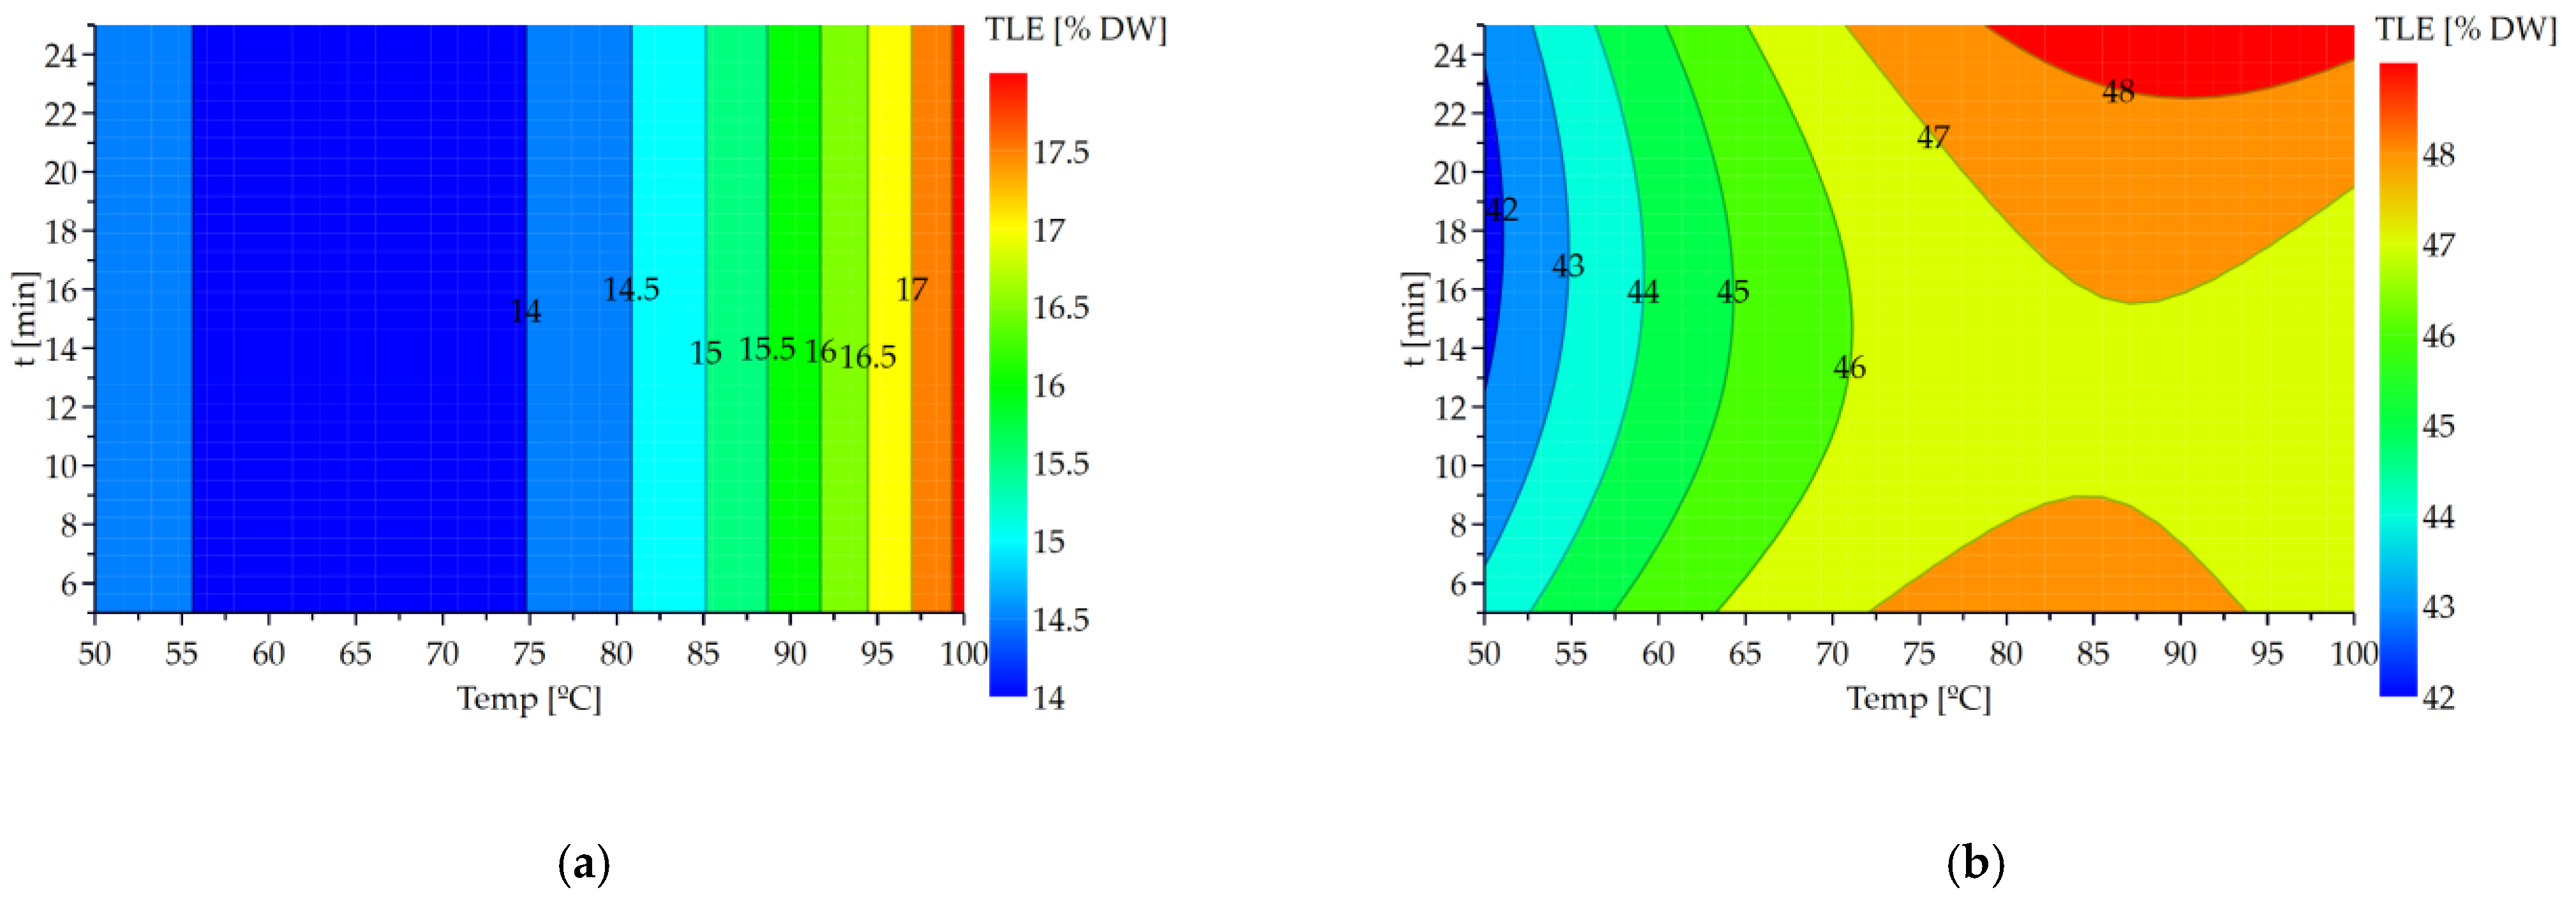
The contour plots presenting the evolution of the
TLE according to the temperature and treatment time for
N. gaditana and
N. oceanica are shown in
Figure 3.
For
N. gaditana (
Figure 3a), the
TLE evolves in vertical bands, which confirms that the treatment time factor has no effect on the content of extracted lipids. For this strain, the optimal operating conditions for the microwave treatment are 100 °C and 5 min. These conditions make it possible to recover the highest lipid content (17.7 ± 0.2 %
DW); a significant increase of 4% is noticed in comparison with the control. For
N. oceanica (
Figure 3b,) the parabolic shape of the curves shows the effect of the quadratic term of the temperature. Two areas with a high TLC appear for opposite values of temperature demonstrate the contradictory effects of the term temperature (positive effect) and its quadratic term (negative effect). However, the model made it possible to define a single optimum area. The optimal operating conditions for the microwave process are 25 min and 91 °C. These conditions allow to obtain 49 ± 1%
DW of lipids extracted. An increase of 8% is noticed in comparison with the control.
New experiments were carried out under these conditions to validate the models (
Table 4).
An increased in TLE of 22 ± 8 % is observed while the model predicts an increase of 25 ± 5% for N. gaditana. Concerning N. oceanica, the model predicts an increase of 16 ± 2% whereas we observe 22 ± 4% of increase in TLE. Student tests were performed, and non-significant differences were found between the predicted and observed values (p > 0.05).
Concerning
T. suecica, the two factors did not have a significant effect (
p > 0.05) on the
TLE in the range of values studied (
Supplementary data. Figure S3). In addition, no significant difference on the
TLE was found between the values of the samples treated with microwaves and the control (
Supplementary data. Tables S7, S8). These results suggest that the microwave process is not an efficient technology to improve lipid extraction from
T. suecica.
The results obtained reveal that the different species of microalgae react differently to the microwave process. This confirms the importance of optimizing the operating conditions for each microalga. In this study, for the two strains of
Nannochloropsis genus, microwaves facilitated the recovery of lipids. However, although these strains are of the same genus, a difference is observed in the values of the operating conditions necessary to reach a maximum in
TLE. However, this technology has been shown ineffective in increasing lipid recovery from
T. suecica. These results are in agreement with the literature where it has been shown that the microwave process can be an optimal pretreatment method to increase lipid recovery and that the optimal conditions of the microwave process differ depending on the strain studied [
14,
26,
30,
31].
3.3. Effect of the Ultrasound Process on the Lipid Recovery
A CCF design with two factors at three levels has then been carried out to optimize the cell disruption of microalgae by ultrasound. The response studied is the recovery of lipids after treatment. As indicated in
Section 2.2.3, a power of 130 W and a frequency of 20 kHz were used. The independent variables studied are the amplitude applied to the suspension of microalgae and the time of treatment.
First order polynomial models were applied to predict the
TLE for
N. gaditana and
N. oceanica during ultrasound treatment. The non-significant coefficients (
p > 0.05) (
Supplementary data. Figures S4, S5, S6) were removed to obtain reduced models (
Supplementary data. Tables S10, S13) to predict the
TLE from
N. gaditana (Equation (6)) and from
N. oceanica (Equation (7)).
with R
2 = 0.900 and R
2adj = 0.875
with R
2 = 0.861 and R
2adj = 0.826
For
N. gaditana and
N. oceanica, the amplitude and the treatment time have a significant and positive effect on the
TLE. The interaction between the two factors and each quadratic term have no significant effect on
TLE. The models were statistically assessed using analysis of variance (ANOVA) (
Supplementary data. Tables S11, S14). The first F-test performed corresponds to a comparison between the variance of the regression and the variance of the model residuals. P-values are less than 0.05 for the two strains which indicates a validation of the model. P-values of the second F-test are equal to 0.554 for
N. gaditana and to 0.622 for
N. oceanica which indicates a good fit of experimental data to the values predicted by the models.
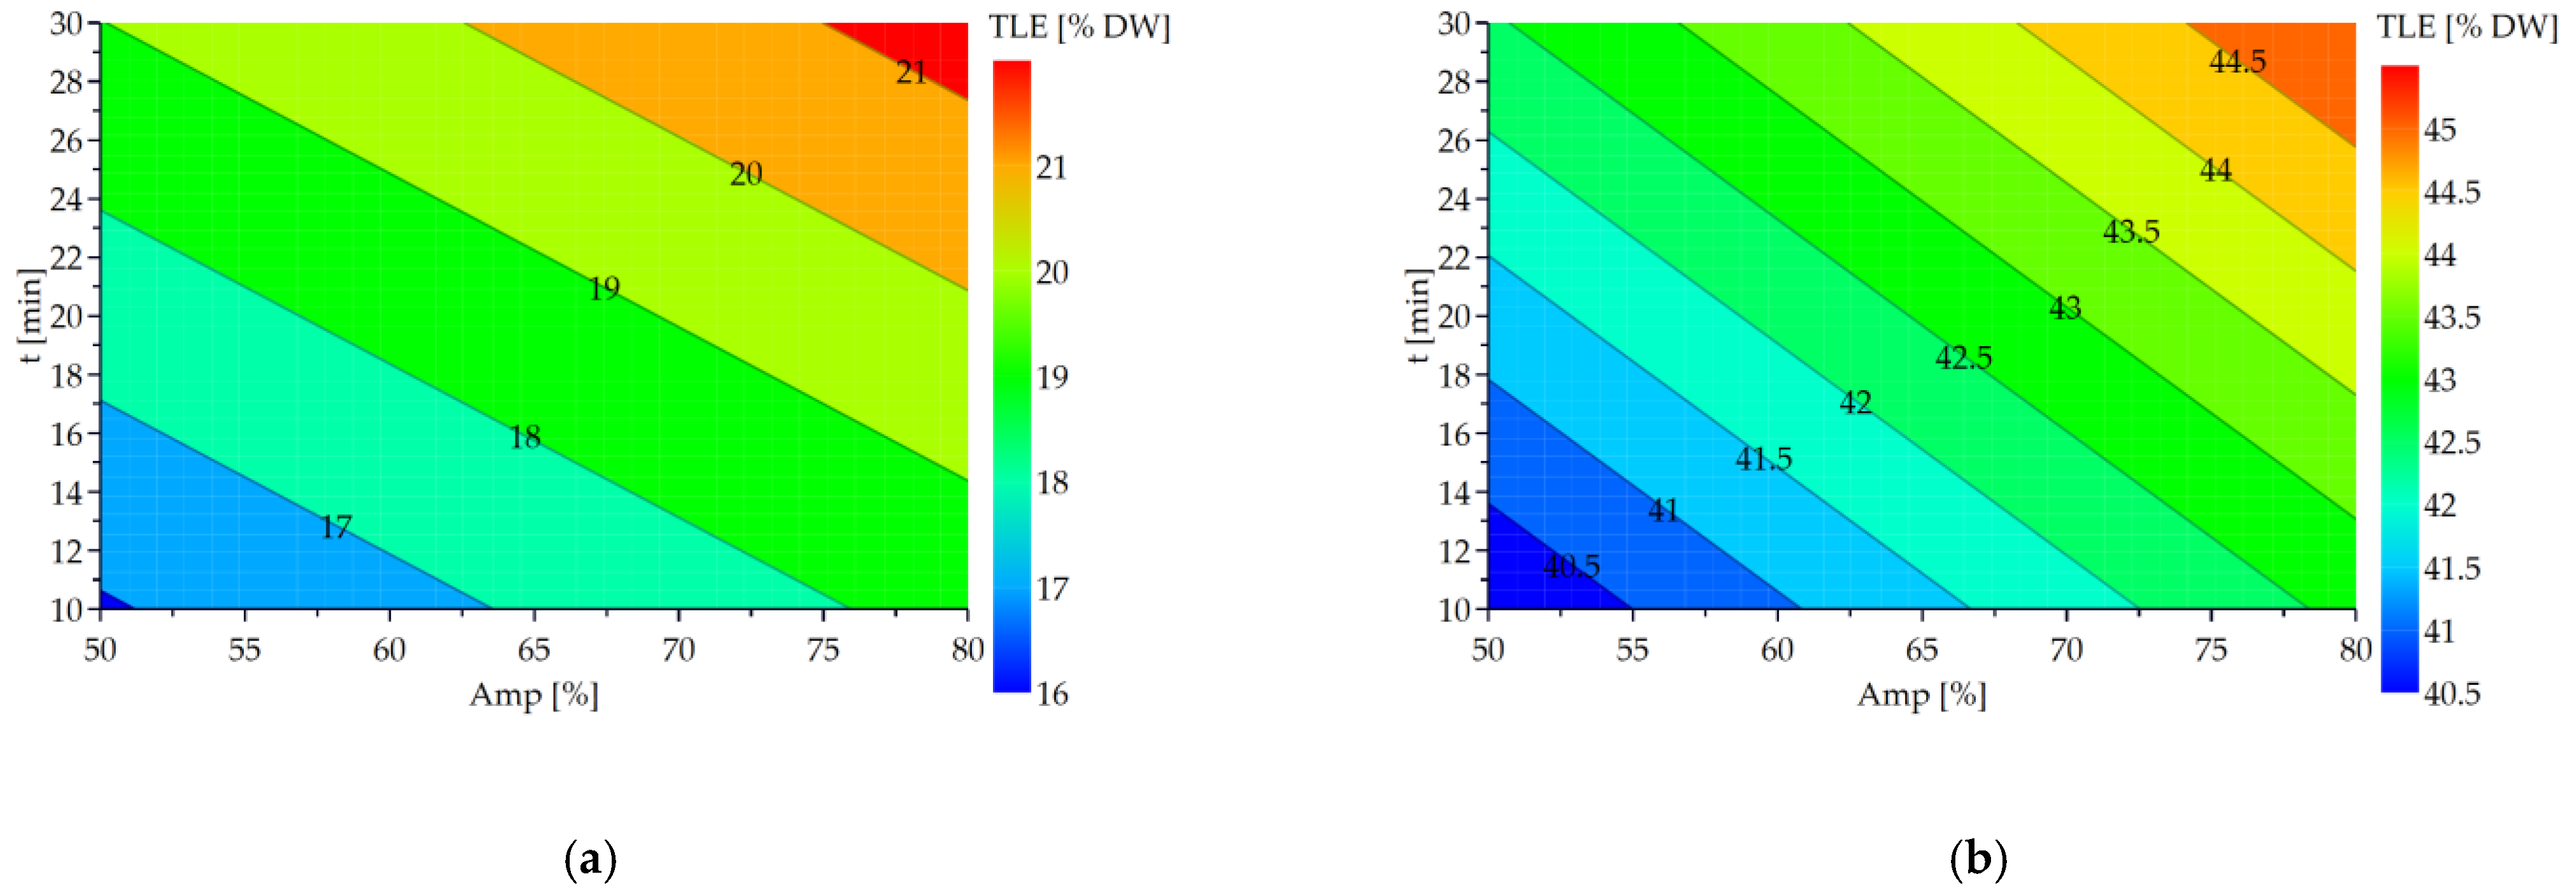
The contour plots presenting the evolution of the TLC according to the power amplitude and the treatment time for
N. gaditana and
N. oceanica are shown in
Figure 4.
The
TLE rises progressively when the treatment time and the ultrasound amplitude increase (
Figure 4a,b). According to Equations (6) and (7), both factors contribute equally to the determination of the
TLE. The highest values of
TLE are obtained for the maximal values of the factors. Thus, the optimal operating conditions for the ultrasound treatment are an amplitude of 80% during 30 min for both microalgae. These conditions make it possible to extract the highest lipid value: 21.7 ± 0.5%
DW (i.e., an increase of 8% in comparison with the control for
N. gaditana) and 45.4 ± 0.6%
DW (i.e., an increase of 6% for
N. oceanica).
As well as for microwave, new experiments were carried out under the optimal conditions to validate the models for the ultrasound-assisted extraction (
Table 4). An increased in
TLE of 45 ± 8% is observed while the model predicts an increase of 53 ± 6% for
N. gaditana. Concerning
N. oceanica, the model predicts an increase of 20 ± 3% whereas we observe a 15 ± 3% increase. Student tests were performed, and non-significant differences were found between the predicted and observed values (
p > 0.05).
Concerning
T. suecica, the treatment time and the ultrasound amplitude have no significant effect on the
TLE in the range of values studied (
Supplementary data. Figure S6). Nevertheless, a significant increase of the
TLE of 9% is noticed. Indeed, the average over all the experiments is equal to 10.9 ± 0.4%
DW whereas the control is equal to 1.7% ± 0.3%
DW (
Supplementary data. Table S15). Thus, the operating conditions of the ultrasound process will be the minimum values of the factors, i.e., 50% of amplitude during 10 min.
The ultrasound process was found to be effective in increasing the recovery of lipids from the three strains of microalgae. Indeed, for the two strains of
Nannochloropsis, the maximum
TLE was reached for the highest amplitude and treatment time in the range of values studied. For
T. suecica, the optimum was obtained for lower values of amplitude and treatment time. Therefore, as for the microwave process, the optimization of the operating conditions of the ultrasound process to maximize the
TLE depends on the strain studied. These results are in agreement with Alhattab et al. (2019), who showed the significant influence of the composition of the cell wall of microalgae and the operating conditions on the effectiveness of sonication as a disruption technique [
21]. Indeed,
Nannochloropsis strains have a stronger cell wall than that of
T. suecica. In conclusion, the operating conditions of the ultrasound process necessary to release the maximum lipid content of
Nannochloropsis are the maximum values of the space studied, whereas lower values are recommended for
T. suecica.
3.4. Effect of Cell Disruption Processes on the Fatty Acid Profile
Previously, only the
TLE was measured to optimize the disruption processes. However, the determination of the FAP also seems relevant as such information can help to choose the most profitable application for the microalgae according to their composition in lipids. For example, palmitic (C16:0), stearic (C18:0), oleic (C18:1n-9c) and linolenic (ALA-C18:3n-3c) acids are the most common fatty acids (FAs) for biodiesel production from microalgae [
15,
17]. Unsaturated fatty acids (UFAs) have applications in the chemistry industry for renewable polymeric materials [
4,
32]. Microalgae species with a high content of PUFAs, and especially those with essential FAs as eicosapentanoeic acid (EPA, C20:5n-3c) and docosahexanoic acid (DHA, C22:6 n-3), have important applications in the nutraceutical industries for the development of functional products [
4,
33,
34].
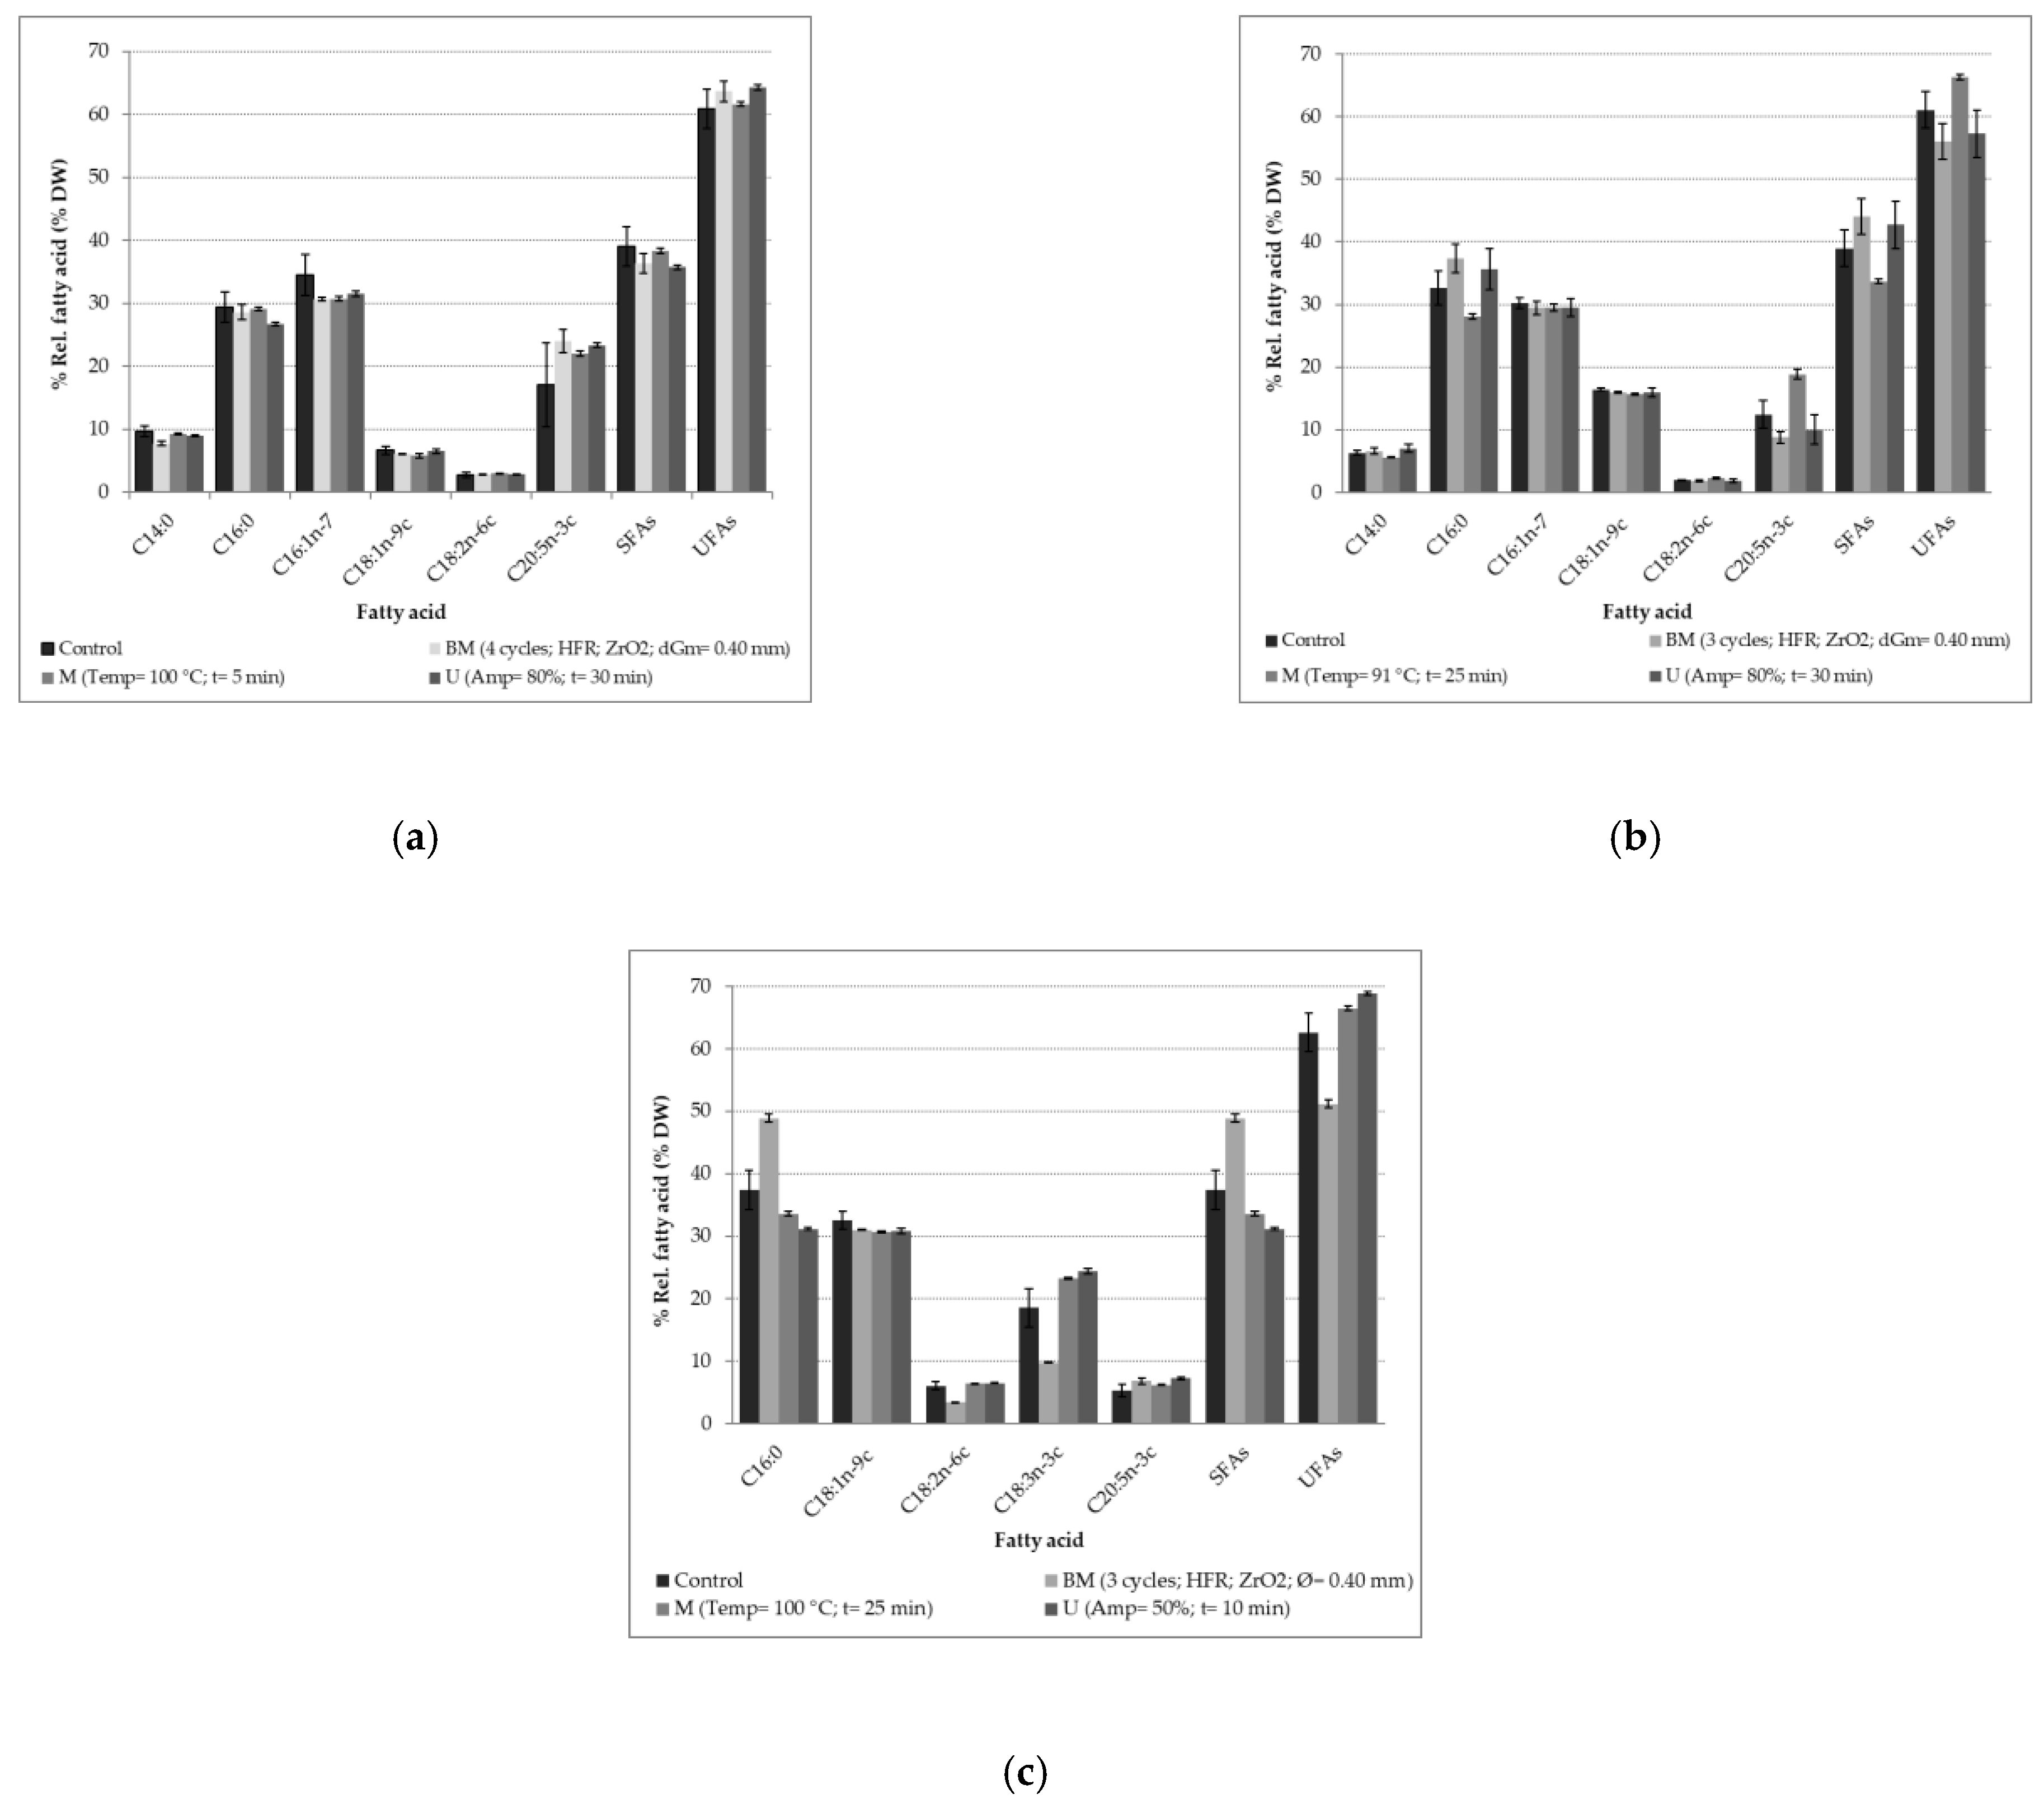
Figure 5 presents the FAP obtained for the two strains of
Nannochloropsis and for
T. suecica in optimized conditions with bead milling, microwave and ultrasound processes.
Lipids extracted from
N. gaditana are constituted of six FAs whatever the disruption process used (
Figure 5a). Two Saturated Fatty Acids (SFAs-C14:0; C16:0), two mono-unsaturated fatty acids (MUFAs: C16:1-7; C18:1n-9c) and two poly-unsaturated fatty acids (PUFAs: C18:2n-6c; C20:5n-3c) were found.
Similar findings on the FAP have been reported by several authors on both
N. gaditana and other species of the genus
Nannochloropsis. The main FAs found in these studies are C16:0, C16:1-7 and C20:5n-3c [
33,
35,
36,
37,
38]. According to the results of an ANOVA, no significant differences are noticed on the content of the 6 FAs between the control and the samples obtained after the disruption processes. FAP does not, therefore, provide information allowing us to favor one of the three disruption methods studied. The potential applications for this microalga could be the production of biodiesel due to its high content in SFAs (around 40%) or the use as food supplements due to a high proportion of EPA (around 20%).
For
N. oceanica, the same FAs were found as for
N. gaditana but in different proportions (
Figure 5b). This indicates that the quantities of FAs found in the genus
Nannochloropsis can vary across its different strains [
39]. Depending on the disruption process used, significant variations in the palmitic acid (C16: 0) and EPA (C20: 5n-3c) ratios were observed. Palmitic acid is extracted in larger quantities when using bead milling or ultrasound as disruption process, increasing the proportion of SFAs in the extract. The disruption of the internal organelles containing the SFAs was favored by these to processes. Concerning the microwave process, the palmitic acid content obtained is lower than that of the control. Regarding EPA, its content decreases after a bead milling treatment while it increases after a microwave process. The ultrasound process results in the same EPA content as the control.
Thus, for biodiesel application, where lipids with a large amount of SFAs are sought as they provide low viscosity and better quality to biodiesel [
40], bead milling and ultrasound will be recommended as disruption process. Concerning other applications, the microwave process will be used to improve the nutritional quality of the lipids thanks to a higher quantity of EPA. However, it should be considered that on an industrial scale, the lipid extraction process can be performed with other solvents and composition of the fatty acids can be modified.
The FAP of
T. suecica differs from that of
N. gaditana and
N. oceanica (
Figure 5c). Most FAs are SFAs for the genus
Nannochloropsis, while for
T. suecica, the UFAs are present in larger quantities. Indeed, linolenic acid (ALA-C18:3n-3c) in higher proportions as well as the absence of the myristic acid (C14:0) were observed. In addition, a higher proportion of about 30% of oleic acid (C18:1n-9c) is noticed.
Variations on the FAP were observed according to the disruption technology applied. The SFA C16:0 is found in high proportion in suspensions treated with bead milling. A decrease of the proportion of the linoleic acid (LA-C18:2n-6c) and the linolenic acid (ALA-C18:3n-3c) is also observed with bead milling process. These results suggest that bead milling process could be an appropriate method to release lipids from T. suecica for biodiesel applications, due to the high proportion of palmitic (C16:0), oleic (C18:1n-9c), and linolenic (ALA-C18:3n-3c) FAs. Concerning the microwave- and ultrasound-assisted processes, as they favor the release of UFAs, they should be used if the lipids are intended for nutraceutical, cosmetic or pharmaceutical applications.
In conclusion, these results show that the effect of the three disruption processes is different on the microalgae cells. Bead milling is assumed to breakdown the internal organelles of energy reserve containing the SFAs, while microwaves and ultrasound would destroy the cell membranes, thus releasing the polar FAs characteristics of this structure.
The field of application can also be a constraint. For instance, for biodiesel applications, a higher proportion of SFAs than UFAS will be preferred. In this case, for
T. suecica, it would be recommended to apply bead milling despite the significant energy consumption (
Section 3.5). Indeed, with bead milling, 20% more of SFAs are released compared to the ultrasound treatment. For nutritional applications where significant proportions of UFAs are sought, ultrasound assisted process is the most interesting except for
N. oceanica. Indeed, microwaves can increase the proportion of UFAs by 9% compared ultrasound.
3.5. Evaluation of the Energy Consumption for the Cell Disruption Processes
The choice of the most suitable disruption process for lipid recovery will not be based solely on the
TLE but also on an energy criterion. This criterion is the specific energy consumption (SEC) and corresponds to the total electricity requirements according to the lipids extracted in kWh/g lipids. The SEC and the
TLE are presented in
Figure 6 according to the microalgae studied and the disturbance process. The operating conditions of the disruption processes used for the calculations are those determined previously.
Among the three disruption processes tested, the bead milling is the most energy-consuming process. For N. gaditana and T. suecica, the lipid yields are less than 20% and induce SECs of 0.73 and 0.77 kWh.g−1 lipids, respectively. For N. oceanica, the energy consumption is lower since a greater amount of lipids has been recovered (42.9%DW, 3 and 14 times higher than that of N. gaditana and T. suecica.) with a corresponding SEC equal to 0.23 kWh.g−1 lipids.
Concerning the ultrasound process, the SEC is lower than for the bead milling for a same level of extracted lipids. A critical parameter for the SEC of the ultrasound process is the treatment time. Indeed, despite a low TLE of 10.9%DW, the lowest SEC (0.06 kWh.g−1 lipids) corresponds to the lowest sonication time (10 min for T. suecica). For N. gaditana and N. oceanica, the treatment time is 30 min with a same amplitude. The SEC of N. oceanica (0.09 kWh.g−1 lipids) is less than this of N. gaditana (0.18 kWh.g−1 lipids) due to a very high value of TLE for N. oceanica (45.4%DW) in comparison of this of N. gaditana (21.7%DW).
Considering N. gaditana, for which the TLE is the same for the two processes, the SECs obtained for the microwave process are lower than that of the bead milling one. On the contrary, comparing the SECs between ultrasound and microwave processes is difficult as it depends on the percentage of lipids extracted. Despite a different microwave application time, identical SEC values were obtained for N. oceanica and N. gaditana. The increase in SEC generated by a long treatment time can be offset by a high level of extracted lipids. Thus, for N. gaditana, microwaves were applied 5 min to obtain 17.7%DW of lipids, the SEC corresponding is equal to 0.15 kWh.g−1 lipids. For N. oceanica, the application time is 25 min and the TLE 49%DW, the SEC determined is equal to 0.16 kWh.g−1 lipids.
The most suitable disruption process for each microalga can be determined according to the objective set. To maximize lipid content, a treatment by ultrasound will be recommended only for N. gaditana. For N. oceanica, the highest TLE is obtained with a microwave treatment. For T. suecica, the bead milling will be the preferred extraction process. However, in a context of sustainable development, a compromise will have to be made between the lipid content and energy consumption. Under such consideration, the bead milling process is no longer competitive with the other two processes. The microwave process will be recommended for N. gaditana and an ultrasound process will be chosen for T. suecica and N. oceanica


 ,
, 


