Article

Intensification of a Neutralization Process for Waste Generated from Ion Exchange Regeneration for Expansion of a Chemical Manufacturing Facility

1
Engineering and Technology, Americas, Bayer U.S. LLC., Creve Coeur, MO 63141, USA
2
Worley Group Inc., Baton Rouge, LA 70809-3433, USA
3
Cain Department of Chemical Engineering, Louisiana State University, Baton Rouge, LA 70803, USA
4
Department of Chemical and Biomolecular Engineering, Ohio University, Athens, OH 45701, USA
*
Author to whom correspondence should be addressed.
Submission received: 6 June 2021 / Revised: 20 July 2021 / Accepted: 20 July 2021 / Published: 25 July 2021
(This article belongs to the Special Issue Advances in Water and Wastewater Treatment Processes)

Abstract

:
Waste generated during regeneration of Ion Exchanger (IX), used for deionizing water, needs to be neutralized before it can be discharged back to a clean water source. An efficient and novel process is disclosed that minimizes the neutralization volume and chemicals required for pH adjustment. The currently employed neutralization setups in the industry are environmentally unsustainable. Various neutralization setups were studied for treating waste generated from IX regeneration. From the collected plant data, the treatment requirements of waste streams generated during regeneration of IX beds were analyzed. An efficient neutralization setup was developed to lower the operating and capital costs by eliminating the need of some equipment and by lowering the neutralization volume. The new process results in considerable savings compared to currently used processes in the industry and is environmentally benign. The improved neutralization setup proposed in this work has achieved a 63% reduction in volume of IX regeneration waste stream; a 62% reduction in the capital cost; 23% reduction in chemical usage; and a 55% reduction in operating cost. The achieved improvements are quite significant, which are bound to immensely benefit the chemical industries that require demineralized water for their operation.

1. Introduction

Demineralized water is required in almost all chemical manufacturing facilities either to produce steam or for process operations. If the water used in the boilers is not demineralized, it can cause scaling and eventually damage boiler tubes [1,2]. Demineralization process uses ion-exchange (IX) technology which primarily removes dissolved mineral solids [3]. IX beds consist of a cation and an anion resin bed. IX resin comprise of ionic functional groups, like Na+ and Cl supported on organic polymeric beads [4,5,6]. These functional groups have an affinity for ions of opposite charge in the liquid stream. IX reaction involves replacement of contaminant ions from the stream with either H+ or OH ions, as shown in Equations (1) and (2). The cation resin bed removes cations, such as manganese (Mn2+), magnesium (Mg2+), potassium (K+), calcium (Ca2+), and iron (Fe3+) from the water. The anion resin bed removes anions like carbonates (CO32−, HCO3), sulfate (SO42−), nitrate (NO3−), and chloride (Cl). Examples of IX reactions are shown below, where R represents polymeric IX beads
R-H+ + Cation (Ca2+) → R-Ca2+ + Soft Water (H+)
R-OH + Anion (Cl) → R-Cl + Soft Water (OH)
A twin bed IX system, which consists of a column packed with cation resins and a column packed with anion resins, is commonly used to achieve moderate quality of demineralization of water. The twin bed is regenerated using brine [6]. During the regeneration step, Ca2+ or Na+ ions attached to the cation resin bed are replaced with the H+ ions from H2SO4 resulting in formation of CaSO4 or Na2SO4 in the waste stream. Similarly, Cl or NO3 ions attached to the anion bed are replaced by OH ions from NaOH to form NaCl or NaNO3 wastewater stream. Regeneration reactions of IX beds are shown in Equations (3) and (4). The process of regeneration creates basic and acidic waste stream that needs to be treated before disposal. The waste stream is collected in a tank and neutralized with acid and base chemicals to reach a desired pH before disposing the neutralized waste.
R-Ca2+ + H2SO4 → R-H+ + Waste water (SO42−)
R-Cl + NaOH → R-OH + Waste water (Cl)
The conventional regeneration step produces large quantities of neutralization waste volume which requires large quantity of chemical to adjust the pH and also larger volumes of reactors for the process. The large volume of waste stream takes longer neutralization time. Furthermore, inefficient mixing in large volumes cause fluctuations in pH adjustments. In the specific industrial project that the authors were involved in, expansion of existing IX process was nearly impossible due to space limitations for the conventional neutralization process in the current facility [7]. Therefore, there was a need to optimize the neutralization methodology so that larger volumes can be handled without significant requirements of space, increases in costs, and volume of waste streams. There is a great need for debottlenecking methods and optimization of existing neutralization setups in the industry that have not been addressed as yet [8,9,10,11].
This paper reports a novel approach that was developed for improving the economic efficiency and environmental friendliness of the regeneration process via IX beds. The new approach is based on the idea that the waste streams from the cation and anion regeneration that were strong in acid and base concentrations can be used to self-neutralize themselves and then their pH can be finely adjusted to the desired levels of 6–8 pH required by state regulations. The overall quantities of acid or caustic needed for neutralization are reduced. In this paper, different neutralization processes are discussed, and the most efficient process is identified. To our knowledge, the cost-effective neutralization process discussed in this work has not been reported before. We consider that our approach fills an important research gap in designing an efficient neutralization process for IX regeneration streams.
Parameters such as inefficient mixing, long neutralization time, excessive volume of IX regeneration streams, and their environmental impact [12,13,14,15] are the main drivers of this research. By reducing the neutralization volume, other associated problems, such as inefficient mixing and long neutralization time, also gets addressed effectively. This work presents an analysis of various IX regeneration waste streams to come up with an efficient and cost-effective way of selecting and treating the selected waste streams to achieve an improved neutralization process. Additionally, a more environmentally friendly setup is proposed by reducing the quantity of acid and base required and changing the neutralization setup from below ground to above ground. The selected streams also enable quicker and easier neutralization thereby reducing the time required for neutralizing the waste streams.
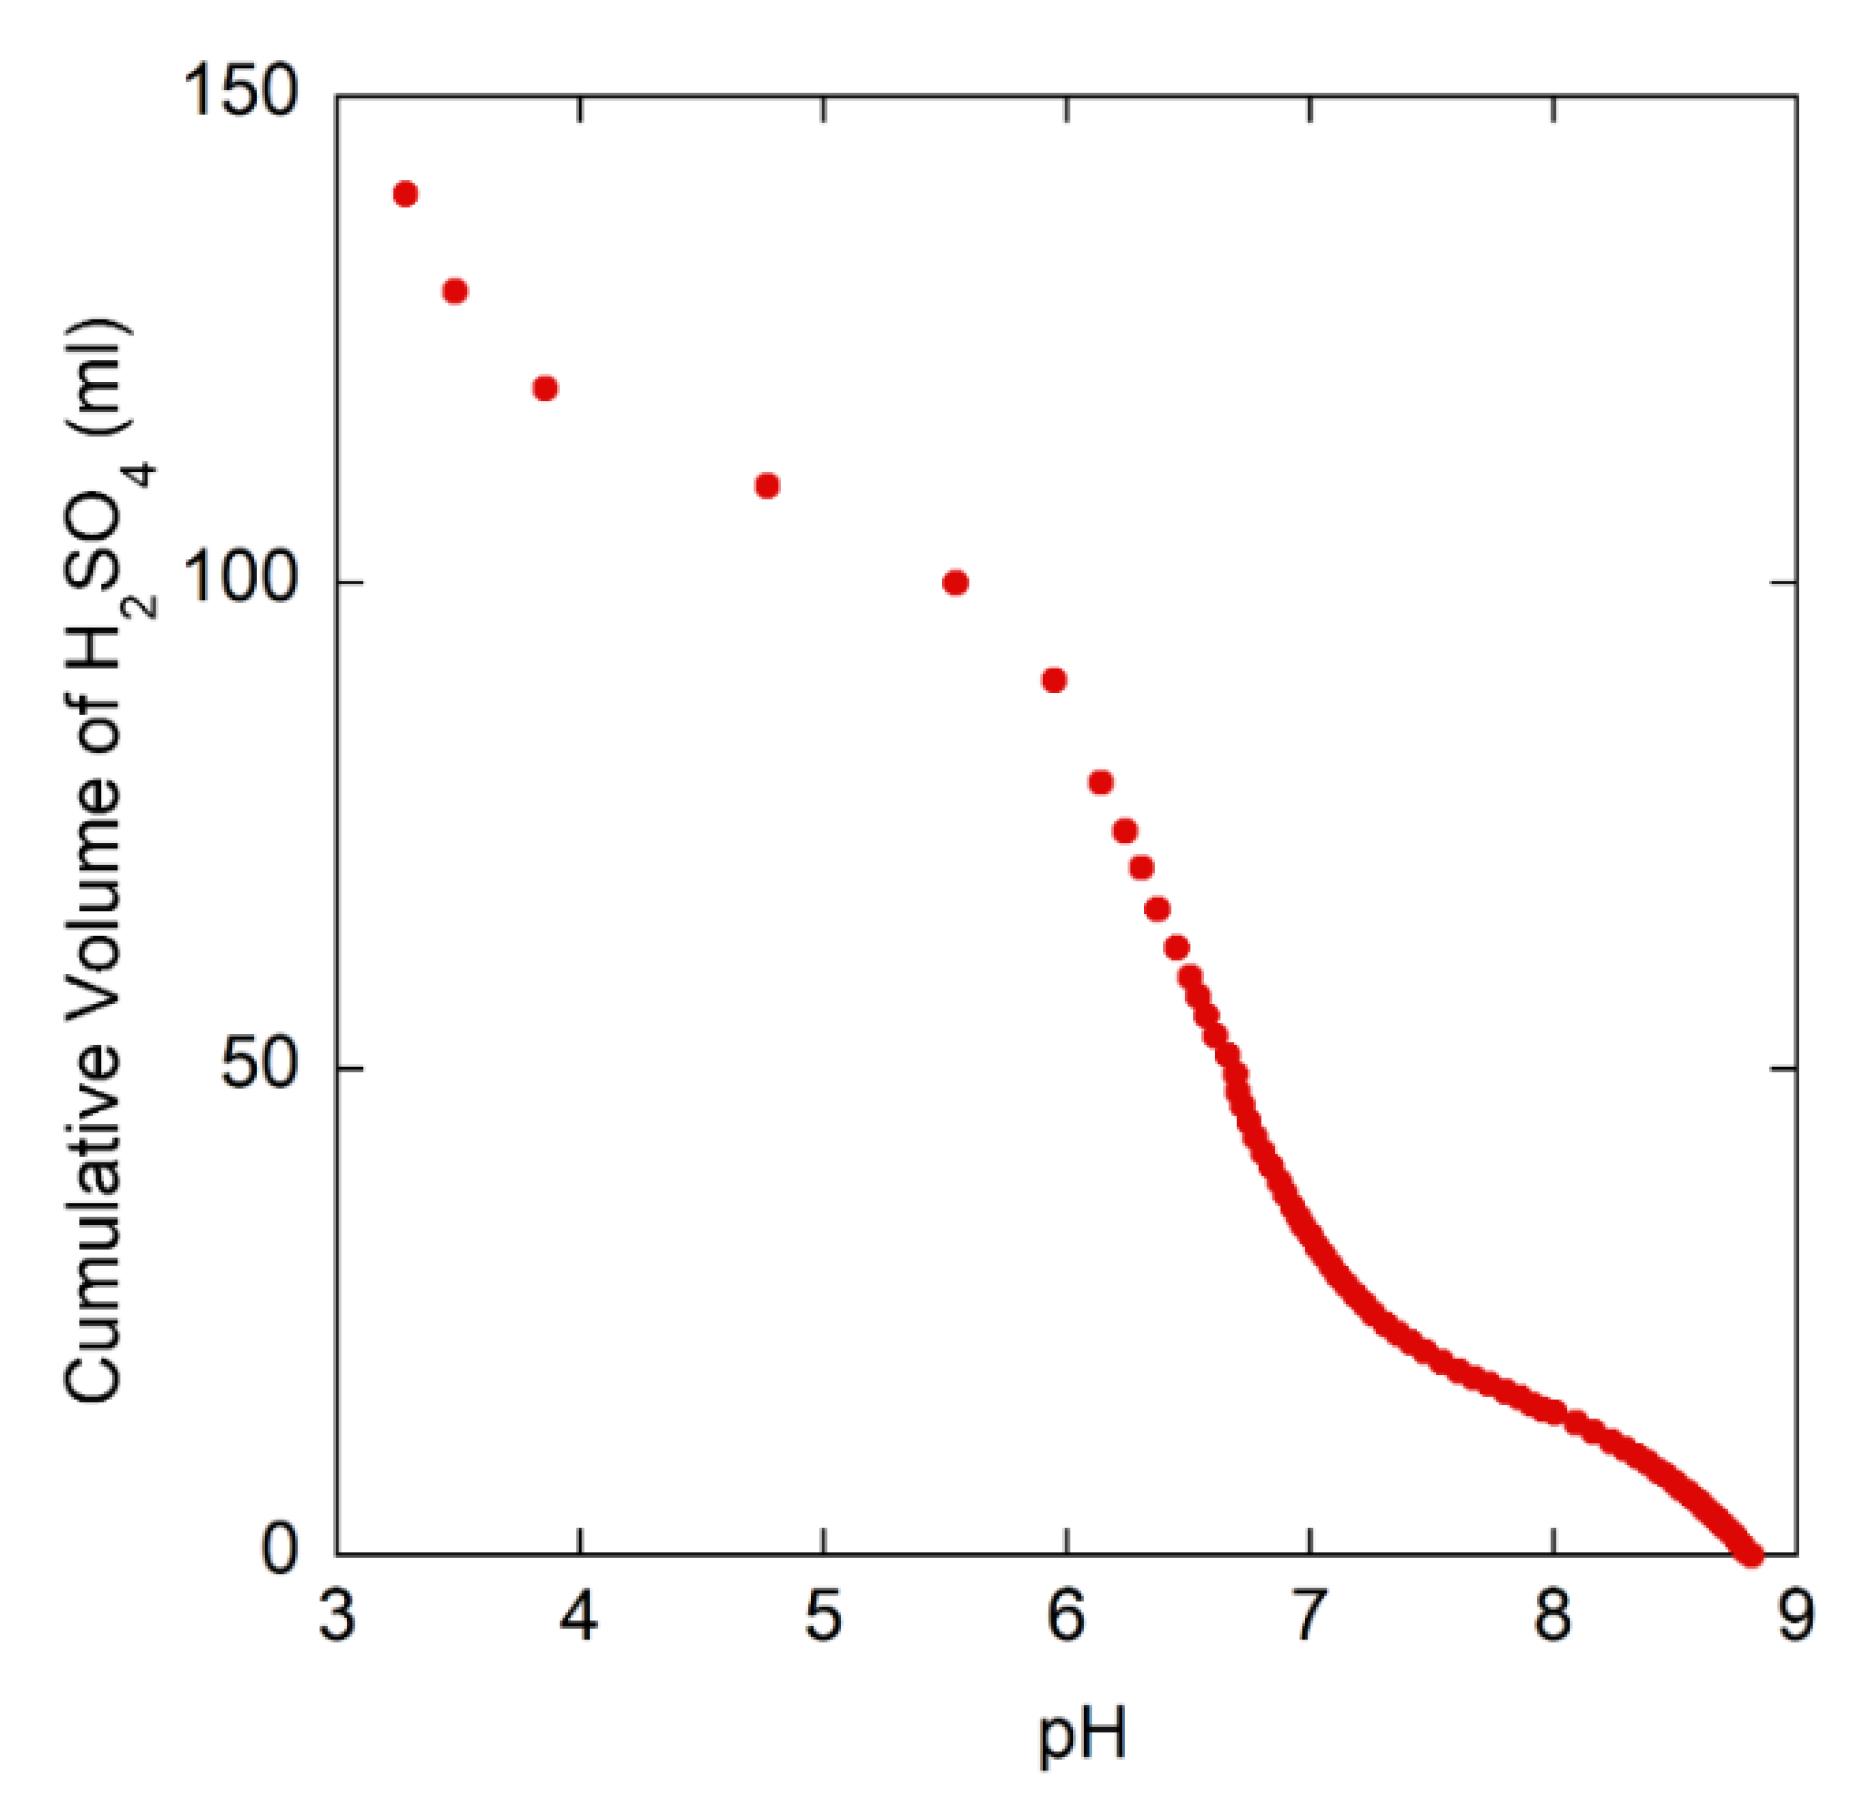
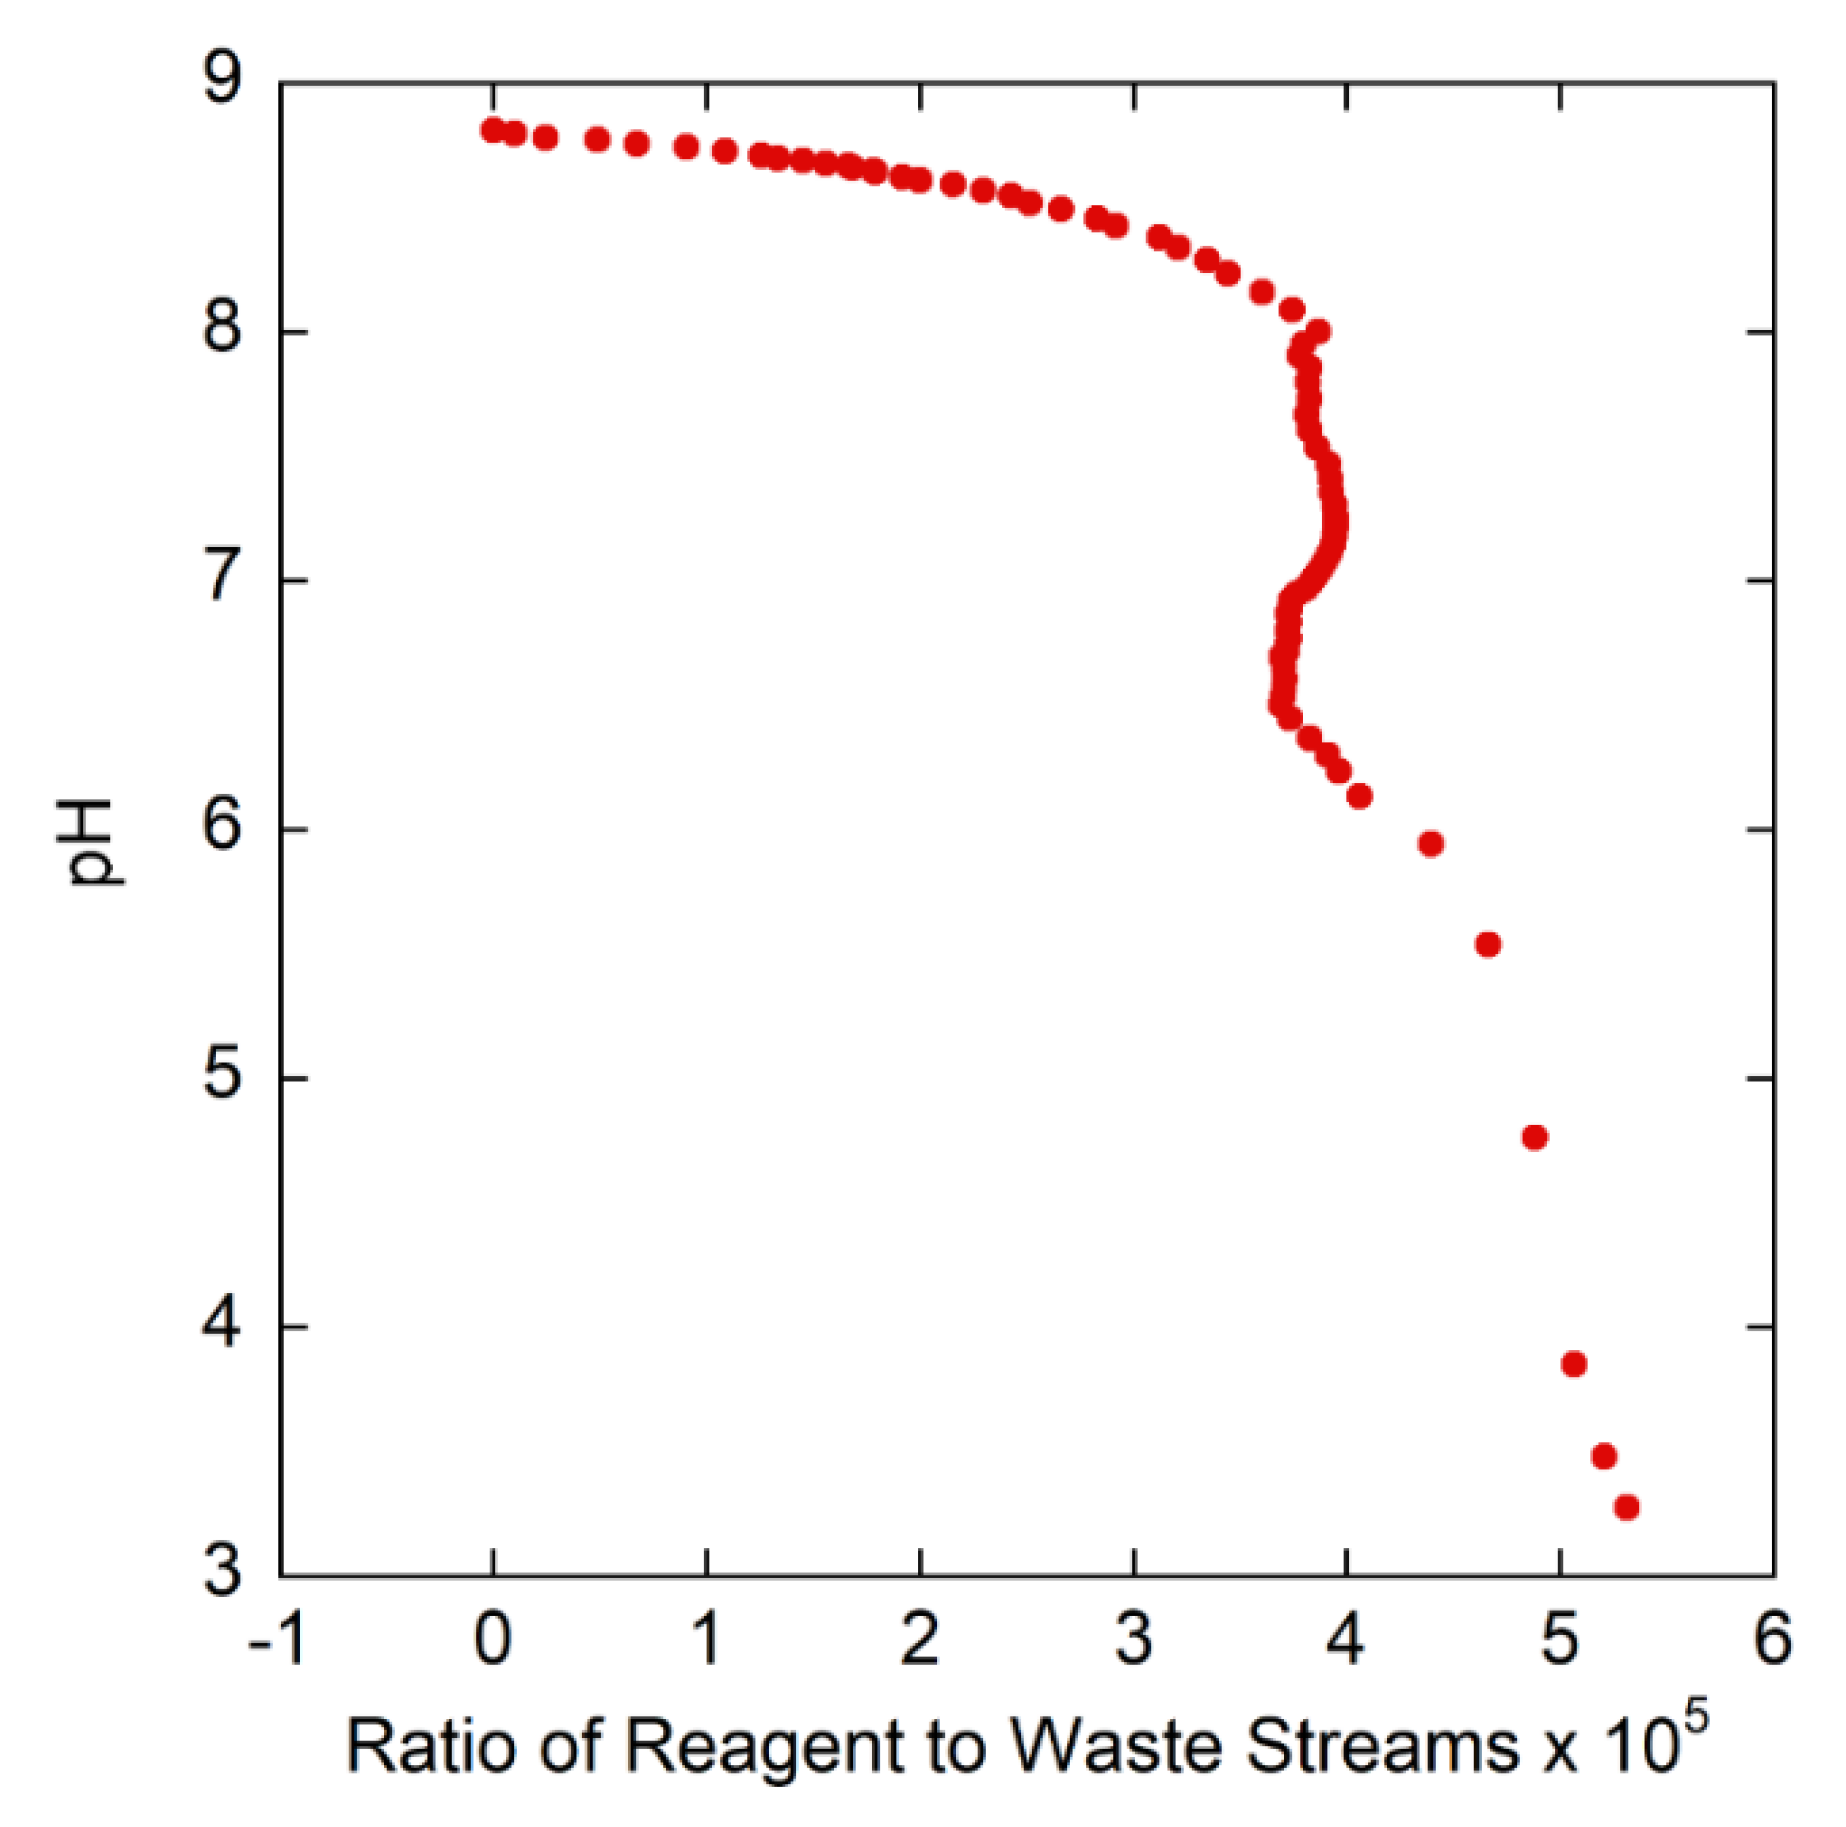
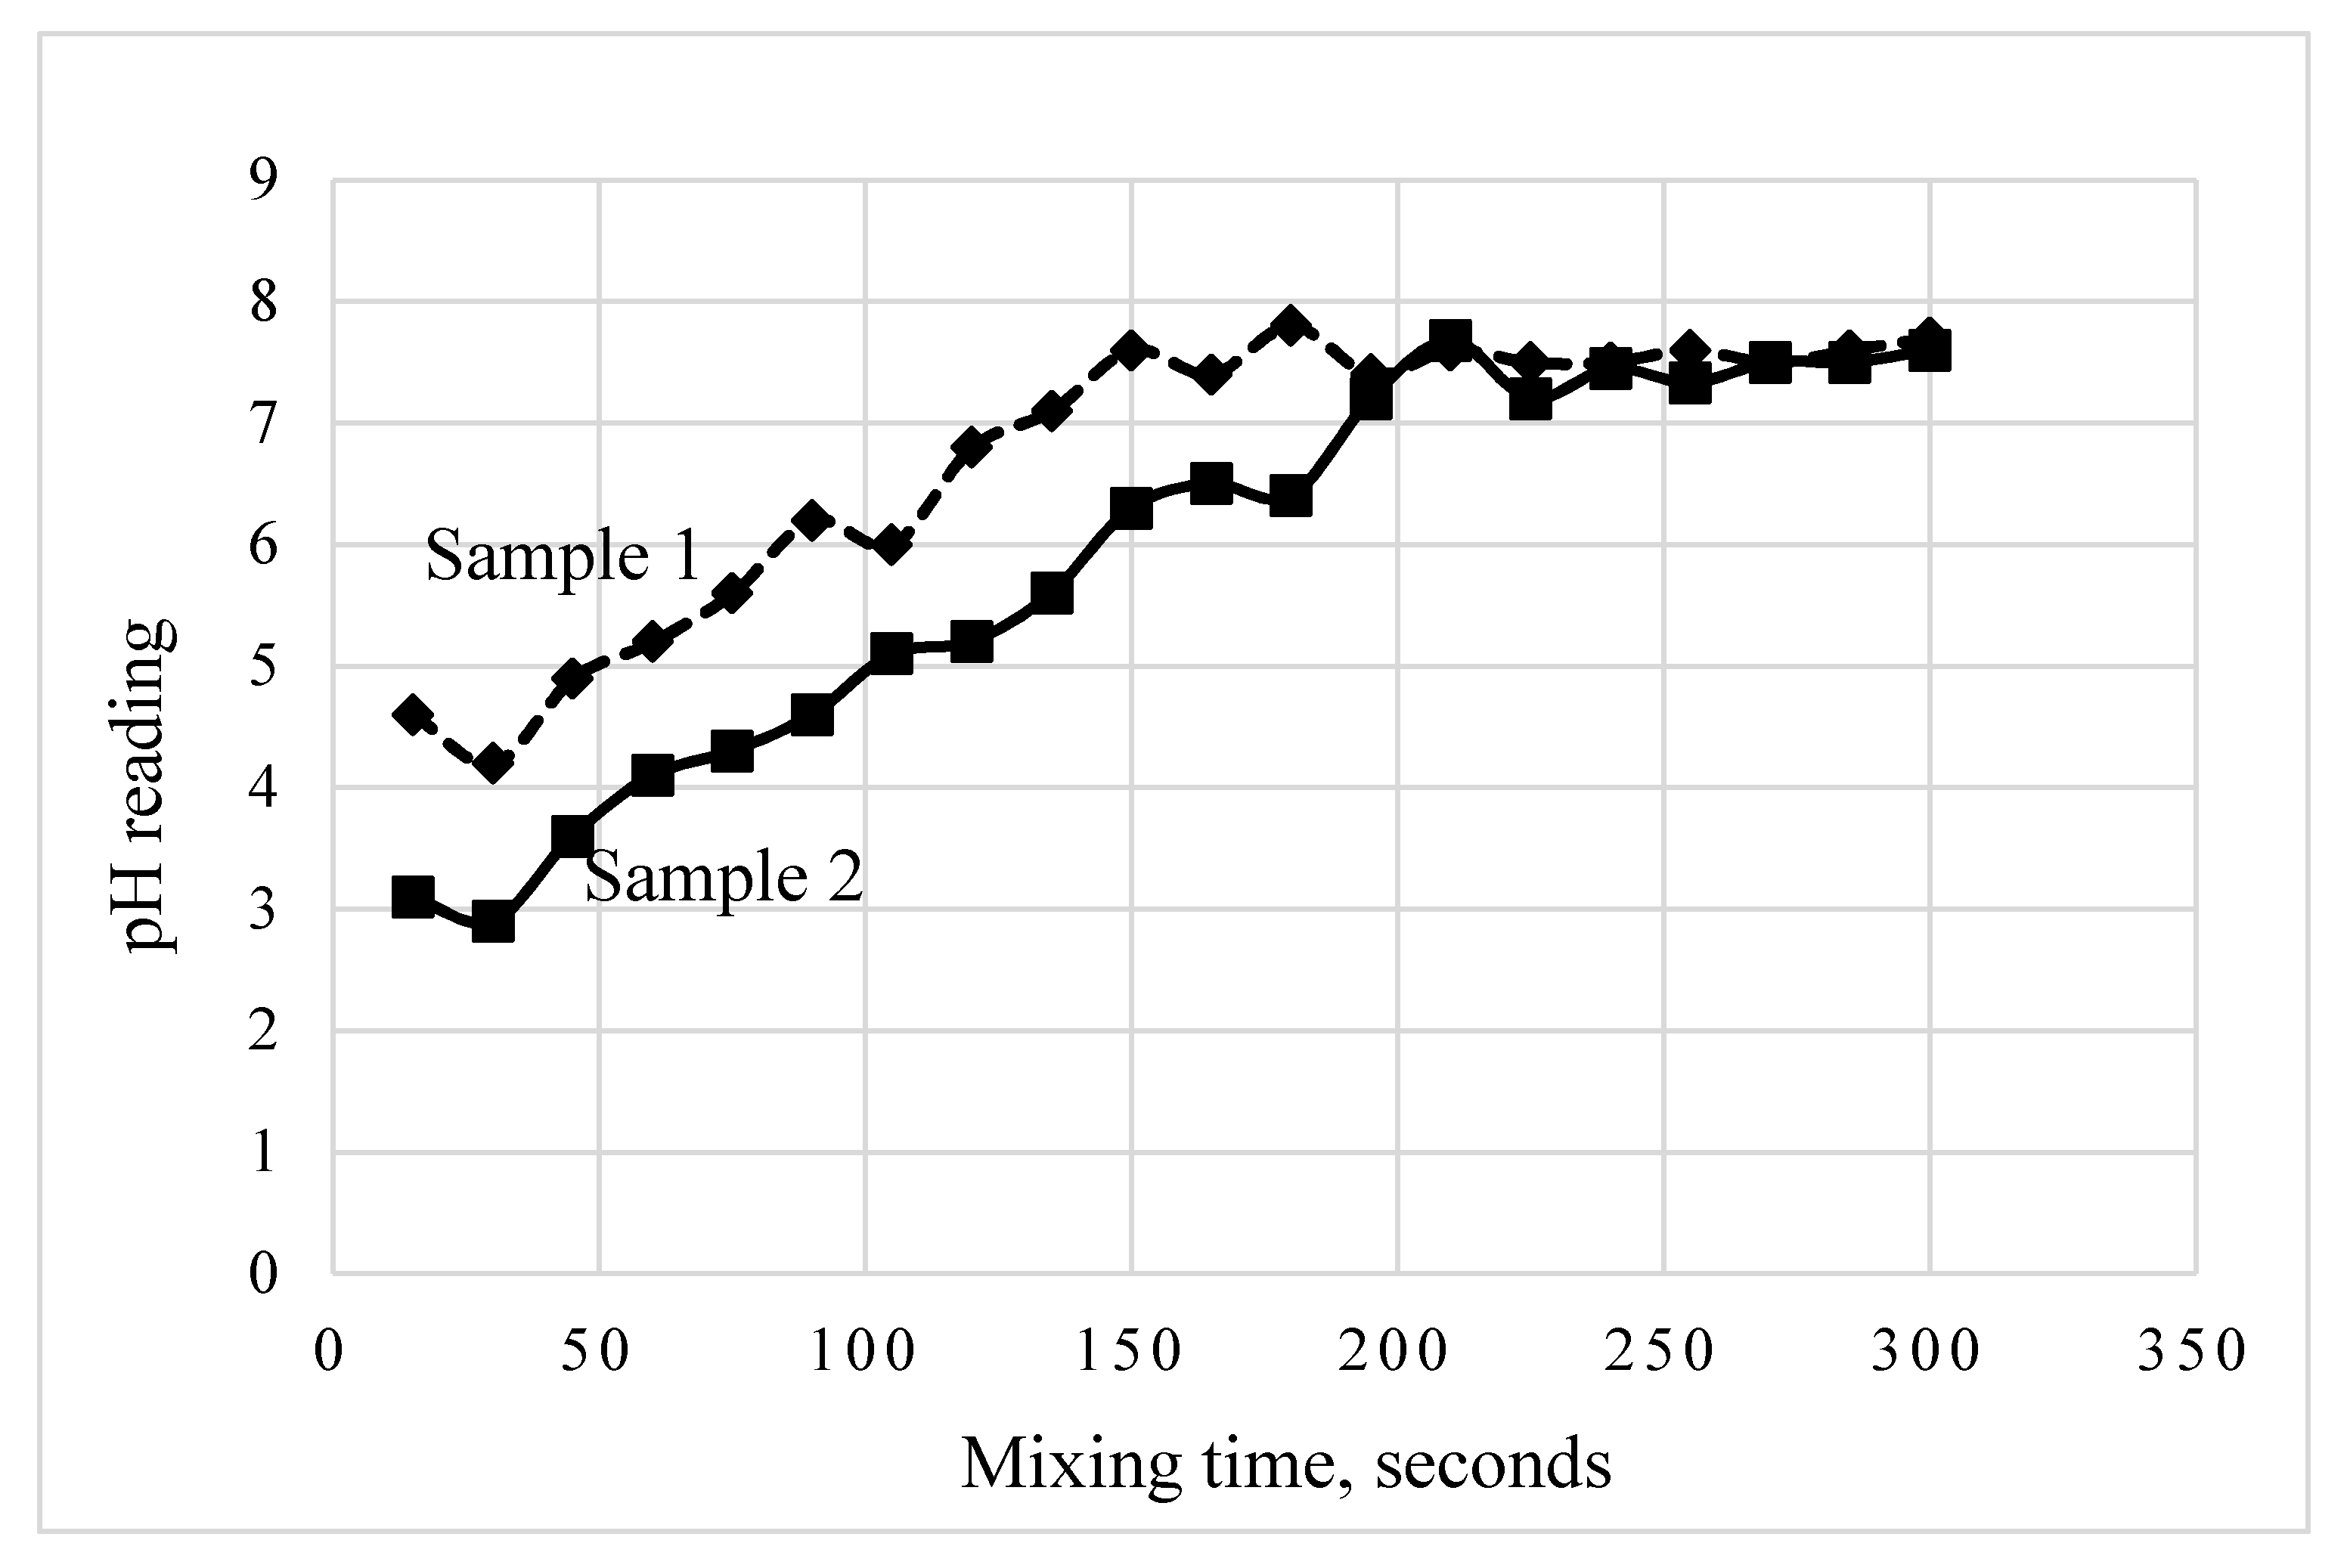
By picking selective regeneration streams, efficient designing of acid and caustic controls, and pH measurement, the overall quantities of acid and caustic needed for the neutralization process was reduced. Efficient mixing of the IX regeneration waste streams is difficult to achieve as has been discussed previously. As per the prior works [16,17,18], a small addition of alkaline reagent to dilute streams can result in a large change in pH, and so it is easy to overshoot or undershoot the desired pH value while neutralizing waste streams, if proper mixing is not achieved.
In the industrial project executed by the authors, the existing below ground neutralization pit was limited by volume, and so several above ground neutralization setups were studied.

2. Methods and Processes Used

2.1. Existing Regeneration and Neutralization System

In the existing system, the regeneration streams from the cation and anion beds are directed to a below ground neutralization pit for treatment with concentrated streams of acid or base to adjust the pH in the range of 6–8. The total combined volume of waste generated during regeneration of the cation and anion bed assembly is roughly 193 m3 /h. The below ground pit of the existing neutralization setup had an effective volume of 71.92 m3. Since the volume of the pit is smaller than the volume of the IX regeneration effluent the neutralization setup had to be halted to process the effluent streams. This added considerable time to the overall process and reduced IX generation capacity. The neutralized waste from the pit is pumped to an outfall after pH adjustments. This neutralization is done in one step with mixing achieved by air sparging in the pit. Control valves are used to control the acid/base flows to this pit depending on the pH set point.

2.2. Neutralization Waste Volume Optimization

Regeneration of cation and anion beds in the new neutralization process involves several steps as shown in Table 1. For the cation bed, 2% regeneration, 5% regeneration, and slow rinse steps utilize an acidic chemical and other steps such as backwash and fast rinse consist of water as inlet. For the anion bed, 5% regeneration and slow rinse steps utilize a basic chemical and other steps such as warm up, backwash, and fast rinse use water. In the conventional neutralization setup, all the streams shown in Table 1 are directed to a neutralization setup for neutralization before sending back to freshwater source. While optimizing the neutralization setup it was decided to analyze each of the streams shown in Table 1. pH measurement of the below streams from cation and anion beds was performed and was found to be near neutral. These streams are designated as dilute streams.
  • Cation backwash
  • Cation fast rinse
  • Anion warmup
  • Anion backwash
  • Anion fast rinse
pH measurement of the below streams showed high concentration of acid or base suggesting the need for neutralization. These streams are designated as concentrated streams:
  • Cation 2% Acid Regen
  • Cation 5% Acid Regen
  • Cation Slow Rinse
  • Anion 5% Base Regen
  • Anion Slow Rinse
During the regeneration cycle, it is proposed that dilute regeneration streams are not required to be directed to a neutralization setup and can be sent to a common outfall which is monitored closely before sending to a ditch. The ditch is directed to the original water source. Based on analysis of the effluent streams, it was decided to send the concentrated streams for waste treatment in the proposed neutralization setup.
Based on this evaluation the volume of waste stream that required neutralization was reduced from 193 m3/h to 71.92 m3/h by removing the processing requirement of the dilute streams. This is a 62% reduction in waste stream that required treatment.

2.3. Chemicals Used in the Regeneration Process

Existing cation and anion bed exchangers run in series to remove cations and anions from a water stream to produce deionized water. When the resins within the exchangers are saturated with ions, the system needs to be regenerated. To regenerate the system, a flow of 2% H2SO4 and 5% H2SO4 by weight solution is run through the cation bed and a 5% by weight NaOH solution is run through anion bed. The effluent from the regeneration is sent to neutralization process.

2.4. Cost Estimation Basis

AspenTech Capital Cost Estimating (ACCE) version 11 software has been used to estimate cost of equipment such as pumps, tanks, and eductors.

2.5. Equipment Power Calculations

The power consumption of equipment such as pumps and agitators is estimated in the ASPEN Hysys version 10 software. All the equipment is assumed to be 70% efficient for the cost comparison purpose.

2.6. Estimation of Cost of Power Required

The cost of horsepower is estimated based on the cost of industrial electricity in gulf coast location, and with the assumption of 8500 h of operation. The estimated costs are compared for the setups provided.
Industrial energy rate = 10.86 cents /kwh
C o s t = 10.86 × p o w e r   i n   k w × 8500 × 0.01 = U S D

2.7. Chemical Usage

The chemical usage for different setups is estimated to get a pH of 7 and based on a simple material balance calculation.

2.8. Description of Various Neutralization Setups

To come up with the optimum design of the neutralization process, we analyzed many alternatives. These are discussed below.

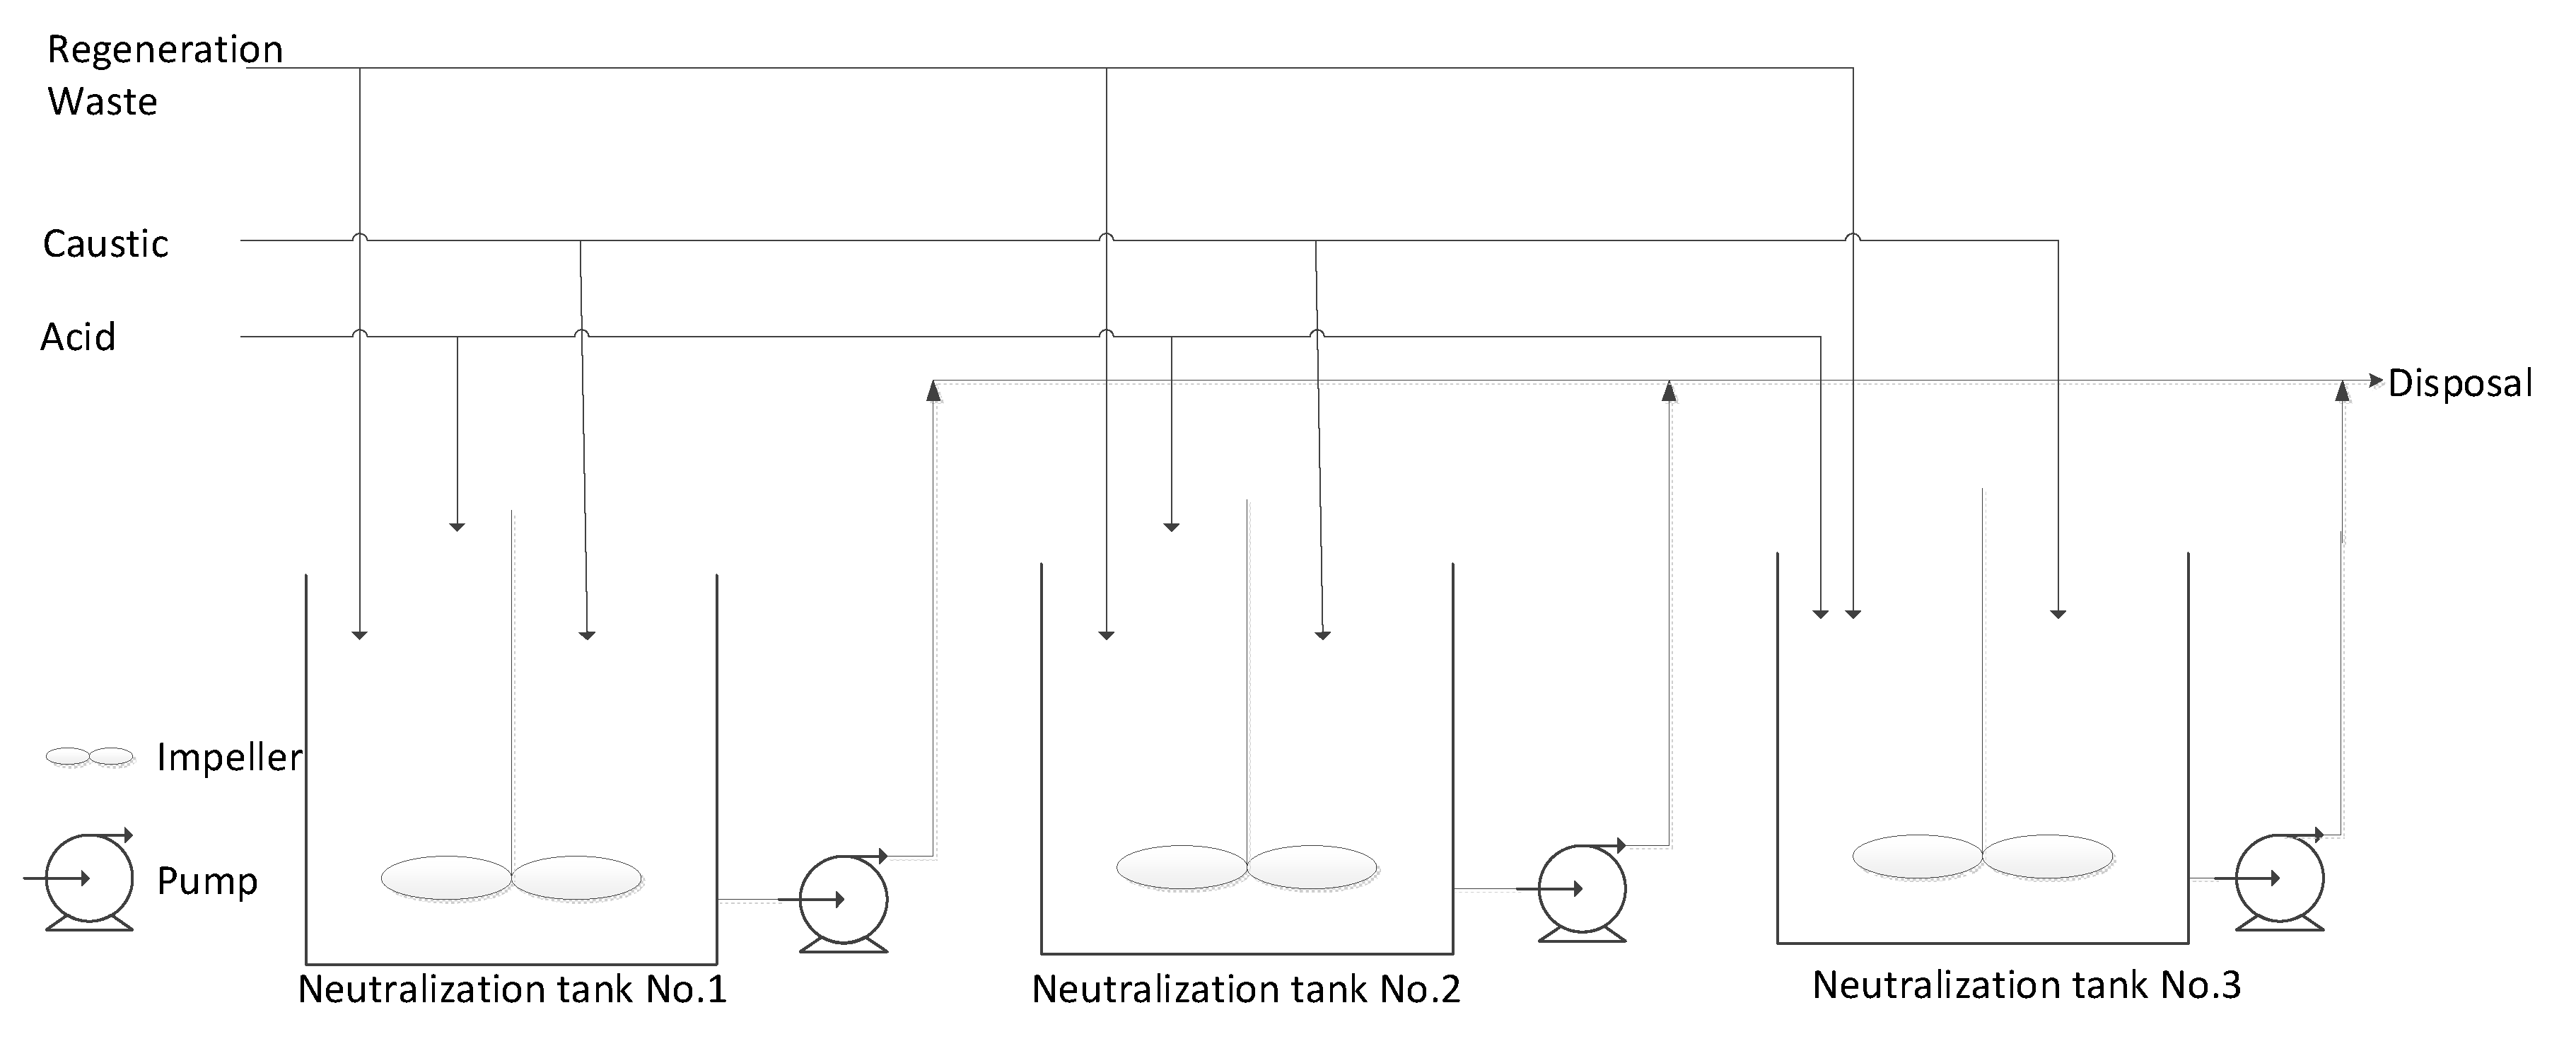
2.8.1. First Neutralization Setup

One of the neutralization setups studied has three 94.64 m3 rubber lined carbon steel neutralization tanks with agitators. Each tank has a pair of pumps to achieve the desired forward flow. Neutralization is performed in each tank in batch mode. To handle 71.92 m3 of neutralized waste from one regeneration, a total volume of 94.64 m3 was chosen to have three regenerations simultaneously plus some overfill margin added. The pump on each tank can pump out either straight to disposal once the neutralization is complete or to the next tank for further tuning of the pH.

2.8.2. Second Neutralization Setup

Considering the high capital and operating cost of the first neutralization setup shown in Figure 1, to replace the existing below ground neutralization pit entirely, a new improved neutralization setup was conceptualized.
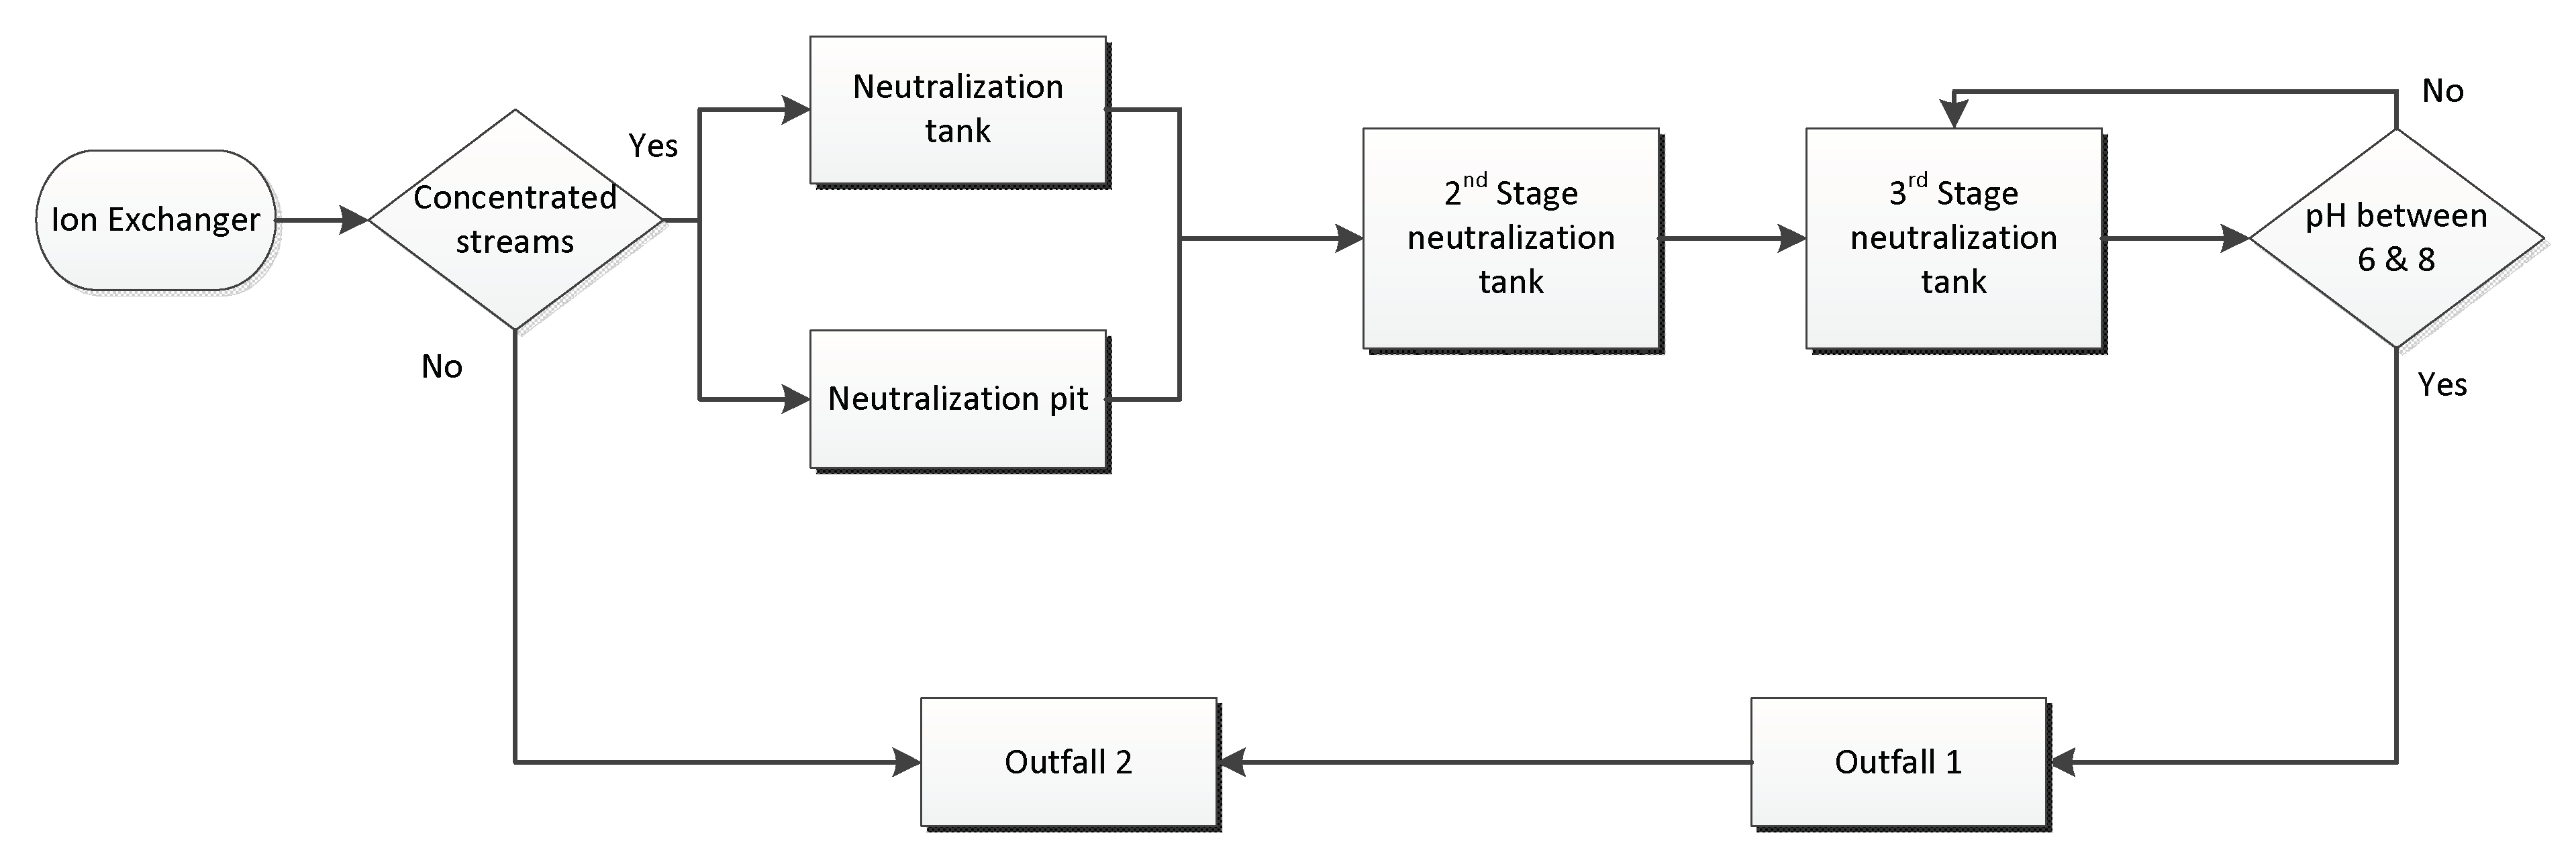
A three-tank system was proposed as shown in Figure 2 with the idea that neutralization can be done in different stages in a continuous fashion. The first stage neutralization tank (new) would have a working volume of 75.71 m3. This would allow for one regeneration cycle to be run and store the entire volume of effluent produced from the concentrated regeneration streams. This first stage neutralization tank would allow for mixing of the strong acid and base effluent streams thereby self-neutralizing the regeneration streams before any further pH adjustment. The tank would be mixed using mixing eductors which saves energy as compared to the agitator assembly described in the first neutralization setup. The pH would be constantly monitored and once an initial pH range of 3–11 is achieved, the waste stream would be sent to the second stage neutralization tank. The first stage neutralization tank would allow for any crude adjustment of the pH with metering pumps. Once the desired pH is achieved in the first stage neutralization tank, the contents from the first stage storage will be sent to the second stage. Proper monitoring of the pH of the first stage is necessary to ensure that effluent flow from first stage does not overwhelm the second and third stage tanks as their volumes are much smaller.
The second stage neutralization tank would have a working volume of 2.71 m3. The tank would be mixed using eductors with a constant forward flow. The pH will be monitored constantly using a small slip stream from the recirculating pump. This second stage would adjust the pH to a range of 5–9. The second stage neutralization tank would run with a constant forward flow rate of 79.45 m3/h. The third stage neutralization tank is also run with a constant forward flow rate of 79.45 m3/h. When in the third stage neutralization tank, pH will be controlled in the range of 6–8, a diverter valve would allow the waste stream to exit to the outfall 1 shown in Figure 2. If the pH is outside of the acceptable pH range the diverter valve would send the stream back to the second stage neutralization tank for additional neutralization. Allowable pH ranges for each stage can be adjusted. second and third stage tanks are designed for ~13 min residence time with the eductor’s being sized to turn over the 22.71 m3 volume six times per hour. The pH adjustment would be handled by a metering pump to allow for fine pH adjustments. All pH adjustment chemicals (acid or base) would be introduced to the eductor streams to aid in effective mixing of the process fluid with the acid or base. Addition of the acid or base needed for neutralization would be done via injection quill. All the tanks would be Fiber Reinforced Plastic (FRP) with resin liners to withstand the high range of pH encountered.

2.8.3. Improved Neutralization Setup

An improved neutralization setup is proposed during the evaluation of the neutralization setup. In order to optimize the function of the neutralization pit, it was proposed to direct the dilute streams from the cation and anion IX beds directly to outfall 2 that does not need to be pH adjusted, thereby reducing the volume of waste streams that need to be processed in the neutralization tanks. It was found that directing the dilute regeneration streams to the outfall would not alter the composition of the outfall 2. Outfall 2 is monitored by the site before it can be returned to the original water source. Keeping this in mind, an improved neutralization setup is proposed. In this setup, a single tank with a working volume of 75.71 m3 is proposed to handle all the concentrated waste streams. To increase the reliability of the system two pumps each with a design flow rate of 181.6 m3/hr were installed for recirculation and feeding forward as shown in Figure 3. To ensure proper mixing in the tank two eductors are designed to achieve 24 tank volume turnaround every hour to achieve the desired mixing.

2.9. Ensuring Redundancy

For the demineralization system it is desired to have flexibility to run two regeneration cycles simultaneously. For reliability reasons the two neutralization setups should be independent of each other such that if one is under maintenance one neutralization can still be performed. When running two cycles, the maximum effluent volume increases to ~151.42 m3 with a maximum effluent inflow of 122.58 m3/hr occurring during the 2% acid regen and the 5% base regen for 27.5 min. In the event that the entire effluent volume would need to be held for neutralization the existing neutralization pit would need to be used in conjunction with the new tank to achieve redundancy. This would then proceed to be neutralized in the above prescribed manner. In the event that either the existing neutralization pit or the new first stage neutralization tank is down, only one regeneration cycle can be performed to allow for possible upsets in the neutralization process. If the existing pit is not to be used and two regeneration cycles are desired the first stage neutralization tank can be designed to handle 151.42 m3 neutralization waste.

3. Results and Discussions

3.1. Existing Neutralization Pit

The existing below ground neutralization pit is inefficient as it is a one-step neutralization process with inefficient mixing leading to poor pH control. The poor controls and inefficient mixing make it hard to achieve the desired pH with overshooting or undershooting upon addition of too much acid or base. In addition to that, simple air sparging in the pit is inefficient for adequate mixing. Moreover, the incoming regeneration waste volume is higher than the actual working capacity of the pit. Since the volume of neutralization waste is greater than the volume of the neutralization pit the process is very inefficient as one needs to halt neutralization till the pit is made available. All this cause bottlenecks in the system when the pH is outside the range allowed for discharge to the ditch. This system does not allow for the fine adjustment of the neutralization flow rate needed to achieve the desired pH range. These bottlenecks required reassessing the waste streams generated and looking into other more efficient waste treatment processes.

3.2. First Neutralization Process

The first neutralization process considered is shown in Figure 1. This setup has a large capital cost due to the number of tanks and pumps required along with agitators in the tanks. The operating cost of this setup is also high. This setup required 3, 94.63 m3 tanks, 3 agitators, 12 pumps and other ancillary equipment’s and piping. Along with the high operating cost the system also had poor reliability. If one of the tanks is down for maintenance, then the entire neutralization waste management must be halted. There were a lot of opportunities to optimize the setup. Further studies were done to find a more efficient solution.

3.3. Second Neutralization Setup

Considering the bottlenecks with the process depicted in Figure 1, a second neutralization setup was conceptualized to reduce the capital cost of the setup by eliminating agitators and reducing the size of subsequent tanks. Even though the capital cost of the second setup is less than the cost of the first setup (Table 2), it still had the same downside as the first setup of halting the neutralization in case any single tank in series required maintenance.

3.4. Improved Neutralization Setup

The improved neutralization setup required extensive research and testing of the individual waste streams and involvement of the environmental group to evaluate which streams needed extensive waste treatment and which streams could be sent to an outfall which does not require any waste treatment and are tested regularly for compliance reasons.
Lab experiments were performed in which the dilute streams from cation backwash, cation fast rise, anion warmup, anion backwash, and anion fast rinse were titrated for a pH reading for several batches. The pH readings were found to be between 7–8 which suggests that the dilute streams can be sent to an outfall without needing any pH adjustment. The dilute streams were then directed to the outfall 2 for several months and the measured pH of the outfall was found to stay within the desired range of 7–8 pH as shown by the plant data.
A lab experiment was conducted with 210 mL of concentrated waste streams. The combined stream was agitated and found to equilibrate at 8.8 pH. This experiment was repeated several times and the pH of the final mixture was found to fluctuate between 6.5–9.5. Even though the variation in the pH from the concentrated streams can vary based on the samples collected the key reason for the experiment was to identify the sensitivity of pH to the addition of neutralization chemicals.
The concentrated stream from IX regeneration was further titrated with 0.02 N H2SO4. It was seen that the pH change was pretty sharp between 6–8 pH suggesting the need for effective agitation (see Figure 4 and Figure 5).
The improved setup has a total installed cost saving of almost $2 million over the first neutralization setup discussed (see Table 1). The improved setup also has a very low operating cost as there are not as much electrically driven equipment in the improved setup. The improved setup also safeguards the plant in the event that the above ground tank requires maintenance. With the revised waste streams requiring treatment even the below ground neutralization pit is capable of handling neutralization waste if the above ground tank is down for maintenance. This redundancy along with reduced operating cost due to low power consumption makes this a very efficient and green process to neutralize waste from IX regeneration.
Based on the efficiency of the eductors and turnover rate achieved in the neutralization tank it was seen in experiments that the desired pH can be achieved within 200 s. Figure 6 shows the plot of two samples collected from the concentrated streams and neutralized to reach a steady pH of 7.
As shown in Table 3 the operating cost of running the various neutralization setups is calculated. It was estimated that the improved neutralization setup will save $169,000 in operating cost per year, this correspond to 55% operating cost saving. Seeing the operating cost saving the improved neutralization setup pays for the improvement in a few years of operation. Table 4 shows the chemical usage summary for different setups showing the improving trend in chemical usage for the various setups. The improved neutralization setup requires about 23% less acid and caustic compared with the first setup.

4. Summary and Conclusions

Waste neutralization is an important chemical engineering unit operation that is needed to meet environmental regulation and sustainability. Traditionally, the entire volume of IX regeneration waste is neutralized with the use of agitators and multiple neutralization steps. An improved neutralization setup is described in this work, which is more efficient and cost effective both from cost of operation and capital cost standpoint. Traditional neutralization processes depicted in the first and second setup employed agitators and multiple tanks to achieve effective mixing. Eductors have developed to a point that one can achieve enhanced mixing with very little energy requirement as illustrated in the improved neutralization setup. The improved setup has a total installed cost saving of $2 million over the first neutralization process discussed. The new neutralization setup is an improvement over the traditional demineralized regeneration waste treatment approaches practiced in the industry. All this has been achievable by employing a novel approach identified in this paper to split the effluent streams into concentrated and dilute streams and achieving enhanced mixing in a single vessel with lower energy consumption. The analysis of individual waste streams from the regeneration of IX beds is insightful and can be used by others in the industry to optimize their neutralization waste management. The 63% reduction in volume of IX regeneration waste stream requiring treatment, 62% reduction in the capital cost, 23% reduction in chemical usage, and 55% reduction in operating cost makes the improved neutralization process a unique process which will benefit the chemical industry immensely. These principles are not limited to neutralization of IX waste, one can use the same principles to deal with waste streams generated by any unit operation that needs to be neutralized before discarding.

Author Contributions

Conceptualization, D.S.; methodology, D.S.; software, D.S., A.V.K. and S.S.; validation, D.S., K.T.V. and S.S.; formal analysis, D.S.; investigation, D.S.; resources, D.S., A.V.K., K.T.V. and S.S.; data curation, D.S., A.V.K. and S.S.; writing—original draft preparation, D.S.; writing—review and editing, D.S., A.V.K. and S.S.; visualization, D.S.; supervision, D.S.; project administration, D.S. All authors have read and agreed to the published version of the manuscript.

Funding

This research received no external funding.

Institutional Review Board Statement

Not applicable.

Informed Consent Statement

Not applicable.

Acknowledgments

K.T.V. thanks the Charles and Hilda Roddey Professorship through LSU for help supporting this work and defraying publication costs.

Conflicts of Interest

The authors declare no conflict of interest.

References

  1. Kadir, N.N.A.; Shahadat, M.; Ismail, S. Formation Study for Softening of Hard Water Using Surfactant Modified Bentonite Adsorbent Coating. Appl. Clay Sci. 2017, 137, 168–175. [Google Scholar] [CrossRef]
  2. Glavic, P.; Simonic, M. Handbook of Water and Energy Management in Food Processing; Klemes, J., Smith, R., Kim, J., Eds.; Woodhead Publishing Limited: Sawston, UK, 2008; p. 629. [Google Scholar]
  3. Aghdam, M.A.; Zraick, F.; Simon, J.; Farrell, J.; Snyder, S.A. A novel brine precipitation process for higher water recovery. Desalination 2016, 385, 69–74. [Google Scholar] [CrossRef]
  4. Brady, J.; Li, X. Developing Solid Oral Dosage Forms; Qiu, Y., Chen, Y., Zhang, G., Yu, L., Mantri, R.V., Eds.; Elsevier: Amsterdam, The Netherlands, 2017; p. 270. [Google Scholar]
  5. Harland, C.E. Ion Exchange; Royal Society of Chemistry: London, UK, 1994. [Google Scholar]
  6. Sharma, D.; Karre, A.; Valsaraj, K. Evaluations of the capacity of an existing brine system and estimation of salt loading profile for increased soft water demand to avoid soil contamination. Can. J. Chem. Eng. 2020. [Google Scholar] [CrossRef]
  7. Hopkins, M. Monsanto to Expand Dicamba Manufacturing at Luling Plant. 2016. Available online: https://www.croplife.com/crop-inputs/herbicides/monsanto-to-expand-dicamba-manufacturing-at-luling-plant/ (accessed on 13 April 2016).
  8. Singh, R. Hybrid Membranes Systems for Water Purification; Elsevier: Colorado Springs, CO, USA, 2005; p. 57. [Google Scholar]
  9. Pratt, J. Chemical Waste. Treatment. Patent Number US5002670A, 26 March 1991. [Google Scholar]
  10. Boer, J.; Blaga, P. Optimizing Production Cost by Redesigning the Treatment Process of the Industrial Waste Water. Procedia Technol. 2016, 22, 419–424. In Proceedings of the 9th International Conference Interdisciplinarity in Engineering, INTER-ENG 2015, Tirgu Mures, Romania, 8–9 October 2015. [Google Scholar]
  11. Gavasci, R.; Zandaryaa, S. Environmental Engineering and Renewable Energy; Elsevier: Amsterdam, The Netherlands, 1998. [Google Scholar]
  12. Lozier, M.J.M.; Mickley, M.; Reiss, R.J.; Russell, J.J.; Schaefer, J.S.; Sethi, S.J.; Manuszak, J. AWWA membrane residuals management subcommittee report: Current perspectives on residuals management for desalting membranes. Am. Water Work. Assoc. J. 2004, 96, 73–87. [Google Scholar]
  13. Crittenden, J.C. Water Treatment: Principles and Design, 2nd ed.; Wiley: Hoboken, NJ, USA, 2005; pp. 20–30. [Google Scholar]
  14. Perry, R.H.; Green, D.W.; Maloney, J.O. (Eds.) Perry’s Chemical Engineers’ Handbook, 7th ed.; McGraw-Hill: New York, NY, USA, 1997. [Google Scholar]
  15. McAllister, E.W. Pipeline Rules of Thumb Handbook, 6th ed.; Gulf Professional Publishing: Houston, TX, USA, 2005; Volume 417. [Google Scholar]
  16. McMillan, G.K.; Reddy, R.D.; Moulis, J.P. Virtual Plant Provides Real Insights. Chemical Processing. Available online: http://modelingandcontrol.com/repository/ChemProc0109.pdf (accessed on 1 January 2009).
  17. McMillan, G.; Cameron, R. Advanced pH Measurement and Control, 3rd ed.; ISA: Research Triangle Park, NC, USA, 2005. [Google Scholar]
  18. Karre, A.V.; Sharma, D.; Valsaraj, K.T. Estimating fouling and hydraulic debottlenecking of a clarifier piping system in the expansion of a chemical manufacturing plant. Chem. Prod. Process Modeling 2020. [Google Scholar] [CrossRef]
Figure 1. First neutralization process. Neutralization is done in three tanks in parallel in batch mode.
Processes 09 01285 g001
Figure 2. Second neutralization process. Neutralization is done in a continuous manner with the three neutralization tanks in series.
Processes 09 01285 g002
Figure 3. Improved neutralization process.
Processes 09 01285 g003
Figure 4. Change in pH with addition of 0.02 N H2SO4.
Processes 09 01285 g004
Figure 5. Ratio of Reagent to waste stream Vs pH.
Processes 09 01285 g005
Figure 6. Sample result for mixing time vs pH measurement in the improved neutralization setup.
Processes 09 01285 g006
Table 1. Cation and anion bed regeneration step summary.
Regeneration StepStep Time, MinutesEffluent Volume, m3Flow Rate Required for the Step, m3/h
Cation-bed
Backwash1519.8779.49
2% Regen27.520.8245.42
5% Regen27.58.1217.72
Slow Rinse 5516.2417.72
Fast Rinse4537.4849.97
Total170102.53
Anion-bed
Warmup153.9715.90
5% Regen4612.1915.90
Slow Rinse6014.7614.76
Backwash159.6538.61
Fast Rinse 49.97
Total13690.55
Table 2. Comparison of equipment cost and number of equipment for different neutralization setups.
First SetupSecond SetupImproved Neutralization Setup
Equipment Type Number of EquipmentTotal Cost
(USD × 1000)
Number of EquipmentTotal Cost
(USD × 1000)
Number of EquipmentTotal Cost
(USD × 1000)
Pump12400124006185
Tank31723100151
Agitator350-- --
Eductor 11
Total Installed cost of equipmentN/A3110N/A2500N/A1181
Table 3. Operating cost comparison of running the different neutralization setups.
Neutralization SetupPower Required, KilowattAnnual Cost of Power,
(USD × 1000)
First neutralization setup332306
Second neutralization setup298275
Improved neutralization setup149138
Table 4. Chemical usage summary for different neutralization setups.
ChemicalFirst SetupSecond SetupImproved Neutralization Setup
Usage of 93% H2SO4, cubic meter0.14020.12120.1061
Usage of 50% NaOH, cubic meter0.11720.10610.0909
Publisher’s Note: MDPI stays neutral with regard to jurisdictional claims in published maps and institutional affiliations.

