Article

Machine Learning Models for the Classification of CK2 Natural Products Inhibitors with Molecular Fingerprint Descriptors

1
Key Laboratory of Environmental and Viral Oncology, College of Life Science and Chemistry, Faculty of Environment and Life, Beijing University of Technology, Beijing 100124, China
2
Institute of Materia Medica, Peking Union Medical College and Chinese Academy of Medical Sciences, Beijing 100050, China
*
Author to whom correspondence should be addressed.
Submission received: 26 October 2021 / Revised: 16 November 2021 / Accepted: 17 November 2021 / Published: 19 November 2021
(This article belongs to the Special Issue Application of Artificial Intelligence in Industry and Medicine)

Abstract

:
Casein kinase 2 (CK2) is considered an important target for anti-cancer drugs. Given the structural diversity and broad spectrum of pharmaceutical activities of natural products, numerous studies have been performed to prove them as valuable sources of drugs. However, there has been little study relevant to identifying structural factors responsible for their inhibitory activity against CK2 with machine learning methods. In this study, classification studies were conducted on 115 natural products as CK2 inhibitors. Seven machine learning methods along with six molecular fingerprints were employed to develop qualitative classification models. The performances of all models were evaluated by cross-validation and test set. By taking predictive accuracy(CA), the area under receiver operating characteristic (AUC), and (MCC)as three performance indicators, the optimal models with high reliability and predictive ability were obtained, including the Extended Fingerprint-Logistic Regression model (CA = 0.859, AUC = 0.826, MCC = 0.520) for training test andPubChem fingerprint along with the artificial neural model (CA = 0.826, AUC = 0.933, MCC = 0.628) for test set. Meanwhile, the privileged substructures responsible for their inhibitory activity against CK2 were also identified through a combination of frequency analysis and information gain. The results are expected to provide useful information for the further utilization of natural products and the discovery of novel CK2 inhibitors.

1. Introduction

Casein kinase 2 (CK2) is involved in multiple cellular processes through phosphorylation of various substrates [1,2]. Deregulated CK2 activity is related to a variety of solid tumors, including lung, liver, and gastric cancers. A growing amount of evidence suggests that CK2 is involved in the infection of SARS-CoV2 and vaccinia and promotes rapid cell-to-cell spread [3,4]. Thus, the pharmacological intervention of CK2 has been considered a potential strategy for anti-cancer and anti-viral therapy.
The heterotetrameric CK2 holoenzyme is composed of two catalytic subunits (CK2α or CK2α’) and two regulatory subunits (CK2β). Like other kinases, the ATP-binding pocket of CK2α has been considered as the orthosteric site to design ATP-competitive inhibitors with diverse scaffolds including benzimidazole, anthraquinone, tricyclic quinolone, and natural products [5,6]. However, except for CX-4945, which has advanced through clinical trials [7], most inhibitors are precluded from being drug candidates because of cytotoxicity, genotoxicity, and other pharmaceutics deficiencies [8,9]. Attempts to optimize inhibitors presenting polycyclic scaffolds have faced challenges overcoming these drawbacks. A strategy was proposed to discover more potent CK2 inhibitors with novel non-polycyclic scaffolds that permit the exploration of diverse pharmacophoric fragments. Therefore, it would be meaningful to identify key groups that make dominant contributions to CK2 inhibitory activity.
Natural products are regarded as valuable sources of drug leads [10,11,12]. Different classes of natural products, namely coumarins, flavones, anthraquinones, etc., have been identified as CK2 inhibitors. Recently, the method of computer-aided drug design (CADD) has accelerated the discovery of CK2 natural product inhibitors [13,14]. Crystal structures of CK2α-inhibitors complexes (available from Protein Data Bank) and molecular modeling studies elucidated the binding modes of compounds with CK2α. The ATP-binding pocket of CK2 is composed of a hydrophobic pocket, a positive area, and a hinge region [15,16]. More specifically, heterocyclic scaffolds of inhibitors (2–3 aromatic rings) aresandwiched in the hydrophobic site consisting of Leu45, Val53, Val66, Ile95, Phe113, and Ile174. Meanwhile, it can be found that amino, hydroxyl, and nitrogen heterocycles tend to establish hydrogen bonds (H-bonds) with Glu114 or Val116, as well as halogen bonds between halogen atoms and carbonyl oxygen atoms of Glu114 and Val116. In contrast, only a few groups, such as hydroxyl and carboxylate groups, make electrostatic interactions with Lys68 of the positive area. As the most used ligand-based drug design methods, Quantitative Structure–Activity Relationship (QSAR/3D-QSAR) and pharmacophore screening are powerful tools to identify structural features and properties of inhibitors that are strictly connected with their biological activities. Zhang et al. built the ligand-based and receptor-based 3D-QSAR models of coumarin [17], which provided structural clues for the optimization of CF3 substituted coumarinderivates [18]. However, 3D-QSAR studies were based on compounds with one certain scaffold, and thus the generated models only gave exclusive hints for the specific scaffold. As a complementary method to overcome the applicability domain of QSAR, pharmacophore hypothesis-based virtual screening can be used to identify novel inhibitors by mapping the pharmacophoric features generated by the training set [19,20], but it cannot take into account inhibitors with different mechanisms of action at the same time. Since machine learning methods are considered as useful tools of drug discovery [21,22], classification studies of machine learning methods along with molecular features have the advantage of taking compounds with diverse chemical scaffolds as data samples, as well as considering multiple inhibition mechanisms at the same time, and have been widely used in drugsvirtual screening [23] and the prediction of kinase inhibitors binding modes [24].
At present, most studies are focused on the QSAR studies and optimization of one type of natural product. Since natural products possess diverse chemical structures and broad-spectrum bioactivities, it is appropriate to perform classification studies to identify structural groups related to their inhibitory activities and provide comprehensive structural clues for the discovery of novel CK2 inhibitors. In this study, classification models of 115 natural products were established by 7 machine learning methods combined with 6 molecular fingerprints, and privileged substructures responsible for CK2 inhibitory activity were also identified. It is expected that this study will offer an initiative for the development of novel CK2 inhibitors as anti-cancer and anti-viral drugs.

2. Materials and Methods

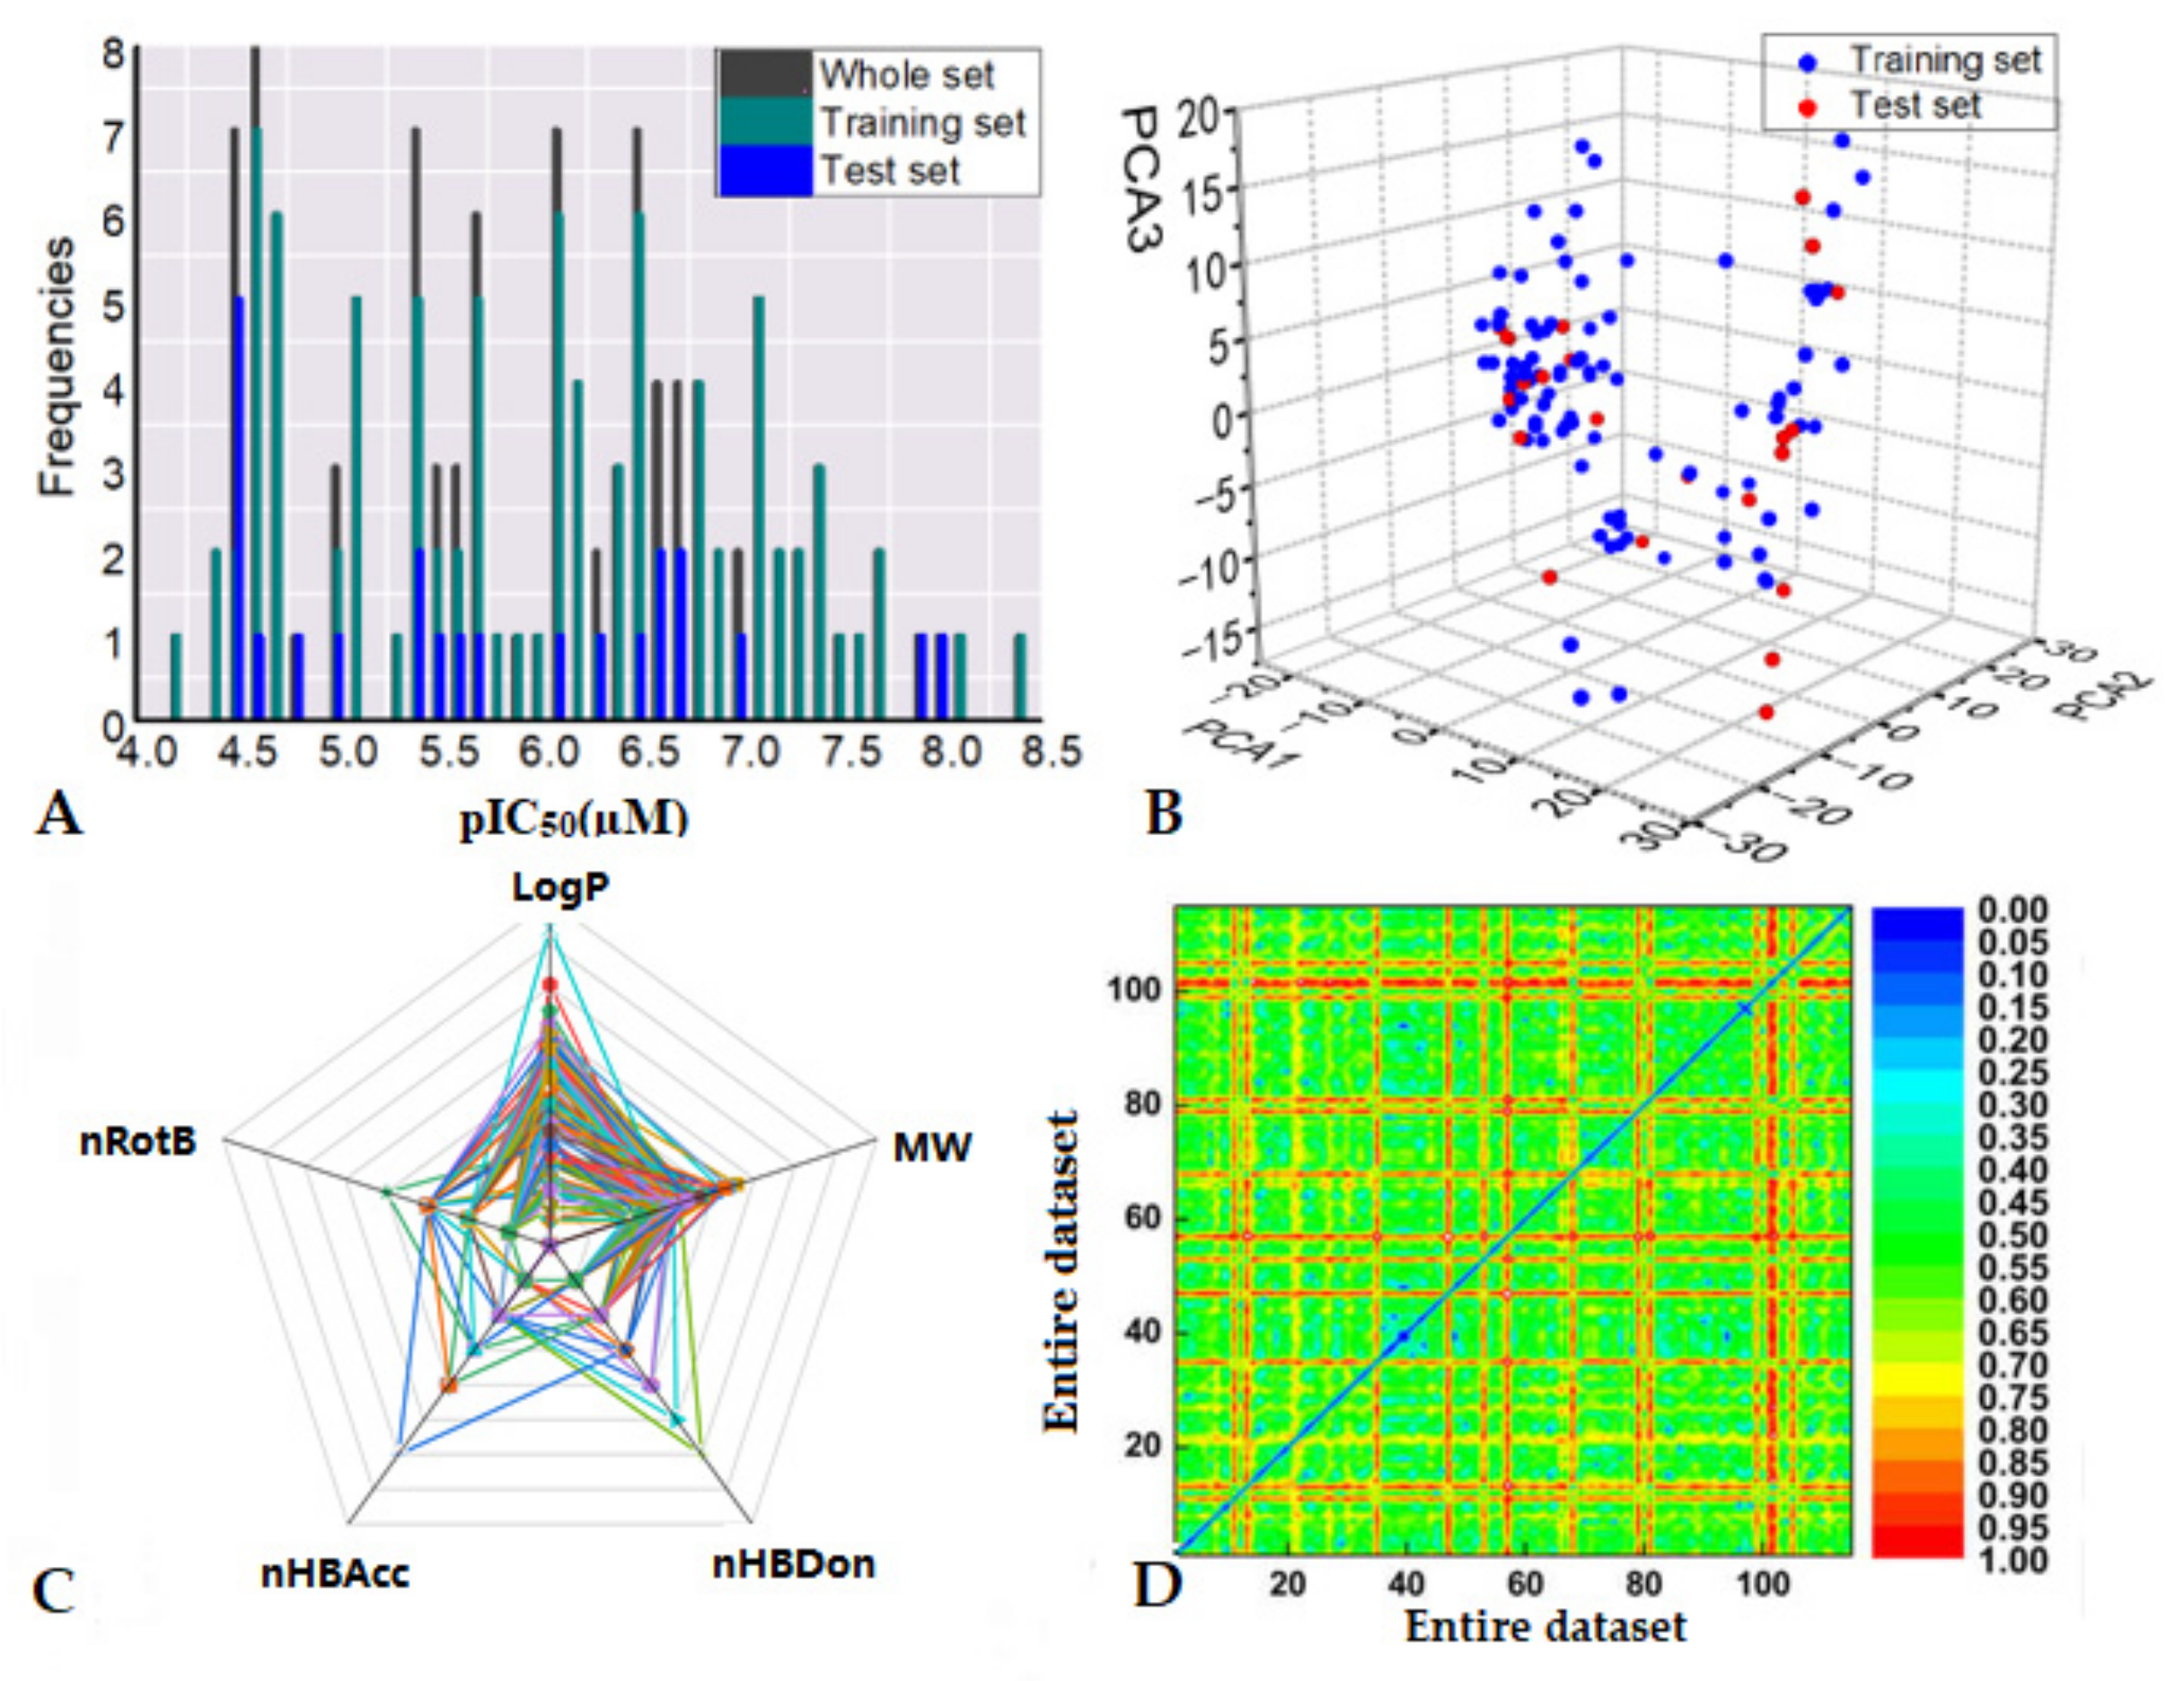
2.1. Data Collection and Chemical Space Distributions

With the consideration of molecular scaffolds as diverse as possible, 115 CK2 natural products inhibitors were collected from published literature [25,26,27,28]. Based on the inhibitory activity distribution of these inhibitors, a cut-off value (IC50 = 10 μM) was used as a threshold to define the compounds as “P” (≤10 μM, active inhibitors) and “N” (>10 μM, inactive inhibitors). Then all these compounds were randomly divided into a training set and a test set at a ratio of 4:1 as listed in Table S1 (Supplementary Materials).
In order to evaluate chemical space distributions of the entire data set, 22 2D molecular descriptor groups (e.g., constitutional indices, charge descriptors, ring descriptors, topological indices, connectivity indices, etc.) were calculated by DRAGON 7.0 [29], and 3822 molecular descriptors were further evaluated by principal components analysis to identify the featured molecular descriptors. The five descriptors of Lipinski rules were also plotted into a radar chart to observe the chemical space distribution oftheentire dataset. In addition, the complexity of a molecule (FMF), sum of the atomic polarizabilities (apol), topological polar surface area based on fragment contributions (TopoPSA), kappa shape indices (Kier), topological charge (JGT), van der Waals volume (VABC), relative molecular mass (MW), and lipid water partition coefficient (ALogP) wasalso explored to plot scatter plots in data with different labels in Figure S1 (Supplementary Materials). As Euclidian distances could be taken as an evaluator to reflect the molecular similarity of compounds, a heat map of Euclidian distance metrics based on PubChem fingerprints wasalso constructed.

2.2. Molecular Fingerprints and Machine Learning Methods

Molecular fingerprints are generally presented as a fixed-length string of numbers 1 and 0 to characterize a molecule which could be characterized by a binary string of structural information. The number 1 indicates that a substructure exists in the given molecule, while the number 0 shows the exact opposite. In this study, six fingerprints [30], namely Extended fingerprint (Ext 1024 bits), Estate fingerprint (Est 79 bits), Molecular Access Systemfingerprint (MACCS 166 bits), PubChem fingerprint (PubChem 881 bits), CDK graph only fingerprint (Graph 1024 bits) and Substructure fingerprint (Sub 307 bits) were used. All six fingerprints were calculated using the PaDEL-Descriptor software [31].
Classification models were developed by seven machine learning methods, including k-Nearest Neighbor (kNN), Logistic Regression(LR), Naïve Bayes(NB), ArtificialNeuralNetwork (ANN), Support Vector Machine (SVM), Random Forest (RF), and Tree. All these methods were integrated withOrange Canvas 3.11 software (freely available at https://orange.biolab.si/, 8 March 2018).
KNN: Based on the idea of maximum likelihood estimation [32], this method is used to find the distance between new input samples and training samples in feature spaces. In this work, the nearness was determined by Euclidean distance and distance weighted parameters with a value of five.
LR: This method is commonly used for classifying a binary response to minimize the loss function of the regression to obtain the unknown parameters [33]. Two possible response values were labeled with the symbols “0” and “1”, and the predicted value range was mapped to [0, 1], and finally, the classification was realized.
NB: NB algorithm is based on the principle of probability [34]. According to the known prior probability, the Bayes formula is aimed at finding the posterior probability that a sample belongs to a certain class and then selecting the class with the highest posterior probability as the class to which the sample belongs.
ANN: ANN is used to identify the complicated non-linear relationship between the dependent and the independent variable for classification and regression [35]. The network includes an input layer, an output layer, and a hidden layer. In this study, the hidden layer was set to 200, and other parameters were default.
SVM:SVMis a kernel-based algorithm toper form binary classification with the principle of structural risk minimization [36]. The input variables in the low-dimensional space are mapped to the high-dimensional space by changing the kernel function, and then a support vector (a binary string of each sample) is used to find the maximum interval in the new space. Finally, an optimal classification hyperplane is generated to discriminate samples from different categories. In our study, the Gaussian Radial basis function (RBF) kernel was selected, and the cost was set to 1.00.
RF: RF is an ensemble learning method for classification and regression [37]. The forest is assembled by trees, and each tree is formed from a bootstrapped sample of the training set. The process of RF establishment is to construct multiple decision trees by randomly extracting different features and different samples. The classification results depend on the majority of the individual tree’s output. In this study, the number of trees was set as 20 in the forest.
Tree:The basic idea of a Tree is the recursive division of independent variable spaces [38]. A decision tree includes decision nodes, branches, and leaves, for a categorical dependent variable described by one or more predictor variables. The key to constructing a decision tree model is the branching criteria of the tree, the conditions under which the tree stops growing, and the pruning of the tree. In this study, the minimal number of instances in leaves was set to three, and stop splitting nodes with instances less than five.

2.3. Model Performance Evaluation

A 10-fold cross-validation and test set validation were performed to evaluate the performance of models. The parameters, including true positives (TP), false positives (FP), true negatives (TN), and false negatives (FN), were considered to evaluate the quality of each model. Furthermore, the preferred indicators, predictive accuracy of “P” class (sensitivity, SE), “N” class (specificity, SP), and overall predictive accuracy (CA) were calculated by the following formulas [39]. Taking into account all of the confusion matrix elements, positive predictive value (PP), negative predictive value (NP), and the Matthews correlation coefficient (MCC) were also explored to measure the correlation between the true class labels and the predicted labels.
SE = TP/(TP + FN)
SP = TN/(TN + FP)
CA = (TP + TN)/(TP + TN + FP + FN)
PP = TP/TP + FP
NP = TN/TN + FN
M C C = T P × T N F P × F N T N + F N T N + F P T P + F N T P + F P
In addition, TP and FP rates were also used to plot the receiver operating characteristic (ROC) curve, the area under which (AUC) was another parameter to evaluate the quality of the model ranging from 0.5 (no discriminative ability) to 1 (perfect classifier) [40].

2.4. Identification of Privileged Substructures

The privileged substructures referred to pharmacophoric groups that were responsible for their CK2 inhibitory activity. Information gain (IG) along with substructure frequency [41] was analyzed to identify the privileged groups, which offered the potential determinant fragments for novel CK2 inhibitors discovery. In case a substructure frequently appeared in the “P” category, this fragment was considered a privileged substructure of CK2 inhibitors. The frequency of fragments is defined below [42].
F r e q u e n c y   of   a   substructure = N f r a g m e n t p × N N f r a g m e n t × N P
where N f r a g m e n t p , N is the number of compounds in “P” class containing the fragment, N is the total number of compounds in the data set, N f r a g m e n t , N is the number of compounds having the fragment in the data set, and N P , N represents the total number of “P” compounds in the data sets.
In order to elucidate the roles of privileged substructures binding to CK2, molecular docking was performed to identify the potential position and orientation of compounds 2 and 73 in the active pocket using Genetic Optimization for Ligand Docking (GOLD) version 4.0 [43]. The active site of CK2 was defined as the collection of amino acids enclosed within a 6.5 Å radius sphere centered on Ellagic [44]. TheGOLD score and default genetic algorithm (GA) parameters were applied to predict the binding modes between CK2 and inhibitors.

3. Results and Discussion

3.1. Dataset Analysis

The reported 115 natural product inhibitors were randomly divided into a training set and test set with a ratio of 4:1. According to the classification criteria node IC50 = 10 μM, all molecules were split into “P”(88) and “N”(27), among which 92 training set compounds (73 inhibitors and 19 non-inhibitors)and 23 test set compounds (15 inhibitors and 8 non-inhibitors), respectively. The experimental pIC50 values for the entire dataset were mainly distributed between −6.5 and –4.5 (shown in Figure 1A). Therefore, each group presented the roughly balanced distribution of “P” inhibitors (training group = 79%, testing group = 65.2%), which was suitable to evaluate the predictive performance of the models.
Chemical diversity is a determinative factor for the development of robust and predictable models. Here, chemical diversity was characterized by the chemical space (defined by PCA analysis of featured molecular descriptors) and a heat map of molecular similarity constructed by Euclidian distance metrics (calculated by PubChem fingerprint). As shown in Figure 1B, the top 3 most important distributions were used to generate a three-dimensional distribution plot for all 115 compounds. Since these 3 components explained 57% of the featured descriptor variance in this dataset, Figure 1B can be viewed as the representation of chemical space covered by all compounds, which indicates the training set and test set are basically covered in the same spatial distribution. Additionally, the radar chart displayed the five descriptors of Lipinski rules of molecules used. It can be seen from Figure 1C that the molecular property of the entire dataset was similar and did not exhibit preference. Therefore, it is relatively reliable to evaluate the performance of models constructed by the training set using the prediction results of the test set. Furthermore, molecular diversity was analyzed by the heat map constructed by Euclidian distance metrics. Red (1) and blue (0) indicate the highest and lowest diversity of molecules, respectively. As illustrated in Figure 1D, most plots were distributed in the green area (around 0.4), which meansthe data set presented highdiversity. To a certain extent, the dataset possessed similar chemical spaces and high structural diversity, which meets the basic requirement of a reliable classification model.

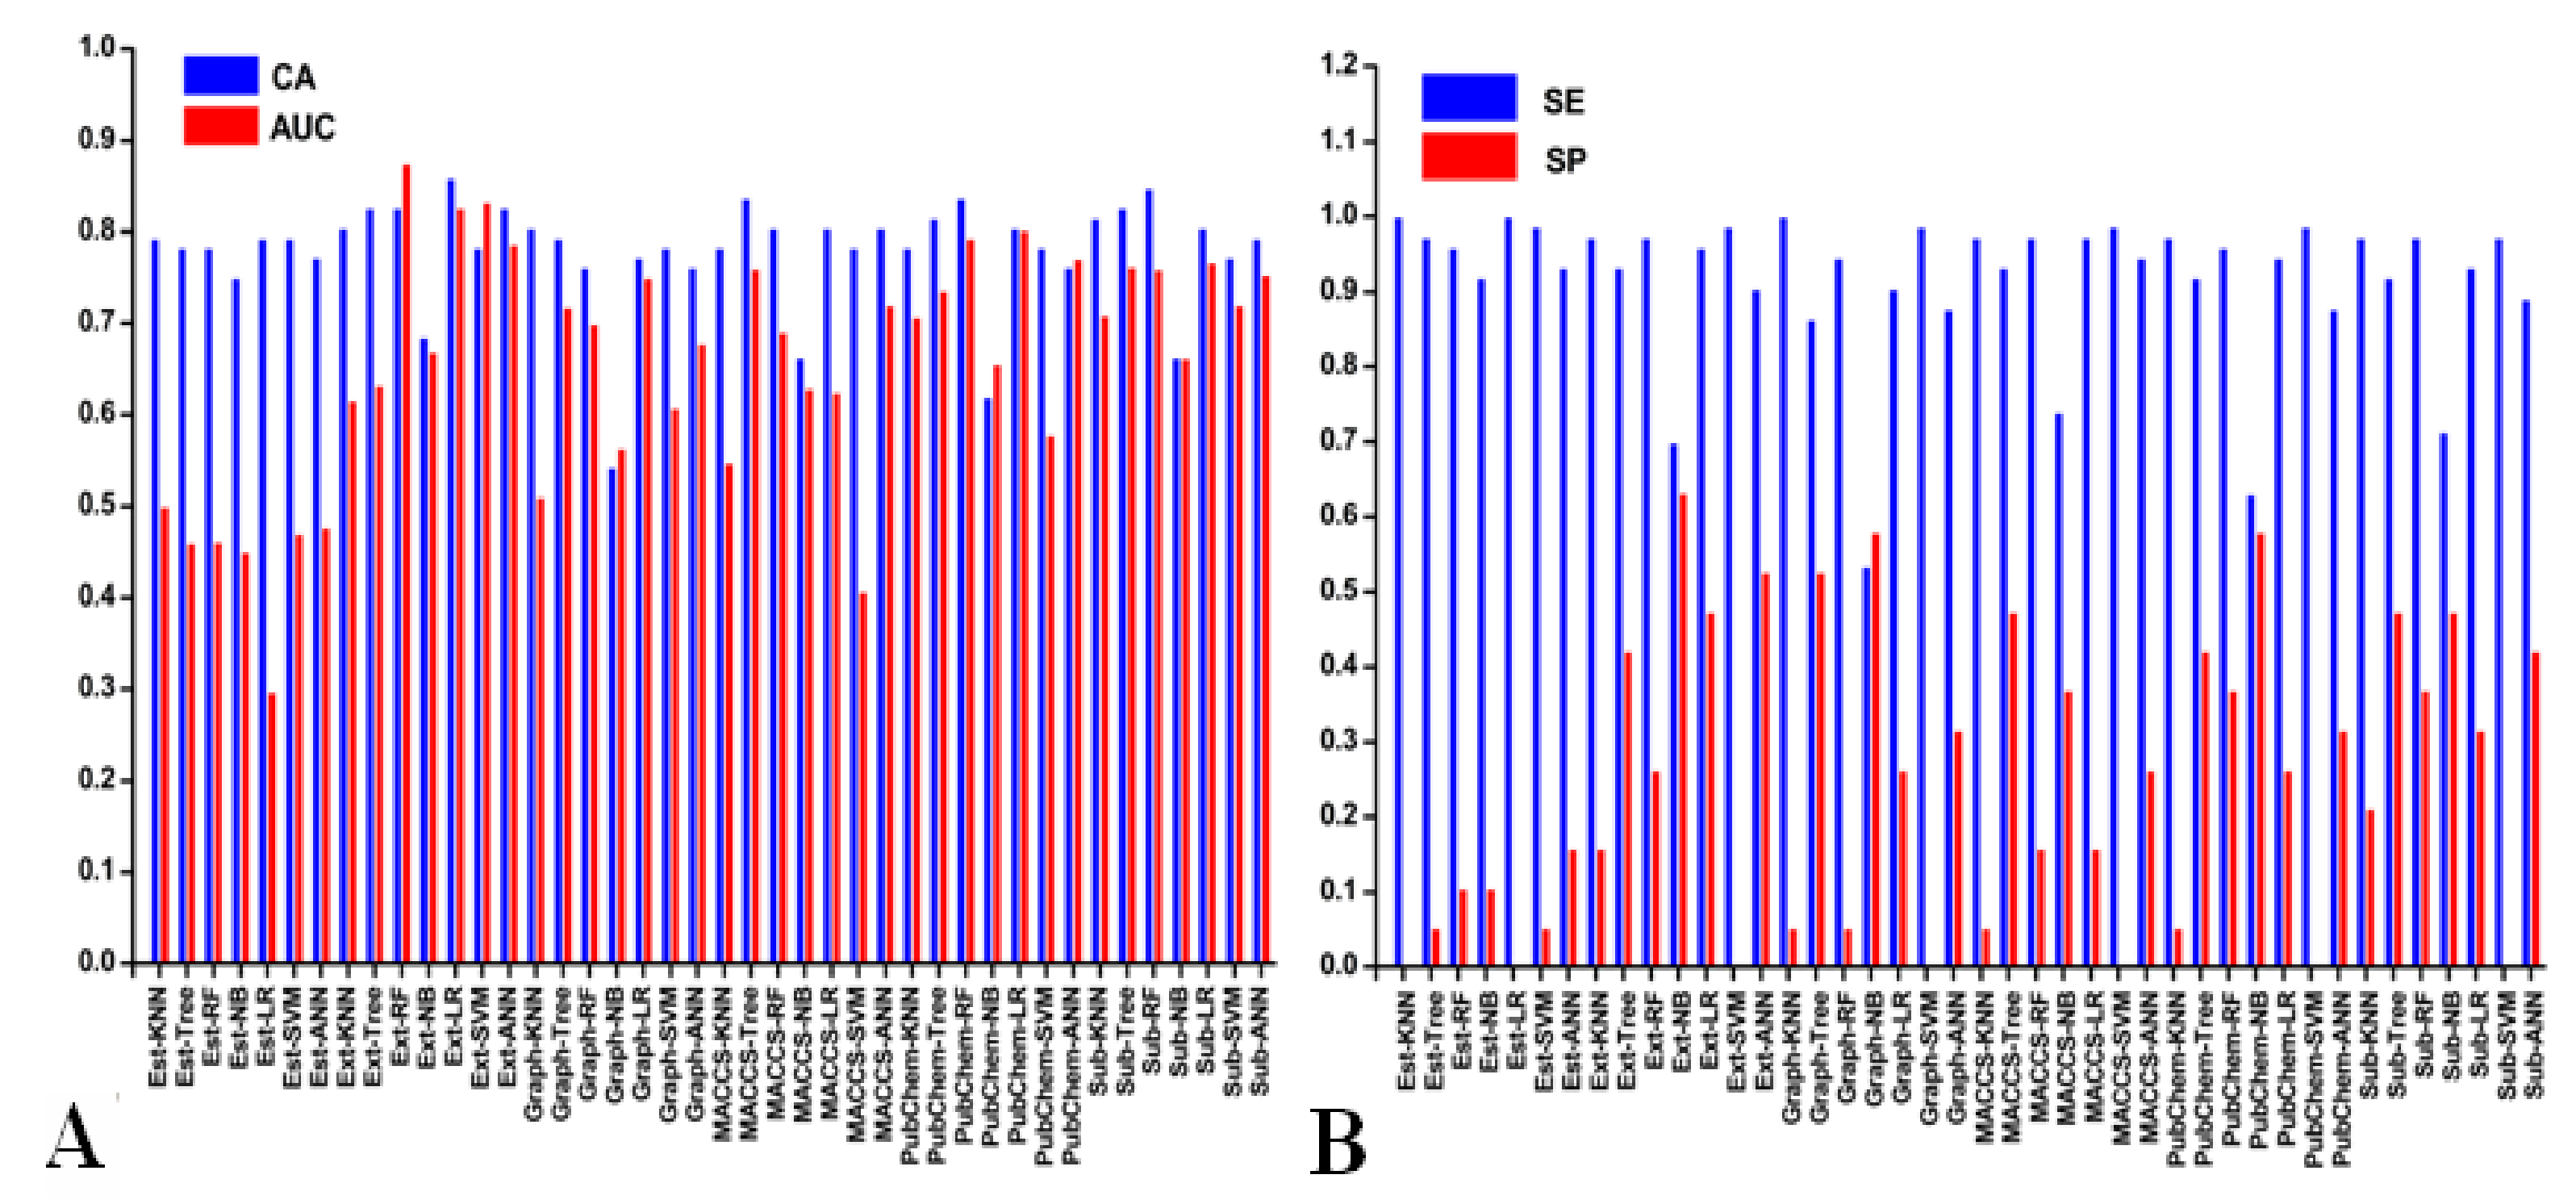
3.2. Performance of 10-Fold Cross-Validation

The performances of 42 models were first evaluated with a 10-fold cross-validation method, which was performed 10 times based on the split training set with the ratio of 1:9. The results of cross-validation (CA, AUC, SE, and SP values) are shown in Figure 2. Considering the CA and AUC values as two key indicators of a reliable model, 10 models were roughly defined as the first 10 rankings, with the CA ranging from 0.783 to 0.859 and AUC ranging from 0.760 to 0.875.
However, their SE values and SP values were in the range of 0.88 to 0.99 and 0 to 0.53, respectively, which means that these models had a good predictive ability for the active inhibitors other than the inactive inhibitors. It may be speculated that the higher ratio of active inhibitors to inactive inhibitors in the data set was the underlying reason.
In order to better understand the top 10 models, Table 1 also lists their detailed performance for the training set. From the results of the 10-fold cross-validation, we can see that the same molecular fingerprint generated models with the prediction capabilities to a different extent when combined with different machine learning algorithms. No matter which machine learning method was used, both Ext and PubChem fingerprints generally yielded the optimal results. Among these models, Ext-LR and PubChem-RF gave the top two predictive results by considering AUC and MCC as indicators.
PubChem fingerprint (881 bits) is based on the well-defined structural fragments dictionary, which is full of structural information. It is a public, freely accessible platform for mining biological information resources of small molecules [45]. Ext fingerprint (1024 bits) is an extension of the CDK fingerprint, which takes into account the nature of the ring, including rich structural information [46]. In this study, the data set processed the polycyclic structure features and aromatic rings. Consequently, PubChem and Ext fingerprints may well characterize their structural information.

3.3. Performances of Test Set

The test set was used for testing the predictive ability of the 10 best models. As shown in Table 2, their CA values and AUC values ranged from 0.652 to 0.826 and 0.654 to 0.933. Interestingly, the higher SE values relative to SP, similar to those of the 10-fold cross-validation results, indicated that all models had good predictive performance for “P” inhibitors, especially the highest accuracy of 100% for “P” Inhibitors of the Ext and PubChem fingerprint-based models. However, the Sub-LR model presented the best accuracy for non-inhibitors compounds (SP = 0.63). The higher prediction accuracy of inhibitor compounds could be explained by the uneven distribution of inhibitors and non-inhibitors in the test set. Among these models, the PubChem-ANN model (CA = 0.826, AUC = 0.933, MCC = 0.628) yielded the best performance, followed byExt-LR (CA = 0.826, AUC = 0.800, MCC = 0.628), and Ext-SVM (CA = 0.652, AUC = 0.850, MCC = 0.652) models for the test set.
Based on the performances of models for the training set and test set, both PubChem and Ext were involved in the optimal models for the entire dataset. Compared with other machine learning algorithms, LR and ANN produced the preferred classification models for CK2 natural products inhibitors with robustness and good predictive ability

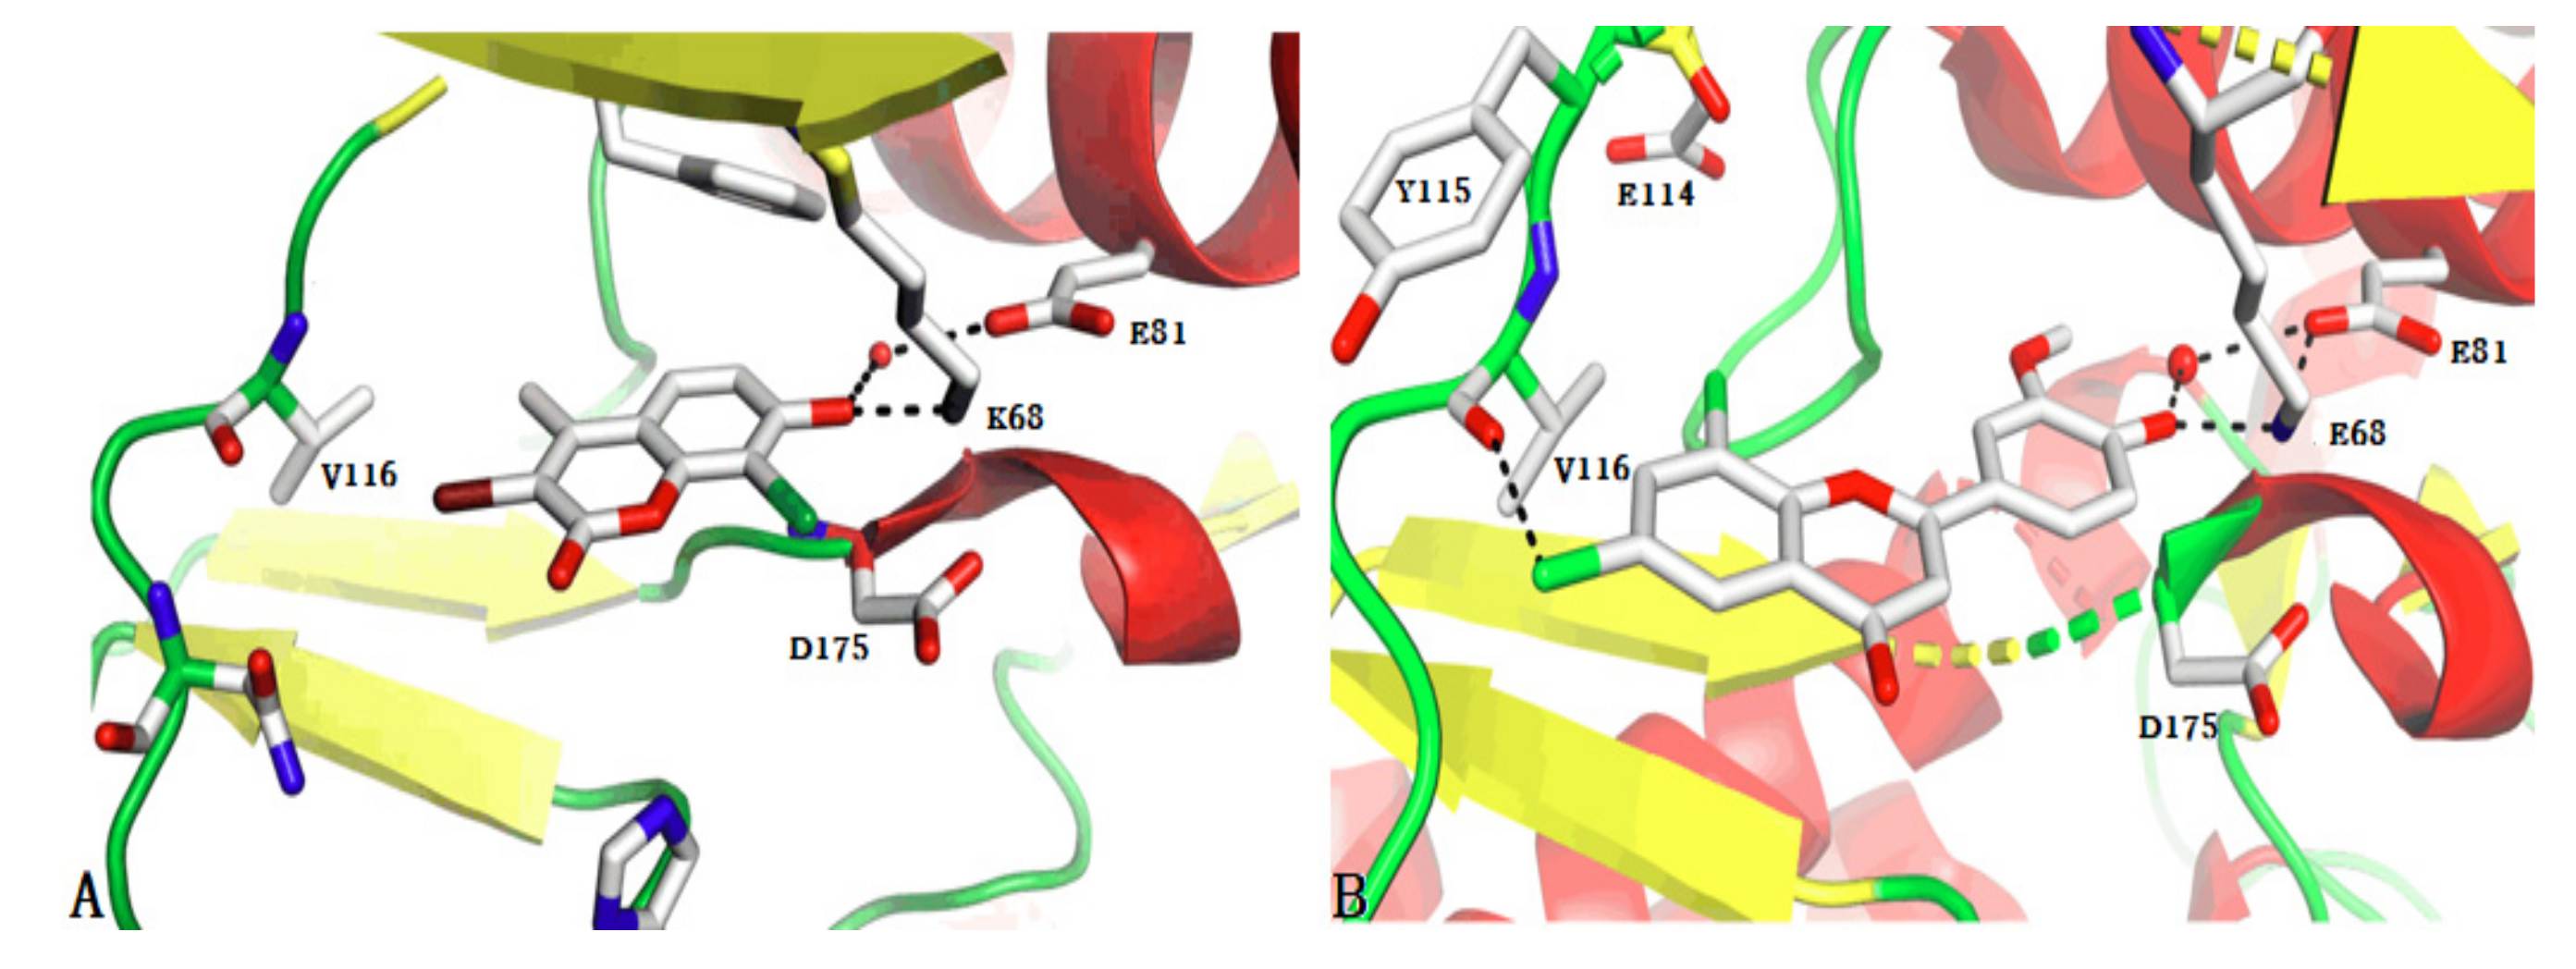
3.4. Identification of Privileged Substructures

Information gain (IG) and substructure frequency analysis were performed to identify the privileged pharmacophoric fragments based on PubChem fingerprint. The higher IG values, the greater roles of these substructures responsible for their inhibitory activity. As listed in Table 2, 9 privileged substructures were found to appear in active inhibitors (“P”) more frequently than inactive inhibitors (“N”). Specifically, the former 7 fragments were present in active inhibitors, and the latter two substructures were identified in 10 (corresp. 16) active inhibitors and one inactive inhibitor. Consequently, these fragments played the determinant roles for their inhibitory activity based on their presence in each class and also could be used as structural signs to discover and screen novel CK2 inhibitors. Meanwhile, reprehensive compounds were docked into the CK2 binding pocket to elucidate the binding modes of privileged substructures with key residues.
For example, the >= 3 saturated or aromatic benzene rings (PubChemFP193) appeared in most active natural products as the planar aromatic scaffolds were sandwiched in the hydrophobic area of the CK2α binding site to anchor its scaffold. This is consistent with the aromatic scaffolds found in most known CK2α inhibitors. The halogenated benzene substituted with a hydroxyl (PubChemFP505, PubChemFP551, and PubChemFP827) or an alkoxyl (PubChemFP806 and PubChemFP807) were found in compounds 4 (pIC50 = 7.74) and 5 (pIC50 = 7.70), in which the electronic attractive substituent-halogen atoms at R4 promoted the neighbored hydroxyl to be an ionizable negative oxygen atom which formed polar interactions with Lys68 of the positive area of CK2α (Figure 3A). This conclusioncould explain the activity variations of different structures. By comparing the structures and activities of compounds 73 and 93, a chlorine atom at R4 generated a 30-fold increased inhibitory activityin contrast to a hydroxyl at the corresponding position. This is consistent with molecular modeling studies of Non-R2 carboxylate-substituted tricyclic Quinoline compounds, which elucidated inappropriate electrostatic interactions between the Non-R2 carboxylate group and the positive region followed by the reorientation of tricyclic skeletons [47]. Another privileged substructure is the halogen-substituted benzene fragment which is referred to as PubChemFP38, PubChemFP815, and PubChemFP785. As indicated from compound 2, this substructure pointed to the hinge region and formed the halogen bond with Glu114 or Val116 (Figure 3B). Therefore, it is not strange that compound 2 (pIC50 = 8.00) substituted with 2 halogen atoms at R7 displayed a 100-fold higher activity than compound 34 (pIC50 = 6.10) with 2 hydrogen atoms at the same position. Halogen bonds have been considered as a significant interaction involved between ligands and receptors [48]. Additionally, amide groups (PubChemFP439) were identified as pharmacophoric groups and were also included in the design of 2-propenone derivatives as CK2α inhibitors(IC50 = 0.6 μM) [49]. By introducing the mentioned privileged substructures on the non-polycyclic2-propenone scaffold, more potent CK2 inhibitors are expected to be identified (Undergoing work).

4. Conclusions

In this study, seven machine learning methods, along with six molecular fingerprints, were employed to establish classification models of 115 CK2α natural product inhibitors. After 10-fold cross-validation and external test set evaluation, the accuracy of the training set and test set ranged from 0.783 to 0.859 and from 0.652 to 0.826, respectively, and the optimal model was obtained using Ext fingerprint combined with the LR algorithm (for the training set) and PubChem fingerprint along with the ANN method(for the test set). Furthermore, information gain and substructure frequency analysis were performed to identify pharmacophoric substructures related to their inhibitory activity. In summary, our research provided optimization clues for the further discovery of novel CK2 inhibitors.

Supplementary Materials

The following are available online at https://0-www-mdpi-com.brum.beds.ac.uk/article/10.3390/pr9112074/s1, Table S1: Structure and inhibitory activityof CK2 natural product inhibitors, Figure S1: Scatter plots of molecular properties in different categories.

Author Contributions

Conceptualization, N.Z. and Y.L.; methodology, M.B. and X.Z.; validation, M.B., X.Z. and Y.Z.; formal analysis, G.S., Y.L. and M.B.; writing—original draft preparation, N.Z. and Y.L.; writing—review and editing, G.S., L.Z. and R.Z. All authors have read and agreed to the published version of the manuscript.

Funding

This research was funded by Beijing Natural Science Foundation, Grant number 7192015, National Natural Science Foundation of China, Grant number 82003599, Beijing Municipal Commission of Education Research Projects Grant number KM202110005005.

Institutional Review Board Statement

Not applicable.

Informed Consent Statement

Not applicable.

Data Availability Statement

The data presented in this study are available in the references.

Conflicts of Interest

The authors declare no conflict of interest.

Nomenclature

CK2, Casein Kinase 2; Ext, Extended fingerprint; Est, Estate fingerprint; MACCS, Molecular Access System fingerprint; Pubchem, PubChem fingerprint; Graph, CDK graph fingerprint; Sub, Substructure fingerprint; kNN, k-nearest neighbor; LR, LogisticRegression; NB, Naïve Bayes; ANN, Artificial neural network; SVM, support vector machine; RF, random Forest; Tree, C4.5 Decision Tree; TP, true positives; FP, false positives; TN, true negatives; FN, false negatives; SE, sensitivity; SP, specificity; CA, predictive accuracy; PP, positive predictive value; NP, negative predictive value; MCC, Matthews correlation coefficient; ROC, receiver operating characteristic.

References

  1. Borgo, C.; D’Amore1, C.; Sarno, S.; Salvi, M.; Ruzzene, M. Protein kinase CK2: A potential therapeutic target for diverse human diseases. Signal Transduct. Target. Ther. 2021, 6, 183. [Google Scholar] [CrossRef]
  2. Borgo, C.; D’Amore, C.; Cesaro, L.; Sarno, S.; Pinna, L.A.; Ruzzene, M.; Salvi, M. How can a traffic light properly work if it is always green? The paradox of CK2 signaling. Crit. Rev. Biochem. Mol. Biol. 2020, 56, 321–359. [Google Scholar]
  3. Bouhaddou, M.; Memon, D.; Meyer, B.; White, K.M.; Rezelj, V.V.; Marrero, M.C.; Polacco, B.J.; Melnyk, J.E.; Ulferts, S.; Kaake, R.M.; et al. The global phosphorylation landscape of SARS-CoV-2 infection. Cell 2020, 182, 685–712. [Google Scholar] [CrossRef] [PubMed]
  4. Alvarez, D.E.; Agaisse, H. Casein kinase 2 regulates vaccinia virus actin tail formation. Virology 2012, 423, 143–151. [Google Scholar] [CrossRef] [Green Version]
  5. Qiao, Y.; Chen, T.; Yang, H.; Chen, Y.; Lin, H.; Qu, W. Small molecule modulators targeting protein kinase CK1 and CK2. Eur. J. Med. Chem. 2019, 181, 111581. [Google Scholar] [CrossRef] [PubMed]
  6. Cozza, G. The development of CK2 inhibitors: From traditional pharmacology to in silicon rational drug design. Pharmaceuticals 2017, 10, 26. [Google Scholar] [CrossRef] [Green Version]
  7. Senhwa Biosciences, Inc.Senhwa Biosciences CX-4945 Granted Orphan Drug Designation by the US FDA in Cholangiocarcinoma. Available online: https://www.senhwabio.com/en/news/ec41f1 (accessed on 4 January 2017).
  8. Cozza, G.; Meggio, F.; Moro, S. The dark side of protein kinase CK2 inhibition. Curr. Med. Chem. 2011, 18, 1884–2867. [Google Scholar] [CrossRef]
  9. Cozza, G.; Venerando, A.; Sarno, S.; Pinna, L.A. The selectivity of CK2 inhibitorQuinalizarin: A reevaluation. Biol. Andm. Res. Int. 2015, 2015, 734127. [Google Scholar]
  10. Beutler, J.A. Natural products as a foundation for drug discovery. Curr. Protoc. Pharmacol. 2019, 86, e67. [Google Scholar] [CrossRef] [PubMed]
  11. Harvey, A.L.; Edrada-Ebel, R.; Quinn, R.J. The re-emergence of natural products for drug discovery in the genomics era. Nat. Rev. Drug Discov. 2015, 14, 111–129. [Google Scholar] [CrossRef] [PubMed] [Green Version]
  12. Guerra, B.; Issinger, O.G. Natural compounds and derivatives as Ser/Thr protein kinase modulators and inhibitors. Pharmaceuticals 2019, 12, 4. [Google Scholar] [CrossRef] [Green Version]
  13. Haidar, S.; Jürgens, F.; Aichele, D.; Jose, J. In silico and in vitro studies of natural compounds as human CK2 inhibitors. Curr. Comput.-Aided Drug Des. 2021, 17, 323–331. [Google Scholar] [CrossRef] [PubMed]
  14. CoMarzec, E.; Świtalska, M.; Winiewska-Szajewska, M.; Wójcik, J.; Wietrzyk, J.; Maciejewska, A.M.; Poznański, J.; Mieczkowski, A. The halogenation of natural flavonoids, baicalein and chrysin, enhances their affinity to human protein kinase CK2. IUBMB Life 2020, 72, 1250–1261. [Google Scholar] [CrossRef]
  15. Battistutta, R. Protein kinase CK2 in health and disease: Structural bases of protein kinase CK2 inhibition. Cell. Mol. Life Sci. 2009, 66, 1868–1889. [Google Scholar] [CrossRef]
  16. Ul-Haq, Z.; Ashraf, S.; Bkhaitan, M.M. Molecular dynamics simulations reveal structural insights into inhibitor binding modes and mechanism of casein kinase II inhibitors. J. Biomol. Struct. Dyn. 2019, 37, 1120–1135. [Google Scholar] [CrossRef] [PubMed]
  17. Zhang, N.; Zhong, R. Docking and 3D-QSAR studies of 7-hydroxycoumarin derivatives as CK2inhibitors. Eur. J. Med. Chem. 2010, 45, 292–297. [Google Scholar] [CrossRef]
  18. Zhang, N.; Chen, W.; Zhou, Y.; Zhao, H.; Zhong, R. Rational design of Coumarin derivatives as CK2 inhibitors by improving the interaction with the hinge region. Mol. Inform. 2016, 35, 15–18. [Google Scholar] [CrossRef] [PubMed]
  19. Di-wu, L.; Li, L.L.; Wang, W.J.; Xie, H.Z.; Yang, J.; Zhang, C.H.; Zhong, L.; Feng, S.; Yang, S.Y. Identification of CK2 inhibitors with new scaffolds by a hybrid virtual screening approach based on Bayesian model; pharmacophore hypothesis and molecular docking. J. Mol. Graph. Model. 2012, 36, 42–47. [Google Scholar] [CrossRef] [PubMed]
  20. Tutone, M.; Pibiri, I.; Perriera, R.; Campofelice, A.; Culletta, G.; Melfi, R.; Pace, A.; Almerico, A.M.; Lentini, L. Pharmacophore-based design of new chemical scaffolds as translational read though-inducing drugs (TRIDs). ACS Med. Chem. Lett. 2020, 11, 747–753. [Google Scholar] [CrossRef]
  21. Zhang, W.; Lin, W.; Zhang, D.; Wang, S.; Shi, J.; Niu, Y. Recent advances in the machine learning-based drug-target interaction prediction. Curr. Drug Metab. 2019, 20, 194–202. [Google Scholar] [CrossRef]
  22. Pena-Guerrero, J.; Nguewa, P.A.; Garcia-Sosa, A.T. Machine learning, artificial intelligence, and data science breaking into drug design and neglected diseases. Wiley Interdiscip. Rev.-Comput. Mol. Sci. 2021, 11, e1513. [Google Scholar] [CrossRef]
  23. Yang, M.; Tao, B.; Chen, C.; Jia, W.; Sun, S.; Zhang, T. Machine learning models based on molecular fingerprints and an extreme gradient boosting method lead to the discovery of JAK2 inhibitors. J. Chem. Inf. Model. 2019, 59, 5002–5012. [Google Scholar] [CrossRef] [PubMed]
  24. Rodríguez-Pérez, R.; Miljković, F.; Bajorath, J. Assessing the information content of structural and protein-ligand interaction representations for the classification of kinase inhibitor binding modes via machine learning and active learning. J. Cheminf. 2017, 12, 362020. [Google Scholar] [CrossRef]
  25. Chilin, A.; Battistutta, R.; Bortolato, A. Coumarin as attractive casein kinase2 (CK2) inhibitor scaffold: An integrate approach to elucidate the putative binding motif and explain structure-activity relationships. J. Med. Chem. 2008, 51, 752–759. [Google Scholar] [CrossRef]
  26. Golub, A.G.; Bdzhola, V.G.; Ostrynska, O.V.; Kyshenia, I.V.; Sapelkin, V.M.; Prykhod’ko, A.O. Discovery and characterization of synthetic 4′-hydroxyflavones New CK2 inhibitors from flavone family. Bioorgan. Med. Chem. 2013, 21, 6681–6689. [Google Scholar] [CrossRef]
  27. DeMoliner, E.; Moro, S.; Sarno, S.; Zagotto, G.; Zanotti, G.; Pinna, L.A. Inhibition of protein kinase CK2 by anthraquinone-related compounds. J. Biol. Chem. 2003, 278, 1831–1836. [Google Scholar] [CrossRef] [PubMed] [Green Version]
  28. Cozza, G.; Zonta, F.; DalleVedove, A.; Venerando, A.; Dall’Acqua, S.; Battistutta, R.; Ruzzene, M. Biochemical and cellular mechanism of protein kinase CK2 inhibition by deceptive curcumin. FEBS J. 2020, 287, 1850–1864. [Google Scholar] [CrossRef]
  29. Dragon Software for Molecular Descriptor Calculation V7.0.6, KodeSrl. Available online: https://chm.kode-solutions.net/ (accessed on 3 September 2017).
  30. Heikamp, K.; Bajorat, J. Fingerprint design and engineering strategies: Rationalizing and improving similarity search performance. Future Med. Chem. 2012, 4, 1945–1959. [Google Scholar] [CrossRef]
  31. Yap, C.W. PaDEL-descriptor: An open source software to calculate molecular descriptors and fingerprints. J. Comput. Chem. 2010, 32, 1466–1474. [Google Scholar] [CrossRef] [PubMed]
  32. Cover, T.M.; Hart, P. Nearest neighbor pattern classification. IEEE Trans. Inf. Theory 1967, 13, 21–27. [Google Scholar] [CrossRef]
  33. Dreiseitl, S.; Ohno-Machado, L. Logistic regression and artificial neural network classification models: A methodology review. J. Biomed. Inform. 2002, 35, 352–359. [Google Scholar] [CrossRef] [Green Version]
  34. Watson, P. Naive Bayes classification using 2D pharmacophore feature triplet vectors. J. Chem. Inf. Model. 2008, 48, 166–178. [Google Scholar] [CrossRef] [PubMed]
  35. Basheer, I.A.; Hajmeer, M. Artificial neural networks: Fundamentals, computing, design, and application. J. Microbiol. Methods 2000, 43, 3–31. [Google Scholar] [CrossRef]
  36. Bouboulis, P.; Theodoridis, S.; Mavroforakis, C.; Dalla, L. Complex support vector machines for regression and quaternary classification. IEEE Trans. Neural Netw. Learn. Syst. 2014, 26, 1260–1274. [Google Scholar] [CrossRef] [PubMed] [Green Version]
  37. Svetnik, V.; Liaw, A.; Tong, C.; Culberson, J.; Sheridan, R.; Feuston, B. Random Forest: A Classification and Regression Tool for Compound Classification and QSAR Modeling. J. Chem. Inf. Comput. Sci. 2003, 43, 1947–1958. [Google Scholar] [CrossRef]
  38. Plewczynski, D.; Spieser, S.; Koch, U. Assessing different classification methods for virtual screening. J. Chem. Inf. Model. 2006, 46, 1098–1106. [Google Scholar] [CrossRef]
  39. Fan, T.; Sun, G.; Zhao, L.; Cui, X.; Zhong, R. QSAR and classification study on prediction of acute oral toxicity of N-nitroso compounds. Int. J. Mol. Sci. 2019, 19, 3015. [Google Scholar] [CrossRef] [Green Version]
  40. Perez-Garrido, A.; Helguera, A.M.; Borges, F.; Cordeiro, M.; Rivero, V.; Escudero, A.G. Two new parameters based on distances in a receiver operating characteristic chart for the selection of classification models. J. Chem. Inf. Model. 2011, 51, 2746–2759. [Google Scholar] [CrossRef] [PubMed]
  41. Shen, J.; Cheng, F.X.; Xu, Y.; Li, W.H.; Tang, Y. Estimation of ADME properties with substructure pattern recognition. J. Chem. Inf. Model. 2010, 50, 1034–1041. [Google Scholar] [CrossRef]
  42. Sun, G.L.; Fan, T.; Sun, X.; Hao, Y.; Cui, X.; Zhao, L.; Ren, T.; Zhou, Y.; Zhong, R.; Peng, Y. In Silico Prediction of O⁶-Methylguanine-DNA Methyltransferase inhibitory potency of base analogs with QSAR and machine learning methods. Molecules 2018, 23, 2892. [Google Scholar] [CrossRef] [PubMed] [Green Version]
  43. Jones, G.; Willett, P.; Glen, R.C.; Leach, A.R.; Taylor, R. Development and validation of a genetic algorithm for flexible docking. J. Mol. Biol. 1997, 267, 727–748. [Google Scholar] [CrossRef] [PubMed] [Green Version]
  44. Sekiguchi, Y.; Nakaniwa, T.; Kinoshita, T.; Nakanishi, I.; Kitaura, K.; Hirasawa, A. Structural insight into human CK2α in complex with the potent inhibitor ellagic acid. Bioorgan. Med. Chem. 2009, 19, 2920–2923. [Google Scholar] [CrossRef] [PubMed]
  45. Bolton, E.E.; Wang, Y.; Thiessen, P.A.; Bryant, S.H. Chapter 12 PubChem: Integrated platform of small molecules and biological activities. Annu. Rep. Comput. Chem. 2008, 4, 217–241. [Google Scholar]
  46. Sawada, R.; Kotera, M.; Yamanishi, Y. Benchmarking a wide range of chemical descriptors for drug-target interaction prediction using a chemogenomic approach. Mol. Inform. 2014, 33, 719–731. [Google Scholar] [CrossRef] [PubMed]
  47. Zhou, Y.; Li, X.; Zhang, N.; Zhong, R. Structural basis for low-affinity binding of non-R2 carboxylate-substituted tricyclic quinoline analogs to CK2α: Comparative molecular dynamics simulation studies. Chem. Biol. Drug Des. 2015, 85, 189–200. [Google Scholar] [CrossRef]
  48. Shinada, N.K.; Brevern, A.G.; Schmidtke, P. Halogens in Protein-Ligand Binding Mechanism: A Structural Perspective. J. Med. Chem. 2019, 62, 9341–9356. [Google Scholar] [CrossRef]
  49. Qi, X.; Zhang, N.; Zhao, L.; Hu, L.; Cortopassi, W.A.; Jacobson, M.P.; Li, X.; Zhong, R. Structure-based identification of novel CK2 inhibitors with a linear 2-propenone scaffold as anti-cancer agents. Biochem. Biophys. Res. Commun. 2019, 512, 208–212. [Google Scholar] [CrossRef]
Figure 1. (A) Distributions of the experimental pIC50 values for the whole dataset (n = 115, grey bars), training set (n = 92, green bars), and test set (n = 23, blue bars); (B) Chemical space of the entire dataset (n = 115) using top three principal components of dragon molecular descriptors (57% variance explained). (C) Radar map of molecular properties of the entire dataset; (D) Heat map of molecular similarity constructed by Euclidian distance metrics for the entire dataset.
Processes 09 02074 g001
Figure 2. Performance of 10-fold cross-validation for training set in 42 classification models. (A) CA, AUC (B) SE, and SP, which are the classification accuracy; the area under the ROC curve, sensitivity, and specificity, respectively.
Processes 09 02074 g002
Figure 3. Binding modes of compounds 73 (A) and 2 (B) with CK2 indicated from molecular docking.
Processes 09 02074 g003
Table 1. Performance of top 10 classification models for the training set and test set.
Data SetModelCAAUCSESPPPNPMCCTPTNFPFN
Training
set
Ext-RF0.8260.8750.970.260.8350.7140.360715142
Ext-SVM0.8300.8330.990.000.7910−0.050720191
Ext-LR0.8590.8260.960.470.8750.7500.520709103
PubChem-LR0.8040.8020.950.260.8310.5560.283695144
PubChem-RF0.8370.7930.960.370.8530.7000.426707123
Ext-ANN0.8260.7870.900.530.8800.5890.449661097
PubChem-ANN0.7610.7710.880.320.8310.4000.210646139
Sub-LR0.8040.7670.930.320.8400.5450.309686135
Sub-Tree0.8260.7620.920.470.8700.6000.430679106
MACCS-Tree0.8370.7600.930.470.8710.6430.457689105
Test setExt-RF0.7390.8501.000.250.7141.000.42215260
Ext-SVM0.6520.8501.000.000.6520015080
Ext-LR0.8260.8001.000.500.7891.000.62815440
PubChem-LR0.7830.8331.000.380.7501.000.53015350
PubChem-RF0.7390.8750.930.380.7370.7500.38714351
Ext-ANN0.8260.7581.000.500.7891.000.62815440
PubChem-ANN0.8260.9331.000.500.7891.000.62815440
Sub-LR0.7830.6750.870.630.8120.7140.50913532
Sub-Tree0.7390.6540.930.380.7370.7500.38714351
MACCS-Tree0.7390.7830.930.380.7370.7500.38714351
Table 2. PubChem fingerprint-based privileged substructures responsible for CK2 inhibition.
No.Privileged
Substructures
General
Substructures
Representative
Compounds
IGFPFN
PubChemFP439C(-C)(-N)(=O) Processes 09 02074 i001 Processes 09 02074 i0020.0071.31(2)0(0)
PubChemFP807OC1CC(Br)CCC1 Processes 09 02074 i003 Processes 09 02074 i0040.0101.31(3)0(0)
PubChemFP38
PubChemFP815
>= 2 ClClC1CC(Cl)CCC1 Processes 09 02074 i005 Processes 09 02074 i0060.014
0.014
1.31(4)
1.31(4)
0(0)
0(0)
PubChemFP193>= 3 saturated or aromatic carbon-only ring size 6 Processes 09 02074 i007 Processes 09 02074 i0080.0141.31(4)0(0)
PubChemFP806OC1CC(Cl)CCC1 Processes 09 02074 i009 Processes 09 02074 i0100.0141.31(4)0(0)
PubChemFP785OC1CCC(Cl)CC1 Processes 09 02074 i011 Processes 09 02074 i0120.0321.31(9)0(0)
PubChemFP818CC1C(C)CCCC1 Processes 09 02074 i013 Processes 09 02074 i0140.0321.31(9)0(0)
PubChemFP505
PubChemFP551
PubChemFP827
Cl-C:C-O
Cl-C-C-O
OC1C(Cl)CCCC1
Processes 09 02074 i015 Processes 09 02074 i0160.011
0.011
0.011
1.19(10)
1.19(10)
1.19(10)
0.39(1)
0.39(1)
0.39(1)
PubChemFP801CC1CC(Cl)CCC1 Processes 09 02074 i017 Processes 09 02074 i0180.0271.23(16)0.24(1)
FP and FN represent frequencies of substructure presenting in “P” and “N” class, respectively.
Publisher’s Note: MDPI stays neutral with regard to jurisdictional claims in published maps and institutional affiliations.

