
Analysis of Dynamic Characteristics for Machine Tools Based on Dynamic Stiffness Sensitivity


1
Beijing Zhenxing Institute of Metrology and Measurement, Beijing 100074, China
2
School of Statistics and Mathematics, Zhongnan University of Economics and Law, Wuhan 430073, China
3
School of Mechanical Science and Engineering, Huazhong University of Science and Technology, Wuhan 430074, China
*
Author to whom correspondence should be addressed.
Processes 2021, 9(12), 2260; https://0-doi-org.brum.beds.ac.uk/10.3390/pr9122260
Submission received: 29 November 2021
/
Revised: 12 December 2021
/
Accepted: 13 December 2021
/
Published: 15 December 2021
(This article belongs to the Special Issue Numerical Simulation of Nonlinear Dynamical Systems)
Abstract
:Dynamic parameters are the intermediate information of the entirety of machine dynamics. The differences between components have not been combined with the structural vibration in the cutting process, so it is difficult to directly represent the dynamic characteristics of the whole machine related to spatial position. This paper presents a method to identify sensitive parts according to the dynamic stiffness-sensitivity algorithm, which represents the dynamic characteristics of the whole machine tool. In this study, two experiments were carried out, the simulation verification experiment (dynamic experiment with variable stiffness) and modal analysis experiment (vibration test of five-axis gantry milling machine). The key modes of sensitive parts obtained by this method can represent the position-related dynamic characteristics of the whole machine. The characteristic obtained is that the inherent properties of machine-tool structure are independent of excitation. The method proposed in this paper can accurately represent the dynamic characteristics of the whole machine tool.
1. Introduction
Against the background of advanced manufacturing, chatter has become a key problem hindering the development of machine tools for high-speed and high-precision machining. Hung J et al. proposed that the machining performance of a machine tool is jointly determined by the machine tool’s structure and spindle tool, and the dynamic characteristics of machine tools are expressed in different forms in different frequency ranges, such as low-frequency structural mode and high-frequency tool mode [1]. Munoa J et al. found, through research on the cutting stability of different materials processed by machine tools, that, for aluminum processing, chatter is mainly related to the tool mode (high frequency), and the cutting stability is highly dependent on the tool rather than the position of the machine tool [2]. For the machining of iron, the chatter is mainly related to the structural mode (low frequency), and the cutting stability is highly dependent on the dynamic characteristics of the structure rather than the tool. Due to the complexity of machine-tool dynamics, different scholars have different research priorities. Schmitz et al. mainly focused on the dynamic kneading degree of the tool tip [3], while Weck M et al. paid more attention to the whole machine mode and the frequency response function (FRF) of the tool tip [4]. Altintas Y et al. pointed out in the modal analysis of the actual machine tool that the machine-tool structure, as the boundary condition of the spindle tool system, will affect the tool tip’s FRF [5]. Therefore, the tool or structure cannot be isolated in the study of the dynamic characteristics of the machine tool.
A change in the spatial position of the movable parts of the machine tool will lead to a change in the mass matrix, stiffness matrix, and damping matrix of the system, resulting in a change in the dynamic characteristics of the machine tool. Weck M et al. also proposed that the research on the dynamic characteristics of the machine tool should be comprehensively analyzed from the workspace as early as last century [4]. Baumann J et al. proposed an interpolation method of dynamic parameter values based on a dynamic model to obtain the FRF of different spatial positions of machine tools [6]. Law M et al. proposed a simplified finite element model based on multi-body dynamics and modified the model according to experimental modal analysis (EMA), so as to quickly present the dynamic characteristics of machine tools in different positions and directions [7]. Luo B et al. put forward the concept of the spatial sensitivity of machine-tool dynamics in order to quickly and efficiently obtain the dynamics of the whole space position of a machine tool, so as to reveal the variation law of dynamics related to machine-tool position and predict the dynamics [8]. Deng C et al. proposed a milling-stability prediction method based on the Kriging model [9]. The dynamic characteristics of the whole machine tool are jointly determined by the spindle tool system and structure. The structural dynamic characteristics are predicted by the Kriging model and combined with the spindle tool system by the receptance coupling substructure analysis (RCSA) technique, so as to predict the FRF of the tool tip at any spatial position. Berthold J et al. evenly divided the machine-tool workspace and selected 45 representative points to study the dynamic characteristics of the machine tool in the whole space through special cutting technology and modal analysis methods [10].
The dynamic characteristics of the whole machine tool have not only position correlation, but also running-speed correlation [11,12]. Munoa J et al. pointed out that the dynamic characteristics of the machine tool in the running state are very different from those in the static state, and a failure to accurately obtain the dynamics of the machine tool in the normal machining state leads to flutter prediction error [13]. M. Weck et al. conducted an EMA of the machine tool under static and running conditions, and the results showed that the maximum difference in the amplitude of the structural response was approximately 30% [4]. Gagnol V et al. analyzed the interaction and weak-link identification of various parts of the machine tool under different machining parameters [14]. The experimental results showed that a difference in machining parameters will have a significant impact on the dynamic characteristics of the whole machine. Wan M et al. proposed a method to identify machining damping directly from a chatter-free milling test, and established a functional model between cutting process damping and cutting parameters, so as to more accurately analyze the dynamic characteristics of machine tools [15]. Yue C et al. established the process-damping prediction model, considered the process-damping effect and workpiece dynamic characteristics by using the full discrete method, and then analyzed the stable lobe diagram of different cutting parameters [16].
Peng Y et al. divided the whole machine-tool workspace, selected limited representative points, and then identified the natural frequency and damping ratio of each position individually and represented the dynamic characteristics of the machine tool [17]. However, such dynamics are the intermediate information about the dynamics of the whole machine tool. The differences between various parts of the machine tool have not been combined with the structural vibration in the cutting process of the machine tool, so it is difficult to directly represent the dynamic characteristics of the whole machine tool [18]. Miao J et al. analyzed the cutting trajectory and the intermediate frequency waveform error to indirectly obtain the vibration of the tool tip [19]. Through the analysis, it was found that the vibration of the frequency waveform error of the tool tip was dominated by the sixth-order mode in the finite element modal analysis, rather than the participation of all modes to the same extent. Yin L et al. studied the relationship between workpiece surface morphology and machine-tool mode [20]. The mode with large participation in the vibration signal also dominates the workpiece surface morphology, so the workpiece morphology can be predicted according to the dominant mode of the machine tool. He S et al. proposed the concept of a modal mass distribution matrix to evaluate the dynamic characteristics and weak parts of machine tools [21]. Zaghbani I et al. proposed to use the dominant mode to represent the dynamic characteristics of the whole machine [22]. The experiment showed that a change in the spatial position of the machine tool will lead to a change in the number and energy proportion of the dominant modes. Shen L et al. pointed out that the optimization of some parts of the machine tool does not necessarily improve the machining performance of the whole machine; rather, one should first identify and optimize the weak parts according to the dominant mode, so as to improve the dynamic characteristics of the machine tool [23]. Deng C et al. put forward the theory of modal flexibility and elastic energy distribution to judge the sensitive modes and weak links of machine tools, and find the optimal stiffness configuration by using an orthogonal test method, so as to reduce the flexibility of sensitive modes [24]. Zulaika J J et al. analyzed the sensitivity of each mode to improve the cutting stability lobe and optimized the components that have the greatest impact on the sensitive mode, so as to improve the cutting stability of the machine tool in all directions [25].
Position-related dynamics are the intermediate information about machine-tool dynamics, which are unable to directly reflect the spatial position-related dynamic characteristics of a machine tool. This paper presents a method to reflect the dynamic characteristics of the whole machine tool which converts the dynamic characteristics of the whole machine tool to the key modes of sensitive components according to the sensitivity of dynamic stiffness. Firstly, dynamic stiffness is explained by modal analysis theory, and the method of judging sensitive components is introduced. Then, the accuracy of the method is verified by simulation experiments with different physical parameters. Finally, the sensitive parts of the five-axis gantry milling machine are analyzed using a dynamic stiffness-sensitivity algorithm. Compared with the prediction results of LMS (professional modal test software of Siemens), it is verified that the key modes of sensitive components proposed in this paper can accurately represent the dynamic characteristics of the whole machine tool.
2. Dynamics of Machine Tools Based on Dynamic Stiffness Sensitivity
2.1. Dynamics of Machine Tools
At present, the dynamic characteristic analysis of machine tools is mainly divided into the finite element analysis (FEA) method and EMA method. The FEA method is mainly used in the initial stage of machine-tool design and development. It analyzes the dynamic characteristics of the whole machine through modeling, assembly, meshing, and adding constraints to the machine tool and its components. However, this method has the disadvantages of complex calculation, large time consumption, and low accuracy. The EMA method is based on the measured FRF of the machine tool, and it analyzes the modal characteristics and weak parts of the machine tool, so as to analyze the dynamic characteristics of the machine tool. As the machine tool is a complex system composed of many parts, the EMA method based on the actual machine tool is more reliable. When the spatial position of the machine tool changes, the mass matrix, stiffness matrix, and damping matrix of the whole machine caused by the moving parts will change, resulting in a change in the number of dominant modes and the energy ratio of the whole machine tool or each part. As the intermediate information of machine-tool dynamics, the dynamics obtained from modal analysis do not combine the differences in the machine-tool space and components with the specific application in the machining process of an NC machine tool, so they cannot directly represent the dynamic characteristics of the whole machine related to the position of the machine tool and analyze the vibration characteristics in the machining process.
In view of the shortcomings and defects of the existing methods, a characterization method of the dynamic characteristics of the machine tool based on the sensitivity of dynamic stiffness is proposed in this paper. Dynamic stiffness sensitivity is defined as the change rate of the characteristic modal dynamic stiffness of the machine tool relative to the structural parameters, including the mass, stiffness, or damping of the component. Firstly, the dynamics of the measured system are identified through EMA, and then the sensitivity of the dynamic stiffness of each order mode to the stiffness change between the measuring points of each component is analyzed, so as to obtain the sensitivity of each component of each order mode. If the dynamic stiffness sensitivity of each component to the change in relative stiffness is similar, the whole system has no sensitive component in this mode. If the dynamic stiffness sensitivity of a component to the change in relative stiffness is large, the component is determined as the sensitive component of this order mode. The sensitive component has component-related and frequency-band-related characteristics, and the determined sensitive component is the inherent characteristic of the machine tool, which is independent of the excitation force. Through the comprehensive analysis of the dynamic stiffness sensitivity of each component of each mode, the key modes of the sensitive components are obtained in order to represent the dynamic characteristics of the whole machine. This method combines the differences between dynamics and multi-component dynamic characteristics, and realizes the transformation of structural dynamics into the key modes of sensitive components of machine tools according to the dynamic stiffness-sensitivity algorithm, so as to obtain the characterization of the dynamic characteristics of the whole machine related to the position of the machine tool.
The equation of motion of an undamped multi-degree-of-freedom system is expressed as:
where [M] is the system mass matrix and [K] is the system stiffness matrix, both of which are symmetric matrices, and; {X} and are displacement vectors and acceleration vectors, respectively.
Through transformation, the FRF of the system is obtained:
where mr is the r-th modal mass of the system, kr is the r-th modal stiffness of the system, and is the r-th modal mode shape of the system, .
The r-th order modal stiffness is defined by the stiffness matrix and vibration mode vector:
Derivative of Equation (2) relative to structural parameter p:
when the structural design parameter p is the stiffness matrix K.
Sensitivity expression of the r-th modal dynamic stiffness relative to the stiffness between various degrees of freedom of the system:
According to Equation (6), the coefficient of the r-th modal dynamic stiffness relative to each degree of freedom of the system is the same, and the difference is mainly proportional coefficient .
In order to obtain the sensitive component of relative stiffness change under a certain mode, it is necessary to analyze the sensitivity ratio of the dynamic stiffness of this mode to the stiffness change in each measuring point of each component, so as to be the sensitive component according to the sensitivity proportion coefficient. For example, the sensitivity ratio of the dynamic stiffness of the second mode to the system stiffness parameters Kij and Kmn is:
We can use Equation (8) to calculate the sensitivity of the dynamic stiffness of the machine tool to the stiffness between each unit of the machine tool. In the process of a modal experiment, the acceleration sensor is arranged on the key components of the machine tool. Each acceleration sensor installed on the surface of the machine tool is defined as a test unit, and the modal data of each test unit can be obtained through experiments. If the acceleration sensor is installed on the base, workbench, spindle, and other components of the machine tool, the dynamic stiffness sensitivity of the relative stiffness of the component can be calculated through the sensitivity of all test units on the component, and its statistical principle is as follows:
where ak represents the sensitivity proportional coefficient of a modal dynamic stiffness relative to the stiffness change in the component, and akn represents the sensitivity proportional coefficient of a modal dynamic stiffness relative to the stiffness change in the n-th measuring point of the component.
2.2. Dynamic Simulation Verification of Variable Stiffness
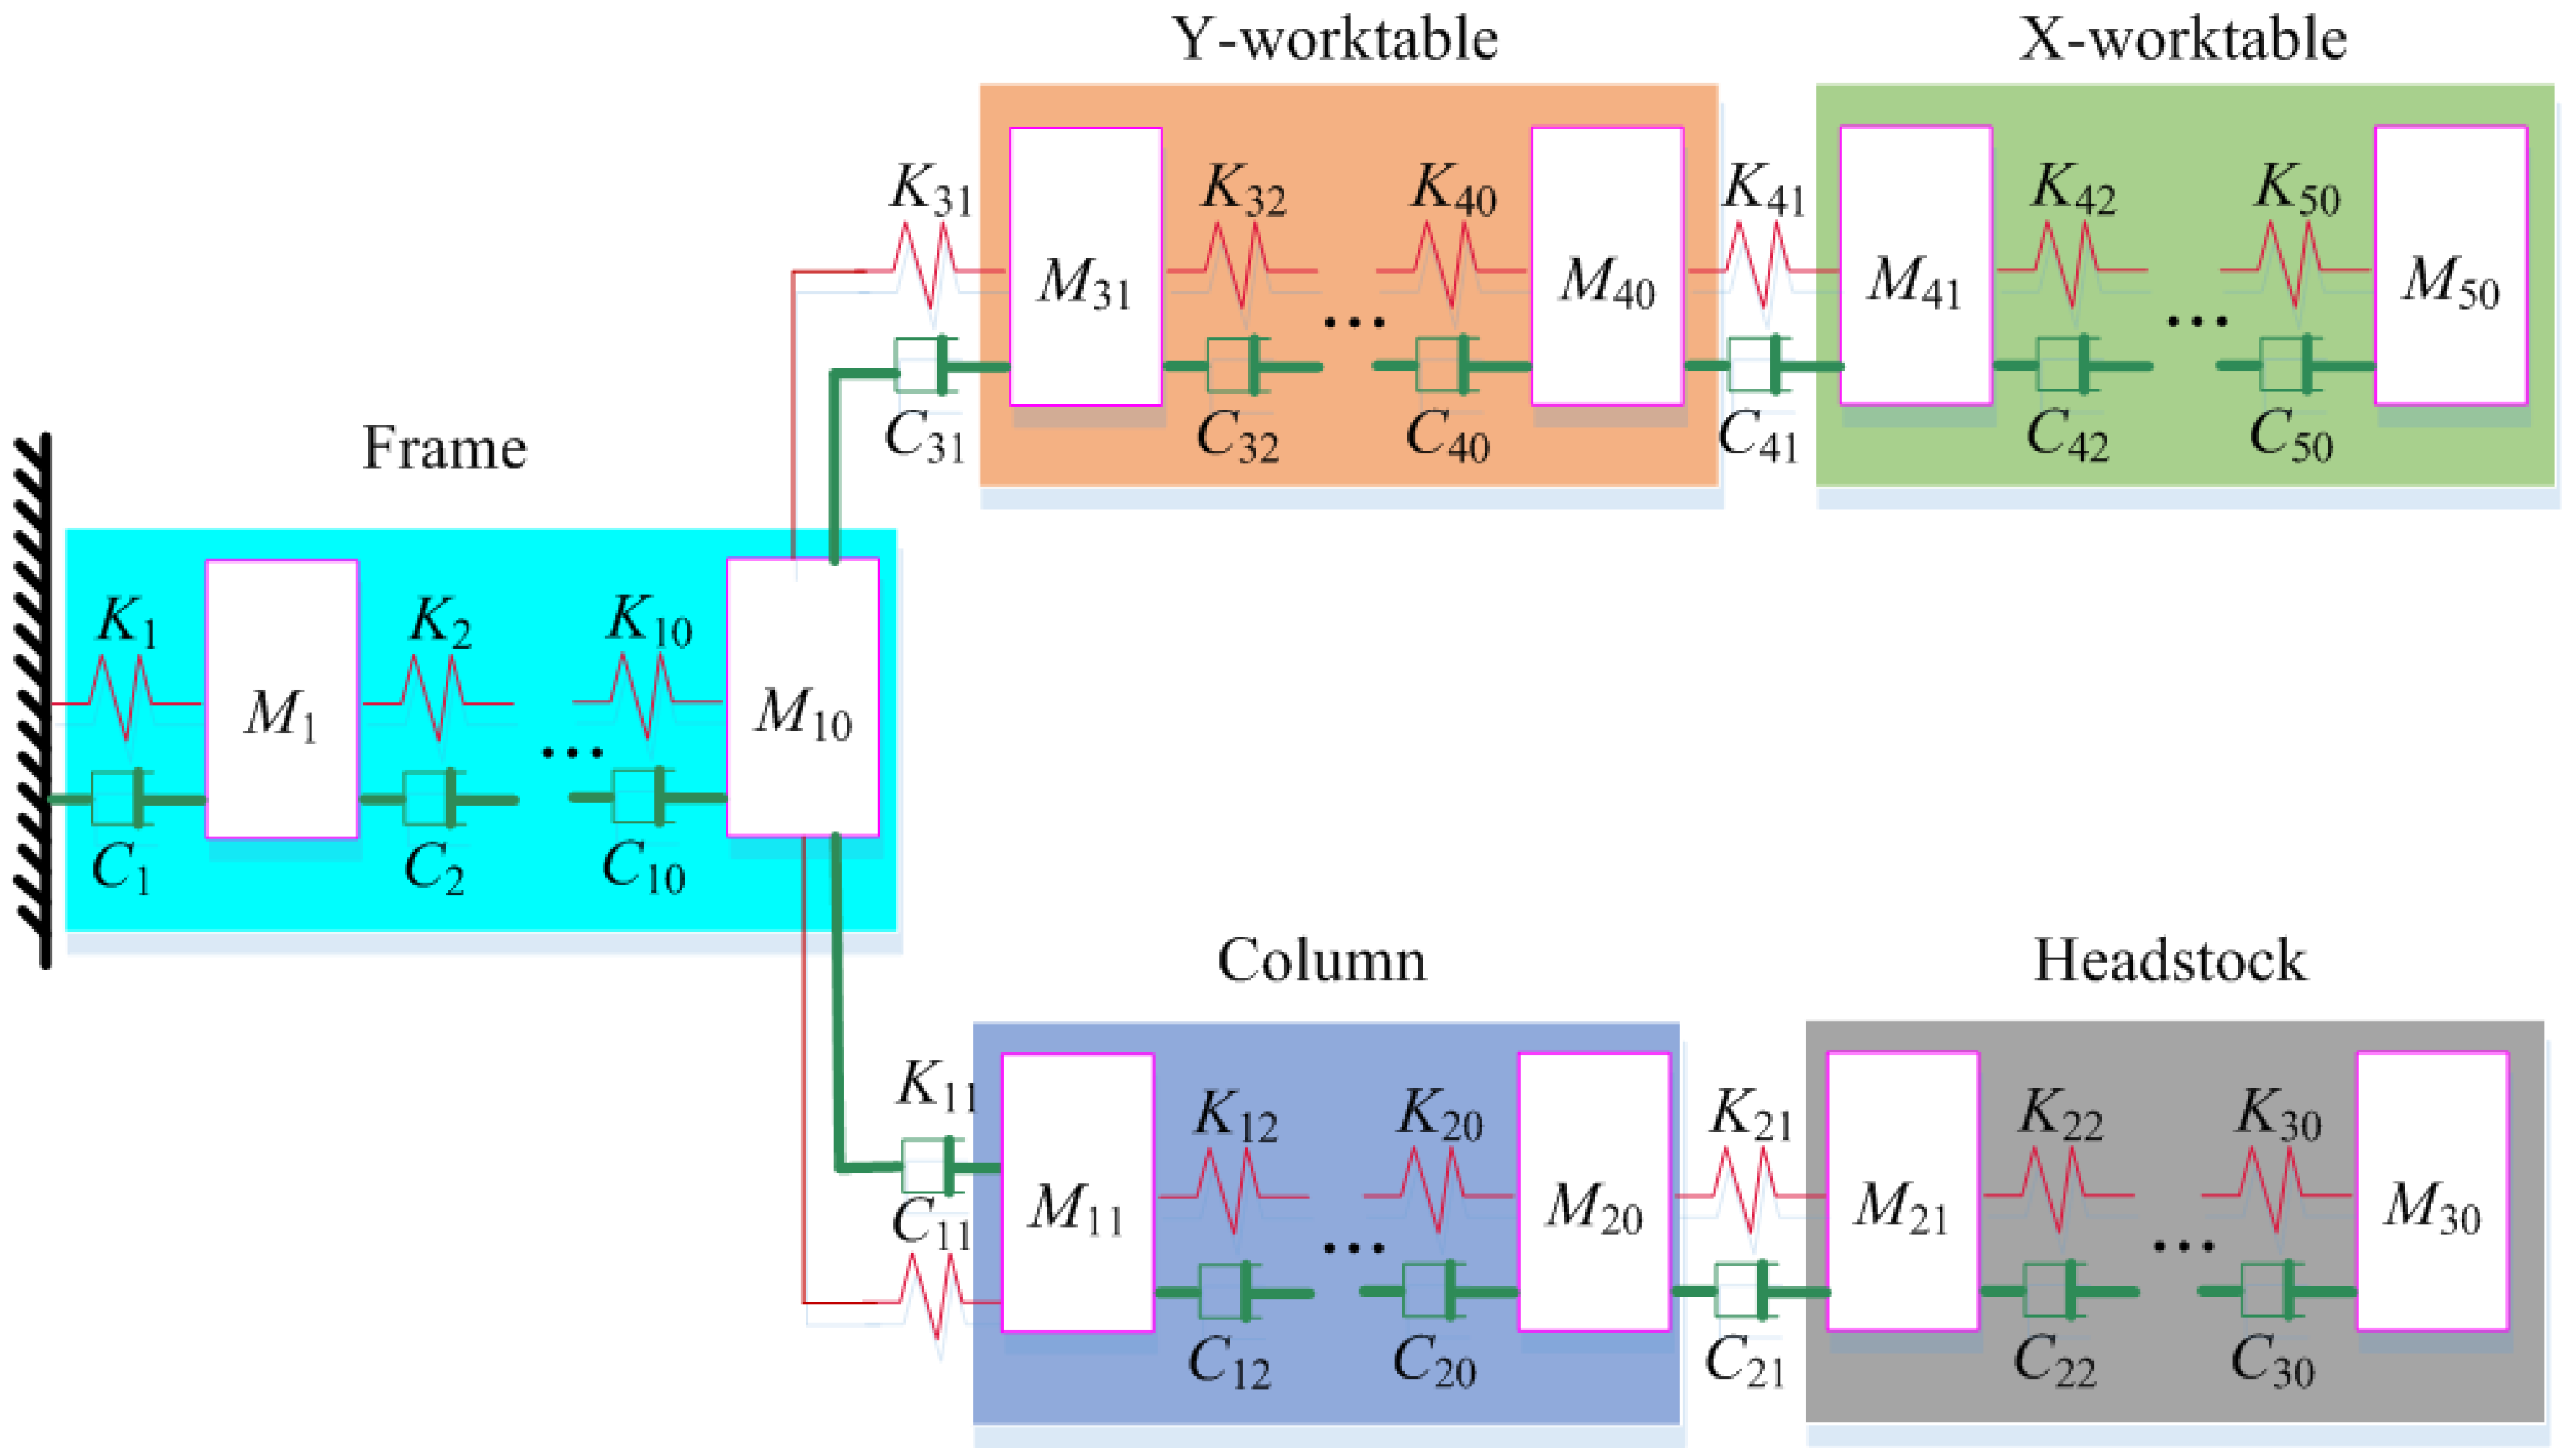
In Section 2.1, based on the modal vibration analysis theory, the judgment method of sensitive parts based on dynamic stiffness sensitivity is described through theoretical derivation, and the set of structural dynamics is transformed into the key modes of sensitive parts of a machine tool, so as to represent the position-related dynamic characteristics of the whole machine. However, the accuracy of the method of judging sensitive parts by the dynamic stiffness sensitivity of relative stiffness change needs to be verified. Therefore, this section establishes a simulation system to verify the accuracy of the dynamic stiffness-sensitivity method to determine sensitive components. In order to improve the similarity between the simulation model and the actual machine-tool system, a simulation system similar to the distribution of machine-tool components is established in this section, as shown in Figure 1 [21]. For the established spring mass simulation system, two groups (group A and group B) of physical parameters are defined, so as to more intuitively analyze the sensitivity of dynamic stiffness and determine the accuracy of sensitive parts. Sensitive parts are established by setting a smaller stiffness value between the internal degrees of freedom of the parts, i.e., the parts with smaller stiffness are sensitive parts. In group A, there are no sensitive parts, the mass of each mass block is 1 kg, and the stiffness of each connection point is 1000 N/m. In group B, there are sensitive parts, the mass of each mass block is 1 kg, the stiffness values of connection points (No. 11, 21, 31, and 41) are 1 N/m, and the others are 1000 N/m. For the above two groups, the system mass and system stiffness are defined, respectively; then, the modal analysis of the system is carried out to obtain the dynamics, the dynamic stiffness-sensitivity analysis of the relative stiffness change is carried out to determine the sensitive components, and, finally, the analyzed sensitive components are compared with the set sensitive components. If the sensitive components identified according to the dynamic stiffness sensitivity are the same as the set sensitive components, it is proven that the method proposed in this paper can effectively identify the sensitive components.
As shown in Figure 1, the simulation system includes five components and 50 degrees of freedom [21]. Among them, degrees of freedom 1–10 represent the base, degrees of freedom 11–20 represent the column, degrees of freedom 21–30 represent the headstock, degrees of freedom 31–40 represent the Y workbench, and degrees of freedom 41–50 represent the X workbench.
Since the simulation system is an undamped system, the damping of each degree of freedom of the simulation system is:
C1 = C2 =… = C50= 0
The mass of each degree of freedom of the simulation system is set as:
M1 = M2 =… = M50 = 1 kg
For case A, if sensitive parts are not included, the internal stiffness of the parts is consistent:
For case B, the sensitive part is set as the headstock, the stiffness of other parts is still, and the stiffness of the headstock is:
The stiffness matrix of the system is further described as follows:
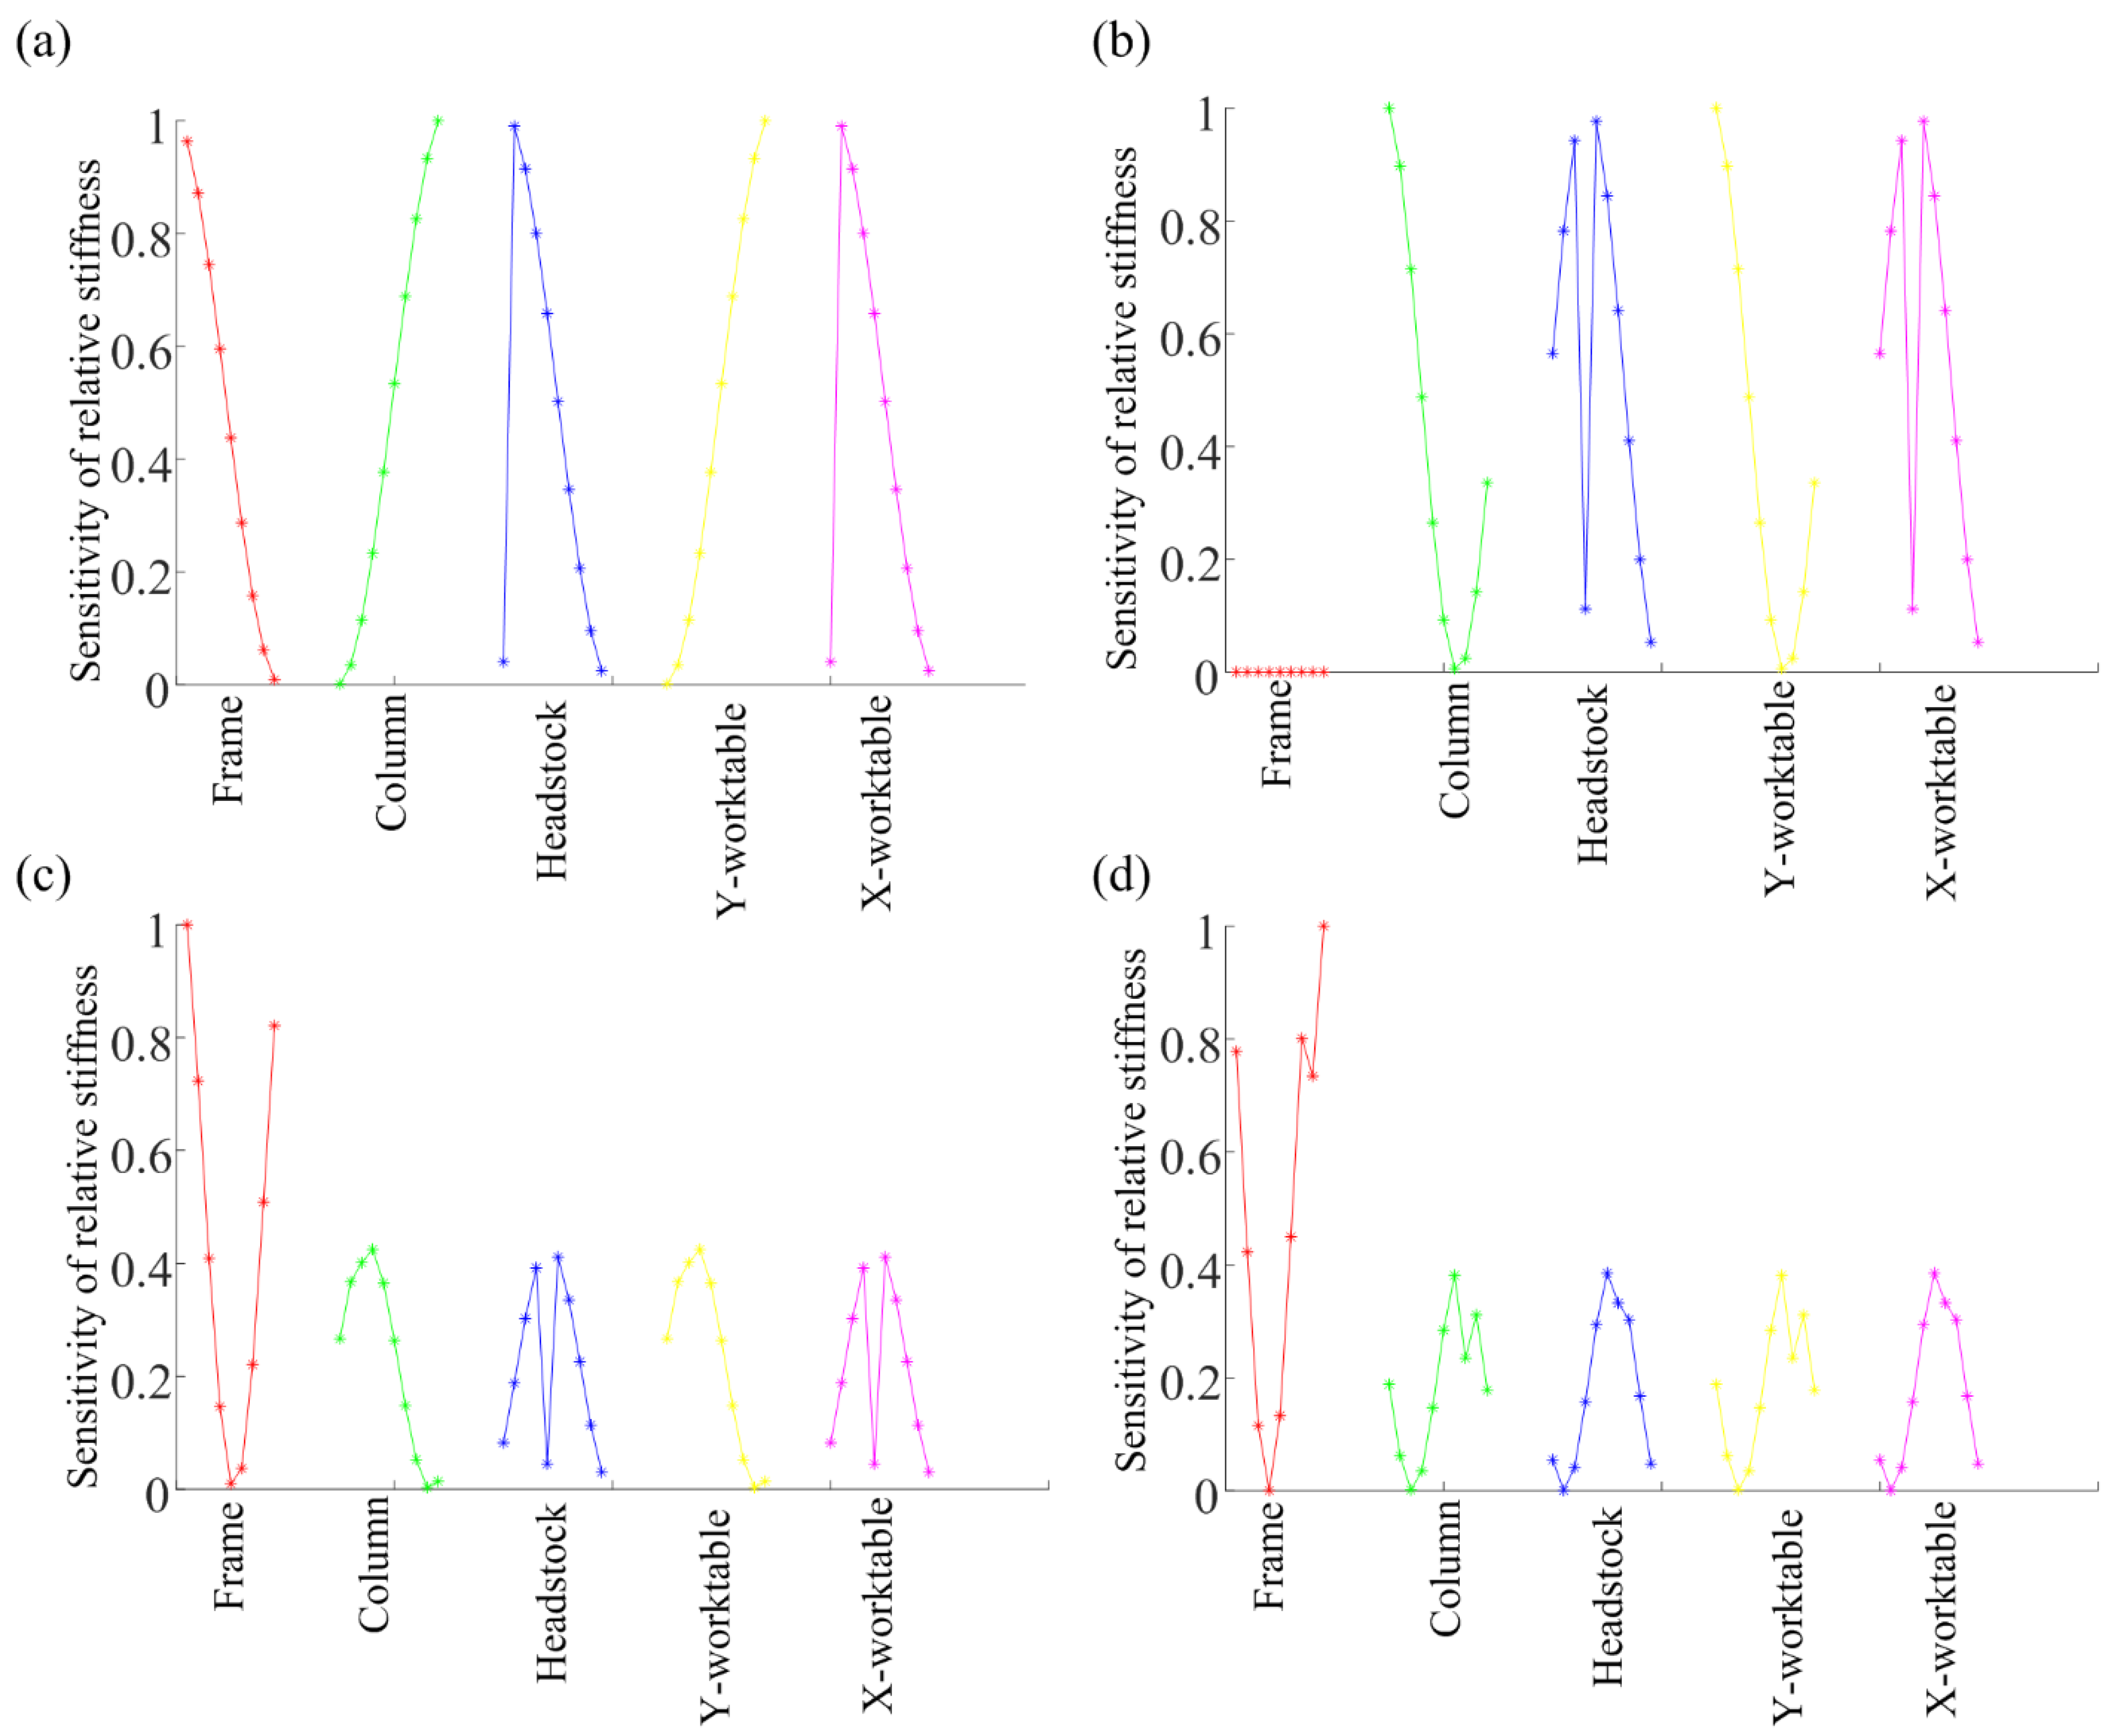
Place the mass matrix and stiffness matrix of case A and case B into Equation (1), respectively, to obtain the natural frequency and vibration mode of the first four modes of the system, so as to analyze the dynamic stiffness sensitivity of each measuring point of the system in each case. Firstly, in case A, the dynamic stiffness sensitivity of the relative stiffness change of each degree of freedom of the system is analyzed, as shown in Figure 2. The red asterisk in the figure represents the dynamic stiffness sensitivity of the relative stiffness change of each degree of freedom of the base; the green star point in the figure represents the dynamic stiffness sensitivity of the relative stiffness change of each degree of freedom of the main shaft; the blue asterisk in the figure represents the dynamic stiffness sensitivity of the relative stiffness change of each degree of freedom of the headstock; the yellow asterisk in the figure represents the dynamic stiffness sensitivity of the relative stiffness change of each degree of freedom of Y workbench; the magenta stars in the figure represent the dynamic stiffness sensitivity of the relative stiffness change of each degree of freedom of the X worktable. Figure 2a shows the first-order modal dynamic stiffness sensitivity of each degree of freedom of the system, and the dynamic stiffness sensitivity of relative stiffness changes of each component is basically the same; Figure 2b shows the second-order modal dynamic stiffness sensitivity of each degree of freedom of the system, and the dynamic stiffness sensitivity of the base relative to the stiffness change of other components is small; Figure 2c shows the second-order modal dynamic stiffness sensitivity of each degree of freedom of the system, and the dynamic stiffness sensitivity of the base is greater than that of other components. Figure 2d shows the fourth-order modal dynamic stiffness sensitivity of each degree of freedom of the system, and the dynamic stiffness sensitivity of the base is greater than that of other components. According to the analysis results of the fourth-order modal dynamic stiffness sensitivity of each degree of freedom of the system, the difference in each order modal dynamic stiffness sensitivity of different components is small, so the system has no sensitive components. The second-order modal dynamic stiffness sensitivity of the base is low, and the third- and fourth-order modal dynamic stiffness sensitivity of the base is high. This situation may be caused by the special spatial position of the base and the connection of multiple worktables and columns at the same time. Therefore, the slight difference in the modal dynamic stiffness sensitivity of each component may be related to the spatial position of the component in the system.
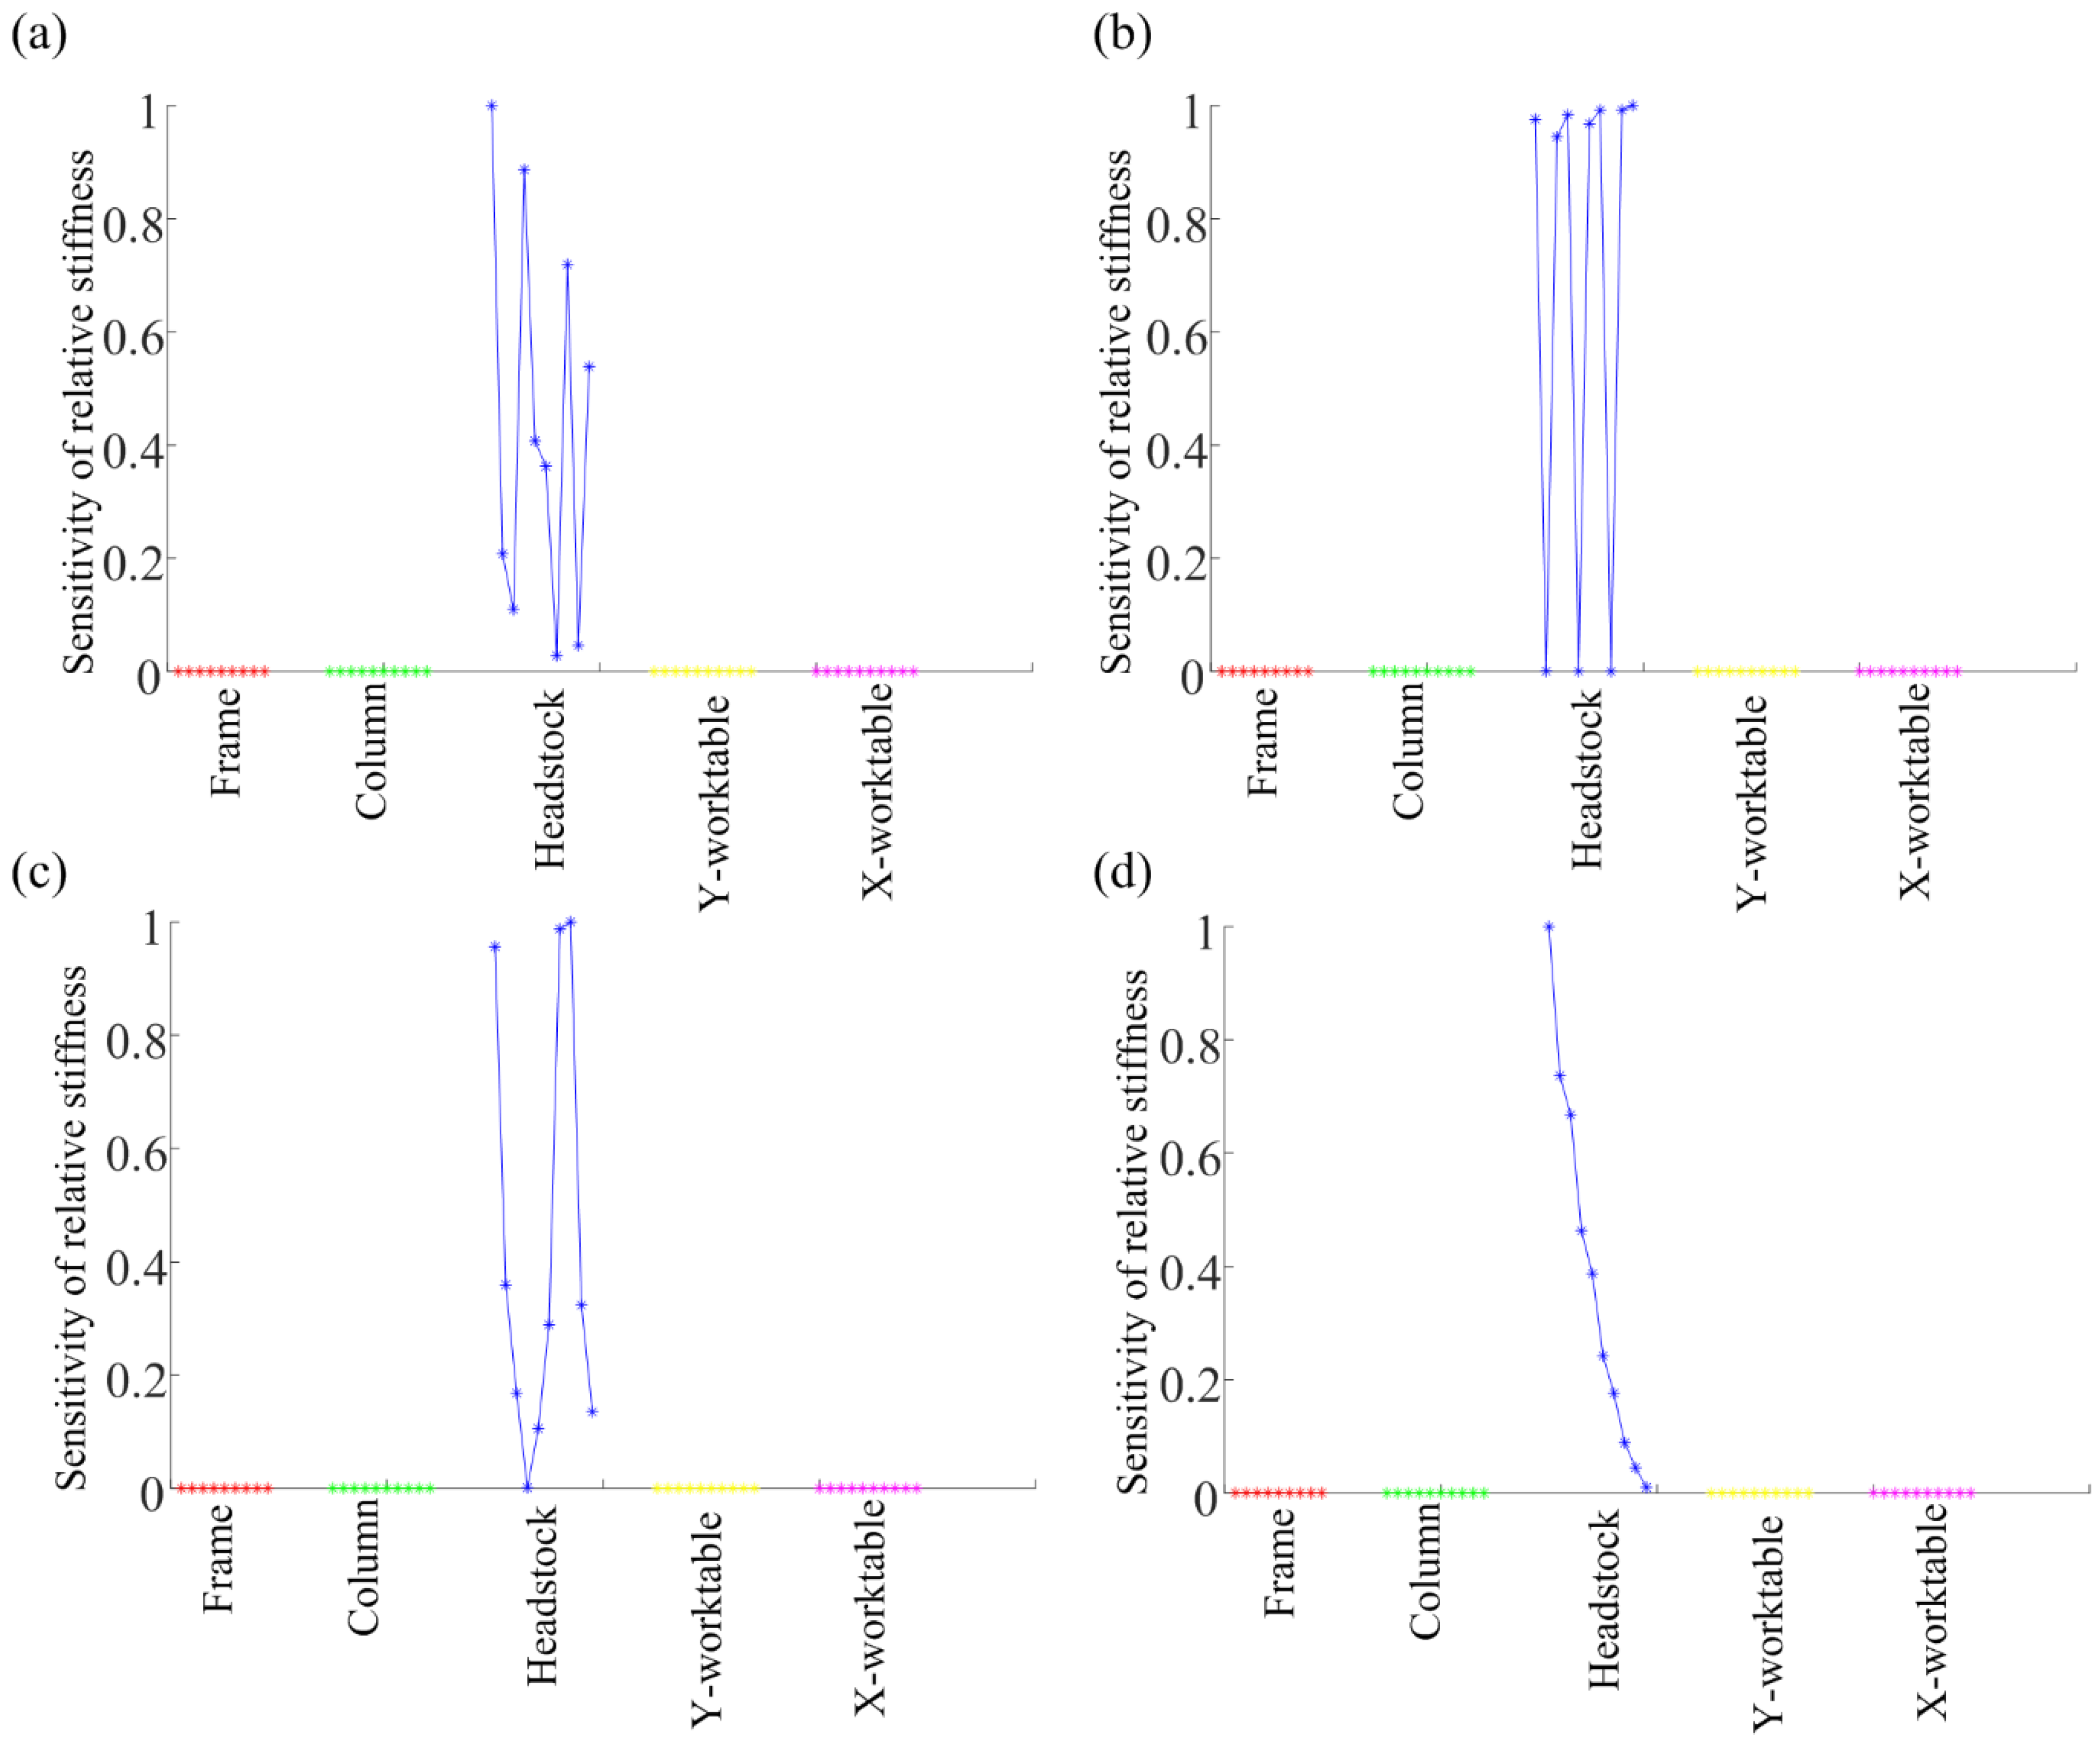
In case B, the dynamic stiffness sensitivity of the relative stiffness change of each degree of freedom of the system is analyzed, as shown in Figure 3. Figure 3a shows the first-order modal dynamic stiffness sensitivity of each degree of freedom of the system. The dynamic stiffness sensitivity of the spindle box is much greater than that of other components. In addition, Figure 3b shows the second-order modal dynamic stiffness sensitivity of each degree of freedom of the system, Figure 3c shows the third-order modal dynamic stiffness sensitivity of each degree of freedom of the system, and Figure 3d shows the fourth-order modal dynamic stiffness sensitivity of each degree of freedom of the system. In the second–fourth-order modal dynamic stiffness-sensitivity distribution diagrams, the modal dynamic stiffness sensitivity of the headstock is also greater than that of other components. From the results of the dynamic stiffness sensitivity of the first four modes of each degree, the dynamic sensitivity of the headstock stiffness change is much larger than that of other parts, and the headstock sensitivity ratio coefficient has obvious mutations. Therefore, the headstock was judged to be a sensitive part of the system, which was consistent with the set result, thus proving the accuracy of identifying sensitive parts based on the sensitivity of dynamic stiffness.
3. Verification of Dynamics of Variable-Position Machine Tool
3.1. Experimental Setup
In order to obtain the dynamics of the machine tool and analyze the sensitive parts, the EMA is carried out on the five-axis gantry machining center in this section. The main equipment selected for the EMA is shown in Table 1.
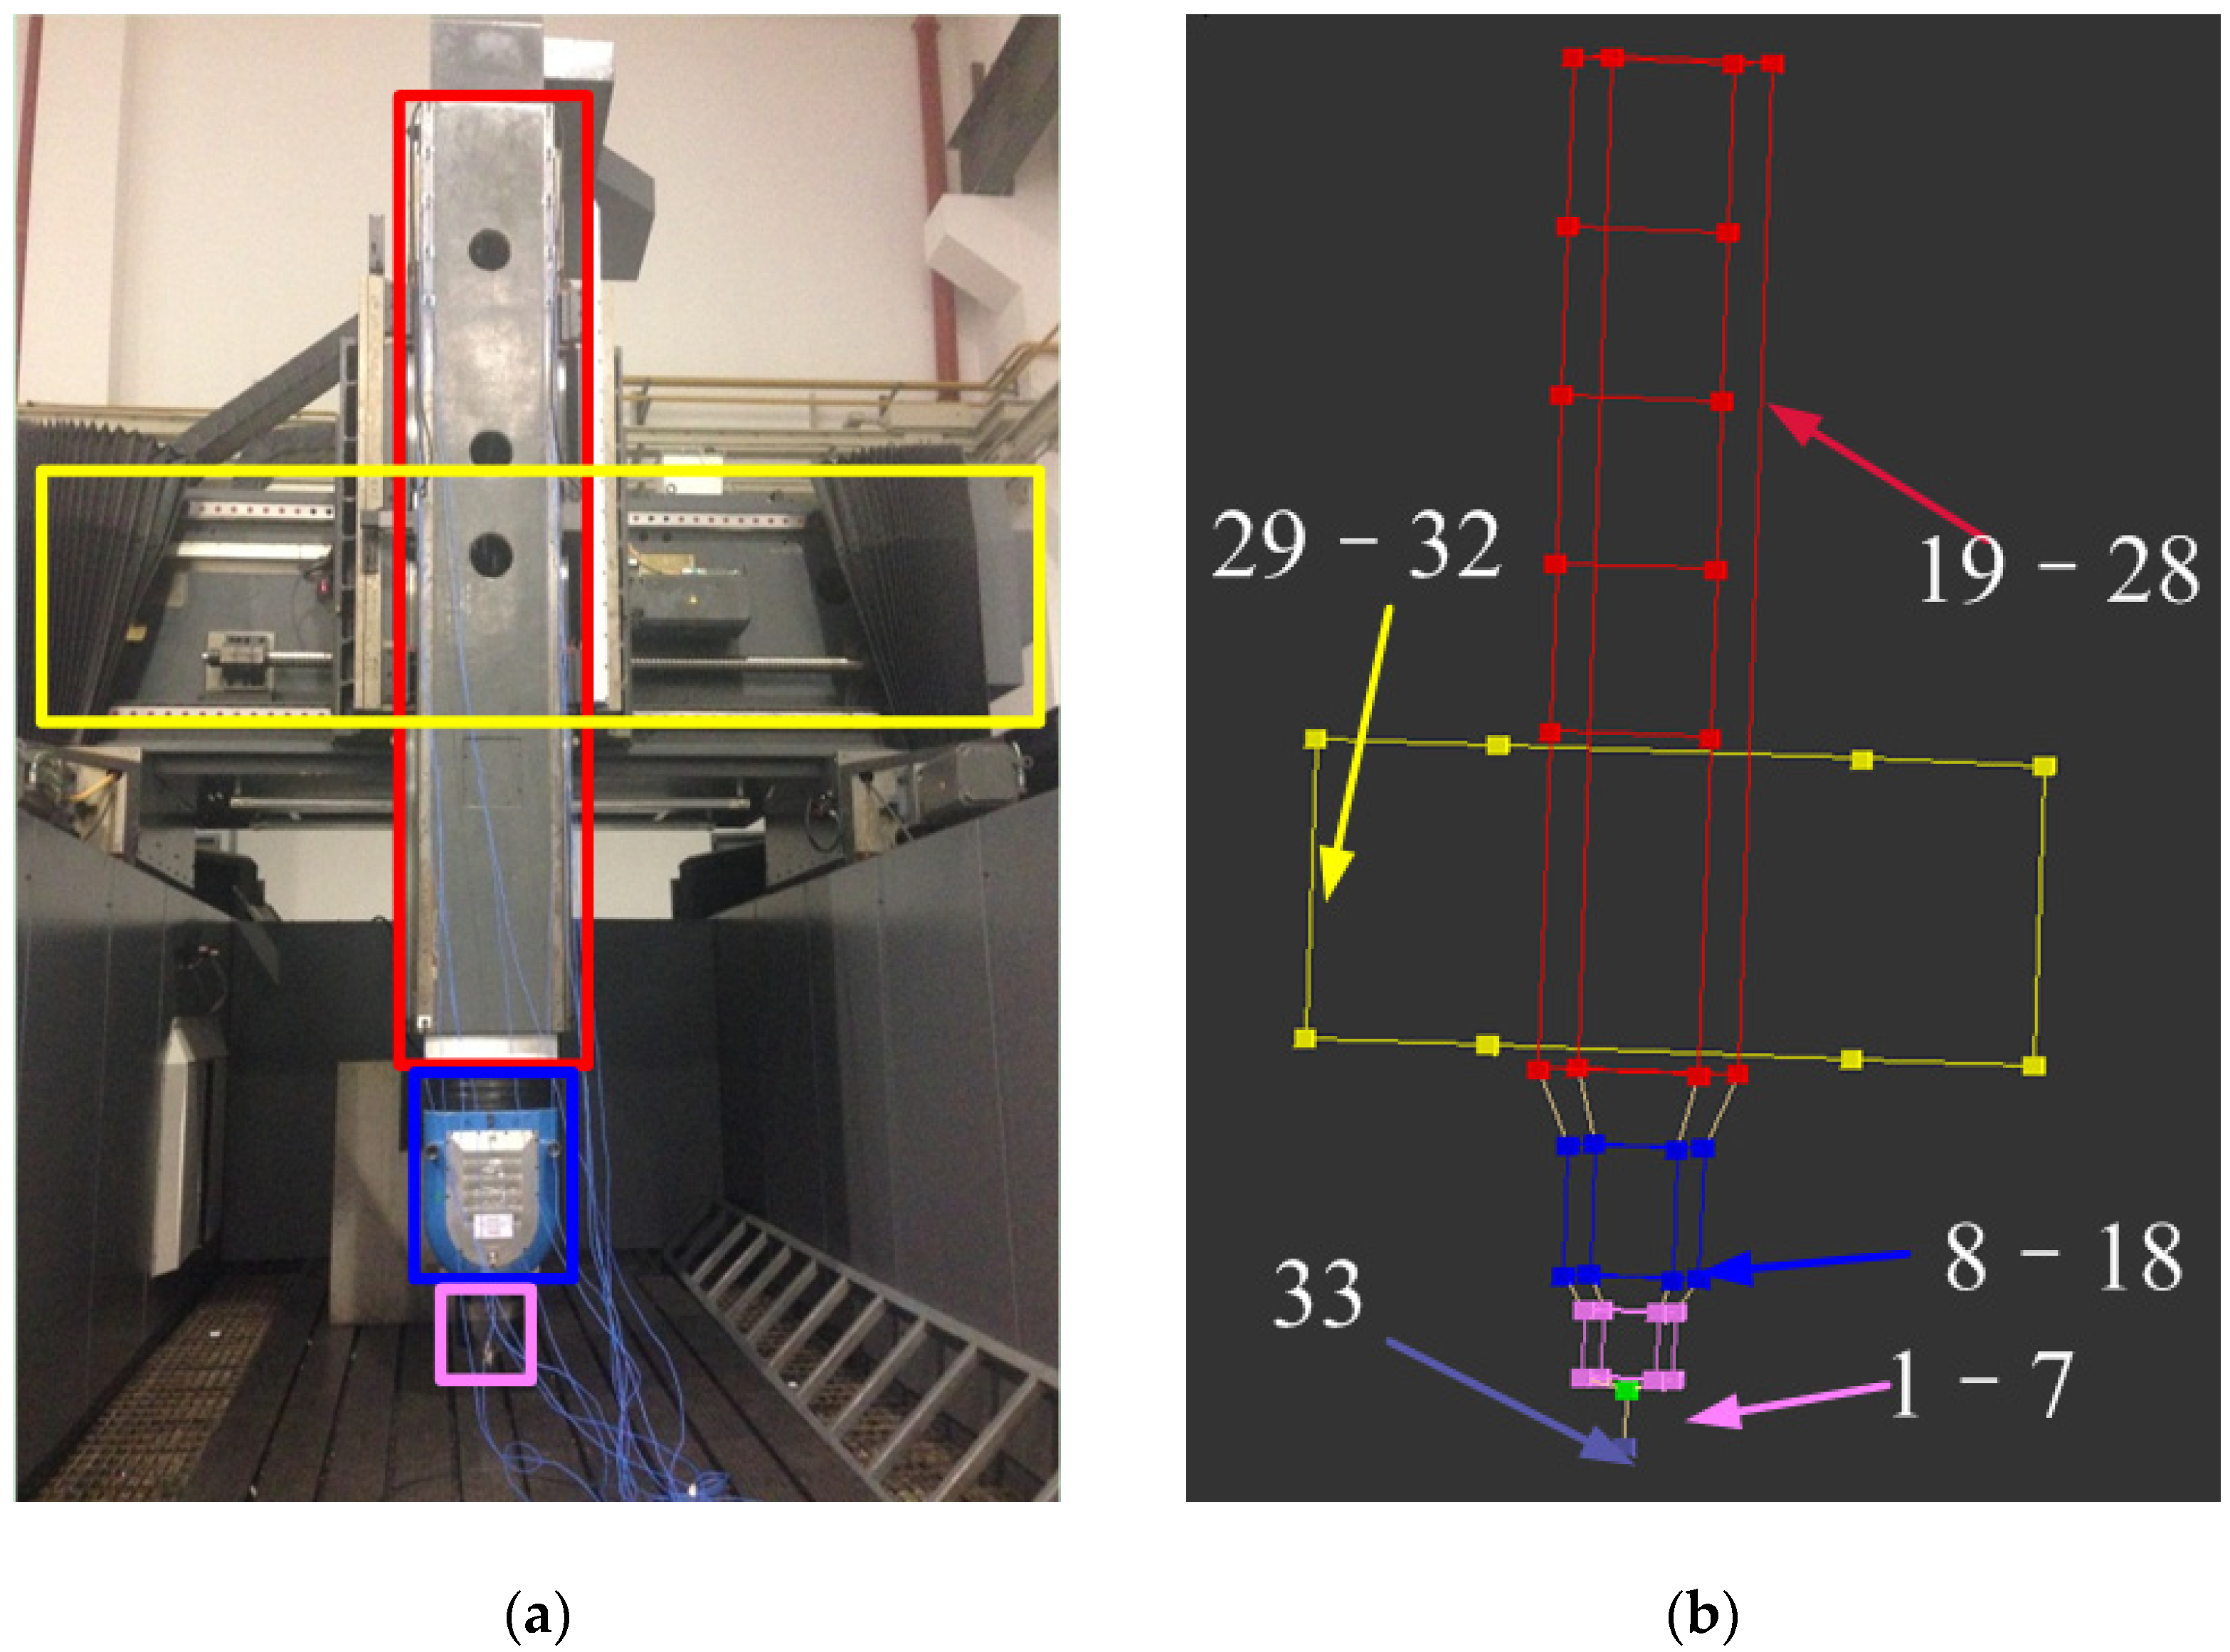
A total of 33 measuring points are arranged in the five-axis gantry machining center for measurement and analysis, as shown in the layout of measuring points in the percussion experiment in Figure 4, and three-way acceleration sensors are used for signal acquisition. Measuring points 1–7 are arranged on the spindle part, measuring points 8–18 are arranged on the spindle head part, measuring points 19–28 are arranged on the ram part, measuring points 29–32 are arranged on the beam part, measuring point 33 is arranged on the tool handle part, and measuring point 33 is set as the reference point of the experiment. As the data acquisition equipment can only connect 12 acceleration sensors at a time, with the exception that the three-way acceleration sensor on the spindle head component needs to be fixed as the reference point, the other 11 acceleration sensors move three positions, respectively, to complete the measurement of all measuring points.
3.2. EMA of Machine Tool
In Section 2, the method of identifying sensitive parts by dynamic stiffness sensitivity is described through theoretical derivation, and a multi-degree-of-freedom simulation system similar to the structural layout of the machine tool is established for verification. This section takes the solid machine tool as the experimental object, uses the dynamic stiffness-sensitivity method to identify the sensitive parts, and uses the modal modification prediction of LMS to modify and predict the sensitive parts, so as to further prove the practicability and reliability of the dynamic stiffness-sensitivity method to identify the sensitive parts.
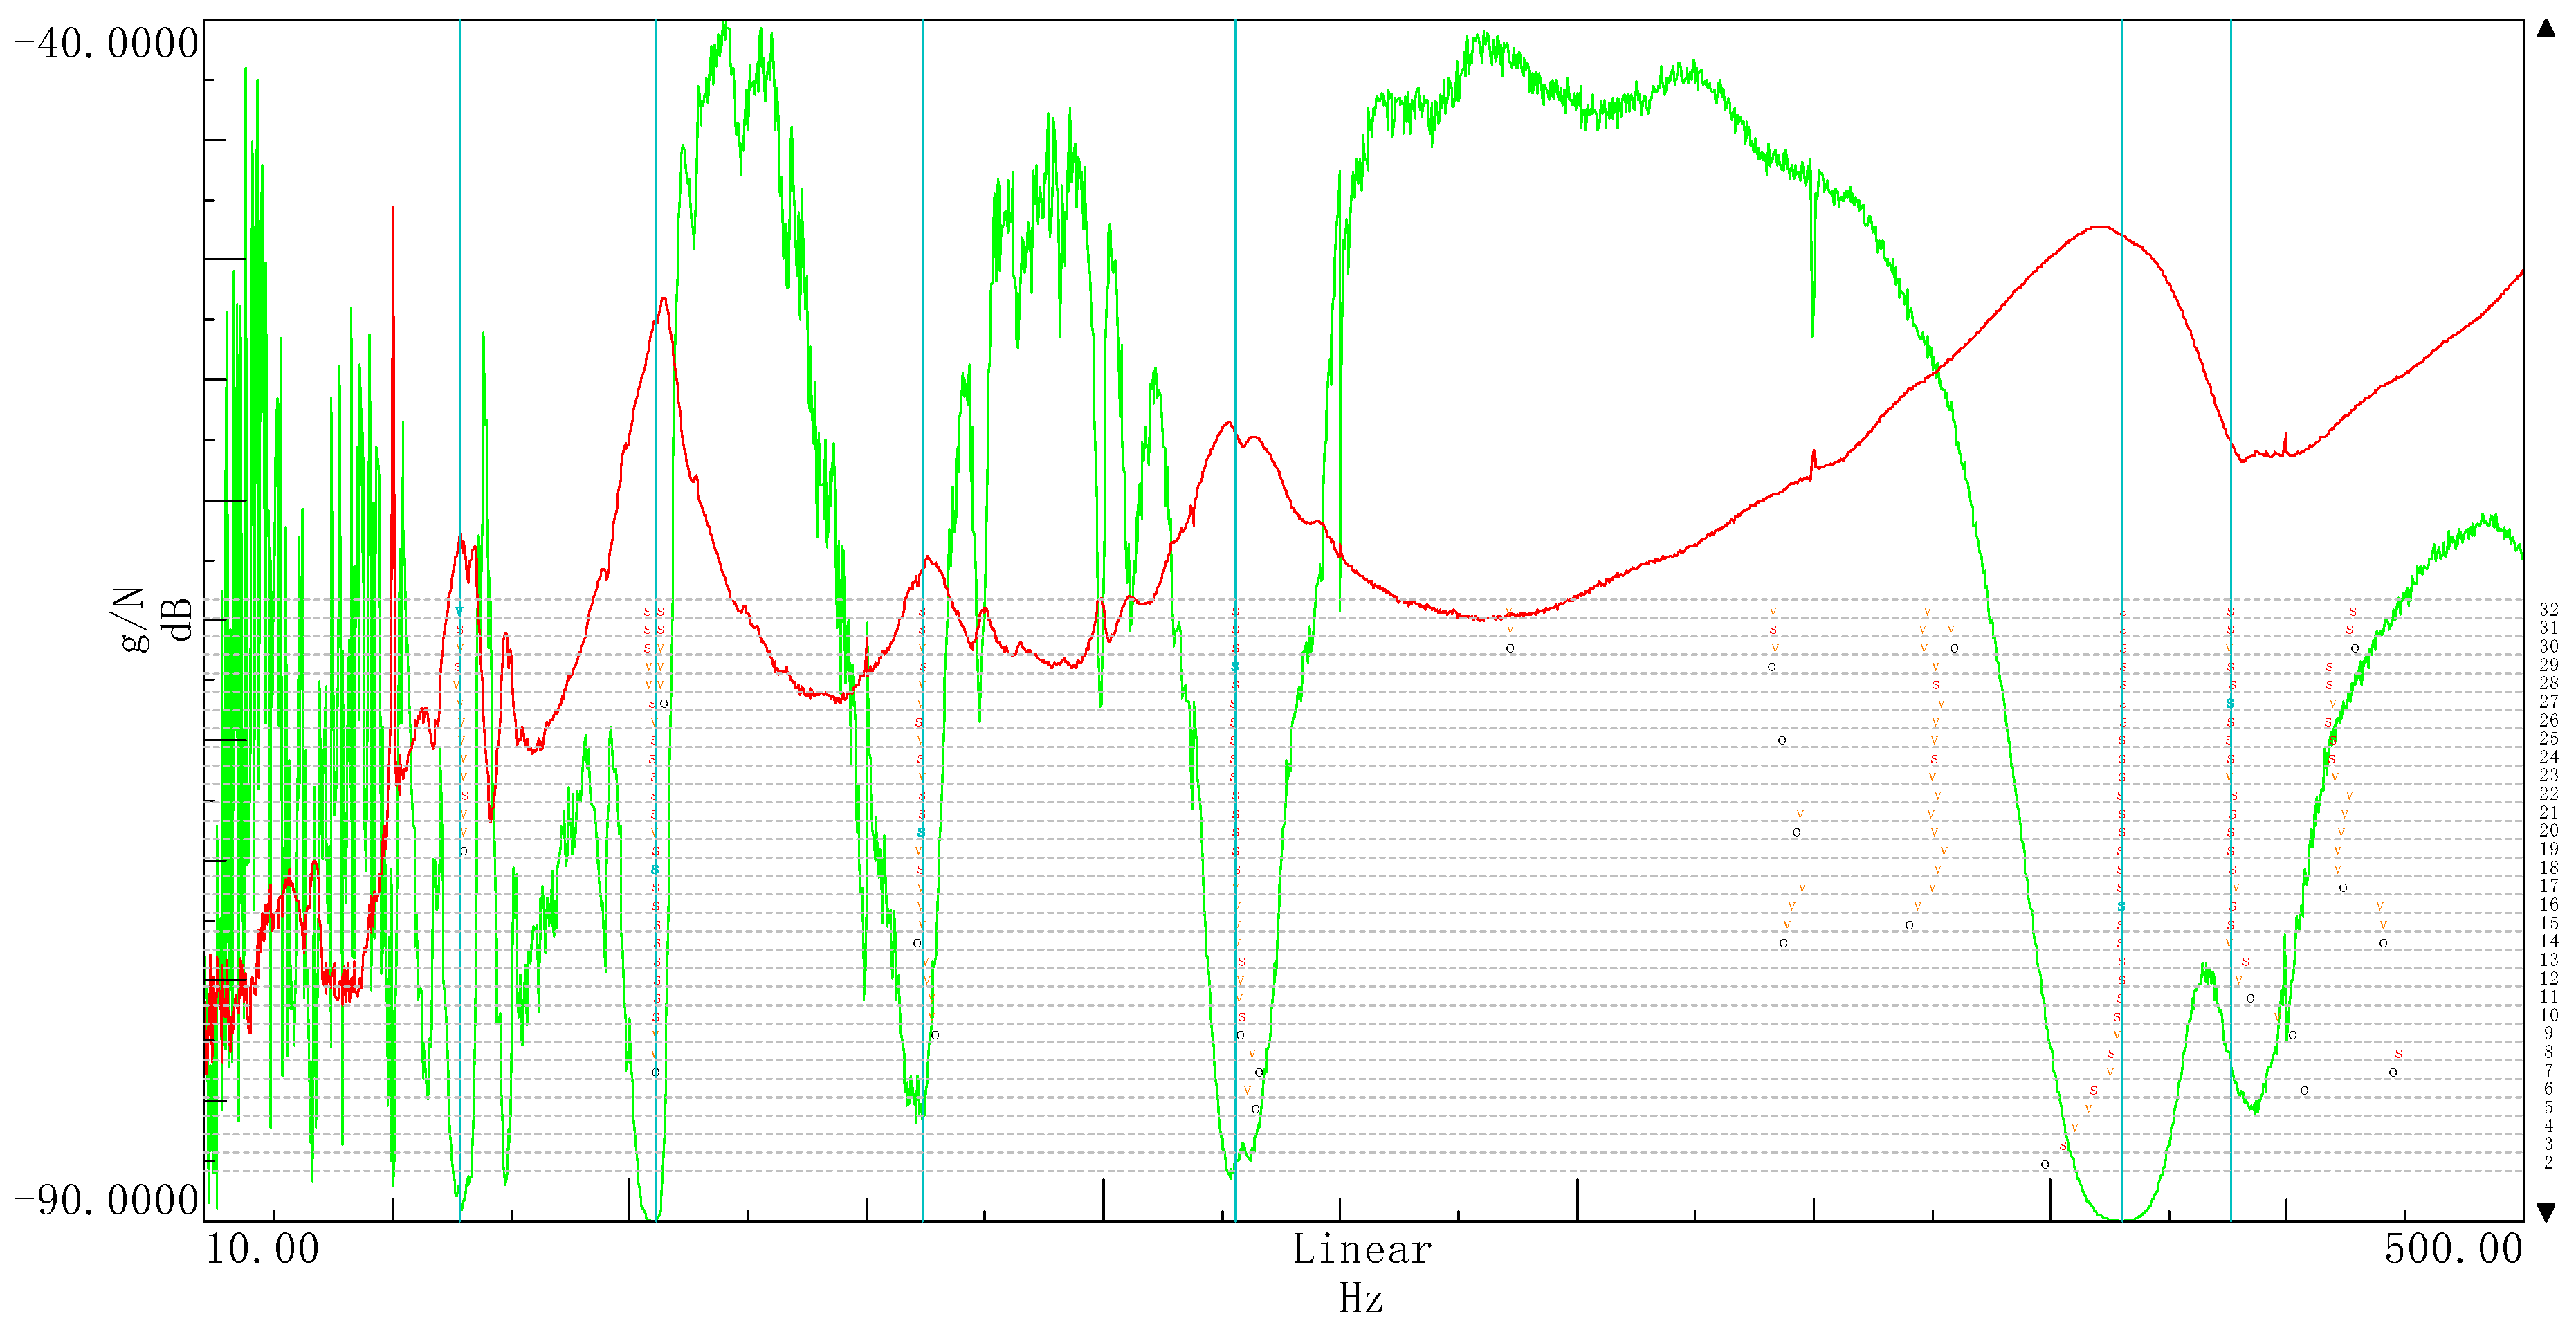
In the static state of the machine tool, the force hammer is used to excite the machine tool, so as to collect the vibration response signal, and the EMA method is used to obtain the dynamic characteristics of the machine tool. The tapping point is selected as the measuring point of the tool-handle sensor, the tapping direction is the X direction, and the sampling frequency is set to 4096 Hz. In order to suppress the interference of noise, the experiment is repeated five times and the average value is obtained. At the same time, the input force signal and output vibration signal are collected, and the FRF is calculated. The PolyMAX algorithm of LMS software is used to identify the dynamics of the machine tool. The dynamics of the FRFs in the X direction of all measuring points in the knocking experiment are identified. The analysis frequency band is set within 10–500 Hz and the modal order is set to 32. The FRFs of all measuring points of the machine tool are comprehensively analyzed to obtain the steady-state diagram of EMA, as shown in Figure 5. In the steady-state diagram, the green line represents the multivariable modal indication function (MIF), the red line represents FRF, “S” indicates that the modal natural frequency, modal shape, and damping ratio of this order are stable within the tolerance range, “V” indicates that the pole vector is stable within the tolerance range, and “O” indicates extremely instability. According to the distribution of the FRF and pole queue in the steady-state diagram, the sixth-order modes are identified in the range of 10–500 Hz. The dynamics of each order mode are shown in Table 2.
3.3. Analysis of Dynamic Characteristics of Machine Tool
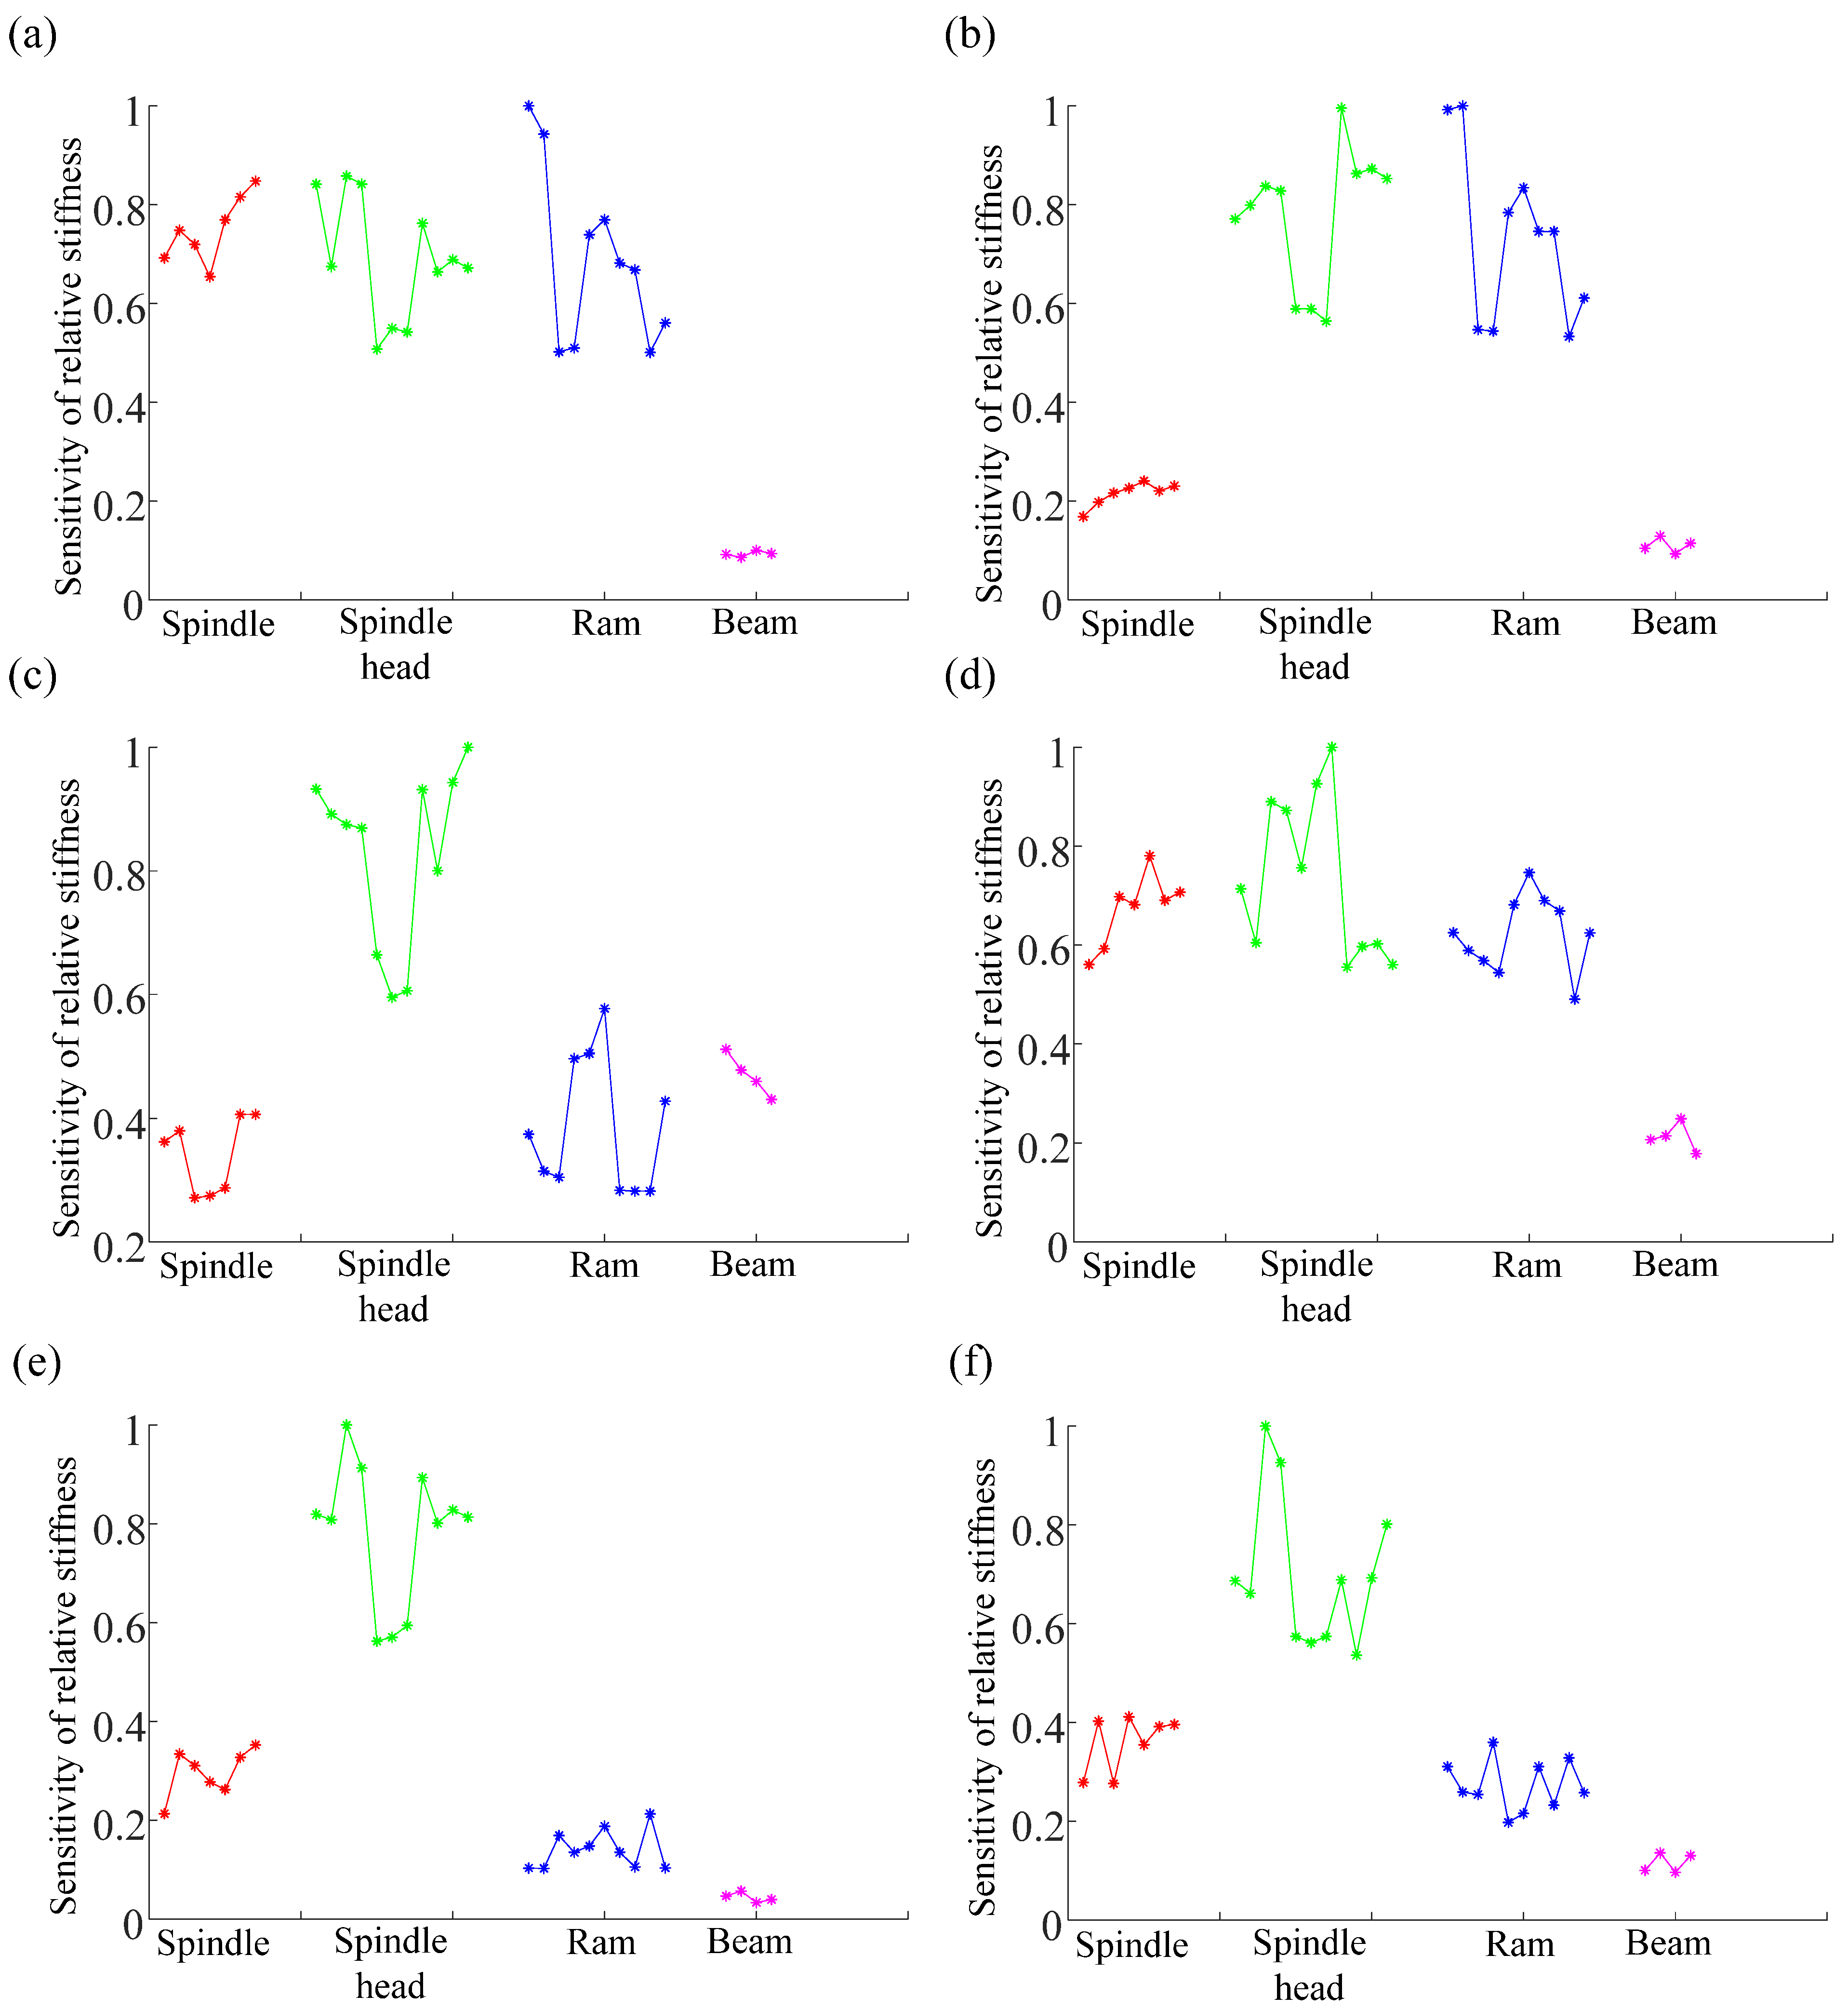
According to the dynamic stiffness-sensitivity algorithm, the modal dynamic stiffness sensitivity of the machine tool’s respective changes in stiffness is analyzed, and the measurement points are arranged in order, as shown in Figure 6. Figure 6a–f present the sensitivity of the sixth-order modal dynamic stiffness of the machine tool to each measuring point in turn. The red asterisk in the figure represents the dynamic stiffness sensitivity of the relative stiffness change of each degree of freedom of the main shaft; the green star point in the figure represents the dynamic stiffness sensitivity of the relative stiffness change of each degree of freedom of the pendulum head; the blue asterisk in the figure represents the dynamic stiffness sensitivity of the relative stiffness change of each degree of freedom of the ram; the magenta stars in the figure represent the dynamic stiffness sensitivity of the relative stiffness change of each degree of freedom of the beam.
Figure 6a shows the sensitivity of the first modal dynamic stiffness of the machine tool to the stiffness change of each degree of freedom of the machine tool. It is easy to observe that the peak values of the red points, green points, and blue points have little difference, and they are much larger than the magenta points, i.e., the dynamic stiffness sensitivity of the beam relative to other components is low. Figure 6b shows the sensitivity of the second-order modal dynamic stiffness of the machine tool to the stiffness change of each degree of freedom of the machine tool. The peak values of the green points and blue points are close and the largest, while the peak values of the red points are the smallest, i.e., the dynamic stiffness sensitivity of the spindle head and sliding array is high. Figure 6c shows the sensitivity of the third-order modal dynamic stiffness of the machine tool to the stiffness change of each degree of freedom of the machine tool. The position of the green point is much higher than that of the blue point, red point, and magenta point, i.e., the dynamic stiffness sensitivity of the spindle head is much higher than that of other components. Figure 6d shows the sensitivity of the dynamic stiffness of the fourth mode of the machine tool to the stiffness change of each degree of freedom of the machine tool. It is easy to observe that the peak values of the red points, green points, and blue points have little difference, and are much larger than the magenta points, i.e., the dynamic stiffness sensitivity of the beam relative to other components is low. Figure 6e shows the sensitivity of the dynamic stiffness of the fifth mode of the machine tool to the stiffness change of each degree of freedom of the machine tool. Similar to the third mode, the sensitivity of the spindle head to the dynamic stiffness of other components is much higher. Figure 6f shows the sensitivity of the dynamic stiffness of the sixth mode of the machine tool to the stiffness change of each degree of freedom of the machine tool. Similar to the third mode, the sensitivity of the spindle head to the dynamic stiffness of other components is much higher. Considering the sensitivity of the first six modes of dynamic stiffness to the stiffness change of each measuring point of the machine tool, the spindle head component is determined as a sensitive component. It can be seen from Figure 6c,e,f that, in the sensitivity analysis of the dynamic stiffness of the third-order mode relative to the stiffness change of each degree of freedom of the machine tool, the dynamic stiffness sensitivity of the spindle head relative to other components is much higher. Therefore, the spindle head component is used as the sensitive component and the third, fifth, and sixth modes are used as the key modes to represent the dynamic characteristics of the machine tool. In addition, with the change in modal order, the dynamic stiffness sensitivity of each component of the machine tool will also change, and there is no obvious change law.
3.4. Verification of Sensitive Components Using Modal Modification Prediction
In order to more accurately represent the dynamic characteristics of the whole machine tool, the dynamic stiffness-sensitivity algorithm is used to transform the dynamic characteristics of the whole machine tool into the key modes of sensitive components, so as to realize the characterization of the dynamic characteristics of the whole machine tool. In Section 3.3, through the EMA and dynamic stiffness-sensitivity analysis of the actual machine tool, it is determined that the spindle head is the most sensitive part of the whole machine. In order to further verify the accuracy of the identification results of the algorithm, this section details the modification of the physical parameters of the original machine tool with the help of the modal modification prediction module of LMS, predicts the dynamic characteristics of the modified machine tool, and compares and analyzes the FRF curves before and after modification, so as to confirm the reliability of improving the stiffness of sensitive parts and the overall dynamic stiffness of the machine tool.
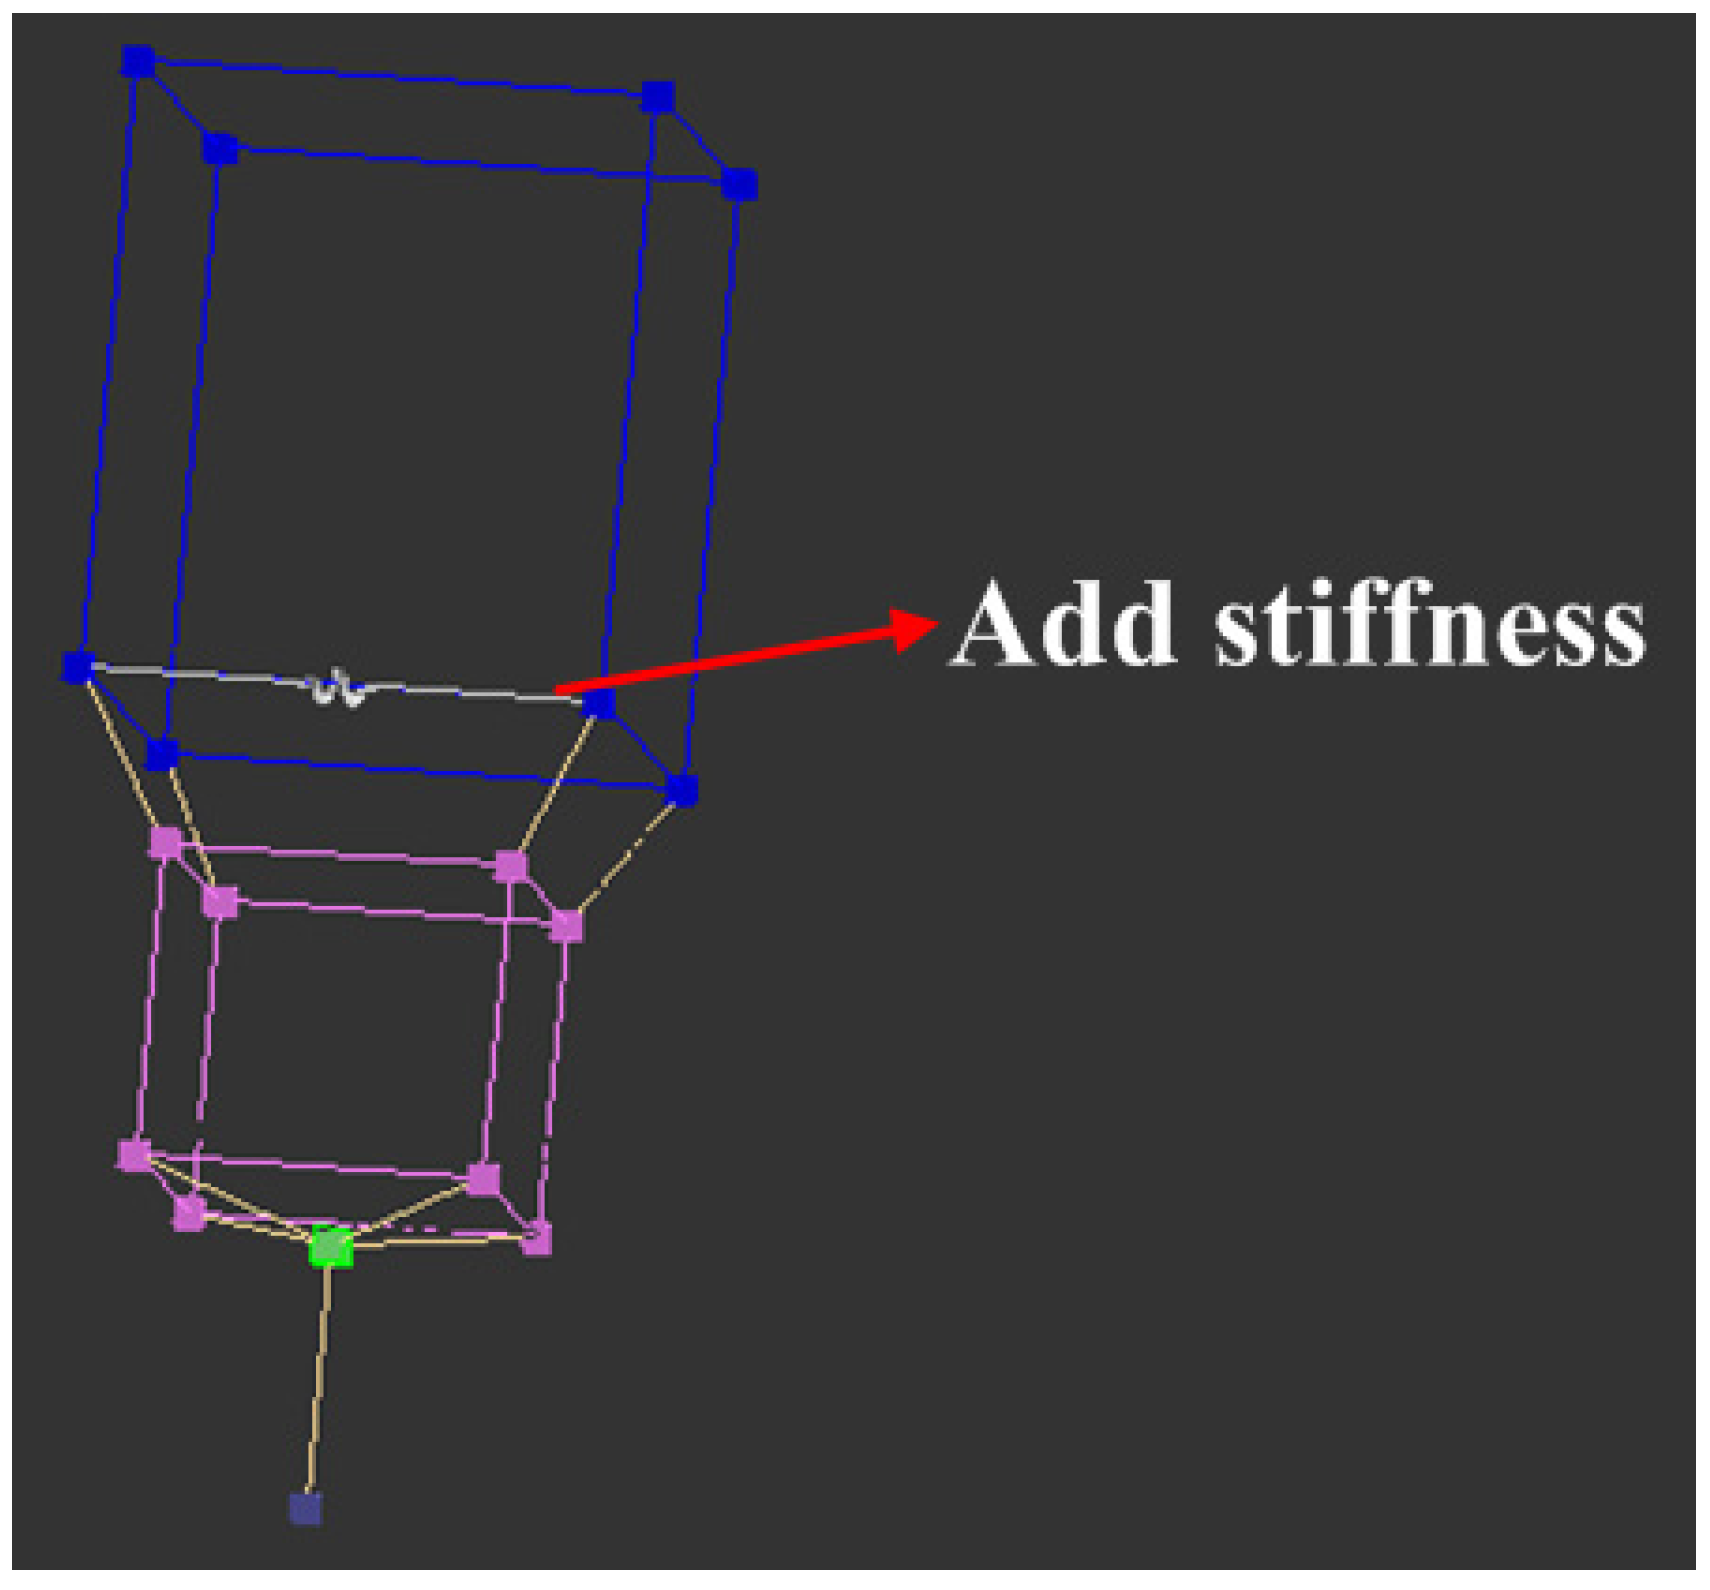
In the modal modification prediction module, the physical parameters of the original model can be modified according to the actual needs. The spindle head component is determined as a sensitive component through dynamic stiffness-sensitivity analysis, and in order to verify the impact of the sensitive component on the stiffness of the whole machine tool, a spring with stiffness of 1 × 10¹⁰ N/m is added between measuring point 1 and measuring point 2 of the spindle head component, as shown in the schematic diagram of physical parameter modification of modal modification and prediction in Figure 7. Figure 8 is a schematic diagram that more clearly shows the spindle head part after adding the spring, and the gray line is the spring added between the measuring points.
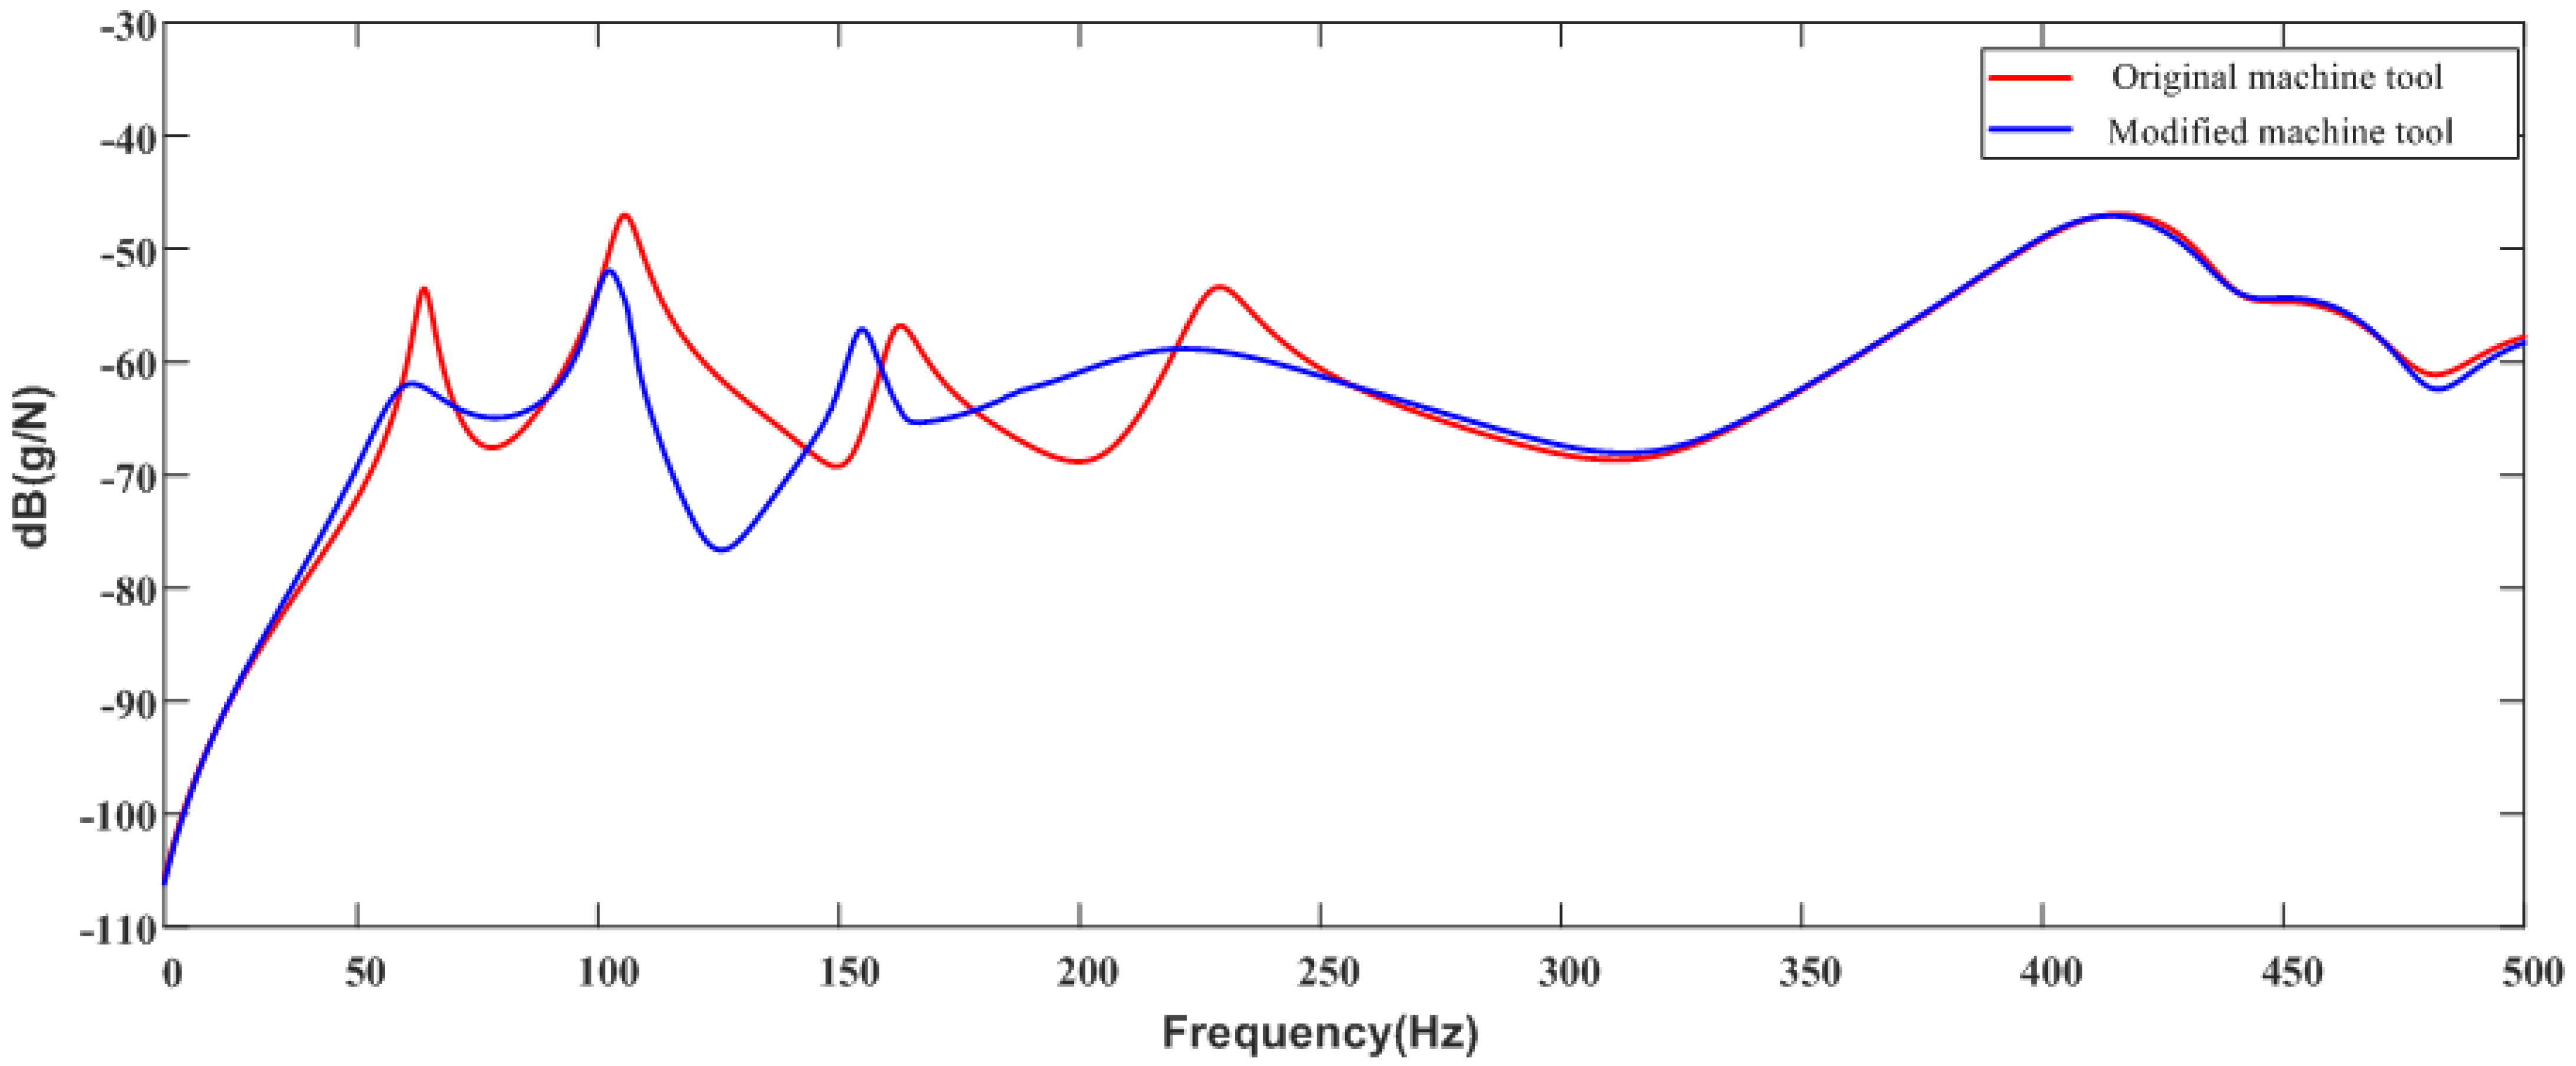
After modifying the physical parameters of the spindle head components, the FRF comparison diagram of the whole machine at 10–500 Hz before and after the change of the spindle head stiffness is obtained by fitting in the modal prediction module, as shown in Figure 9. The amplitude of the FRF after the stiffness of the spindle head is increased is reduced compared with the original machine tool, i.e., the stiffness of the whole machine is effectively improved after the stiffness of the spindle head is increased. The modal analysis software is used to identify the FRF of the whole machine before and after the modification of the swing head, and the comparison table of dynamics before and after the modification of the spindle head is obtained, as shown in Table 3. It can be seen from the table that the natural frequencies of the first six modes of the machine tool decrease in varying degrees, and the amplitude corresponding to the natural frequency decreases significantly, which proves that improving the stiffness of the sensitive parts can effectively improve the stiffness of the whole machine, and also proves the reliability of judging the sensitive parts by the sensitivity of the dynamic stiffness.
4. Conclusions
As the dynamic parameters are difficult to use to directly represent the spatial position-related dynamic characteristics of the machine tool, a dynamic stiffness-sensitivity algorithm was proposed in this paper which transforms the dynamic characteristics of the machine tool into the key modes of sensitive components, and obtains the position-related dynamic characteristics of the machine tool. Firstly, the definition of dynamic stiffness sensitivity is described through modal analysis theory, and the method of judging sensitive parts by dynamic stiffness sensitivity is introduced. Then, the accuracy of the scheme is verified by carrying out multi-freedom simulation system experiments under different physical parameters. Finally, the sensitive parts of the five-axis gantry milling machine are analyzed by using the dynamic stiffness-sensitivity algorithm. It was found that the swing head component as a sensitive component and its third, fifth, and sixth modes as key modes represent the dynamic characteristics of the machine tool, which is consistent with the prediction results of LMS software. The results show that the key modes of sensitive parts proposed in this paper can accurately represent the dynamic characteristics of the whole machine tool. There are some shortcomings in this study. The method proposed in this paper cannot quantitatively represent the dynamic characteristics of the whole machine tool. Therefore, we need to focus on this issue in the follow-up research.
Author Contributions
Conceptualization, C.L. and X.J.; methodology, Z.S. and X.H.; formal analysis, C.L. and X.J.; data curation, H.Z. and X.M.; supervision, Z.S. and X.M.; writing—original draft preparation, X.H. and H.Z.; writing—review and editing, C.L. and X.J. All authors have read and agreed to the published version of the manuscript.
Funding
This research received no external funding.
Institutional Review Board Statement
Not applicable.
Informed Consent Statement
Not applicable.
Data Availability Statement
Data and methods used in the research have been presented in sufficient detail in the paper.
Conflicts of Interest
The authors declare no conflict of interest.
References
- Hung, J.; Lai, Y.; Luo, T.; Su, H.-C. Analysis of the machining stability of a milling machine considering the effect of machine frame structure and spindle bearings: Experimental and finite element approaches. Int. J. Adv. Manuf. Tech. 2013, 68, 2393–2405. [Google Scholar] [CrossRef]
- Munoa, J.; Zatarain, M.; Bediaga, I.; Lizarralde, R. Optimization of hard material roughing by means of a stability model. In Proceedings of the 8th CIRP International Workshop on Modelling of Machining Operations, Chemnitz, Germany, 10–11 May 2005; pp. 431–438. [Google Scholar]
- Schmitz, T.L.; Donalson, R.R. Predicting High-Speed Machining Dynamics by Substructure Analysis. Cirp. Ann-Manuf. Technol. 2000, 49, 303–308. [Google Scholar] [CrossRef]
- Altintas, Y.; Brecher, C.; Weck, M.; Witt, S. Virtual Machine Tool. Cirp. Ann.-Manuf. Technol. 2005, 54, 115–138. [Google Scholar] [CrossRef]
- Cao, Y.; Altintas, Y. Modeling of spindle-bearing and machine tool systems for virtual simulation of milling operations. Int. J. Mach. Tool Manuf. 2007, 47, 1342–1350. [Google Scholar] [CrossRef]
- Baumann, J.; Siebrecht, T.; Wiederkehr, P. Modelling the Dynamic Behavior of a Machine Tool Considering the Tool-position-dependent Change of Modal Parameters in a Geometric-kinematic Simulation System. Procedia CIRP 2017, 62, 351–356. [Google Scholar] [CrossRef]
- Law, M.; Altintas, Y.; Srikantha Phani, A. Rapid evaluation and optimization of machine tools with position-dependent stability. Int. J. Mach. Tool Manuf. 2013, 68, 81–90. [Google Scholar] [CrossRef]
- Luo, B.; Pan, D.; Cai, H.; Mao, X.; Peng, F.; Mao, K.; Li, B. A method to predict position-dependent structural natural frequencies of machine tool. Int. J. Mach. Tool Manuf. 2015, 92, 72–84. [Google Scholar] [CrossRef]
- Deng, C.; Miao, J.; Wei, B.; Feng, Y.; Zhao, Y. Evaluation of machine tools with position-dependent milling stability based on Kriging model. Int. J. Mach. Tool Manuf. 2018, 124, 33–42. [Google Scholar] [CrossRef]
- Berthold, J.; Kolouch, M.; Wittstock, V.; Putz, M. Identification of modal parameters of machine tools during cutting by operational modal analysis. Procedia CIRP 2018, 77, 473–476. [Google Scholar] [CrossRef]
- Prydalnyi, B.I.; Sulym, H.T. Mathematical model of the tensioning in the collet clamping mechanism with the rotary movable input link on spindle units. J. Eng. Sci. 2021, 8, 23–28. [Google Scholar] [CrossRef]
- Wang, X.; Guo, Y.; Chen, T. Measurement research of motorized spindle dynamic stiffness under high speed rotating. Shock Vib. 2015, 2015, 1–11. [Google Scholar] [CrossRef]
- Munoa, J.; Beudaert, X.; Dombovari, Z.; Altintas, Y.; Budak, E.; Brecher, C.; Stepan, G. Chatter suppression techniques in metal cutting. Cirp. Ann-Manuf. Technol. 2016, 65, 785–808. [Google Scholar] [CrossRef]
- Gagnol, V.; Le, T.; Ray, P. Modal identification of spindle-tool unit in high-speed machining. Mech. Syst. Signal Process. 2011, 25, 2388–2398. [Google Scholar] [CrossRef]
- Wan, M.; Feng, J.; Ma, Y.; Zhang, W.-H. Identification of milling process damping using operational modal analysis. Int. J. Mach. Tool Manuf. 2017, 122, 120–131. [Google Scholar] [CrossRef]
- Yue, C.; Gao, H.; Liu, X.; Wang, L.; Liang, S.Y. Analytical prediction of part dynamics and process damping for machining stability analysis. Procedia CIRP 2018, 72, 1463–1468. [Google Scholar] [CrossRef]
- Peng, Y.; Li, B.; Mao, X.; Li, C.; Liu, H.; Peng, F. Partition of the workspace for machine tool based on position-dependent modal energy distribution and clustering algorithm. Int. J. Adv. Manuf. Tech. 2020, 108, 943–955. [Google Scholar] [CrossRef]
- Filiz, S.; Ozdoganlar, O.B. A three-dimensional model for the dynamics of micro-endmills including bending, torsional and axial vibrations. Precis. Eng. 2011, 35, 24–37. [Google Scholar] [CrossRef]
- Miao, J.; Yu, D.; An, C.; Ye, F.; Yao, J. Investigation on the generation of the medium-frequency waviness error in flycutting based on 3D surface topography. Int. J. Adv. Manuf. Technol. 2017, 90, 667–675. [Google Scholar] [CrossRef]
- Yin, L.; Liu, Q.; Zhang, F.; Zhou, Z.; Ullah, S. Study for the Identification of Dominant Frequencies and Sensitive Structure on Machine Tools Using Modal Decoupling and Structural Sensitivity Analysis. J. Vib. Eng. Technol. 2019, 7, 507–517. [Google Scholar] [CrossRef]
- He, S.; Mao, X.; Liu, X.; Luo, B.; Li, B.; Peng, F. A new approach based on modal mass distribution matrix to identify weak components of machine tool structure. J. Vib. Eng. Technol. 2016, 83, 193–203. [Google Scholar] [CrossRef]
- Zaghbani, I.; Songmene, V. Estimation of machine-tool dynamic parameters during machining operation through operational modal analysis. Int. J. Mach. Tool Manu. 2009, 49, 947–957. [Google Scholar] [CrossRef]
- Shen, L.; Ding, X.; Li, T.; Kong, X.; Dong, X. Structural dynamic design optimization and experimental verification of a machine tool. J. Vib. Eng. Technol. 2019, 104, 3773–3786. [Google Scholar] [CrossRef]
- Deng, C.; Liu, Y.; Zhao, J.; Wei, B.; Yin, G. Analysis of the machine tool dynamic characteristics in manufacturing space based on the generalized dynamic response model. J. Vib. Eng. Technol. 2017, 92, 1411–1424. [Google Scholar] [CrossRef]
- Zulaika, J.J.; Campa, F.J.; Lopez De Lacalle, L.N. An integrated process–machine approach for designing productive and lightweight milling machines. Int. J. Mach. Tool Manuf. 2011, 51, 591–604. [Google Scholar] [CrossRef]
Figure 1.
Schematic diagram of system simulation system.

Figure 2.
In case A, the modal dynamic stiffness sensitivity of each degree of freedom: (a) the first order, (b) the second order, (c) the third order, and (d) the fourth order.
Figure 2.
In case A, the modal dynamic stiffness sensitivity of each degree of freedom: (a) the first order, (b) the second order, (c) the third order, and (d) the fourth order.

Figure 3.
In case B, the modal dynamic stiffness sensitivity of each degree of freedom: (a) the first order (b) the second order (c) the third-order, and (d) the fourth order.
Figure 3.
In case B, the modal dynamic stiffness sensitivity of each degree of freedom: (a) the first order (b) the second order (c) the third-order, and (d) the fourth order.

Figure 4.
Layout of measuring points in percussion test: (a) five-axis gantry machining center; (b) layout of measuring points.
Figure 4.
Layout of measuring points in percussion test: (a) five-axis gantry machining center; (b) layout of measuring points.

Figure 5.
Steady state of EMA of gantry machine tool.

Figure 6.
Modal dynamic stiffness sensitivity of each degree of freedom of each component of the machine tool: (a)–(f): t first mode to the sixth mode.
Figure 6.
Modal dynamic stiffness sensitivity of each degree of freedom of each component of the machine tool: (a)–(f): t first mode to the sixth mode.

Figure 7.
Parameter modification of modal prediction.

Figure 8.
Adding stiffness to spindle head parts.

Figure 9.
Comparison of FRF before and after modification of swing head.


Table 1.
Main equipment for EMA.
| Main Equipment | Parameter |
|---|---|
| Five-axis gantry machining center | Numerical control system: SIEMENS 840D |
| Data acquisition equipment | Model: LMS SCADAS Mobile SCM05 |
| Data analysis system | LMS SCADAS |
| Force hammer | Model: PCB- HDFC-DFC-1 Sensitivity: 2.2 mV/N Measurement range: ±2224 N |
| Acceleration sensor | Model: PCB356A16 Sensitivity: 100 mV/g Sampling frequency: 2–5000 Hz Measurement range: ±50 g Resonance frequency: >25 kHz |
Table 2.
Dynamics of the spindle of the percussion experimental machine tool.
| Modes | f (Hz) | ζ (%) |
|---|---|---|
| Mode 1 | 64.15 | 3.21 |
| Mode 2 | 105.65 | 3.04 |
| Mode 3 | 161.86 | 2.01 |
| Mode 4 | 228.01 | 3.07 |
| Mode 5 | 415.02 | 6.07 |
| Mode 6 | 437.98 | 4.22 |
Table 3.
Comparison of dynamics before and after modification of spindle head.
| Modes | Original Machine Tool | Modified Machine Tool | ||
|---|---|---|---|---|
| f (Hz) | Amplitude (g/N) | f (Hz) | Amplitude (g/N) | |
| 1 | 64.15 | −53.53 | 61.51 | −61.92 |
| 2 | 105.65 | −47.14 | 102.56 | −51.96 |
| 3 | 161.86 | −57.42 | 155.38 | −57.11 |
| 4 | 228.01 | −53.58 | 222.84 | −58.58 |
| 5 | 415.02 | −46.93 | 414.53 | −47.05 |
| 6 | 437.98 | −52.92 | 436.12 | −54.33 |
Publisher’s Note: MDPI stays neutral with regard to jurisdictional claims in published maps and institutional affiliations. |
© 2021 by the authors. Licensee MDPI, Basel, Switzerland. This article is an open access article distributed under the terms and conditions of the Creative Commons Attribution (CC BY) license (https://creativecommons.org/licenses/by/4.0/).
Share and Cite
MDPI and ACS Style
Li, C.; Song, Z.; Huang, X.; Zhao, H.; Jiang, X.; Mao, X. Analysis of Dynamic Characteristics for Machine Tools Based on Dynamic Stiffness Sensitivity. Processes 2021, 9, 2260. https://0-doi-org.brum.beds.ac.uk/10.3390/pr9122260
AMA Style
Li C, Song Z, Huang X, Zhao H, Jiang X, Mao X. Analysis of Dynamic Characteristics for Machine Tools Based on Dynamic Stiffness Sensitivity. Processes. 2021; 9(12):2260. https://0-doi-org.brum.beds.ac.uk/10.3390/pr9122260
Chicago/Turabian StyleLi, Chunhui, Zhiqiang Song, Xianghua Huang, Hui Zhao, Xuchu Jiang, and Xinyong Mao. 2021. "Analysis of Dynamic Characteristics for Machine Tools Based on Dynamic Stiffness Sensitivity" Processes 9, no. 12: 2260. https://0-doi-org.brum.beds.ac.uk/10.3390/pr9122260
Note that from the first issue of 2016, this journal uses article numbers instead of page numbers. See further details here.