
Hybrid Sleep Stage Classification for Clinical Practices across Different Polysomnography Systems Using Frontal EEG

1
Institute of Bioinformatics and Systems Biology, National Yang Ming Chiao Tung University, Hsinchu 300, Taiwan
2
Department of Electrical and Computer Engineering, National Yang Ming Chiao Tung University, Hsinchu 300, Taiwan
3
Center for Intelligent Drug Systems and Smart Bio-Devices (IDS2B), National Yang Ming Chiao Tung University, Hsinchu 300, Taiwan
4
Department of Biomedical Science and Environmental Biology, Drug Development and Value Creation Research Center Kaohsiung Medical University, Kaohsiung 807, Taiwan
5
Department of Neurology, School of Medicine, College of Medicine, Kaohsiung Medical University, Kaohsiung 807, Taiwan
6
Department of Neurology, Kaohsiung Medical University Hospital, Kaohsiung 807, Taiwan
7
Sleep Disorders Center, Kaohsiung Medical University Hospital, Kaohsiung 807, Taiwan
*
Authors to whom correspondence should be addressed.
Processes 2021, 9(12), 2265; https://0-doi-org.brum.beds.ac.uk/10.3390/pr9122265
Submission received: 10 November 2021
/
Revised: 15 December 2021
/
Accepted: 15 December 2021
/
Published: 16 December 2021
(This article belongs to the Special Issue Application of Artificial Intelligence in Industry and Medicine)
Abstract
:Automatic bio-signal processing and scoring have been a popular topic in recent years. This includes sleep stage classification, which is time-consuming when carried out by hand. Multiple sleep stage classification has been proposed in recent years. While effective, most of these processes are trained and validated against a singular set of data in uniformed pre-processing, whilst in a clinical environment, polysomnography (PSG) may come from different PSG systems that use different signal processing methods. In this study, we present a generalized sleep stage classification method that uses power spectra and entropy. To test its generality, we first trained our system using a uniform dataset and then validated it against another dataset with PSGs from different PSG systems. We found that the system achieved an accuracy of 0.80 and that it is highly consistent across most PSG records. A few samples of NREM3 sleep were classified poorly, and further inspection showed that these samples lost crucial NREM3 features due to aggressive filtering. This implies that the system’s effectiveness can be evaluated by human knowledge. Overall, our classification system shows consistent performance against PSG records that have been collected from different PSG systems, which gives it high potential in a clinical environment.
1. Introduction
Sleep is an important aspect of human life. Sleep quality has a wide range of effects including mood [1], memory [2], metabolism [3], and immunity [4,5]. Thus, it is very important to have an objective method to measure sleep quality. Such measurements are usually conducted through sleep stage classifying. During these processes, a sleep technician divides polysomnography (PSG) records into multiple 30 s epochs. A PSG record usually consists of multiple channels of electroencephalogram (EEG), electrooculogram (EOG), electromyogram (EMG), and electrocardiogram (ECG) signals. A technician would then use these signals to classify each epoch into one of five stages: wake (W), rapid eye movement (REM), and three non-REM stages (N1, N2, and N3). The percentage and destitution of each sleep stage class are then used to evaluate sleep quality. While the simple identification between wake, REM sleep, and NREM sleep can be achieved using ECG [6], photoplethysmography [7], oximetry [8] or body movement [9], EEG or EOG signals are still required to correctly distinguish the different sleep stages. The need for multiple channels has kept the measurement of sleep quality from mass deployment outside of dedicated sleep laboratories. This classification process is also exhaustive and time-consuming, which limits the number of patients that can be evaluated. Therefore, there is a growing need for an automatic sleep stage classification system that requires fewer electrical signal channels.
There have been many studies that have tried to conduct sleep stage classification through conventional machine learning and deep learning. In the former case, sleep stage features are manually extracted from EEG signals. These features are usually selected based on expert knowledge. For example, in [10], the authors used variants of discrete wavelet transformation (DWT) to extract features from multiple EEG and EOG channels. In [11], Alickovic and Subasi used DWT to decompose single-channel EEG signal. The authors specifically decomposed the EEG signals into multiple sub-bands that roughly represented sleep EEG rhythms such as Delta and Beta. In [12], The authors took extracted features from multiple aspects, including time domain features (mean, 75th percentile), frequency domain feature (band powers, spectral variance, band power ratio), and non-linear features (approximate entropy, Lempel–Ziv complexity). After the features were extracted, they were then selectively fed into a classifier, such as a random forest [12,13] or a support vector machine [14], to determine the sleep stage. In deep learning, instead of defining features manually, a neural network is used to automatically obtain features from the EEG signals. Most studies have used convolutional neural networks (CNN), sometimes with varying windows sizes, to better capture structural and frequential features [15,16,17,18,19,20]. Because individual sleep stages often have temporal dependencies with other stages, CNN alone may not be sufficient to correctly label sleep stages. Therefore, some studies have combined CNN with variants of recurrent neural networks (RNN) in order for them to learn inter-epoch relationships [16,20,21,22]. Both traditional machine learning and deep learning techniques are capable of determining sleep stages from as few as only one channel EEG while still maintaining reasonable accuracy. This greatly reduces the complexity that is involved in sleep stage classification. Most of these studies utilize EEG signals from parietal EEG channels such as Cz or Pz. These channels can be easily mounted in a clinical environment but not in home or community environment. Thus, it is important to develop a sleep stage classification algorithm with channels that are more easily accessible, such as Fz or Fpz.
In sleep stage classification studies, the models are often validated using raw, unfiltered EEG data. This approach ensures that the resulting model only requires minimum effort during signal pre-processing and allows it to be easily combined with normal EEG recording devices that are commonly used in scientific studies. In practice, sleep EEG are often recorded by proprietary PSG systems. These systems usually carry out signal processing procedures of their own. Some of these procedures, such as band filters could reduce noises but may also lead to the loss of frequential information. This presents an obstacle in the deployment of sleep stage classifiers in a software-as-medical-device manner. A model that has been trained with data collected by one PSG system may not make inaccurate predictions on signals that have been obtained elsewhere. The black-box nature of deep learning algorithm makes it very hard to assess the effectiveness of a trained model on the target data. To ensure the robustness of deep learning models, a hospital must prepare a large amount of PSG records from diverse sources in order to train their models for individual PSG systems. On the other hand, traditional machine learning techniques use pre-defined features that humans are able to understand. Thus, it is easier to create a generic model through traditional machine learning and to evaluate if the model is able to accurately classify signals that have been recorded with different instruments.
Previously, we proposed a sleep stage classification model that was based on forehead EEG [23]. The model used frequential features that were based on expert knowledge to differentiate between different stages. We used forehead EEG channels because they are much easier to mount compared to Cz and Pz signals. In this study, we employed an improved version of our previous model on a group of volunteers. The new model employs entropy to obtain non-parametric features from EEG signals. The aim was to create an automatic sleep stage classification system that can be trained and used separately against PSG data from different systems. Our result shows that it is possible to create such a system with entropy and frequency power features based on our understanding of human sleep.
2. Materials and Methods
2.1. Subject and Data Acquisition
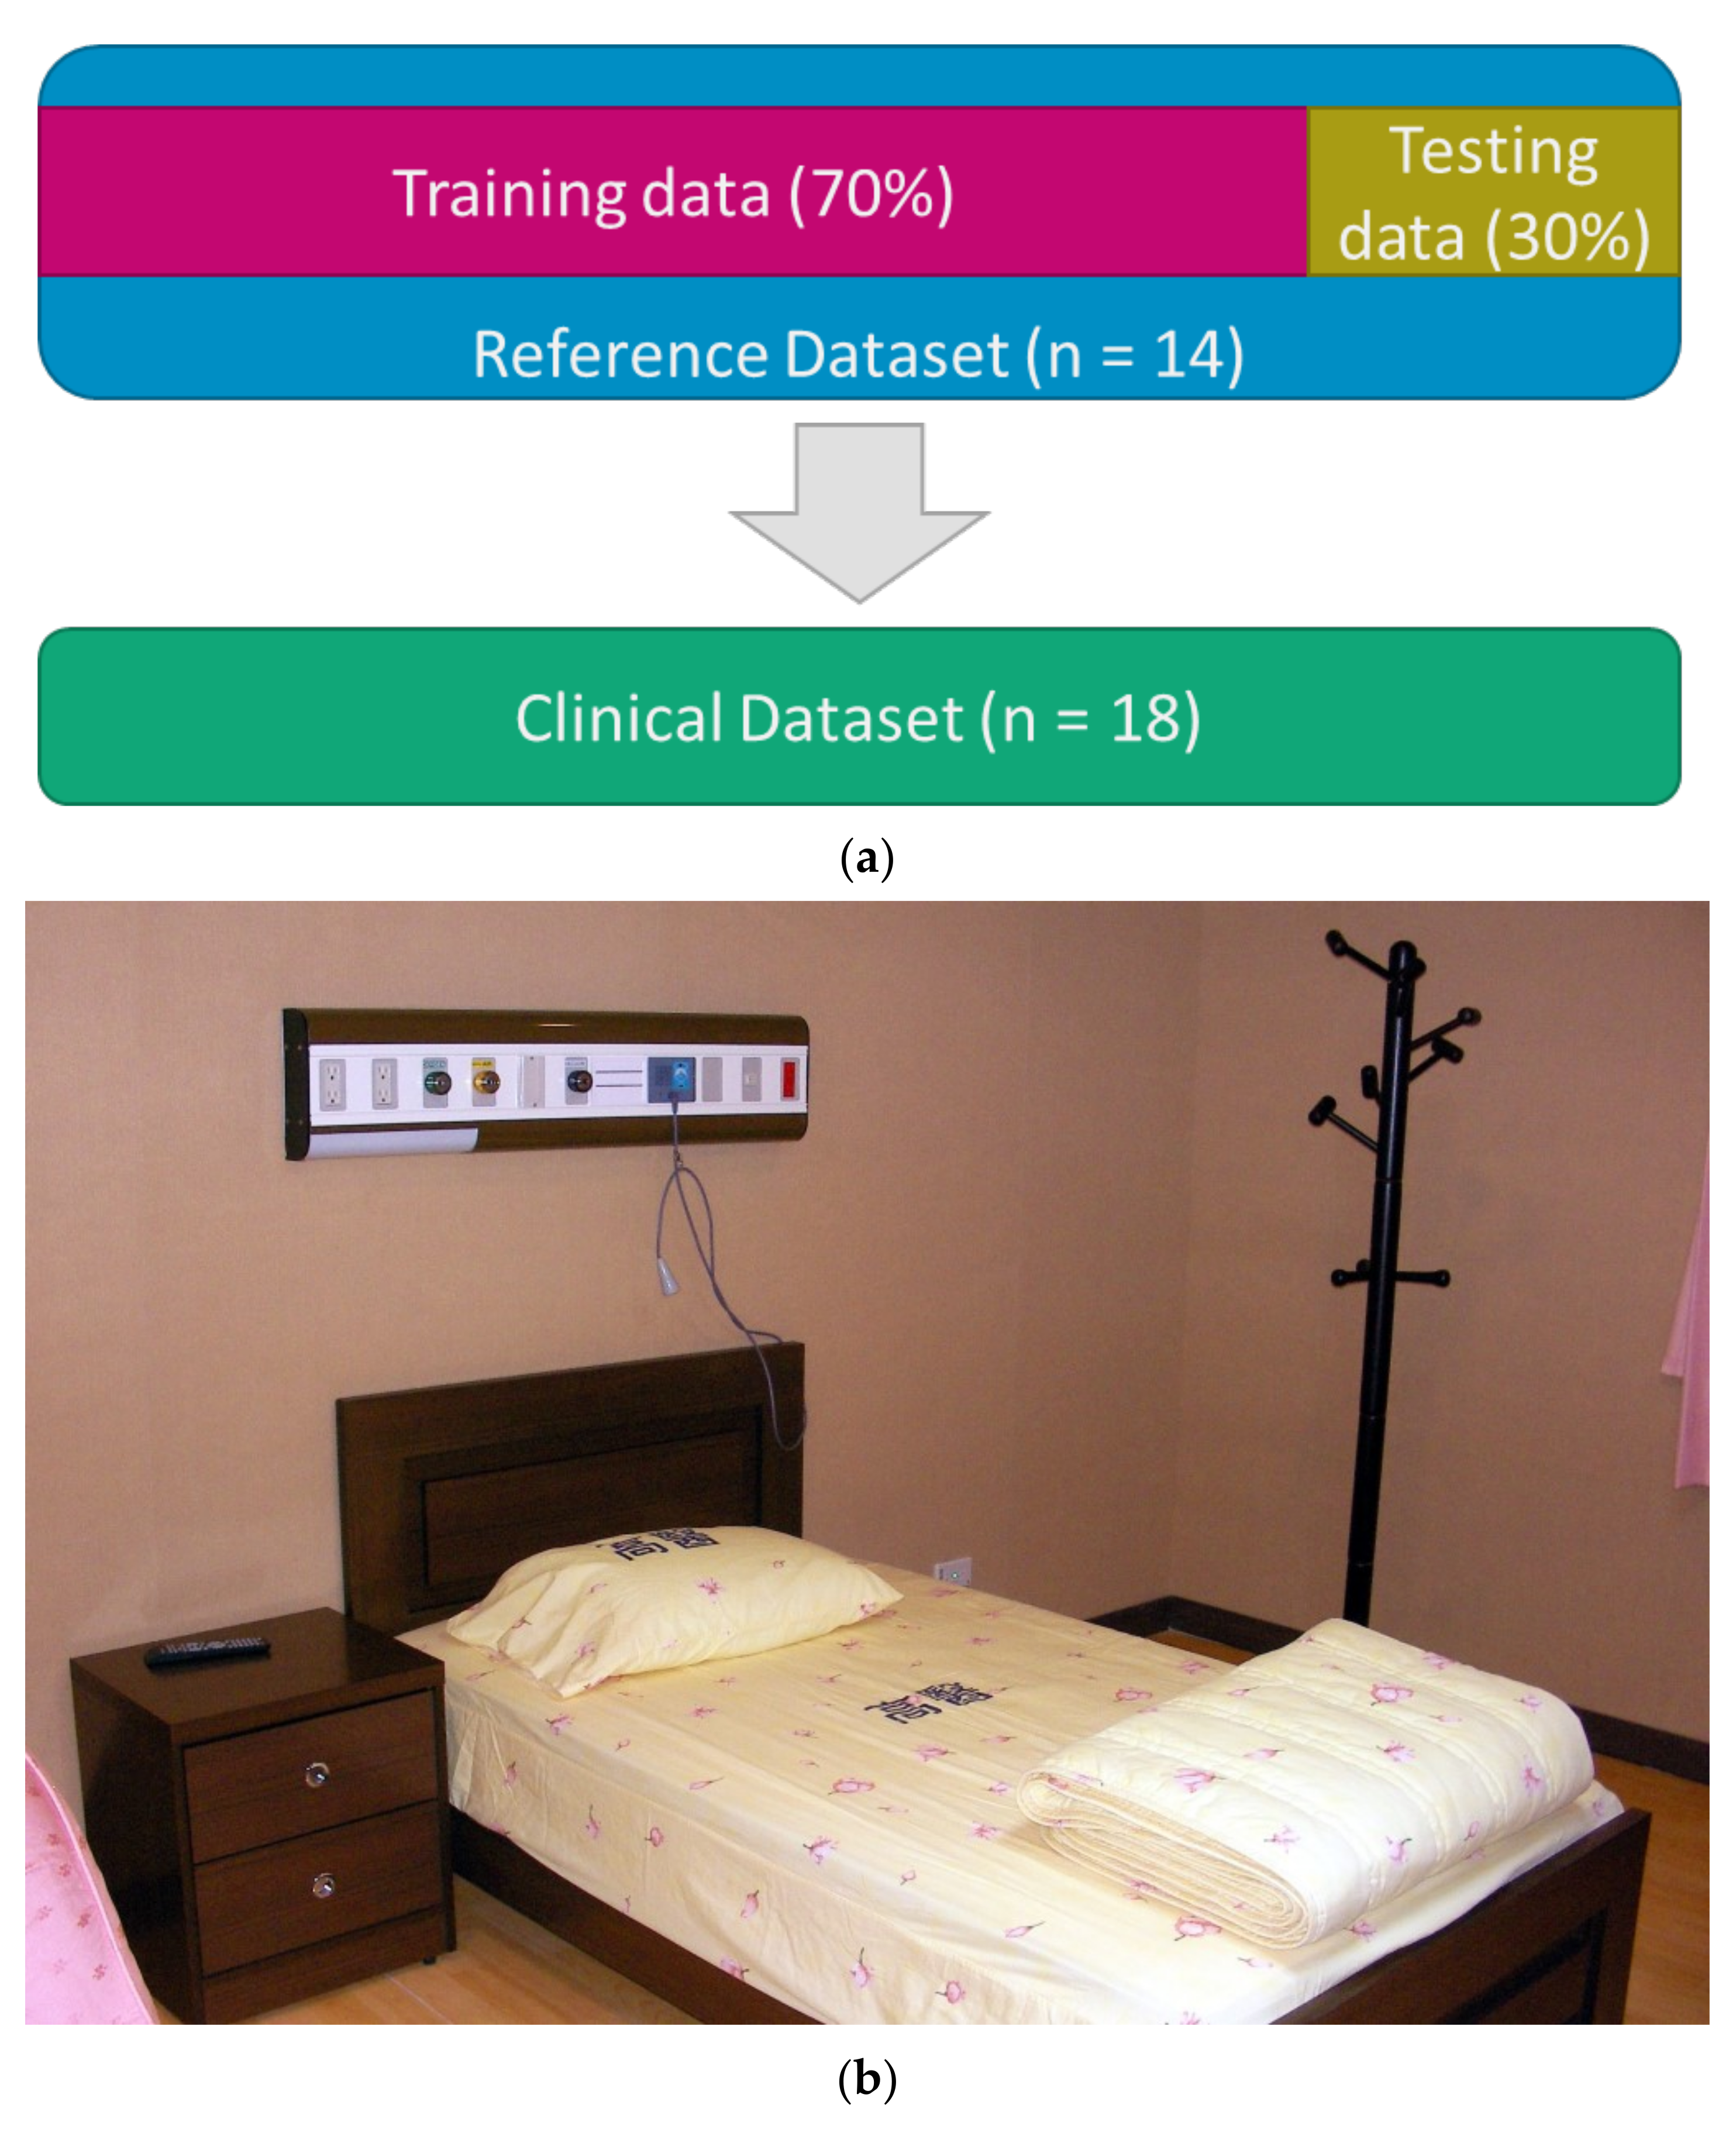
Unlike most studies, the classification system in this study was trained on a set of training data and then validated against another set of un-related EEG data. The process is shown in Figure 1a. The training dataset would be referred to as the Reference dataset, while the validation dataset would be referred to as the Clinical dataset. The Reference dataset consisted of 14 PSG records. These records were recorded with the NicoletOne v44 Sleep Diagnostic System (natus, Pleasanton, CA, USA) at 125 Hz. The PSG system applies a 0.5–62.5 Hz bandpass filter to all of the EEG channels. The total epoch count was 12,580, with each record containing around 7 to 8 h of data. The dataset was then split into the training split (70%) and the testing split (30%).
The Clinical dataset consisted of 18 PSG records. Unlike the Reference dataset, each PSG record was created using one of three PSG systems: NicoletOne v44 (n = 5), Alice 6 LDx (Philips, Amsterdam, The Netherlands) (n = 6), or Grael PSG (Compumedics, Abbotsford, Vic, Australia) (n = 7). The sampling rates of each system were 125 Hz, 200 Hz, and 1024 Hz, respectively. These records were recorded at the sleep laboratory of the Kaohsiung Medical University Hospital (Kaohsiung City, Taiwan). Their lengths range from 3~11 h, depending on how long the participants had slept. Each record was pre-processed by the PSG systems with different bandpass filters. In particular, four out of the five samples that were recorded by the Nicolet system were filtered by a narrower filter (1.0–62.5 Hz) than the samples in the Reference dataset in order to explore our model’s performance when the filtering conditions changed. The detailed properties of the Clinical dataset are shown in Table 1. All of the experimental procedures were approved by the local ethics committee (Institutional Review Board of Kaohsiung Medical University Hospital, Kaohsiung City, Taiwan; Approval Code: KMUHIRB-E(II)-20190371).
2.2. Sleep Stage Manual Labeling
Both the Reference dataset and the Clinical dataset had sleep stage labels that were scored visually by sleep technicians. Five stages were used (W, N1, N2, N3, and REM) according to the rules of the AASM. The compositions of the Reference dataset and the Clinical dataset are detailed in Table 2.
2.3. Signal Pre-Processing
All of the PSG records in both datasets were exported as a European Data Format (edf) file for maximum compatibility with other analytic software. Each edf file contained six EEG channels (F3, F4, C3, C4, O1, O2), two EOG channels, chin EMG, leg EMG, airflow signals, lead-II ECG, oximetry, nasal pressure, snoring sounding, and body position. Because the EEG records in the Clinical dataset were recorded at different frequencies, they were down-sampled to 125 Hz before the bandpass filter was applied to match the Reference dataset. For sleep stage classification, the EEG signals from channels F4 and F3 were re-referenced to the opposite lateral mastoids (A1 or M1) and were filtered with a 0.5–50 Hz FIR bandpass filter in order to remove power line noises. All down-sampling and filtering were conducted with MATLAB (2020 b, The MathWorks, Natick, MA, USA) through the EEGLAB toolbox (v2021.0, Swartz Center for Computational Neuroscience, La Jolla, CA, USA).
2.4. Feature Extraction
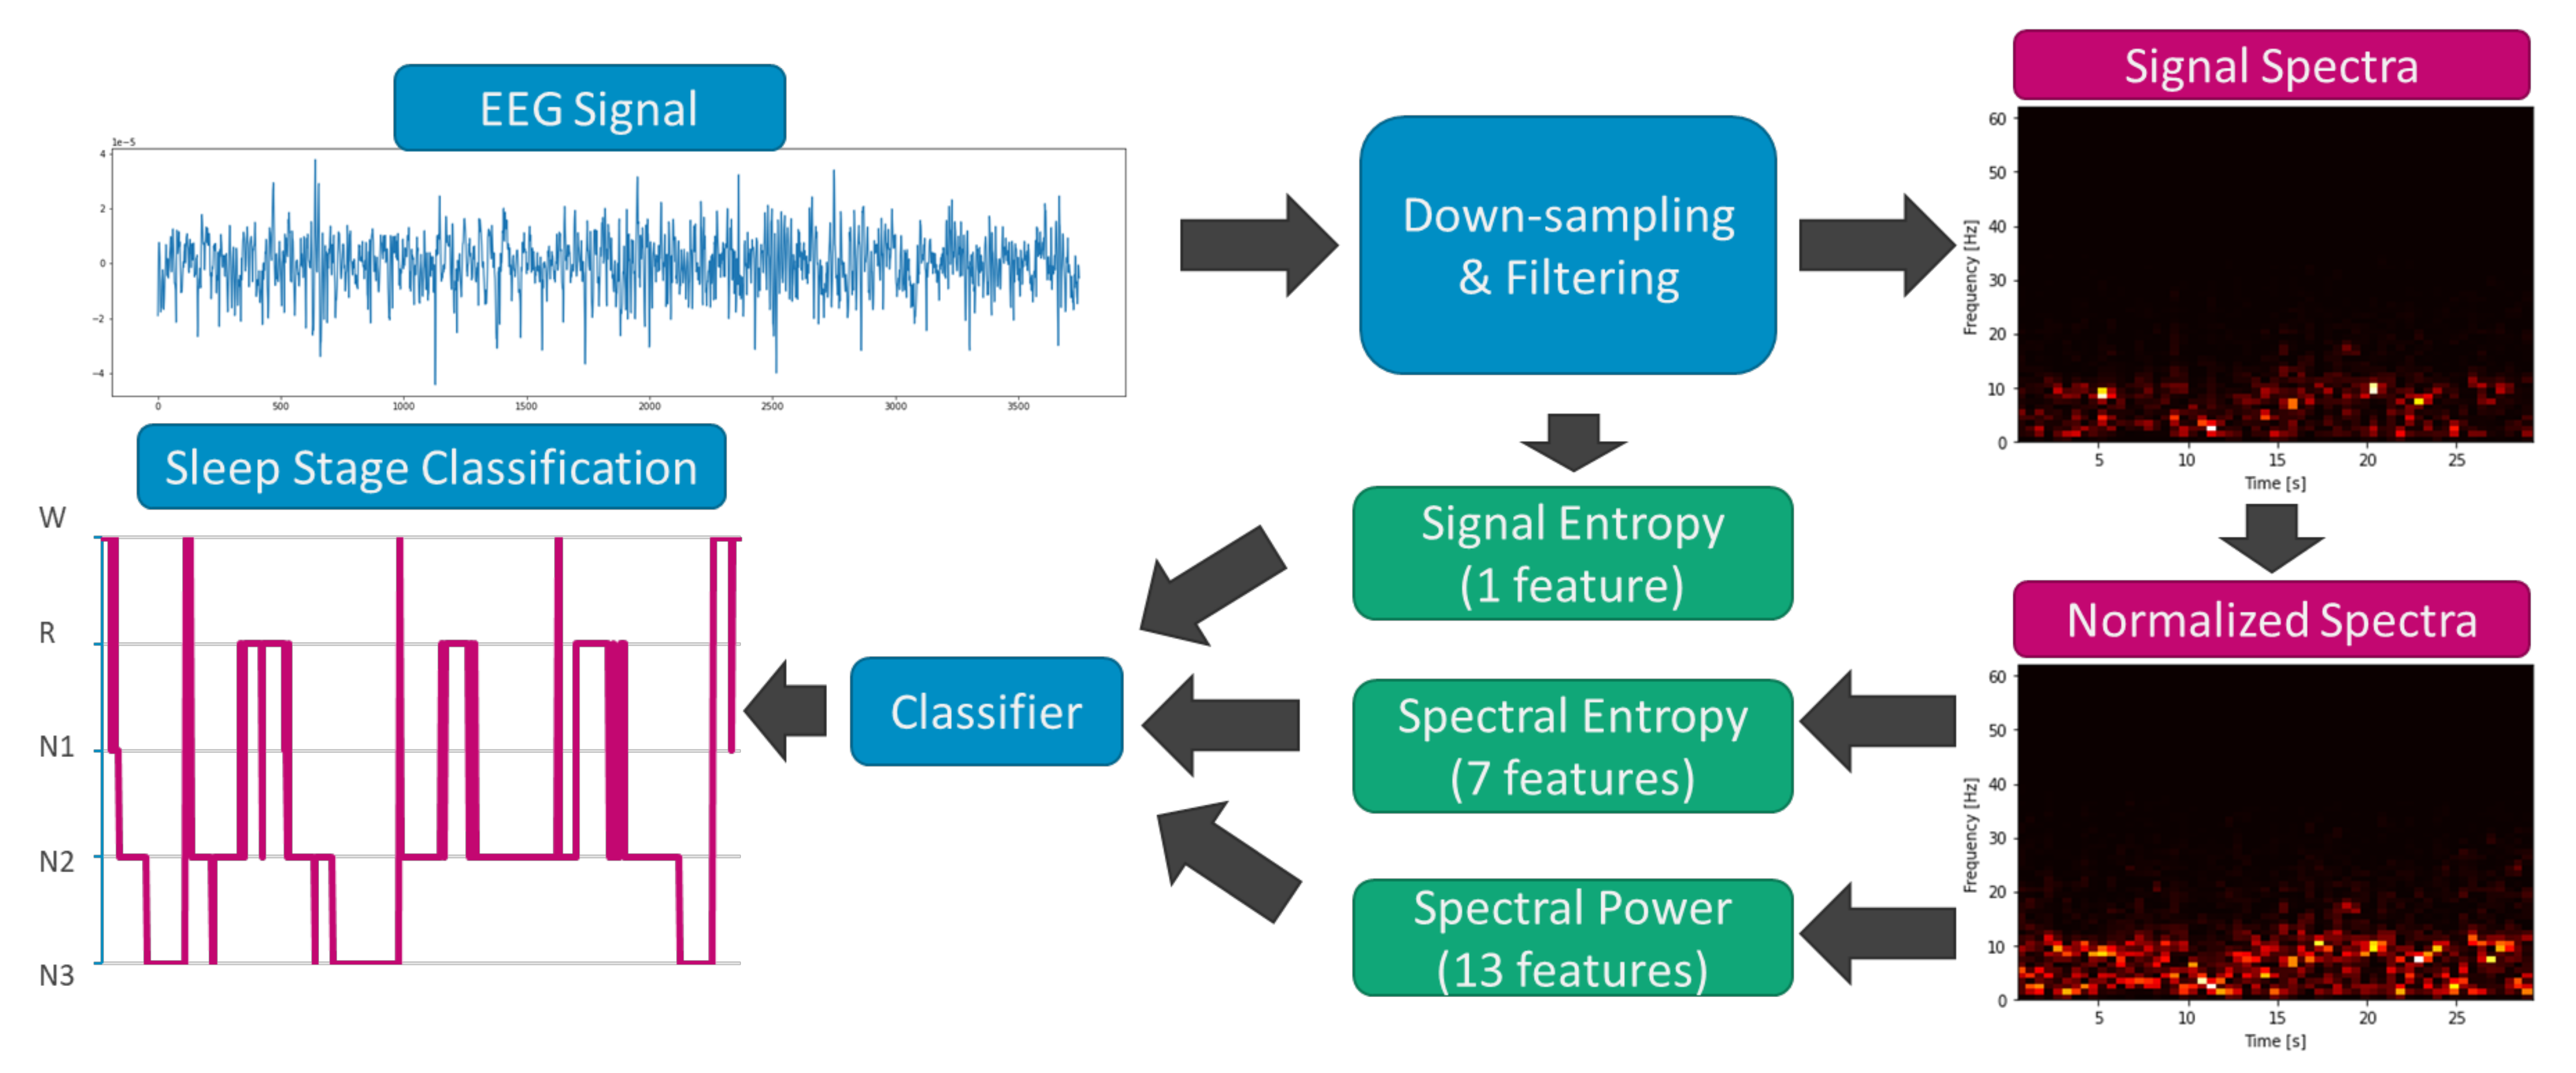
The procedure that was used for sleep stage extraction is shown in Figure 2. In general, each 30 s EEG input was able to derive a signal entropy and a frequency spectrogram. The spectrogram was normalized to enhance the spectral structure of the epoch. Then, the normalized spectrogram was used to extract the power band values and the spectra entropy.
We used the same power spectra feature extraction procedure as we did in our last iteration [23]. First, we used short-time Fourier transform (STFT) with a 1 s Hamming window overlapped with a 0.5 s window to decompose each 30 s EEG epoch. The derived PSD map was sliced into several bins by frequency. For each 1 s segment, the PSD values of each frequency bin were normalized by dividing them by the total PSD. The frequency band bins were picked based on expert knowledge on the structure of different sleep stages. Specifically, the PSD map was sliced into low delta (0.5–2 Hz), delta (1–4 Hz), theta (5–7 Hz), alpha (8–12 Hz), sigma (12–14 Hz), beta (15–30 Hz), and gamma (30–50) bins. A low delta frequency represents the slow-wave activity (SWA) that is dominant in N3. The delta band represents the potential occurrence of the K-complex, while the sigma band represents the sleep spindle, and both signals are distinguishing features of the N2 stage. The theta band represents light sleep (N1 + N2). The alpha, beta, and gamma bands represent wakeful stages. The PSD values in each frequency bin (except Gamma) were sorted and split into an upper sub-bin and a lower sub-bin. Each sub-bin was able to derive a sum that was representative of the relative dominance of a specific frequency. In total, 13 frequential features were derived for a 30 s epoch per EEG channel.
A limitation of our previous method is that power analysis might be inadequate for the recognition of non-stationary structures in sleep EEGs. While short, stationary sleep EEG structures such as SWA or sleep spindle may be recognized through STFT, nonstationary structures such as the K-complex, and random muscle artifacts are much harder to extract during the wake stage. To improve our previous feature extraction procedure, we employed spectral entropy to evaluate the information that was contained in each epoch. This creates a hybrid classification system that is able to utilize both linear features and non-linear features. The hypothesis is that an epoch with a complex waveform (such as N2 or REM) would contain more information, while a stationary epoch (such as N3) would contain less information. Therefore, it is possible to distinguish different stages by their entropy value. Indeed, there have been multiple studies that have used entropy as a feature for sleep stage classification [24,25,26,27]. Some studies used variants of approximate entropy (ApEn) [28] such as sample entropy (SampEn) [29] and multiscale sample entropy (MSE) [30] on raw EEG time series. Others use information entropy (sometimes called Shannon entropy) and its variant such as log energy Entropy on the frequency spectra of EEG signals. During our preliminary tests, we found that log energy entropy yielded the highest variance across different stages for both the time series and frequency spectra. Therefore, we opted to use log energy Entropy to evaluate signal complexity in the following study. The Log energy entropy can be calculated from the equation below:
When evaluating signal entropy, Si represents the EEG amplitude. When evaluating spectral entropy, Si represents the power density of each given band (low delta, delta, theta, alpha, sigma, beta, gamma). For each epoch, one signal entropy feature and seven spectral entropy features would be derived. In total, eight entropy features were obtained.
2.5. Sleep Stage Classification
In recent studies, variants of SVM and decision tree classifiers have been the most popular option for sleep stage classification [31,32,33,34,35]. Decision tree and its variants use sets of decision rules to distinguish different classes. These classifiers usually show high accuracy, but their rules tend to overfit to the training data. On the other hand, SVM and its variants project features into a high-dimension feature space and define a surface that separates different classes. This approach tends to be more generic and tends to suffer less batch effects. Because we collected our data from multiple brands of PSG systems, we opted to use SVM in this study. After the features were extracted, they were fed to a Gaussian SVM classifier. While the SVM classifier is able to learn the features of individual epochs, it is unable to learn inter-epoch relationships and may produce sudden changes in the sleep stages. To compensate for this, we applied a median filter (MF) with a window of three 30 s epochs in order to smooth the predicted stages. All of the feature extraction and classification processes were implemented with Python 3.
A class imbalance could lead to overfitting in both SVM and Tree classifiers. This issue may be avoided by either removing samples in the majority class or by assigning a different weight to each class. In the Reference datasets, there were far more N2 stages than there were for the other samples. In our preliminary study, we tried to both randomly remove the N2 samples and to change the class weights to see if the classification was affected. No differences in performance were observed in either condition. Therefore, we chose not to remove the data nor to use a custom weight in the Reference dataset during the training phase.
2.6. Statistical Analysis
To compare the classification performance of our model on samples from different PSG systems, the model was first trained against the Reference dataset. Then, the model was validated against each sample in the Clinical dataset. Every validation would derive a set of four metrics (precision, recall, F1 score, and accuracy). These metric sets were grouped by their PSG systems, and then the one-way ANOVA was used to evaluate the differences between groups. Statistical analysis was performed using jamovi (version 1.6, The jamovi project).
3. Results
3.1. Reference Dataset
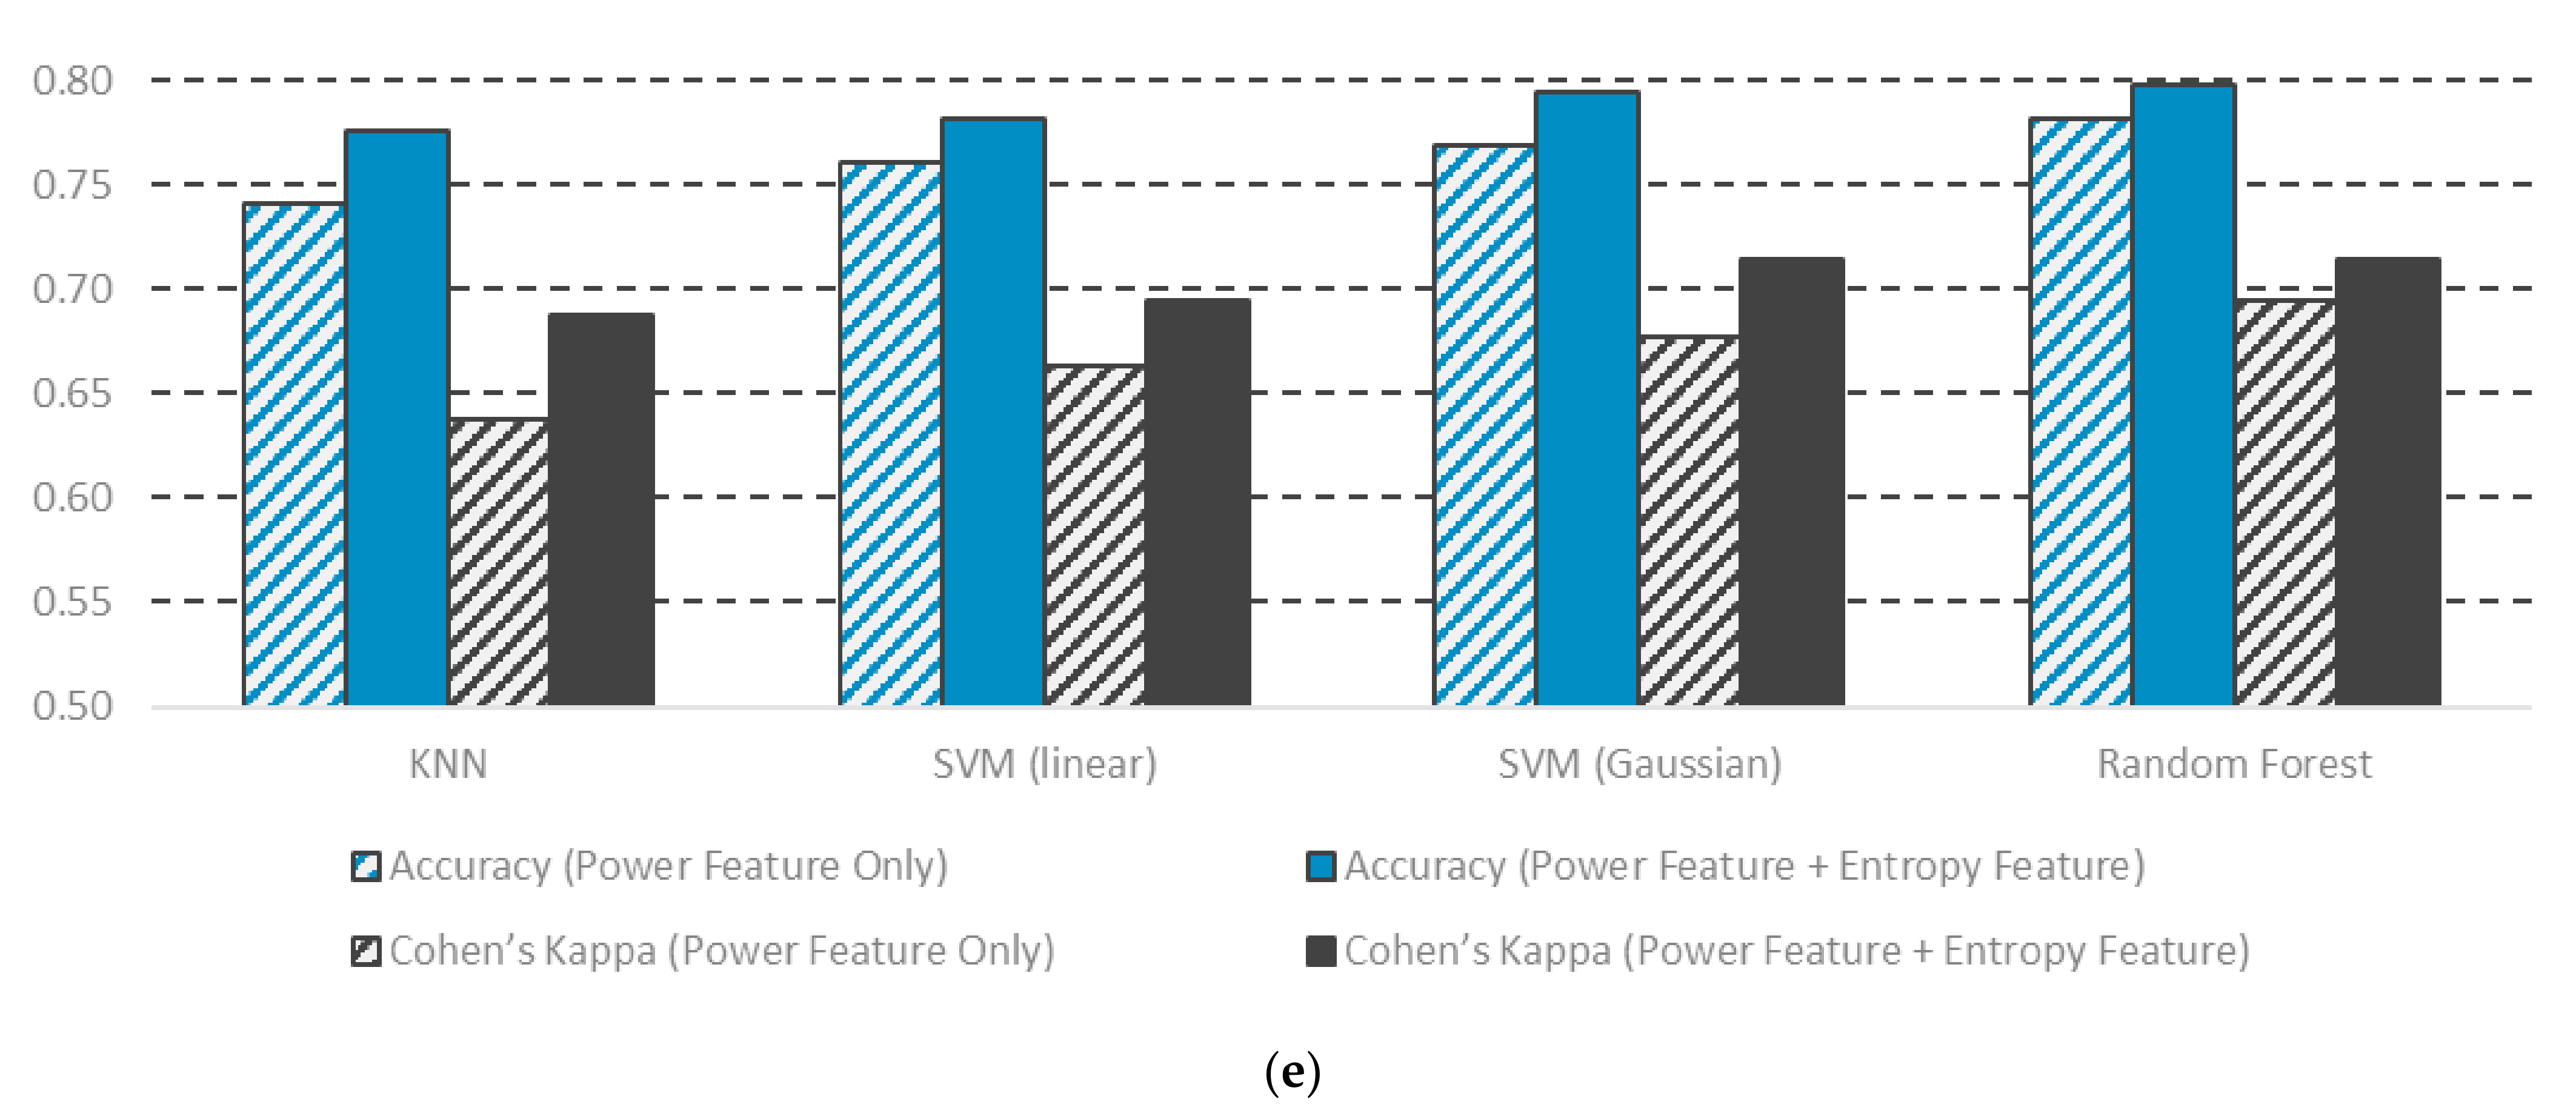
We used the F3 channel and the F4 channel for feature extraction and a Gaussian SVM to test the performance of the classification system. The classification results for the Reference dataset are shown in Figure 3. For the F3 channel, the overall accuracy of the training split was 0.80 (Figure 3a) while that of the testing accuracy was 0.79 (Figure 3b). The F4 channel showed almost identical results, with a training accuracy of 0.81 and a testing accuracy of 0.79 (Figure 3c,d). In both channels, the classification accuracy of each class in the training split and testing split were almost identical. This indicates that there was no overfitting. The best classified class was the N2 class, while the worst classified class was the N1 class. This is in line with most sleep stage classification studies [10,11,12,13,14,15,16,17,18]. Such differences might be caused by sample size, as in normal sleep, N2 was the most abundant stage, while N1 was the least common. Another possible cause could be that the N2 stage demonstrates distinctive EEG structures such sleep spindle and the K-complex, which are able to be captured through either power spectra or entropy. Since it is an intermediate stage that occurs between different stages, The N1 stage has fewer distinctive patterns that could be extracted. Indeed, stages with distinctive patterns such as Wake, N1, and N3 all have good precision and a good recall rate, as shown in Table 3. To validate the effectiveness of the entropy features, we compared the performance of our original feature set (power feature only) and the new feature set (power feature and entropy features) against KNN, random forest, and SVM using the F4 channel EEG. The classification results are listed in Table 4. The KNN and the linear SVM classifier showed the lowest accuracy (0.78 and 0.78) when the new feature set was used (Figure 3c). The random forest and Gaussian SVM classifier showed the highest accuracy (0.80 and 0.79, respectively). All of the classifiers yielded higher accuracy after incorporating entropy features. This shows that the entropy features that we added are a good compliment to the spectral power features and that they are stable across different classifying methods. Additionally, note that all three classifiers showed higher Cohen’s Kappa values. This indicates that the labels that were produced from the new feature set are more similar to those made by human experts. Overall, our results indicate that adding entropy features significantly improved the robustness of sleep stage classification.
3.2. Clinical Dataset
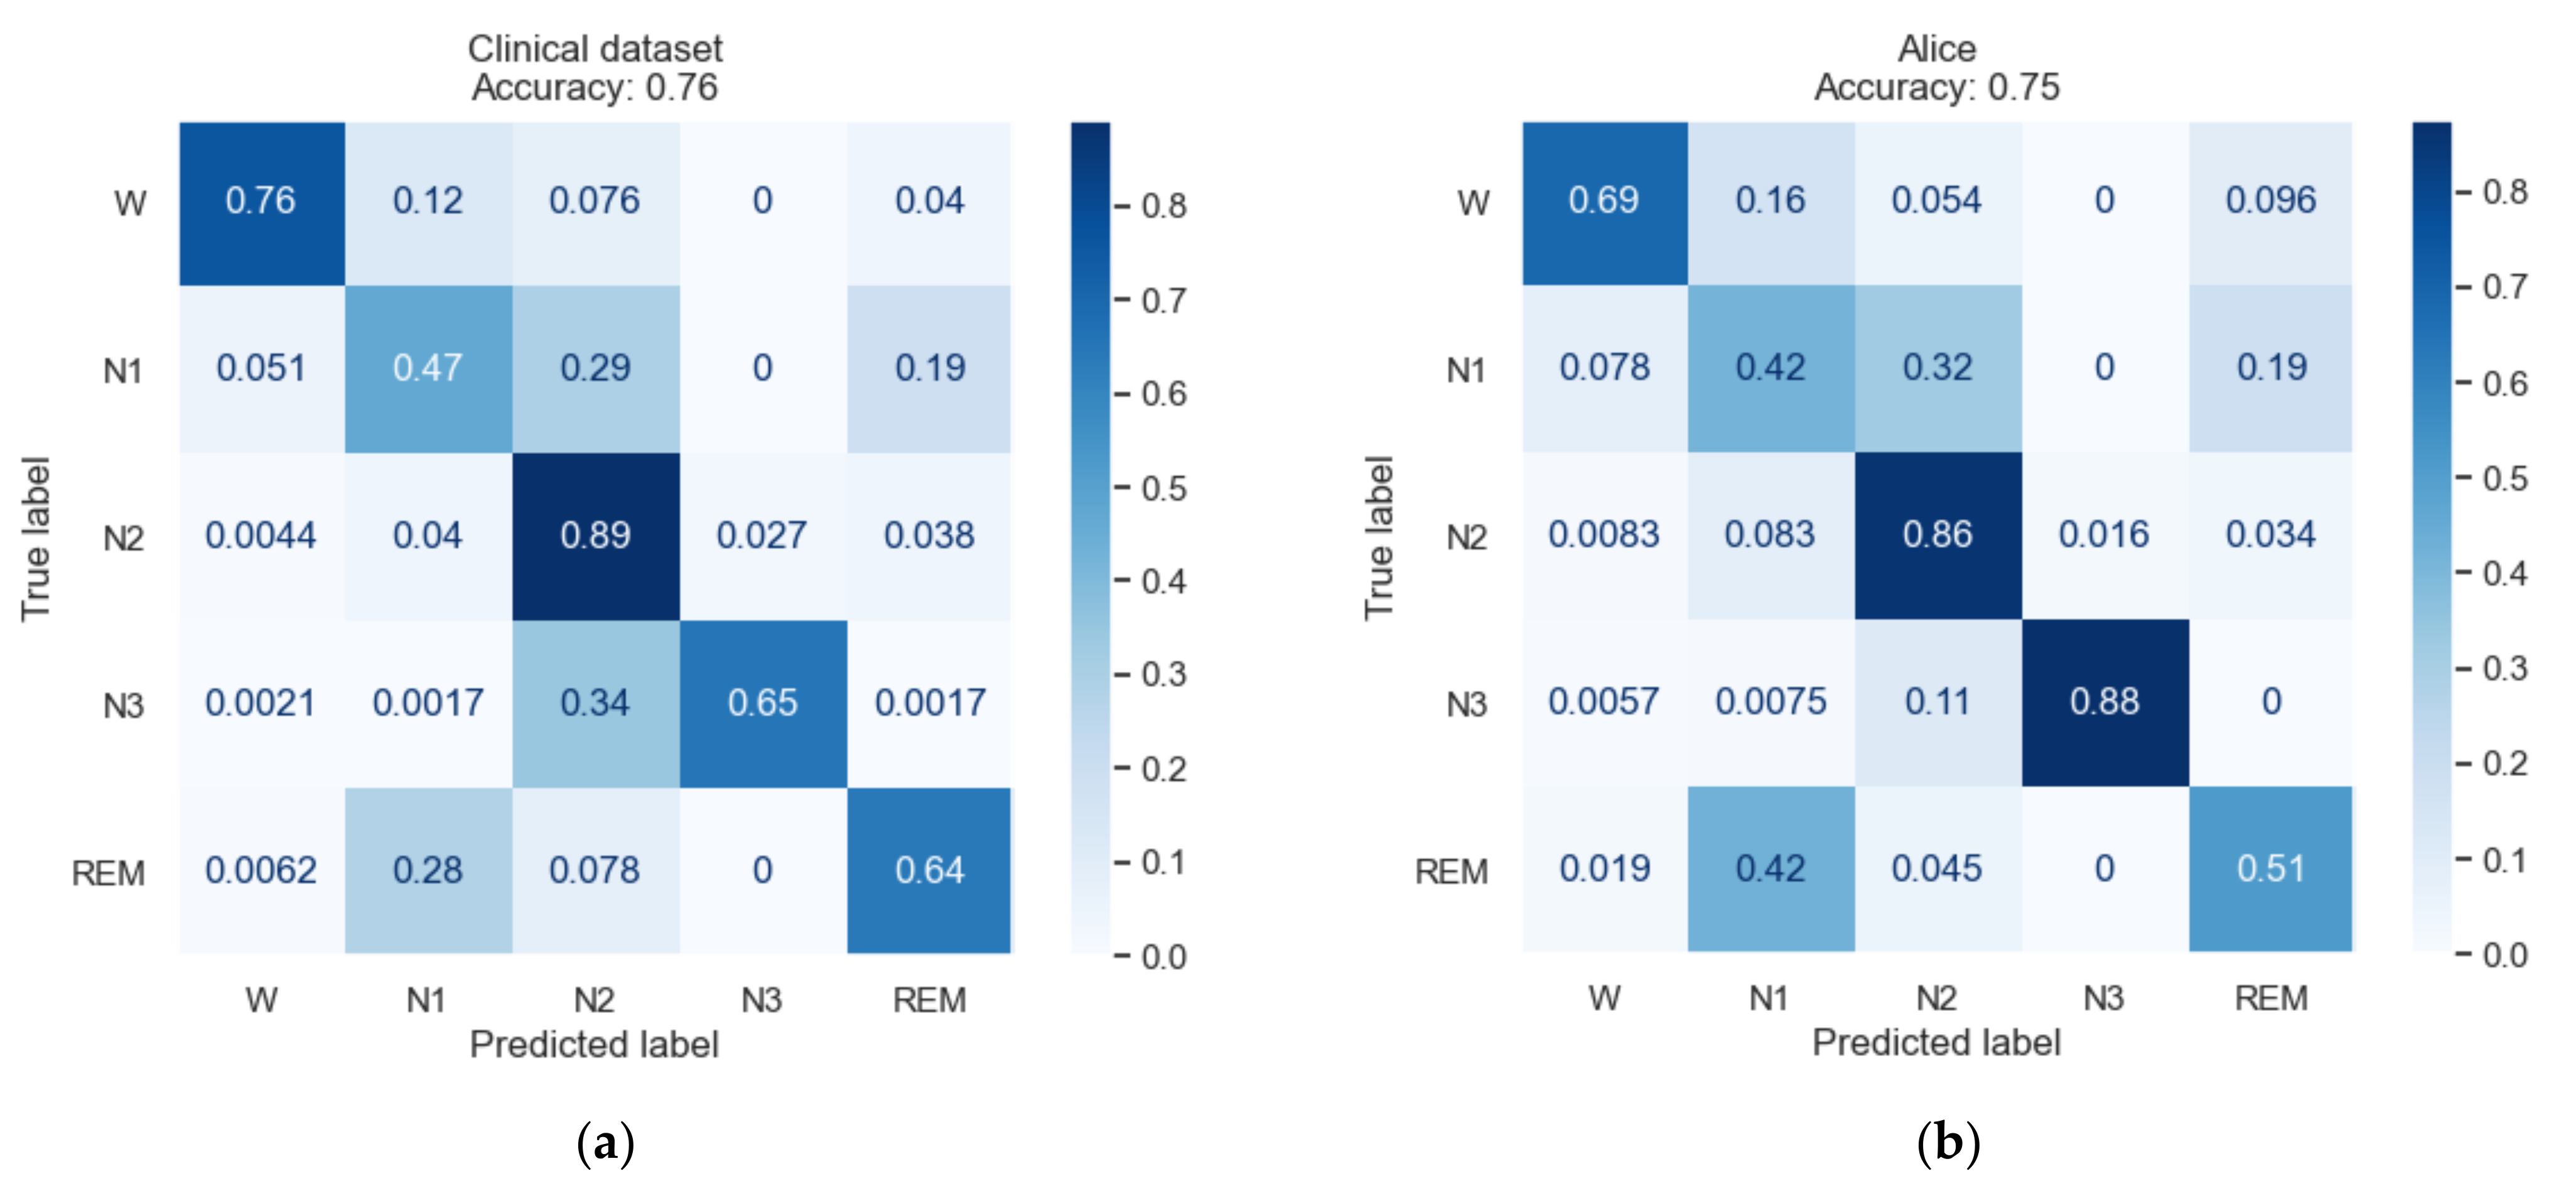
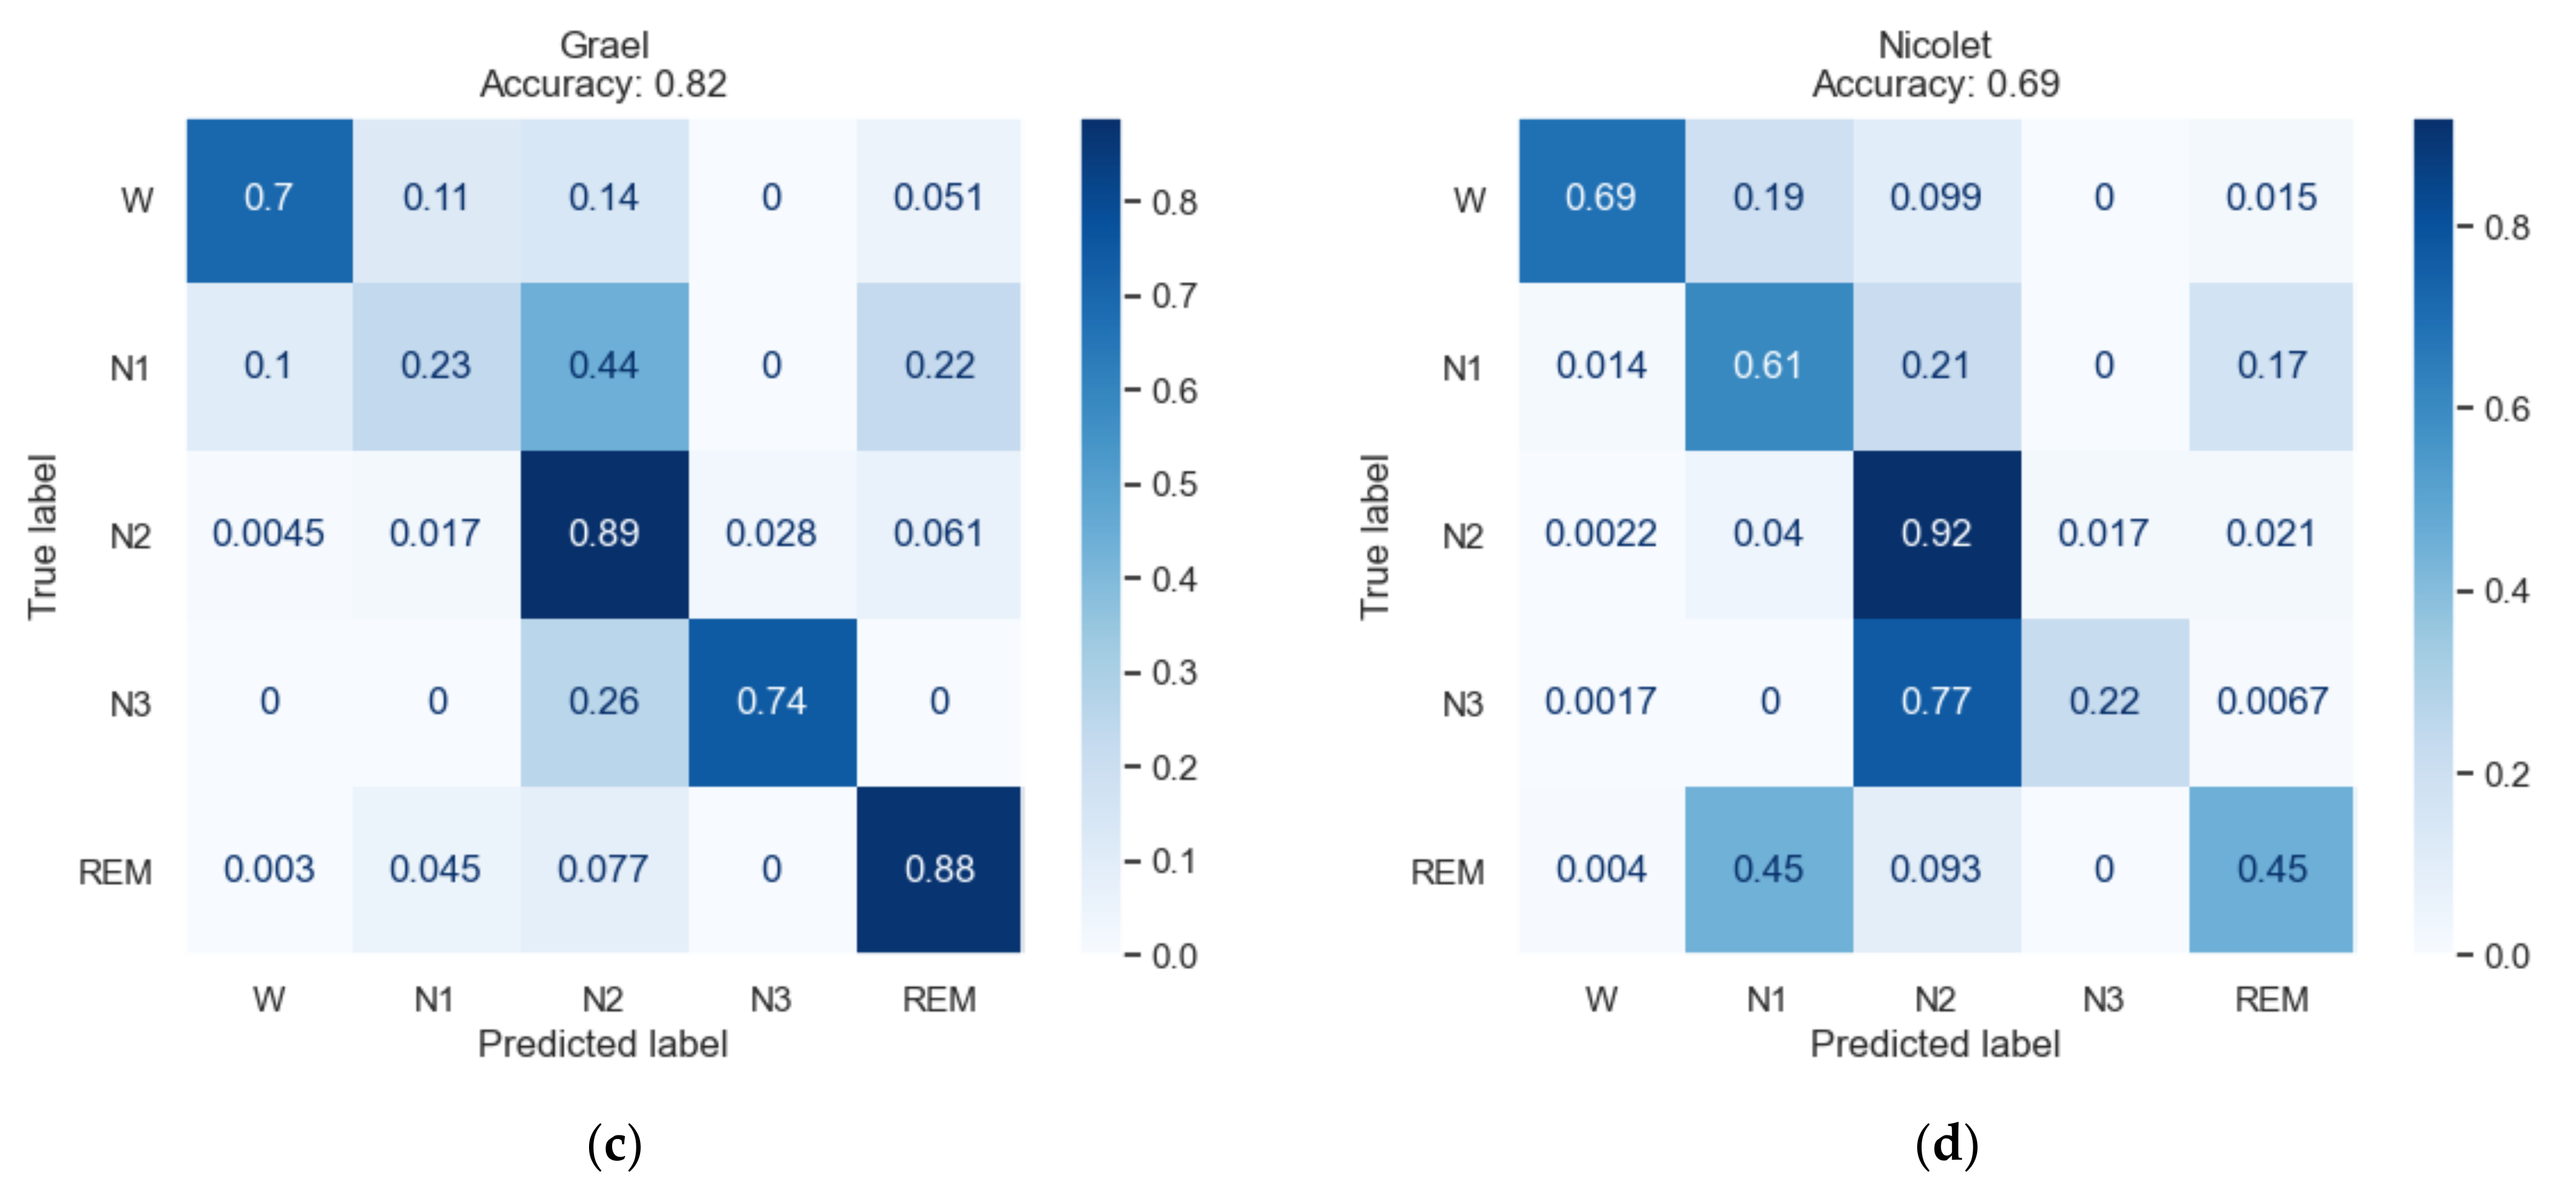
To test the algorithm’s robustness against PSG records from different source, we took the model trained by Reference dataset and evaluated it against Clinical dataset. Considering tree-derived classifiers tend to overfit more than other classifier, we opt to use a Gaussian SVM for classification in Clinical dataset. EEG signals from F4 channel were used because they showed slightly classification results in Reference dataset. Figure 4 shows the classifying results of the clinical dataset. The overall classification performance was slightly worse than Reference dataset. While accuracy of Wake, N1, N2 were roughly the same, the accuracy of N3 and REM stages are much lower (Figure 4a). When grouped by their respective PSG systems, records from Grael (No. 7–13) appeared to have the best classification (Figure 4c). Curiously, PSG records from Nicolet (No. 14–18) showed the lowest accuracy, with large proportion of N3 stage being mis-classified as N2 (Figure 4d).
To explore how different PSG systems and signal filtering procedures may affect classification results, we divided the classification results by subject and then grouped them by their respective system. Figure 5 shows the distribution of the features that were extracted from different the PSG systems in each class. The values are listed in Supplementary (Table S1). The Nicolet system showed slightly different distribution patterns in the features that are related to the theta rhythm (T-L, T-U, T-SPE) and to the low delta rhythm (LowD-L, LowD-U, LowD-SPE) in N1 (Figure 5b), N2 (Figure 5c), N3 (Figure 5d), and REM (Figure 5e). This is likely caused by the aggressive filtering (1.0–62.5 Hz) that was applied to the Nicolet samples, as part of the lower delta information (0.5–1.0 Hz) was removed in most of the Nicolet samples. The removal of the delta information may have also influenced the PSD normalization process and may have led to a shift in the extracted power values of less prominent bands such as the theta band. Meanwhile, the features that were related to the alpha, beta, gamma, and sigma bands mostly showed an overlapped distribution across the Alice, Greal, and Nicolet samples. This suggests that our classification system may still work despite different preprocessing conditions.
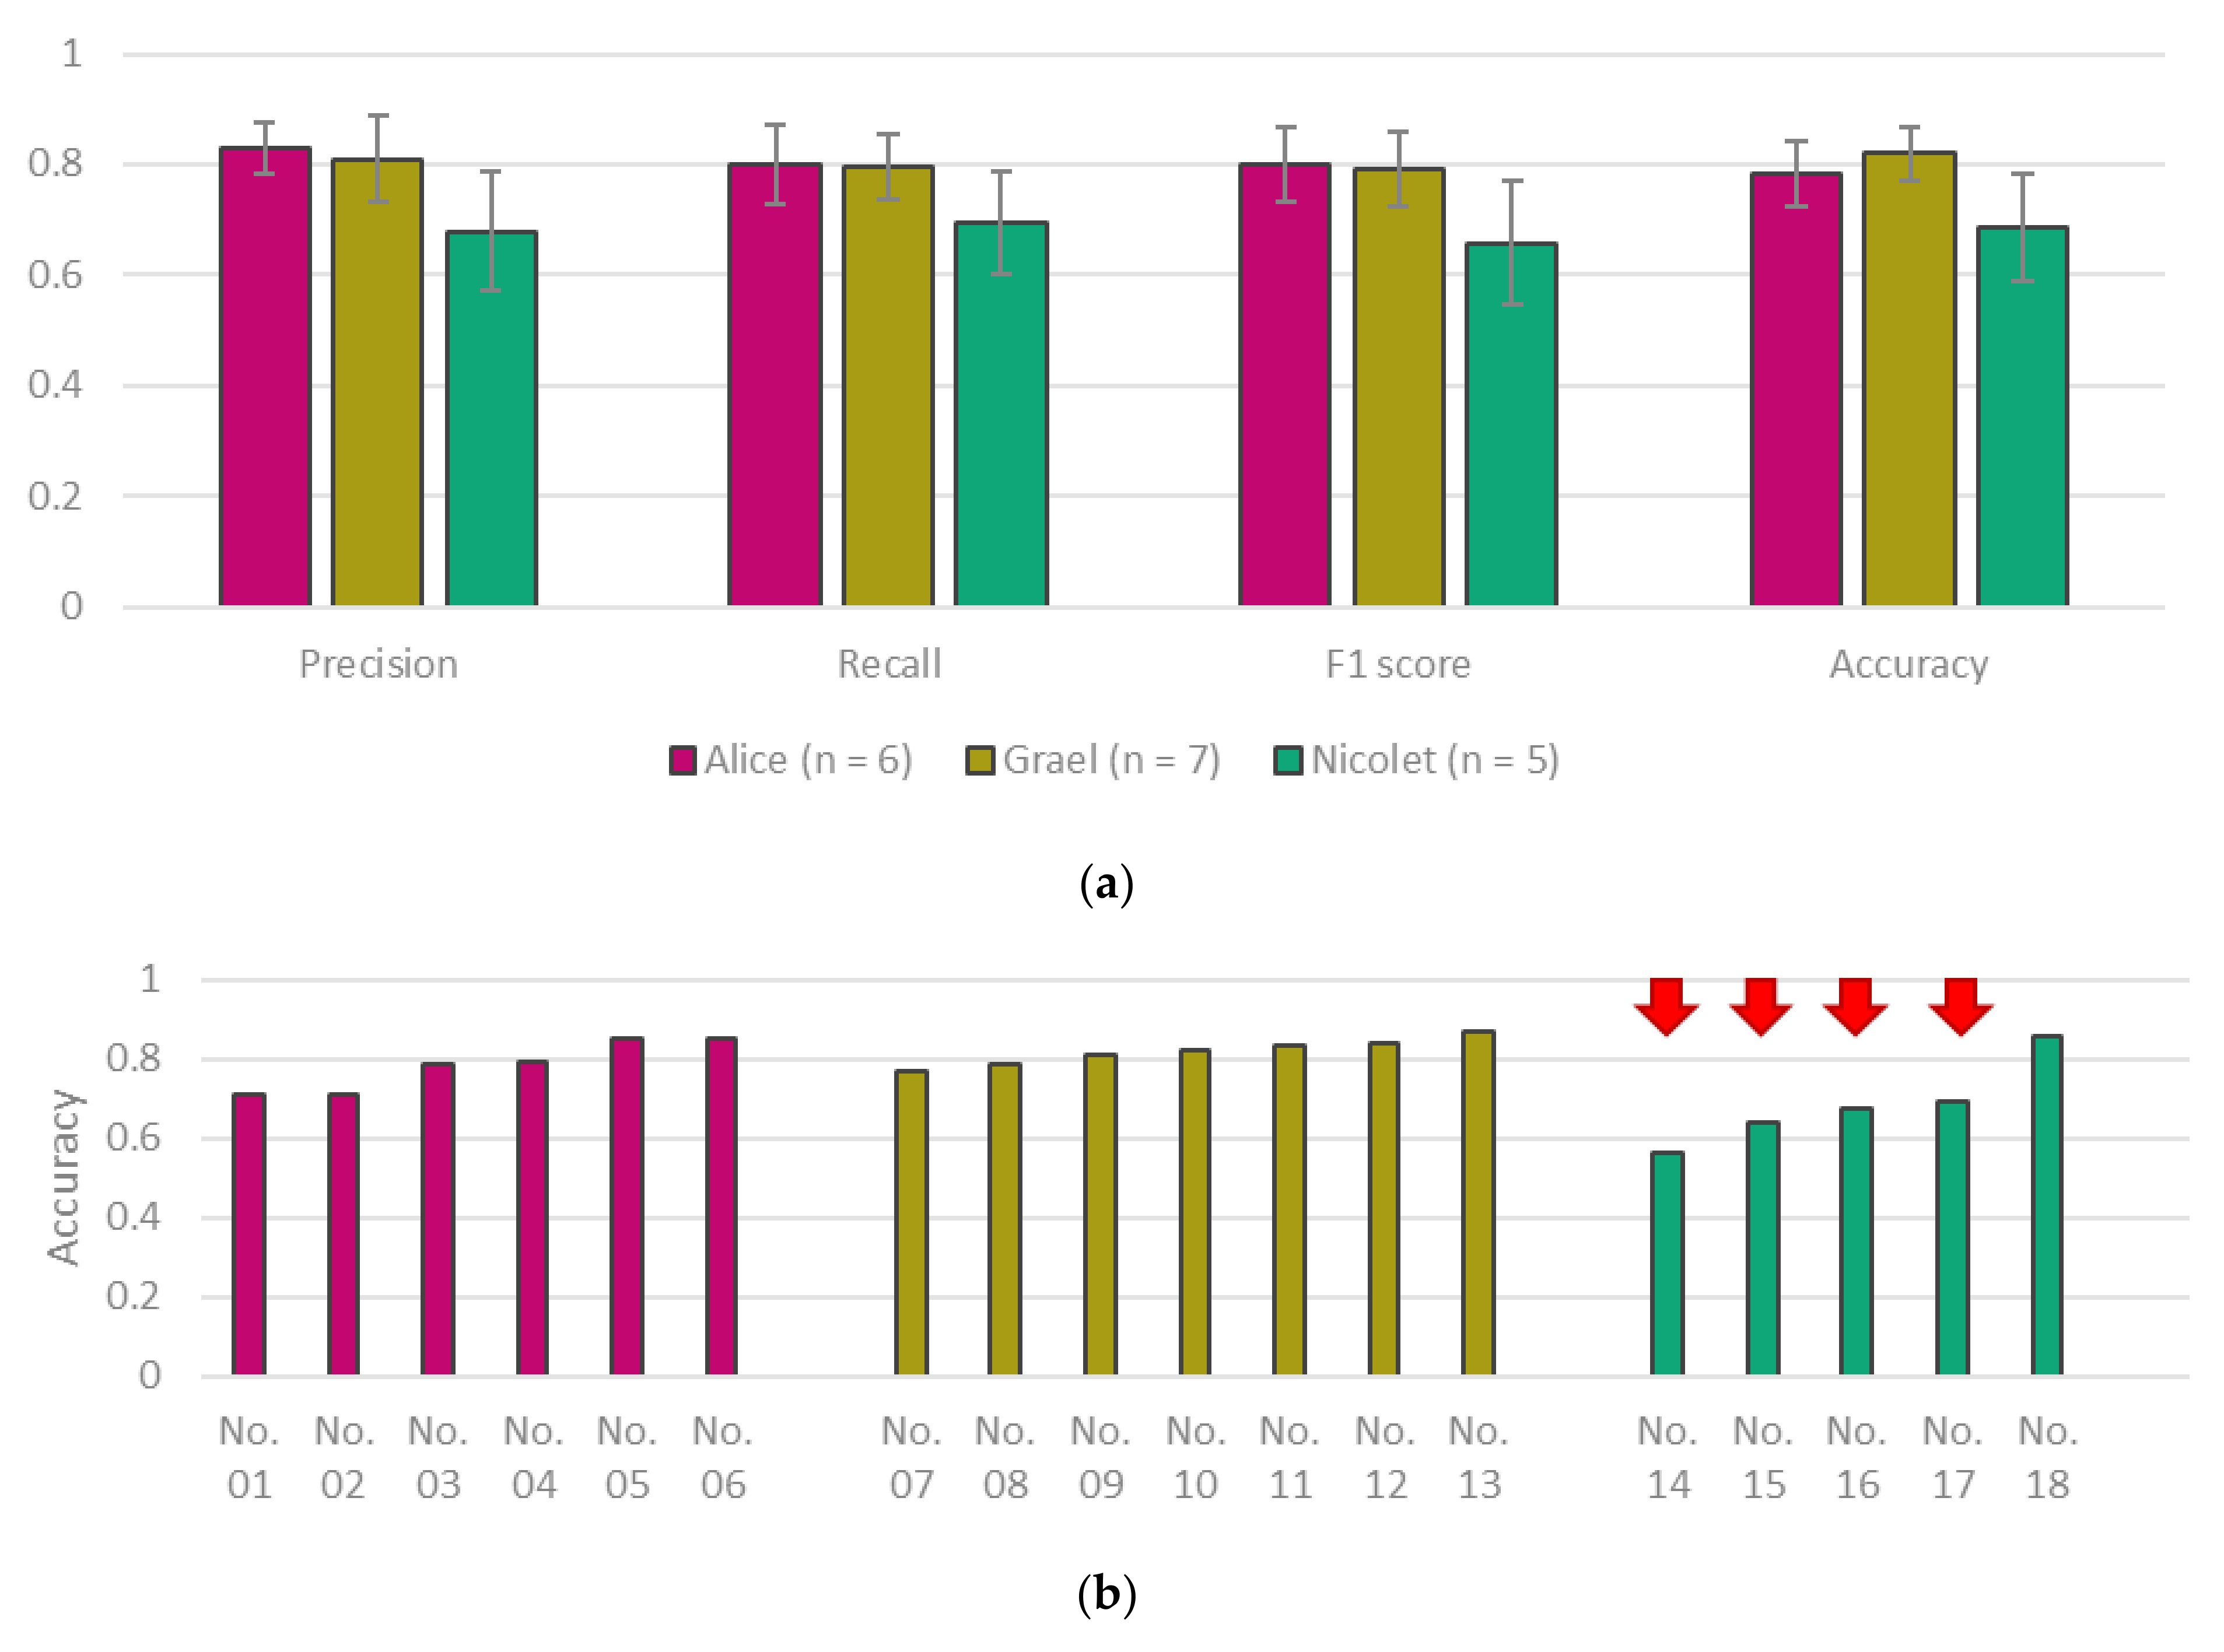
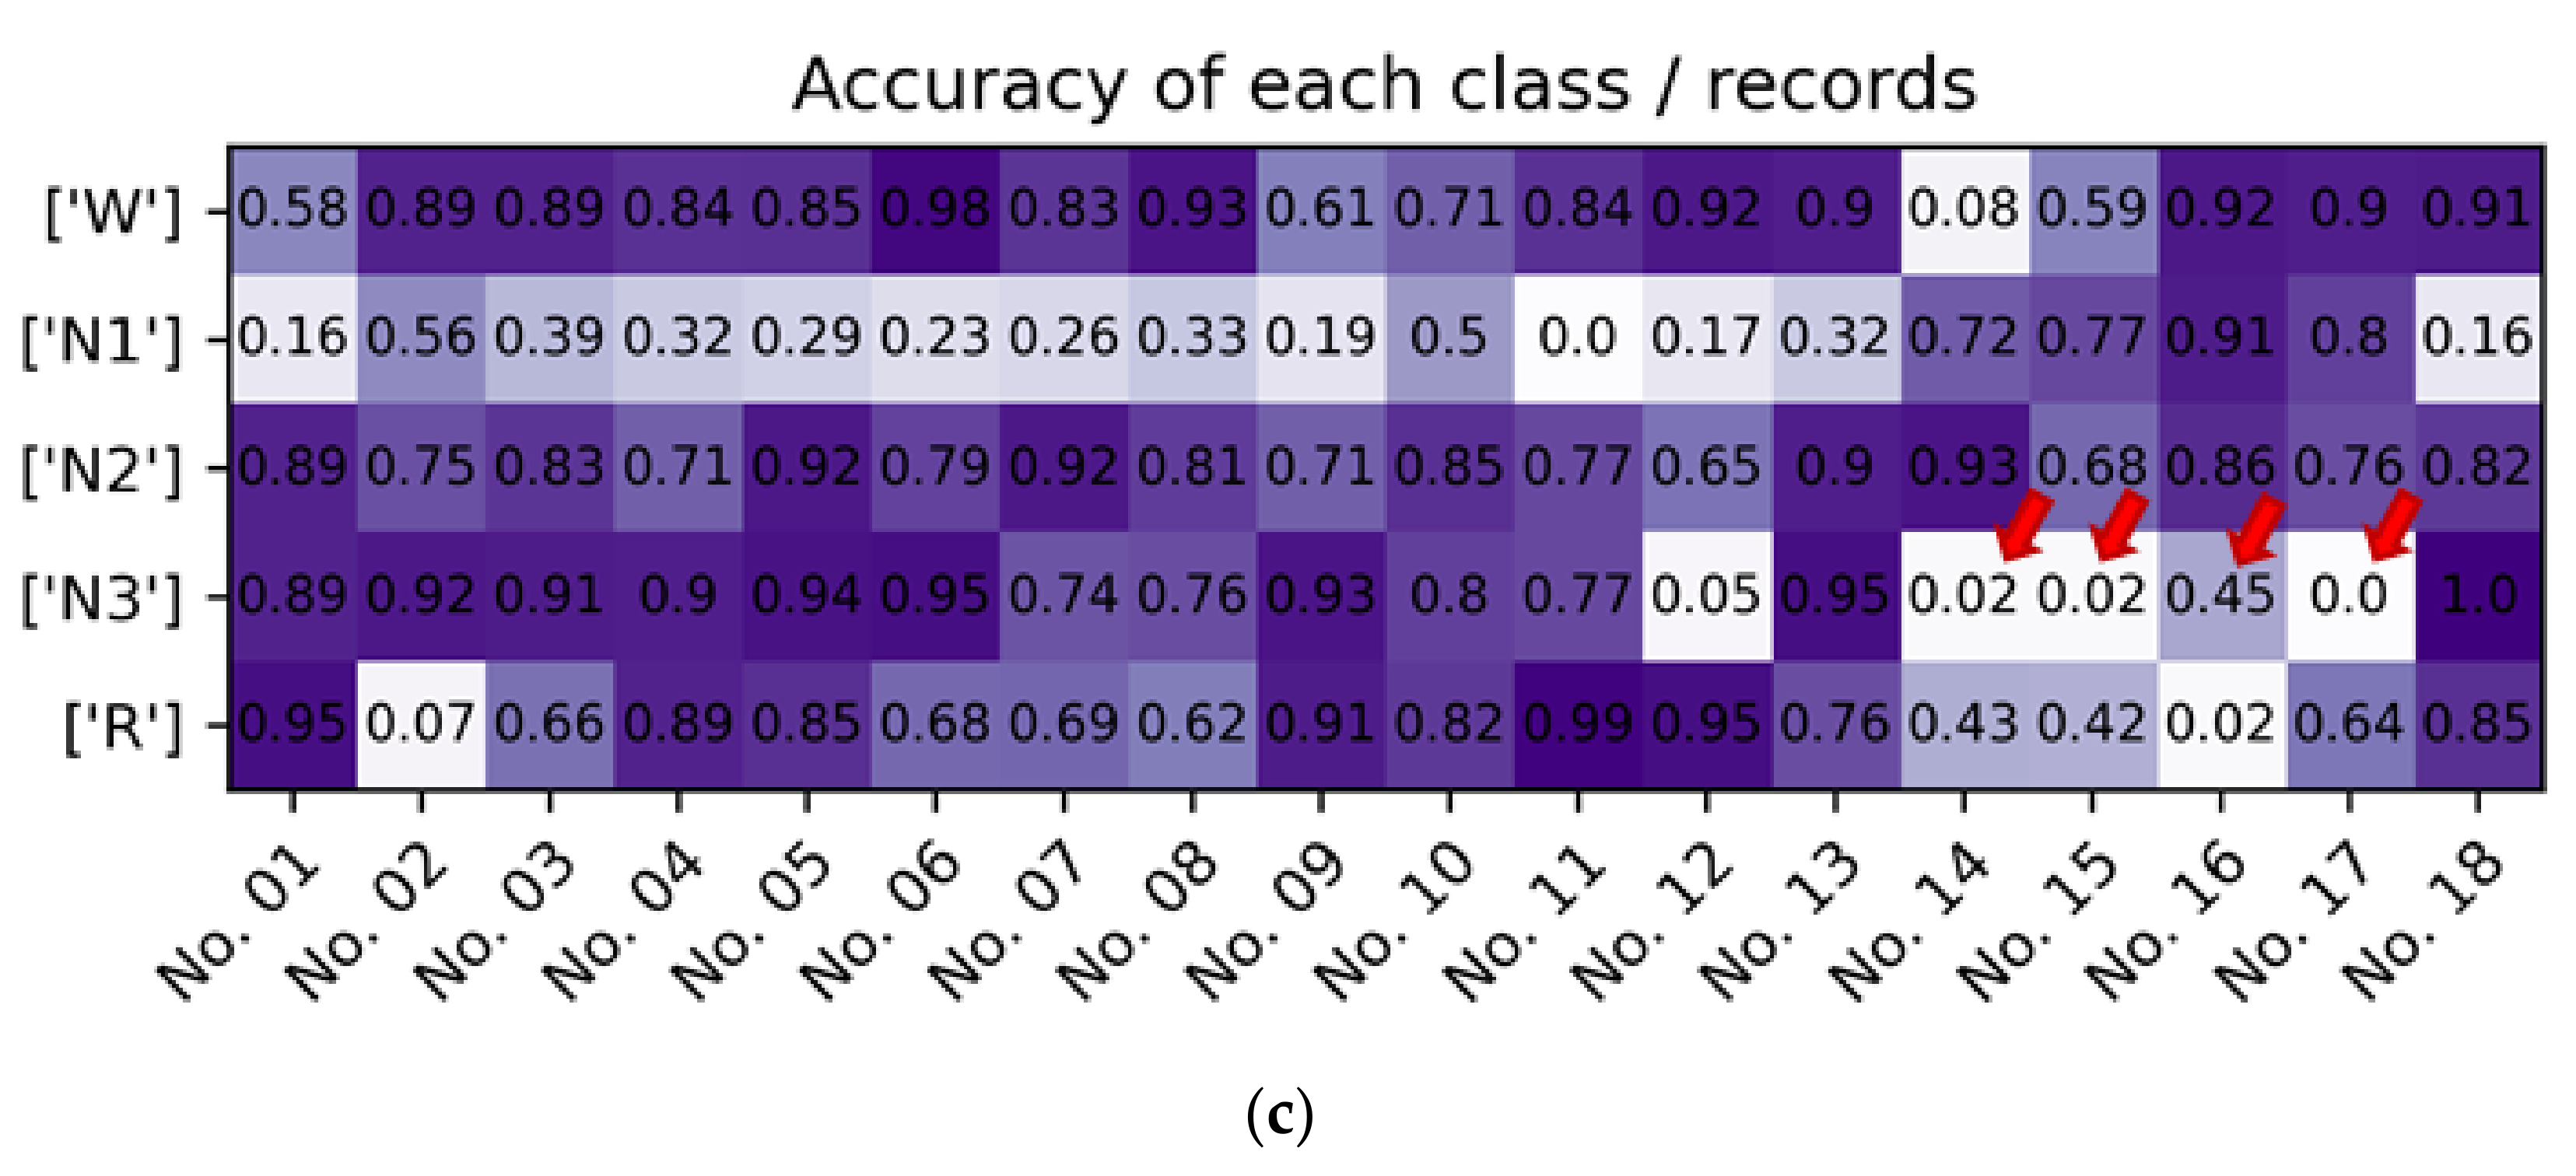
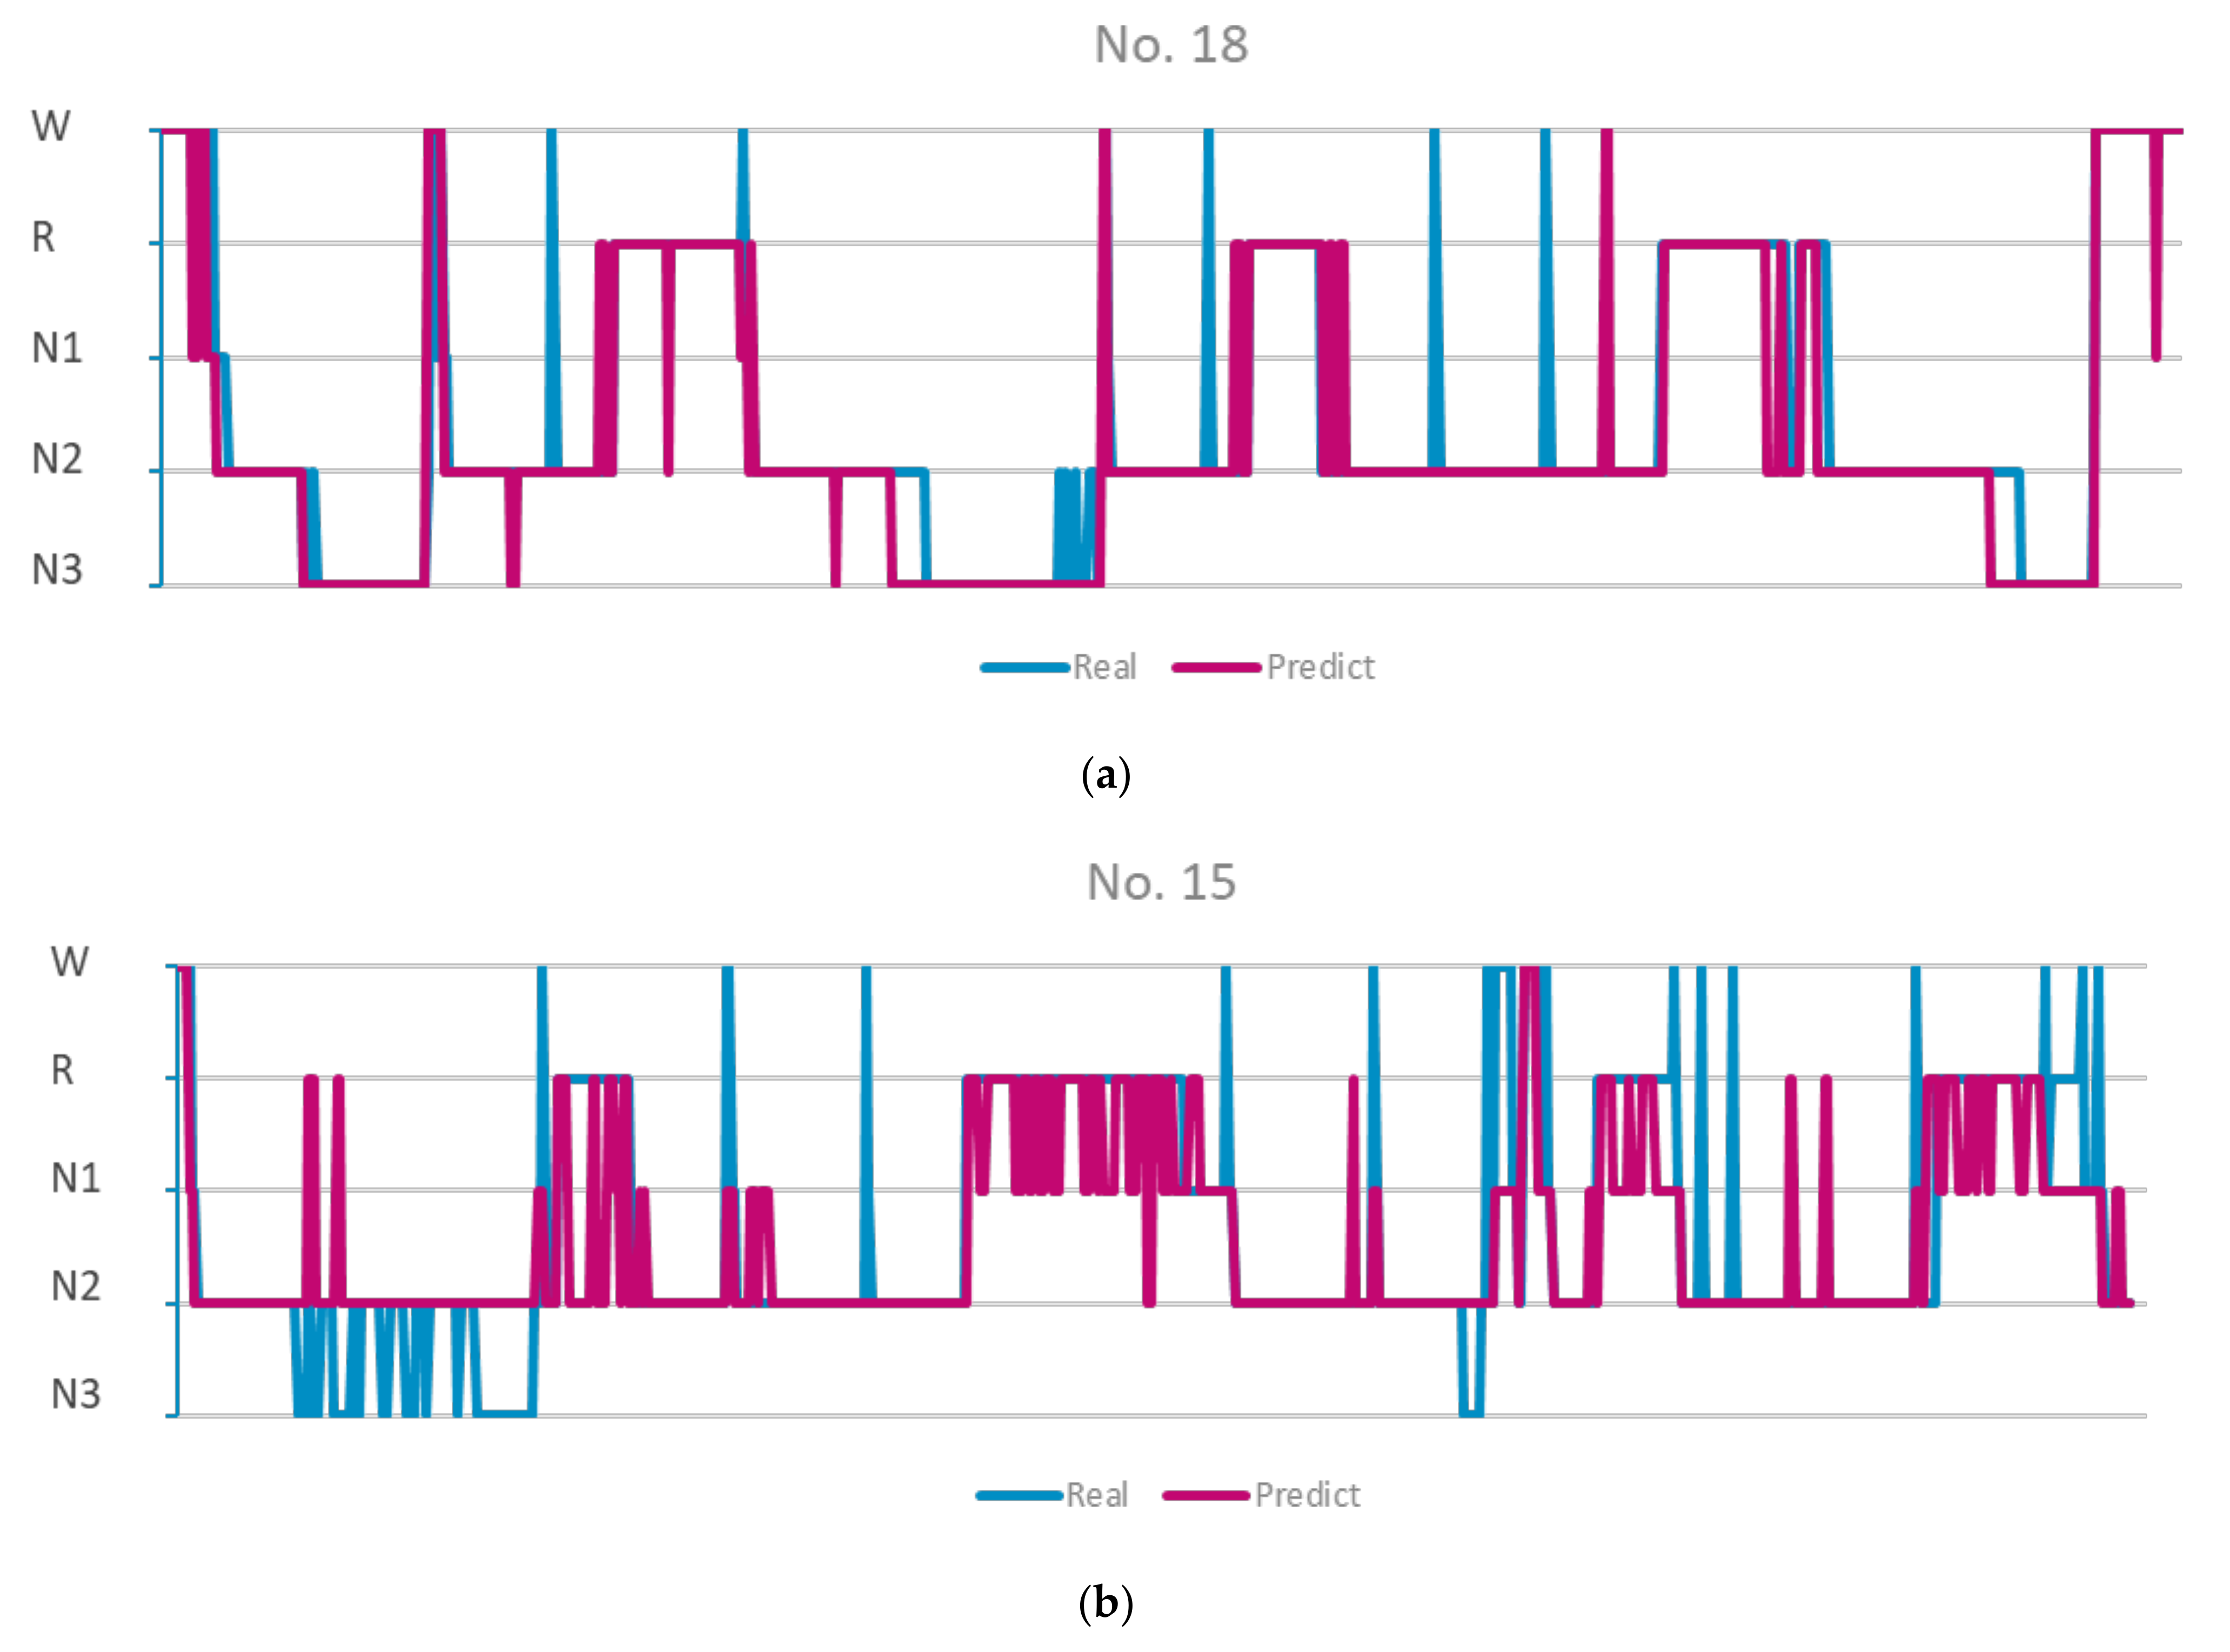
Figure 6a showed the various classification metrics of different groups. The results for each of the metrics are listed in Table 5. Although the Nicolet group showed lower average values in all of the metrics, the differences were not significant (p > 0.05). When examining the individual records, we found that some of the records in the Nicolet group (record No. 14–17) had accuracies that were as low as 0.58, which are much lower than average (Figure 6b). On the other hand, the other records that were obtained from Nicolet (No. 18) demonstrated very high accuracy. No. 18 differs from other Nicolet records in that it uses a wider bandpass filter (0.5–62.5 Hz) than the records that were obtained from the other systems (1.0–62.5 Hz). We then assumed that the lack of low-frequency information may be one of the reasons for why the classifier demonstrated such poor performance. This was confirmed when we looked at the per class accuracy of each of the records (Figure 6c). While No. 18 and most of the other samples showed very high accuracy values for N3 sleep, No. 14–17 showed extremely low N3 accuracy. The hypnograms also reflect this difference (Figure 7). While all of the N3 stages were correctly identified in record No. 18, none of them were recognized in No. 15. Overall, our results show that the proposed sleep stage classification algorithm was able to achieve high generality across samples that have been collected by different PSG systems as long as aggressive frequency filtering was not applied.
4. Discussion
The rapid development of machine learning and artificial intelligence have led to a boom in machine-assisted labeling and diagnosis in medical technology. Although most studies are related to body imaging recognition, there is an increasing number of studies that are dedicated to electric bio-signals. Sleep stage classification poses a unique challenge for machine learning in two aspects. The first is that sleep EEG are not as stationary other signals such as ECG. The other is that sleep EEG are often recorded by proprietary systems, which makes it hard to build a general-purpose model or to evaluate the robustness of one model against a given set of data. The latter might be a critical limiting factor in applying a sleep stage classification algorithm in a clinical environment. There is no guarantee that a trained model would perform effectively against a set of sleep PSG records, nor is there a good way to evaluate the effectiveness. In this study, we present a sleep stage classification system that is based on spectral power and entropies. The model showed reasonable performance in the Reference dataset, a dataset that was composed of PSG records that were collected using a single PSG system brand under the same conditions. We then tested the model against the Clinical dataset, which contained PSG records that had been collected from systems that were developed by various brands and with records taken under different conditions. The model showed high robustness against most of these records, save for some records that had been aggressively filtered. Overall, the classification system demonstrates source tolerance and may be used as a base to build a general-purpose sleep stage classification system.
In our previous study, we only used spectral power information for sleep stage classification based on expert knowledge. We tried to solve some inherent problems regarding spectral feature extraction, such as through the use of a sliding-window STFT instead of FFT. While these approaches integrated some expert knowledge into the machine learning process, there were still other aspects missing, such as the randomness of each EEG epoch. In this study, we managed to incorporate signal complexity by introducing entropy features. First, we used signal entropy to evaluate the overall regularity of the EEG signal. Second, we applied spectral entropy in order to achieve spectra information. Spectral entropy is usually evaluated against the whole spectrum. Here, we took a different approach by slicing the spectra into multiple sub-bands and then evaluated their respective entropy. In doing so, we were able to evaluate the complexity of the different sub-bands individually and were able to derive more distinctive features. This is especially useful in distinguishing between stages such as N2 and N3. The former would show high complexity in bands containing the sleep spindle, while the latter would show higher complexity in the delta band but very low complexity in the higher bands. The resulting algorithm showed improvement in all of the metrics compared to our previous iteration. In theory, not every type of entropy would significantly contribute to the classification of different stages across all of the different frequency bands. Thus, our current iteration may still have room for improvement. Selectively picking entropy features based on expert knowledge would further simplify our model and would further improve its generality.
In the first half of our study, we used a uniform EEG dataset to test our classification. The Reference dataset was collected using the same type of EEG system under the same conditions. In the second half of our study, we took a different approach by testing the trained model against the data that had been collected by various EEG system under different conditions. The first approach was the same as the one taken by most other sleep classification studies, where a model is trained and verified against a uniform dataset. The second approach is more similar to how sleep stage classification is used in a clinical environment, where PSG records are recorded by different systems. In the first approach, because all of the conditions were the same for all of the different samples, it is guaranteed that the trained model would work on the rest of the data. This would also minimize variations in the dataset and would yield better classification results. However, the trained model may suffer from over-fitting caused by the dataset being used. In this context, over-fitting is not always visible, as both the training and validation process use the same data source. By using data that were collected from different validation systems, we were able to examine how our model performed across different environments. This is important for the pan-system utilization of the sleep stage classifier, for this would ensure the that the classification system would be compatible with different PSG sources.
Three types of PSG systems were used to collect data for the Clinical dataset: the Nicolet, Grael, and Alice systems. The trained model showed robust performance against the Grael dataset and Alice dataset. This shows that our proposed algorithm has high generality against PSG records from different sources. Initially, we expected that the samples that had been collected from the Nicolet system would show the best classification results since this was the same system that was used to collect the Reference dataset. Contrary to our assumption, the model showed the worst performance on the records that were collected by the Nicolet system. Upon further examination, we found that this low accuracy seems to stem from different filtering conditions. Out of five samples that were collected by Nicolet, one (No. 18) had the same filtering conditions as the Reference dataset (0.5–62.5), while the other four samples were had more aggressive filtering (1.0–62.5 Hz) applied. In No. 18, the N3 sleep stages were correctly identified, while in the other samples (No. 14–17), most of the N3 stages were not identified, as shown in Figure 6c and Figure 7. Our results show that loss of frequency information that occurred at 0.5–1.0 Hz had a strong impact on the classification results. On the other hand, 6 out of 18 samples in the Clinical dataset had a lower upper band cutoff (35.0 Hz) than the Reference dataset (62.5 Hz). The cutoff is in gamma band, which is one of the features that we used to identify the Wake stage. Unlike samples with the delta cutoff, samples with the gamma cutoff did not show significantly lower accuracy compared to other samples. This was expected, as our classification methods were built around expert knowledge, in which the gamma activity was not as definitive for the Wake stage as the delta activity was for the N3 sleep stage. These results show that the effectiveness of our classification system against a given sample can be evaluated by information that is understandable to humans. This would allow clinical personnel to decide when to trust the classifier’s predictions and when human input is needed.
Despite some promising results, there are some limitations to the present study. In the Clinical dataset, only the Nicolet samples included PSG records where part of the delta band had been filtered. No delta-filtered samples were collected from the other systems, which leaves the question of whether the influence of delta-filtering is universal. Additionally, the PSG samples were collected from a relatively young population (20–40 years old). More samples are needed to determine the system’s effectiveness in samples from elderly people, as sleep EEG alters with aging.
5. Conclusions
In this study, we presented a pan-PSG sleep stage classification system that uses power spectra and entropy. The system was built around expert knowledge as it pertains to sleep stage classification. We found that the trained model to had high generality, as its performance was fairly consistent across the PSG records that were collected by different systems. We noticed that the model performed poorly on some of the samples, which was able to be explained by aggressive filtering in a particular frequency band. This indicates that our model’s performance against a given PSG record can be assessed. This leaves room for human intervention when low performance is expected. The proposed classification system has high potential for use as a semi-automatic mass sleep stage classification system, reducing labeling time while still leaving room for manual correction.
Supplementary Materials
The following are available online at https://0-www-mdpi-com.brum.beds.ac.uk/article/10.3390/pr9122265/s1, Table S1: Normalized Features Mean and Standard Deviation
Author Contributions
Conceptualization, L.-W.K. and C.-Y.H.; methodology, L.-W.K. and C.-H.S.; software, C.-H.S.; validation, L.-W.K., C.-Y.H., and C.-H.S.; resources, L.-W.K.; data curation, J.-C.J. and C.-H.S.; writing—original draft preparation, C.-H.S.; writing—review and editing, L.-W.K.; visualization, C.-H.S.; supervision, L.-W.K. and C.-Y.H.; project administration, L.-W.K.; funding acquisition, L.-W.K. and C.-Y.H. All authors have read and agreed to the published version of the manuscript.
Funding
This research was funded by Center for Intelligent Drug Systems and Smart Bio-Devices (IDS2B) from the Featured Areas Research Center Program within the framework Higher Education Sprout Project of Ministry of Education (MOE), Taiwan (grant No. 110W153, and 110W305); Ministry of Science and Technology (MOST), Taiwan (grant No. MOST 108-2221-E-009-045-MY3, and MOST 110-2321-B-A49-003); and Kaohsiung Medical University, Taiwan (grant No. NCTUKMU108-BIO-07).
Institutional Review Board Statement
The study was conducted according to the guidelines of the Declaration of Helsinki, and approved by Institutional Review Board of Kaohsiung Medical University Hospital, Kaohsiung City, Taiwan. (Approval Code: KMUHIRB-E(II)-20190371).
Informed Consent Statement
Informed consent was obtained from all subjects involved in the study.
Data Availability Statement
The data presented in this study are available upon request from the corresponding author. The data are not publicly available due to legal and privacy issues.
Conflicts of Interest
The authors declare no conflict of interest.
References
- Konjarski, M.; Murray, G.; Lee, V.V.; Jackson, M.L. Reciprocal relationships between daily sleep and mood: A systematic review of naturalistic prospective studies. Sleep Med. Rev. 2018, 42, 47–58. [Google Scholar] [CrossRef]
- Carno, M.-A.; Connolly, H.V. Sleep and sedation in the pediatric intensive care unit. Crit. Care Nurs. Clin. North. Am. 2005, 17, 239–244. [Google Scholar] [CrossRef]
- Spiegel, K.; Leproult, R.; L’hermite-Balériaux, M.; Copinschi, G.; Penev, P.D.; Van Cauter, E. Leptin levels are dependent on sleep duration: Relationships with sympathovagal balance, carbohydrate regulation, cortisol, and thyrotropin. J. Clin. Endocrinol. Metab. 2004, 89, 5762–5771. [Google Scholar] [CrossRef] [Green Version]
- Besedovsky, L.; Lange, T.; Haack, M. The sleep-immune crosstalk in health and disease. Physiol. Rev. 2019, 99, 1325–1380. [Google Scholar] [CrossRef] [PubMed] [Green Version]
- Zhang, J.; Xu, D.; Xie, B.; Zhang, Y.; Huang, H.; Liu, H.; Chen, H.; Sun, Y.; Shang, Y.; Hashimoto, K.; et al. Poor-sleep is associated with slow recovery from lymphopenia and an increased need for ICU care in hospitalized patients with COVID-19: A retrospective cohort study. Brain Behav. Immun. 2020, 88, 50–58. [Google Scholar] [CrossRef] [PubMed]
- Fonseca, P.; Long, X.; Radha, M.; Haakma, R.; Aarts, R.M.; Rolink, J. Sleep stage classification with ECG and respiratory effort. Physiol. Meas. 2015, 36, 2027–2040. [Google Scholar] [CrossRef] [PubMed] [Green Version]
- Radha, M.; Fonseca, P.; Moreau, A.; Ross, M.; Cerny, A.; Anderer, P.; Long, X.; Aarts, R.M. A deep transfer learning approach for wearable sleep stage classification with photoplethysmography. NPJ Digit. Med. 2021, 4, 135. [Google Scholar] [CrossRef]
- Casal, R.; Di Persia, L.E.; Schlotthauer, G. Sleep-wake stages classification using heart rate signals from pulse oximetry. Heliyon 2019, 5, e02529. [Google Scholar] [CrossRef] [PubMed]
- Kurihara, Y.; Watanabe, K. Sleep-stage decision algorithm by using heartbeat and body-movement signals. IEEE Trans. Syst. Man. Cybern. Part A Syst. Hum. 2012, 42, 1450–1459. [Google Scholar] [CrossRef]
- Khalighi, S.; Sousa, T.; Oliveira, D.; Pires, G.; Nunes, U. Efficient feature selection for sleep staging based on maximal overlap discrete wavelet transform and SVM. In Proceedings of the 2011 Annual International Conference of the IEEE Engineering in Medicine and Biology Society, Boston, MA, USA, 30 August–3 September 2011; pp. 3306–3309. [Google Scholar]
- Alickovic, E.; Subasi, A. Ensemble SVM Method for Automatic Sleep Stage Classification. IEEE Trans. Instrum. Meas. 2018, 67, 1258–1265. [Google Scholar] [CrossRef] [Green Version]
- Koley, B.; Dey, D. An ensemble system for automatic sleep stage classification using single channel EEG Signal. Comput. Biol. Med. 2012, 42, 1186–1195. [Google Scholar] [CrossRef]
- Klok, A.B.; Edin, J.; Cesari, M.; Olesen, A.N.; Jennum, P.; Sorensen, H.B.D. A new fully automated random-forest algorithm for sleep staging. In Proceedings of the 2018 40th Annual International Conference of the IEEE Engineering in Medicine and Biology Society (EMBC), Honolulu, HI, USA, 17–21 July 2018; pp. 4920–4923. [Google Scholar]
- Wu, H.; Talmon, R.; Lo, Y.-L. Assess sleep stage by modern signal processing techniques. IEEE Trans. Biomed. Eng. 2015, 62, 1159–1168. [Google Scholar] [CrossRef] [Green Version]
- Tsinalis, O.; Matthews, P.M.; Guo, Y.; Zafeiriou, S. Automatic sleep stage scoring with single-channel EEG using convolutional neural networks. arXiv 2016, arXiv:1610.01683. [Google Scholar]
- Phan, H.; Andreotti, F.; Cooray, N.; Chén, O.Y.; De Vos, M. Joint classification and prediction CNN framework for automatic sleep stage classification. IEEE Trans. Biomed. Eng. 2019, 66, 1285–1296. [Google Scholar] [CrossRef] [PubMed]
- Mousavi, S.; Afghah, F.; Acharya, U.R. SleepEEGNet: Automated sleep stage scoring with sequence to sequence deep learning approach. PLoS ONE 2019, 14, e0216456. [Google Scholar] [CrossRef] [PubMed] [Green Version]
- Supratak, A.; Dong, H.; Wu, C.; Guo, Y. DeepSleepNet: A model for automatic sleep stage scoring based on raw single-channel EEG. IEEE Trans. Neural Syst. Rehabil. Eng. 2017, 25, 1998–2008. [Google Scholar] [CrossRef] [Green Version]
- Zhang, L.; Chen, D.; Chen, P.; Li, W.; Li, X. Dual-CNN Based multi-modal sleep scoring with temporal correlation driven fine-tuning. Neurocomputing 2021, 420, 317–328. [Google Scholar] [CrossRef]
- Chambon, S.; Galtier, M.N.; Arnal, P.J.; Wainrib, G.; Gramfort, A. A deep learning architecture for temporal sleep stage classification using multivariate and multimodal time series. IEEE Trans. Neural Syst. Rehabil. Eng. 2018, 26, 758–769. [Google Scholar] [CrossRef] [Green Version]
- Yuan, Y.; Jia, K.; Ma, F.; Xun, G.; Wang, Y.; Su, L.; Zhang, A. A hybrid Self-attention deep learning framework for multivariate sleep stage classification. BMC Bioinform. 2019, 20, 586. [Google Scholar] [CrossRef] [PubMed] [Green Version]
- Tsinalis, O.; Matthews, P.M.; Guo, Y. Automatic sleep stage scoring using time-frequency analysis and stacked sparse autoencoders. Ann. Biomed. Eng. 2016, 44, 1587–1597. [Google Scholar] [CrossRef] [PubMed] [Green Version]
- Huang, C.-S.; Lin, C.-L.; Ko, L.-W.; Liu, S.-Y.; Su, T.-P.; Lin, C.-T. Knowledge-based identification of sleep stages based on two forehead electroencephalogram channels. Front. Neurosci. 2014, 8, 263. [Google Scholar] [CrossRef] [Green Version]
- Liang, S.-F.; Kuo, C.-E.; Hu, Y.-H.; Pan, Y.-H.; Wang, Y.-H. Automatic stage scoring of Single-channel sleep EEG by using multiscale entropy and autoregressive models. IEEE Trans. Instrum. Meas. 2012, 61, 1649–1657. [Google Scholar] [CrossRef]
- Boostani, R.; Karimzadeh, F.; Nami, M. A Comparative review on sleep stage classification methods in patients and healthy individuals. Comput. Methods Programs Biomed. 2017, 140, 77–91. [Google Scholar] [CrossRef]
- Rahman, M.M.; Bhuiyan, M.I.H.; Hassan, A.R. Sleep stage classification using single-channel EOG. Comput. Biol. Med. 2018, 102, 211–220. [Google Scholar] [CrossRef]
- Tripathy, R.K.; Ghosh, S.K.; Gajbhiye, P.; Acharya, U.R. Development of automated sleep stage classification system using multivariate projection-based fixed boundary empirical wavelet transform and entropy features extracted from multichannel EEG Signals. Entropy 2020, 22, 1141. [Google Scholar] [CrossRef]
- Pincus, S.M. Approximate entropy as a measure of system complexity. Proc. Natl. Acad. Sci. USA 1991, 88, 2297–2301. [Google Scholar] [CrossRef] [PubMed] [Green Version]
- Richman, J.S.; Moorman, J.R. Physiological time-series analysis using approximate entropy and sample entropy. Am. J. Physiol. Heart Circ. Physiol. 2000, 278, H2039–H2049. [Google Scholar] [CrossRef] [Green Version]
- Costa, M.; Goldberger, A.L.; Peng, C.-K. Multiscale entropy analysis of biological signals. Phys. Rev. E 2005, 71, 021906. [Google Scholar] [CrossRef] [PubMed] [Green Version]
- Lajnef, T.; Chaibi, S.; Ruby, P.; Aguera, P.-E.; Eichenlaub, J.-B.; Samet, M.; Kachouri, A.; Jerbi, K. Learning machines and sleeping brains: Automatic sleep stage classification using decision-tree multi-class support vector machines. J. Neurosci. Methods 2015, 250, 94–105. [Google Scholar] [CrossRef]
- Hassan, A.R.; Bhuiyan, M.I.H. A Decision support system for automatic sleep staging from EEG signals using tunable Q-factor wavelet transform and spectral features. J. Neurosci. Methods 2016, 271, 107–118. [Google Scholar] [CrossRef] [PubMed]
- Sharma, R.; Pachori, R.B.; Upadhyay, A. Automatic sleep stages classification based on iterative filtering of electroencephalogram signals. Neural. Comput. Applic. 2017, 28, 2959–2978. [Google Scholar] [CrossRef]
- Da Silveira, T.L.T.; Kozakevicius, A.J.; Rodrigues, C.R. Single-channel EEG sleep stage classification based on a streamlined set of statistical features in wavelet domain. Med. Biol. Eng. Comput. 2017, 55, 343–352. [Google Scholar] [CrossRef] [PubMed]
- Zhang, Z.; Wei, S.; Zhu, G.; Liu, F.; Li, Y.; Dong, X.; Liu, C.; Liu, F. Efficient sleep classification based on entropy features and a support vector machine classifier. Physiol. Meas. 2018, 39, 115005. [Google Scholar] [CrossRef] [PubMed]
Figure 1.
Experimental design for this study. (a) Experimental flowchart. The machine learning model is trained on a Reference dataset (n = 14) first. The train/test split of the Reference dataset was 7:3. After the model was trained, it was validated against a Clinical dataset (n = 17); (b) The PSG records were collected in a clinical environment from sleep labs of the Kaohsiung Medical University Hospital.

Figure 2.
Feature extraction and classification flowchart. For each 30 s EEG input, a signal entropy and a spectrogram were derived. The spectrogram was normalized to enhance the spectral pattern. A normalized spectrogram was then used to extract the power band values and the spectra entropy. Finally, all of the features were fed to a Gaussian SVM classifier for training.

Figure 3.
Classification results of the Reference dataset. (a) Confusion matrix of the training split (F3 channel). All classes except N1 showed accuracy above 0.75; (b) confusion matrix of testing split (F3 channel). The accuracies of each class were nearly identical to that of the training split; (c) confusion matrix of training split (F4 channel); (d) confusion matrix of testing split (F4 channel); (e) accuracy and Cohen’s Kappa for the old feature set (power features only) and for our current feature set (power + entropy features) in various classifiers.


Figure 4.
Classification results for the Clinical dataset. (a) Confusion matrix of the whole dataset split; (b) confusion matrix of Alice split; (c) confusion matrix of Grael split; (d) confusion matrix of Nicolet split.
Figure 4.
Classification results for the Clinical dataset. (a) Confusion matrix of the whole dataset split; (b) confusion matrix of Alice split; (c) confusion matrix of Grael split; (d) confusion matrix of Nicolet split.


Figure 5.
Distribution of extracted features from different PSG systems separated by sleep stages. Each feature value was normalized against itself so that all of the features could be depicted in the same plot. Most features showed a similar distribution across all three systems, although features related to the low delta and theta bands showed a slightly different distribution in the Nicolet dataset. Those from the Alice and Grael samples are mostly overlapped, while those from Nicolet are not. (a) Wake stage; (b) N1; (c) N2; (d) N3; (e) REM.


Figure 6.
Classification metrics of the clinical dataset (colored by PSG system). (a) Average metrics of different system groups. The Anova p value showed no significant different across different systems (p > 0.05); (b) accuracy of individual records. Some records showed exceptionally low accuracy compared to others (red arrow); (c) accuracy of each class/record. All of the records showing exceptional accuracy also have very low N3 accuracy.


Figure 7.
Hypnogram of subjects with or without loss of frequency information in the delta band. (a) Record lost information (No. 18). Most of the N3 stages are correctly identified; (b) record with lost information (No. 15). While most of the other stages were correctly identified, none of its N3 stages were identified.


Table 1.
Data collection conditions for the Clinical dataset.
| Record No. | Epoch Count | PSG System | Sample Rate (Hz) | Bandpass Lower Bound (Hz) | Bandpass Upper Bound (Hz) |
|---|---|---|---|---|---|
| No. 1 | 498 | Alice | 200 | None | None |
| No. 2 | 646 | Alice | 200 | None | None |
| No. 3 | 972 | Alice | 200 | None | None |
| No. 4 | 358 | Alice | 200 | None | None |
| No. 5 | 640 | Alice | 200 | None | None |
| No. 6 | 1114 | Alice | 200 | None | None |
| No. 7 | 1033 | Grael | 1024 | 0.3 | 35.0 |
| No. 8 | 340 | Grael | 1024 | 0.5 | 62.5 |
| No. 9 | 596 | Grael | 1024 | 0.3 | 35.0 |
| No. 10 | 897 | Grael | 1024 | 0.3 | 35.0 |
| No. 11 | 874 | Grael | 1024 | 0.3 | 35.0 |
| No. 12 | 589 | Grael | 1024 | 0.3 | 35.0 |
| No. 13 | 624 | Grael | 1024 | 0.3 | 35.0 |
| No. 14 | 1094 | Nicolet | 125 | 1.0 | 62.5 |
| No. 15 | 742 | Nicolet | 125 | 1.0 | 62.5 |
| No. 16 | 797 | Nicolet | 125 | 1.0 | 62.5 |
| No. 17 | 1334 | Nicolet | 125 | 1.0 | 62.5 |
| No. 18 | 748 | Nicolet | 125 | 0.5 | 62.5 |
Table 2.
Numbers of different sleep stages in Reference dataset and Clinical dataset.
| W | N1 | N2 | N3 | REM | Total | |
|---|---|---|---|---|---|---|
| Reference dataset | 1527 | 1805 | 5613 | 1677 | 1958 | 12,580 |
| Clinical dataset | 1684 | 785 | 6418 | 2419 | 2590 | 13,896 |
Table 3.
Classification result of each class in the Reference dataset.
| Precision | Recall | F1 Score | Support | ||
|---|---|---|---|---|---|
| Train | Wake | 0.87 | 0.82 | 0.85 | 1068 |
| N1 | 0.66 | 0.50 | 0.57 | 1197 | |
| N2 | 0.85 | 0.88 | 0.86 | 3741 | |
| N3 | 0.82 | 0.78 | 0.80 | 1115 | |
| REM | 0.72 | 0.86 | 0.78 | 1307 | |
| Test | Wake | 0.85 | 0.81 | 0.83 | 491 |
| N1 | 0.63 | 0.50 | 0.56 | 603 | |
| N2 | 0.86 | 0.87 | 0.86 | 1852 | |
| N3 | 0.82 | 0.79 | 0.81 | 554 | |
| REM | 0.70 | 0.84 | 0.76 | 651 |
Table 4.
Classification results of previous methods (power feature only) and of the new method (power feature + entropy feature).
Table 4.
Classification results of previous methods (power feature only) and of the new method (power feature + entropy feature).
| Accuracy | Cohen’s Kappa | ||
|---|---|---|---|
| Previous method (power feature only) | KNN | 0.74 | 0.64 |
| SVM (Linear) | 0.76 | 0.66 | |
| SVM (Gaussian) | 0.77 | 0.68 | |
| Random Forest | 0.78 | 0.69 | |
| Current method (power feature + entropy feature) | KNN | 0.78 | 0.69 |
| SVM (Linear) | 0.78 | 0.69 | |
| SVM (Gaussian) | 0.79 | 0.71 | |
| Random Forest | 0.80 | 0.71 |
Table 5.
Classification metrics of different groups in Reference dataset.
| Precision | Recall | F1 Score | |
|---|---|---|---|
| Alice (n = 6) | 0.81 ± 0.04 | 0.77 ± 0.07 | 0.78 ± 0.07 |
| Grael (n = 7) | 0.84 ± 0.03 | 0.82 ± 0.05 | 0.82 ± 0.04 |
| Nicolet (n = 5) | 0.68 ± 0.12 | 0.69 ± 0.10 | 0.66 ± 0.12 |
| Anova p value | 0.06 | 0.09 | 0.07 |
Publisher’s Note: MDPI stays neutral with regard to jurisdictional claims in published maps and institutional affiliations. |
© 2021 by the authors. Licensee MDPI, Basel, Switzerland. This article is an open access article distributed under the terms and conditions of the Creative Commons Attribution (CC BY) license (https://creativecommons.org/licenses/by/4.0/).
Share and Cite
MDPI and ACS Style
Su, C.-H.; Ko, L.-W.; Juang, J.-C.; Hsu, C.-Y. Hybrid Sleep Stage Classification for Clinical Practices across Different Polysomnography Systems Using Frontal EEG. Processes 2021, 9, 2265. https://0-doi-org.brum.beds.ac.uk/10.3390/pr9122265
AMA Style
Su C-H, Ko L-W, Juang J-C, Hsu C-Y. Hybrid Sleep Stage Classification for Clinical Practices across Different Polysomnography Systems Using Frontal EEG. Processes. 2021; 9(12):2265. https://0-doi-org.brum.beds.ac.uk/10.3390/pr9122265
Chicago/Turabian StyleSu, Cheng-Hua, Li-Wei Ko, Jia-Chi Juang, and Chung-Yao Hsu. 2021. "Hybrid Sleep Stage Classification for Clinical Practices across Different Polysomnography Systems Using Frontal EEG" Processes 9, no. 12: 2265. https://0-doi-org.brum.beds.ac.uk/10.3390/pr9122265
Note that from the first issue of 2016, this journal uses article numbers instead of page numbers. See further details here.