
Slurry-Phase Carbonation Reaction Characteristics of AOD Stainless Steel Slag

School of Metallurgy and Energy, North China University of Science and Technology, Tangshan 063009, China
*
Authors to whom correspondence should be addressed.
Processes 2021, 9(12), 2266; https://0-doi-org.brum.beds.ac.uk/10.3390/pr9122266
Submission received: 5 November 2021
/
Revised: 8 December 2021
/
Accepted: 15 December 2021
/
Published: 16 December 2021
(This article belongs to the Special Issue Biochemical Processes for Sustainability)
Abstract
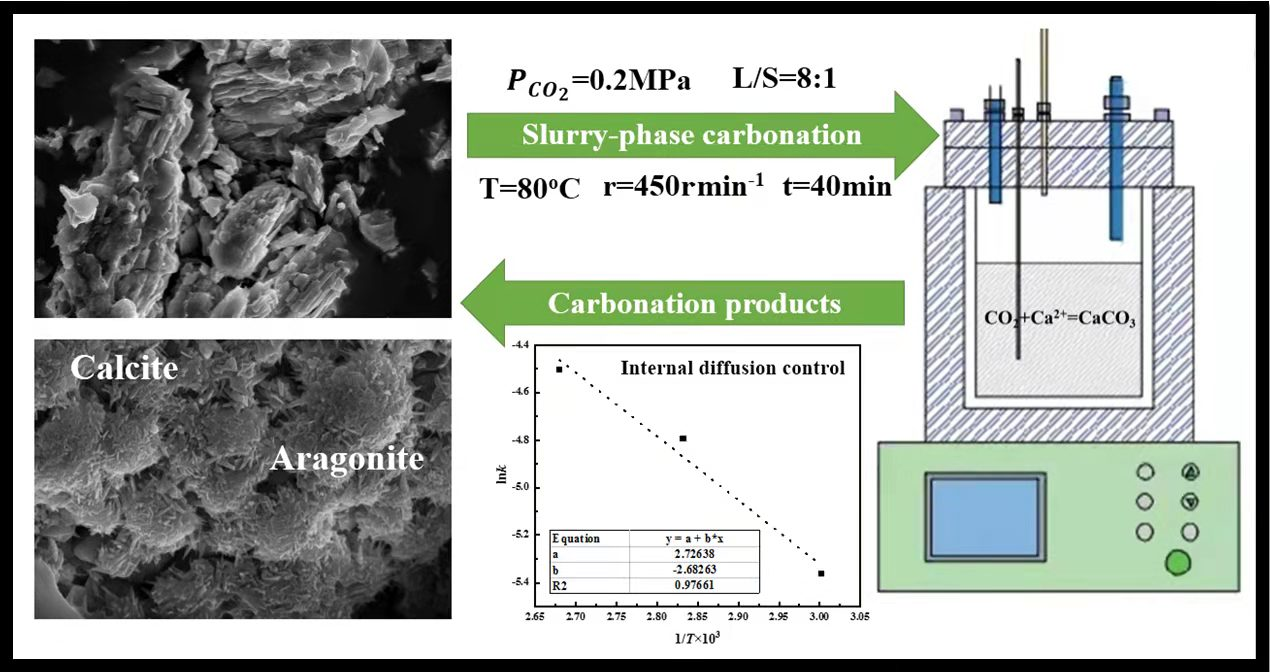
:Argon oxygen decarburization stainless steel slag (AOD slag) has high mineral carbonation activity. AOD slag carbonation has both the resource utilization of metallurgical waste slag and the carbon reduction effect of CO2 storage. This paper aimed to study carbonation reaction characteristics of AOD slag. Under the slurry-phase accelerated carbonation route, the effect of stirring speed (r) and reaction temperature (T) on AOD slag’s carbonation was studied by controlling the reaction conditions. Mineral composition analysis and microscopic morphology analysis were used to explore the mineral phase evolution of AOD slag during the carbonation process. Based on the unreacted core model, the kinetic model of the carbonation reaction of AOD slag was analyzed. The results showed that the carbonation ratio of AOD slag reached its maximum value of 66.7% under the reaction conditions of a liquid to solid ratio (L/S) of 8:1, a CO2 partial pressure of 0.2 MPa, a stirring speed of 450 r·min−1, and a reaction temperature of 80 °C. The carbonation reaction of AOD slag was controlled by internal diffusion, and the calculated apparent activation energy was 22.28 kJ/mol.

1. Introduction
AOD slag is a by-product of the secondary refining process of stainless steel using argon-oxygen decarburization process. After natural cooling, AOD slag generally exists as a fine powder with a light gray color, its main chemical components include CaO, SiO2, and MgO, with mass fractions of 57.72%, 31.69%, and 6.68% [1], and the main mineral phases are calcite (CaCO3), dicalcium silicate (Ca2SiO4), pyroxene (CaMg(SiO3)2), with mass fractions of 41.0%, 40.4% and 14.2% [2]. As of 2020, the global stainless steel output has reached 50.89 million tons. According to the estimation of 1 ton of stainless steel slag associated with every 3 tons of stainless steel [3], the global stainless steel slag output in 2020 will be approximately 16.96 million tons. AOD slag contains heavy metal elements such as Cr, Pb, Ni, etc. Ref. [4] shows that improper disposal will cause the waste of rare heavy metal resources such as Cr, Pb, and Ni, etc. As the output abandoned AOD slag increases year by year, most of its disposal methods are stacking and landfilling, causing environmental pollution and land waste [5,6]. Therefore, how to effectively treat and use AOD slag has become a hot spot for domestic and foreign attention and research.
Yadav [7,8], Ghouleh [9], and Santos [10] found that AOD slag is rich in calcium and magnesium resources, and has the potential of natural silicate minerals for carbon fixation. The use of AOD slag for mineral carbon fixation is beneficial to alleviate its storage pressure and reduce the cost of mineral carbonation. Based on the research on the carbonation of AOD slag and the utilization of CO2, it is concluded that the process paths are mainly direct dry carbonation, direct wet carbonation, and indirect carbonation [11]. Direct dry carbonation is a gas-solid carbonation reaction, in which CO2 gas directly reacts with mineralized raw materials in one step to generate corresponding metal carbonates. Direct wet carbonation involves first dissolving CO2 in water to form a carbonic acid solution, and then reacting bicarbonate ions/carbonate ions in the solution with calcium ions/magnesium ions dissolved in mineral raw materials to form carbonate precipitates. In this way, the utilization of CO2 mineralization is realized. Compared with the direct dry carbonation method, the reaction rate and carbonation efficiency of the direct wet carbonation method of CO2 is relatively higher, and the process method is relatively simple, generally by increasing the reaction temperature, stirring rate, CO2 partial pressure, etc. The reaction conditions can achieve the effect of increasing the rate of carbon fixation, making it easier to industrialize. Chang et al. [12] used direct wet carbonation and found that the water-phase carbonation of refined converter slag in a slurry reactor is feasible, with a high mass transfer rate, and can achieve CO2 storage. Salman et al. [13] and Baciocchi et al. [14,15] also systematically studied the product leaching and reaction mechanism of steel slag carbonation and investigated the different degrees of steel slag carbonation to prove the possibility of CO2 sequestration through steel slag carbonation. Huijgen et al. [16,17] proposed that the CaCO3 and calcium-depleted silicate area generated on the surface of the steel slag during the direct wet carbonation reaction would hinder the diffusion of calcium ions, thereby reducing the carbonation reaction rate of the steel slag. At present, there are few studies on the application of AOD slag after carbonation, and the carbonation efficiency is mainly explored through CO2 partial pressure and reaction temperature, its reaction conditions are not easy to control, which increases energy consumption.
Based on these findings, this paper conducted a slurry-phase method to accelerate carbonation in the optimal range of the AOD slag carbonation thermodynamics, and systematically studied the reaction conditions such as stirring speed, reaction temperature, and reaction time under the direct wet accelerated carbonation process for the carbonation of the AOD slag, to find the optimal conditions for improving the carbonation efficiency of the AOD slag. Through the study of AOD slag carbonation reaction kinetics, the corresponding kinetic model parameters were obtained, which provided experimental data and a theoretical basis for process simulation and engineering amplification.
2. Materials and Methods
2.1. The Original AOD Slag
The original AOD slag was collected from the refining workshop of a stainless steel manufacturer in China. Because the AOD slag was powdery and had a fine particle size, it can be sieved directly with a 200-mesh standard sieve (<74 μm) to remove agglomerates and inclusions. The AOD slag obtained by sieving was placed in a drying box and dried continuously at 105 °C for 6 h to remove the moisture in the AOD slag. Finally, the obtained AOD slag sample was placed in a desiccator and stored for later use.
2.1.1. Chemical Composition of AOD Slag
An X-ray fluorescence spectrometer (XRF) was used to analyze the chemical composition of the AOD slag, and the results were output in the form of oxides, as shown in Table 1. The main oxides in AOD slag included CaO, SiO2, MgO, TiO2, and Al2O3, with mass fractions of 65%, 23.93%, 6.36%, 1.20%, and 1.94%, respectively, and the mass fraction of calcium and magnesium components in the AOD slag sample used was as high as 71.36%. The trace oxides in the AOD slag included Cr2O3, P2O5, MnO, and FeO, among which the mass fraction of Cr2O3 was 0.31%.
2.1.2. Mineral Composition of AOD Slag
An X-ray diffractometer (XRD) was used to scan at a voltage/current of 40 mA/45 kV at a rate of 5·2θ·min−1, and X-ray diffraction data of the AOD slag in the range of 10°–90° was collected. XRD analysis software such as JADE 9.0 and ICDD powder diffraction database (PDF-2009) was used for qualitative and semi-quantitative analysis of the X-ray diffraction data.
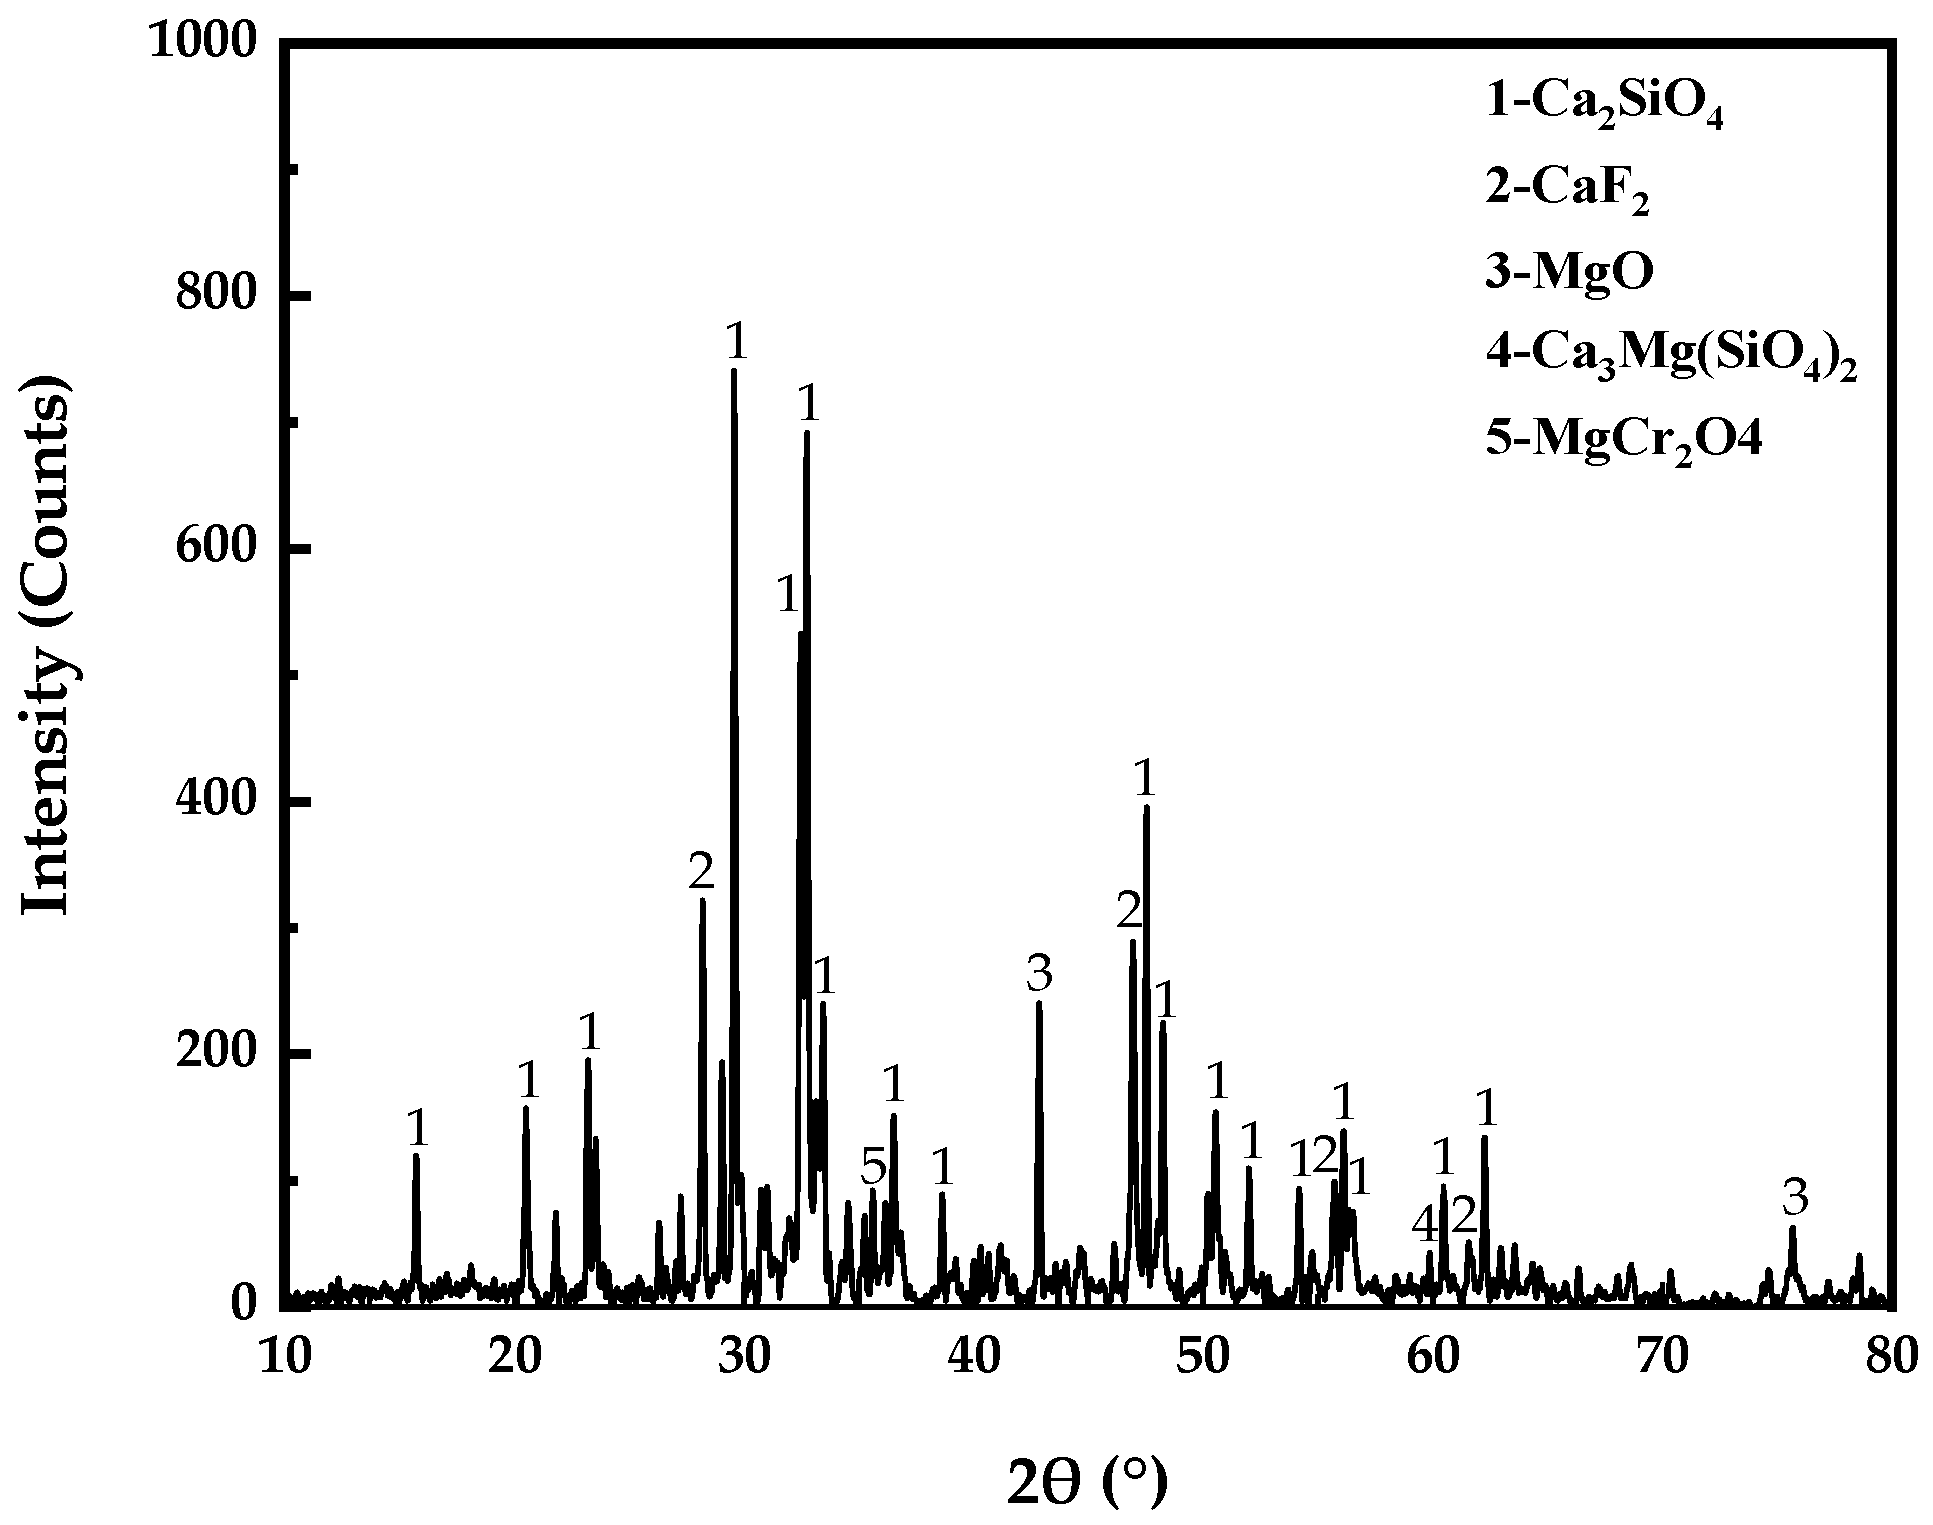
The mineral phase composition of AOD slag was shown in Figure 1. In Figure 1, the ore phases of AOD slag were mainly dicalcium silicate (Ca2SiO4), fluorite (CaF2), periclase (MgO), merwinite (Ca3Mg(SiO4)2), and magnesiochromite (MgCr2O4). The semi-quantitative analysis results of AOD slag ore phase composition are shown in Table 2. In Table 2, the main mineral phase of AOD slag was dicalcium silicate (Ca2SiO4), which accounted for about 70–80% of the total mass of the crystalline phase; Fluorite (CaF2) and periclase (MgO) were secondary mineral phases, accounting for about 12.8% and 9.8% of the total mass of the crystalline phase, merwinite (Ca3Mg(SiO4)2) and magnesiochromite (MgCr2O4) belonged to the trace mineral phase.
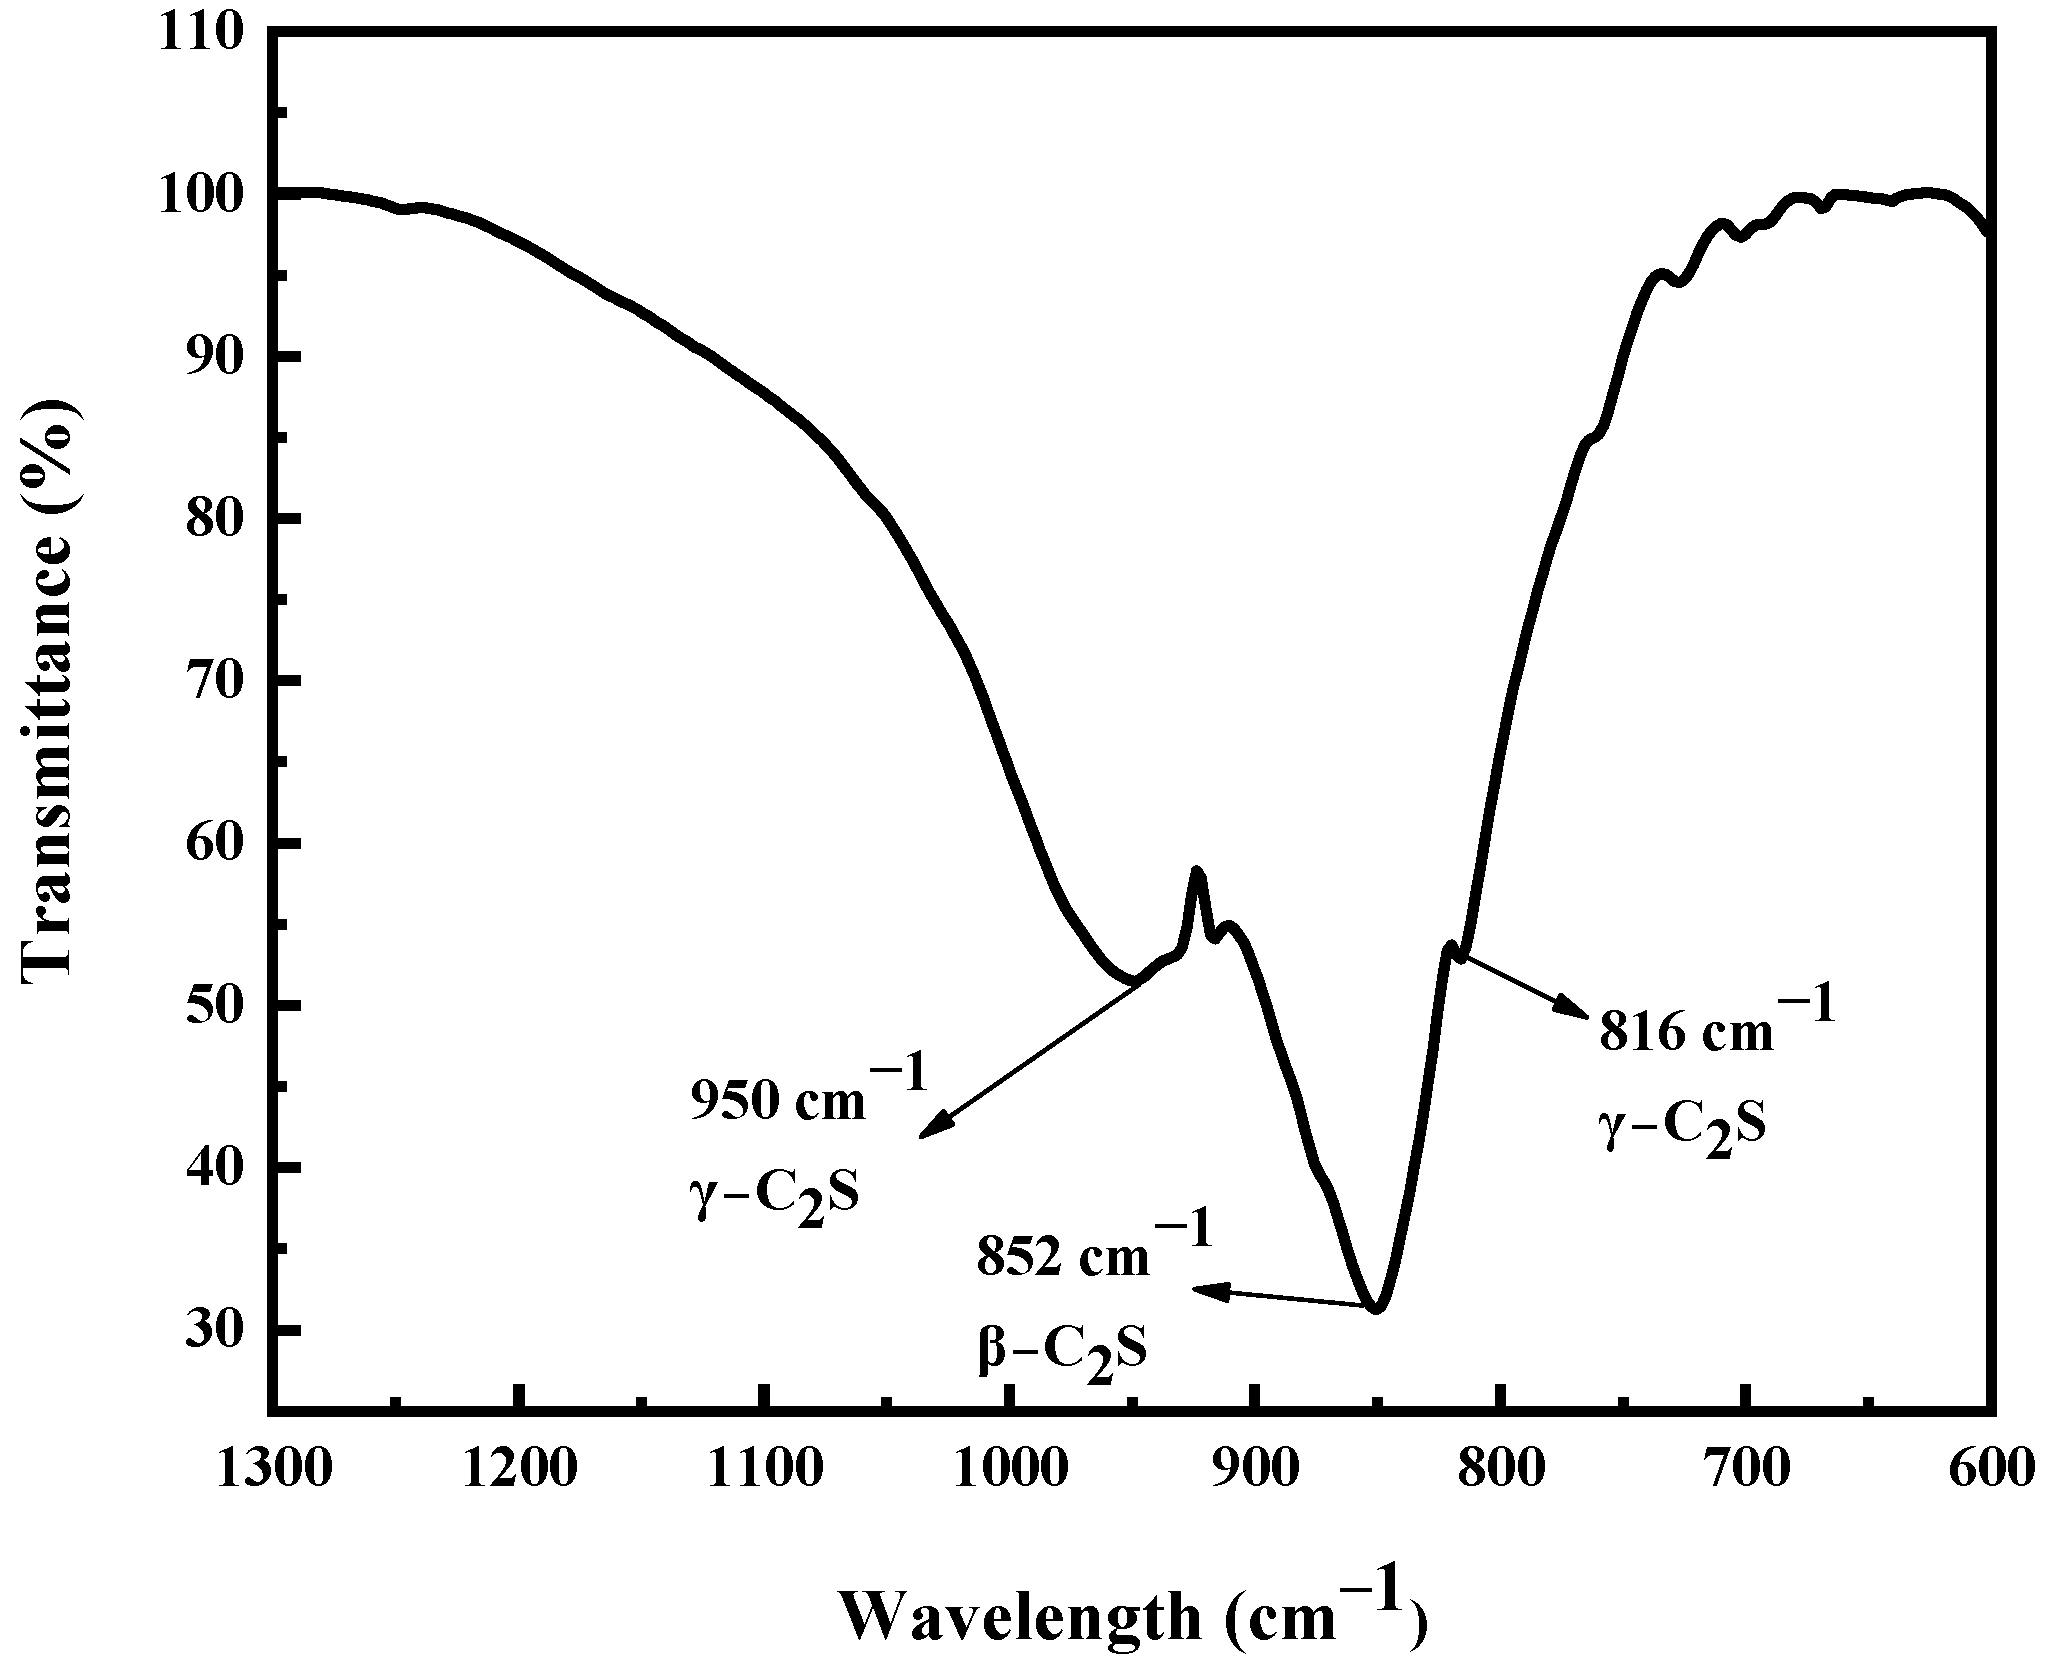
Fourier transform infrared spectrometer (FTIR) was used to detect the AOD slag, and the above XRD analysis was supplemented and verified. The FTIR spectrum was shown in Figure 2. The peaks in the region of 750–1200 cm−1 mainly correspond to the asymmetric and symmetric tensile vibrations of the Si-O bond, and three absorption peaks of the infrared vibration frequency were observed in this region, corresponding to 816 cm−1, 852 cm−1, and 950 cm−1, respectively, the three absorption peaks correspond to γ-C2S, β-C2S, and γ-C2S, respectively [18]. It can be seen that the mineral phases in AOD slag mainly included γ-C2S, β-C2S, CaF2, MgO, Ca3Mg(SiO4)2, and MgCr2O4. According to the analysis results of the chemical composition and mineral phase composition of the AOD slag, the mineral phases containing Ca and Mg in the AOD slag were mainly dicalcium silicate (Ca2SiO4) and periclase (MgO), and the reaction systems involved were Ca2SiO4-CO2, MgO-CO2.
Thermodynamics can be used to analyze the carbonation thermodynamics of Ca and Mg mineral phases in the AOD slag and provide theoretical guidance for the setting of AOD slag carbonation reaction parameters. The Reaction Equations module of HSC Chemistry 6.0 thermodynamic software was used to calculate the standard Gibbs free energy (ΔrGθ) of the carbonation reaction that may occur in the most stable phase in the AOD slag under standard conditions. The mass dimension was mol, the temperature dimension was °C, the temperature range was 0–100 °C, and the step size was 25 °C. The calculated ΔrGθ was linearly fitted with temperature (T) as the independent variable, and the results were shown in Table 3. In Table 3, the ΔrGθ of Ca2SiO4, MgO, and ƒ-CaO mineral phase carbonation reactions in the AOD slag were all less than 0, indicating that the three mineral phases can spontaneously undergo carbonation reaction, which was consistent with the AOD slag mineral phase composition analysis results.
2.2. Carbonation Experiment of AOD Slag
2.2.1. Slurry-Phase Accelerated Carbonation
Based on the analysis of AOD slag mineral phase composition and carbonation thermodynamics, a slurry-phase accelerated carbonation method was designed within the optimal range of AOD slag carbonation thermodynamics. The slurry-phase accelerated carbonation process mainly used the direct wet carbonation process which requires a larger liquid to solid ratio (L/S > 2). This process used a high temperature/pressure reactor, its equipment schematic was shown in Figure 3. The carbonation reaction was carried out in a high-pressure reactor with stirring, and the whole process was tightly sealed. The pipes in the polytetrafluoroethylene (PTFE) reaction barrel were connected with a temperature heat transfer device, a CO2 gas circulation device, and a cooling cycle device.
2.2.2. Carbonation Process
The slurry-phase carbonation experiment was set under the condition of a liquid to solid ratio of 8:1. We weighed 20 g of AOD slag and 160 mL of deionized water, poured them into a PTFE reaction barrel to prepare a concentrated agent with a liquid to solid ratio of 8:1, and put them into a PTFE reaction barrel after adding in the autoclave, and closed the quick opening flange to seal the autoclave. Then the reaction conditions were created by varying the reaction temperature and stirring speed. When the conditions were fulfilled, high-purity CO2 gas can be introduced to carry out the carbonation reaction, and the reaction conditions must be kept constant during the experiment. When the reaction time was reached, the stirring was turned off and CO2 was stopped, the pressure of the reactor was relieved, and the carbonated AOD slag-deionized water mixed slurry was taken out. After standing, the slurry was dried at 105 °C for 15 h to analyze the AOD slag carbon, to analyze the difference in the quality of the AOD slag carbon and its carbonation ratio, and to further characterize the product.
2.3. Thermogravimetric Experiment
The TG-DTG thermogravimetric analysis method was used to analyze the carbonation rate of carbonated AOD slag. Due to the hydroxide, moisture, and carbonate in the carbonated AOD slag decomposing within a certain temperature range and causing CO2 to escape, the carbonation rate of the AOD slag was calculated based on the mass loss of this part. Among them, the TG curve referred to the relationship curve between the quality and temperature of the measured slag sample under the temperature control of the equipment, and the DTG curve referred to the curve obtained by the first-order derivative of the TG curve to temperature (or time).
According to TG-DTG data, the carbonation ratio of the AOD slag was calculated according to Equations (1)–(3).
where denotes the mass of CO2 stored in the EAF slag after carbonation, (g); denotes the amount of CaO involved in the carbonation reaction, (g); denotes the molar mass of CaO, (g/mol); denotes the molar mass of CO2, (g/mol); denotes the carbonation ratio of the AOD slag, (%); denotes the mass of the AOD slag, (g); denotes the mass fraction of CaO in the AOD slag.
2.4. Microscopic Morphology Analysis
A focused ion beam field emission scanning electron microscope (Scios) was used to observe the microscopic morphology of the AOD slag. The observation method was as follows: the AOD slag sample was fixed on the sample stage with conductive glue, the surface of the slag sample was sprayed with CO2 gas to ensure that the slag powder was evenly distributed, the surface of the slag sample was sprayed with ion sputtering and placed on the stage, and then closed when the door was evacuated until the air pressure was less than 9 × 10⁻³ Pa. We then focused on the sample and started the SEM inspection, moved the sample to find and saved the SEM photo of the required typical area.
An X-ray energy spectrometer (EDS) was used to analyze the element types and contents in specific micro-regions of AOD slag particles. The observation method was as follows: the CCD window of the electron microscope was frozen and the detector inserted into the sample chamber. The SEM photos of the typical area were then uploaded to the EDAX computer, and the sample points for energy spectrum detection were selected, and the measured data were saved.
3. Results and Discussion
3.1. Effect of Stirring Speed on the Carbonation of AOD Slag
The stirring speed was a key factor in the process of the slurry-phase carbonation. To study the effect of stirring speed on the carbonation of AOD slag, under the conditions of a liquid-solid ratio of 8:1, a CO2 partial pressure of 0.2 MPa, and a reaction temperature of 80 °C, a series of carbonation experiments were conducted.
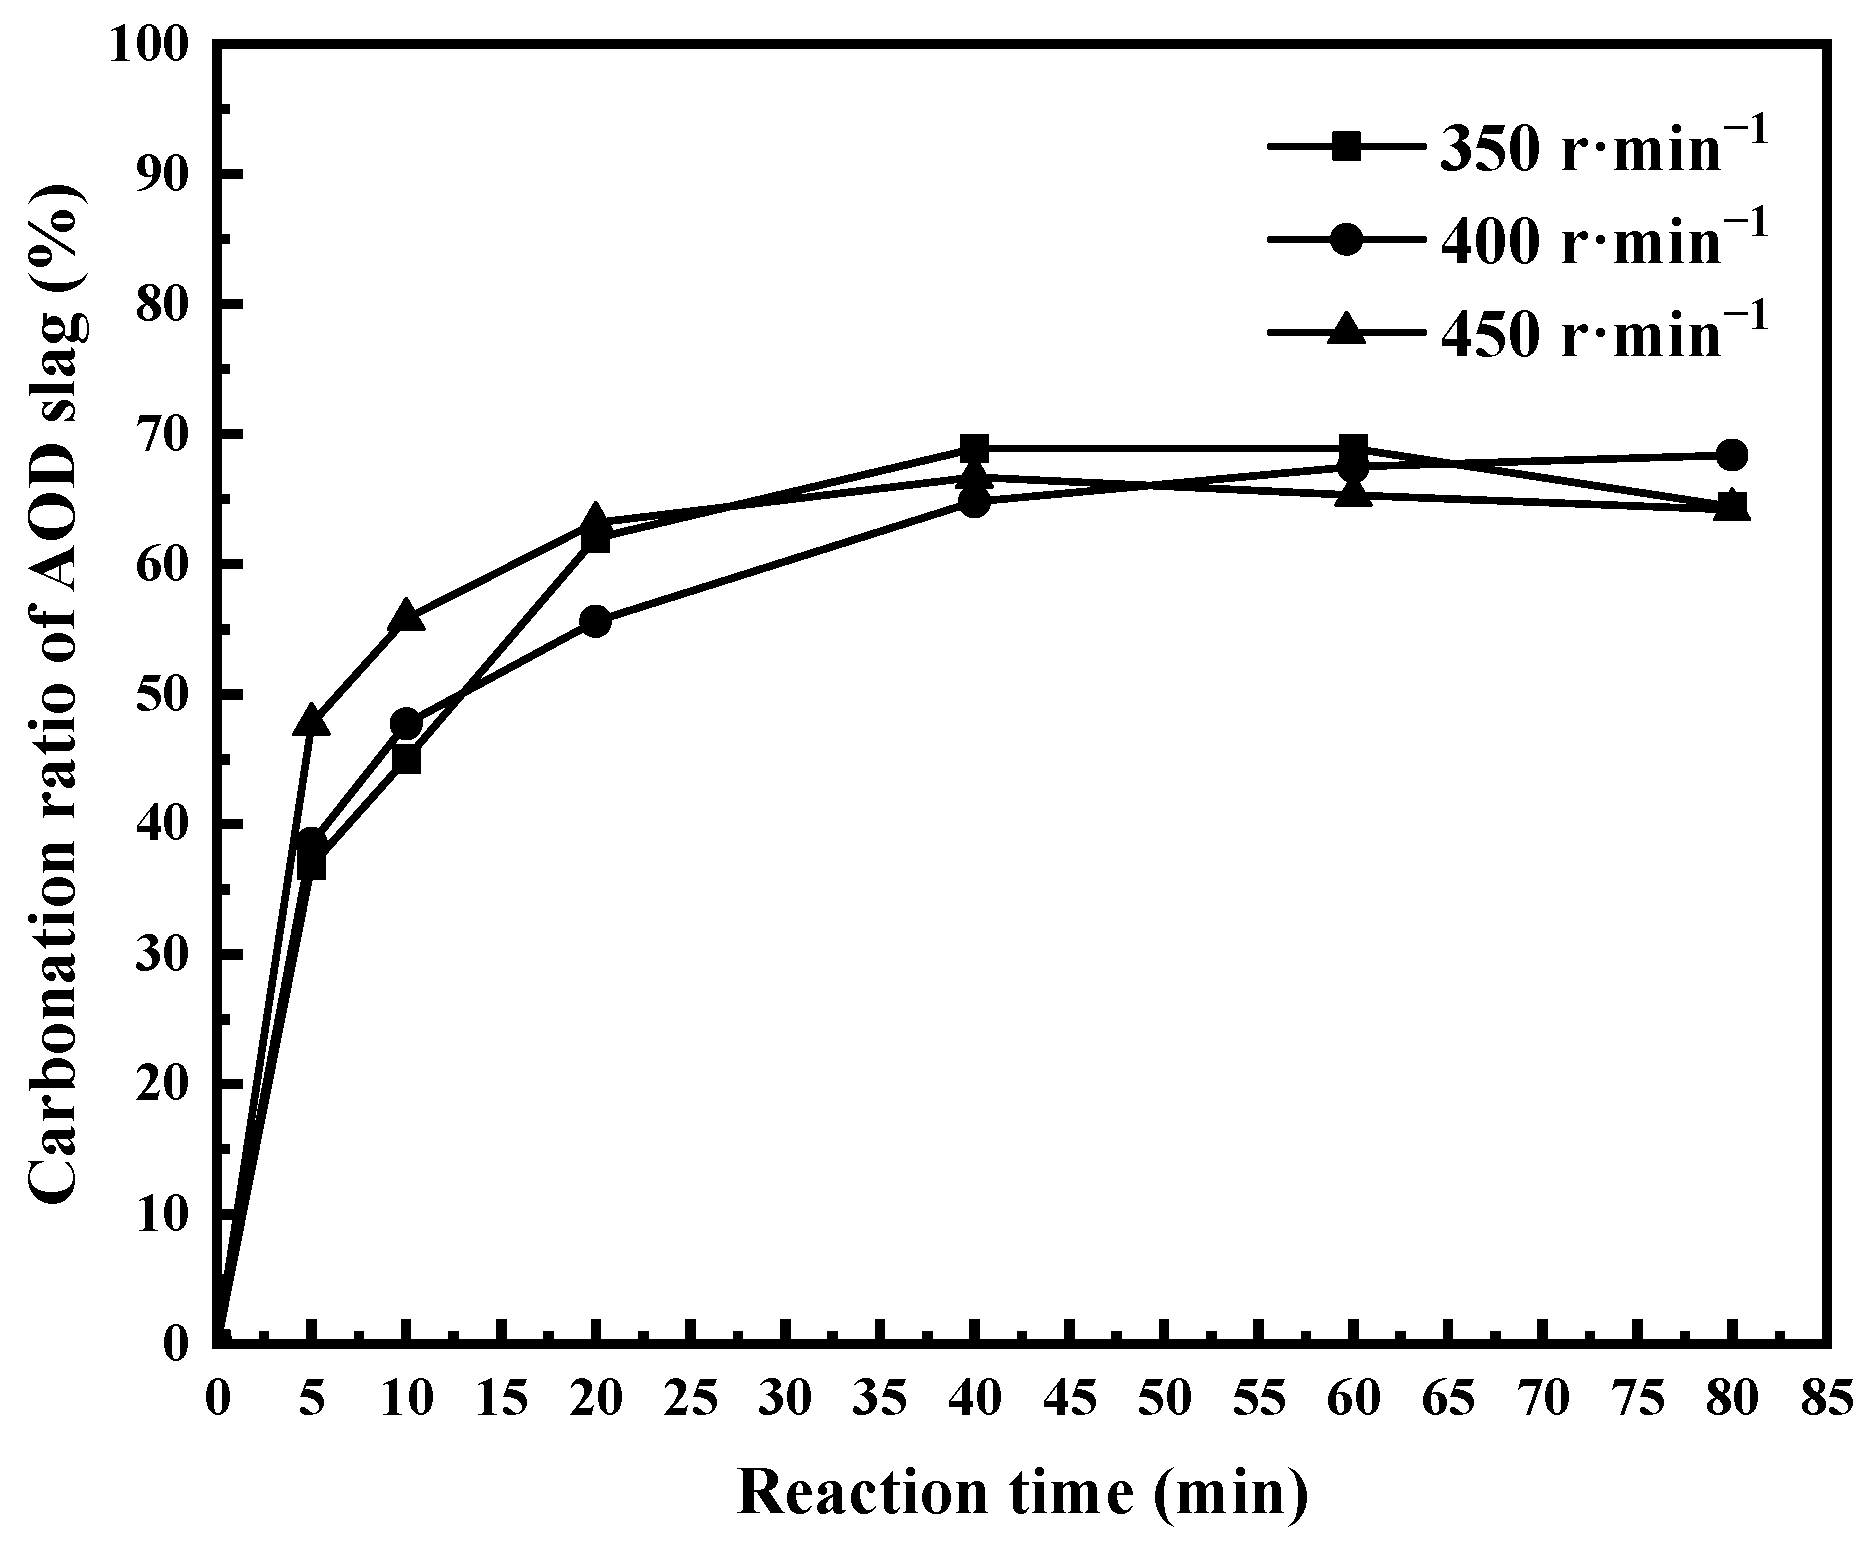
Figure 4 shows the evolution of AOD slag’s carbonation ratio overreaction time under different stirring speeds. The AOD slag’s carbonation ratio increased to 45–57% rapidly in the initial carbonation reaction stage (0–10 min). In the middle and late stages of the carbonation reaction (20–80 min), the AOD slag’s carbonation ratio only gained limited growth and reached its maximum value of 60–65% in 40 min. The effect of stirring speed on the carbonation of AOD slag was mainly reflected in the initial stage of the carbonation reaction, within 0–10 min, as the stirring speed increased, the AOD slag’s carbonation ratio gradually increased. Compared with the carbonation system with a stirring speed of 350 r·min−1, the carbonation ratio of the AOD slag under 450 r·min−1 stirring speed increased by nearly 52.3%. In the latter stage of the carbonation reaction, when the carbonation reaction reached equilibrium, the effect of stirring speed on the carbonation ratio was eliminated, and the maximum carbonation ratio of the AOD slag under the three stirring speeds was 60–65%.
The effect of stirring speed on the carbonation of AOD slag was mainly reflected in the initial stage of the reaction. During this period, the AOD slag hydration reaction and the carbonation reaction coexisted in the slurry-phase system, and the stirring effect increased the contact area of the reactive mineral phases with water and CO2, thereby accelerating the reaction rate. When the various reactions in the suspension system reached equilibrium, the difference in the mass transfer effect caused by the stirring disappears, which showed that the maximum carbonation ratio of the AOD slag was almost the same under various stirring speed conditions. Therefore, it can be concluded that for AOD slag, stirring can speed up the initial carbonation reaction, but cannot change its long-term carbonation potential.
3.2. The Effect of Reaction Temperature on Carbonation of AOD Slag
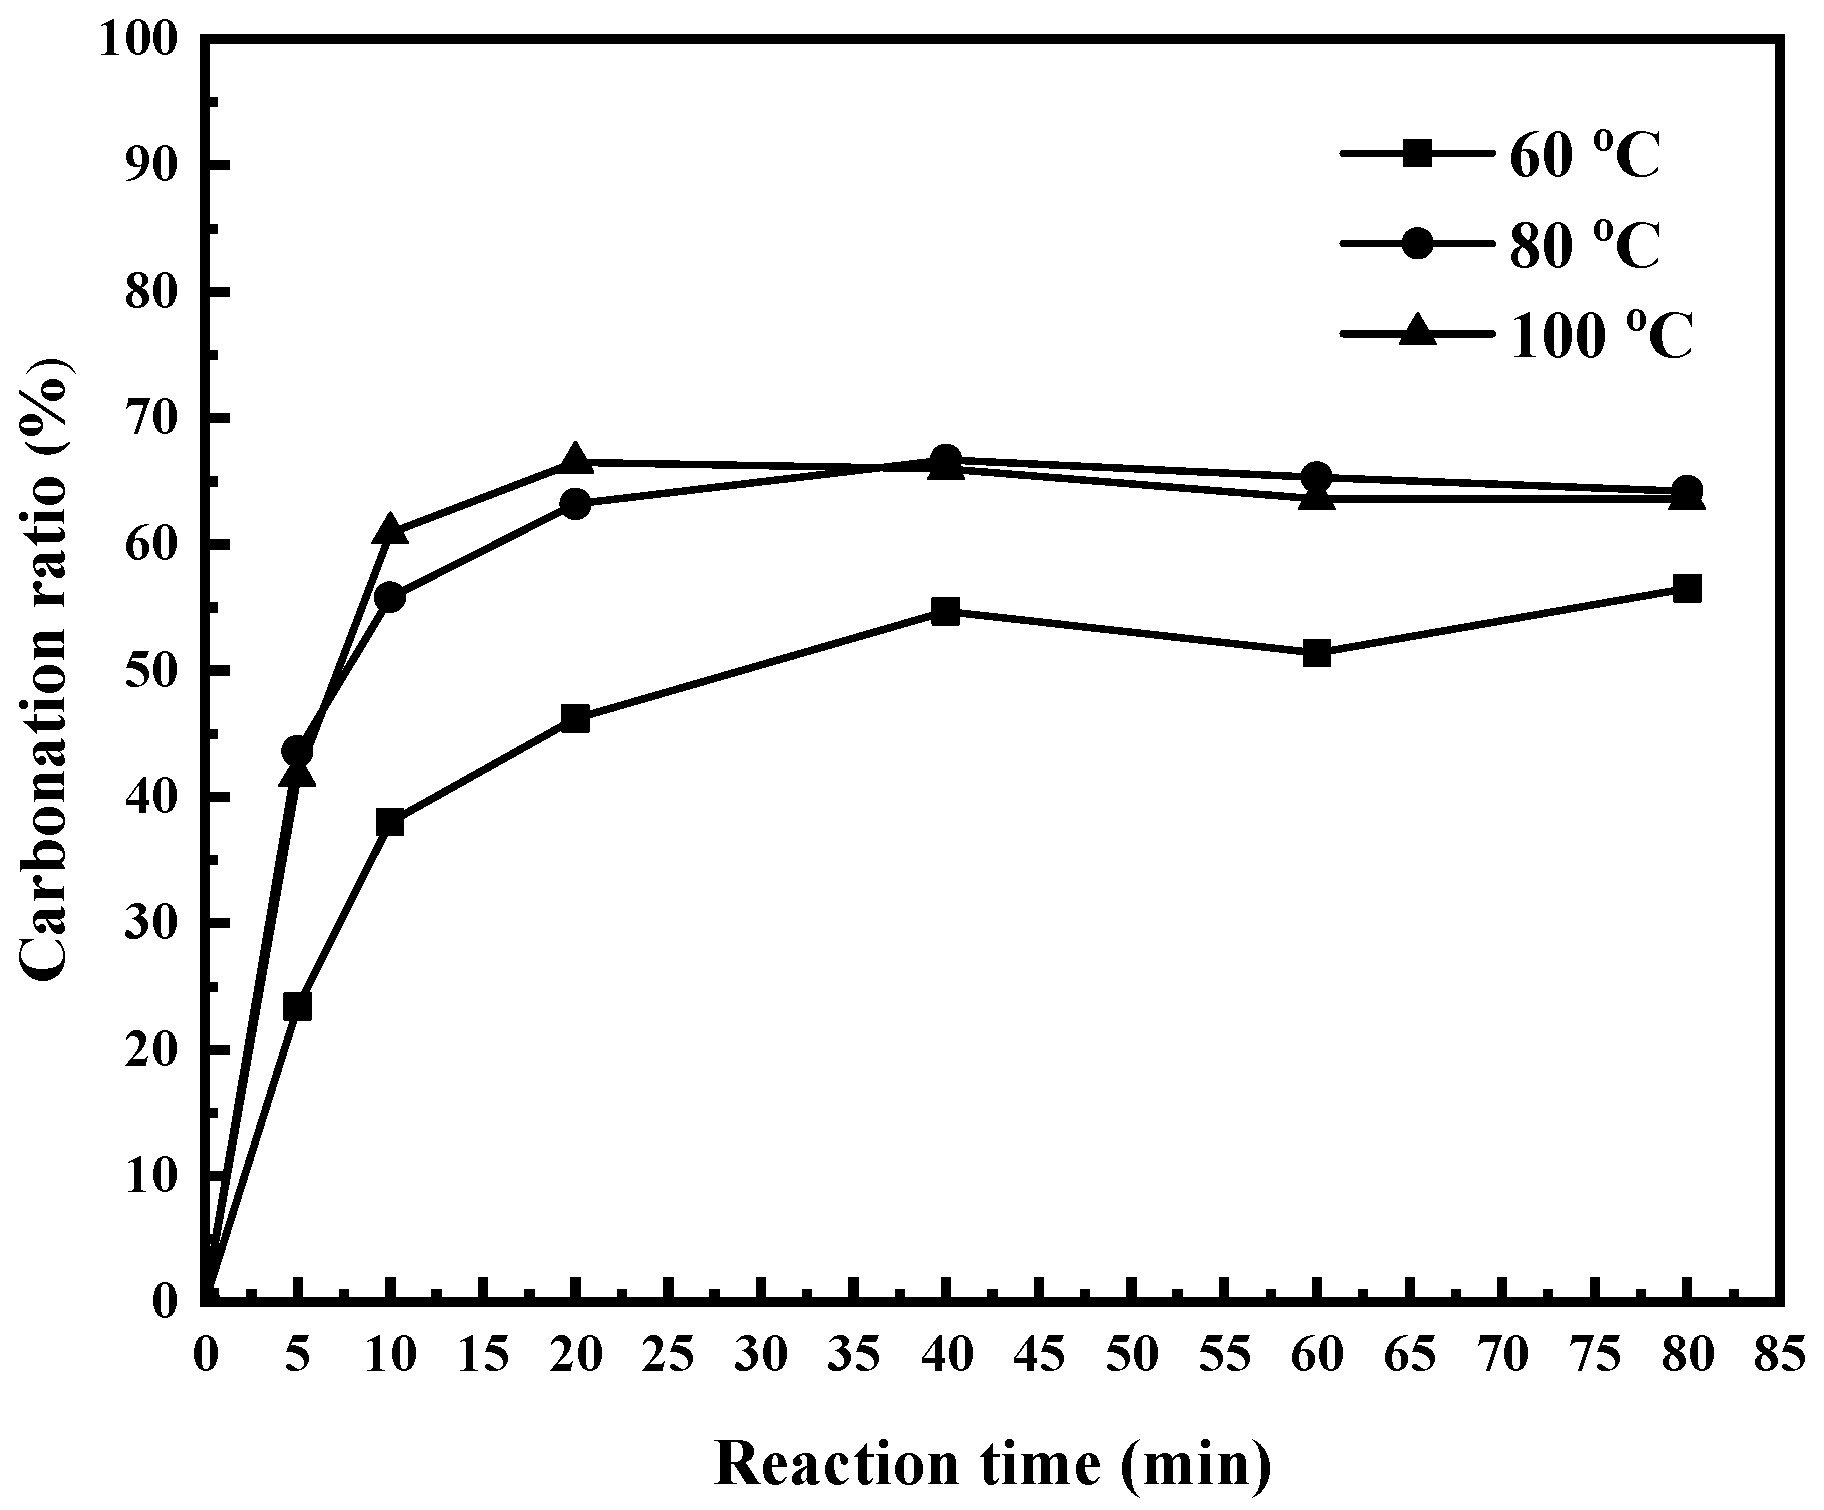
To study the effect of reaction temperature on the carbonation of AOD slag, under the conditions of a liquid to solid ratio of 8:1, a CO2 partial pressure of 0.2 MPa, and a stirring speed of 450 r·min−1, a series of carbonation experiments were carried out.
Figure 5 shows the evolution of AOD slag’s carbonation ratio overreaction time under different reaction temperatures. After 5 min of reaction, the carbonization ratio of the AOD slag under the 60 °C reaction system was 23.4%, and the carbonization ratio under the 80–100 °C reaction system was in the range of 42–43%. As the reaction time increased, the carbonation ratio of the AOD slag gradually increased. Under the 80–100 °C carbonation system, the carbonation ratio of the AOD slag could reach its maximum value of 66–67% when reaction time reached 20 min. But under the 60 °C carbonation system, the carbonation ratio of the AOD slag could not reach its maximum value of 50–51% unless the reaction reached 40 min.
Under the slurry-phase carbonation route, a violent carbonation reaction occurred at the beginning of the contact between AOD slag and CO2. As the reaction temperature raised, the carbonation active mineral phases (Ca2SiO4, Ca3Mg(SiO4)2, MgO, etc.) in the AOD slag absorbed more energy per unit time and could store enough activation energy in a shorter time to convert them into activated molecules. As the number of carbons activated molecules increased, the carbonation reaction of the AOD slag was more effective to occur, which was manifested as the increase of the carbonation reaction ratio at the initial stage of the reaction, and the maximum carbonation ratio increased during the reaction equilibrium period.
3.3. Carbonation Products of AOD Slag
FTIR, XRD, and SEM-EDS were used to analyze the phase composition and microscopic morphology of the carbonated AOD slag, to analyze the influence of reaction temperature, stirring speed, and reaction time on the carbonation ratio of the AOD slag, and then determine the influence of these factors on the crystallization behavior of the product calcium carbonate.
3.3.1. XRD Analysis
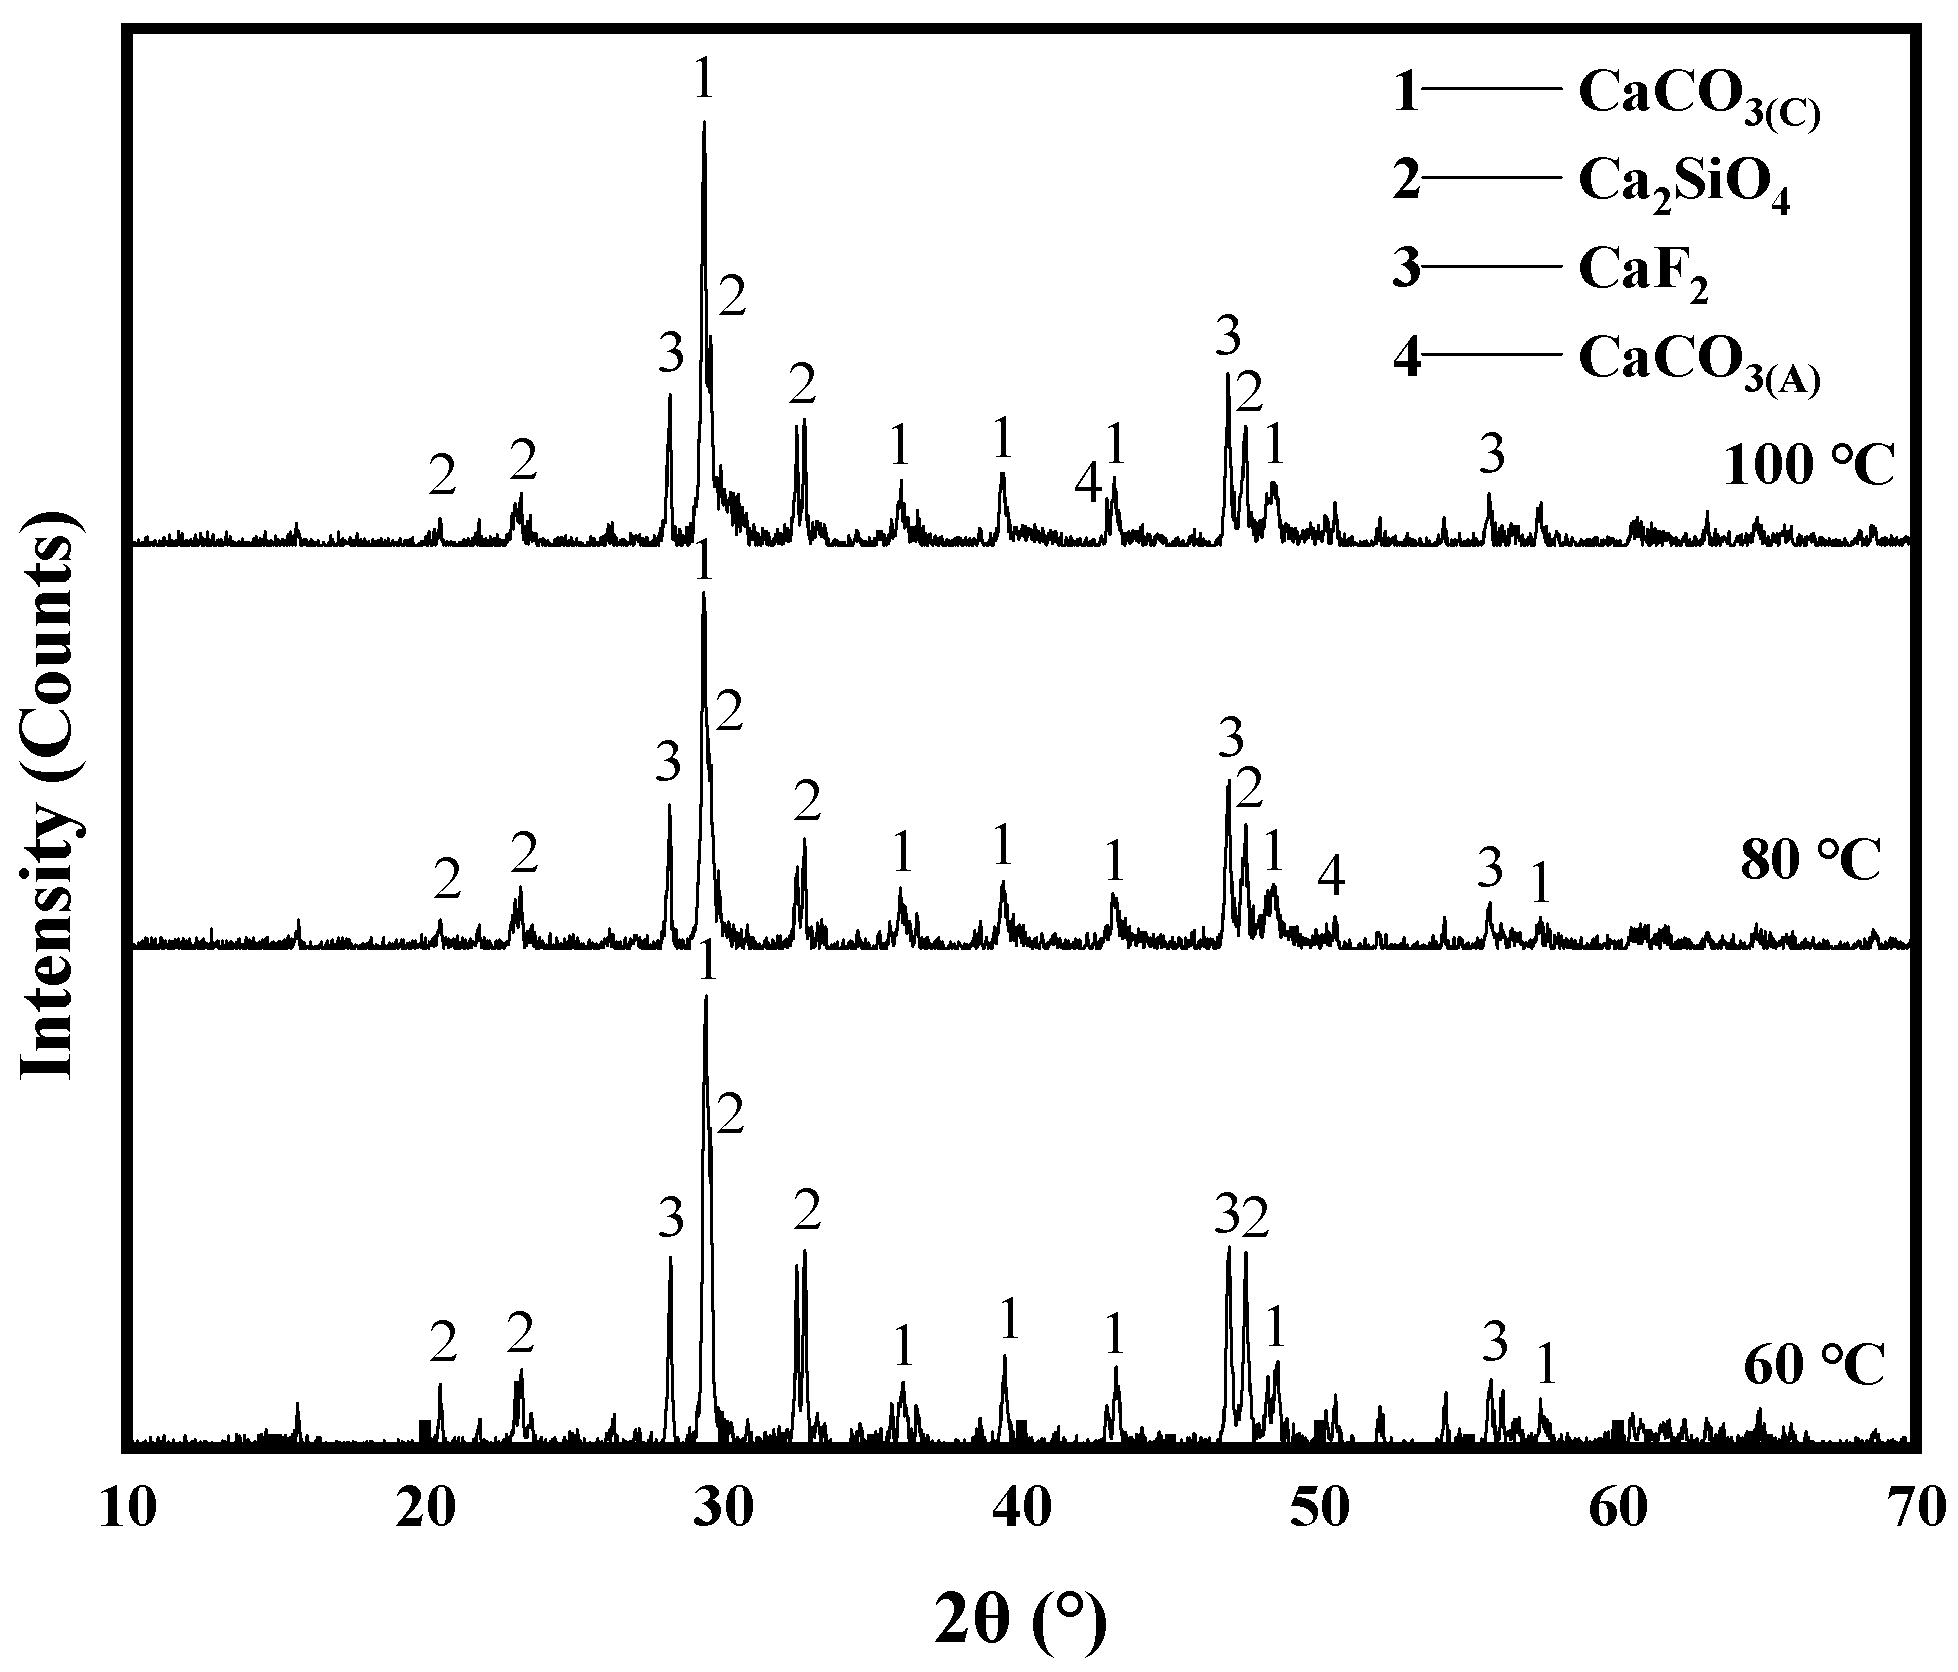
The XRD patterns of the carbonated AOD slags obtained by reacting for 80 min at different reaction temperatures are shown in Figure 6. The carbonation products of the AOD slag were mainly calcium carbonates with different crystal forms. When the reaction temperature was 60 °C, the crystal form was single calcite (CaCO3(C)), while when the reaction temperature was 80 °C or 100 °C, aragonite (CaCO3(A)) began to precipitate in the carbonated AOD slag.
To further study the crystallization law of calcium carbonate in the carbonated AOD slag, Jade 9 software was used to perform full spectrum fitting on XRD data to analyze the relative content of different crystal forms of calcium carbonate, and the results were shown in Table 4. As the reaction temperature increased, the mass fraction of calcite (CaCO3(C)) in the carbonated AOD slag gradually increased. When the reaction temperature was 100 °C, the mass fraction of calcite (CaCO3(C)) in the carbonated AOD slag was as high as 65.5%. The content of dicalcium silicate (Ca2SiO4) in the carbonated AOD slag gradually decreased with the increase of temperature, which showed that dicalcium silicate (Ca2SiO4) was continuously carbonized during the carbonation process. The aragonite (CaCO3(A)) appeared in the carbonated AOD slags obtained under 80 °C and 100 °C. The content of fluorite (CaF2) did not change much during the carbonation process of AOD slag and had been around 10%.
3.3.2. FTIR Analysis
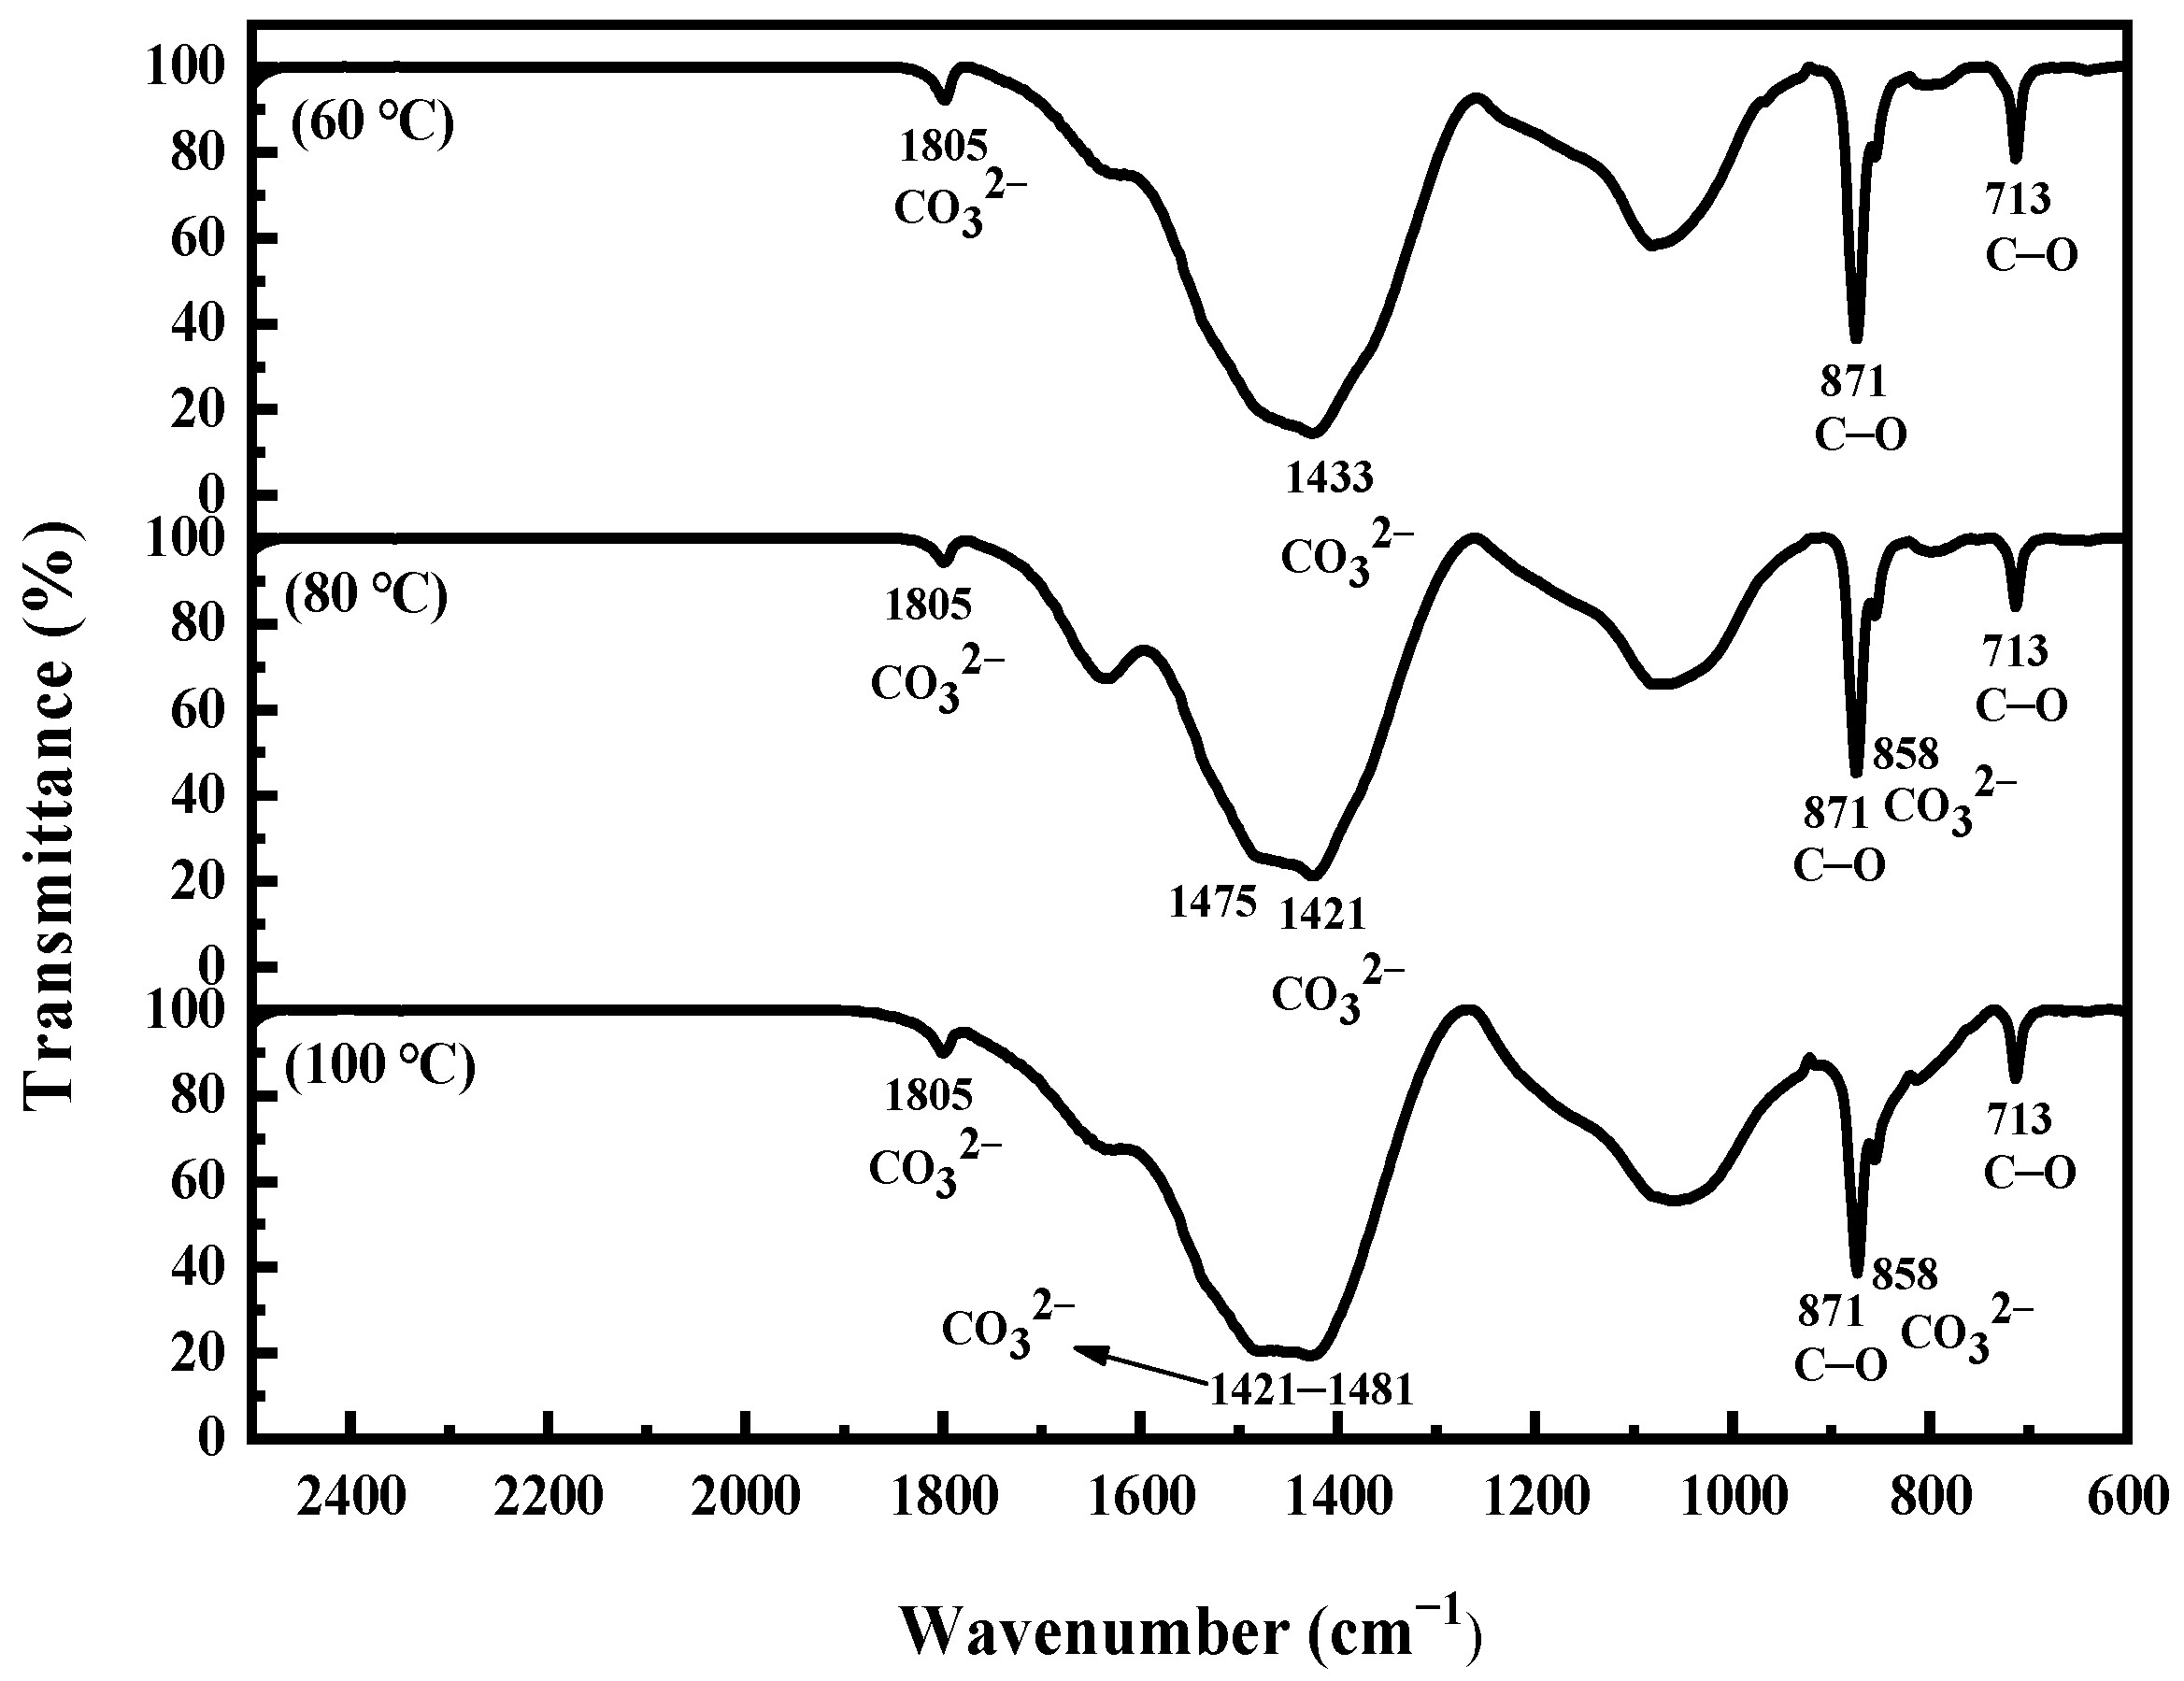
The FTIR spectra of carbonated AOD slag at different temperatures were shown in Figure 7. Characteristic infrared vibration peaks were detected at 713 cm−1, 871 cm−1, 1421–1481 cm−1, and 1805 cm−1 in carbonated AOD slags [19] corresponding to the C-O stretching vibration peak, C-O anti-symmetric stretching vibration peak, CO32− out-of-plane deformation vibration peak, and CO32− in-plane deformation vibration peak of CaCO3(C), it showed that calcite (CaCO3(C)) was formed in the carbonated AOD slag at different temperatures. It was worth noting that the carbonated AOD slag still had a characteristic infrared vibration peak at 858 cm−1 at 80 °C and 100 °C, corresponding to the CO32− out-of-plane bending vibration in aragonite (CaCO3(A)). It showed that aragonite (CaCO3(A)) was precipitated in the carbonated AOD slag, which was consistent with the analysis results of the above XRD analysis.
3.3.3. Microscopic Morphology Analysis
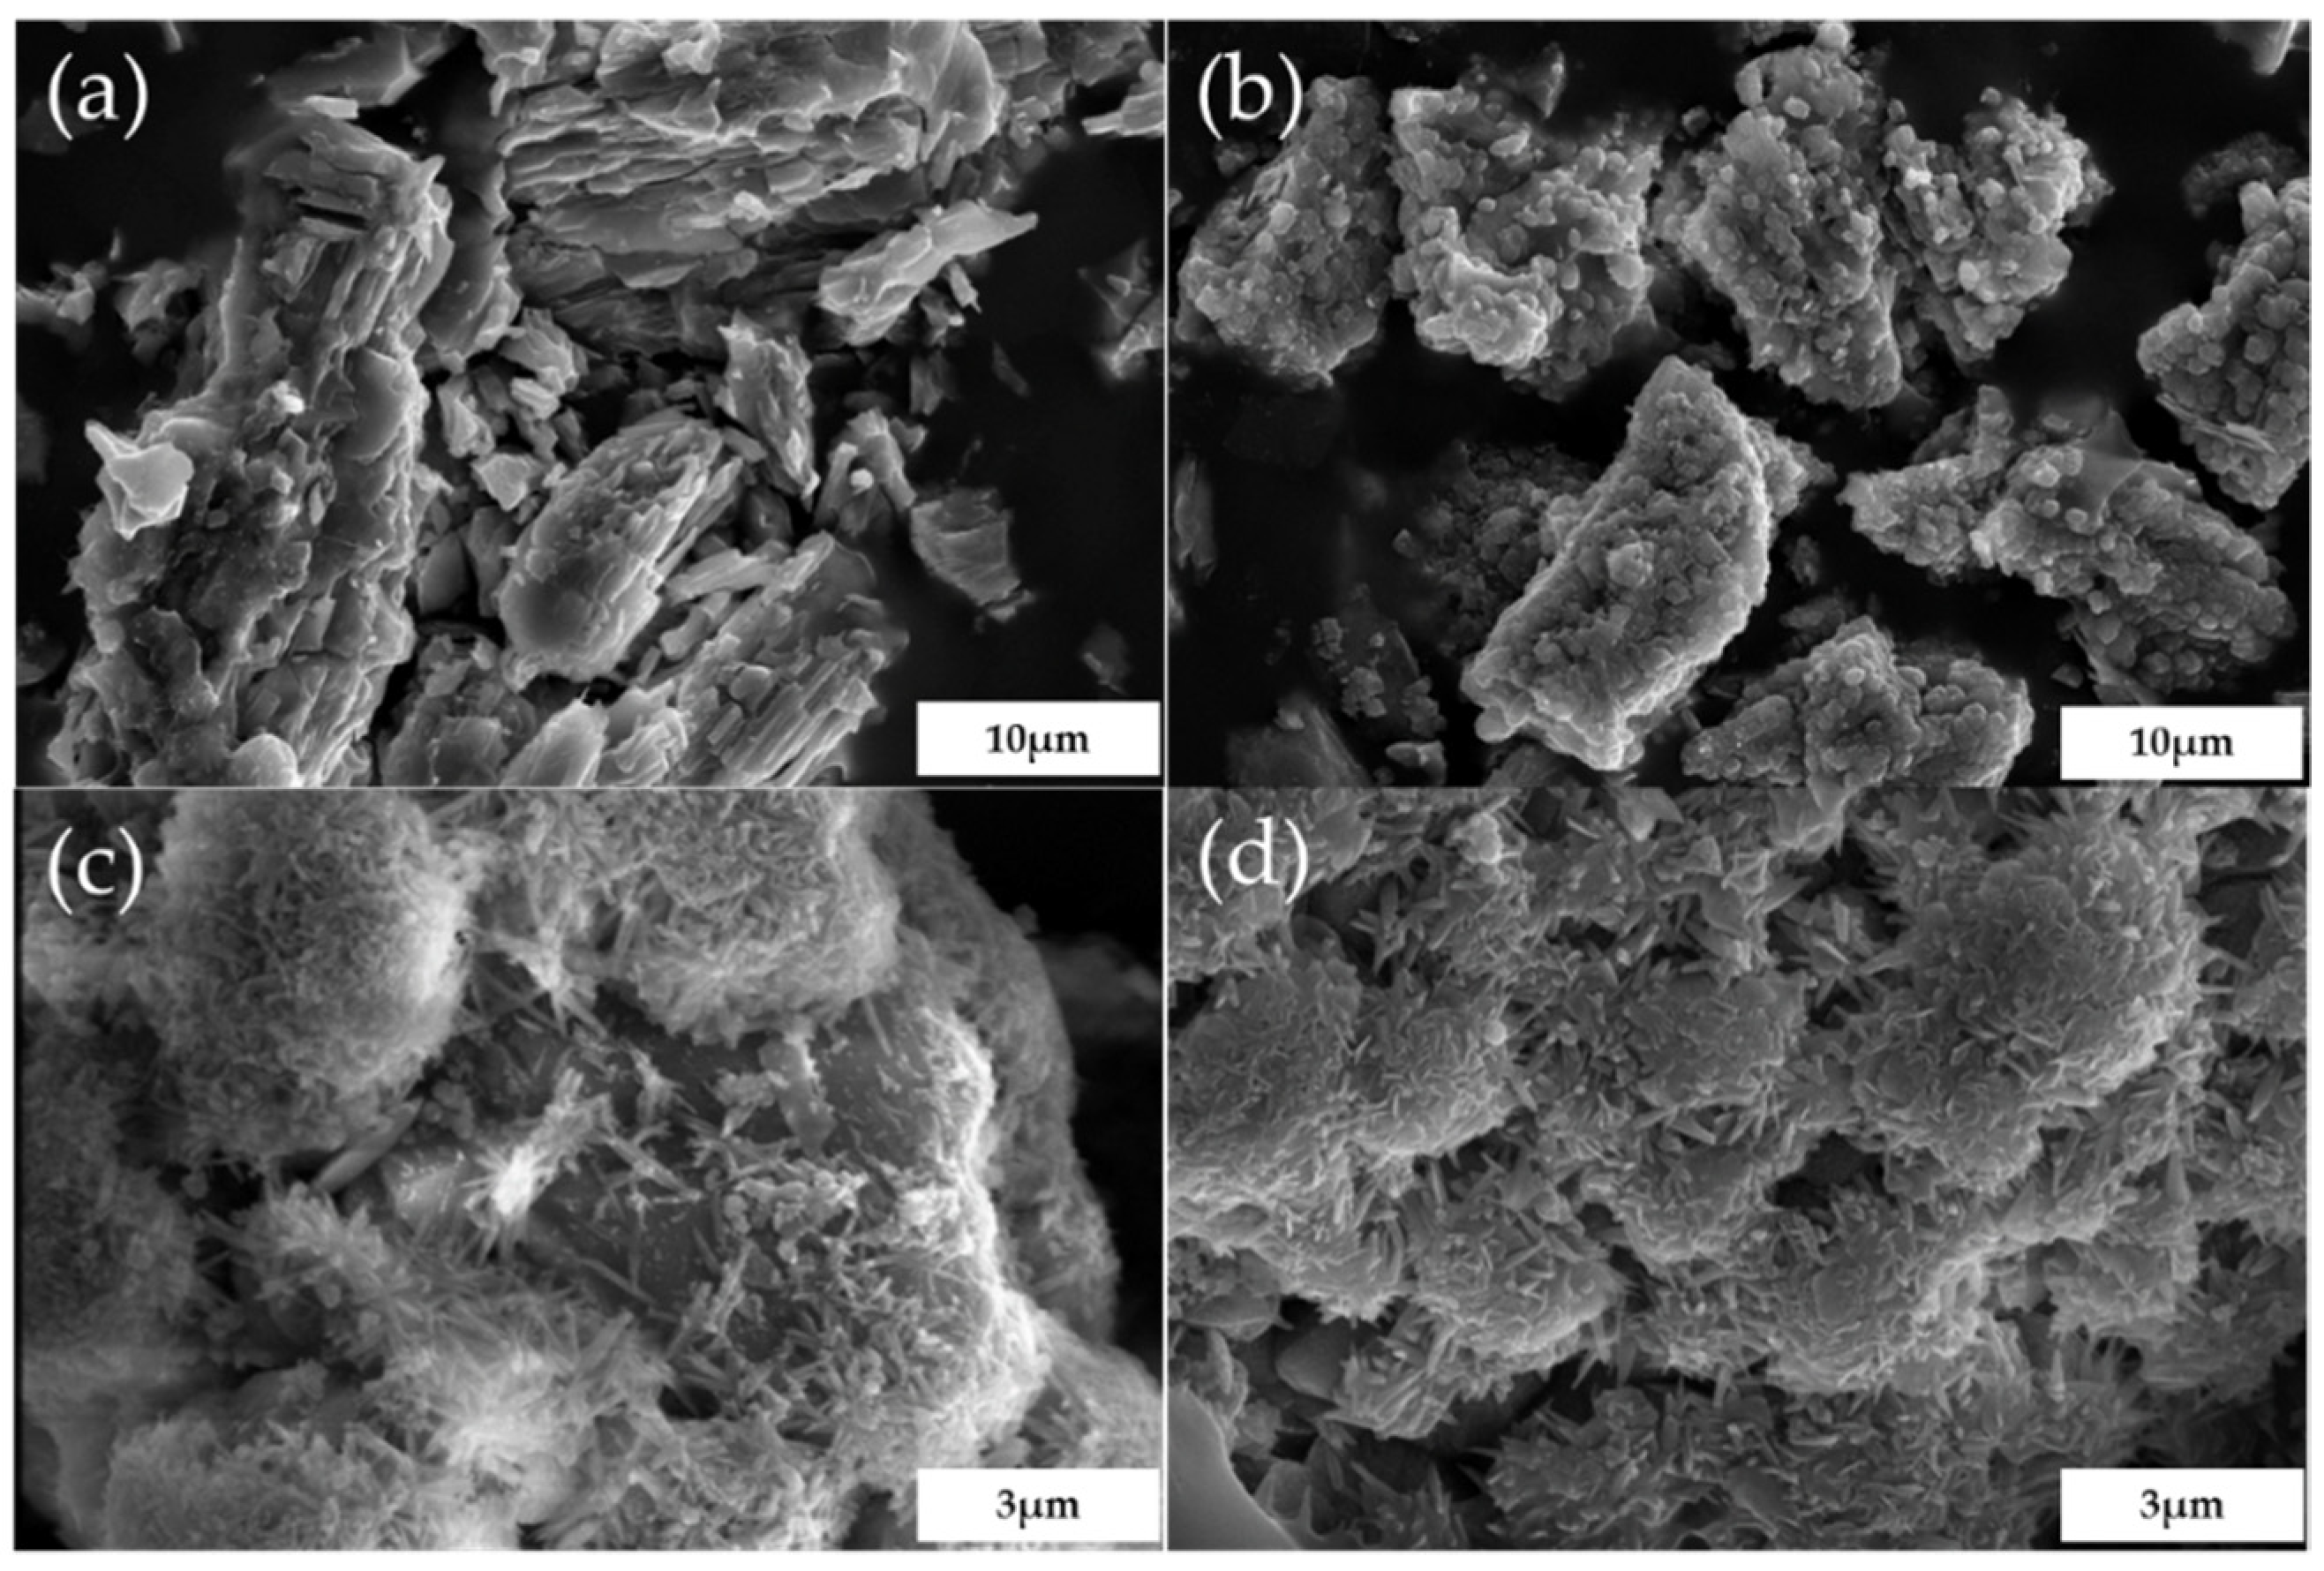
SEM-EDS was used to detect the microscopic morphology of the original AOD slag and the carbonated AOD slags obtained under a different reaction temperature, with the result shown in Figure 8. As shown in Figure 8a, most of the original AOD slag particles were massive aggregates with a smooth surface, with different crystal grain sizes and sharp edges. As shown in Figure 8b, the resulting carbonated AOD slag under 60 °C was composed of irregular blocky solid particles, of which the larger particles were mostly rhombic hexahedrons, with smooth smaller round particles attached to the surface, showing a tendency to be corroded. As shown in Figure 8c,d, when the reaction temperature was 80 °C and 100 °C, the obtained carbonated AOD slag was mainly composed of massive solid particles, and the surface of the particles was attached with long needles. Combined with the XRD analysis of the above carbonated AOD slag, it can be seen that the main mineral phase of carbonated AOD slag was calcite (CaCO3), the solid particles formed during the carbonization of AOD slag were mainly calcite (CaCO3), and the long needles were aragonite (CaCO3(A)), reflecting the aragonite (CaCO3(A)) calcium carbonate crystals began to precipitate in the carbonated AOD slag.
Through the above research on the carbonation products of AOD slag slurry-phase carbonation, it was found that most of the aragonite (CaCO3(A)) were long needle-like or spindle-shaped, and it was difficult to wrap the surface of the active components in the AOD slag under a lower reaction temperature. On the contrary, if the adapted reaction temperature was increased, a lot of aragonite (CaCO3(A)) tended to be formed, thereby further increasing the carbonation ratio of the AOD slag.
Under the conditions of a stirring speed of 450 r·min−1, reaction temperature of 80 °C, liquid-solid ratio of 8:1, reaction time of 40 min, and CO2 partial pressure of 0.2 MPa, the AOD slag suspension method accelerates carbonation, and the carbonization rate can reach 66.7%. Under optimized conditions, the process effectively eliminated the dissolution of CO2 and weakened the diffusion mass transfer resistance during the decomposition of calcium and magnesium active groups.
3.4. Carbonation Reaction Kinetic Model of AOD Slag
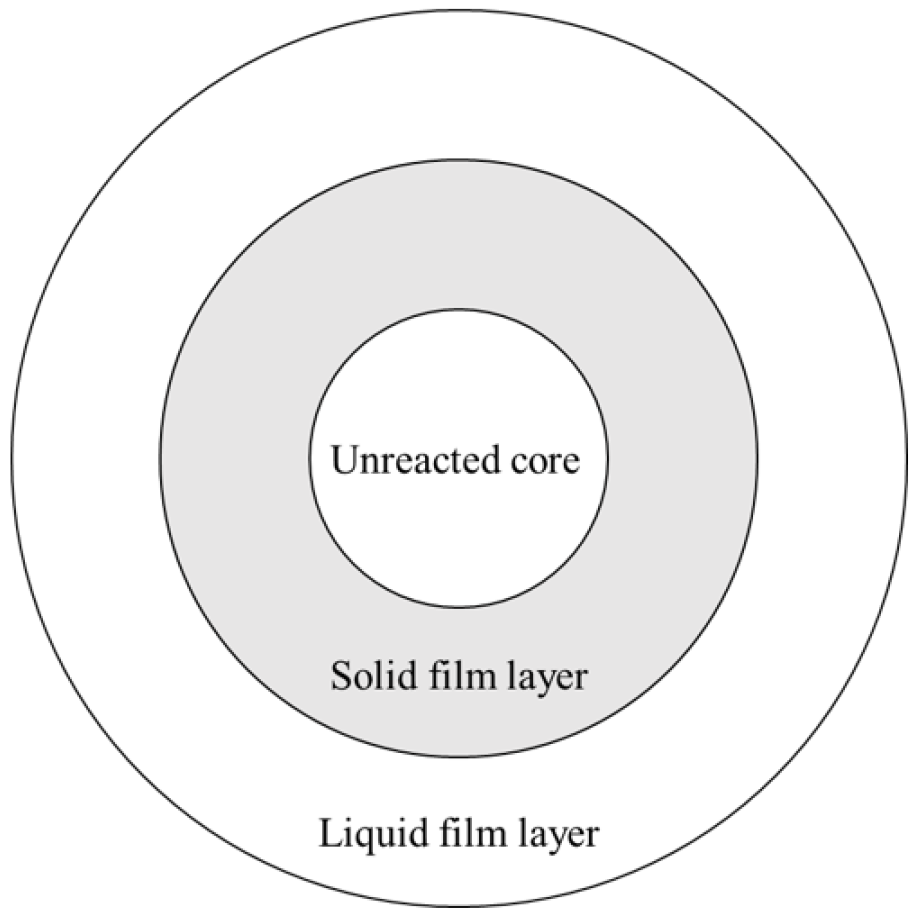
To further study the reaction kinetics mechanism of AOD slag accelerating carbonation, the unreacted shrinking core model [20] was used to describe the carbonation reaction process. The schematic diagram of the unreacted shrinking core model was shown in Figure 9. As shown in Figure 9, the CO2 gas diffused into the AOD slag liquid film layer and then diffused through the CaCO3 product layer, afterwards, CO2 and CaO chemically react at the interface and move to the inside [20]. There are three controlling factors for the unreacted shrinking core model [21,22] each with different expressions about the relationship between reaction time and carbonation ratio.
I. When the resistance of gas film diffusion (external diffusion) is the predominant carbonation rate-controlling step, the carbonation ratio-reaction time expression can be written as Equation (4).
II. When the resistance of shell diffusion control (internal diffusion) is the predominant carbonation rate-controlling step, the carbonation ratio-reaction time expression can be written as Equation (5).
III. When the chemical reaction controls the carbonation reaction, the carbonation ratio-reaction time expression can be written as Equation (6).
where x denotes the carbonation ratio of AOD slag at different temperatures (%); k (, , and ) denote the reaction rate constants; t denotes the reaction time (min).
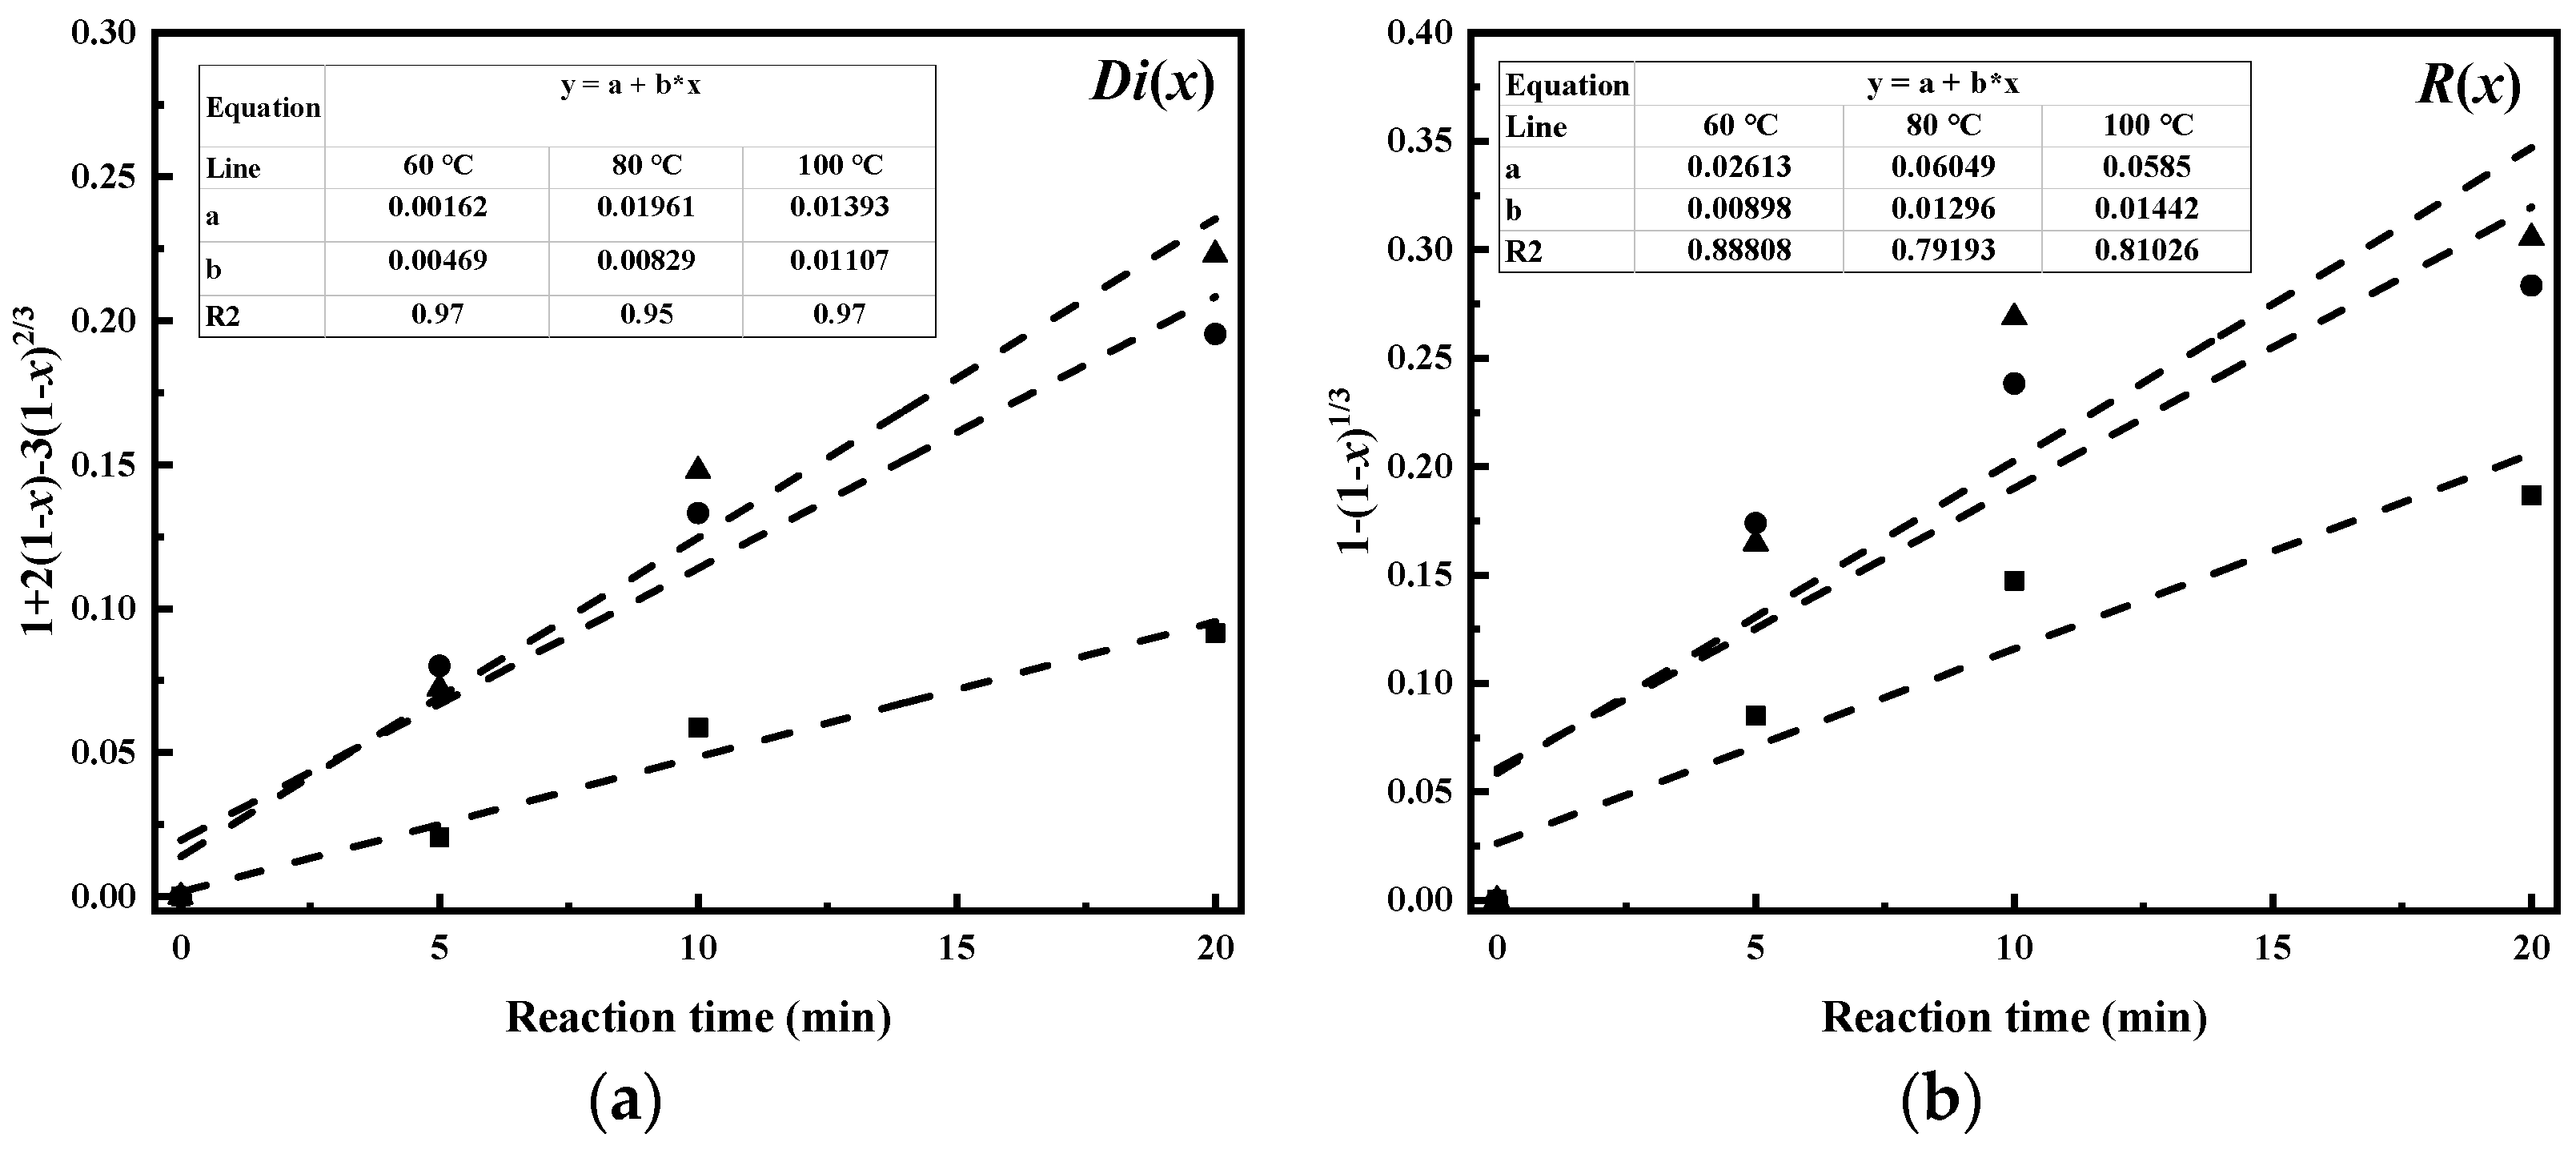
CO2 was supplied in a sufficient amount to carbonatable phases in AOD slag during the slurry-phase carbonation procedure in this study, which means the gas film diffusion would not be a controlling factor, so the external diffusion control model (De) was not adopted. Considering that the slurry-phase carbonation of the AOD slag was relatively violent, when the reaction reached 20 min it reached its maximum level (see Figure 5). The carbonation reaction time interval of 0–20 min was selected as the abscissa value range of linear fitting. Then, Equations (5) and (6) were referred to perform t→Di(x) and t→R(x) linear fitting separately, and the fitting results of the internal diffusion control equation and the chemical reaction control equation at different temperatures were shown in Figure 10.
It was observed that Di(x) exhibited better linearity in the entire temperature range of 60–100 °C, which indicates that the rate-controlling process within the range of setting conditions for slurry-phase carbonation of AOD slag was a shell diffusion controlling process.
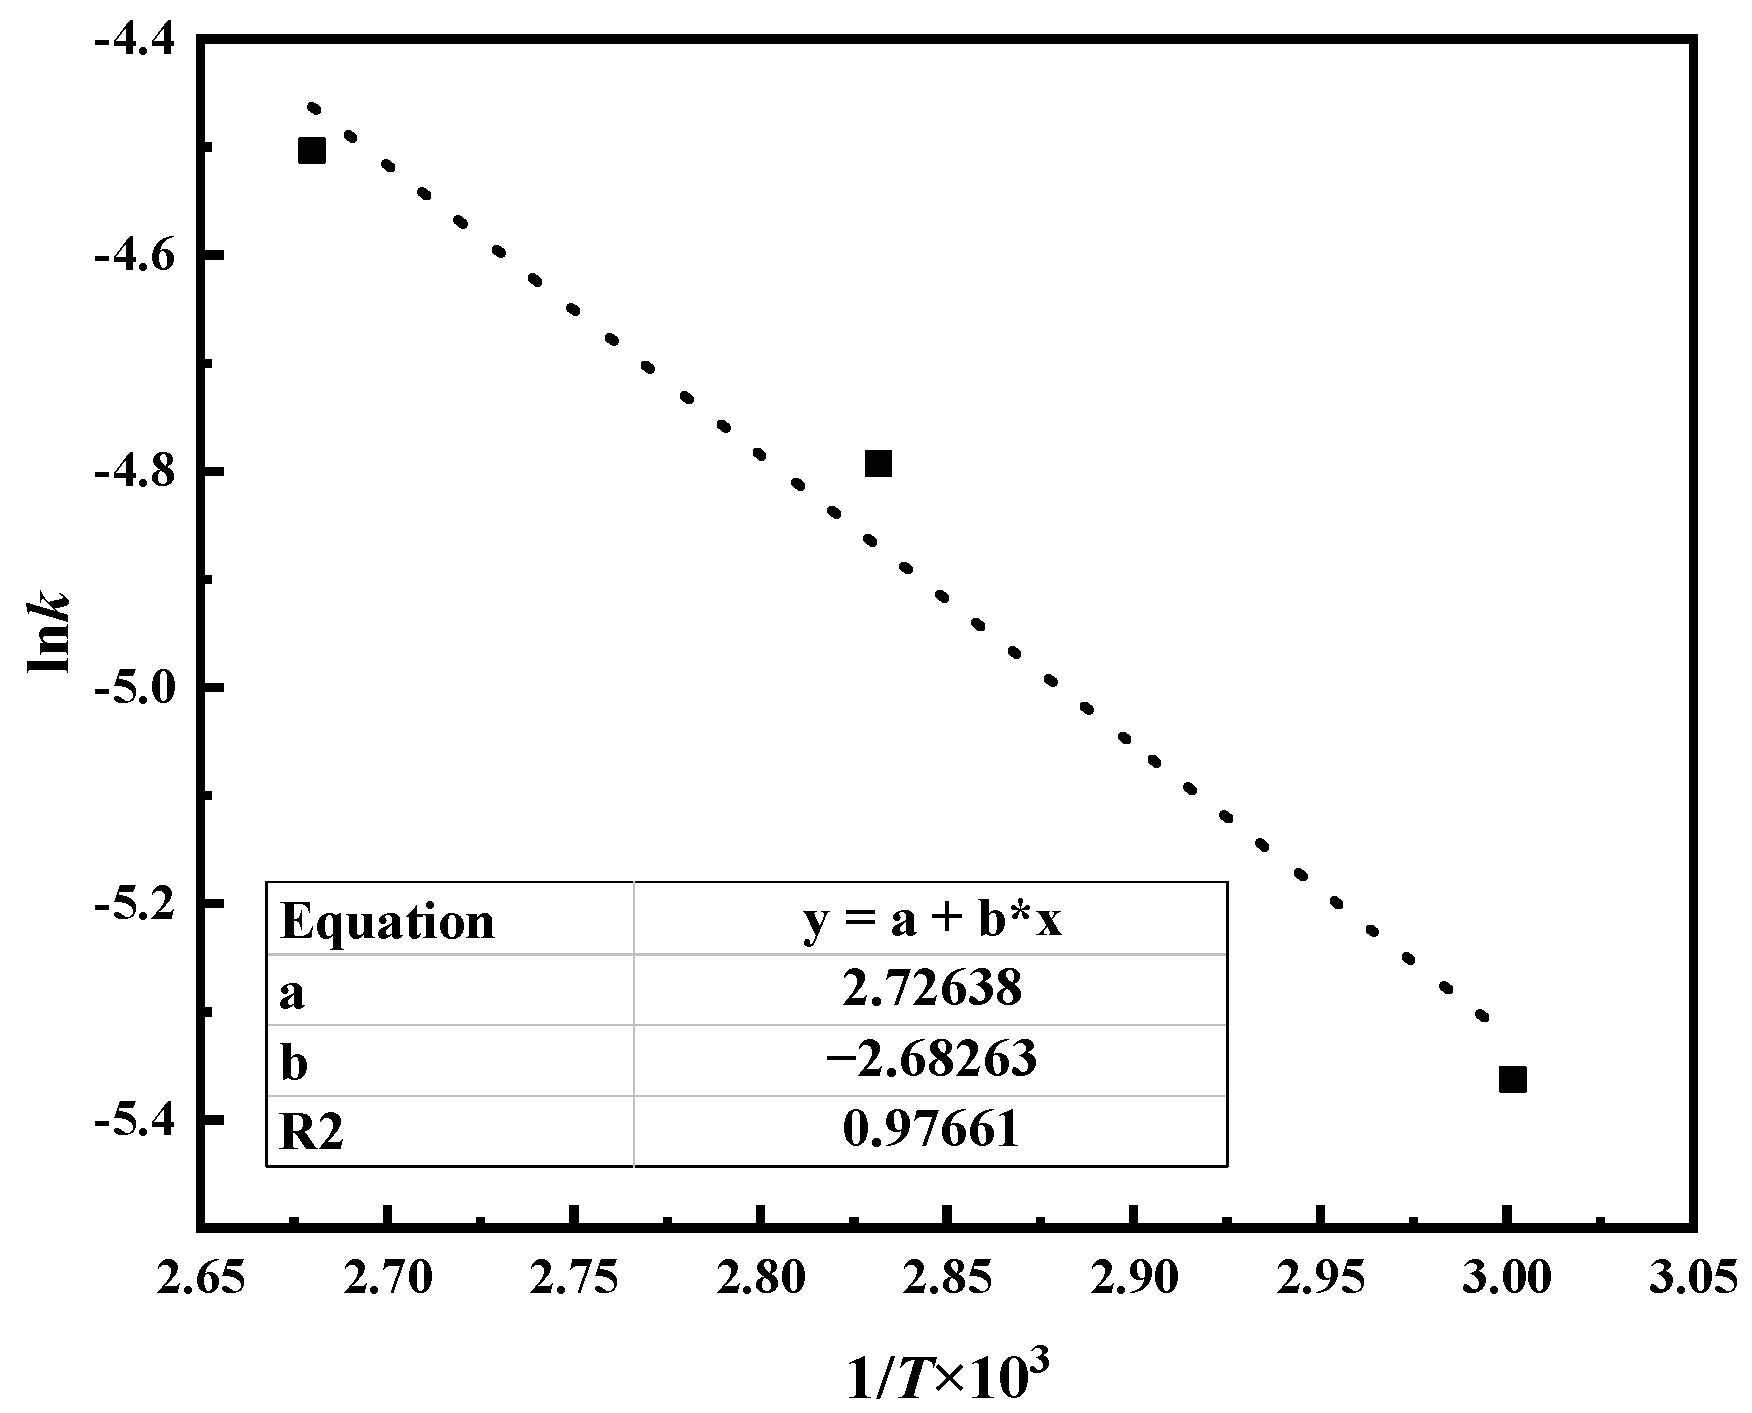
According to the Arrhenius equation, Equation (7) [23,24], the activation energy calculation of the internal diffusion governing equation could be obtained by using Equation (7) to perform linear fitting (ln k vs. 1/T).
where k denotes the reaction rate constant, A denotes the frequency factor, R denotes the gas constant, T denotes the temperature (K), E denotes the activation energy of carbonation reaction (kJ/mol).
Figure 11 shows the Arrhenius plot of Di for AOD slag’s carbonation. The Arrhenius plot exhibits good linearity (R2 = 0.98) at temperatures ranging from 60–100 °C. The activation energy (E) of the carbonation reaction was calculated to be 22.28 kJ/mol which was a reasonable value as the activation energy for the diffusion control process [22].
4. Conclusions
- (1)
- A higher stirring speed could accelerate the reaction rate in the early stage (0–10 min) of the slurry-phase carbonation reaction, but when the carbonation reaction entered the later stage and reached the maximum carbonation ratio, the stirring speed did not improve the carbonation potential of the AOD slag.
- (2)
- The slurry-phase carbonation of AOD slag had a relatively violent initial reaction, and the maximum carbonation ratio could be reached when the reaction reached 20–40 min. In the lower temperature range (60–80 °C), as the reaction temperature increased, the number of activated carbonation molecules in the slurry-phase carbonation system per unit time increased, which increased the carbonation efficiency of AOD slag. In the higher temperature range (80 °C–100 °C), the activation efficiency of the reaction temperature on the carbonation activity of AOD slag decreased.
- (3)
- The carbonation products of the AOD slag were mainly calcium carbonates with different crystal forms. As the reaction temperature increased, the mass fraction of calcite (CaCO3(C)) in the carbonated AOD slag gradually increased. When the reaction temperature was 60 °C, the crystal form was single calcite (CaCO3(C)), while when the reaction temperature was 80 °C or 100 °C, aragonite (CaCO3(A)) began to precipitate in the carbonated AOD slag.
- (4)
- Within 20 min from the beginning to the equilibrium of the reaction, the slurry-phase carbonation of AOD slag was controlled by shell diffusion (internal diffusion), and its activation energy was 22.28 kJ/mol.
Author Contributions
Conceptualization, J.-G.L. and Y.-J.W.; methodology, M.-J.T.; software, S.-H.L. and S.Q.; validation, Y.-J.W., J.-G.L. and Y.-N.Z.; formal analysis, M.-J.T.; investigation, Y.-J.W. and M.-J.T.; resources, Y.-N.Z. and J.-G.L.; data curation, M.-J.T. and Y.-J.W.; writing—original draft preparation, M.-J.T.; writing—review and editing, J.-G.L. and Y.-J.W.; visualization, S.Q. and M.-J.T.; supervision, J.-G.L.; project administration, J.-G.L.; funding acquisition, Y.-N.Z. All authors have read and agreed to the published version of the manuscript.
Funding
This research was funded by the National Natural Science Foundation of China (No. 51704119 and 51574108).
Institutional Review Board Statement
Not applicable.
Informed Consent Statement
Not applicable.
Data Availability Statement
Not applicable.
Acknowledgments
We wish to express our gratitude to the members of our research team, Bao Liu, Xi Zhang, Yi-Tong Wang and Tao Li.
Conflicts of Interest
The authors declare no conflict of interest. The funders had no role in the design of the study; in the collection, analyses, or interpretation of data; in the writing of the manuscript, or in the decision to publish the results.
References
- Zhao, H.Q.; Qi, Y.H.; Shi, Y.L.; Na, X.Z.; Feng, H.L. Mechanism and prevention of disintegration of AOD stainless steel slag. J. Iron Steel Res. Int. 2013, 20, 26–30. [Google Scholar] [CrossRef]
- Wang, W.; Li, J.G.; Wang, Y.J.; Zeng, Y.N.; Gao, A.M. Properties of aged AOD slag and its leaching characteristics. China Metall. 2021, 31, 104–110. [Google Scholar]
- Adegoloye, G.; Beaucour, A.L.; Ortola, S.; Noumowe, A. Concretes made of EAF slag and AOD slag aggregates from stainless steel process: Mechanical properties and durability. Constr. Build. Mater. 2015, 76, 313–321. [Google Scholar] [CrossRef]
- Zhang, H.; Xin, H. An overview for the utilization of wastes from stainless steel industries. Resour. Conserv. Recycl. 2011, 55, 745–754. [Google Scholar]
- Liu, B.; Li, J.; Zeng, Y.; Wang, Z. Toxicity assessment and geochemical model of chromium leaching from AOD slag. Chemosphere 2016, 144, 2052–2057. [Google Scholar] [CrossRef]
- Yu, C.; Zhang, W.; Gao, F.; Huang, H.; Zhao, L. An overview of resource utilization of steel slag as absorbent material for waste water treatment. E3S Web Conf. 2020, 199, 17. [Google Scholar] [CrossRef]
- Yadav, S.; Mehra, A. Dissolution of steel slags in aqueous media. Environ. Sci. Pollut. Res. 2017, 24, 16305–16315. [Google Scholar]
- Yadav, S.; Mehra, A. Experimental study of dissolution of minerals and CO2 sequestration in steel slag. Waste Manag. 2017, 64, 348–357. [Google Scholar] [CrossRef]
- Ghouleh, Z.; Guthrie, R.; Shao, Y. Production of carbonate aggregates using steel slag and carbon dioxide for carbon-negative concrete. J. CO2 Util. 2017, 18, 125–138. [Google Scholar] [CrossRef]
- Santos, R.M.; Bouwel, J.V.; Vandevelde, E.; Mertens, G.; Elsen, J.; Gerven, T.V. Accelerated mineral carbonation of stainless steel slags for CO2 storage and waste valorization: Effect of process parameters on geochemical properties. Int. J. Greenh. Gas Control. 2013, 17, 32–45. [Google Scholar] [CrossRef] [Green Version]
- Saran, R.K.; Arora, V.; Yadav, S. CO2 Sequestration by Mineral Carbonation: A Review. Glob. Nest. J. 2018, 20, 497–503. [Google Scholar]
- Chang, E.E.; Chen, C.H.; Chen, Y.H.; Pan, S.Y.; Chiang, P.C. Performance evaluation for carbonation of steel-making slags in a slurry reactor. J. Hazard. Mater. 2011, 186, 558–564. [Google Scholar]
- Salman, M.; Cizer, O.; Pontikes, Y.; Santos, R.M.; Snellings, R.; Vandewalle, L.; Blanpain, B.; Van Balen, K. Effect of accelerated carbonation on AOD stainless steel slag for its valorisation as a CO2-sequestering construction material. Chem. Eng. J. 2014, 246, 39–52. [Google Scholar] [CrossRef] [Green Version]
- Baciocchi, R.; Costa, G.; Bartolomeo, E.D.; Polettini, A.; Pomi, R. Carbonation of Stainless Steel Slag as a Process for CO2 Storage and Slag Valorization. Waste Biomass Valorization 2010, 1, 467–477. [Google Scholar] [CrossRef]
- Baciocchi, R.; Costa, G.; Di Gianfilippo, M.; Polettini, A.; Pomi, R.; Stramazzo, A. Thin-film versus slurry-phase carbonation of steel slag: CO2 uptake and effects on mineralogy. J. Hazard. Mater. 2015, 283, 302–313. [Google Scholar] [CrossRef] [PubMed]
- Huijgen, W.J.J.; Comans, R.N.J. Carbonation of steel slag for CO2 sequestration: Leaching of products and reaction mechanisms. Environ. Sci. Technol. 2006, 40, 2790–2796. [Google Scholar] [CrossRef] [PubMed]
- Huijgen, W.J.J.; Witkamp, G.J.; Comans, R. Mineral CO2 Sequestration by Steel Slag Carbonation. Environ. Sci. Technol. 2005, 39, 9676–9682. [Google Scholar] [CrossRef]
- Wang, Y.J.; Zeng, Y.N.; Li, J.G.; Zhang, Y.Z.; Zhao, Q.Z. Carbonation of argon oxygen decarburization stainless steel slag and its effect on chromium leachability. J. Clean. Prod. 2020, 256, 120377. [Google Scholar] [CrossRef]
- Wang, Y.J.; Zeng, Y.N.; Li, J.G.; Zhang, Y.Z. Cementitious behavior of argon oxygen decarburization stainless steel slag and its stabilization on chromium. Crystals 2020, 10, 876. [Google Scholar]
- Homma, S.; Ogata, S.; Koga, J.; Matsumoto, S. Gas–solid reaction model for a shrinking spherical particle with unreacted shrinking core. Chem. Eng. Sci. 2005, 60, 4971–4980. [Google Scholar] [CrossRef]
- Levenspiel, O. Chemical Reaction Engineering. Ind. Eng. Chem. Res. 1999, 38, 4140–4143. [Google Scholar] [CrossRef]
- Takasu, H.; Funayama, S.; Uchiyama, N.; Hoshino, H.; Tamura, Y.; Kato, Y. Kinetic analysis of the carbonation of lithium orthosilicate using the shrinking core model. Ceram. Int. 2018, 44, 11835–11839. [Google Scholar] [CrossRef]
- Cao, T.Y. Dynamic study on lime carbonation. Wuhan Iron Steel Corp. Technol. 2010, 48, 21–23. [Google Scholar] [CrossRef]
- Zeng, Y.N.; Ren, Q.Q.; Liu, B.; Li, J.G. Kinetic model of chromium release from argon oxygen decarburisation (AOD) slag in a neutral leachate. J. Iron Steel Res. Int. 2020, 27, 1303–1310. [Google Scholar] [CrossRef]
Figure 1.
XRD diffraction pattern of the AOD slag.

Figure 2.
FTIR pattern of AOD slag.

Figure 3.
Schematic diagram of experimental set-up for carbonation of AOD slag.

Figure 4.
Effect of stirring speed on carbonation of the AOD slag.

Figure 5.
Effect of reaction temperature on carbonation of AOD slag.

Figure 6.
XRD pattern of the AOD stainless steel slag.

Figure 7.
FTIR spectra of carbonated AOD slag at different temperatures.

Figure 8.
SEM morphology of AOD slag and carbonated AOD slag: (a)—AOD raw slag; (b)—60 °C AOD carbonated slag; (c)—80 °C AOD carbonated slag; (d)—100 °C AOD carbonated slag.
Figure 8.
SEM morphology of AOD slag and carbonated AOD slag: (a)—AOD raw slag; (b)—60 °C AOD carbonated slag; (c)—80 °C AOD carbonated slag; (d)—100 °C AOD carbonated slag.

Figure 9.
Schematic diagram of the unreacted shrinking core model.

Figure 10.
Fitting results of (a)—internal diffusion (Di(x)) and (b)—chemical reaction (R(x)) governing equations.
Figure 10.
Fitting results of (a)—internal diffusion (Di(x)) and (b)—chemical reaction (R(x)) governing equations.

Figure 11.
Reaction activation energy regression curves of internal diffusion.


Table 1.
Chemical composition of AOD slag/wt. %.
| Composition | CaO | SiO2 | MgO | Al2O3 | TiO2 | Cr2O3 | FeO | MnO | P2O5 | Other |
|---|---|---|---|---|---|---|---|---|---|---|
| Content | 65 | 23.93 | 6.36 | 1.94 | 1.20 | 0.31 | 1.15 | 0.09 | 0.002 | 0.06 |
Table 2.
Main mineral phase composition of AOD slag (mass %).
| Composition | Ca2SiO4 | CaF2 | MgO | MgCr2O4 | Ca3Mg (SiO4)2 |
|---|---|---|---|---|---|
| Content | 77.6 | 12.8 | 9.8 | 0.2 | Microphase |
Table 3.
Carbonation reaction equations and their ΔrGθ of minerals in AOD slag.
| Mineral Phase | Carbonation Reaction Equation | Log (K) | ΔrGθ (kJ/mol) | ΔrGθ = A + BT (kJ/mol) |
|---|---|---|---|---|
| Ca2SiO4 | Ca2SiO4(A) + 2CO2 = 2CaCO3 + SiO2 | 26.637 | −152.029 | 0.335T-160.538 |
| Ca2SiO4(AA) + 2CO2 = 2CaCO3 + SiO2 | 23.260 | −132.755 | 0.315T-140.773 | |
| Ca2SiO4(B) + 2CO2 = 2CaCO3 + SiO2 | 23.221 | −132.532 | 0.319T-140.650 | |
| Ca2SiO4(L) + 2CO2 = 2CaCO3 + SiO2 | 23.439 | −133.777 | 0.329T-142.019 | |
| Ca2SiO4(O) + 2CO2 = 2CaCO3 + SiO2 | 21.989 | −125.498 | 0.322T-133.559 | |
| MgO | MgO + CO2 = MgCO3 | 8.503 | −48.531 | 0.175T-52.918 |
| f-CaO | CaO + CO2 = CaCO3 | 22.852 | −130.423 | 0.160T-134.421 |
Table 4.
Main mineral phase composition of carbonated AOD slag.
| Slag Sample | CaCO3 | Ca2SiO4 | CaF2 | CaCO3(A) |
|---|---|---|---|---|
| 60 °C | 50.5 | 38.1 | 11.4 | Microphase |
| 80 °C | 61.9 | 22.6 | 9.4 | 4.5 |
| 100 °C | 65.5 | 21.3 | 10.0 | 3.2 |
Publisher’s Note: MDPI stays neutral with regard to jurisdictional claims in published maps and institutional affiliations. |
© 2021 by the authors. Licensee MDPI, Basel, Switzerland. This article is an open access article distributed under the terms and conditions of the Creative Commons Attribution (CC BY) license (https://creativecommons.org/licenses/by/4.0/).
Share and Cite
MDPI and ACS Style
Tao, M.-J.; Wang, Y.-J.; Li, J.-G.; Zeng, Y.-N.; Liu, S.-H.; Qin, S. Slurry-Phase Carbonation Reaction Characteristics of AOD Stainless Steel Slag. Processes 2021, 9, 2266. https://0-doi-org.brum.beds.ac.uk/10.3390/pr9122266
AMA Style
Tao M-J, Wang Y-J, Li J-G, Zeng Y-N, Liu S-H, Qin S. Slurry-Phase Carbonation Reaction Characteristics of AOD Stainless Steel Slag. Processes. 2021; 9(12):2266. https://0-doi-org.brum.beds.ac.uk/10.3390/pr9122266
Chicago/Turabian StyleTao, Meng-Jie, Ya-Jun Wang, Jun-Guo Li, Ya-Nan Zeng, Shao-Hua Liu, and Song Qin. 2021. "Slurry-Phase Carbonation Reaction Characteristics of AOD Stainless Steel Slag" Processes 9, no. 12: 2266. https://0-doi-org.brum.beds.ac.uk/10.3390/pr9122266
Note that from the first issue of 2016, this journal uses article numbers instead of page numbers. See further details here.