Anonymous Detection of Traveler Flows Employing Bluetooth Technologies †


1
Telematics and Electronics for Transports, Faculty of Transports, University POLITEHNICA of Bucharest, 060042 Bucharest, Romania
2
ORANGE S.A. Romania, 020334 Bucharest, Romania
3
Engineering and Management of Metallic Materials, Faculty of Material Science and Engineering, University POLITEHNICA of Bucharest, Academy of Romanian Scientists, 060042 Bucharest, Romania
*
Author to whom correspondence should be addressed.
†
Presented at the 14th International Conference on Interdisciplinarity in Engineering—INTER-ENG 2020, Târgu Mureș, Romania, 8–9 October 2020.
Proceedings 2020, 63(1), 61; https://0-doi-org.brum.beds.ac.uk/10.3390/proceedings2020063061
Published: 31 December 2020
(This article belongs to the Proceedings of The 14th International Conference on Interdisciplinarity in Engineering—INTER-ENG 2020)
Abstract
:Intensive usage of public transportation represents a good solution to reduce traffic congestion. Dynamic allocation of vehicles enhances the service level and offers a more comfortable trip to travelers. Bluetooth (BT) has been used in some specific cases as a means of data collection regarding vehicle flow. However, it has been less employed for the anonymous detection of traveler flow, origin–destination, the density of travelers in public transport, etc. This paper analyzes the efficiency of different versions of BT for this type of application. Experiments were carried on for subway lines and stations, as well as in open space. Information regarding mobility dynamics represents an important factor to be considered in traffic management to improve the efficiency of existing systems. Conclusions and recommendations for future research are also provided.
1. Introduction
Bluetooth (BT) version 5.0, issued approximately six years after the development of the BT 4.0 standard, allows for enhancements in short-range communications, with the perspective for inclusion in the deployment of the Internet of Things (IoT). This technology is one of the main pillars in IoT, including the transport domain. The medium access technique is frequency hopping, and BT promises the possibilities of anonymously detecting mobile carriers with such devices, helping in building intelligent transportation systems (ITS). A more efficient method to detect traffic flows is the usage of BT technology in terms of energy consumption reduction. The approach has been successfully applied in normal vehicle traffic measurements at surface road infrastructure but is less implemented in subway transportation. The proposed method is based on anonymous detection of BT/Wi-Fi devices carried by subway travelers. The method presents its advantages, as the infrastructure does not need expensive and hard to maintain dedicated sensors. Collecting relevant information about traveler flow may help information and public transport management systems better administer vehicle fleets, and guidance to relevant destinations, etc. The drawback of the methodology is that only a fraction of the real traveler flow is measurable since not all people may carry detectable BT/Wi-Fi devices. Installing BT/Wi-Fi sensors in specific station locations or in the subway wagons, an image of travelers’ origin–destination (OD) flow, based on BT/Wi-Fi MACs detection, time stamping, and location, can also be built. It may be the goal of public transport administrations to obtain large amounts of data (spatiotemporal flow of travelers) without installing costly, physically invasive infrastructure of dedicated sensors. Moreover, for surface public transport, the development of the proposed solution is also possible with a proper installation of BT/Wi-Fi detector configurations in buses or bus stops, and a similar image of passenger movements can be determined. The collected data can be useful in the dynamic distribution of public transport vehicles on the route (traveler demand-responsive public transportation). In the context of global warming and the increase in emissions, improving the attractiveness of public transportation represents a simple solution to greener cities worldwide.
2. Related Work
2.1. Employment of Indirect Measurement Techniques in Traffic and Traveler Detection
More recent advances in traffic and traveler detection employ indirect (anonymous) measurement techniques, which have the advantage of reduced infrastructure equipment over traditional implementations [1], such as the deployment of dedicated sensors in the field. Frequently, techniques, such as Floating Car Data (FCD) and Floating Car Observer (FCO), are employed to collect data from traffic and passenger flow. Some of these procedures use indirect detection of traffic elements (BT/Wi-Fi devices detection). The authors of [1] explained the BT technology particularities and concluded that even if two BT devices were used together for the inquiry process in a floating car data collection system, 1.919 s are needed for the complete inquiry in the worst case, which is 1.27 s (inquiry scan idle time) + 0.64 s (maximum back off time). This means that any BT device which is not in the cloaked mode can be identified, if in range. The authors of [2] also stated that for the detection of a mobile-carried BT device, two BT sensors are needed at both ends of the road segment. Since all travel time data collection methods do sampling on the travel time of individual travelers, it is important to determine the minimum appropriate sample size to have accurate traveler flow information. Some studies conclude that the minimum percentage of sampling rate should be about 5%. Another problem that will be addressed in this paper is the influence of the technology over measurement accuracy (e.g., BT version 5 over BT versions 4.x).
In paper [3], the authors compared BT versions and concluded that BT5 seems to offer significant performance improvements compared to the previous versions of BT in terms of speed, range, and broadcasting capacity. The authors of [4] evaluated BT and Wi-Fi technologies for scanning in road transportation. They noted that the usage of mobile-equipped BT devices was increasing with the improved availability of these and recommend employing Bluetooth Media Access Control Scanners (BMS) for traffic data collection. The authors also mention some disadvantages, e.g., the possibility of multiple detections of the same device in the range of a single detector (positive false) and the lower chance of detection for fast-moving BT nodes (negative false). In [5], Juan José Vinagre Díaz et al. performed a detailed analysis of the capabilities of Bluetooth technology for travel time estimation. For pedestrian detection at public transportation terminals, N. Shlayan et al. [6] looked for stochastic models specific to pedestrian movements within the experiments of traveler detection employing an in-house combined BT/Wi-Fi data collection methodology and system. They also proposed using anonymous and encrypted BT and Wi-Fi data obtained from the users of a pedestrian network to make real-time decisions. Other authors [7] explored technology-merging techniques to improve vehicle detection. The authors of [7] used BT detection and inductive loop sensors to improve data accuracy, and F. Mannering and D. Bullock [8] performed an analysis of freeway travel time variability using Bluetooth detection.
The authors of [9] tested the effect of the BT connection interval on the throughput and compared power efficiency relating to throughput for various BLE (Bluetooth Low Energy) versions and different transactions. They found that lowering channel interference (CI) will increase throughput for reads and writes, which is not the case for notifications and writes without response. Another finding was that energy consumption reduces with each newer BLE version.
2.2. Expected Improvements in BT 5.0 over BT 4.x and Threats of BT Communications
As specified by standards, BT 5.0 technology delivers better communication quality and experience, compared with its older versions. BT 5.0 continues the Low Energy version of BT 4.x, with speeds around 2 Mbps, communication distances up to 300 m, in the ISM band (industrial, scientific, and medical radio band) of 2.4–2.485 GHz. Version 5.0 also requires less energy than previous versions, thus increasing the battery usage of mobile devices, and the message capacity is around 255 bytes. Bluetooth 5.0 hardware is fully backward compatible with Bluetooth 4.2. Concerning the security of communication, BT 5.0 suffers from disadvantages specific to radio communications, including waves absorption, multiple reflections, multiple path propagation, interference, etc. However, as in many communication networks, one should not forget the potential for hacking the network, which may include bluejacking, bluebugging, bluesnarfing, bluesniping, or car whisperer, a technique for car handsfree devices attack. Considering the above, it was considered useful to test the capabilities of the two BT versions in real life, in similar conditions, with the target for future usage in transport and travel information systems, public transport management systems, and traveler on route guidance. With the expected increase in BT usage in the near future, this form of collecting information regarding traveler and passenger flow might be a promising technology for reducing sensor network complexity, energy consumption, and influence on the environment.
3. Concept of the System and Test Bed
3.1. Concept of the System
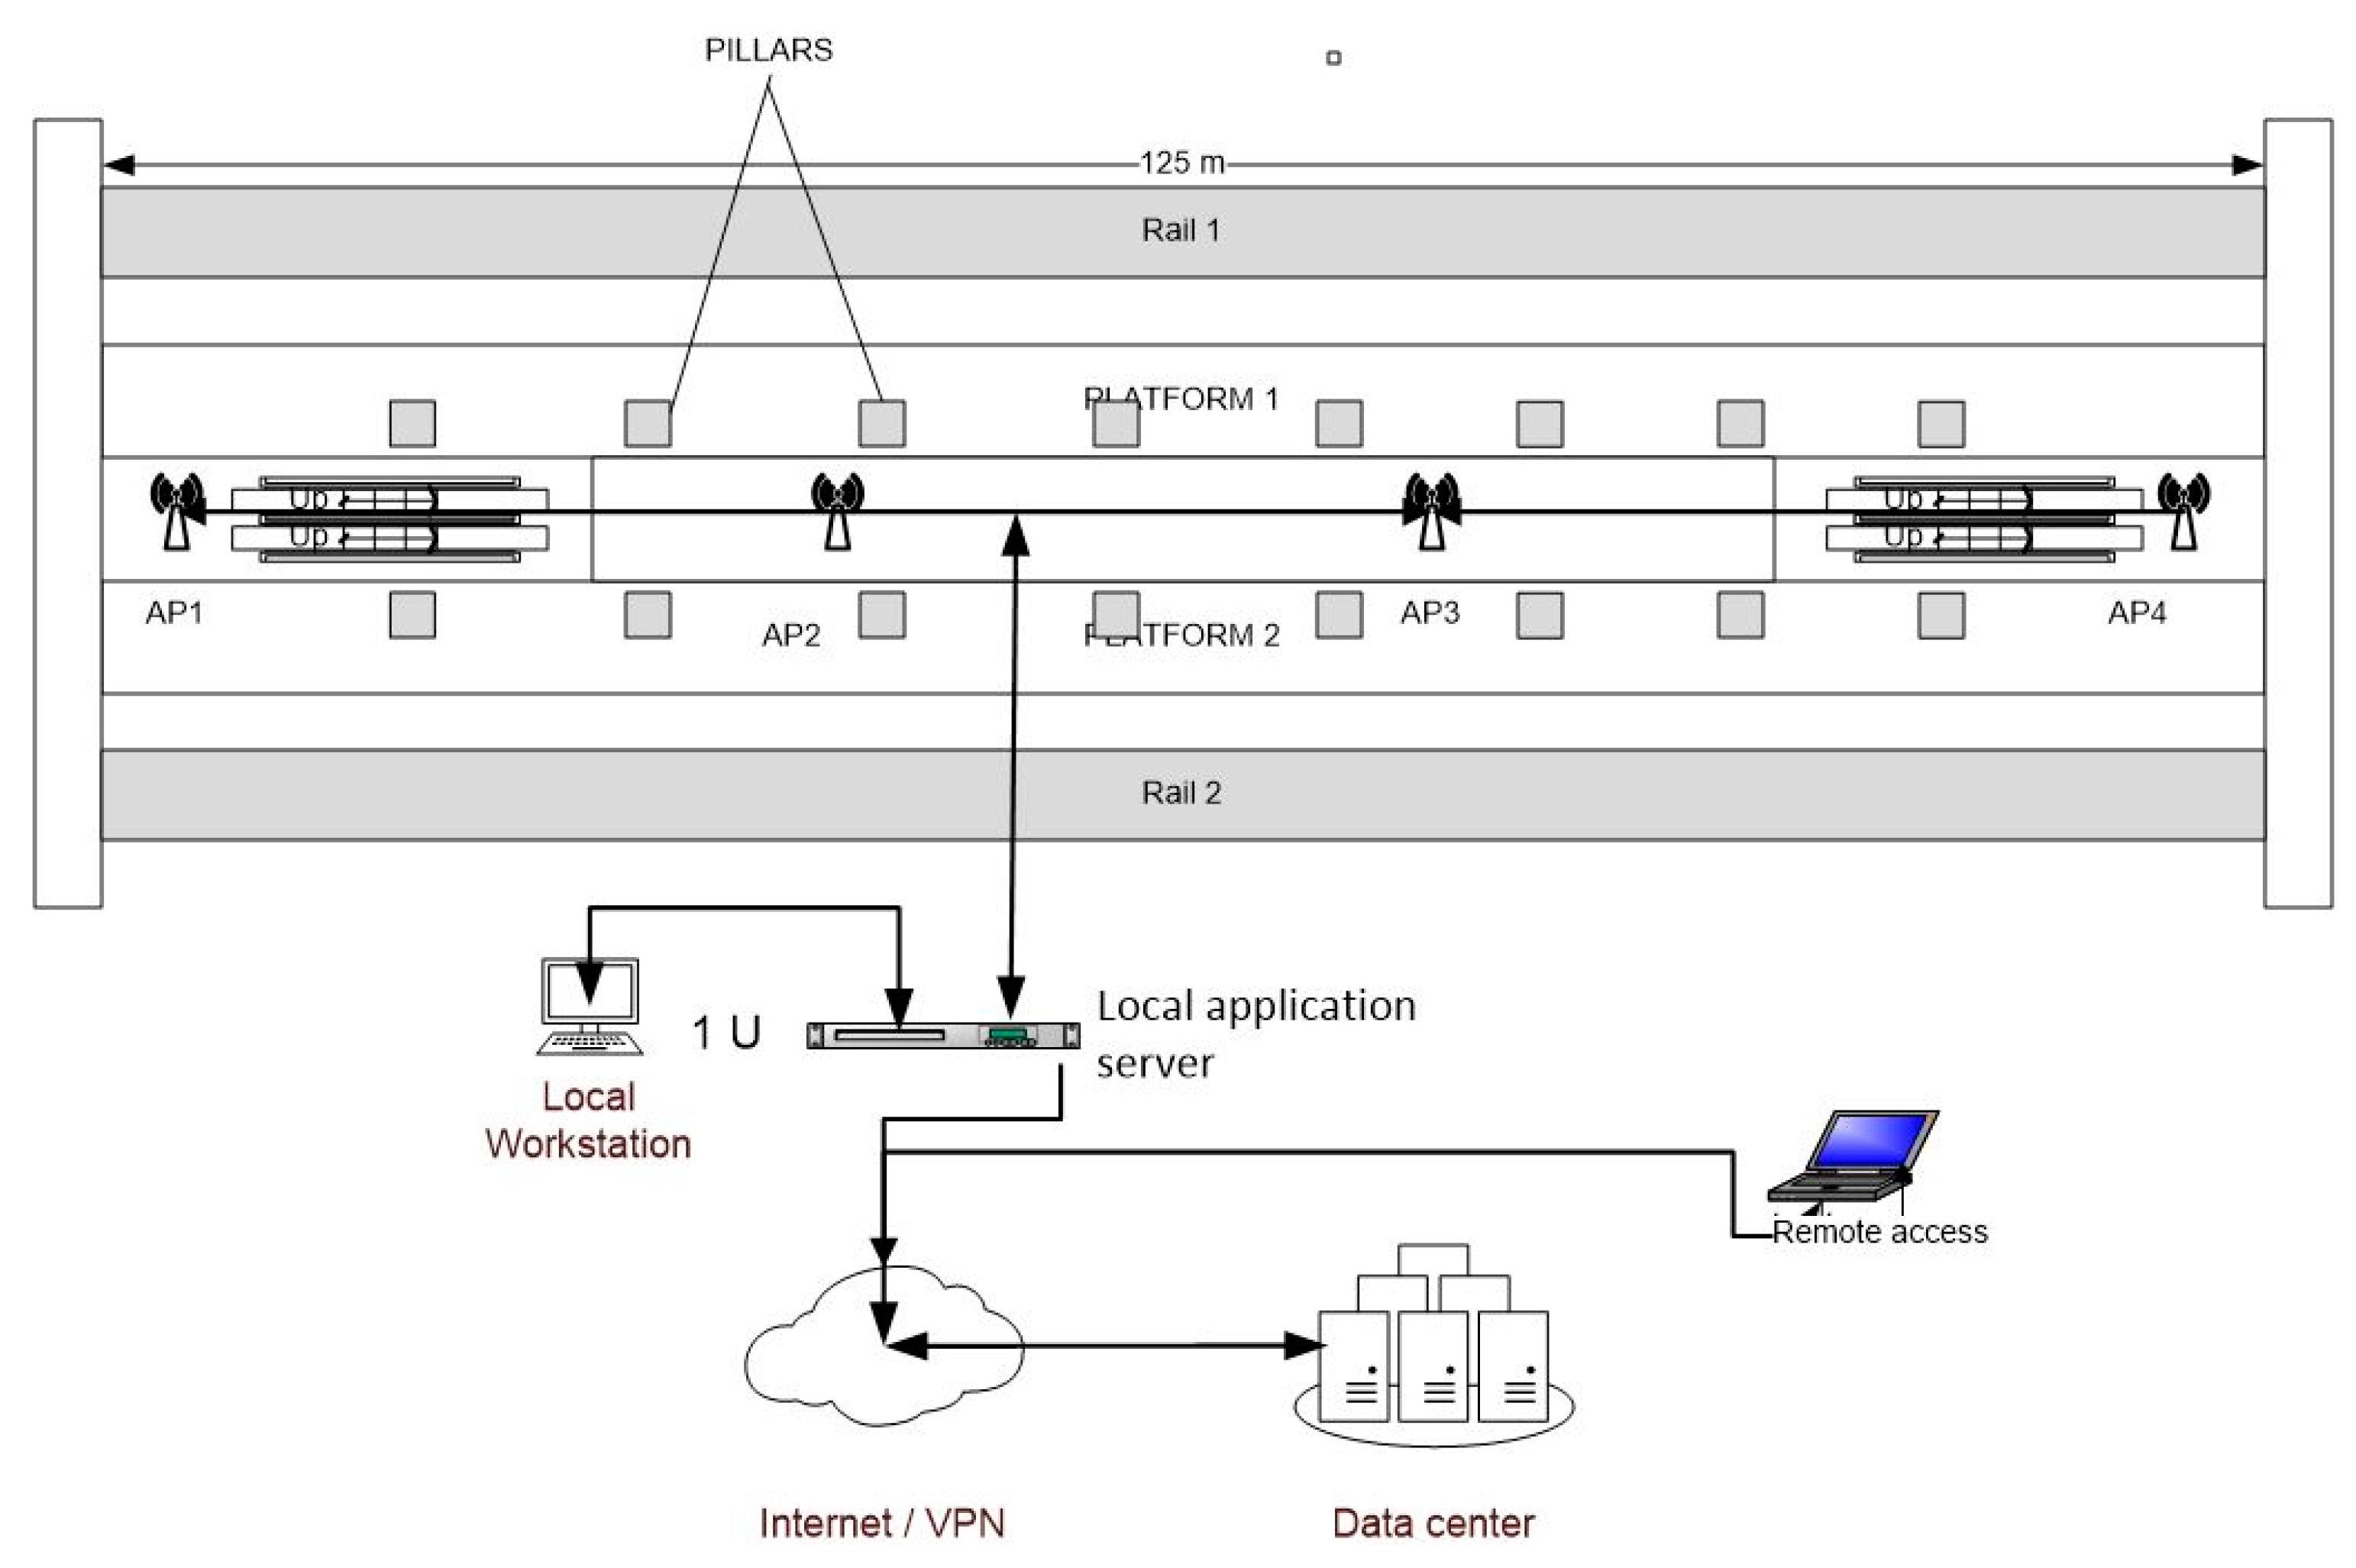
The proposed solution tries to improve the public transport attractiveness by better satisfying the traveler demand, i.e., by dynamically allocating subway trains according to the transport demand. It may also help in determining the actual density of travelers per vehicle, line, or period of the day. Another benefit of anonymously collecting the presence and origin–destination information of travelers is that the information systems may also include route guidance in subway stations, better distribution of travelers in wagons of subways for reducing agglomeration and delay in stations, etc. The proposed configuration of the system architecture for a generic subway station is presented in Figure 1.
In the previous schematic, specific Access Points (APs) are employed to detect nearby mobile BT devices. With respect to the received signal strength indicator (RSSI), the local application may detect the identity, position, and direction of travel of the nodes. The same setup can be installed in trains, indicating the estimated degree of passenger congestion and using the information to dispatch travelers to stations towards less agglomerated wagons, especially in rush hours. Due to the known position of APs, the travelers could also get location information and routing information to different destinations, other lines, and platforms, etc. However, there are some issues that must be considered when dealing with BT signal processing. Generally, the Bluetooth signal reception is shaped by the characteristics of the transmitter, receiver, and propagation medium. The propagation channel’s effects are related to path loss due to the propagation medium and any obstacles on the propagation path. In subway stations, the effect of the walls and the platforms manifests in some way as a waveguide, but there are other obstacles, such as pillars, persons, etc., that obstruct the direct propagation of signals and create reflections and multiple propagation paths. In such cases, propagation may strongly depend on reflections, diffractions, penetration, or even scattering effects on the path. If there is a direct path between the transmitter (Master unit) and the receiver (Slave), then a free space loss model can be applied (for example, in a subway station where the two recipients are in direct sight):
in which is the path loss for free space, a scaling factor, f the frequency of signal, d the distance between the two recipients, = 1 MHz, = 1 km [9].
Path loss is usually represented by the path loss exponent, with a value ranging from 2 to 4 (2 for the free space propagation conditions and 4 for loss propagation conditions), reaching even values of 4 to 6 for extremely difficult propagation conditions. In subways, the tunnels usually act like a waveguide, and the value 2 is recommendable for estimating the path loss (only for linear sections), while in stations or in curved sections of tunnels, the loss exponent might reach values of 3 to 5.
Usually, in these conditions, the path loss is given by:
in which is the path loss [dB], n is the path loss exponent, d is the distance between the transmitter and the receiver [m], and C is a constant to express the local environment losses. A similar formula, derived from the Friis Transmission formula has the following expression:
where represents the path loss [dB], d is the distance between the radio recipients in meters, and the wavelength [m]. For more difficult environment configurations, a more appropriate model is Egli’s, which predicts the total path loss for a point-to-point connection, usually suitable for cellular-type communications:
where is the gain of the transmitter antenna, is the gain of the receiver antenna, are the heights of the transmitting, respectively receiving antennas, d is the distance between the two recipients, and f is the frequency [10].
3.2. Test Bed
The tests were performed in two different locations:
- Outdoors for testing the open field propagation conditions, in a comparison between the Bluetooth 4.x and Bluetooth 5.0 technologies;
- Indoors, in a subway station (“Politehnica” on M1 metro line in Bucharest, Romania).
In the first part of the tests, an outside environment was chosen in an open space to comparatively determine the performances of the two technologies in similar field of view (FOV) conditions. The location selected did have a direct view between the transmitter and the receiver, but it was also surrounded by trees—which caused additional signal power losses. The equipment employed was composed of two Samsung mobile phones (A5 2016 and S8), a Motorola One Vision, and a Nokia 8. Bluescan software was used for determining RSSI levels. A specific jpg file with 1.5 MB was also set for transmission between the master terminal and the slave, counting the total transmission time.
4. Results of the Tests and Analysis
4.1. Open Field Tests
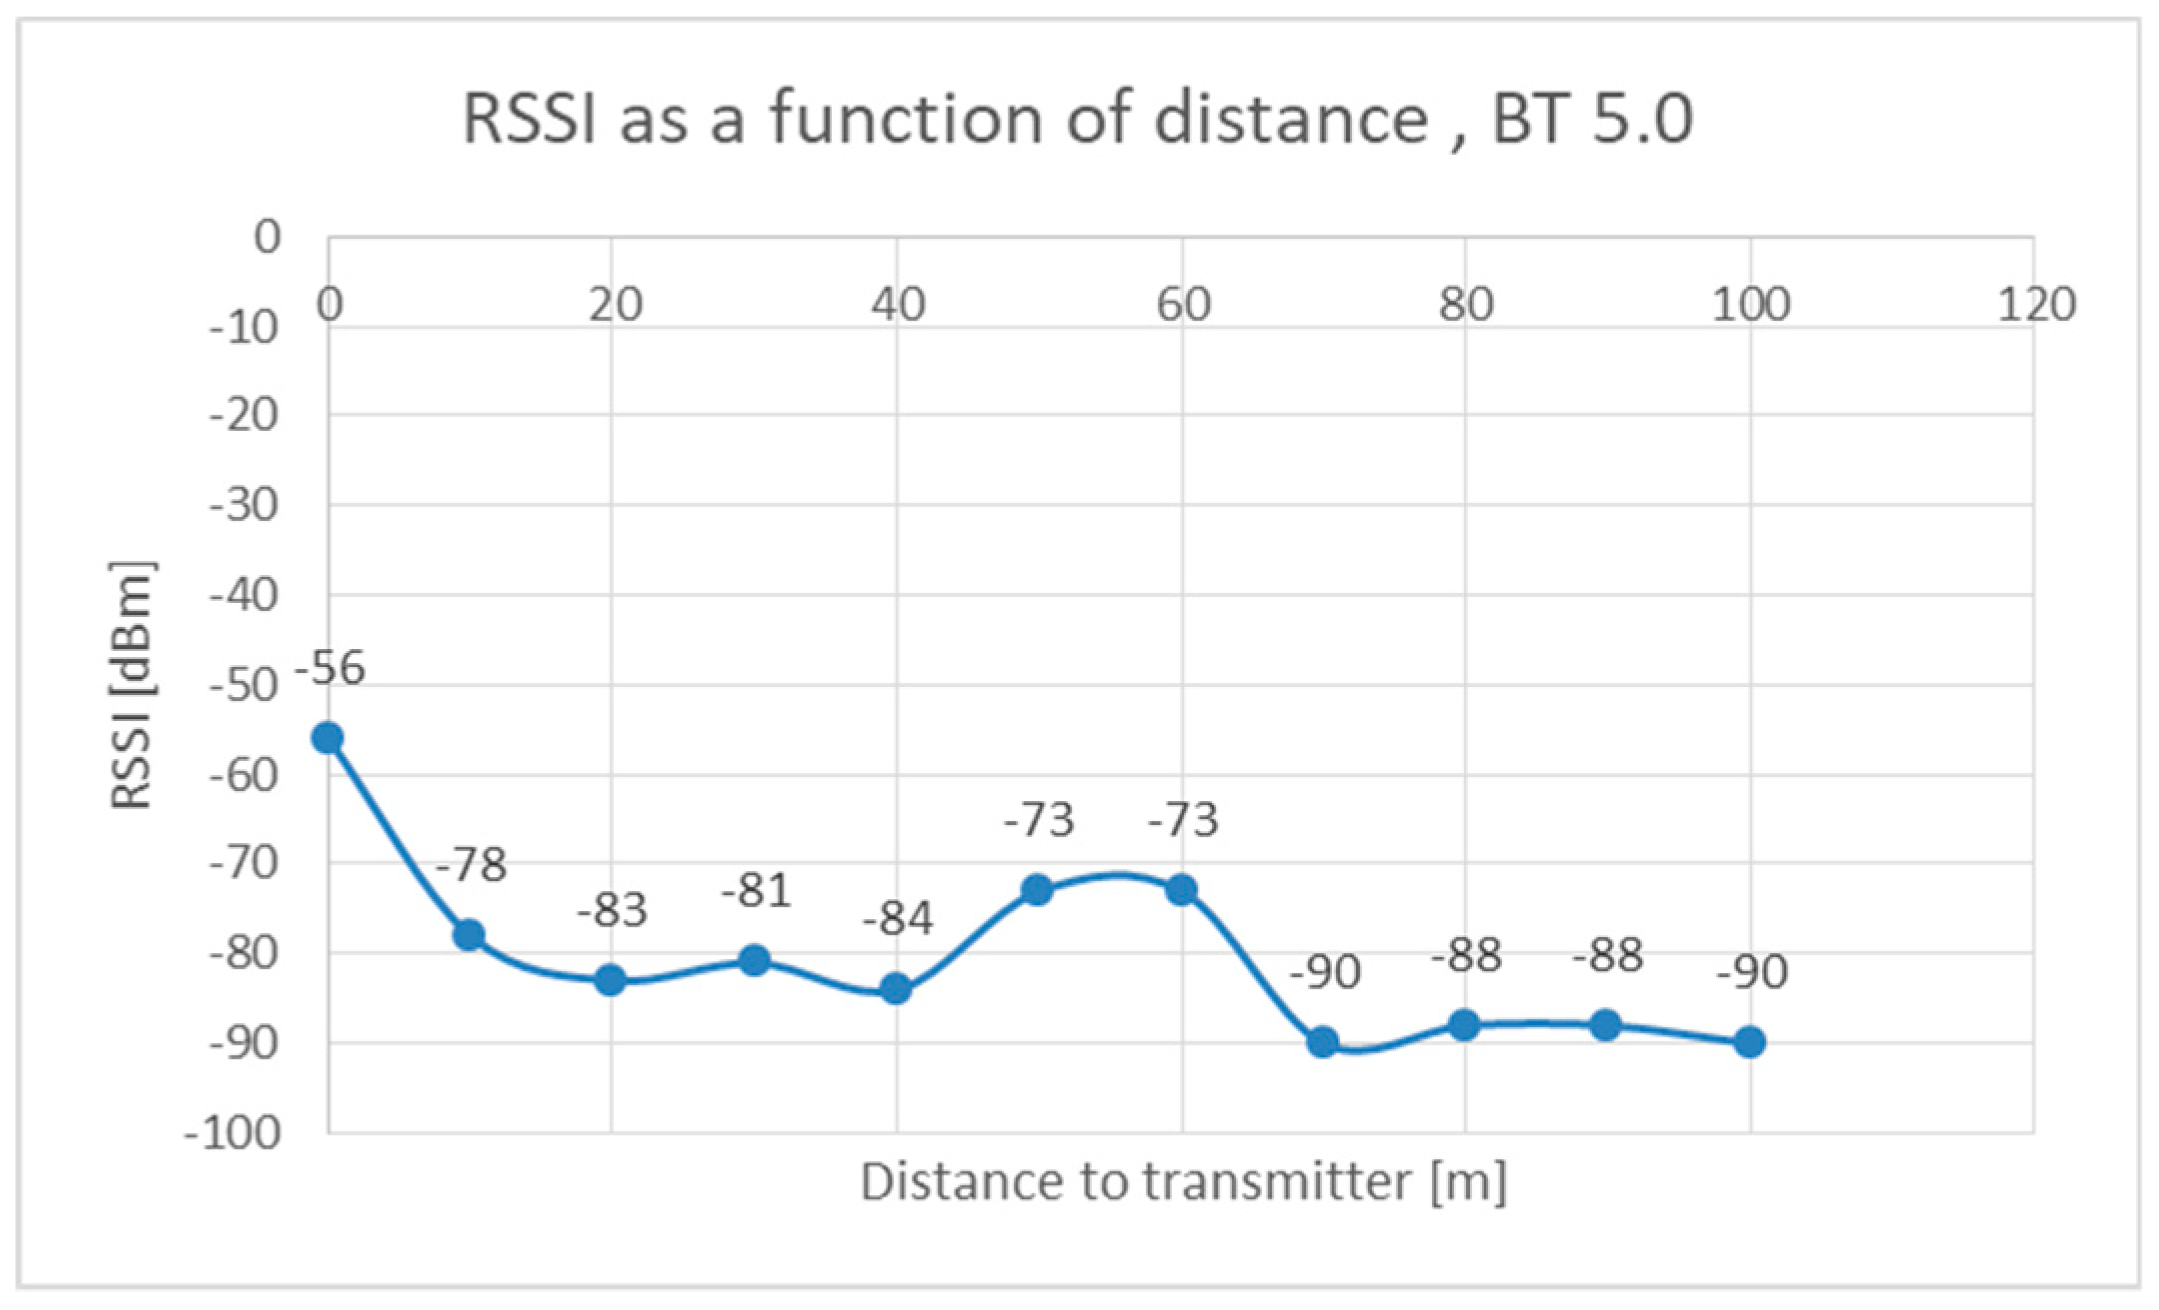
The distance between the master unit and the slave was divided into steps of 10 m each, and measurements were performed for every step. To eliminate variations in signal level, sets of three measurements were performed for each distance slot. The results were considered for the average RSSI value at every distance slot. The first part of the experimental tests is presented in the diagrams below.
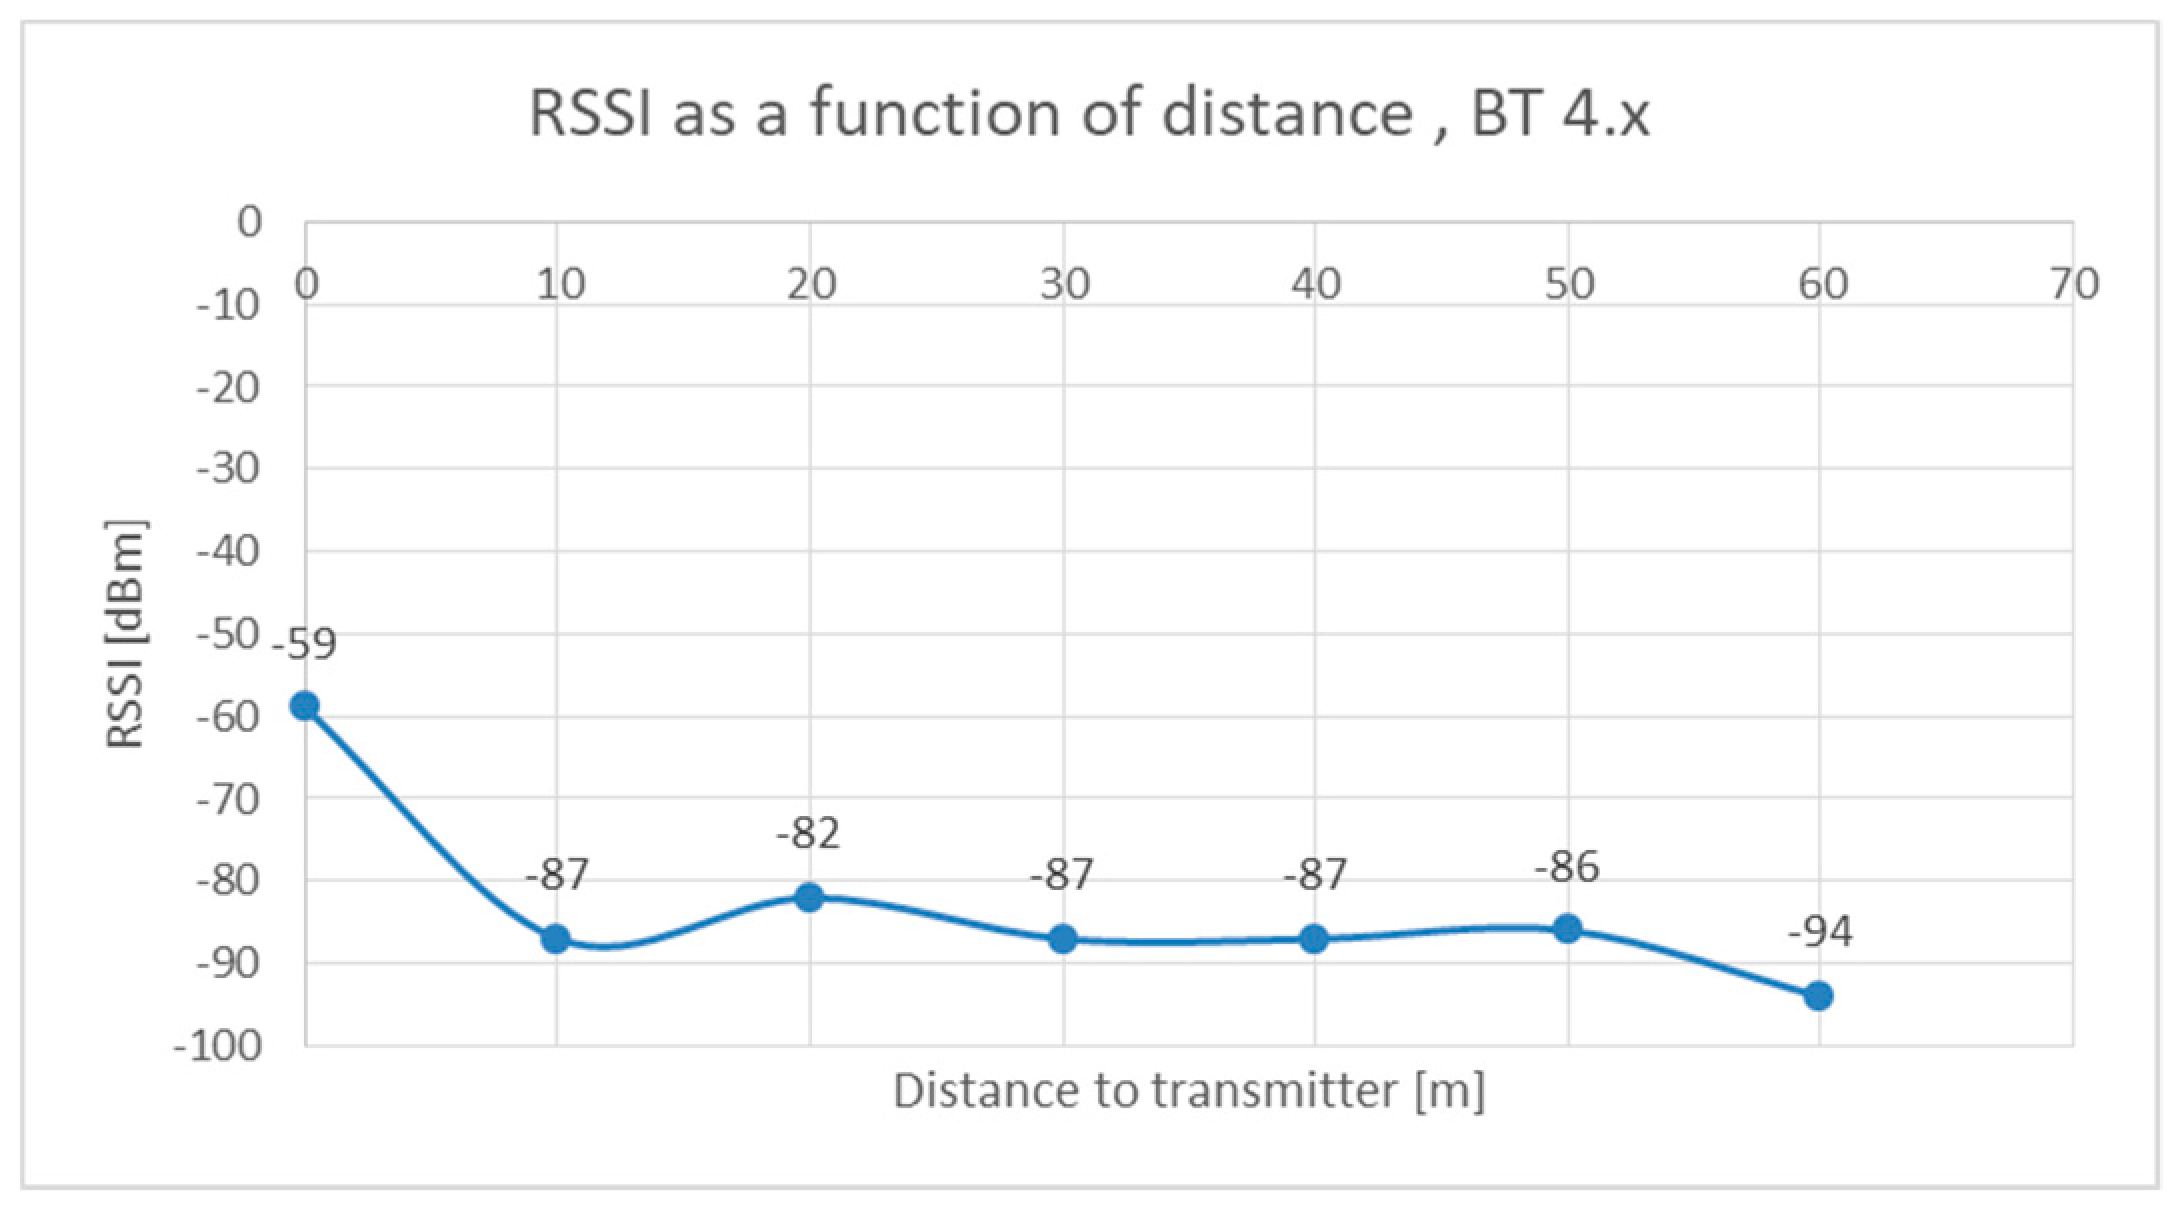
As shown in Figure 2 and Figure 3, the signal strength decreased non-linearly with the distance from the transmitter, having a more abrupt near-field variation (usually the first 10–20 m), then maintaining a relatively constant (small decrease) on longer distances. However, here the advantages of the BT 5.0 technology became obvious, as the connection between the two devices could be maintained on considerably longer distances compared with BT4.x (almost twice the distance). Still, the BT 5.0 showed more variability in signal strength over the distance. For determining the latency of the connection in the two types of Bluetooth technologies, a specific jpg file with the length of 1.5 MB was sent from the master station to the slave, and the transmission time until completion was measured. The average data speed can be then computed by:
where Q represents the amount of data transmitted and t the duration of the transmission.
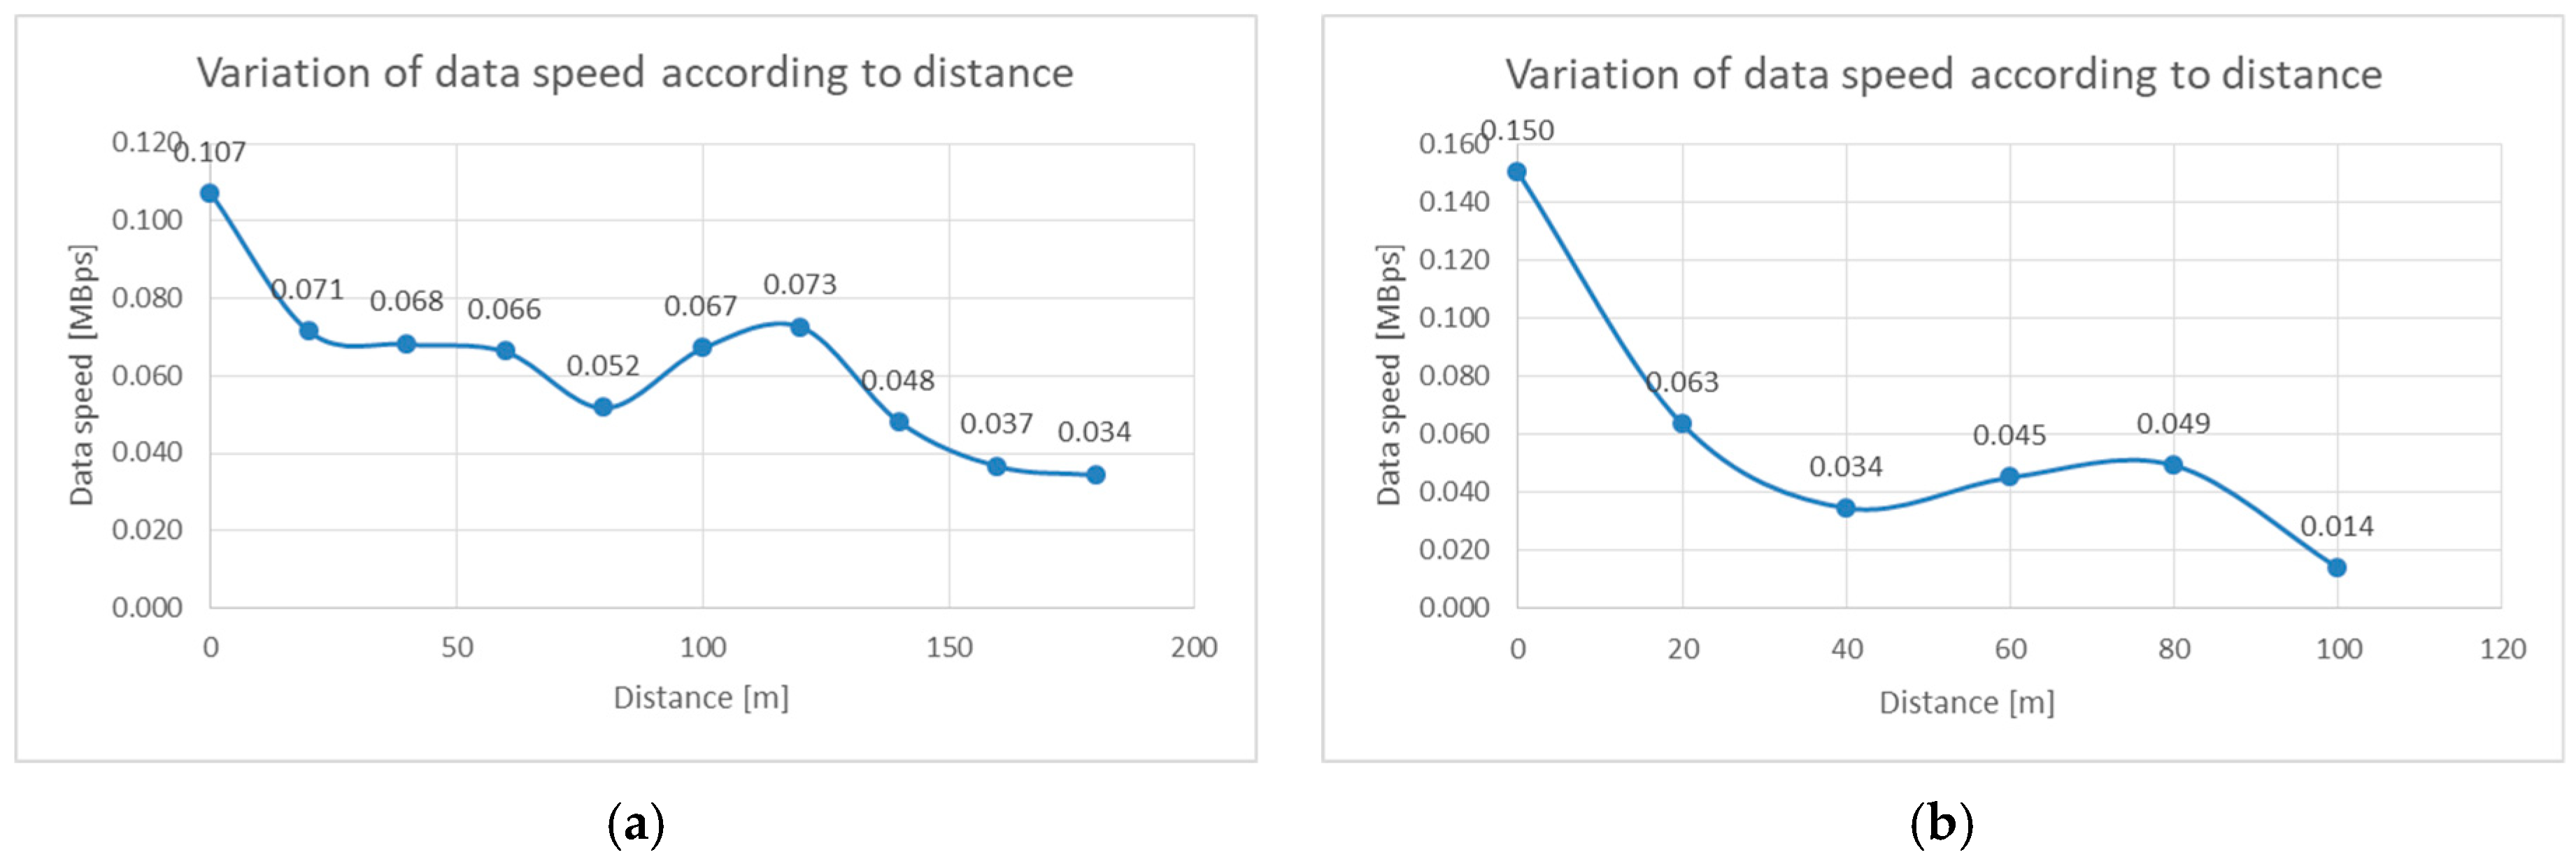
The results for BT5.0 technology are presented in Figure 4a and those for BT 4.x in Figure 4b. There was a more significant drop in speed for BT 4.x once the distance to the transmitter increased, which gave the BT 5.0 the advantage of a higher data rate at longer distances, reaching around 170 m from the transmitter. In addition, as in diagrams shown in Figure 5a,b, the variation of the file transmission time was less for the Bluetooth 5 than for its previous version. As the tests showed, it appeared that BT 4.0 experienced a more abrupt drop in speed over the first 40 m, then the slope was relatively constant for the next 40 m. Instead, the BT 5.0 showed better stability in data rate on much larger distances, passing over 100 m from the transmitter.
While there were, probably, some inherent specificities due to the test conditions, it appears from the open field measurements that the BT5.0 technology is capable of longer connections and is more reliable (Figure 6a), and it is able to deliver higher data rates than BT4.x. As it can be observed from Figure 6b, in the tests performed, on distances that exceed 80 m, the transmission duration varies very much, a fact which creates more instability of the data link. Due to its backward compatibility, this technology is recommendable for detecting nearby discoverable devices and for processing origin–destination information of the BT nodes.
4.2. Tests Performed in the Subway Station
For consistency, the same tests have been carried on in the subway station “Politehnica” from the M1 line in Bucharest. The test conditions changed accordingly: This station has lateral pillars, and it has a rectangular shape. The length of the platforms in this station is 145 m, and it has two lateral rows of pillars, separated 12 m from each other. The tests performed indoors were affected by the configuration of the environment and by the sporadic presence of people on platforms or trains that arrived at the station. The set of employed equipment and software was the same as in the previous batch of outdoor tests. Results are presented in the following diagrams.
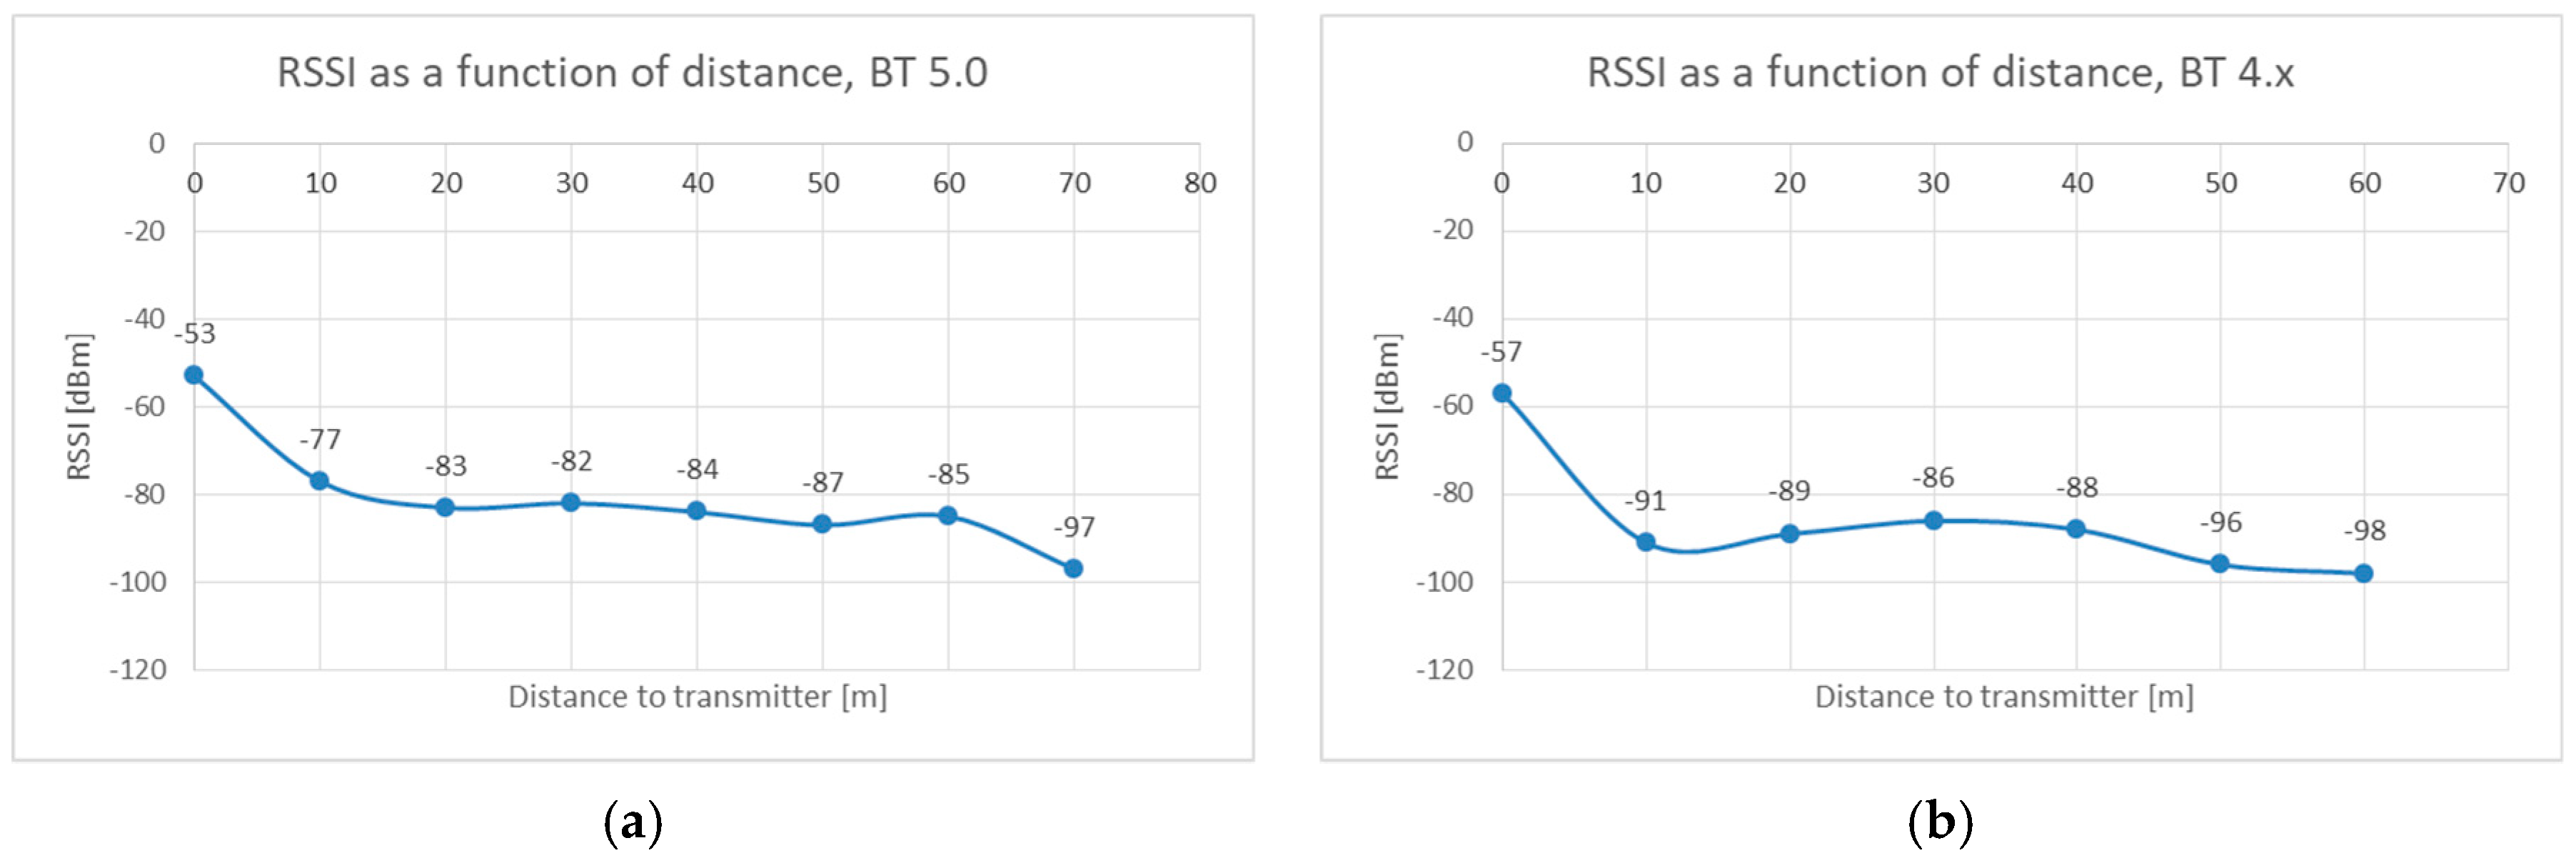
It appeared for tests performed in indoor conditions, the two versions of Bluetooth behaved in a comparable manner, in what concerns the attenuation of signals. The maximum length reached for a reliable communication was 60 m, even longer for BT4.x (Figure 7a,b). For the latency tests, the same jpg file was employed in both conditions. The results are presented in Figure 8a,b.
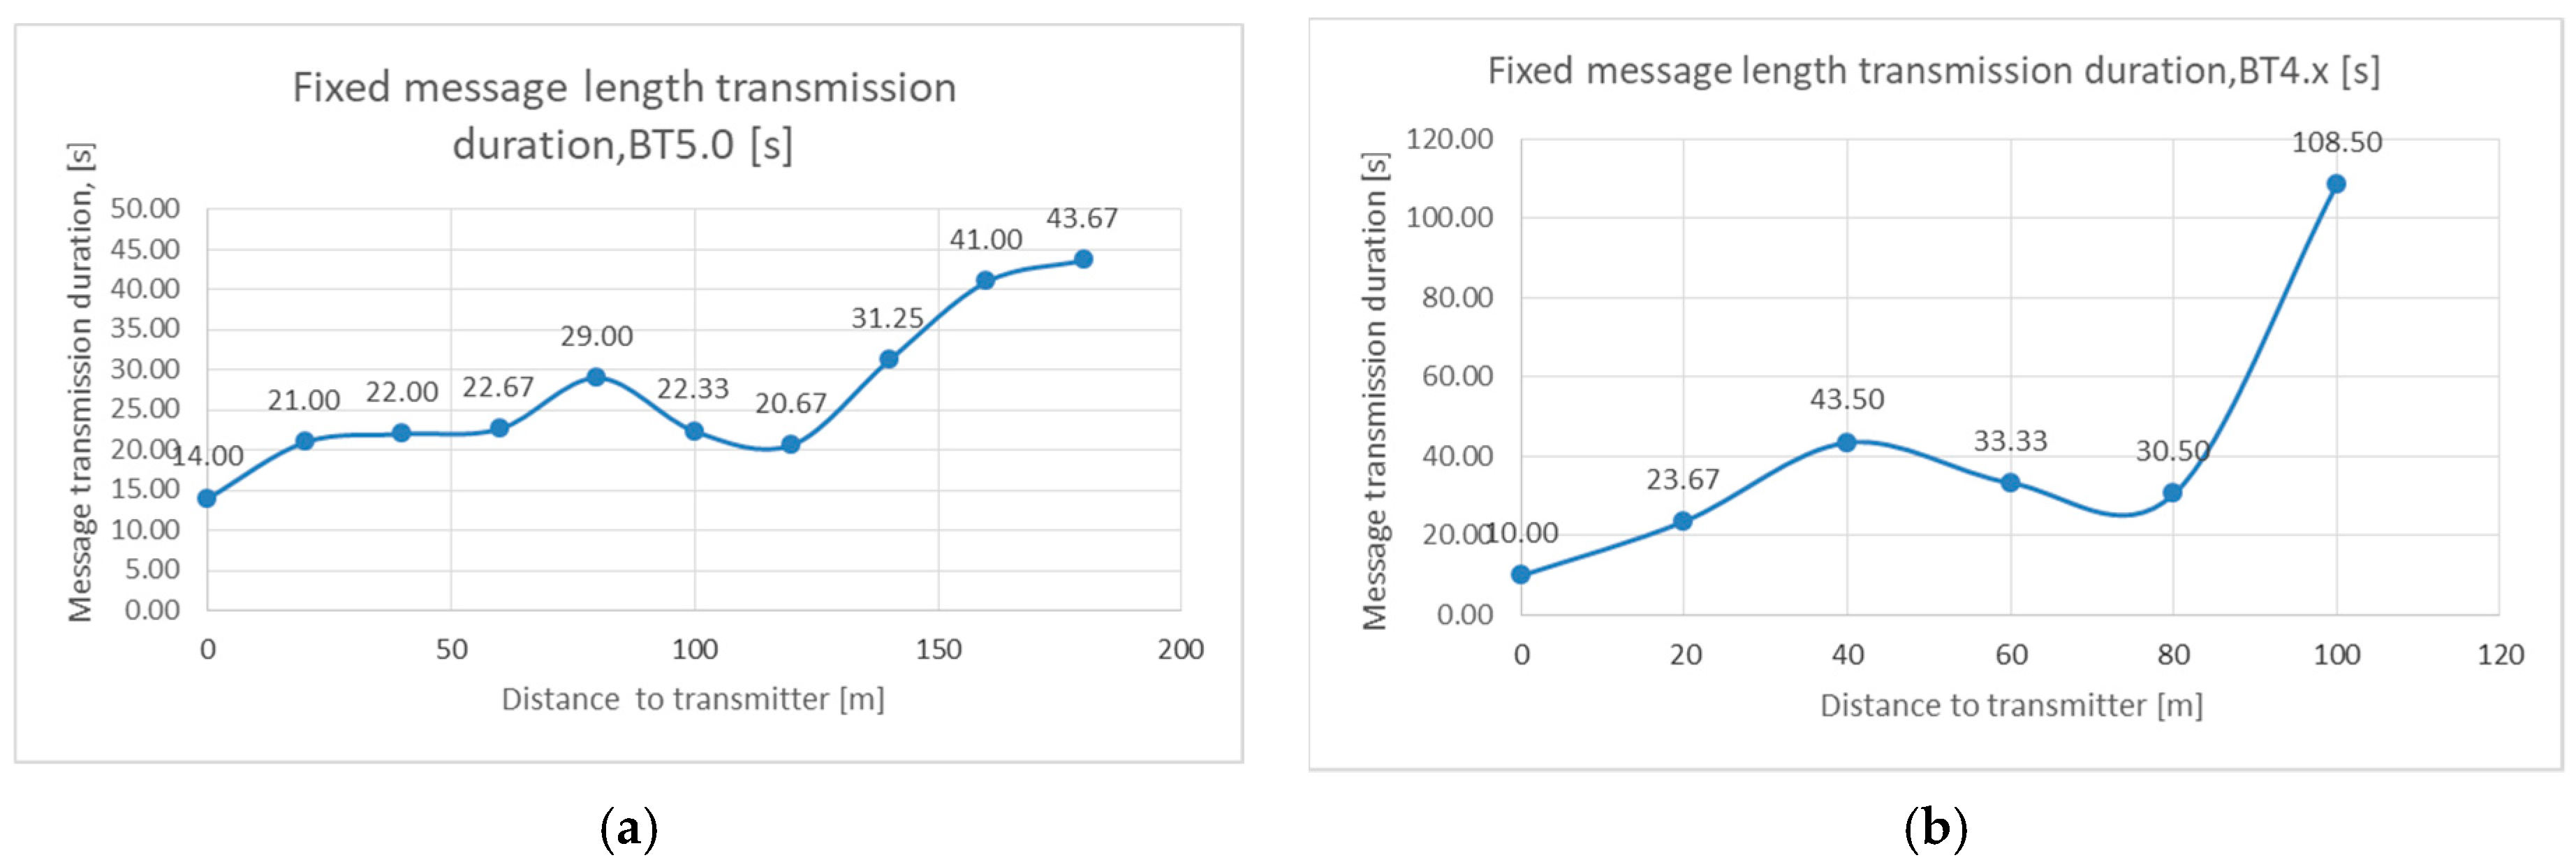
Bluetooth 5.0 kept decent values for transmitting the fixed-length message for approximately the same distances as the Bluetooth 4.x version, which even reached longer distances between the communicating devices while in difficult conditions (the transmission duration reached a whooping value of 205 ms for a 1.5 MB file).
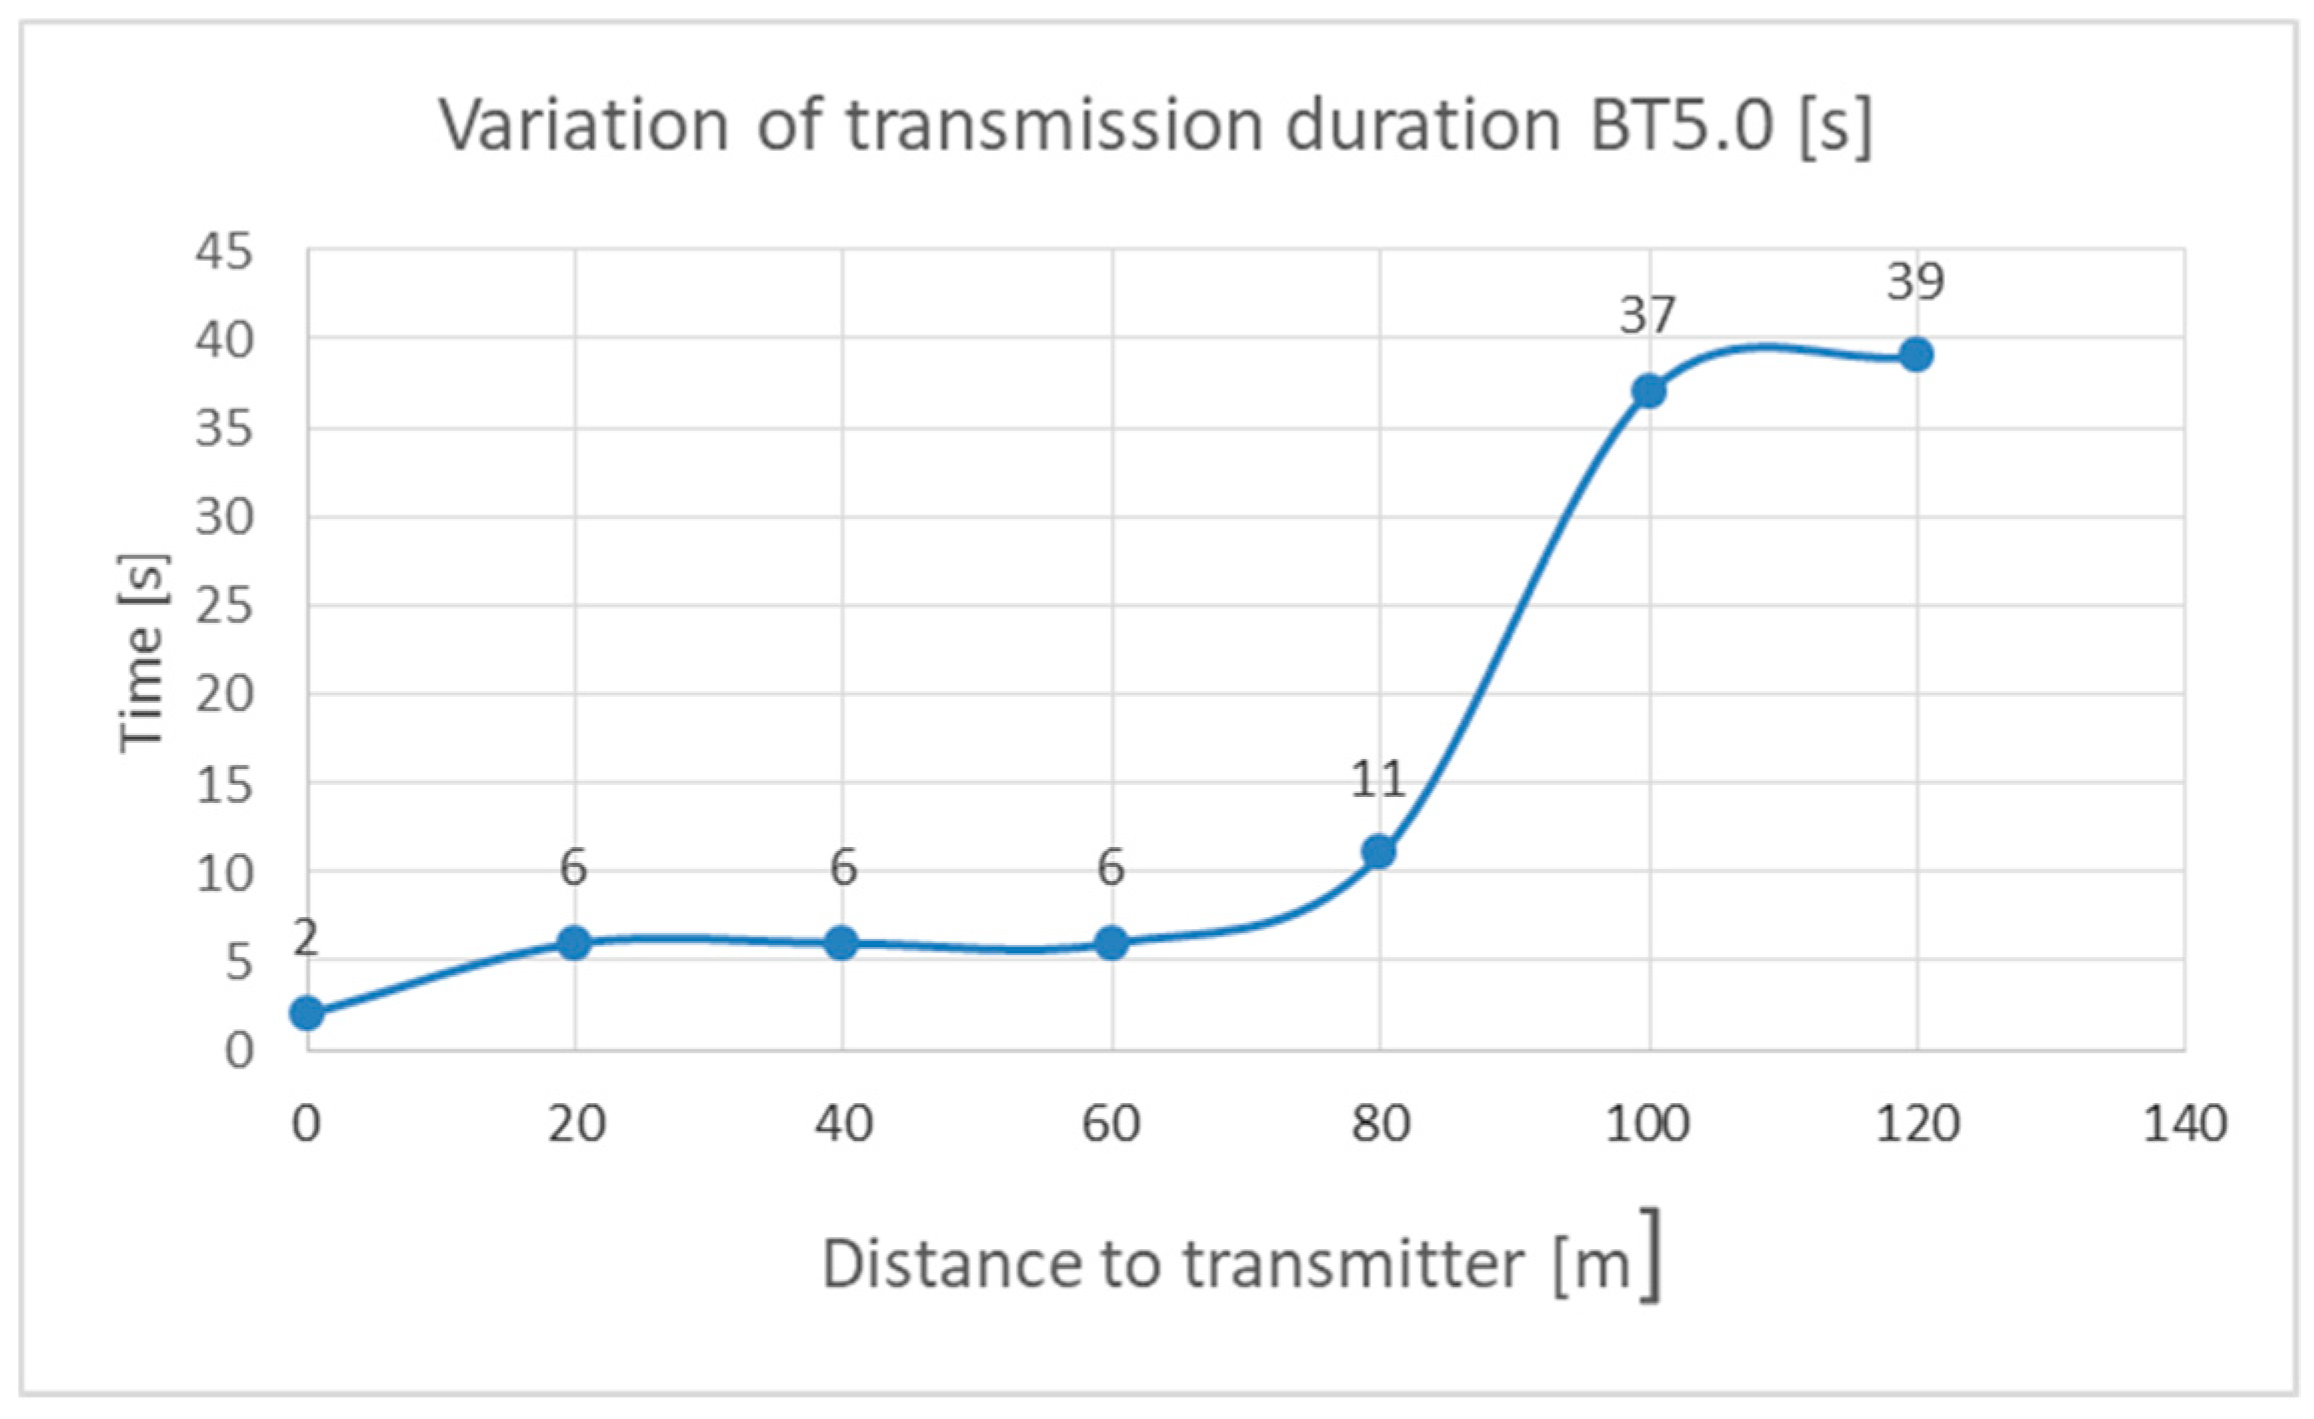
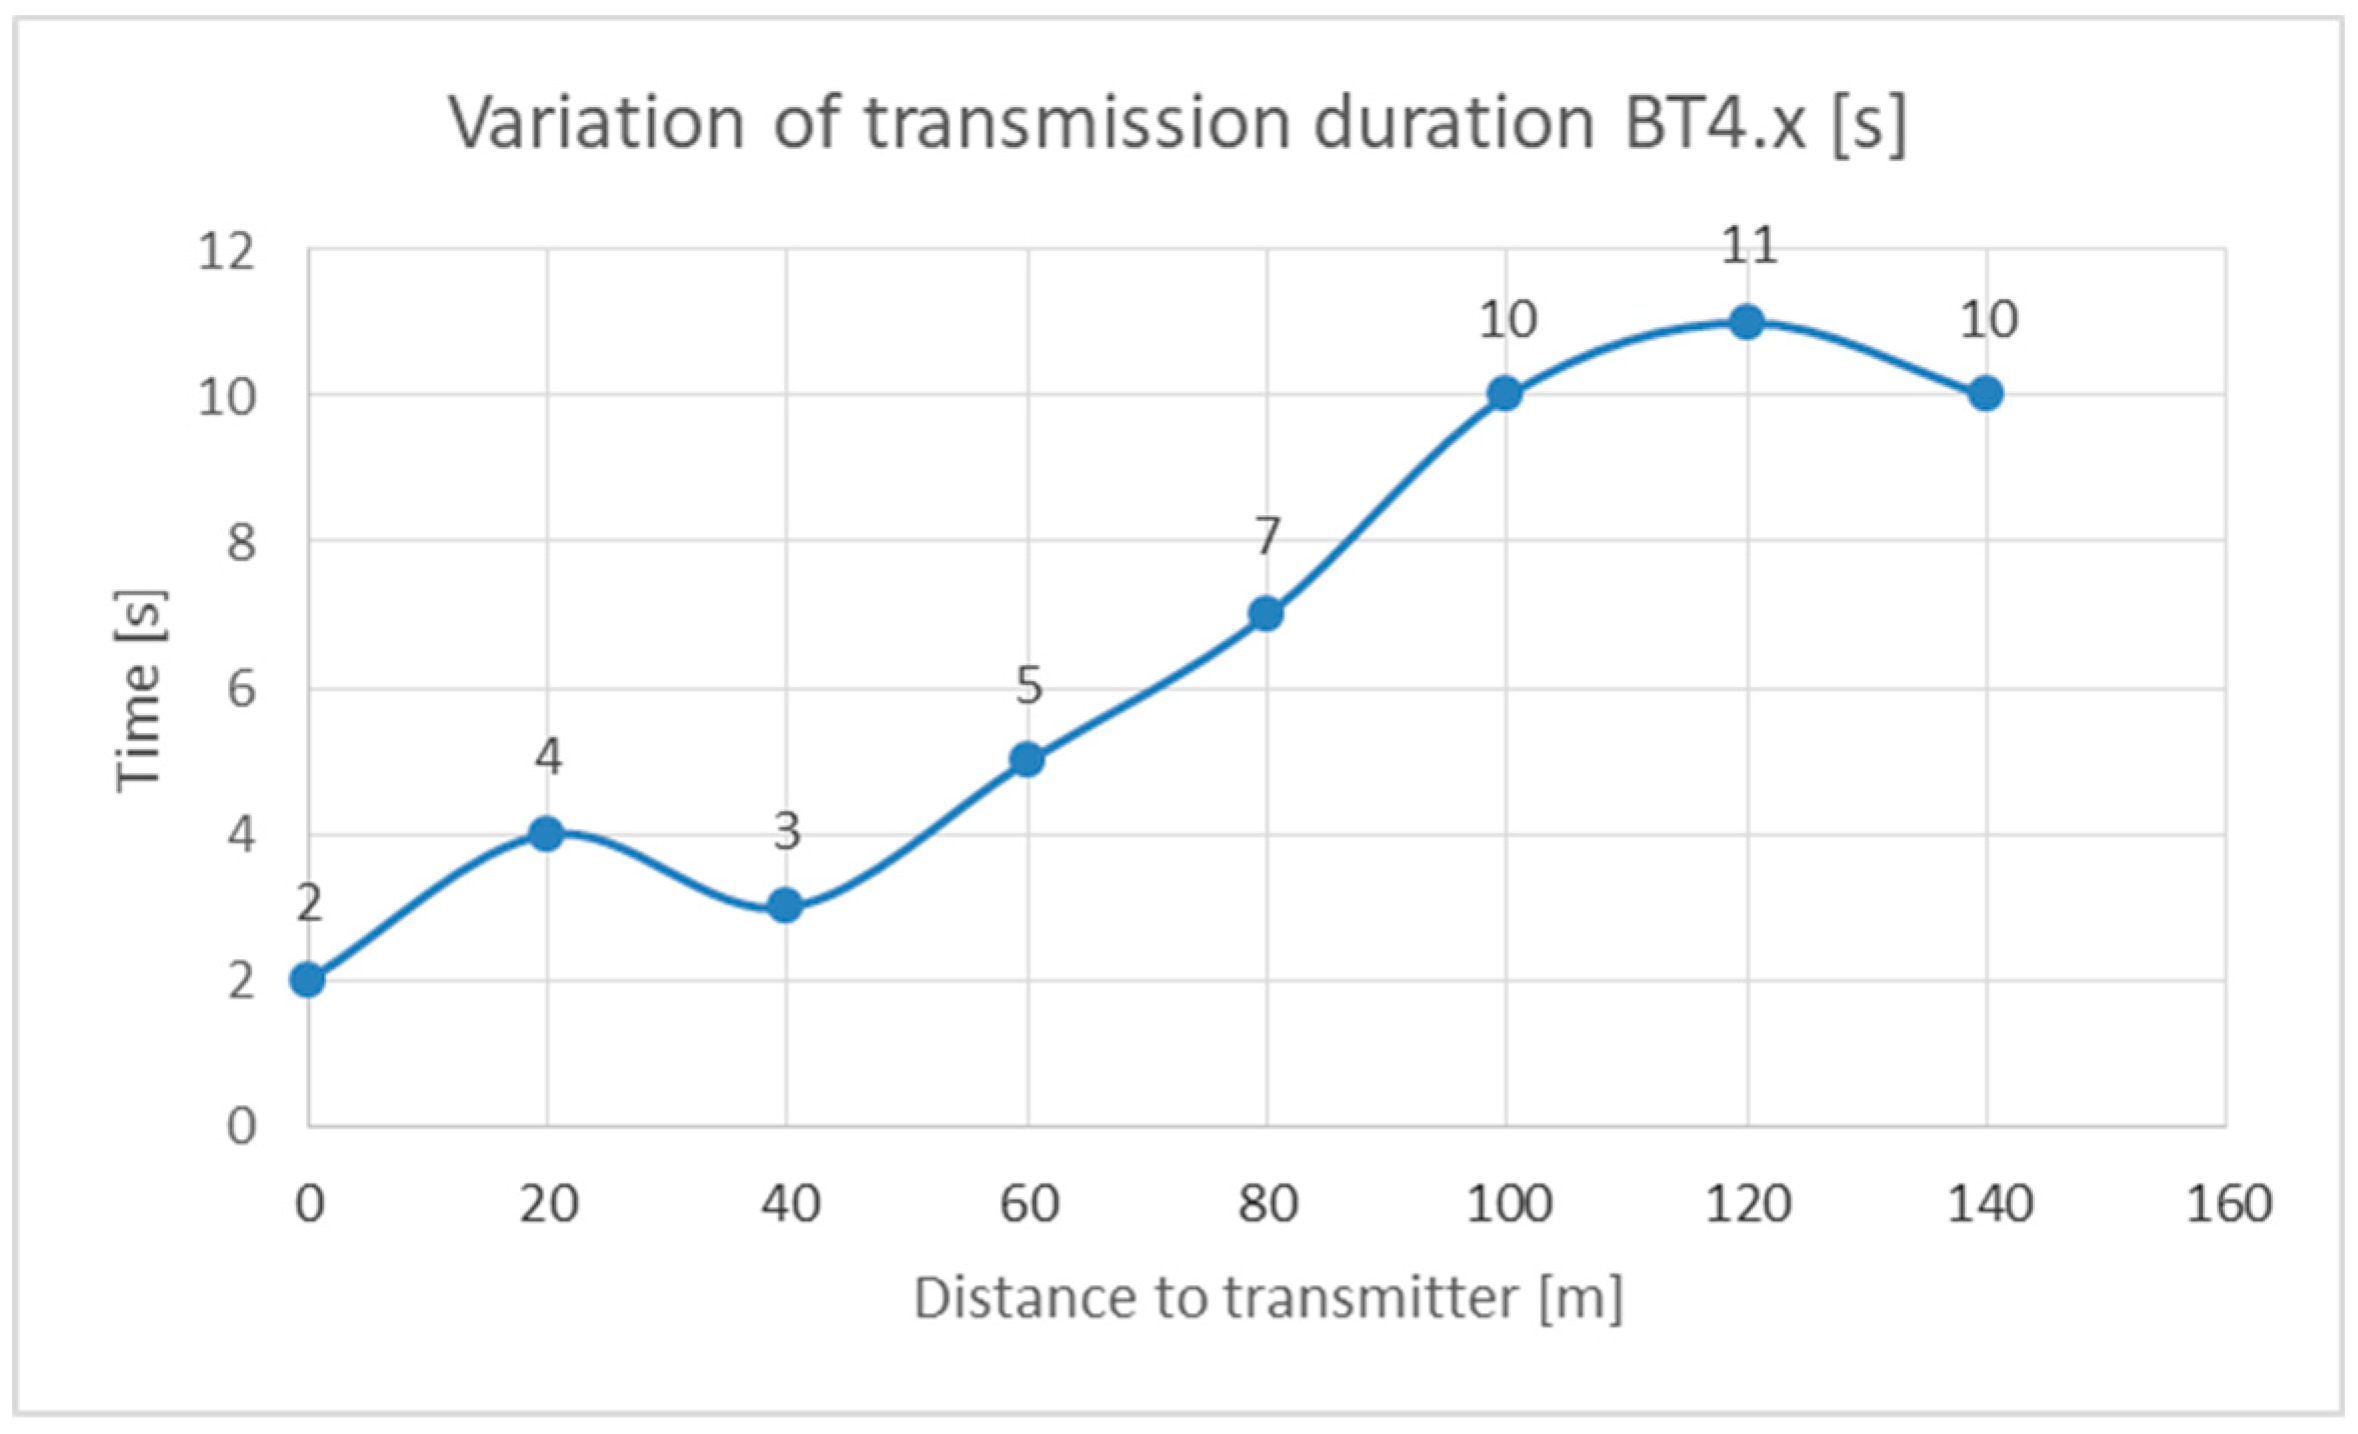
For Figure 9, after a distance of 80 m to the transmitter, the reliability of the link drops significantly; however, messages could still be transmitted up to 120 m, with sporadic interruptions, depending on the presence of trains at the station and the number of travelers on platforms.
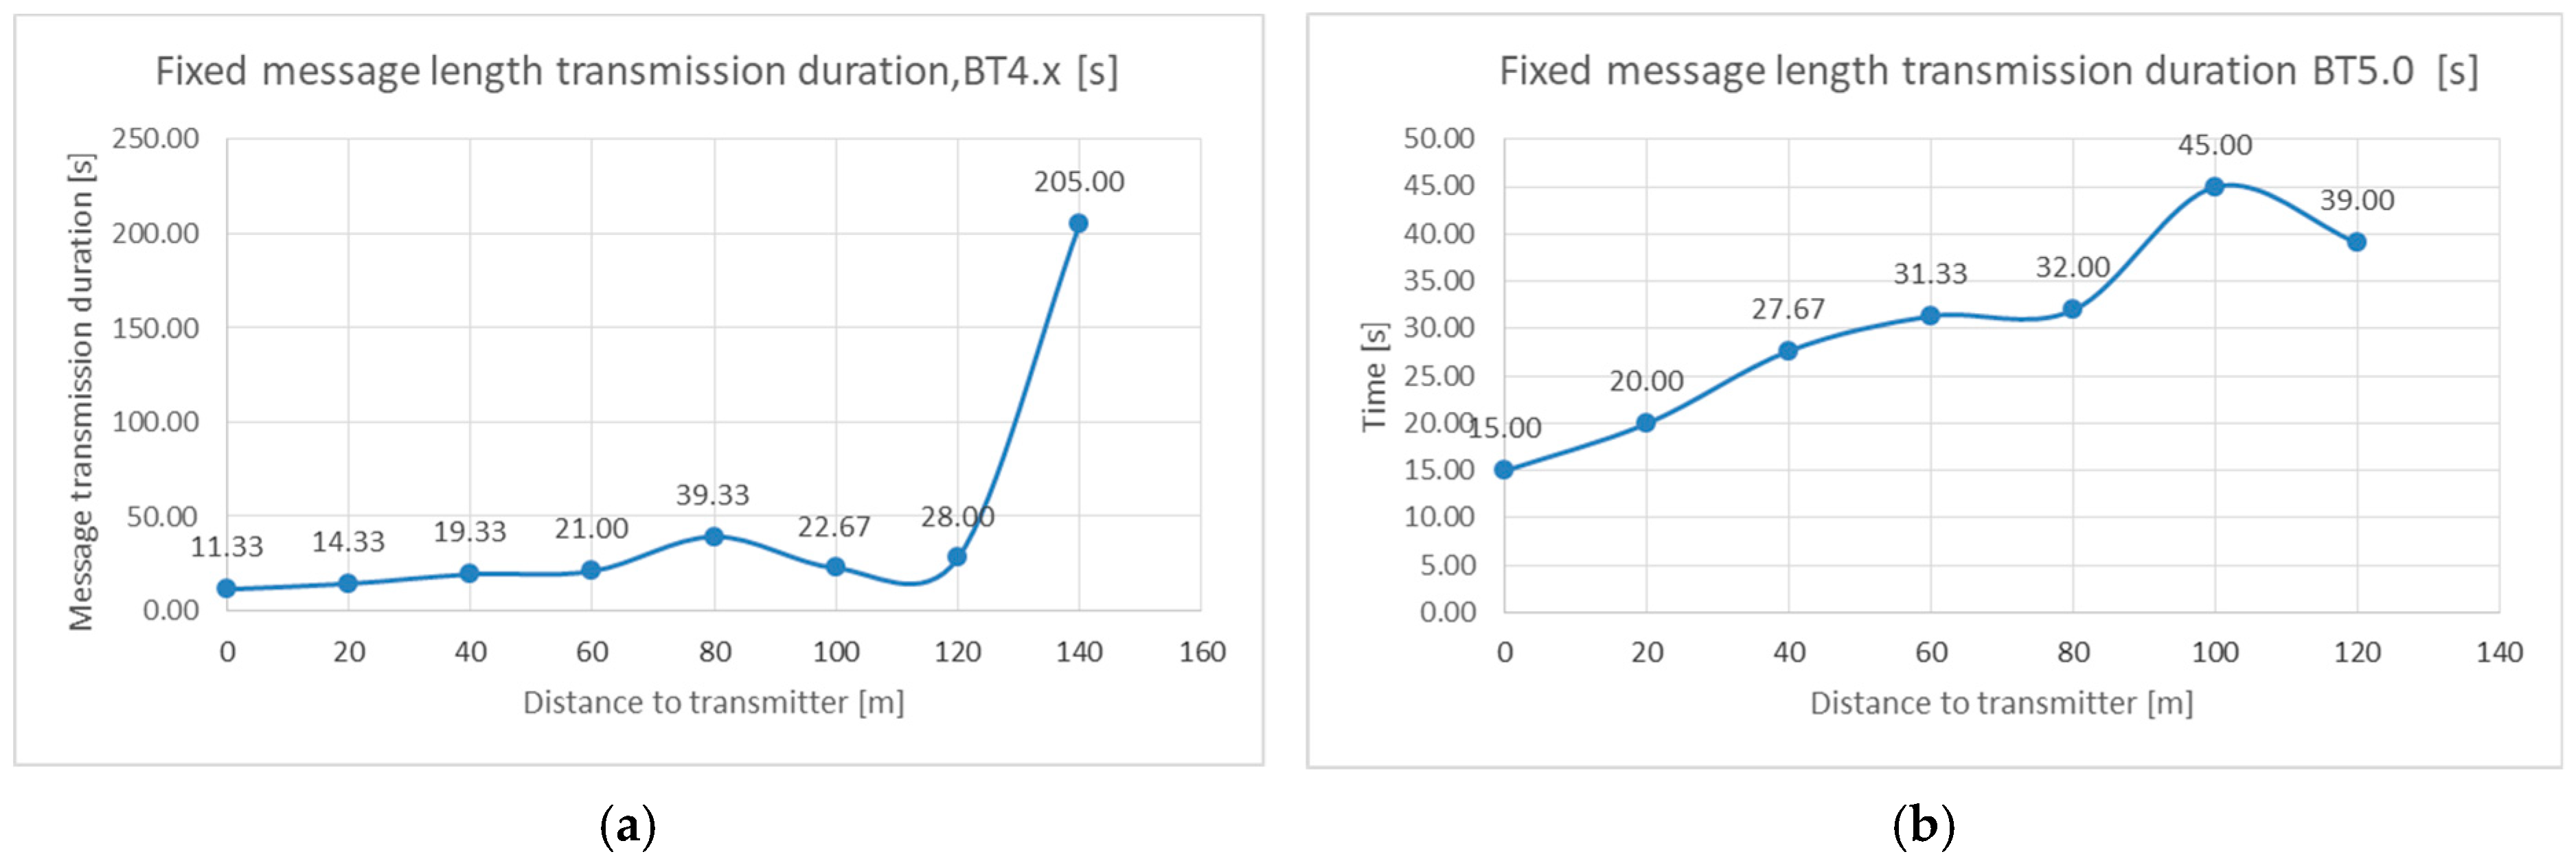
The Bluetooth 4.x technology appeared to behave better in indoor conditions (Figure 10), compared with BT5.0, having more constant transmission time for fixed-length messages. The link could be maintained up to 140 m.
5. Conclusions
For both Bluetooth technologies, the indoor environment created different conditions for the propagation of radio signals. It was even possible, in certain cases, for the propagation at longer distances, to create a sort of a “waveguide” effect, and the reception areas were separated into two zones: the so-called “near field” where the RSSI levels dropped on an exponential trend according to the open field path loss model, and a second, much longer zone, where RSSI levels had a variable, but constant within some limits, levels for longer distances, called “far field propagation”. For wide indoor areas, the Bluetooth 5.0 was more consistent in propagation distances and latency. Therefore, was more suitable for the detection of discoverable devices than Bluetooth 4.x. However, due to backward compatibility, the BT5.0 is also capable of detecting and communicating with BT4.x devices. In this case, considering the architecture of the proposed system, presented in Figure 1, it is recommendable that the Access Points should be provided with BT5.0 version for achieving better detection results.
Funding
This research received no external funding.
Conflicts of Interest
The authors declare no conflict of interest.
References
- Ruppe, S.; Junghans, M.; Haberjahn, M.; Troppenz, C. Augmenting the Floating Car Data Approach by Dynamic Indirect Traffic Detection. Procedia Soc. Behav. Sci. 2012, 48, 1525–1534. [Google Scholar] [CrossRef]
- Sharifi, E.; Shamedi, M.; Haghani, A.; Sadrsadat, H. Analysis of Vehicle Detection Rate for Bluetooth Traffic Sensors: A Case Study in Maryland and Delaware. In Proceedings of the 18th World Congress on Intelligent Transport Systems, Orlando, FL, USA, 16–20 October 2011. [Google Scholar]
- Collotta, M.; Pau, G.; Talty, T.; Tonguz, O.K. Bluetooth 5: A Concrete Step Forward toward the IoT. IEEE Commun. Mag. 2018, 56, 125–131. [Google Scholar] [CrossRef]
- Abbot-Jard, M.; Shah, H.; Bhaskar, A. Empirical Evaluation of Bluetooth and Wi-Fi Scanning for Road Transport. In Proceedings of the Australasian Transport Research Forum 2013 Proceedings, Brisbane, Australia, 2–4 October 2013. [Google Scholar]
- Diaz, J.J.V.; Gonzalez, A.B.R.; Wilby, M.R. Bluetooth Traffic Monitoring Systems for Travel Time Estimation on Freeways. IEEE Trans. Intell. Transp. Syst. 2016, 17, 123–132. [Google Scholar] [CrossRef]
- Shlayan, N.; Kurcku, A.; Ozbay, K. Exploring Pedestrian Bluetooth and WiFi Detection at Public Transportation Terminals. In Proceedings of the 2016 IEEE 19th International Conference on Intelligent Transportation Systems (ITSC), Rio de Janeiro, Brazil, 1–4 November 2016. [Google Scholar]
- Bachmann, C.; Roorda, M.J.; Abdulhai, B.; Moshiri, B. Fusing a Bluetooth Traffic Monitoring System with Loop Detector Data for Improved Freeway Traffic Speed Estimation. J. Intell. Transp. Syst. 2012, 17, 152–164. [Google Scholar] [CrossRef]
- Manering, F.; Bullock, D.M. Analysis of Freeway Travel Time Variability Using Bluetooth Detection. J. Transp. Eng. 2011, 137, 697–704. [Google Scholar]
- Akanni, A.O.; Odepian, K. Comparative Analysis of Propagation Pathloss and Channel Power of VHF and UHF Wireless Signals in Urban Environment. Int. J. Res. Innov. Appl. Sci. 2019, IV. [Google Scholar]
- Mardeni, R.; Pey, L.Y. The Optimization of Okumura’s Model for Code Division Multiple Access (CDMA) System in Malaysia. Eur. J. Sci. Res. 2010, 45, 508–528. [Google Scholar]
Figure 1.
Proposed generic architecture for the subway setup of Bluetooth (BT) sensors.

Figure 2.
Received signal strength indicator (RSSI) average levels according to distance from the master device for Bluetooth 5.0.
Figure 2.
Received signal strength indicator (RSSI) average levels according to distance from the master device for Bluetooth 5.0.

Figure 3.
RSSI average levels according to distance from the master device for Bluetooth 4.x.

Figure 4.
(a) Variation of data speed for BT5.0, according to the distance to the transmitter; (b) Variation of data speed for BT4.x, according to the distance to the transmitter.
Figure 4.
(a) Variation of data speed for BT5.0, according to the distance to the transmitter; (b) Variation of data speed for BT4.x, according to the distance to the transmitter.

Figure 5.
(a) Variation of transmission time for BT5.0 technology; (b) Transmission time for BT4.x technology.
Figure 5.
(a) Variation of transmission time for BT5.0 technology; (b) Transmission time for BT4.x technology.

Figure 6.
(a) Diagram showing the variation of transmission duration for BT5.0; (b) Diagram showing the variation of transmission duration for BT4.x.
Figure 6.
(a) Diagram showing the variation of transmission duration for BT5.0; (b) Diagram showing the variation of transmission duration for BT4.x.

Figure 7.
(a) RSSI average levels according to distance from the master device for Bluetooth 5.0, indoors test conditions; (b) RSSI average levels according to distance from the master device for Bluetooth 4.x, indoors test conditions.
Figure 7.
(a) RSSI average levels according to distance from the master device for Bluetooth 5.0, indoors test conditions; (b) RSSI average levels according to distance from the master device for Bluetooth 4.x, indoors test conditions.

Figure 8.
(a) Transmission time for BT4.x technology, fixed message length, indoor testing conditions; (b) Transmission time for BT5.0 technology, fixed message length, indoor testing conditions.
Figure 8.
(a) Transmission time for BT4.x technology, fixed message length, indoor testing conditions; (b) Transmission time for BT5.0 technology, fixed message length, indoor testing conditions.

Figure 9.
Variation of transmission time for BT5.0 technology, indoor testing conditions.

Figure 10.
Variation of transmission time for BT4.x technology, indoor testing conditions.

Publisher’s Note: MDPI stays neutral with regard to jurisdictional claims in published maps and institutional affiliations. |
© 2020 by the authors. Licensee MDPI, Basel, Switzerland. This article is an open access article distributed under the terms and conditions of the Creative Commons Attribution (CC BY) license (https://creativecommons.org/licenses/by/4.0/).
Share and Cite
MDPI and ACS Style
Chiva, I.-C.; Minea, M.; Minea, V.-L.; Semenescu, A. Anonymous Detection of Traveler Flows Employing Bluetooth Technologies. Proceedings 2020, 63, 61. https://0-doi-org.brum.beds.ac.uk/10.3390/proceedings2020063061
AMA Style
Chiva I-C, Minea M, Minea V-L, Semenescu A. Anonymous Detection of Traveler Flows Employing Bluetooth Technologies. Proceedings. 2020; 63(1):61. https://0-doi-org.brum.beds.ac.uk/10.3390/proceedings2020063061
Chicago/Turabian StyleChiva, Ionuț-Cosmin, Marius Minea, Viviana-Laetitia Minea, and Augustin Semenescu. 2020. "Anonymous Detection of Traveler Flows Employing Bluetooth Technologies" Proceedings 63, no. 1: 61. https://0-doi-org.brum.beds.ac.uk/10.3390/proceedings2020063061