Next Article in Journal / Special Issue
Automated Test Assembly for Large-Scale Standardized Assessments: Practical Issues and Possible Solutions
Previous Article in Journal
Effects of Orientation and Appearance of a Synchronously Moving Object on Hand Movements
Previous Article in Special Issue
Regularized Estimation of the Four-Parameter Logistic Model
 
 
Please note that, as of 22 March 2024, Psych has been renamed to Psychology International and is now published here.
Article

Measurement of Inter-Individual Variability in Assessing the Quality of Life in Respondents with Celiac Disease

1
Department of Statistics, Computer Science, Applications “G. Parenti”, University of Florence, 50134 Firenze, Italy
2
Department of Humanities, University of Naples Federico II, 80133 Napoli, Italy
3
Department of Social Sciences, University of Naples Federico II, 80133 Napoli, Italy
4
Department of Political Sciences, University of Naples Federico II, 80133 Napoli, Italy
*
Author to whom correspondence should be addressed.
Submission received: 22 October 2020 / Revised: 8 November 2020 / Accepted: 9 November 2020 / Published: 23 November 2020
(This article belongs to the Special Issue Learning from Psychometric Data)

Abstract

:
Quality of life of Celiac Disease (CD) patients is affected by constraints in their physical, social and emotional behaviour. Our objective is to assess differences in two relevant dimensions of the Celiac Quality of Life (CQoL) scale, Limitations due to the disease and Dysphoria (i.e., feelings of depression and discomfort), in relation to the perceived social support and some individual and disease-related characteristics. The paper exploits suitable unidimensional Item Response Theory (IRT) models to individually analyse the two mentioned dimensions of the CQoL and Multidimensional Latent Class IRT models for ordinal polytomous items in order to detect sub-populations of CD patients that are homogenous with respect to the perceived CQoL. The latter methods allow to address patients with similar characteristics to the same treatment, performing at the same time a more tailored overture to health promotion programmes. The analysis extracts the relevant patterns and relations among CD patients, disentangling respondents receiving CD diagnosis in adolescence or adult age rather than in childhood (the first perceive high levels of Limitations and Dysphoria), patients with high perceived social support, a factor influencing in a positive way motivation to engage in management of CD-related distress and psychological well-being, and participants who are married or cohabiting. The latter report higher latent trait levels.

1. Introduction

Celiac Disease (CD) is a chronic inflammatory enteropathy triggered by dietary gluten in susceptible individuals. The disorder is estimated to affect until 1 over 300 individuals of the general population [1]. It was classically diagnosed in patients presenting chronic diarrhoea, malabsorption and malnutrition (classical CD) [2]. However, screening in the general population and case-finding studies in high-risk groups have clearly shown that a relevant cluster of patients may have minimal symptoms or be completely silent.
In recent years, an increasing interest in knowing how patients perceive the impact of chronic disorders on their life and how the health state is modified by a given therapeutic intervention or disease outcome [3] carried out to several surveys aimed at assessing the health-related quality of life of celiac patients (Celiac Quality of Life-CQoL). One of the main issues is related to understanding how a chronic disease impacts the physical, social and emotional behaviour of patients from their own perspective [4]. In the specific case of patients with celiac disease, although the adherence to a gluten-free diet improves their general physical health, many studies showed a poorer perceived quality of life compared to the general population (see [5,6] among the others). Impairments in daily life lead these patients to coping with stressful situations such as social stigmatisation, fear of food contamination, food unavailability, and difficulty in travelling [7]. At the same time, emotional and psychological troubles overwhelm CD patients who feel isolated, worried, embarrassed, and depressed [8,9,10]. Thus, CD is perceived as a burden [11], affecting the quality of life of lots of individuals. About that, a recent study has explored CQoL perception by Italian patients using a specific multi-item questionnaire [12]. This study reported that Limitations due to the disease and Dysphoria (i.e., feelings of depression and discomfort) were the most compromised aspects of CQoL.
In this context, perceived social support can represent a protective factor by influencing in a positive way motivation of patients to engage in the gluten-free diet, their management of CD-related distress, and their psychological well-being [13]. Besides, some personal characteristics and disease-related factors can also have an impact on CQoL. In the literature, some studies showed that age, severity of symptoms as well as late diagnosis were associated with a worse level of CQoL [11,14,15], concerning both Limitations and Dysphoria dimensions. Also living in a family with non-other members with CD can cause financial and interpersonal problems and, thus, low level of CQoL [6]. Taking into account the above-mentioned limitations and psychological aspects is an important issue in the development of support programmes addressed to CD patients, because of their strong association with adherence to the gluten-free diet, which is the only treatment for the CD. Indeed, obstacles, distress, and depressive symptoms have an essential role in the lifelong maintenance of a strict diet, being indirect predictors of giving into the temptation of intentional gluten consumption [16]. Hence, assessing CQoL could help experts to define tailored support programmes. Indeed, it has been proven that individuals with chronic diseases benefit from the participation in social support groups, increasing their quality of life [15].
In the present paper, we aim at understanding two specific aspects of CQoL in relation to the perceived social support and some individual and disease-related characteristics. First, we focus on the features of the items characterising the relevant constructs of the CQoL we considered, namely Limitations and Dysphoria, exploiting suitable unidimensional Item Response Theory (IRT) models [17]. Second, we compare several models belonging to the class of Multidimensional Latent Class IRT models for ordinal polytomous items [18] in order to select the best one for describing the latent structure of the data. In fact, IRT models based on discrete latent variables represent a handy statistical tool to cluster individuals in groups that are homogeneous with respect to several unobservable characteristics of interest, consisting in our study in the two CQoL dimensions of Limitations and Dysphoria. In this way, experts can address patients with similar characteristics to the same treatment, performing at the same time a more tailored approach to programmes for health promotion.
The plan of the paper is as follows. In Section 2 we present participants, procedure and measures. Section 3 is devoted to the analysis of item properties, whereas Section 4 is focused on the latent class analysis of the data and on the relation between the CQoL and other individual characteristics. A discussion and some conclusions end the paper.

2. Methods and Data

2.1. Participants and Procedure

Participants were recruited by posting an online self-report questionnaire on Facebook groups dedicated to the CD. Researchers had provided Facebook group administrators with some details about the research’s purpose and received their approval before linking the questionnaire. Participants filled out the survey voluntarily and consented to process their personal data. Eligibility criteria included CD diagnosis and the majority age (18 years). The final sample included 210 respondents, 61.9% of them with classical CD. Their socio-demographic characteristics and some aspects concerning the CD are summarised in Table 1.

2.2. Measures

The self-report questionnaire included several sections. Below we present only those tools that are functional to the specific objectives of the study.
  • Socio-demographics and CD characteristics information. Participants were asked to indicate gender, age, marital status, type of CD and age at diagnosis.
  • Celiac Quality of Life. Two dimensions of the ’Celiac disease quality of life survey’ [19], assessing the perceived limitations due to CD (Limitations) and its psychological impacts (Dysphoria), were used to evaluate the CQoL according to our goals. As reported in the Italian translation [12], each dimension includes 5 items scored on a 5-point Likert response scale, from 1 = Not at all to 5 = A great deal. Thus, high scores on the items denote high levels of perceived limitations and dysphoria and, hence, low CQoL. The internal consistency reliability (Cronbach’s alpha) is 0.79 and 0.87 for Limitations and Dysphoria dimensions, respectively. Details on the distribution of the items are reported in Table 2. It also reports the internal consistency reliability if the single item is omitted and item-to-total correlation. With exception of item 5, all the items present high correlation.
    Summing up the score observed on the single items a raw measurement of the global perceived Limitations and Dysphoria is obtained. Looking at the histograms displayed in Figure 1 (left and central panels, respectively), it is possible to remark an high level of dysphoria (Mean = 20.4, Sd = 4.3, Median = 22) and a moderate level of perceived limitations due to CD (Mean = 15.8, Sd = 4.7, Median = 16). The reader is warned that summing up the item scores is a useful-and commonly used-procedure to explore data in psychometric literature, even if it is mathematically not justified as item responses are measured on an ordinal scale and not on an interval scale.
  • Social support. The ‘Multidimensional Scale of Perceived Social Support’ (MPSS) introduced by Zimet [20] was used to assess the perception of the social support received from three different sources: family (e.g. ‘My family really tries to help me’), friends (e.g. ‘I have friends with whom I can share my joys and sorrows’), and others (e.g. ‘There is a special person who is around when I am in need’). Items concerning this scale are 12 and are scored on a 6-point response scale ranging from 1 = Strongly disagree to 6 = Strongly agree, with high scores denoting high levels of social support. The internal consistency reliability (Cronbach’s alpha) is 0.95. Details on the distribution of the items are reported in Table 3, where Cronbach’s alpha if-single-item-omitted and item-to-total correlation are also indicated. The measurement obtained with total score of this scale is in Figure 1 (right panel). High levels of social support have been reported by respondents (Mean = 60, Median = 64).

3. Test and Item Properties

In this section we investigate the properties of the items representing the most relevant constructs for our study used to measure the CQoL. We first describe the IRT models for unidimensional latent traits and, then, we illustrate the results of the analysis. All analyses whose results are displayed in this section were performed through the R package mirt [21].

3.1. Models for Unidimensional Latent Traits

Let Y i j { 1 , 2 , , m } be the response on a Likert scale of individual i to an item j ( j { 1 , 2 , , J } ). Given the structure of the scales, we assume that the measurement is on an ordinal scale because each score on the scale refers to a greater or smaller magnitude of the feeling/attitude that one wants to measure. Let ( Y i j ; x i ) ( i = 1 , 2 , , n ) denote a sample consisting of the categorical responses Y i j and corresponding vectors of explanatory variables x i . The latter represents the realisation of individual covariates X i .
Classical regression models for ordinal responses are cumulative models [22] yielding the so-called proportional odds model ( P O M ) when logistic link function is assumed and variables have the same effect on the cumulative odds regardless of the response category. When the main aim is modelling the response on several items without using explanatory variables [23] the corresponding Graded Response Model (GRM) [24,25] is introduced in the context of IRT. Assuming a constant number of ratings m for each item j ( j { 1 , 2 , , J } ), as in our analysis, the probability that subject i with latent trait (or feeling) θ i responds by category r or higher, r = 2 , , m , to item j ( j = 1 , , J ) is
P ( Y i j r | θ i ) = F [ γ j ( θ i δ j r ) ] r = 2 , , m ,
where γ j are item-specific discrimination indices and δ j r ( r = 2 , , m ) are item parameters denoting the difficulty of answering category r of item j (they are usually considered as thresholds on the latent continuum). Parameters δ j r may be also expressed in an additive way as δ j r = δ j + τ j r , with δ j summarising the difficulty of item j and τ j r cut-off point between categories that denote the difficulty of passing from category r 1 or smaller to category r or higher. F ( · ) is a cumulative distribution function; in the GRM of Samejima [24] F ( · ) is the logistic cumulative distribution, that is F ( η ) = e x p ( η ) 1 + exp ( η ) , yielding global (or cumulative) logits.
Thus, the formulation of a G R M in terms of logit model follows as
log P ( Y i j r | θ i ) P ( Y i j < r | θ i ) = γ j ( θ i δ j r ) .
When the discrimination parameters γ j s are constant (i.e., all the items discriminate in the same way among different levels of the latent trait), the One-Parameter Graded Response Model (1P-GRM) [26] follows. Another special, and more parsimonious, formulation is obtained when the distance between cutoff points is the same for all items, that is τ j r = τ r for all j = 1 , , J , thus δ j r = δ j + τ r . Hence, the resulting model considers one difficulty parameter for each item and one for each cutoff point. The model at issue is known as Rating Scale GRM (RS-GRM) [27].
According to the traditional derivation of the cumulative logit model yielding GRM, the observed item responses Y i j are interpreted as discretised versions of unobservable continuous items Y ˜ i j and, thus, the item difficulty parameters may be thought in terms of ‘thresholds’. More in detail, let Y ˜ i j = θ i + ϵ i , with ϵ i noise variable with distribution function F ( . ) , denote a variable assessed along a continuum scale that is ruled if respondent i tries to solve/answer item j. In such a context, Y ˜ i j represents the latent trait of a person plus a random variable and it cannot be directly observed: what we can observe is a discretisation of Y ˜ i j . More precisely, the category boundaries approach assumes that category r is observed if the latent variable Y ˜ i j is between thresholds δ r and δ r + 1 . More formally, one has Y i j = r if and only if δ i , r Y ˜ i j < δ i , r + 1 ; thus, item difficulties δ i , r are always ordered.
An alternative class of models that is commonly used for ordinal scales are the adjacent categories (or local logit) models yielding in the IRT context, among others, the Generalised Partial Credit Model (GPCM) [28] and, as a special case, the Partial Credit Model (PCM) [29,30]. The adjacent categories models specify the probability of observing category r given response in categories { r 1 , r } by a binary regression model, as
P ( Y i j = r | Y i j { r 1 , r } , θ i ) = F [ γ j ( θ i δ j r ) ] r = 2 , , m .
The corresponding latent trait model, when logistic distribution is adopted, is the GPCM, that is
log P ( Y i j = r | θ i ) P ( Y i j = r 1 | θ i ) = γ j ( θ i δ j r ) ,
which reduces to the PCM when discrimination parameters γ j are all equal to 1. The adjacent categories models are designed to work with items that provide a partial credit; that is, instead of just right/wrong as possible scoring, a respondent can receive or express partial points for completing/selecting some aspects of the item correctly. Also for this class of models it is possible to take into account a (partial) proportional odds assumption, similarly to the cumulative logit models, with a focus on category-specific effects. However, the main difference with respect to the cumulative logit models is that, in the adjacent categories models, item parameters δ j r now compare two adjacent categories and they are not necessarily ordered, while θ i determines the strength of the preference for the higher category between two consecutive ones. Another class of models with no ordering of thresholds is that of Sequential-Type Models [31] related to the landmark continuation ratio model based on the analysis of consecutive steps (see [32] for a complete overview).
Estimation process for IRT models is typically performed by means of marginal maximum likelihood estimation. The approach consists in maximizing the marginal log-likelihood of P ( Y i j = r ) = P ( Y i j = r | θ i ) f ( θ i ) d θ i , where P ( Y i j = r | θ i ) depends on Equation (1) (or (3)) and f ( θ i ) is the probability distribution of latent trait θ i . Under the normality assumption of the latent trait, a common approach is represented by the Gauss-Hermite quadrature that replaces the integral by a finite sum, which is then maximized by direct (e.g. Newton-Raphson algorithm) or indirect (e.g. EM algorithm) methods. Alternatively, it can be adopted a quasi-likelihood approach or a Bayesian approach based on Markov Chain Monte Carlo methods. Further, a semi-parametric approach may be implemented. The latter avoids parametric assumptions on the latent distribution as well as does not require the solution of the integral (see Section 4.1). More details on the estimation methods are provided in [33] and [34] (Chap. 5).
A useful instrument to globally evaluate the goodness of an item is given by the Fisher information that takes into account both the difficulty and the discrimination parameters at the same time. The Fisher information of an item is defined as (see [34], Chap. 5.6.1, and reference therein)
I j ( θ i ) = r = 1 m 2 log P ( Y i j = r | θ i ) θ i 2 P ( Y i j = r | θ i ) .
In particular, the shape of I j ( θ i ) changes according to the item parameters: difficulty affects the location of the curve along the latent trait continuum θ i , whereas discrimination drives the peak of the curve. To evaluate the goodness of a test as a whole we may compute the test Fisher information as
I ( θ i ) = j = 1 J I j ( θ i ) .
The selection of the best model is obtained by comparing Likelihood-ratio tests (LRT) for nested models and information criteria for non-nested ones. LRT compare two competing statistical models based on the ratio of their likelihoods, that is the likelihood of the restricted model under consideration with the full model, whereas among information criteria the Bayesian Information Criterion (BIC) [35] provides the most parsimonious solution and, therefore, its use is commonly recommended by the literature. This criterion is based on the following index:
B I C = 2 l o g L i k + log ( n ) p a r ,
where l o g L i k is the maximum value of the log-likelihood of the model of interest, and p a r is the number of free parameters. The smallest the B I C index is, the better is the model fitting. Therefore, among a set of competing models, the selected one is the model with the minimum B I C value.

3.2. Results-I

In order to select the most appropriate link function (global logit versus local logit), we estimated both a GRM (global logit) and a GPCM (local logit), separately for the two dimensions Limitations and Dysphoria, comparing them through the BIC index. As shown in Table 4, the BIC indicated the global logit as the best link function in either case; thus, results related to GRM are considered in what follows.
Looking at Figure 2, we observe that the Fisher information I ( θ i ) provided by the 10-item questionnaire is globally satisfactory for both the dimensions. In particular, the subset of 5 items measuring perceived Limitations is maximally informative for individuals with medium levels of the latent trait, whereas the test Fisher information function for the Dysphoria dimension reaches its maximum value in correspondence to medium-high levels of the latent trait.
Details about the Fisher information at item level for both the dimensions are provided by Figure 3 and Figure 4, where the information curves I j ( θ i ) are plotted for each item.
For dimension Limitations, the most informative items are CQoL_1 (feeling limited in eating with coworkers) and CQoL_2 (fear of eating special food), whereas items CQoL_3 (difficulty traveling or taking long trips), CQoL_4 (fear of eating out due to possible food contamination), and CQoL_5 (feeling worried about the increased risk that a family member has the celiac disease) have a poor informative capability. Note that all items cover the central range of latent trait estimates, except for CQoL_5 that is centred around values higher than the average.
About dimension Dysphoria, items show an overall higher informative capability with respect to items of dimension Limitations (compare y-axes of Figure 3 and Figure 4). The most informative item is CQoL_10 (feeling overwhelmed), followed by CQoL_7 (feeling depressed) and CQoL_9 (not being able to live a normal life). On the other hand, CQoL_8 (trouble socializing due to the celiac disease) and CQoL_6 (feeling socially stigmatised) are the poorest informative items. Moreover, item CQoL_6 covers the central range of latent trait estimates, whereas all the other items are centred around values higher than the average.
Further details on the item functioning are given by the item response category characteristic curves (IRCCCs). The IRCCCs are specific for each response category of each item and denote P ( Y i j = r | θ i ) , specified according to Equation (2), that is, the probability of choosing a certain category r for item j given the latent trait θ i . The IRCCCs provide a summary of the perception of the items by the respondents, in terms of difficulty or easiness to disagree with each item content. Thus, left-shifted IRCCCs (along the x-axis) denote ‘easy’ items, that is, items for which low levels of the latent trait (Limitations or Dysphoria) are sufficient to encounter a substantial agreement by the respondents; on the opposite, items with right-shifted IRCCCs require high levels of latent trait. Figure 5 and Figure 6 display the IRCCCs for the items of the Limitations and Dysphoria dimensions, respectively.
First, good reliability stands out for all items, which show well-shaped IRCCCs. However, several items (mainly, items CQoL_4, CQoL_5, and CQoL_8) present redundant response categories (i.e., Y i j = 2 and Y i j = 4 ) that are categories perceived as similar to the adjacent ones and, thus, substantially useless. Therefore, a preference for the extreme categories of the Likert response scale (blue and yellow curves in Figure 5 and Figure 6) emerged, followed by the choice of the middle category ( Y i j = 3 , green curves).
Moreover, respondents tend to strongly disagree with a certain number of items also for medium levels of CQoL. This is the case of items CQoL_7 (feeling depressed), CQoL_8 (trouble socializing due to the celiac disease), and CQoL_10 (feeling overwhelmed) of the dimension Dysphoria. Namely, for these items the IRCCC of category r = 1 (Not at all) tends to be right-shifted (light blue line in plots of Figure 6), thus being r = 1 the most likely response category also for medium levels of Dysphoria other than for low levels. In other words, situations described by these items are not perceived as particularly problematic for celiac individuals participating to the study.

4. A Latent Class Analysis of CQoL

In what follows, we investigate the latent structure of data in order to detect sub-populations of individuals that are homogenous with respect to the perceived CQoL; we also assess the relation between CQoL and some individual characteristics, mainly the perceived social support. We first illustrate the semi-parametric multidimensional extension of the GRM illustrated in Section 3.1 and, then, we show the results. All analyses whose results are displayed in this section were performed through the R package MultiLCIRT [36].

4.1. Semi-Parametric Models for Multidimensional Latent Traits

IRT models above discussed assume, in their original formulation, (i) the presence of a single latent variable (unidimensionality assumption), (ii) parametric, usually normal, distribution of the latent variable, and (iii) no effect of individual characteristics on the latent variable. Often, these assumptions are restrictive and, thus, generalised versions of IRT models can be considered to allow for:
  • the presence of multiple latent variables (multidimensionality assumption), namely Limitations and Dysphoria in our context;
  • removing parametric distributive assumptions of the latent variables, in favour of a semi-parametric model formulation where the latent variables are identified by a finite and, usually, small number of components (support points) denoting sub-populations or latent classes [37,38] of individuals characterised by homogeneous unobservable characteristics (discreteness assumption). Indeed, representing the CQoL distribution with discrete latent variables has several advantages. First, the semi-parametric formulation avoids parametric assumptions that are difficult to test and make the estimation process computationally demanding because of the presence of a multidimensional integral in the log-likelihood function. Second, the semi-parametric formulation is more flexible than the continuous one, as it allows us to cluster individuals into groups (latent classes) with similar latent characteristics, so as to address subjects with particularly low levels of CQoL to tailored therapies and treatments.
For both these reasons, the following analysis is carried out relying on the multidimensional extension of IRT models described in Section 3.1 based on multiple latent traits with a discrete distribution, as implemented in the class of multidimensional Latent Class IRT models (LC-IRT) [18,39,40]. This type of model belongs to the wide class of mixture IRT models (for a review see [41,42], and reference therein) that, in turn, are an example of mixture models [43].
Furthermore, to account for the possible effect of individual characteristics on the latent variables we adopt a concomitant variable approach [44,45], based on the assumption that certain individual observable covariates may affect the clustering of individuals.
Let Y i = ( Y i 1 , , Y i j , , Y i J ) T be the item response configuration of individual i and Θ = ( Θ 1 , , Θ d , , Θ D ) T be the vector of D latent variables that drive the response process (in our context, D = 2 , being Limitations and Dysphoria the two latent variables involved in the analysis). The latter is assumed to have a discrete distribution with k support points (i.e., components) τ 1 , , τ u , , τ k . Each support point τ u is referred to a latent class u of individuals who share common levels of the latent traits. Let θ = ( θ 1 , θ d , , θ D ) be the possible realisation of Θ with τ u = ( θ 1 u , θ 2 u , , θ D u ) T and let π u = P ( Θ = τ u ) ( u = 1 , , k ) the weights for each component denoting the prior probability of belonging to latent class u. Here, to make easier the interpretation of the latent classes and to improve the parsimony of the model (see [18] for details), the number k of mixture components is assumed the same for all the latent traits. This implies that individuals belonging to the same latent class are characterised by a class-specific profile in terms of the D latent variables (i.e., Limitations and Dysphoria), being possible that a class may have high levels on all the D dimensions, another class low levels on all the D dimensions, and some other class high levels on some dimensions and low levels on some other ones. Thus, the dependency among the D dimensions (i.e., between Limitations and Dysphoria) emerges as a consequence of aggregating the dimensions across the latent classes.
The manifest distribution of the individual’s response vector Y i follows the Latent Class (LC) model [37,38]. Thus, extending the formula in (1) we obtain
P ( Y i r ) = u = 1 k P ( Y i r i | Θ = τ u ) π u = u = 1 k j = 1 J P ( Y i j r | Θ = τ u ) π u ,
where P ( Y i j r | Θ = τ u ) is specified in accordance with IRT parameterisation, that is F γ j ( z j d θ d u δ j r ) with z j d indicator variable yielding 1 if item j measures latent trait Θ d . Same extension may be pursued starting from Equation (3). As in the unidimensional model, the discriminating parameters γ j measure the capacity of the item to discern between individuals with different levels of latent traits. The difficulty parameters δ j r are specific of each pair of consecutive item response categories and measure, for each item, the difficulty of answering r or more. In the context at issue, high values of δ j r ( r = 2 , , m ) denote a general tendency to disagree with item j or, in other words, only individuals belonging to latent classes with high levels of the latent traits are expected to choose high values of r for item j. On the opposite, low values of δ j r characterise items for which respondents generally agree.
Notice that γ j and δ j r are constant among the latent classes. Alternative formulations of mixture IRT models that remove these constraints are represented, for instance, by the diagnostic model [40], characterised by fixed rather than free latent traits, and the mixed Rasch-type models [46,47] that rely on a mixture of separate Rasch models with class-specific person and item parameters. Anyway, alternative constraints have to be imposed to allow for free item parameters among classes. In addition, the estimation process related with these alternative formulations turns out to be computationally demanding without providing an effective advantage in terms of interpretation of parameters, which results quite complex.
To ensure the identification of the proposed model, some further constraints have to be considered on the model parameters. As usual in the IRT approach, one item discriminating parameter must be constrained to 1 for each latent trait and one item threshold difficulty parameter to 0 for each latent trait. Alternatively, we may constraint the weighted sum of mixture components to be equal to 0 for each latent trait. In addition, one latent class weight must be obtained as the complement to 1 of the remaining k 1 weights. Taking into account these aspects the number of free parameters is ( k 1 ) + k D + ( J D ) + [ J ( m 1 ) D ] .
The model may be extended to account for the effect of individual characteristics on the latent class membership. Following the concomitant variable approach [44,45], the individual-constant weights π u are replaced with individual-specific weights
π u ( x i ) = P ( Θ = τ u | X i = x i ) ,
generally modelled through a multinomial logit formulation
log π u ( x i ) π 1 ( x i ) = β 0 u + x i T β 1 u i = 1 , , n ; u = 2 , , k ,
with β 0 u class-specific constant term and β 1 u class-specific vector of regression coefficients that describe the effect of covariates on the prior probability of belonging to class u with respect to the reference class (e.g. class 1). Alternatively, whenever latent classes are ordered with respect to latent traits the P O M holds, that is,
log π u ( x i ) + π u + 1 ( x i ) + + π k ( x i ) π 1 ( x i ) + π 2 ( x i ) + + π u 1 ( x i ) = β 0 u + x i T β 1 i = 1 , , n ; u = 2 , , k .
In such a case, regression coefficients collected in vector β 1 are common to all the latent classes and their interpretation is easier. Furthermore, when covariates are considered the number of free model parameters is equal to ( k 1 ) ( p + 1 ) + k D + ( J D ) + [ J ( m 1 ) D ] under the multinomial logit formulation because of the presence of p ( k 1 ) regression coefficients and ( k 1 ) thresholds (constant terms), whereas it becomes [ p + ( k 1 ) ] + k D + ( J D ) + [ J ( m 1 ) D ] under the P O M due to p regression coefficients and ( k 1 ) thresholds.
Different from alternative approaches based on multi-steps strategies (tipically, estimation of the IRT model followed by estimation of the covariates effect), the concomitant variable approach here adopted has the advantage of providing consistent estimates and predicting the most likely latent class for those individuals who have not yet answered the test items.
Inference for this class of models follows and generalises the main content summarised in Section 3.1. EM algorithm is provided in [34], to which we refer for details. We outline that, as usual in the mixture and latent class type models, the number k of mixture components is not a model parameter but it has a constant value that has to be a priori fixed. Whenever theoretical reasons do not exist to support a given value of k, the choice is usually based on the comparison among alternative models through the BIC index.
The selection of dimensions may be performed by a LR statistic used to test the unidimensionality of a set of items against a specific multidimensional alternative. Details are in [18].

4.2. Results-II

In this section results based on the application of multidimensional latent class IRT models for ordinal polytomous item responses were described following the steps proposed in [
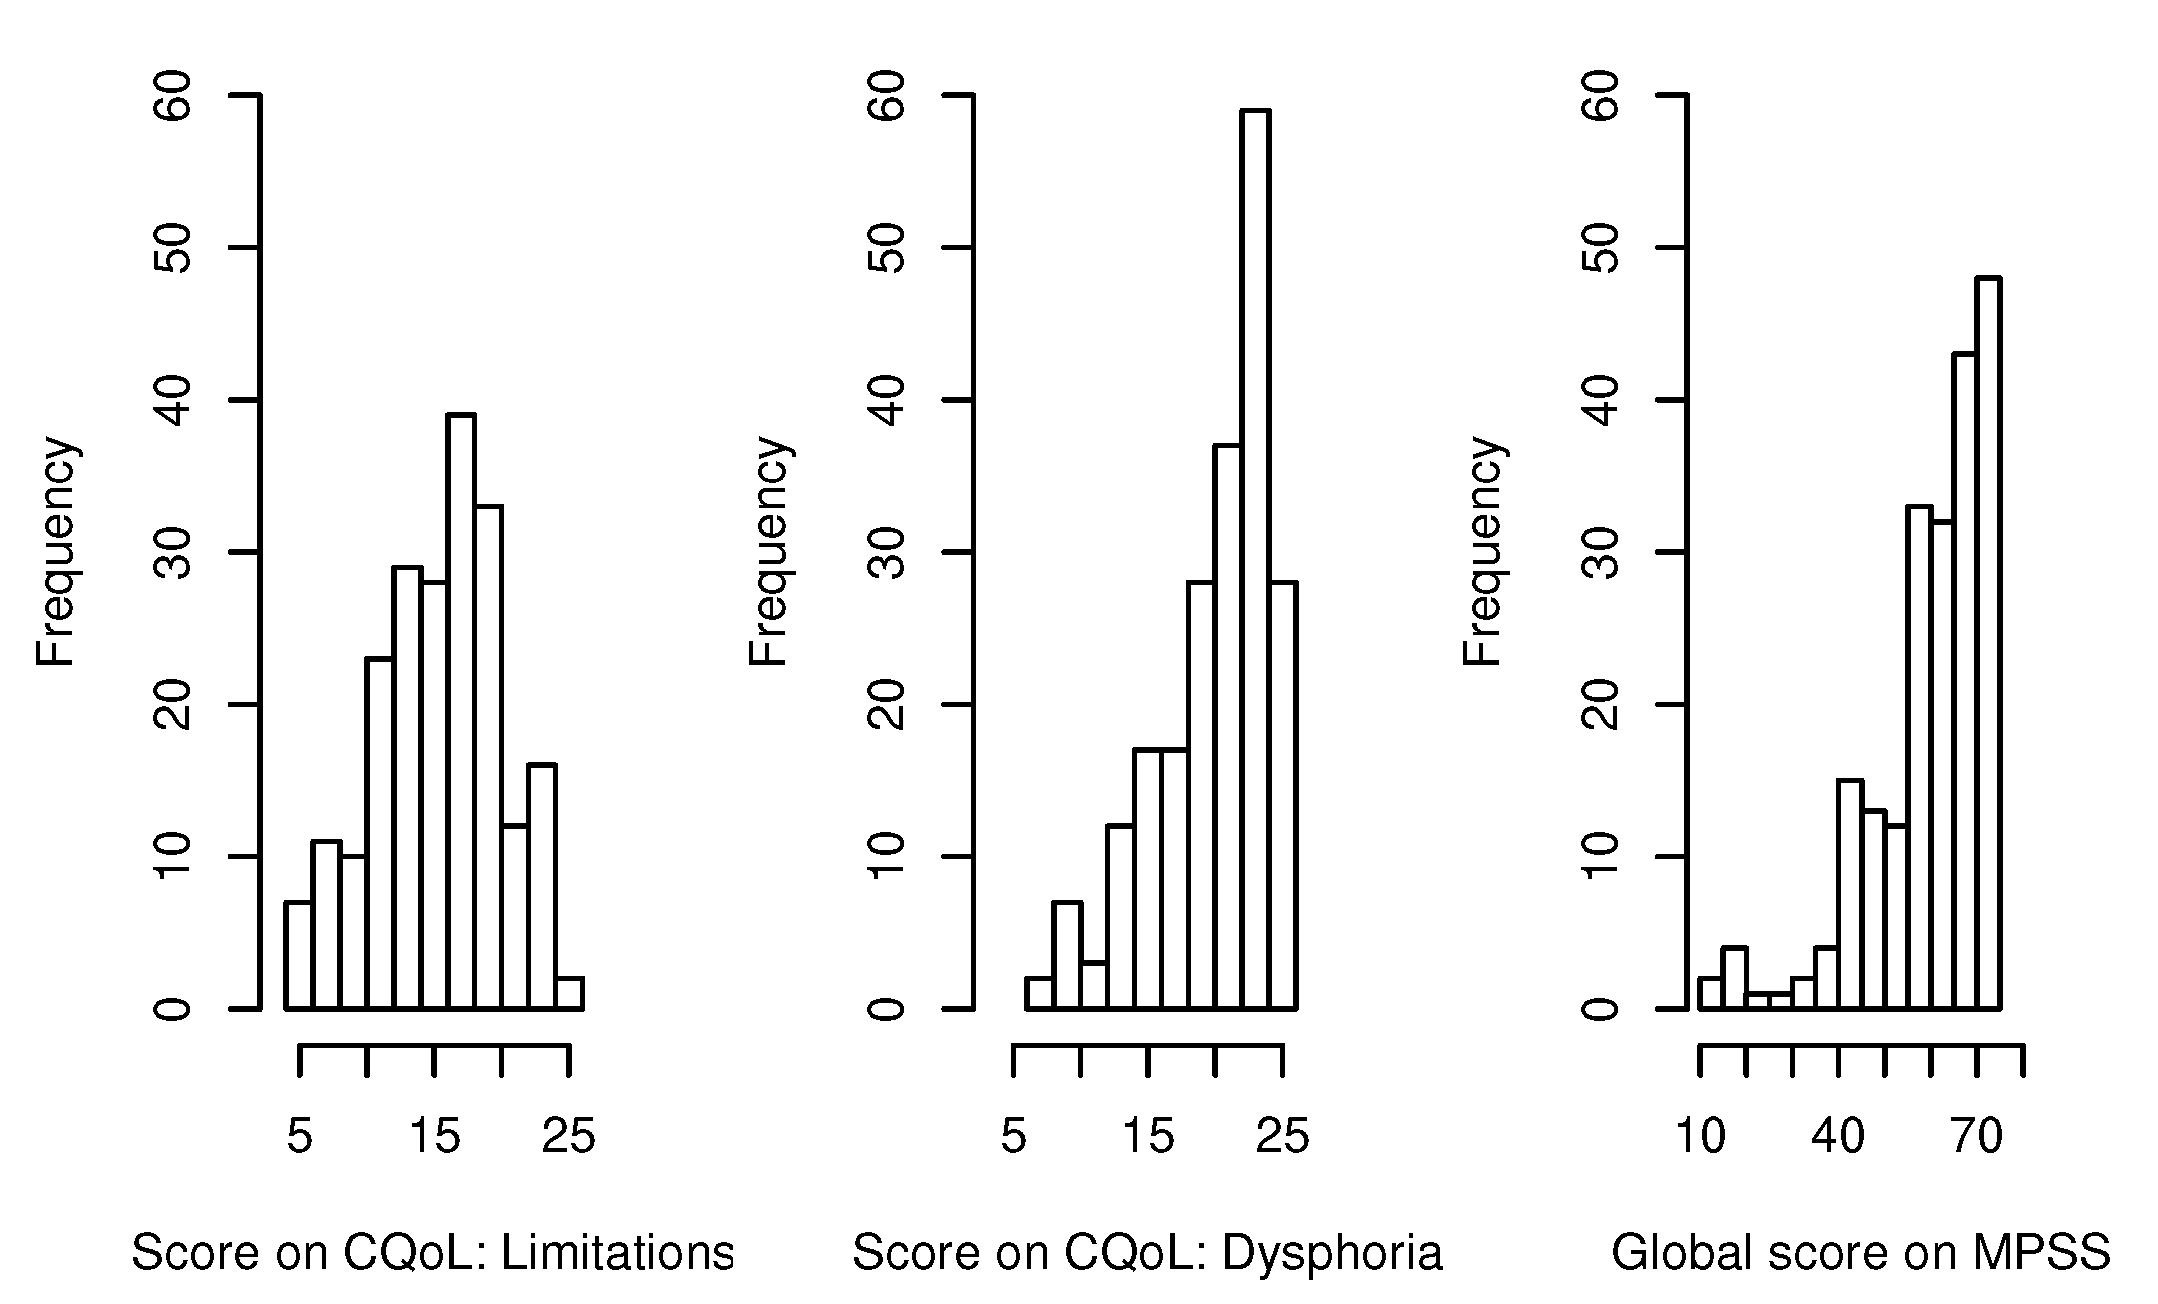
18]. The dimensionality structure of the model was defined according to the two considered dimensions of CQoL Limitations and Dysphoria, with items 1 to 5 loading on Limitations and items 6 to 10 loading on Dysphoria. Firstly, we carried out the standard LC model without covariates for different values of k to detect the best number of latent classes. Given k, we selected the most appropriate link function by estimating a bidimensional model both with global and local logit, again without covariates. In the third step, we compared the model selected at the previous step with its constrained versions to choose suitable constraints on the item parameters. In the end, we added several individual covariates, reaching the final model, whose results were described in depth. In what follows, we report details about each of the mentioned steps.
Number of latent classes. In order to select the optimal number of classes, we carried out the standard LC model with k = 1 , , 5 number of classes not including any covariates. The BIC was used to choose the best model. Results displayed in Table 5 led us to consider k = 3 latent classes.
Type of link function. We chose the most appropriare link function by estimating a bidimensional LC-IRT model both with global and local logit (GRM and GPCM, respectively), keeping the number of classes ( k = 3 ) previously selected. Again, the BIC was used as selection criteria. Results in Table 6 show that global logit link (GRM) is better, thus confirming what obtained with the unidimensional IRT models (Table 4).
Constraints on the item parameters. In order to select the constraints on item parameters, we compared the bidimensional LC GRM with its constrained versions, namely bidimensional LC RS-GRM, 1P-GRM and 1P-RS-GRM, through the BIC index. Also in this step, we considered models without covariates. BIC index showed that the graded response models with constrained τ j r parameters (i.e., rating scale parameterisation) have a better fit. In particular, the comparison between the bidimensional LC RS-GRM and the bidimensional LC 1P-RS-GRM, based on BIC, led to prefer the 1P-RS-GRM. This model consists in the graded response type model with constraints on both cutoff points ( τ j r = τ r , for all j = 1 , , J ) and discrimination parameters ( γ j = 1 , for all j = 1 , , J ).
Details of the model selection are displayed in Table 7.
Latent classes and effect of covariates on the class membership. Once the best model was selected, we added individual covariates to understand how individual and disease-related characteristics impact on class membership. The estimated support points for the bidimensional LC 1P-RS-GRM with covariates (see Table 8) indicated that the latent classes are increasing ordered according to the levels of both Limitations and Dysphoria (i.e., estimated support points of the two dimensions increase from class 1 to class 3). Thus, we can interpret the three latent classes in terms of different degrees of CQoL perceived by participants. In particular, Class 1 included subjects who report low levels of both perceived limitations and dysphoria. On the other hand, patients in Class 2 and Class 3 are characterised by medium and high levels of perceived limitations and dysphoria, respectively. Thus, subjects with the highest level of CQoL are located in Class 1, whereas Class 3 includes patients with the lowest level of CQoL. The average of individual-specific weights π u ( x i ) is reported in Table 8 for each class u ( u = 1 , 2 , 3 ). Moreover, the differences between the maximum and the minimum value estimated for the support points in each dimension showed that Dysphoria is the dimension that better discriminates among subjects (i.e., the dimension with the biggest difference equal to 5.79).
In the final selected model, class weights are influenced by individual covariates. Because the support points were increasingly ordered for both the two considered dimensions, we adopted the more parsimonious global logit specification according to Equation (7) to estimate the effect of covariates on class weights. According to the literature, we added the following variables as covariates: age, social support, age at diagnosis, type of celiac disease, and marital status. Because the type of celiac disease did not result to be significant even for α = 0.20 , it was removed from the final model, whose results are summarised in Table 9.
We can conclude that the most relevant covariates are social support and age at diagnosis. In particular, for a unit increase in the perceived social support the odds of the latent trait levels (i.e., Limitations and Dysphoria) decrease by 0.95. Moreover, receiving a CD diagnosis in adolescence or adult age rather than in childhood leads to higher levels of perceived limitations due to the CD and dysphoria. About that, odds ratios indicate an increase of 3.53 and 2.64 for adolescence and adult age (vs childhood), respectively. In addition, a weaker impact is associated to age and marital status covariates: older patients present lower levels of perceived limitations and dysphoria (OR = 0.98), and participants who are married or cohabiting report higher latent trait levels (OR = 0.63).
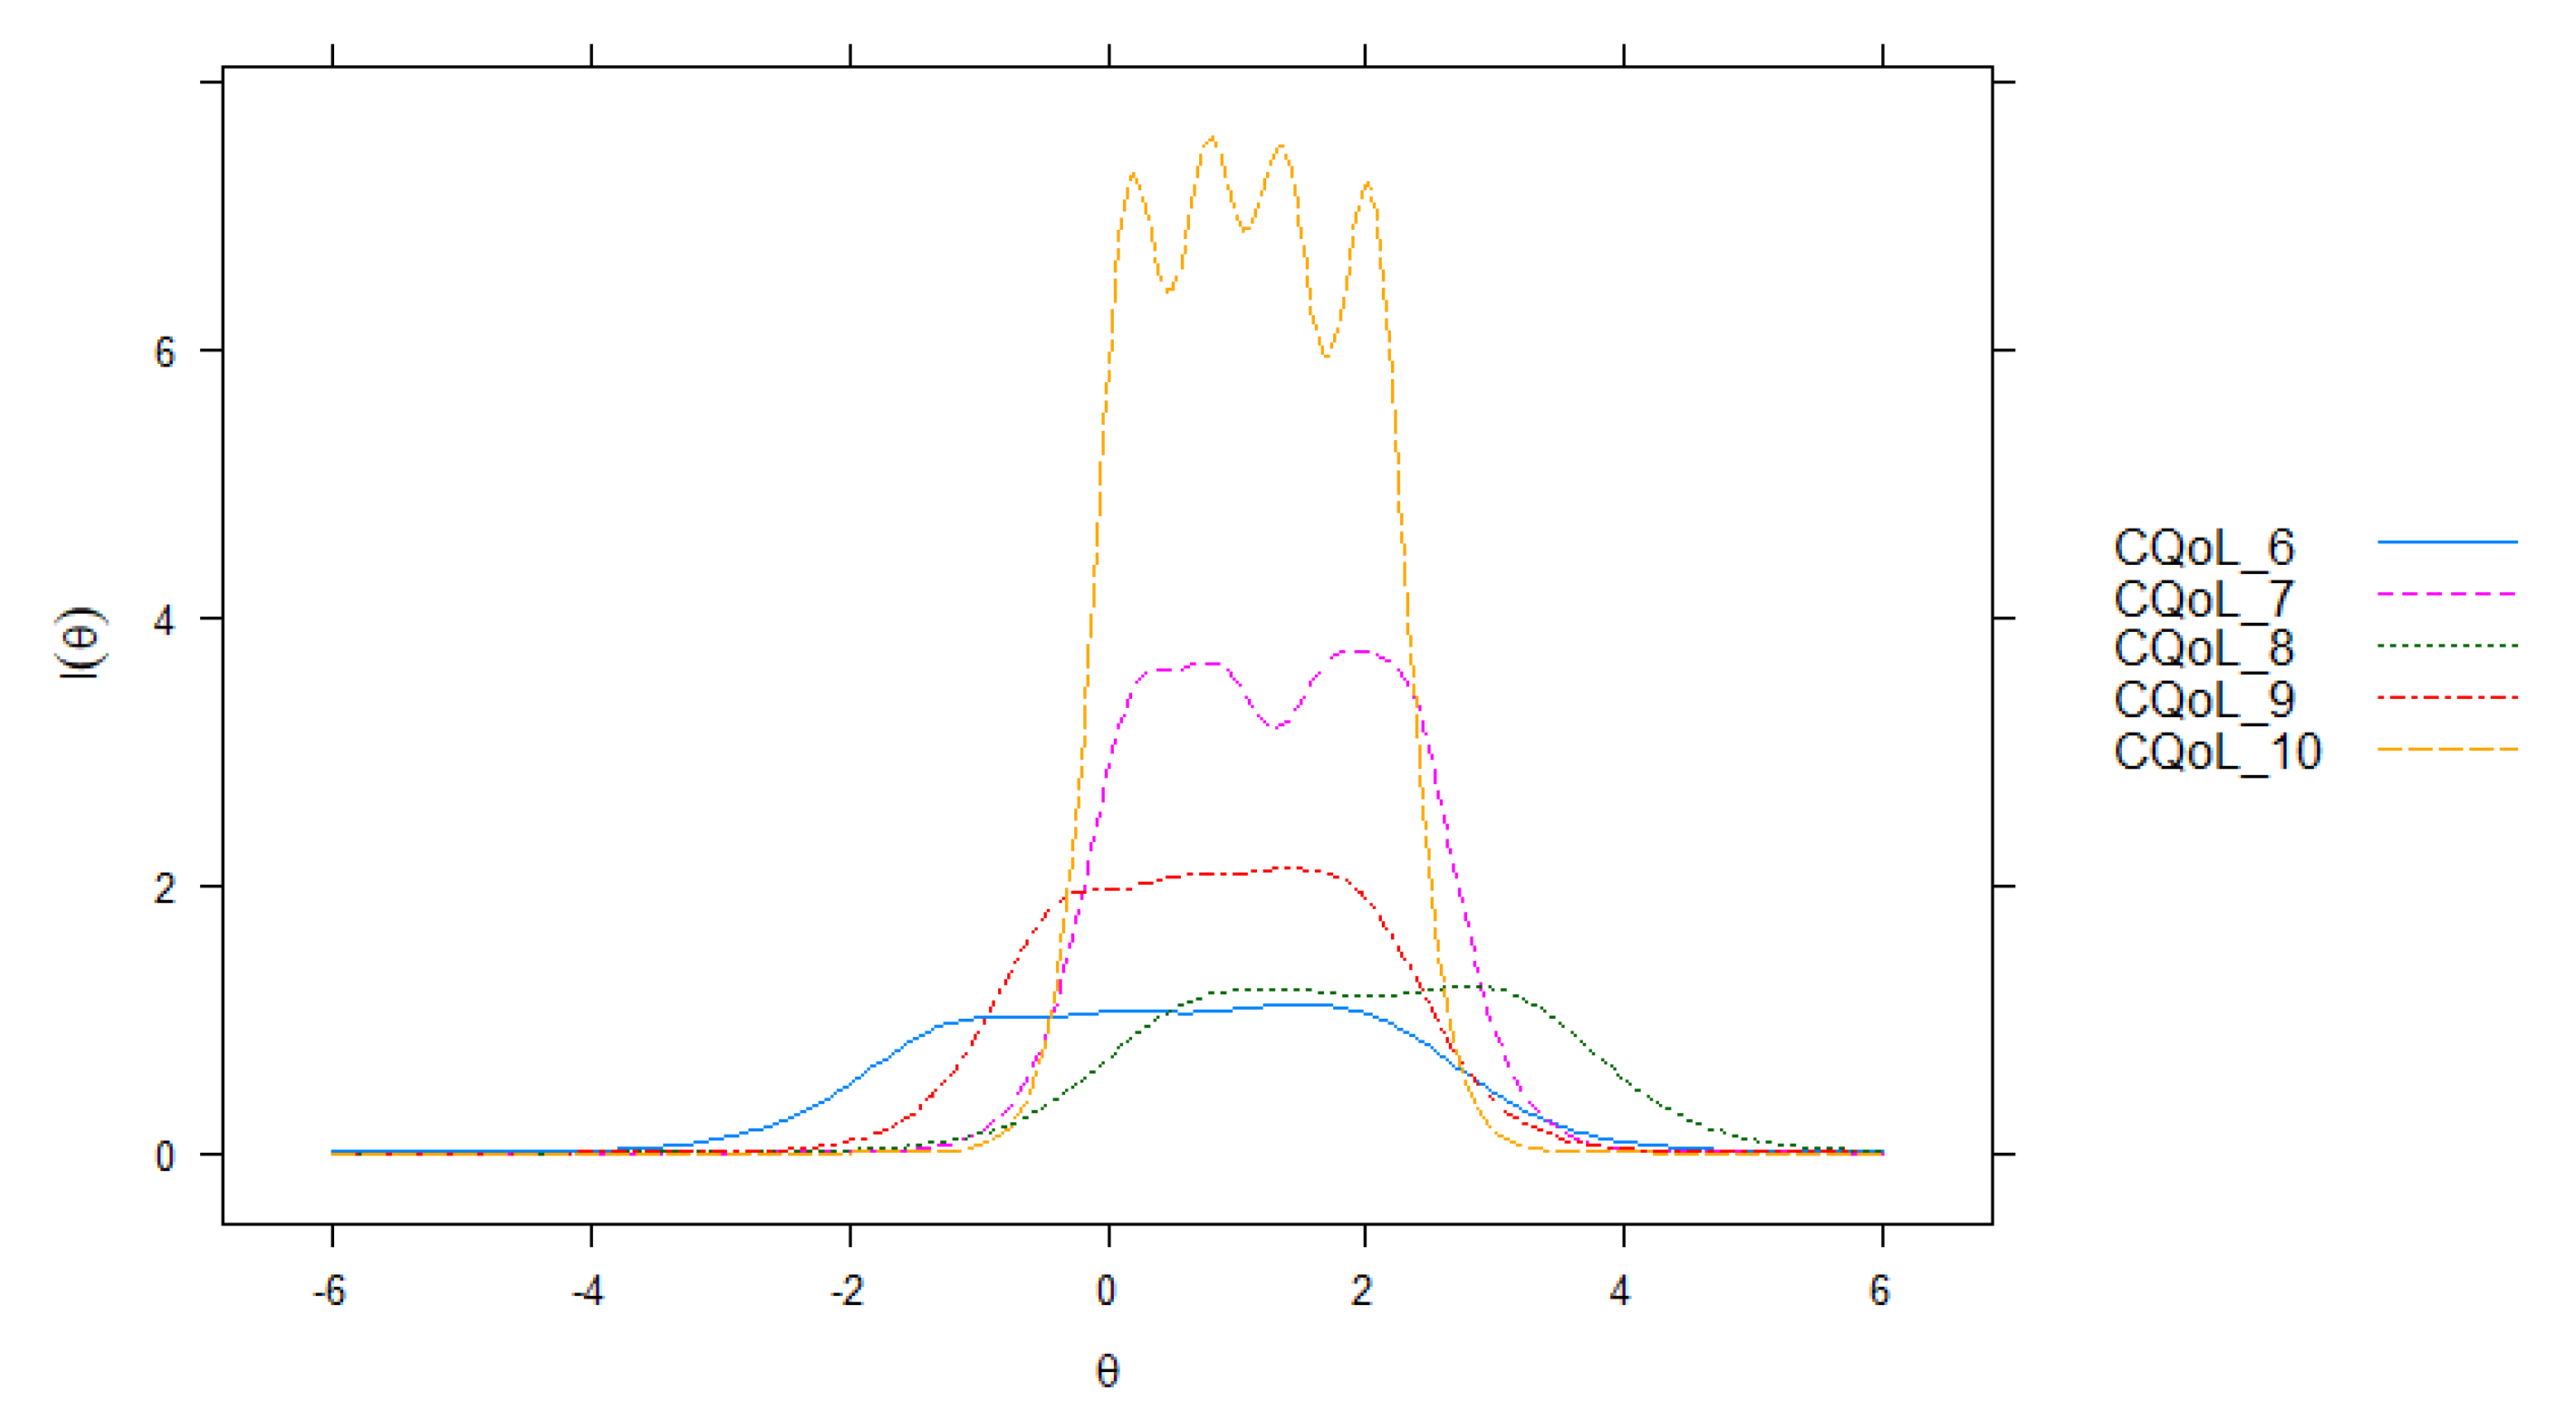
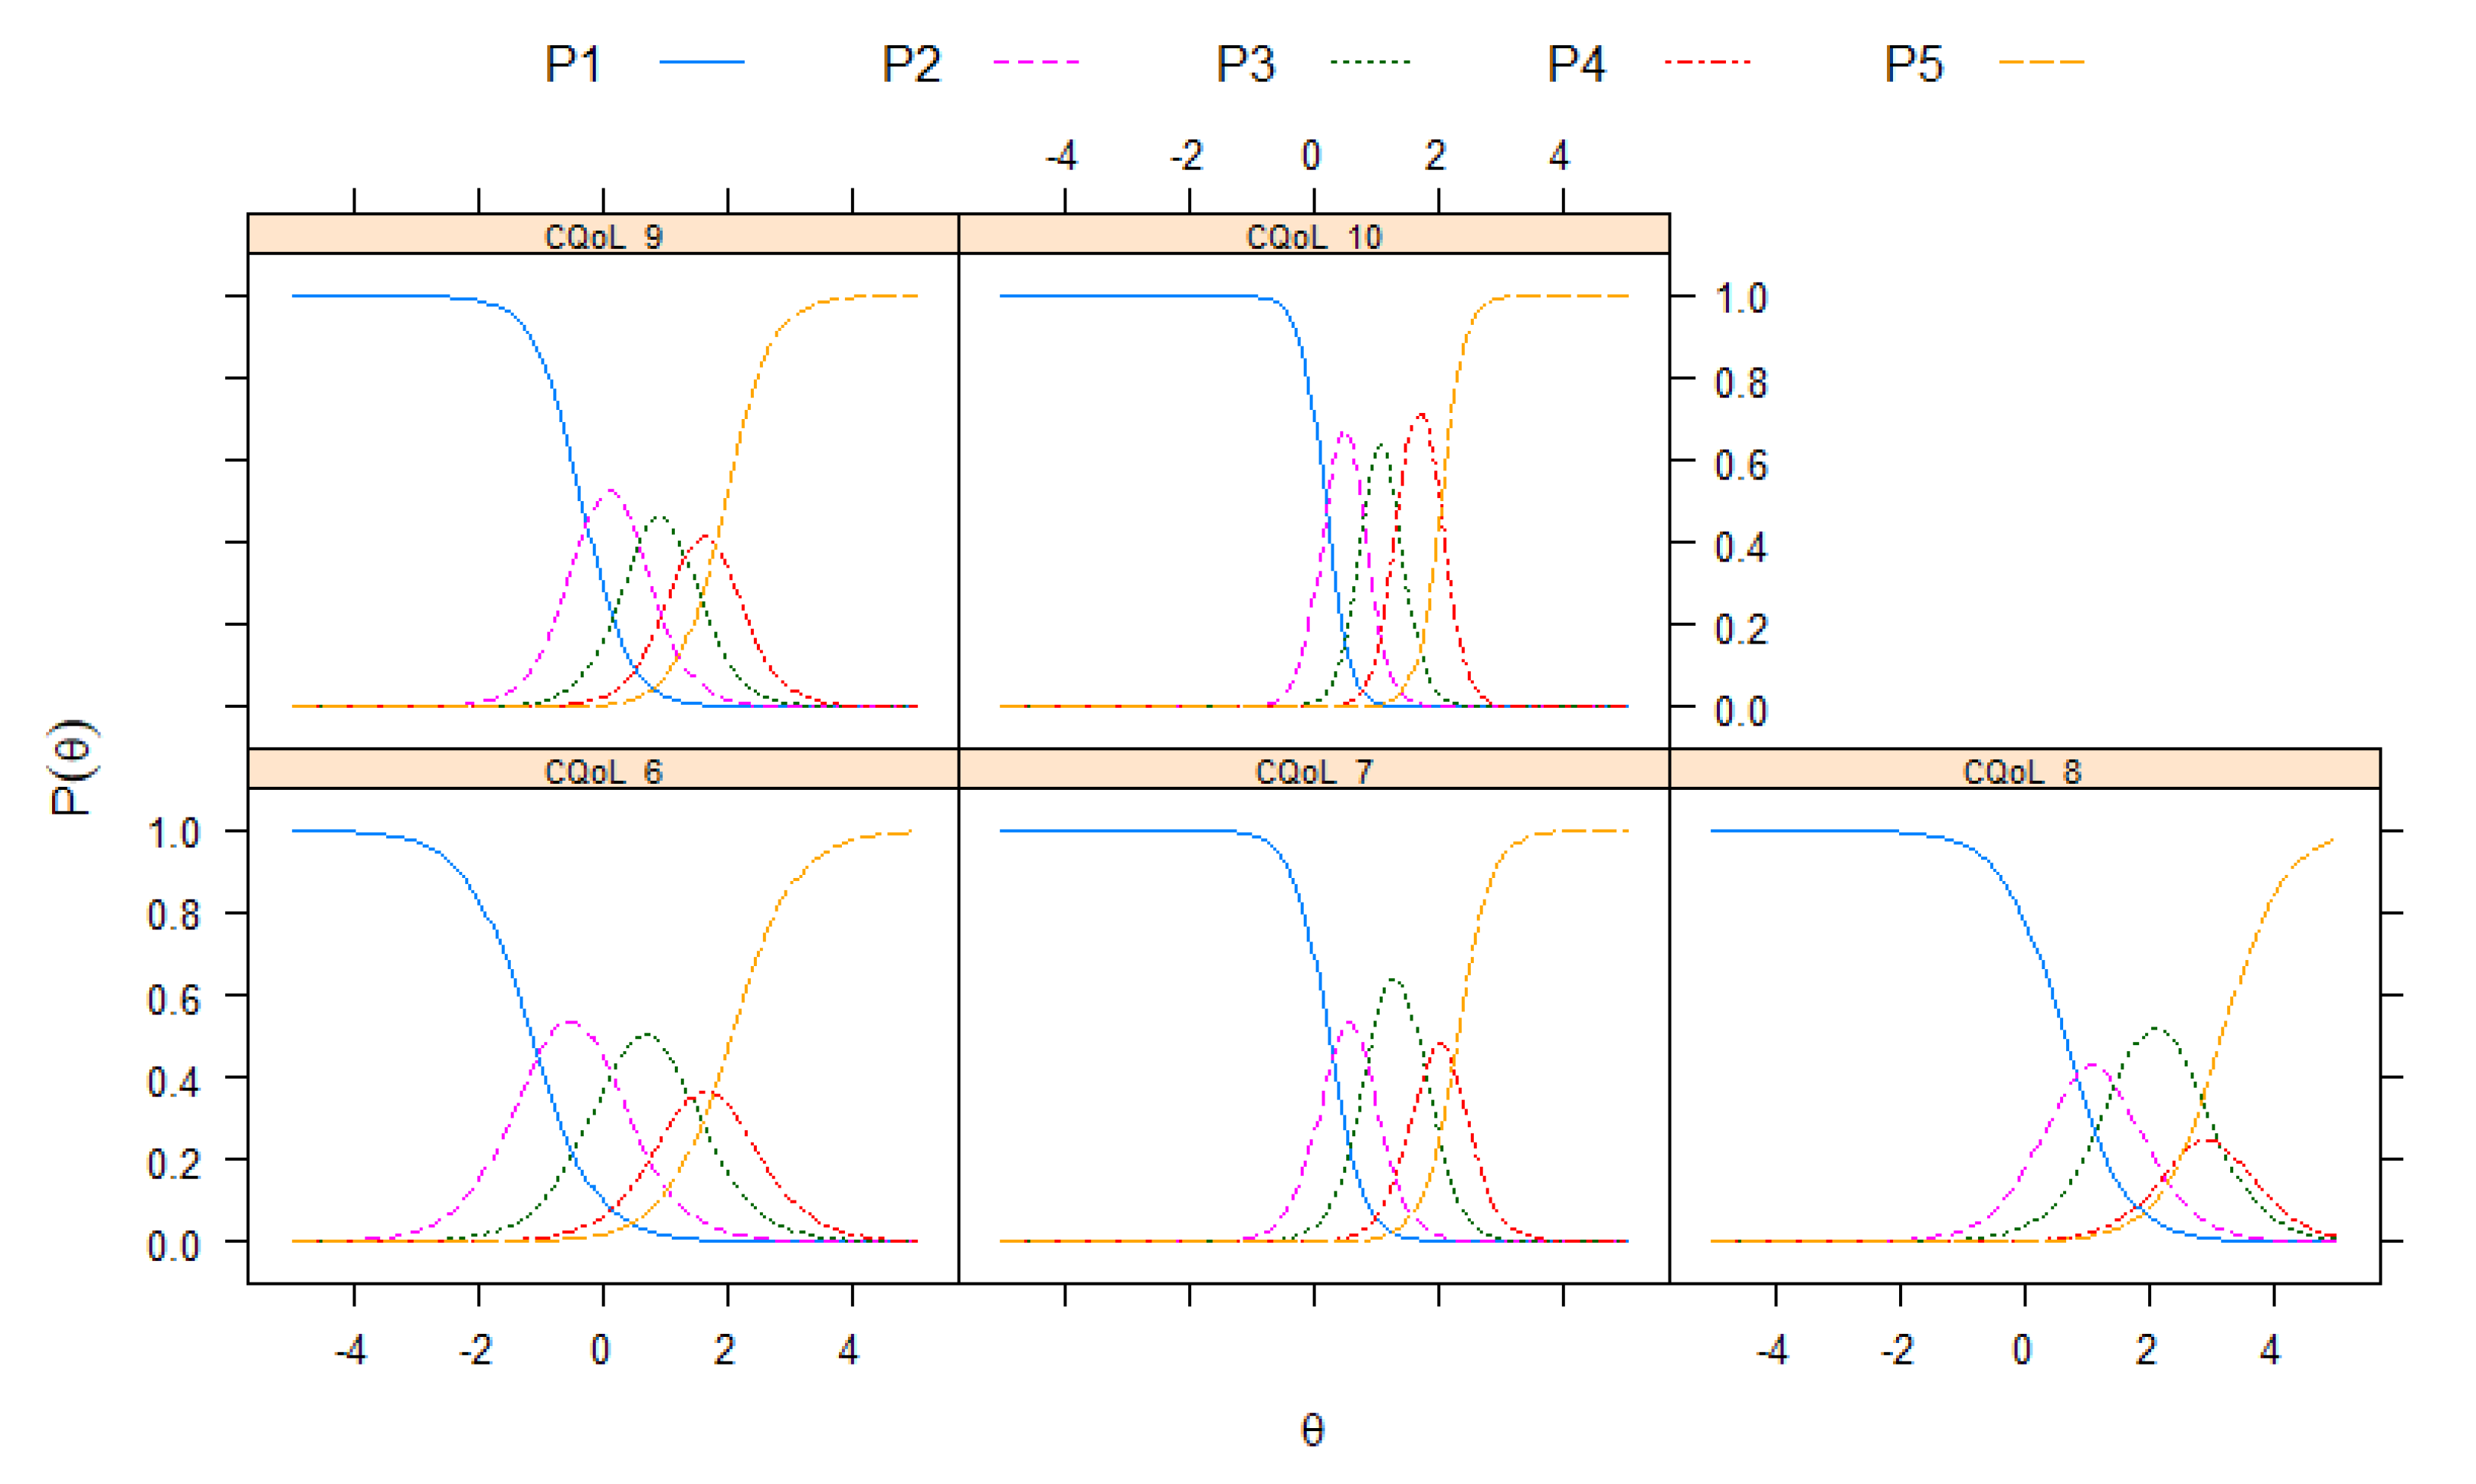
Item difficulties. In Table 10, we illustrate results regarding the item difficulty parameters. It is worth noting that in the specific context of CQoL, easy items represent the most critical CD-related aspects to be taken into account in support programmes. Indeed, these items are more easily endorsed even for low levels of perceived Limitations and Dysphoria. On the other hand, difficult items refer to CD impacts that require high levels of Limitations and Dysphoria to be observed.
Concerning dimension Limitations, the easiest items to endorse were CQoL_1 (feeling limited in eating with coworkers) and CQoL_3 (difficulty traveling or taking long trip), whereas the most difficult item was CQoL_5 (feeling worried about the increased risk that a family member has the celiac disease). About dimension Dysphoria, the easiest items to endorse were CQoL_6 (feeling socially stigmatised) and CQoL_9 (not being able to live a normal life), whereas the most difficult item was CQoL_8 (trouble socialising due to the celiac disease). Regarding τ r parameters, results showed that higher levels of Dysphoria are needed to choose categories greater than 1 with respect to the dimension Limitations.

5. Discussion and Conclusions

Measuring quality of life in CD patients represents a suitable way for understanding how they perceive the impact of the chronic disorder on their life [48]. About that, the aim of this article was two-fold. First, we examined the properties of the items used to measure two relevant dimensions of the CQoL, namely Limitations and Dysphoria, exploiting suitable unidimensional IRT models. Results showed that global logit was the best link function for both the dimensions. Test Fisher information function, as well as item Fisher information function, pointed at satisfactorily item fit, especially for medium/medium-high levels of the latent trait. These results confirmed the item accuracy in measuring CQoL. A more in-depth analysis of item functioning through IRCCCs showed that participants tend to prefer the extreme categories or the middle-point on the 5-point Likert scale. Thus, they considered the other categories substantially useless. Moreover, right-shifting of the first category for some IRCCCs in Dysphoria dimension allowed us to state that socialising was not perceived as particularly compromised by CD for the participants. The latter also tend to declare that they did not feel depressed or overwhelmed because of CD.
The second aim of this paper consisted in detecting sub-populations of CD patients that are homogenous with respect to the CQoL. Here, we considered the multidimensionality of the measurement model, taking into account jointly the two dimensions of Limitations and Dysphoria. We compared several models belonging to the class of Multidimensional Latent Class IRT models for ordinal polytomous items and considered the effect of some individual covariates. Detecting homogeneous groups according to Limitations and Dysphoria represents a useful step for addressing patients to tailored therapies and support programmes.
Standard LC model estimation with a different number of classes indicated that the latent structure of our data was made up of three latent classes, increasing ordered according to the levels of both the analysed dimensions (Limitations and Dysphoria). Consistently with the results obtained in the application of unidimensional IRT models, the model with global logit link reached the best fit. In particular, the bidimensional LC 1P-RS-GRM, characterised by constraints on both cutoff points and discrimination parameters, was selected as the best model according to BIC criterion. Thus, all items have the same power in discriminating patients with different levels of CQoL. About dimensions, psychological aspects related to CD (Dysphoria) provide better discrimination among subjects than limitations due to CD.
Latent class average weights indicated that Class 2 is the largest one, followed by Class 1. Hence, the majority of participants reported low or medium level of perceived limitations and dysphoria, that is, high and medium level of CQoL. Besides, results about item difficulties allowed us to know that the most critical aspect related to CD, which must be taken into account in the development of support programmes, are limitations in eating with coworkers and travelling, social stigmatisation and the feeling of not living a normal life due to CD. On the other hand, the less critical aspects are feeling worried about the increased risk that a family member has the celiac disease and socialisation trouble, which emerge only for high levels of Limitations and Dysphoria. These in-depth results provide an evidence of how the type of analysis we proposed can be useful in a tailored approach to health promotion programmes.
Finally, according to the literature on CQoL, we investigated the effects of some individual and CD-related characteristics on class weights. Type of celiac disease was not significant, showing that patients feel overwhelmed and limited by CD regardless the presence of symptoms. Although several studies reported worse level of CQoL in subjects with high severity of symptoms [11,15,49], our findings are coherent with the results of an Italian study [50] in which only minor differences between symptomatic and asymptomatic patients were reported. Age and marital status presented differently an impact on CQoL, confirming what is generally found in the literature [6,15]. Furthermore, perceived social support and age at diagnosis were relevant covariates in our model, according to findings reported in [13,49]. It is known that perceived social support can assume both the form of emotional and instrumental support, helping CD patients to manage stress, improve motivation in gluten-free diet, and prevent depressive symptoms. Moreover, levels of perceived Limitations due to CD and Dysphoria were higher for who received a CD diagnosis in adolescence or adult age. Indeed, in adolescence or adulthood the assumption of the new habits required by CD could appear more difficult.
The main findings encourage future use of the multidimensional latent class IRT model to evaluate even more CD-related factors, such as motivation, self-regulation, and self-efficacy [51,52]. Indeed, the development of interventions to improve CQoL and patients adaptation to CD limitations should also consider psychological aspects in addition to environmental facilities such as gluten-free choices in restaurants.

Author Contributions

Conceptualization, S.B.; methodology, S.B., M.I.; software, S.B., M.I.; validation, S.B.; formal analysis, R.F.; investigation, M.I.; resources, D.C..; data curation, D.C.; writing—original draft preparation, S.B., R.F., M.I.; writing—review and editing, S.B., M.I., R.F.; visualization, R.F.; supervision, M.I.; project administration, S.B., M.I. All authors have read and agreed to the published version of the manuscript.

Funding

This research received no external funding.

Acknowledgments

Silvia Bacci acknowledges the financial support provided by the “Dipartimenti Eccellenti 2018-2022” ministerial funds.

Conflicts of Interest

The authors declare no conflict of interest.

Abbreviations

The following abbreviations are used in this manuscript:
1P-GRM1-Parameter Graded Response Model
1P-RS-GRM1-Parameter Rating Scale Graded Response Model
CDCeliac Disease
CQoLCeliac Quality of Life
GPCMGeneralised Partial Credit Model
GRMGraded Response Model
IRCCCsItem Response Category Characteristic Curves
IRTItem Response Theory
LCLatent Class
LRTLikelihood-ratio tests
MPSSMultidimensional scale of Perceived Social Support
POMProportional Odds Model
RSRating Scale
RS-GRMRating Scale Graded Response Model

References

  1. Fasano, A.; Catassi, C. Current approaches to diagnosis and treatment of celiac disease: An evolving spectrum. Gastroenterology 2001, 120, 636–651. [Google Scholar] [CrossRef]
  2. Green, P.H.R.; Rostami, K.; Marsh, M.N. Diagnosis of celiac disease. Best Pract. Res. 2005, 19, 389–400. [Google Scholar] [CrossRef]
  3. Bech, P. Quality of life measurements in chronic disorders. Psychother. Psychosom. 1993, 59, 1–10. [Google Scholar] [CrossRef] [PubMed]
  4. Borgaonkar, M.R.; Irvine, E.J. Quality of life measurement in gastrointestinal and liver disorders. Gut 2000, 47, 444–454. [Google Scholar] [CrossRef] [PubMed] [Green Version]
  5. Casellas, F.; Rodrigo, L.; Vivancos, J.L.; Riestra, S.; Pantiga, C.; Baudet, J.S.; Junquera, F.; Puig Diví, V.; Abadia, C.; Papo, M.; et al. Factors that impact health-related quality of life in adults with celiac disease: A multicenter study. World J. Gastroenterol. 2008, 14, 46–52. [Google Scholar] [CrossRef] [PubMed] [Green Version]
  6. Häuser, W.; Gold, J.; Stein, J.; Caspary, W.F.; Stallmach, A. Health-related quality of life in adult coeliac disease in Germany: Results of a national survey. Eur. J. Gastroenterol. Hepatol. 2006, 18, 747–754. [Google Scholar] [CrossRef]
  7. Sainsbury, K.; Mullan, B. Measuring beliefs about gluten free diet adherence in adult coeliac disease using the theory of planned behaviour. Appetite 2011, 56, 476–483. [Google Scholar] [CrossRef] [Green Version]
  8. Cinquetti, M.; Trabucchi, C.; Menegazzi, N.; Comucci, A.; Bressan, F.; Zoppi, G. Psychological problems connected to the dietary restrictions in the adolescent with coeliac disease. Med Surg. Pediatr. 1999, 21, 279–283. [Google Scholar]
  9. Sainsbury, K.; Marques, M.M. The relationship between gluten free diet adherence and depressive symptoms in adults with coeliac disease: A systematic review with meta-analysis. Appetite 2018, 120, 578–588. [Google Scholar] [CrossRef] [Green Version]
  10. Sawyer, S.M.; Drew, S.; Yeo, M.S.; Britto, M.T. Adolescents with a chronic condition: Challenges living, challenges treating. Lancet 2007, 369, 1481–1489. [Google Scholar] [CrossRef]
  11. Deepak, C.; Berry, N.; Vaiphei, K.; Dhaka, N.; Sinha, S.K.; Kochhar, R. Quality of life in celiac disease and the effect of gluten-free diet. JGH Open Open Access J. Gastroenterol. Hepatol. 2018, 2, 124–128. [Google Scholar]
  12. Zingone, F.; Iavarone, A.; Tortora, R.; Imperatore, N.; Pellegrini, L.; Russo, T.; Dorn, S.D.; Ciacci, C. The Italian translation of the celiac disease-specific quality of life scale in celiac patients on gluten free diet. Dig. Liver Dis. 2013, 45, 115–118. [Google Scholar] [CrossRef] [PubMed]
  13. Sainsbury, K.; Halmos, E.P.; Knowles, S.; Mullan, B.; Tye-Din, J.A. Maintenance of a gluten free diet in coeliac disease: The roles of self-regulation, habit, psychological resources, motivation, support, and goal priority. Appetite 2018, 125, 356–366. [Google Scholar] [CrossRef] [PubMed] [Green Version]
  14. Barratt, S.M.; Leeds, J.S.; Sanders, D.S. Quality of Life in Coeliac Disease is Determined by Perceived Degree of Difficulty Adhering to a Gluten-Free Diet, not the Level of Dietary Adherence Ultimately Achieved. J. Gastrointest. Liver Dis. 2011, 20, 241–245. [Google Scholar]
  15. Lee, A.R.; Wolf, R.; Contento, I.; Verdeli, H.; Green, P.H.R. Coeliac disease: The association between quality of life and social support network participation. J. Hum. Nutr. Diet. 2016, 29, 383–390. [Google Scholar] [CrossRef]
  16. Dowd, A.J.; Jung, M.E.; Chen, M.Y.; Beauchamp, M.R. Prediction of adherence to a gluten-free diet using protection motivation theory among adults with coeliac disease. J. Hum. Nutr. Diet. 2016, 29, 391–398. [Google Scholar] [CrossRef]
  17. Van der Linden, W.J.; Hambleton, R.K. Handbook of Modern Item Response Theory; Springer: New York, NY, USA, 1997. [Google Scholar]
  18. Bacci, S.; Bartolucci, F.; Gnaldi, M. A class of multidimensional latent class IRT models for ordinal polytomous item responses. Commun. Stat.-Theory Methods 2014, 43, 787–800. [Google Scholar] [CrossRef] [Green Version]
  19. Dorn, S.D.; Hernandez, L.; Minaya, M.T.; Morris, C.B.; Hu, Y.; Leserman, J.; Lewis, A.; Lee, S.; Bangdiwala, P.; Green, P.H.R.; et al. The development and validation of a new coeliac disease quality of life survey (CD-QOL). Aliment. Pharmacol. Ther. 2010, 31, 666–675. [Google Scholar] [CrossRef]
  20. Zimet, G.D.; Dahlem, N.W.; Zimet, S.G.; Farley, G.K. The multidimensional scale of perceived social support. J. Personal. Assess. 1988, 52, 30–41. [Google Scholar] [CrossRef] [Green Version]
  21. Chalmers, R.P. mirt: A multidimensional item response theory package for the R environment. J. Stat. Softw. 2012, 48, 1–29. [Google Scholar] [CrossRef] [Green Version]
  22. McCullagh, P. Regression models for ordinal data (with discussion). J. R. Stat. Soc. Ser. B 1980, 42, 109–142. [Google Scholar]
  23. Tutz, G. Hierarchical Models for the Analysis of Likert Scales in Regression and Item Response Analysis. Int. Stat. Rev. 2020. [Google Scholar] [CrossRef]
  24. Samejima, F. Estimating of latent ability using a response pattern of graded scores. Psychom. Monogr. Suppl. 1969, 1, i-169. [Google Scholar]
  25. Samejima, F. Graded response model. In Handbook of Item Response Theory; Van der Linden, W., Ed.; Springer: New York, NY, USA, 2016; pp. 95–108. [Google Scholar]
  26. Van der Ark, L.A. Relationships and properties of polytomous Item Response Theory models. Appl. Psychol. Meas. 2001, 25, 273–282. [Google Scholar] [CrossRef] [Green Version]
  27. Muraki, E. Fitting a polytomous item response model to Likert-type data. Appl. Psychol. Meas. 1990, 14, 59–71. [Google Scholar] [CrossRef] [Green Version]
  28. Muraki, E. A generalized partial credit model: Application of an EM algorithm. Appl. Psychol. Meas. 1992, 16, 159–176. [Google Scholar] [CrossRef]
  29. Masters, G.N. A Rasch model for partial credit scoring. Psychometrika 1982, 47, 149–174. [Google Scholar] [CrossRef]
  30. Masters, G.N.; Wright, B. The essential process in a family of measurement models. Psychometrika 1984, 49, 529–544. [Google Scholar] [CrossRef]
  31. Tutz, G. Sequential item response models with an ordered response. Br. J. Math. Stat. Psychol. 1989, 43, 39–55. [Google Scholar] [CrossRef]
  32. Tutz, G. A Taxonomy of Polytomous Item Response Models. arXiv 2020, arXiv:2010.01382v1. [Google Scholar]
  33. Rijmen, F.; Tuerlinckx, F.; De Boeck, P.; Kuppens, P.A. Nonlinear mixed model framework for Item Response Theory. Psychol. Methods 2003, 8, 185–205. [Google Scholar] [CrossRef] [PubMed] [Green Version]
  34. Bartolucci, F.; Bacci, S.; Gnaldi, M. Statistical Analysis if Questionnaires: A Unified Approach based on R and Stata; Chapman & Hall, CRC Press: Boca Raton, FL, USA, 2015. [Google Scholar]
  35. Schwarz, G. Estimating the dimension of a model. Ann. Stat. 1978, 6, 461–464. [Google Scholar] [CrossRef]
  36. Bartolucci, F.; Bacci, S.; Gnaldi, M. MultiLCIRT: An R package for multidimensional latent class item response models. Comput. Stat. Dtaa Anal. 2014, 71, 971–985. [Google Scholar] [CrossRef] [Green Version]
  37. Goodman, L.A. Exploratory latent structure analysis using both identifiable and unidentifiable models. Biometrika 1974, 61, 215–231. [Google Scholar] [CrossRef]
  38. Lazarsfeld, P.F.; Henry, N.W. Latent Structure Analysis; Houghton Mifflin: Boston, MA, USA, 1968. [Google Scholar]
  39. Bartolucci, F. A class of multidimensional IRT models for testing unidimensionality and clustering items. Psychometrika 2007, 72, 141–157. [Google Scholar] [CrossRef]
  40. von Davier, M. A general diagnostic model applied to language testing data. Br. J. Math. Stat. Psychol. 2008, 61, 287–307. [Google Scholar] [CrossRef]
  41. Sen, S.; Cohen, A.S. Applications of mixture IRT models. A literature review. Meas. Interdiscip. Res. Perspect. 2019, 17, 177–191. [Google Scholar] [CrossRef]
  42. Bacci, S.; Gnaldi, M.; Kunze, T.; Greiff, S. Students’ complex problem solving profiles. Psychometrika 2020, 85, 469–501. [Google Scholar]
  43. McLachlan, G.; Peel, D. Finite Mixture Models; Wiley: New York, NY, USA, 2000. [Google Scholar]
  44. Dayton, C.M.; Macready, G.B. Concomitant-variable latent-class models. J. Am. Stat. Assoc. 1988, 83, 173–178. [Google Scholar] [CrossRef]
  45. Formann, A.K. Mixture analysis of multivariate categorical data with covariates and missing entries. Comput. Stat. Data Anal. 2007, 51, 5236–5246. [Google Scholar] [CrossRef]
  46. Rost, J. Rasch models in latent classes: An integration of two approaches to item analysis. Appl. Psychol. Meas. 1990, 14, 271–282. [Google Scholar] [CrossRef] [Green Version]
  47. Rost, J.; von Davier, M. Mixture distribution Rasch models. In Foundations, Recent Developments and Applications; Fischer, G.H., Molenaar, I.W., Eds.; Springer: New York, NY, USA, 1995; pp. 257–268. [Google Scholar]
  48. Marsilio, I.; Canova, C.; D’Odorico, A.; Ghisa, M.; Zingone, L.; Lorenzon, G.; Savarino, E.V.; Zingone, F. Quality-of-Life Evaluation in Coeliac Patients on a Gluten-Free Diet. Nutrients 2020, 12, 2981. [Google Scholar] [CrossRef] [PubMed]
  49. Zarkadas, M.; Cranney, A.; Case, S.; Molloy, M.; Switzer, C.; Graham, I.D.; Butzner, J.D.; Rashid, M.; Warren, R.E.; Burrows, V. The impact of a gluten-free diet on adults with coeliac disease: Results of a national survey. J. Hum. Nutr. Diet. 2006, 19, 41–49. [Google Scholar] [CrossRef] [PubMed]
  50. Altobelli, E.; Paduano, R.; Gentile, T.; Caloisi, C.; Marziliano, C.; Necozione, S.; di Orio, F. Health-related quality of life in children and adolescents with celiac disease: Survey of a population from central Italy. Health Qual. Life Outcomes 2013, 11, 1–9. [Google Scholar] [CrossRef] [PubMed] [Green Version]
  51. Abu-Janb, N.; Jaana, M. Facilitators and barriers to adherence to gluten-free diet among adults with celiac disease: A systematic review. J. Hum. Nutr. Diet. 2020, 33, 786–810. [Google Scholar] [CrossRef]
  52. Fueyo-Díaz, R.; Magallón-Botaya, R.; Gascón-Santos, S.; Asensio-Martínez, Á.; Palacios-Navarro, G.; Sebastián-Domingo, J.J. The effect of self-efficacy expectations in the adherence to a gluten free diet in celiac disease. Psychol. Health 2019, 35, 734–749. [Google Scholar] [CrossRef]
Figure 1. Left panel: Perceived limitations; Central panel: Dysphoria; Right panel: Perceived social support (MPSS global score).
Psych 02 00023 g001
Figure 2. Test Fisher information function I ( θ i ) for both Limitations (left) and Dysphoria (right) dimensions.
Psych 02 00023 g002
Figure 3. Item Fisher information curves, I j ( θ i ) ( j = 1 , , 5 ): items 1 to 5, dimension ’Limitations’.
Psych 02 00023 g003
Figure 4. Item Fisher information curves, I j ( θ i ) ( j = 6 , , 10 ): items 6 to 10, dimension ’Dysphoria’.
Psych 02 00023 g004
Figure 5. Item response category characteristic curves: items 1 to 5, dimension Limitations. P 1 = P ( Y i j = 1 | θ i ) , P 2 = P ( Y i j = 2 | θ i ) , P 3 = P ( Y i j = 3 | θ i ) , P 4 = P ( Y i j = 4 | θ i ) , P 5 = P ( Y i j = 5 | θ i ) .
Psych 02 00023 g005
Figure 6. Item response category characteristic curves: items 6 to 10, dimension Dysphoria. P 1 = P ( Y i j = 1 | θ i ) , P 2 = P ( Y i j = 2 | θ i ) , P 3 = P ( Y i j = 3 | θ i ) , P 4 = P ( Y i j = 4 | θ i ) , P 5 = P ( Y i j = 5 | θ i ) .
Psych 02 00023 g006
Table 1. Summary statistics concerning the characteristics of the 210 respondents of the survey.
Gender
Female (91.4%), Male (8.6)%
Type of celiac disease
Classical (61.90%), Atypical (9.50%), Silent (10.50%), Asymptomatic (18.10%)
Age at diagnosis
Childhood (19.00%), Adolescence (18.10%), Adult age (62.90%)
Age
Min (18), Max (77), Mean (35.86), Sd(12.36)
Marital status
Married or Cohabiting (60.00%), Other (40.00%)
Table 2. Celiac Quality of Life. Frequency distribution of the 10 items assessed on a 5-point scale, from 1 to 5; internal consistency reliability (Cronbach’s alpha) if-item-omitted ( α ); item-to-total correlation ( ρ ).
ItemDescriptionNot at AllSlightlyModeratelyQuite a BitA Great Deal α ρ
Limitations
CQoL_1I feel like I’m limited in eating meals with coworkers0.170.160.370.180.120.720.81
CQoL_2I feel like I am not able to have special food like birthday cake and pizza0.160.200.250.220.170.740.77
CQoL_3I find it difficult to travel or take long trips because of my disease0.120.200.340.220.120.760.72
CQoL_4I feel afraid to eat out because my food may be contaminated0.150.180.260.210.200.760.74
CQoL_5I feel worried about the increased risk of one of my family members having celiac disease0.090.120.180.250.360.790.66
Dysphoria
CQoL_6I feel socially stigmatised for having this disease0.070.110.300.330.190.870.79
CQoL_7I feel depressed because of my disease0.020.040.150.200.590.840.85
CQoL_8I have trouble socialising because of my disease0.010.010.100.190.690.880.71
CQoL_9I feel like I cannot live a normal life because of my disease0.050.090.190.290.380.850.84
CQoL_10I feel overwhelmed about having this disease0.030.070.130.200.570.830.89
Table 3. Social support. Frequency distribution of the 12 items assessed on a 6-point scale, from 1 to 6; internal consistency reliability (Cronbach’s alpha) if-item-omitted ( α ); item-to-total correlation ( ρ ).
ItemDescriptionStrongly DisagreeMostly DisagreeDisagree a BitAgree a BitMostly AgreeStrongly Agree α ρ
1There is a special person who is around when I am in need0.040.030.040.110.240.540.950.82
2There is a special person with whom I can share joys and sorrows0.040.020.050.080.250.560.950.86
3My family really tries to help me0.010.020.060.080.200.630.950.73
4I get the emotional help and support I need from my family0.030.010.060.110.200.590.950.80
5I have a special person who is the real source of comfort to me0.060.010.040.090.240.560.950.84
6My friends really tries to help me0.060.040.090.210.280.320.950.83
7I can count on my friends when things go wrong0.040.060.090.220.300.290.950.84
8I can talk about my problems with my family0.030.030.090.110.230.510.950.84
9I have friends with whome I can share my joys and sorrows0.050.050.090.170.260.380.950.79
10There is a special person in my life who cares about my feelings0.050.030.030.080.200.610.950.78
11My family is willing to help me make decisions0.030.020.030.090.210.620.950.85
12I can talk about my problems with my friends0.060.060.070.170.260.380.950.78
Table 4. Maximum log-likelihood and BIC index for the GRM and GPCM models estimated on Limitations and Dysphoria (the smallest BIC values are in boldface).
DimensionModellogLikBIC
LimitationsGRM−1465.983065.64
GPCM−1472.093077.85
DysphoriaGRM−1040.822215.31
GPCM−1044.102221.88
Table 5. Maximum log-likelihood, number of parameters and BIC index for standard LC models with k = 1 , , 5 (the smallest BIC value is in boldface).
klogLik#parBIC
1−2905.81406025.51
2−2581.45815596.01
3−2456.261225564.88
4−2391.491635654.55
5−2352.292045795.38
Table 6. Maximum log-likelihood, number of parameters and BIC index for the GRM and GPCM (the smallest BIC value is in boldface).
logLik#parBIC
GRM−2492.33545273.40
GPCM−2492.72545274.18
Table 7. BIC indices for competing IRT models: GRM, RS-GRM, 1P-GRM, 1P-RS-GRM (the smallest BIC value is in boldface).
BIC
GRM5273.40
RS-GRM5164.38
1P-GRM5250.64
1P-RS-GRM5154.46
Table 8. Estimated support points (in logit) for each dimension and average class weights for the bidimensional LC 1P-RS-GRM with covariates.
Latent Class
Dimension123
Limitations0.932.724.67
Dysphoria−0.242.455.55
Avg. weights0.380.440.18
Table 9. Regression coefficients ( β ^ 1 ), standard error ( s e ^ ), t-value, p-value, and Odds Ratio (OR) for the individual covariates.
Covariate β ^ 1 s e ^ t-Valuep-ValueOR
Age−0.020.01−1.430.150.98
Social support−0.050.01−4.090.000.95
Age at diagnosis (childhood as reference): Adolescence1.260.482.600.013.53
Age at diagnosis (childhood as reference): Adult age0.970.432.260.022.64
Marital status (married or cohabiting as reference): Other−0.470.32−1.480.140.63
Table 10. Item difficulty parameters ( δ j and τ r ) for the multidimensional 1P-RS-GRM model with covariates. Here γ j = 1 for all j = 1 , , J .
DimensionItem δ j τ 2 τ 3 τ 4 τ 5
Limitations 0.001.403.084.48
CQoL_10.00
CQoL_20.22
CQoL_30.17
CQoL_40.40
CQoL_51.38
Dysphoria 0.002.004.165.75
CQoL_60.00
CQoL_72.31
CQoL_83.24
CQoL_91.01
CQoL_102.06
Publisher’s Note: MDPI stays neutral with regard to jurisdictional claims in published maps and institutional affiliations.

