Sparse Radiocarbon Data Confound Culture-Climate Links in Late Pre-Columbian Amazonia


Institute of Archaeology, University College London, 31-34 Gordon Square, London WC1H 0PY, UK
Quaternary 2019, 2(4), 33; https://0-doi-org.brum.beds.ac.uk/10.3390/quat2040033
Submission received: 30 August 2019
/
Revised: 20 September 2019
/
Accepted: 25 September 2019
/
Published: 27 September 2019
(This article belongs to the Special Issue Changing Nature of Socio-Ecological Interactions in the Americas: From PalaeoAmerican Through to Present Day)
Abstract
:It has recently been argued that pre-Columbian societies in the greater Amazon basin during the Late Holocene were subject to “adaptive cycling”. In this model, cultures practicing “intensive” land use practices, such as raised field agriculture, were vulnerable to perturbations in hydroclimate, whereas “extensive” land use patterns, such as polyculture agroforestry, are viewed as more resilient to climate change. On the basis of radiocarbon data, the relative rise and fall of late pre-Columbian cultures and their inferred patterns of land use in six regions are highlighted to exemplify this model. This paper re-examines the radiocarbon evidence marshalled in favour of adaptive cycling, demonstrating that alleged temporal patterning in these data are overwhelmingly likely due to a combination of sampling effects, lack of statistical controls, and unacknowledged uncertainties that are inherent to radiocarbon dating. The outcome of this combination of factors seriously limits the possibility of cross-referencing archaeological data with palaeo-ecological and -climatological data without controlling for these effects, undermining the central archaeological pillar in support of adaptive cycling in Amazonia. This paper illustrates examples of such mitigation measures and provides the code to replicate them. Suggestions for how to overcome the serious limitations identified in the Late Holocene radiocarbon record of Amazonia are presented in the context of ongoing debates on inferring climatic causation in archaeological and historical datasets.
1. Introduction
A recent perspective paper in Nature Ecology and Evolution [1] proposes that late pre-Columbian societies in Amazonia that possessed intensive systems of land use were vulnerable to changes in hydroclimate. Conversely, societies with extensive land use systems, such as polyculture agroforestry on Amazonian Dark Earths, were resilient to such perturbations. The authors (hereafter De Souza et al.) marshal palaeoecological and palaeoclimatic records to scaffold a review of 11 archaeological cultures in six regions of Amazonia, including the coastal Guianas, which exemplify this pattern. Radiocarbon (14C) data, which underpin the archaeological component of this model, are calibrated and aggregated into summed probability distributions (SPDs) [2] to illustrate the relative rise and fall of different land use systems over time. The proposed model is framed in terms of adaptive cycles [3], in which “intensive” archaeological cultures late in their cycles gave way to “extensive” cultures that were encountered close to their apex at, and after, AD 1492.
The potential heuristic value of this model is intriguing for its ability to assess the historical and contextual developments that took place within indigenous Amazonian societies, as well as the impacts and landscape-scale legacies engendered by these developments. A closer integration of palaeo-ecology and -climatology with archaeology is also timely [4]. If such a synthesis is to be achieved in future research, however, archaeology must hold up its side of the bargain and make allied disciplines fully aware of the uncertainties that affect much of our data [5]. In this brief communication, the archaeological radiocarbon dataset in [1] is employed to do exactly this. The re-analysis demonstrates that: (i) the arbitrary discard of dates from an already small dataset, (ii) absent sensitivity analysis, and (iii) inherent imprecision combined with uncertainty are largely responsible for the patterns of archaeological activity reported in the paper [1]. These problems are mutually dependent and reinforcing, which together greatly undermine the terms on which the adaptive cycles model is advanced. They also place strong limits on viable comparisons to other records. The aim of this assessment is to help to identify fruitful areas for future work.
Methods for identifying and handling the issues outlined above are readily available in the statistical packages already employed by De Souza et al. (notably rcarbon), which is applied extensively here [6]. These analyses are fully documented and reproducible with the accompanying R code and data tables adapted from [1], and are straightforward to execute on the average desktop computer. The data presented by De Souza and colleagues is adequately described in their supplementary information and this paper has therefore eschewed presenting and discussing it in detail—except where necessary to make a point. Only dates that are affiliated to a cultural phase analysed in the original paper are used (i.e., phases such as Pocó and Manacapuru do not feature). Space does not permit an extensive review of methods for the aggregate analysis of radiocarbon data [2,7]. Instead, this paper opts for in-text outlines of analytical decisions as they become relevant to discussion, which are separated broadly into the topics in points i–iii (above). For technical details, the reader is referred to the commented supplementary code (Supplementary Materials). All calibrated dates are presented in calendar years (cal BC/AD) as per the original study. Furthermore, a custom calibration curve is developed, which combines the northern and southern hemisphere curves [8], and the post-calibration dates probability distributions are not normalised. SPDs are normalised to allow for direct comparisons of their shape. Although the paper primarily presents a revision of the 14C analysis itself and the decisions implicit therein, the reanalysis also leads to the epistemological basis on which archaeological 14C is interpreted in Amazonia to be questioned.
2. Truncating Data Limits Inferences
The two patterns of land use that are advanced for pre-Columbian Amazonia by De Souza et al. are contrasted by visually comparing SPDs derived from dates affiliated to “extensive” or “intensive” phases within six regions [1]. Before doing this, however, the paper takes the step of pre-filtering the 14C dates (n = 337) as sequences of phases, to use the terminology of the OxCal calibration software [9]. By modelling the phases as a continuous uniform distribution, this procedure tags certain dates as phase “outliers”, ultimately reducing the sample by 11 dates (n = 326). Given the small number of dates reported per region (Table 1), the sub-samples are disproportionately vulnerable to any removals. As a result, any removals ought to be justified on contextual (archaeological or stratigraphic) grounds. As the term “outlier” implies, the withheld dates overwhelmingly lie at the beginning and end of the phases. The effect of this can be observed directly by comparing SPDs from the full dataset and the truncated dataset used in the paper (Figure 1).
In examining the relative rise and fall of archaeological phases, it is straightforward to see that systematically subsetting exacerbates the separation of phases in time—particularly if the withheld dates bracket the known temporal ranges of phases. An example would be the Guarita–Paredão pairing (Central Amazon), where the former phase is shifted away from the latter and towards the present in the limited dataset, but not in the full dataset. Effectively, the phase modelling introduces a form of unaccounted-for “forward bias” into the data [9], which is especially visible in the Marajoara–Santarém pairings (Eastern Amazon region).
Support for the adaptive cycles model, from an archaeological point of view, is largely predicated on the degree (or lack of) visual overlap between phases. By modelling the Bayesian prior as a continuous uniform distribution with simple boundaries, the paper produces phase models where even heavily overlapping 14C dates from the same site and with the same cultural affiliation are withheld from further analysis. As noted, the majority of the withheld dates are either the oldest or youngest in their phase. The analytical purpose of the phase modelling before deriving SPDs is not clear, despite the established precedent of using Bayesian modelling afterwards [9]. Effectively, archaeologically- and contextually-associated dates (e.g. Beta-143591 and Beta-178916 at the Hatahara site: 1250 ± 80, cal. AD 660–975; 1150 ± 40, cal. AD 910–1025, respectively) feature in the database, but not in the SPDs—on essentially arbitrary grounds. Additionally, the shapes of the SPDs are not uniformly distributed; most resemble bell curves or logistic curves (see Figure 1). Variants of these priors exist natively in OxCal [10] but were apparently not considered. The choice of a continuous uniform distribution is clearly inappropriate, and likely the main driver of identifying “outlying” dates that exaggerates the highlighted differences between phases. Without controlling for existing biases in the data—while also deliberately introducing another form of bias—the inferences that can be drawn from visual inspection of SPDs alone are limited. The subsequent analyses presented here, therefore, employ the full dataset.
3. Radiocarbon Data Needs Testing
Robust methods exist for comparative analyses of fluctuations in aggregated radiocarbon data and for estimating their significance [6]. Crema et al. [11] introduce a non-parametric test for divergences between subsets of a sample of radiocarbon data. The test incorporates a Monte Carlo procedure that randomly permutes the affiliation of dates to derive a confidence interval and a global p-value. Above and below the resulting confidence envelopes, observed SPDs are locally significantly different from the null expectation of no divergent temporal structure between subsets. As noted, the potential existence of diverging population histories in the face of climate change is the crux of the adaptive cycles model. Permutation testing on the numerous and variable subsets of the Amazonian data can test whether statistically significant regional divergences do occur, complementing the visual assessment of SPDs.
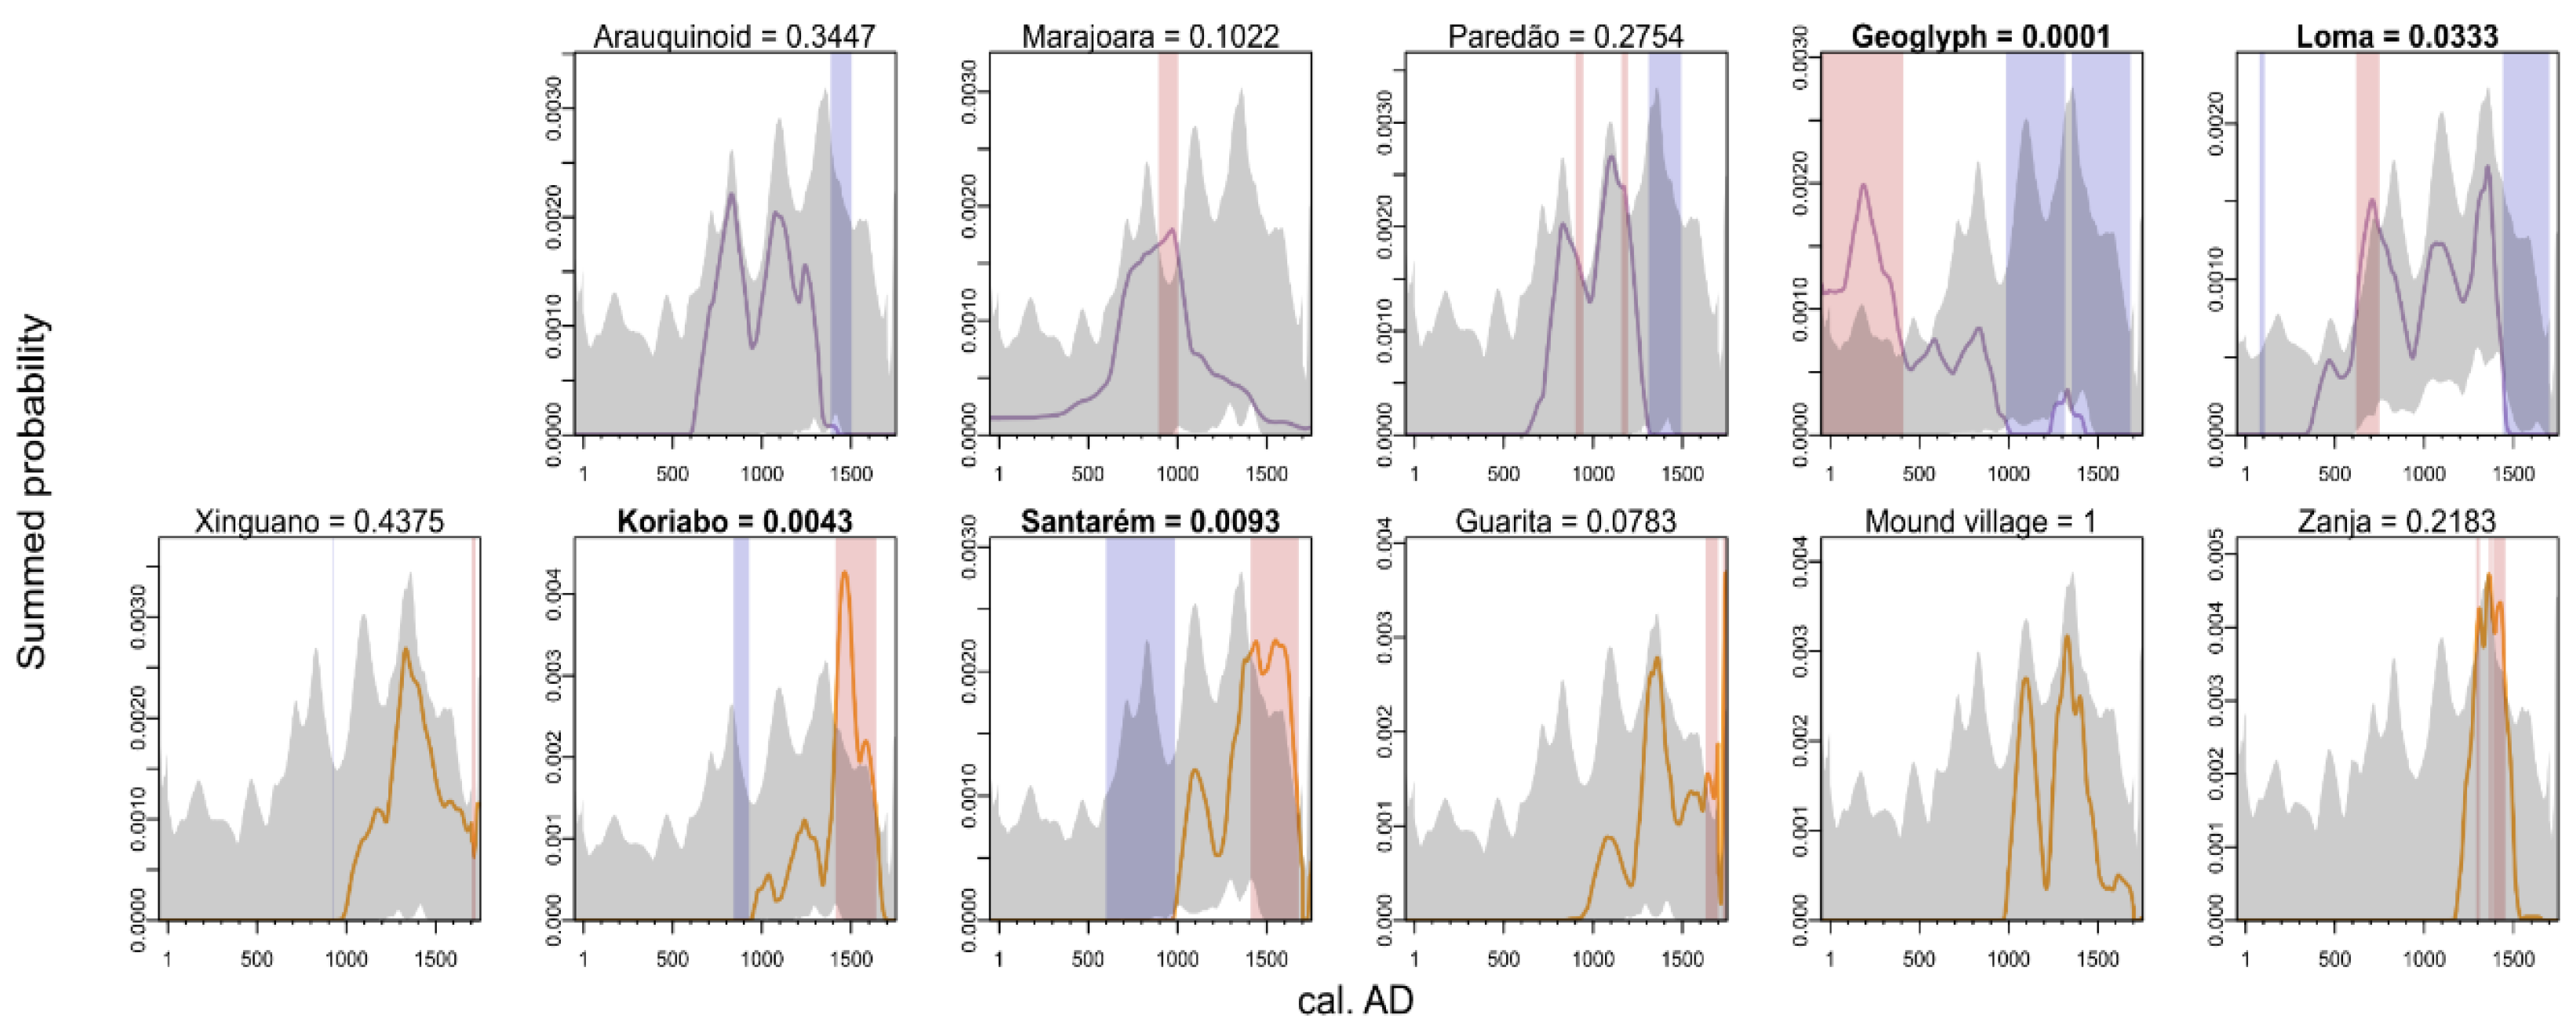
Figure 2 illustrates the results of the permutation test on the full dataset. The test is also applied to the truncated dataset (Figure S1). The results are not qualitatively different. Summarising these findings, we can observe that only four out of eleven phases display significant divergences from the null model of no divergent temporal structure (Geoglyphs, Lomas, Santarém, Koriabo). Of this group, only the latter three are explicitly highlighted as exemplary of the adaptive cycles model in De Souza et al. (see [1] pp. 7–8). The other four explicitly highlighted phases (Arauquinoid, Marajoara, Guarita, Xinguano) are statistically indistinguishable from the null model. The “extensive” phases do not separate out significantly from the “intensive” phases at the relevant points in time. The same is true of the remaining phases (Paredão, Zanjas, Mound villages).
Detailed inspection of the “significant” set (Geoglyphs, Lomas, Santarém, Koriabo) reveals that they do not necessarily support the adaptive cycles model either. Notably, the negative departures in the Koriabo (13 dates) and Santarém (44 dates) phases before AD ~1000 are artefacts of the analysis that are likely due to a lack of data in this interval relative to the sample as a whole, as opposed to a cultural phenomenon within their respective regions. In the case of Santarém, the small global p-value (p = 0.0093) is in part due to this spurious early negative phase, which is greater in duration than the later, positive departure. On the other hand, positive departures cannot be denied in Santarém and Koriabo, but they do not take place at the expense of the Arauquinoid (27 dates) or Marajoara (31 dates) phases as suggested by the adaptive cycles model. Similarly, the Loma phase (104 dates) may exhibit a negative event after AD ~1450, but it is not matched by a significant increase in the corresponding Zanja phase (13 dates). The Zanja SPD notably falls to nearly zero within a century of the Loma SPD doing so, as dates are generally lacking beyond AD 1500. This sharp drop-off following the Conquest is pervasive across the dataset, for obvious reasons.
Conversely, it appears plausible that the “Geoglyph” phase (23 dates) may reflect a long-term cycle relative to the dataset as a whole. Significant downturns after AD ~1000 dovetail with the end of the Medieval Climatic Anomaly (AD ~900–1100, see [1]). Nonetheless, periods of aridity in southwestern Amazonia also precede this interval [12] yet have no discernible consequences for geometric earthwork construction. Other drivers of long-term earthwork abandonment, which took place over approximately a millennium (see Figure 1), cannot be ruled out on the basis of the archaeological radiocarbon data alone.
In summary, seven out of eleven Amazonian cultural phases do not provide strong support either for or against the adaptive cycles model. The four that possess statistically significant trends are ambiguous in their support, as the causes of SPD variability cannot be resolved with the available data. As the permutation test is non-parametric, it is challenging to evaluate on methodological grounds whether there is a meaningful effect size and hence whether the analysis has sufficient statistical power, despite the disparities between phase sample sizes (E.R. Crema, pers. comm.). The analysis has thus far presumed, for illustrative purposes, that the observed patterns are robust and invariant to sample sizes. This is not necessarily the case; aggregate analysis of radiocarbon usually operates with hundreds, if not thousands, of dates per sample, particularly where relatively short-lived processes such as those advanced in De Souza et al. are concerned; see McLaughlin [13] for a case study of the Black Death. The paper now turns to alternate methods that are more suited to shedding light on this issue directly.
4. Uncertainty Undermines Small Datasets
At time of writing, summed probability distributions are virtually the standard method in archaeological research for visualising assemblages of calibrated radiocarbon dates [2,6,7]. They also have widely acknowledged limitations, such as sensitivity to calibration curve effects and downplaying the uncertainties associated to the archaeological sampling procedure itself [13,14,15]. Of relevance to the period under examination here is the presence of centennial-scale plateaus in the IntCal13 and SHCal13 radiocarbon curves. An emerging alternative to SPDs that accompanies rcarbon are composite kernel density estimates (KDEs) [13], which simultaneously minimise noise potentially introduced by calibration effects and directly estimate uncertainties. With adequately-resolved radiocarbon data and a kernel bandwidth parameter tailored to analytical needs, KDEs can detect short-term events that SPDs struggle to separate from noise. Through a bootstrapping procedure, KDEs also provide confidence intervals and hence insight into where the data provides explanatory power. Consequently, KDE ranges tend to terminate rather more abruptly than SPDs. For present purposes, the method is advantageous for illustrating the extent to which the Amazonian radiocarbon dataset is realistically representative of cultural responses to centennial-scale climate change.
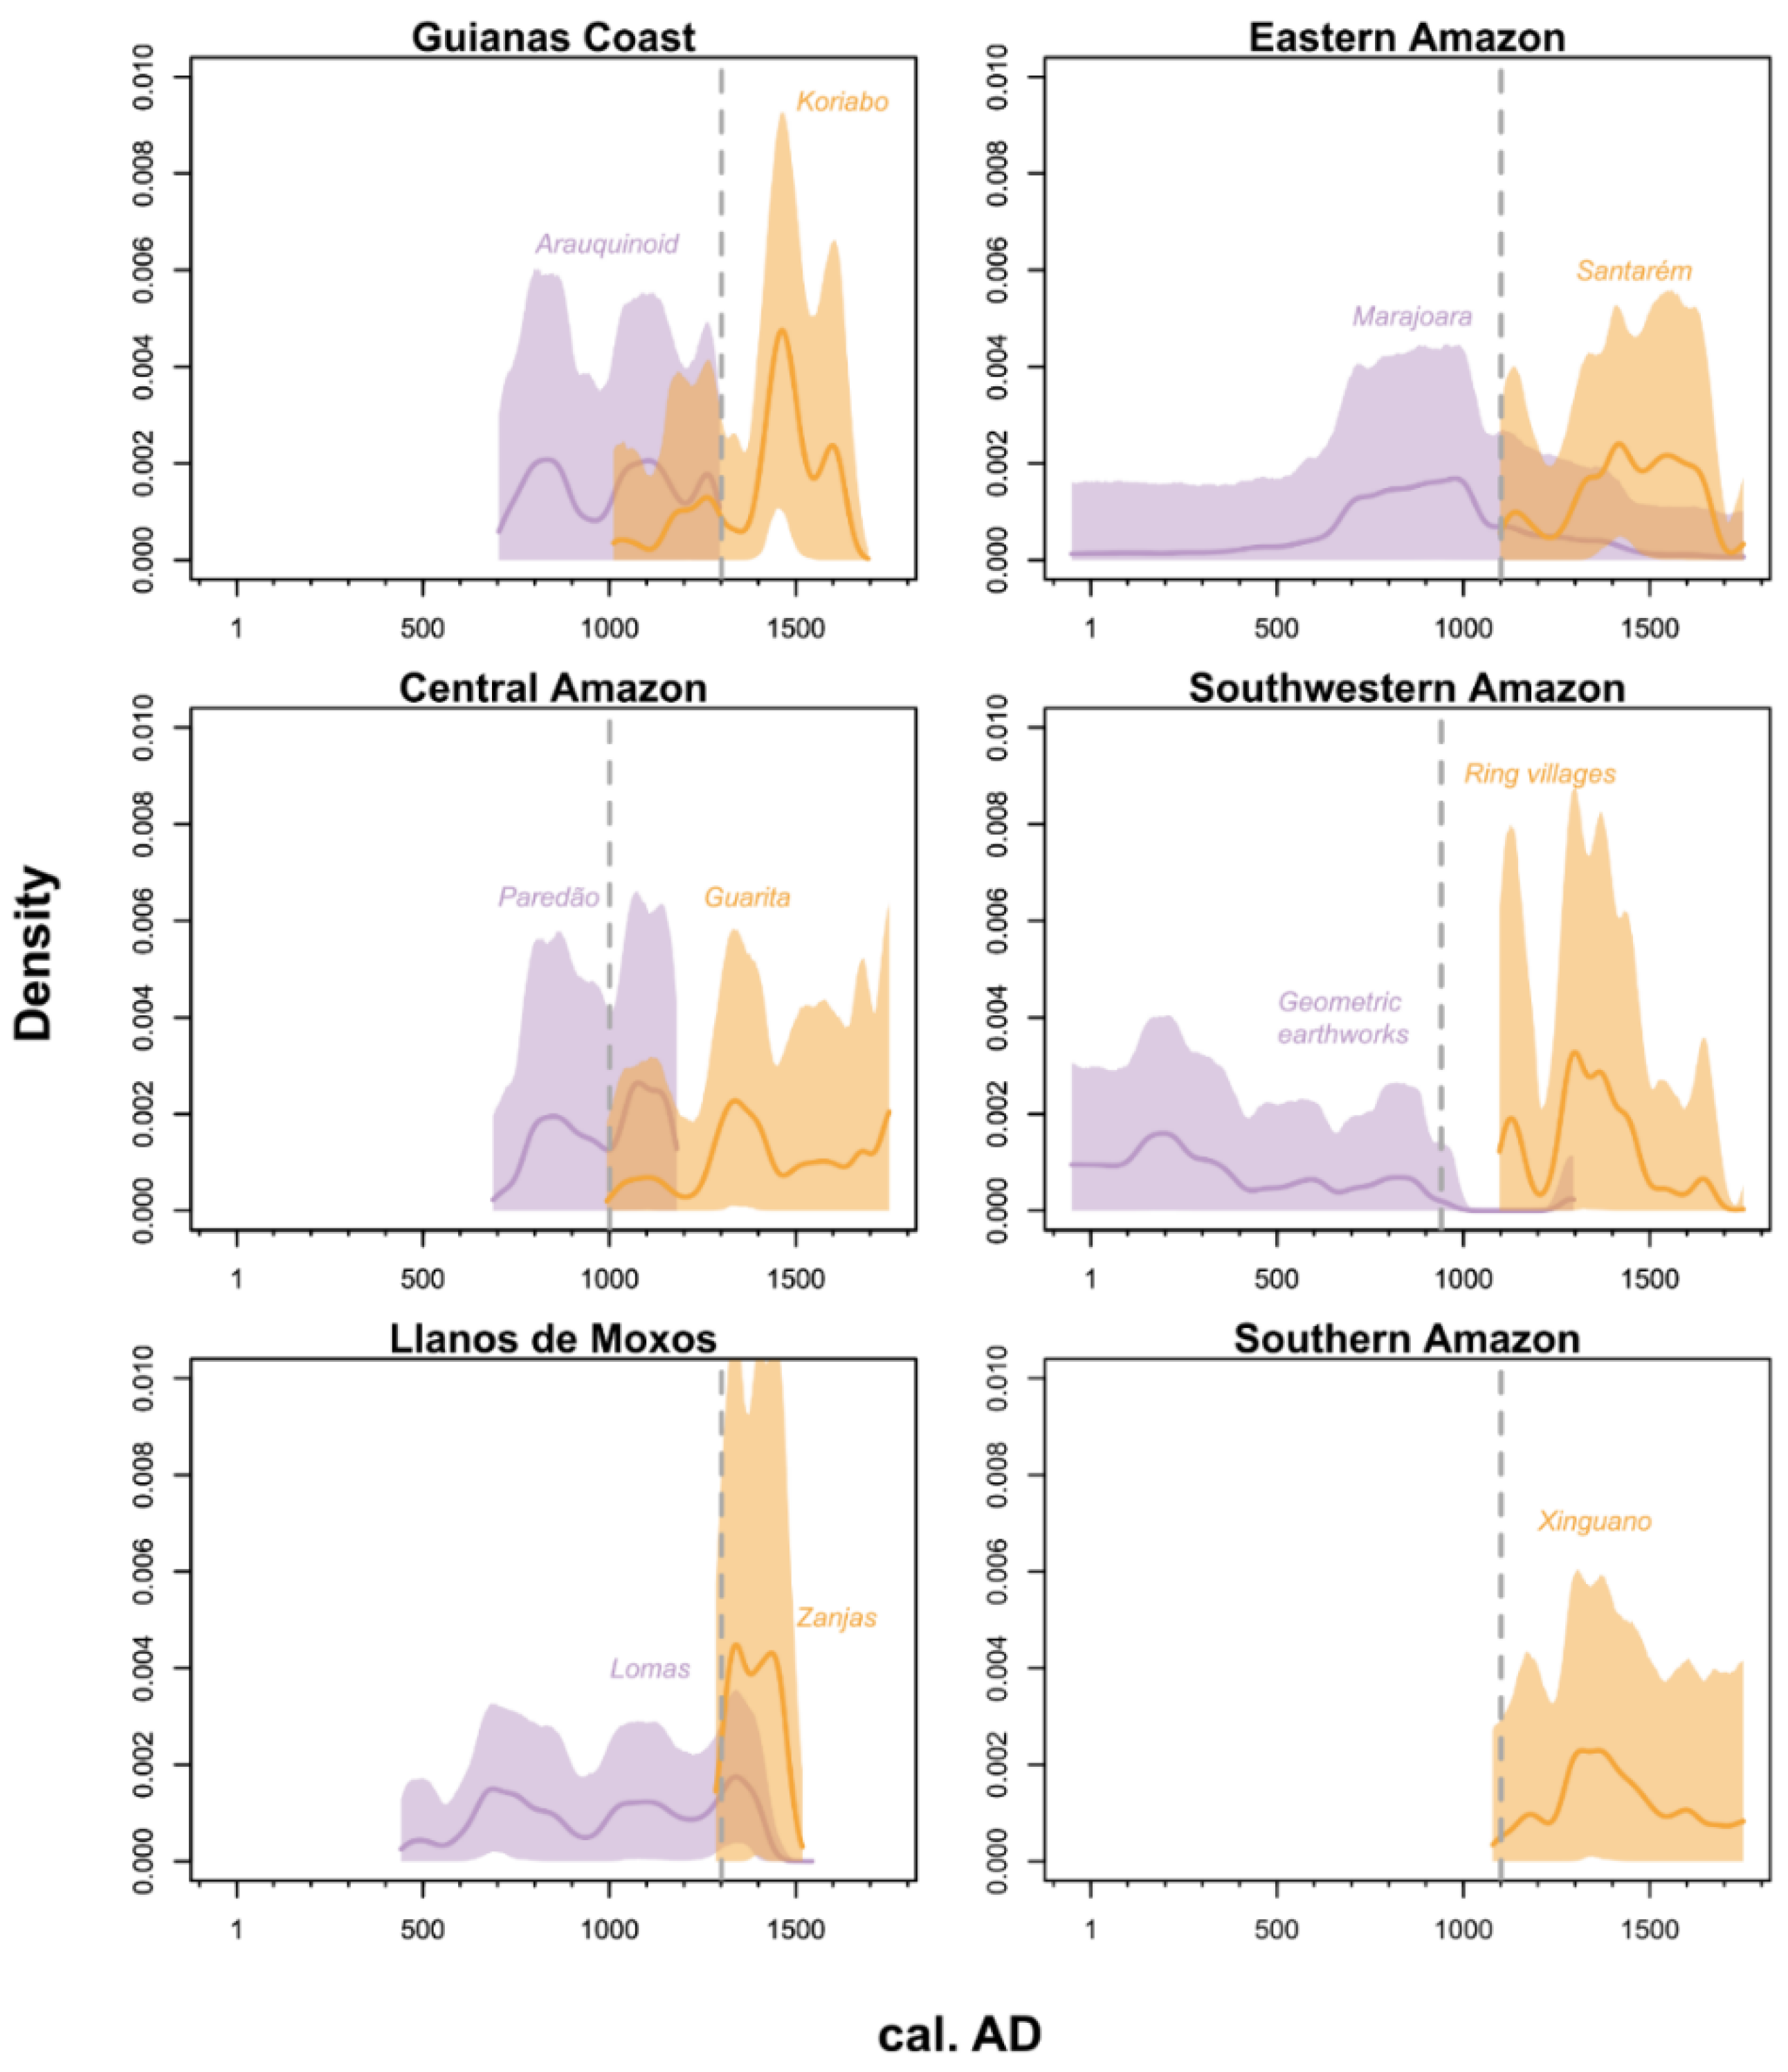
Figure 3 plots the pairs of composite KDEs from each region, produced with identical calibration and binning parameters to the SPDs. Following De Souza et al. [1], detecting short-term (sub-centennial) responses to specific instances of climate change is the point of interest. Kernel bandwidth is therefore set at 25 years. While increasing the bandwidth much beyond this value somewhat narrows the confidence intervals (a documented trade-off between uncertainty and precision [13]), it was found that larger values rapidly obscure any semblance of patterning in the radiocarbon data. The high sensitivity of the KDEs to this balancing act serves to underscore the real limitations of the dataset: on one hand, large bandwidths shorten the KDE date ranges to the point of being meaninglessly brief, while on the other, small bandwidths greatly inflate confidence intervals. This is entirely proportionate to the sample sizes involved; sparse data translate to less statistical confidence. In other words, exceptional confidence can be achieved over an extremely short time range, or high uncertainty can be tolerated in a longer time range that is scaled to the analytical objectives of De Souza et al.
The solid lines in Figure 3 are the bootstrapped confidence interval means and are somewhat misleading. The overlap (or lack thereof) of envelopes is the appropriate visual metric with KDEs in this case [13], which here largely illustrate a lack of separation in time between subsets of the data. The KDEs in the Llanos de Moxos region (Lomas and Zanjas) and the Central Amazon (Paredão and Guarita) counter-indicate a “rise and fall” associated to an adaptive cycle: the envelopes of the “intensive” phases increase at the points where the relevant climatic events start, and persist for over a century each. Furthermore, the range of the “intensive” Lomas actually outlasts the “extensive” Zanjas. In the case of the Eastern Amazon, the most apparent decline around AD ~1000 in Marajoara precedes the indicated drought. The Marajoara phase persists for the entire range of the Santarém phase with considerable overlap between the KDEs. The high proportion of KDE overlap indicates the degree to which the patterns here are indistinguishable, as the “true” level of archaeological activity may exist anywhere within the envelopes. The KDEs do not “separate out” as expected if there were genuine adaptive cycle occurring here.
The geometric earthworks (Southwestern Amazon) once again provide the strongest overall evidence in favour of drought sensitivity but must be viewed in the context of the preceding multi-centennial decline in earthwork construction that is unaffiliated to any significance climatic events. Geometric earthworks are also notable among the phases for being exclusively ceremonial, rather than associated to habitation or settlement [16]. The extent to which construction of non-settlement (‘ceremonial’) sites is indicative of trends in activity or adaptive capacity is not clear. Finally, a replacement of the Arauquinoid series by Koriabo ceramics (Coastal Guiana) appears plausible initially, however, the KDEs show that two phases also co-existed in the region for at least three centuries. The shapes of their overlapping KDEs do not imply a growth of one at the expense of another. Instead, the Arauquinoid KDE ceases where the sampling terminates, just before AD 1300, rather than visibly declining in the face of Koriabo pressure. Stepping briefly beyond the stated boundaries of the phases, it cannot be ruled out that the data in coastal Guiana may well represent a local replacement, yet the Arauquinoid cultural tradition itself persists in a widespread distribution until (and likely beyond) the Conquest [17].
A consistent pattern across these results is that the archaeological radiocarbon data is not sufficiently resolved to discern the magnitude, rate, and duration of cultural change as implied by an adaptive cycles model. Estimating confidence intervals from the phases (Figure 3) shows that the patterns illustrated previously (Figure 2) are likely not invariant to sample sizes. While visual differences exist (Figure 1), employing the full dataset and permutation testing somewhat undermines their reliability as potential indicators of relative levels of cultural activity. These patterns are themselves doubtful against the backdrop of direct estimates of statistical confidence. The likely culprit is sparse and/or insufficiently resolved data. In summary, the radiocarbon dates do not provide strong evidence either for or against an adaptive cycles model in late pre-Columbian Amazonia; the results indicate the density of the data is fundamentally unsuited to testing this hypothesis. The alternative hypothesis ([1] p. 9), stating that certain patterns may instead represent instances of conflict and/or migration, cannot be commented on directly using only radiocarbon data; SPDs and KDEs do not themselves track spatial trends or, by extension, population movements [18].
5. Conclusions
Historically, Amazonian archaeology has centred on the pursuit of understanding human-environment relationships. In the course of decades of debate on the relative importance of one factor or another, positions often became entrenched, opinions were polarised, and false dichotomies erected as barricades against the opposing camp. Archaeological research has greatly benefited from interdisciplinary research to help resolve polemics [4]. As noted in the introduction to this brief paper, there may be great utility in the synthetic thinking exemplified by, for example, De Souza et al. to this end. Increasingly, Amazonian archaeology is becoming open, multi-disciplinary, and as result, more concerned with quantitative analyses. In my opinion, the field is the better for it.
To this end, the provisioning of research data alongside the adaptive cycles model invites examination on its own terms. This option was simply not possible a decade or so ago. Note, however, that the evidence for climate-induced culture change in the model is based entirely on the separation in time of SPDs, with the implicit expectation that human responses to climate change will be reflected in the radiocarbon record on sub-centennial or generational time scales. Several mitigation strategies attempted to characterise this level of granularity in the reanalysis: using the full dataset, significance testing, and bootstrapping, while replicating the remaining parameters in the original analysis to the greatest extent possible. The first two of these measures failed to provide support for the presence of adaptive cycling. The third underlines (Figure 3) that the data are fundamentally unsuited to analyses at this scale, in large part due to the limited number of radiocarbon dates at the critical points where cultural transitions are said to occur. SPDs derived from handfuls of dates, for the reasons outlined in the preceding sections, have very serious limitations that the adaptive cycles model does not acknowledge. In summary: sparse radiocarbon data confound culture-climate links in late pre-Columbian Amazonia.
As stated in the introductory paragraphs, adaptive cycling and related models offer the potential for synthetic, integrative work across multiple disciplines. This paper does not question the influence of climate on society, or of humans on the environment, however, the archaeological evidence that has been presented as emblematic of this relationship in late pre-Columbian Amazonia is in its infancy. Few elements of the radiocarbon dataset provide strong support one way or the other. Recent reviews [19,20] argue that the opportunities afforded by the growing availability of data on ancient human activity must be tempered with realistic assessments of what exactly they represent. In addition to the issues this paper has highlighted, it is worth noting that many patterns in the adaptive cycles model are located in very close proximity to the European Conquest of the Americas. Previous archaeological studies of culture-climate links are especially cautious around known sampling disjunctures, such as the preference for numismatic dating in Roman Britain causing a “population decline” per the radiocarbon data [21]. It can be suggested that the Colonial-period radiocarbon data for Amazonia may not be much different in this regard, compounded by the well-known post-Conquest population collapses.
To assess how the problems discussed in this brief paper may be overcome, the straightforward answer is that more and better data is needed. Alternative strategies for future work may also circumvent the limitations of reified archaeological phases. For instance, with improvements in and wider adoption of archaeobotanical sampling techniques, it may be possible to emphasise the relative abundances of subsistence remains, as opposed to land use per se (see [21]), or with existing data, specific practices such as agricultural earthwork construction rates. It may also prove useful to abstract archaeological phases up to the habitat level (e.g. seasonally dry forests, floodplains, terra firme, uplands/foothills, etc.), or to simply cast a much wider net, with fewer but larger regions to be able to aggregate more dates. From a demographic point of view, recent advances use a combination of georeferenced archaeological data and ethnographic information to estimate absolute population numbers [22]. This may provide new lower boundaries for the intensity and distribution of pre-Columbian activity over time, bearing in mind that ethnographic density estimates for tropical groups would likely underestimate pre-Columbian population levels at least partially, necessitating the development of bespoke calibrations. These represent interesting challenges whose resolutions have the potential to be highly influential.
Quantitative analyses of archaeological and palaeoclimatic/ecological data represent an unparalleled opportunity to acquire a systematic understanding of how humans and their environments evolved over the extreme long term. Following [19], it can be anticipated that; (1) enhanced multidisciplinary data collection; (2) increased transparency about uncertainty in the data; and (3) analyses of causal mechanisms with appropriate statistical methods, rather than simple correlative relationships, will be growing areas of scholarship in Amazonia in the years to come.
Supplementary Materials
The following are available online at https://0-www-mdpi-com.brum.beds.ac.uk/2571-550X/2/4/33/s1, Figure S1: The regional permutation test executed on the limited dataset. There are no statistically significant changes compared to the full dataset.
Funding
Philip Riris is funded by the British Academy, grant number PF2\180065.
Acknowledgments
I thank Enrico Crema and Manuel Arroyo-Kalin for advice given and the editors for extending the invitation to contribute to this volume. Four reviewers provided valuable advice on clarifying the presentation of the data and results, and are gratefully acknowledged too.
Conflicts of Interest
The author declares no conflict of interest. The funders had no role in the design of the study; in the collection, analyses, or interpretation of data; in the writing of the manuscript, or in the decision to publish the results.
References
- De Souza, J.G.; Robinson, M.; Maezumi, S.Y.; Capriles, J.; Hoggarth, J.A.; Lombardo, U.; Novello, V.F.; Apaéstegui, J.; Whitney, B.; Urrego, D.; et al. Climate change and cultural resilience in late pre-Columbian Amazonia. Nat. Ecol. Evol. 2019, 3, 1007–1017. [Google Scholar] [CrossRef]
- Williams, A.N. The use of summed radiocarbon probability distributions in archaeology: A review of methods. J. Archaeol. Sci. 2012, 39, 578–589. [Google Scholar] [CrossRef]
- Gunderson, L.H.; Holling, C.S. Panarchy: Understanding Transformations in Human and Natural Systems; Island Press: Washington, DC, USA, 2002. [Google Scholar]
- Mayle, F.E.; Iriarte, J. Integrated palaeoecology and archaeology–a powerful approach for understanding pre-Columbian Amazonia. J. Archaeol. Sci. 2014, 51, 54–64. [Google Scholar] [CrossRef]
- Burg, M.B.; Peeters, H.; Lovis, W.A. Uncertainty and Sensitivity Analysis in Archaeological Computational Modeling; Springer: New York, NY, USA, 2016. [Google Scholar]
- Bevan, A.; Crema, E.R. rcarbon v1.3.0: Methods for Calibrating and Analysing Radiocarbon Dates. 2019. Available online: https://CRAN.R-project.org/package=rcarbon (accessed on 31 August 2019).
- Bronk Ramsey, C. Methods for summarizing radiocarbon datasets. Radiocarbon 2017, 59, 1809–1833. [Google Scholar] [CrossRef]
- Marsh, E.J.; Bruno, M.C.; Fritz, S.C.; Baker, P.; Capriles, J.M.; Hastorf, C.A. IntCal, SHCal, or a Mixed Curve? Choosing a 14C Calibration Curve for Archaeological and Paleoenvironmental Records from Tropical South America. Radiocarbon 2018, 60, 925–940. [Google Scholar] [CrossRef]
- Surovell, T.A.; Brantingham, P.J. A note on the use of temporal frequency distributions in studies of prehistoric demography. J. Arch. Sci. 2007, 34, 1868–1877. [Google Scholar] [CrossRef]
- Bronk Ramsey, C. Bayesian analysis of radiocarbon dates. Radiocarbon 2009, 51, 337–360. [Google Scholar] [CrossRef]
- Crema, E.R.; Habu, J.; Kobayashi, K.; Madella, M. Summed probability distribution of 14C dates suggests regional divergences in the population dynamics of the Jomon period in eastern Japan. PLoS ONE 2016, 11, e0154809. [Google Scholar] [CrossRef] [PubMed]
- Bird, B.W.; Abbott, M.B.; Vuille, M.; Rodbell, D.T.; Stansell, N.D.; Rosenmeier, M.F. A 2300-year-long annually resolved record of the South American summer monsoon from the Peruvian Andes. Proc. Natl. Acad. Sci. USA 2011, 24, 8583–8588. [Google Scholar] [CrossRef] [PubMed]
- McLaughlin, T.R. On applications of space–Time modelling with open-source 14C Age calibration. J. Archaeol. Method Theory 2019, 26, 479–501. [Google Scholar] [CrossRef]
- Brown, W.A. The past and future of growth rate estimation in demographic temporal frequency analysis: Biodemographic interpretability and the ascendance of dynamic growth models. J. Archaeol. Sci. 2017, 80, 96–108. [Google Scholar] [CrossRef] [Green Version]
- Torfing, T. Layers of assumptions: A reply to Timpson, Manning, and Shennan. J. Archaeol. Sci. 2015, 63, 203–205. [Google Scholar] [CrossRef]
- Schaan, D.P. Sacred Geographies of Ancient Amazonia: Historical Ecology of Social Complexity; Routledge: London, UK, 2016. [Google Scholar]
- Gassón, R.A. Orinoquia: The archaeology of the Orinoco River Basin. J. World Prehist. 2002, 16, 237–311. [Google Scholar] [CrossRef]
- Silva, F.; Vander Linden, M. Amplitude of travelling front as inferred from 14 C predicts levels of genetic admixture among European early farmers. Sci. Rep. 2017, 7, 11985. [Google Scholar] [CrossRef] [PubMed]
- Van Bavel, B.J.; Curtis, D.R.; Hannaford, M.J.; Moatsos, M.; Roosen, J.; Soens, T. Climate and society in long-term perspective: Opportunities and pitfalls in the use of historical datasets. Wiley Interdiscip. Rev. Clim. Chang. 2019, e611. [Google Scholar] [CrossRef]
- Contreras, D. The Archaeology of Human-Environment Interactions: Strategies for Investigating Anthropogenic Landscapes, Dynamic Environments, and Climate Change in the Human Past; Taylor & Francis: London, UK, 2016. [Google Scholar]
- Bevan, A.; Colledge, S.; Fuller, D.; Fyfe, R.; Shennan, S.; Stevens, C. Holocene fluctuations in human population demonstrate repeated links to food production and climate. Proc. Natl. Acad. Sci. USA 2017, 114, e10524-31. [Google Scholar] [CrossRef] [PubMed]
- Maier, A.; Lehmkuhl, F.; Ludwig, P.; Melles, M.; Schmidt, I.; Shao, Y.; Zeeden, C.; Zimmerman, A. Demographic estimates of hunter–gatherers during the Last Glacial Maximum in Europe against the background of palaeoenvironmental data. Quat. Int. 2016, 425, 49–61. [Google Scholar] [CrossRef]
Figure 1.
Comparison of normalised SPDs of full (filled envelopes) and limited (dashed line) datasets. Phases have been paired in columns (purple: “intensive”, orange: “extensive”) by region and plotted on a common y-axis. Xinguano dates are unpaired. Withheld dates affect the SPDs unevenly. The four subsets most affected (Santarém, Guarita, Paredão, Xinguano) have their ranges truncated to be narrower.

Figure 2.
Permutation test of cultural phases in Amazonia. Envelopes are based on 10000 permutations of the dataset. Phase names in bold possess statistically significant divergences from the Amazonian pattern (Geoglyphs, Lomas, Santarém, Koriabo). Locally significant anomalies are in red (positive) and blue (negative).

Figure 3.
Bootstrapped composite kernel density estimates by region. Colouration follows the same convention as previous figures. Shaded areas are the 95% confidence intervals around the data, solid lines indicate the confidence interval mean. Dashed vertical lines indicate the start of named climate events in each region following De Souza et al. [1].


Table 1.
Summary of dataset employed here. “Intensive” phases are in purple and roughly precede “extensive” phases in time, which are shown in orange. This convention is used consistently throughout this paper.
Table 1.
Summary of dataset employed here. “Intensive” phases are in purple and roughly precede “extensive” phases in time, which are shown in orange. This convention is used consistently throughout this paper.
| Region | Sites | 14C Dates | Bins |
|---|---|---|---|
| Guianas Coast | |||
| Arauquinoid | 7 | 27 | 9 |
| Koriabo | 8 | 13 | 9 |
| Eastern Amazon | |||
| Marajoara | 4 | 31 | 11 |
| Santarém | 8 | 44 | 13 |
| Central Amazon | |||
| Paredão | 8 | 33 | 8 |
| Guarita | 5 | 14 | 9 |
| Southwestern Amazon | |||
| Geoglyphs | 9 | 26 | 14 |
| Mound villages | 4 | 15 | 6 |
| Llanos de Moxos | |||
| Lomas | 5 | 104 | 25 |
| Zanjas | 2 | 13 | 4 |
| Southern Amazon | |||
| Xinguano | 4 | 17 | 8 |
© 2019 by the author. Licensee MDPI, Basel, Switzerland. This article is an open access article distributed under the terms and conditions of the Creative Commons Attribution (CC BY) license (http://creativecommons.org/licenses/by/4.0/).
Share and Cite
MDPI and ACS Style
Riris, P. Sparse Radiocarbon Data Confound Culture-Climate Links in Late Pre-Columbian Amazonia. Quaternary 2019, 2, 33. https://0-doi-org.brum.beds.ac.uk/10.3390/quat2040033
AMA Style
Riris P. Sparse Radiocarbon Data Confound Culture-Climate Links in Late Pre-Columbian Amazonia. Quaternary. 2019; 2(4):33. https://0-doi-org.brum.beds.ac.uk/10.3390/quat2040033
Chicago/Turabian StyleRiris, Philip. 2019. "Sparse Radiocarbon Data Confound Culture-Climate Links in Late Pre-Columbian Amazonia" Quaternary 2, no. 4: 33. https://0-doi-org.brum.beds.ac.uk/10.3390/quat2040033