Phase Stress Measurement of Centrifugally Cast Duplex Stainless Steel by Neutron Diffraction

Hitachi, Ltd., 7-1-1, Omika, Hitachi, Ibaraki 319-1292, Japan
Quantum Beam Sci. 2020, 4(3), 28; https://0-doi-org.brum.beds.ac.uk/10.3390/qubs4030028
Submission received: 10 June 2020
/
Revised: 21 July 2020
/
Accepted: 23 July 2020
/
Published: 29 July 2020
(This article belongs to the Special Issue Analysis of Strain, Stress and Texture with Quantum Beams)
Abstract
:Residual stress can be easily generated during material processing and affect the performance of structural components. Phase stress distribution in austenitic-ferritic duplex stainless steels (DSSs) is complicated due to the different material properties between the two phases. In this study, residual phase stress distribution along the thickness direction of centrifugally cast DSS hollow cylinder was measured by pulsed neutron diffraction with the time-of-flight (TOF) method. The triaxial phase stress distribution along the thickness direction shows that the phase stress of austenitic phase is generally in tension and higher than that of ferrite phase. From the outer surface to the inner surface, the macro-stress distributes from −400 MPa to 200 MPa. The mechanism of macro-stress formation was deduced by taking into consideration the thermal shrinkage behavior during the cooling process of water quench after the solution heat treatment. Furthermore, the lattice strain and phase stress evolution under the uniaxial tensile loading was evaluated by in-situ neutron diffraction measurement. The results indicated that the magnitude of phase stress could be affected by plastic working as well. All these measurements were conducted at Japan Proton Accelerator Research Complex (J-PARC).
1. Introduction
Austenitic-ferritic duplex stainless steels (DSSs) are widely applied to the seawater equipment and line pipes due to their high corrosion resistance and high mechanical properties. However, because of different coefficients of thermal expansion and elastic moduli [1] between the two phases, residual phase stresses occur when the material experiences a thermal history, such as casting, forging or annealing. The tensile residual stress may degrade the material properties, such as fatigue strength. Therefore, clarifying the formation of stress formation is considered as the key point to the countermeasures against this technical issue. According to the analysis of thermal elastic-plastic stress and strain in an austenitic-ferritic DSS with equal phase volume fractions by using the finite element method (FEM) [2,3], during the cooling process after solution treatment, tensile residual stress forms in austenitic (γ) phase and compressive residual stress forms in ferrite (α) phase. Besides the numerical analysis, the measurement of residual stress is also required.
As a powerful tool for material characterization, neutron diffraction is an ideal approach for the residual stress research of crystalline materials [4,5]. As for the multi-phase materials, Albertini et al. have revealed high tensile stress in the γ phase and high compressive stress in the α phase in a centrifugal bowl of duplex steel [6]. Harjo et al. have discussed the thermal residual elastic strains in ferrite-austenite Fe–Cr–Ni alloys with different phase volume fractions and found that the thermal residual stress of γ phase tended to increase with its decreasing phase volume fraction [7,8]. They have also discovered that the partitioned plastic strain in γ phase is larger than that in α phase under tensile loading according to the dislocation density analysis [9]. In addition, the combination of numerical analysis and the measurement results can provide a better understanding on the mechanism of phase stress distribution in dual phase materials. Johansson et al. have successfully developed a three-dimensional elastoplastic FEM model of triaxial stress analysis for DSS [10]. The micro-stresses predicted by the FEM simulations were comparable with the in-situ X-ray measurement. Daymond et al. have reported a good qualitive agreement between the self-consistent model and the experimental data of lattice strain behavior under tensile loading in both Fe/FeC3 ferrite steel and austenitic-ferritic DSS [11]. However, the effect of thermal history on phase stresses due to material processing such as casting has not been sufficiently discussed yet.
In this study, neutron diffraction was utilized to clarify the mechanism of residual stress formation in centrifugally cast DSS. The neutron diffraction measurements were conducted with an instrument for materials engineering called TAKUMI at Beam Line 19 of Materials and Life Science Experimental Facility (MLF) in Japan Proton Accelerator Research Complex (J-PARC) at an output power of 200 kW. The phase stresses of cast DSS were measured by pulsed white neutron with the time-of-flight (TOF) method [12]. Based on the measurement results, the mechanism of stress development during centrifugal casting was deduced. Furthermore, the lattice strain and phase stress evolution were evaluated by in-situ neutron diffraction under the uniaxial tensile loading, based on which the effect of plastic deformation was discussed. Some results in this article are summarized based on the author’s previous publications in Japanese [13,14].
2. Material and Methods
2.1. Material and Specimen
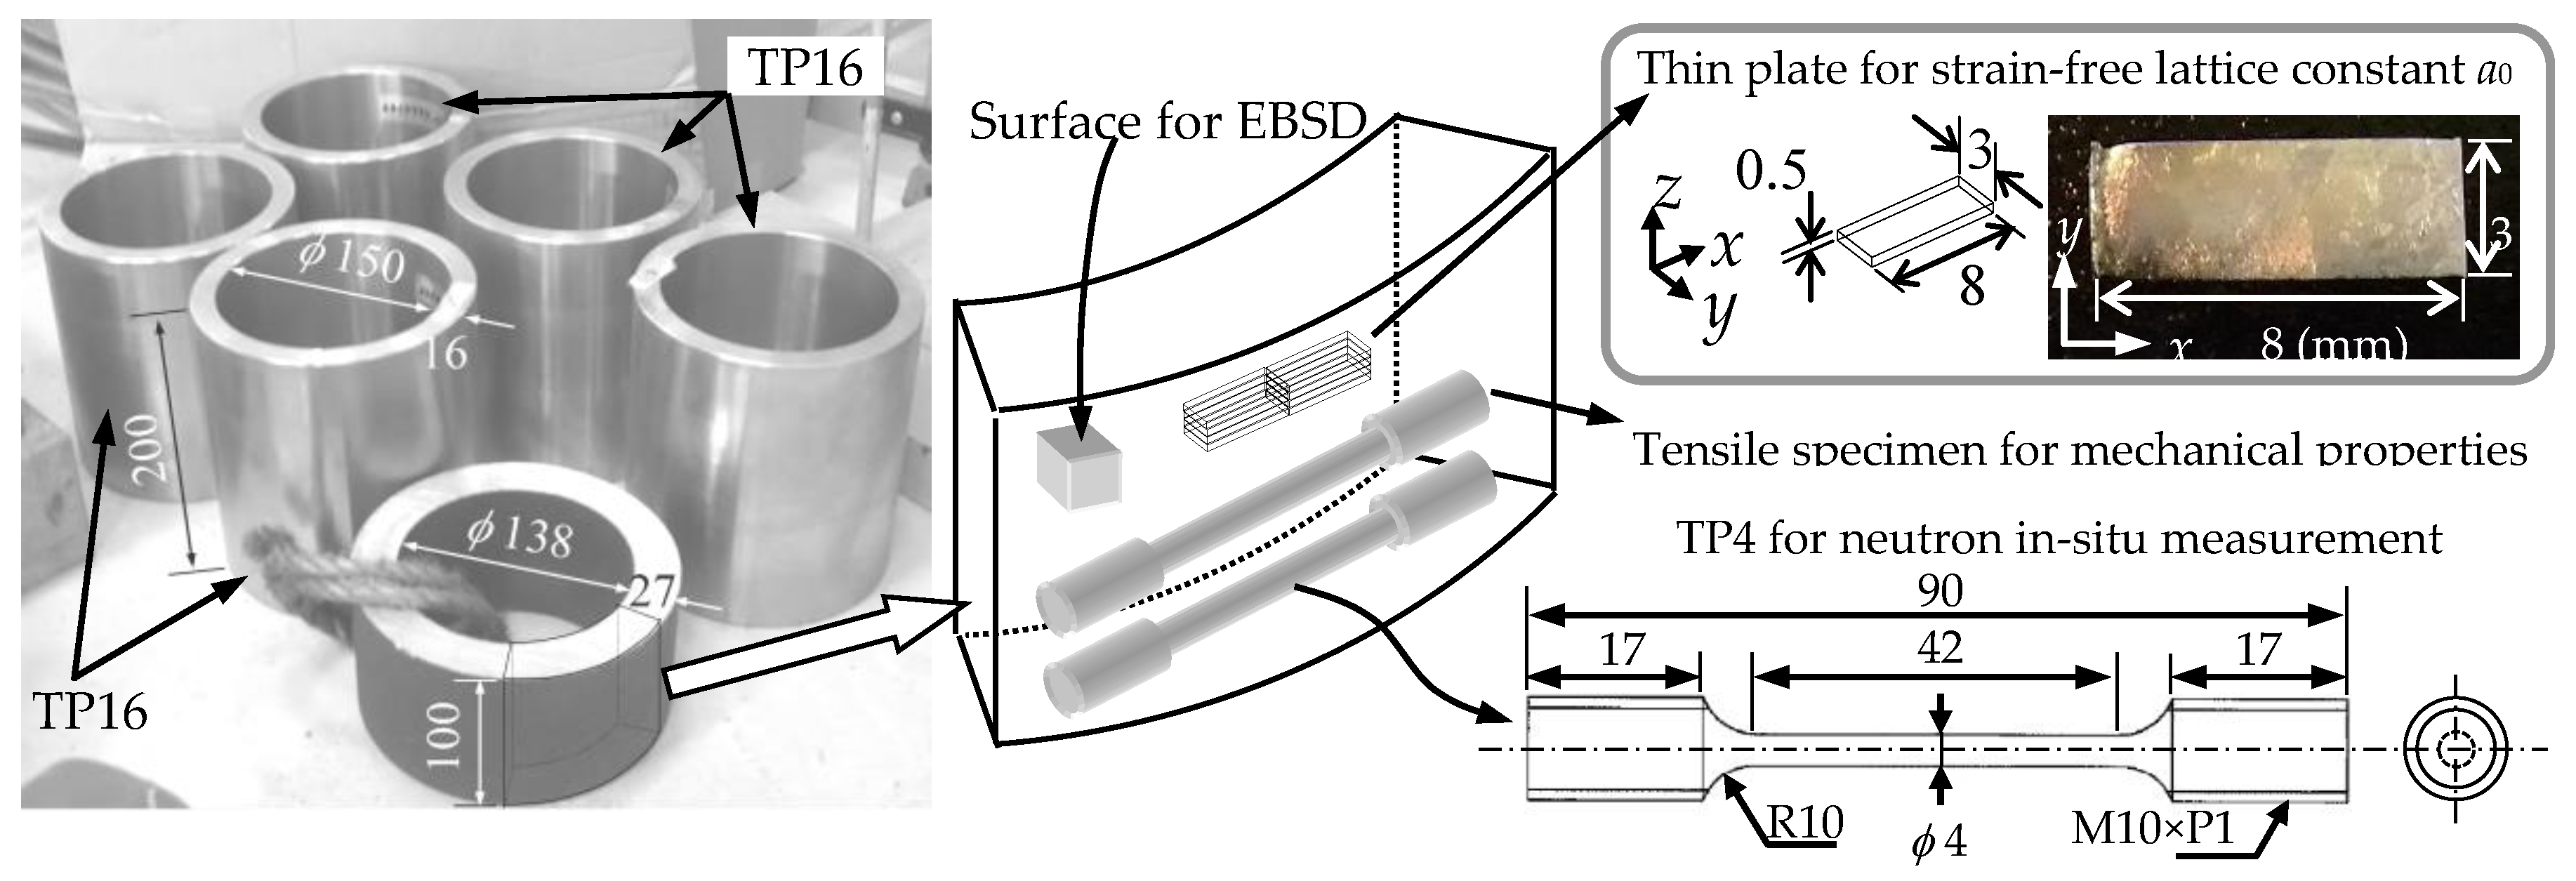
The experimental material is A890 Gr.3A, a centrifugally cast DSS of ASTM (American Society for Testing and Materials), as shown in Figure 1 [14]. The original dimensions of these hollow cylinders are φ 138 mm (inner diameter) × 200 mm (length) with a wall thickness of 27 mm. The chemical composition is shown in Table 1. Following the material process of “centrifugal cast→solution heat treatment (SHT) at 1100 °C for 3 h→water quench (WQ)”, the hollow cylinders were machine-finished from the original dimensions to φ 150 mm (inner diameter) × 200 mm (length) with a wall thickness of 16 mm for residual stress measurement, which were designated as sample set TP16. Considering that unbalanced migration of elements might be caused by centrifugal force, the author has investigated the chemical composition difference between the inner and outer surfaces [13]. The results showed that no obvious segregation occurred during centrifugal cast in this case, indicating that, in terms of chemical composition distribution, the lattice structure should not change along the thickness direction of the hollow cylinders. In addition, several specimens were fabricated for phase volume fraction evaluation, strain-free lattice constant measurement and tensile testing. The round bar specimens for tensile testing were designated as sample set TP4. As shown in Figure 1, the axial direction of TP4 is consistent with the hoop direction of the hollow cylinder. The dimensions of the straight parallel part of TP4 are φ 4 mm (diameter) × 42 mm (length). Table 2 shows the mechanical properties at ambient temperature in air.
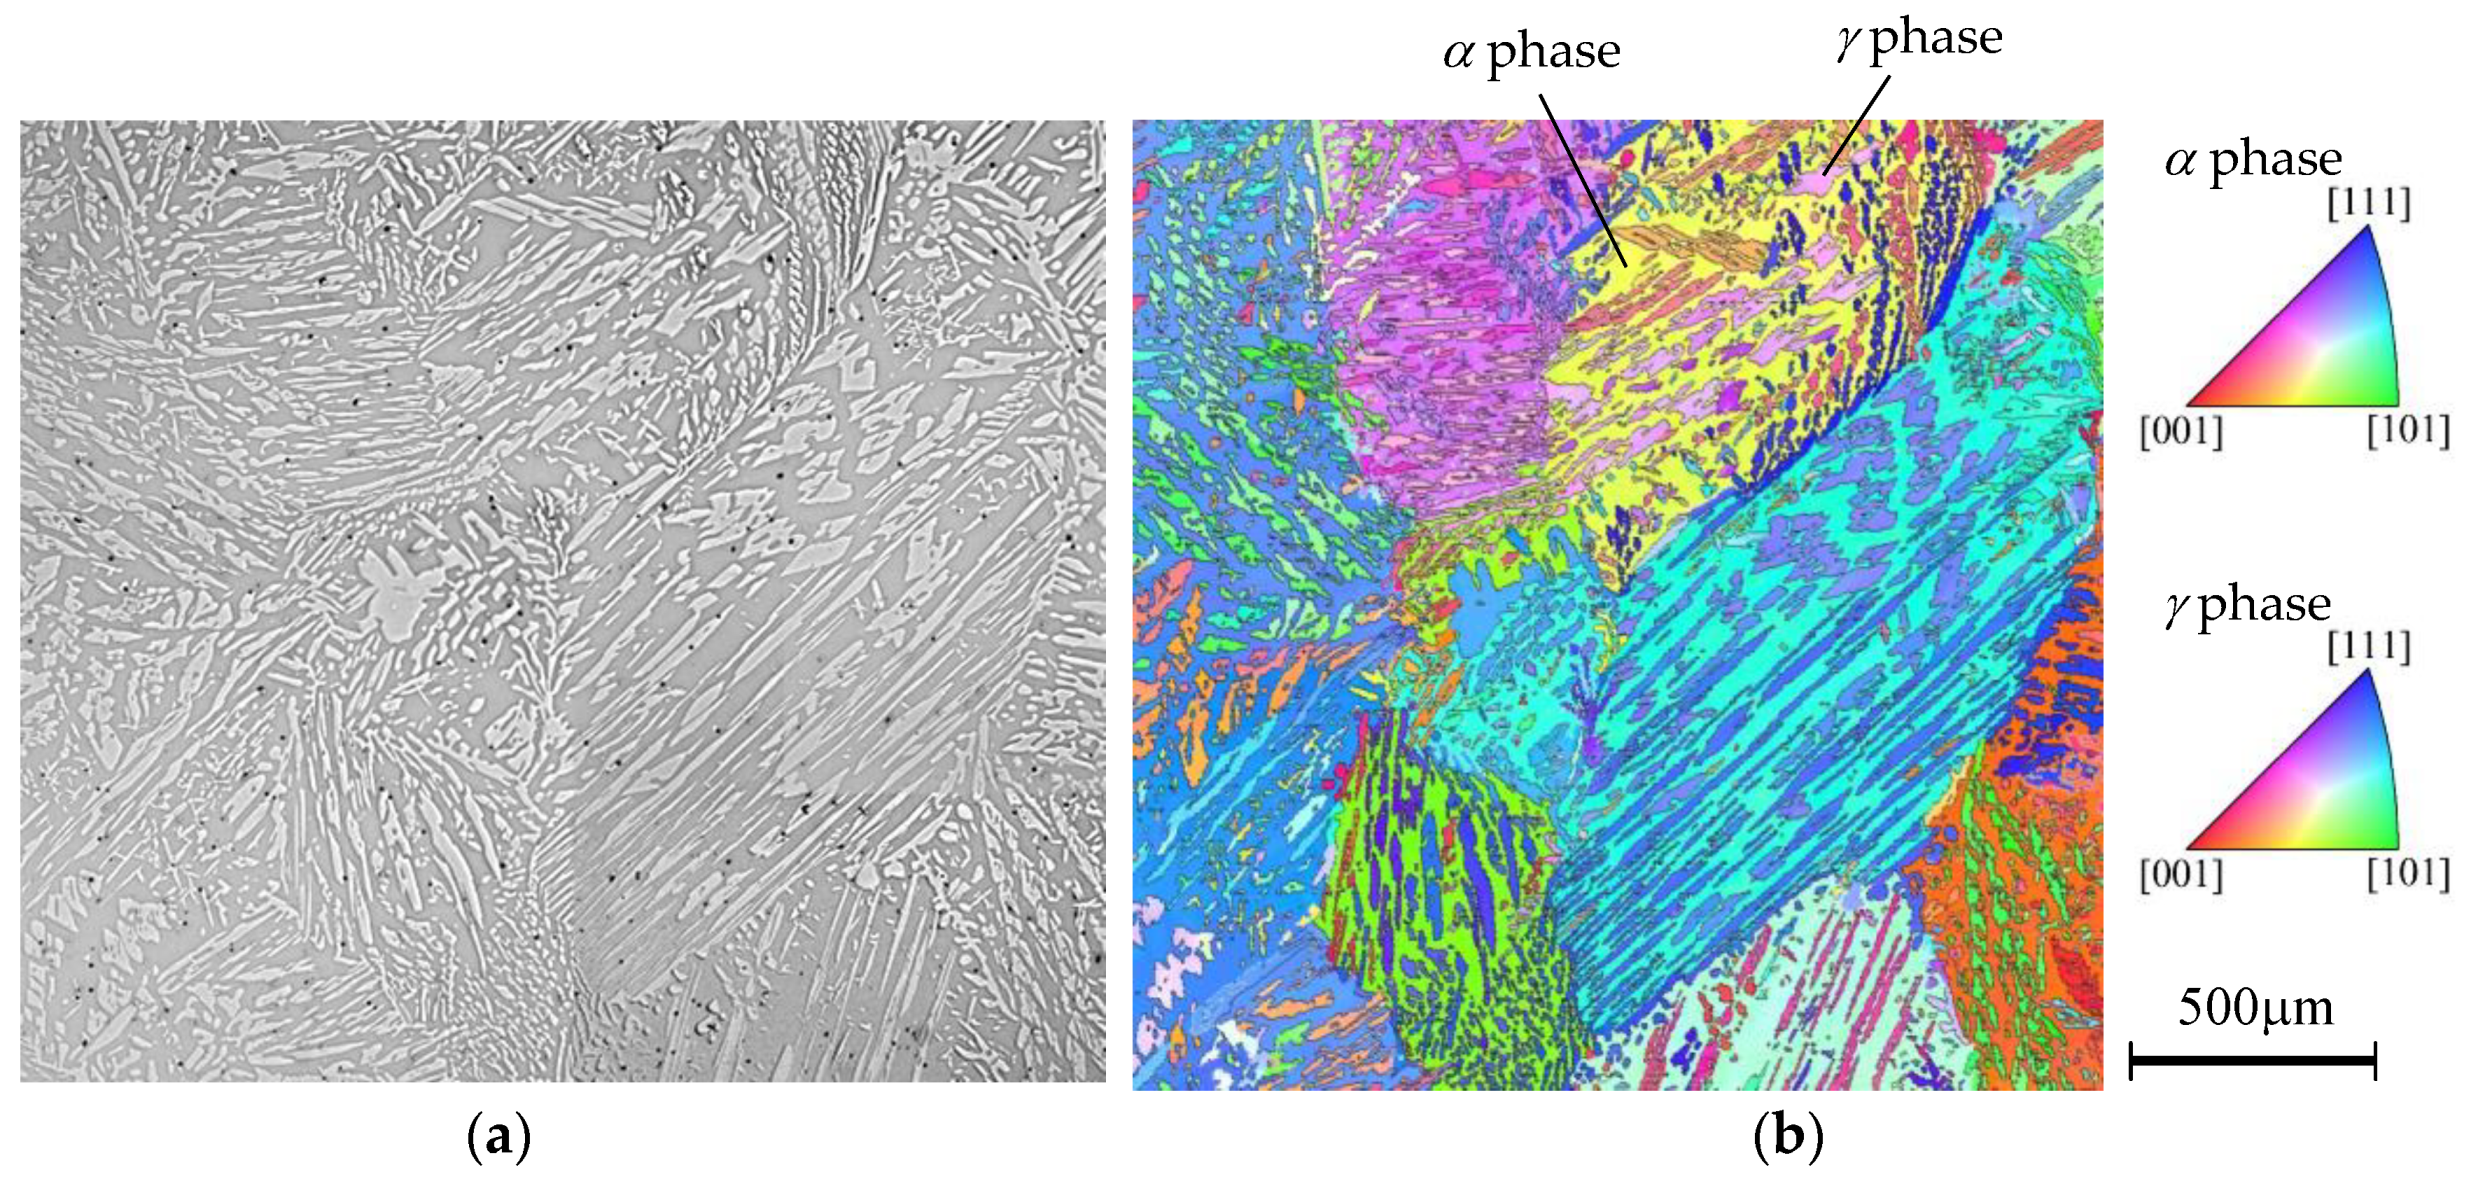
The microscopic structure was observed by using electron backscatter diffraction (EBSD). EBSD analysis was conducted with an orientation imaging microscopy (OIM) module installed inside a field-emission electron scanning electron microscope (FE-SEM) of S-4300SE made by Hitachi High-Technologies Corporation. The inverse pole figure (IPF) image generated by EBSD is shown in Figure 2. The area for EBSD analysis was 2 mm × 2 mm and the scanning step was 4 μm. In general, the fine grains of γ phase disperse inside the coarse grains of α phase with an average grain size (diameter) of about 60 μm, nearly equal to 1/10 of the grain size in α phase. The phase volume fraction f was calculated as the ratio of the area identified as a given phase over the total measurement area by an imaging analysis. The estimated phase volume fractions are fα = 0.588 for α phase and fγ = 0.412 for γ phase, respectively.
2.2. Triaxial Stress Evaluation
Based on the TOF method, the lattice plane (hkl) can be identified by the lattice spacing d, which is calculated by the following relation [12]:
where θ is the diffraction angle (Bragg angle), λ is the wave length belonging to a continuous spectrum of white neutron, h is the Planck constant, m is the mass of neutron, v is the velocity of neutron, L is the total distance of the optical path from neutron emitter to the detector and TOF stands for the flight time for the neutron to traverse the whole optical path. It should be noticed that each λ value correlates to a specific TOF, which can be measured precisely by TAKUMI. Because the two detector banks of TAKUMI are both settled in the directions perpendicular to the incidence of neutron, the diffraction angles 2θ are fixed as 90 deg for both detectors. The crystal structure and lattice constant a of both α and γ phases can be determined by Rietveld refinement [15] of the diffraction intensity profile. The lattice strain εi is then calculated by the following relation:
where i denotes the sample directions. Considering the phase transformation during centrifugal cast should cause an axially symmetric texture, the three main stress directions can be reasonably assumed as radial (r), hoop (h) and axial (z) directions of the cylinder. The three main phase stresses then can be determined for each phase by the essential equation as shown below:
where E is modulus of longitudinal elasticity (Young’s modulus) and ν is Poisson’s ratio. The values of single phase derived from reference [16] (E = 206 GPa, ν = 0.28 for α phase and E = 193 GPa, ν = 0.3 for γ phase) are utilized for the calculation in Equation (3). According to the mixture law [12], the relation of stress types can be expressed as below:
where σα and σγ denote the phase stresses of α phase and γ phase respectively and σ′ denotes the macro-stress, which is the average residual stress of all the grains in the material.
2.3. Preparation of Strain-Free Specimen
When applying neutron diffraction to perform the internal residual stress measurement, the triaxial stress state should be taken into consideration. It is obvious from Equations (2) and (3) that the measurement accuracy of residual stress depends very much on the accuracy of the strain-free lattice constant a0 [17,18,19]. Considering that this lattice spacing could be affected by multiple factors. such as chemical composition, solid solution elements, phase transformation and temperature, preparation for the strain-free specimen requires caution [18,19,20]. Withers et al. have summarized various methods for obtaining strain-free lattice constant a0 [19]. One of the common methods for single phase material is removing residual strain by heat treatment. However, in the case of DSS, because thermal history might trigger phase transformation possibly affecting the lattice structure, heat treatment is not an easy approach to employ. Another method is to cut several tiny specimens from the target material in mm scale to release the surrounding constraint, which is usually applied to the welded components [17,21]. However, obviously the size of these specimens is not small enough to separate the phase stresses from one phase to another in DSS, where the grain size of γ phase is only several 10 μm. Johansson et al. successfully measured the lattice constant a0 of a strain-free γ phase powder sample obtained from α phase matrix of a DSS by using selective dissolution method and calculated a0 of the α phase based on stress equilibrium conditions [10]. However, experimental measurement of strain-free lattice constant a0 for both phases remains difficult.
In this study, the author attempted to prepare strain-free specimens by utilizing an electropolishing method with neither thermal history nor thickness limitation. As shown in Figure 1, 4 small plates of 8 mmL × 3 mmW × 0.5 mmT were picked up from the experimental material and their surfaces were prepared using a sequence of emery paper, diamond paste and electropolishing. The thickness removed by electropolishing was no less than 100 μm on each side of the surface to make sure that no work-hardened layer was left. With this procedure, these specimens were prepared without changing the material properties that might affect the original lattice constant. The final thickness of these thin plates was reduced to 60–90 μm, nearly equal to the grain size of γ phase and much smaller than that of α phase. Therefore, the phase stresses of both phases in thickness direction were supposed to have been relieved.
2.4. Measurement Conditions of Neutron Diffraction
2.4.1. Strain-Free Specimen
Figure 3 shows the optical system of neutron diffraction for strain-free lattice constant measurement [13]. Four overlapped thin plates were fixed with a clip and settled on the specimen stage with the longitudinal direction of the plates perpendicular to the stage surface. The neutron diffraction can be detected by two detectors facing in opposite directions, designated as Detector 1 and 2, which means the diffraction intensities in two orthogonal directions can be measured simultaneously. The gauge volume of measurement was 2 mm × 2 mm × 2 mm. The specimens were periodically rotated around the axis of longitudinal direction at a step angle of 22.5 deg until the total rotation angle reaches 180 deg. The alignment calibration had been carefully conducted between the center axis of the specimens and the rotation axis of the stage before measurement. In order to acquire sufficient diffraction intensity, the measurement was conducted during a holding time of 600 s at each rotation angle. Finally, the total of nine diffraction intensity profiles obtained from different rotation angles were summed up for Rietveld refinement to cancel out the directional dependency of diffraction intensity due to coarse grains and texture. The Rietveld refinement was performed with the analysis code Z-Rietveld (ver 0.9.37) [22,23] developed by the High Energy Accelerator Research Organization (KEK).
2.4.2. Hollow Cylinder
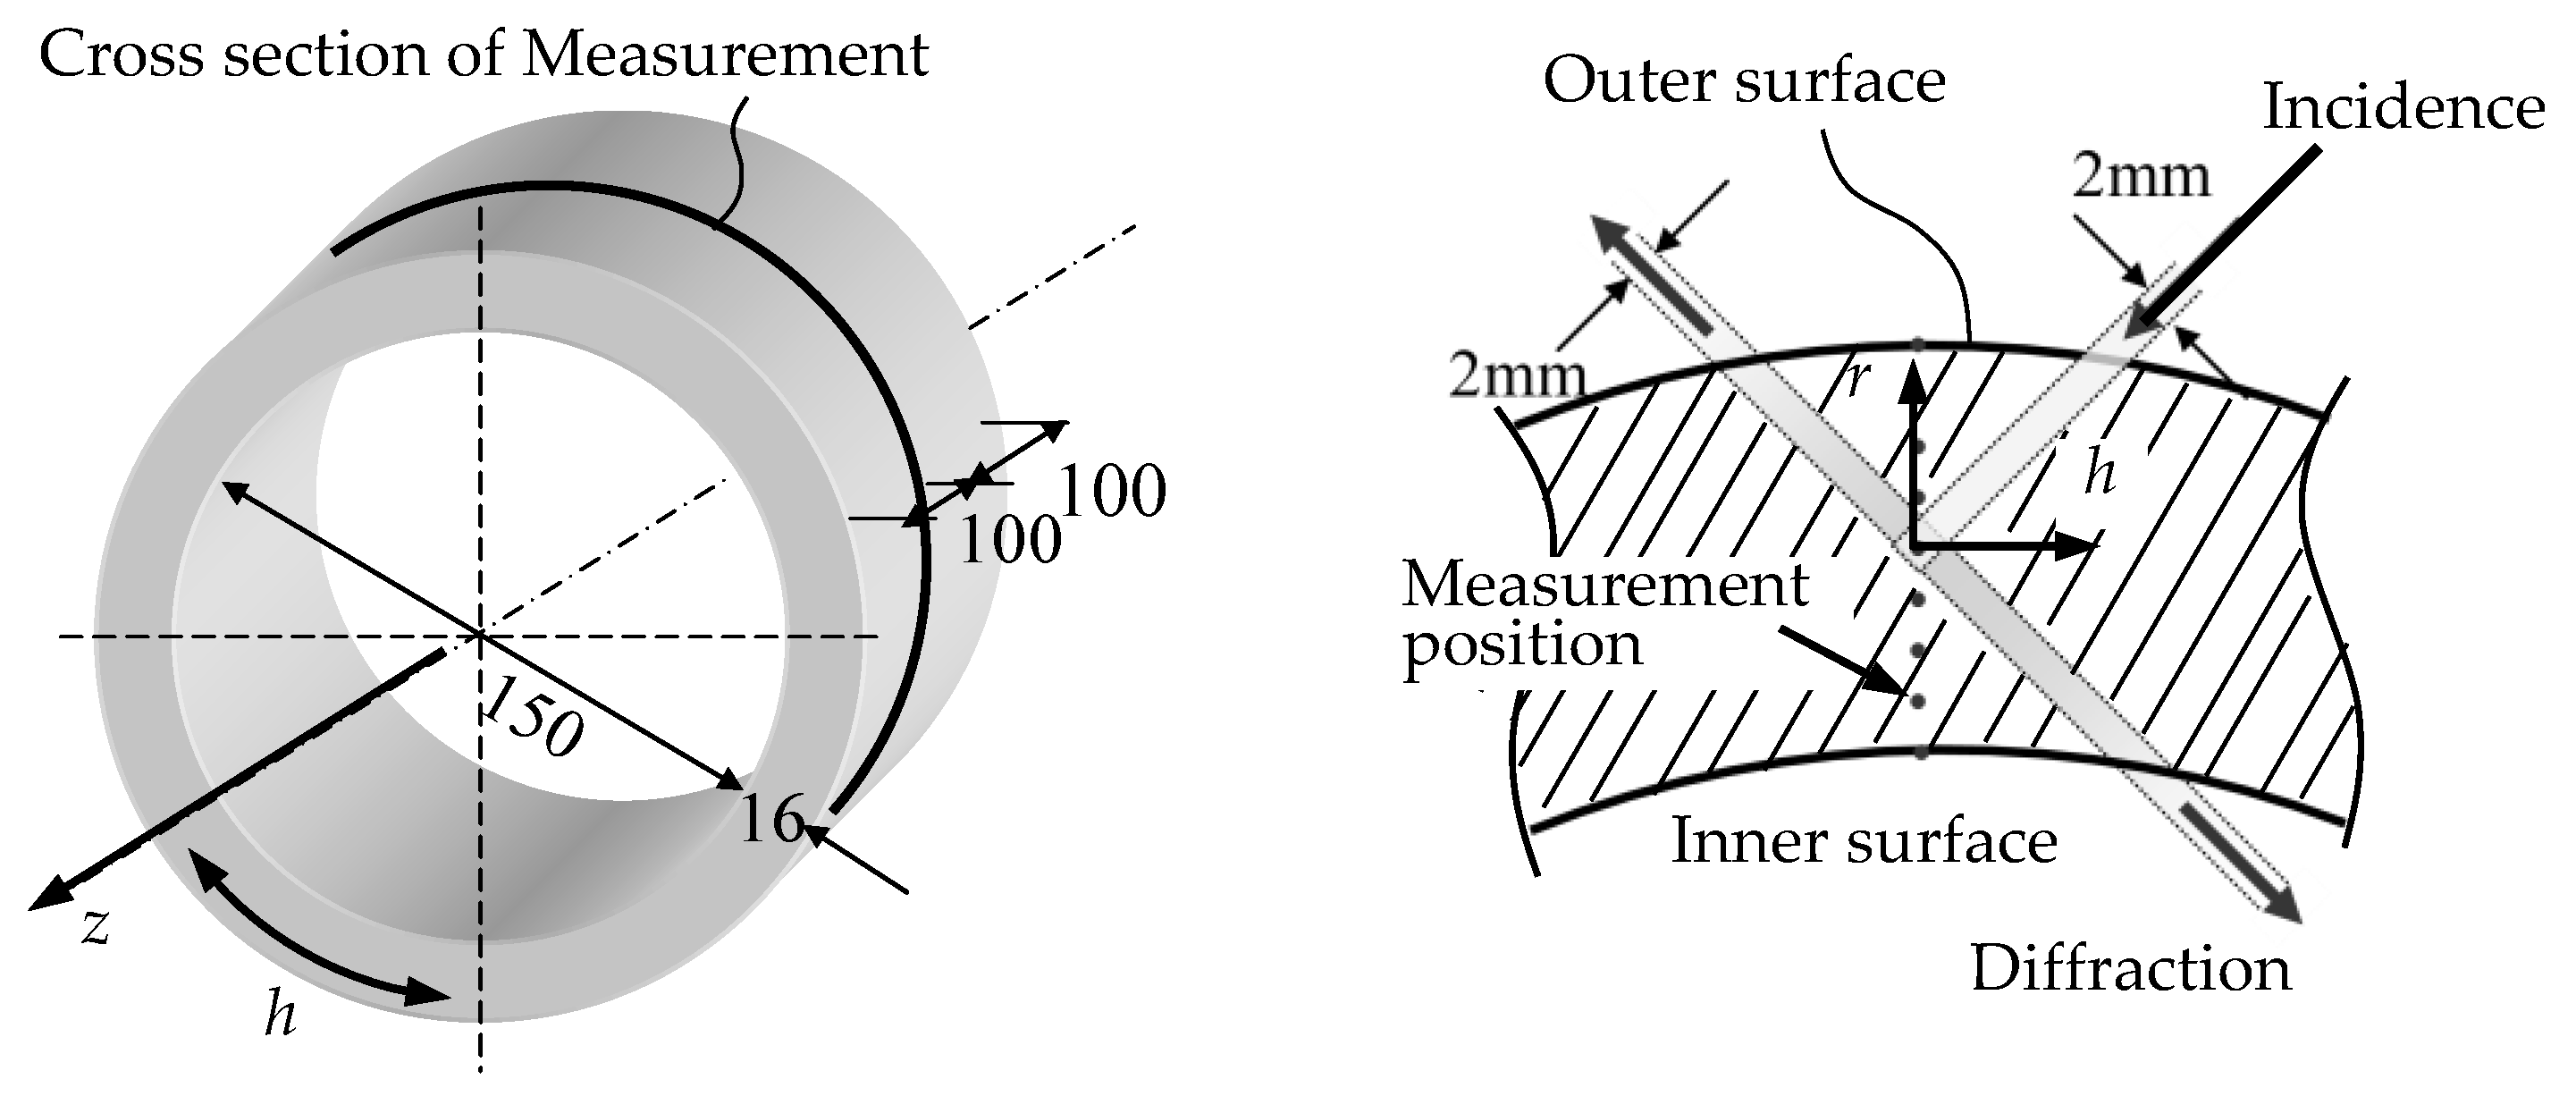
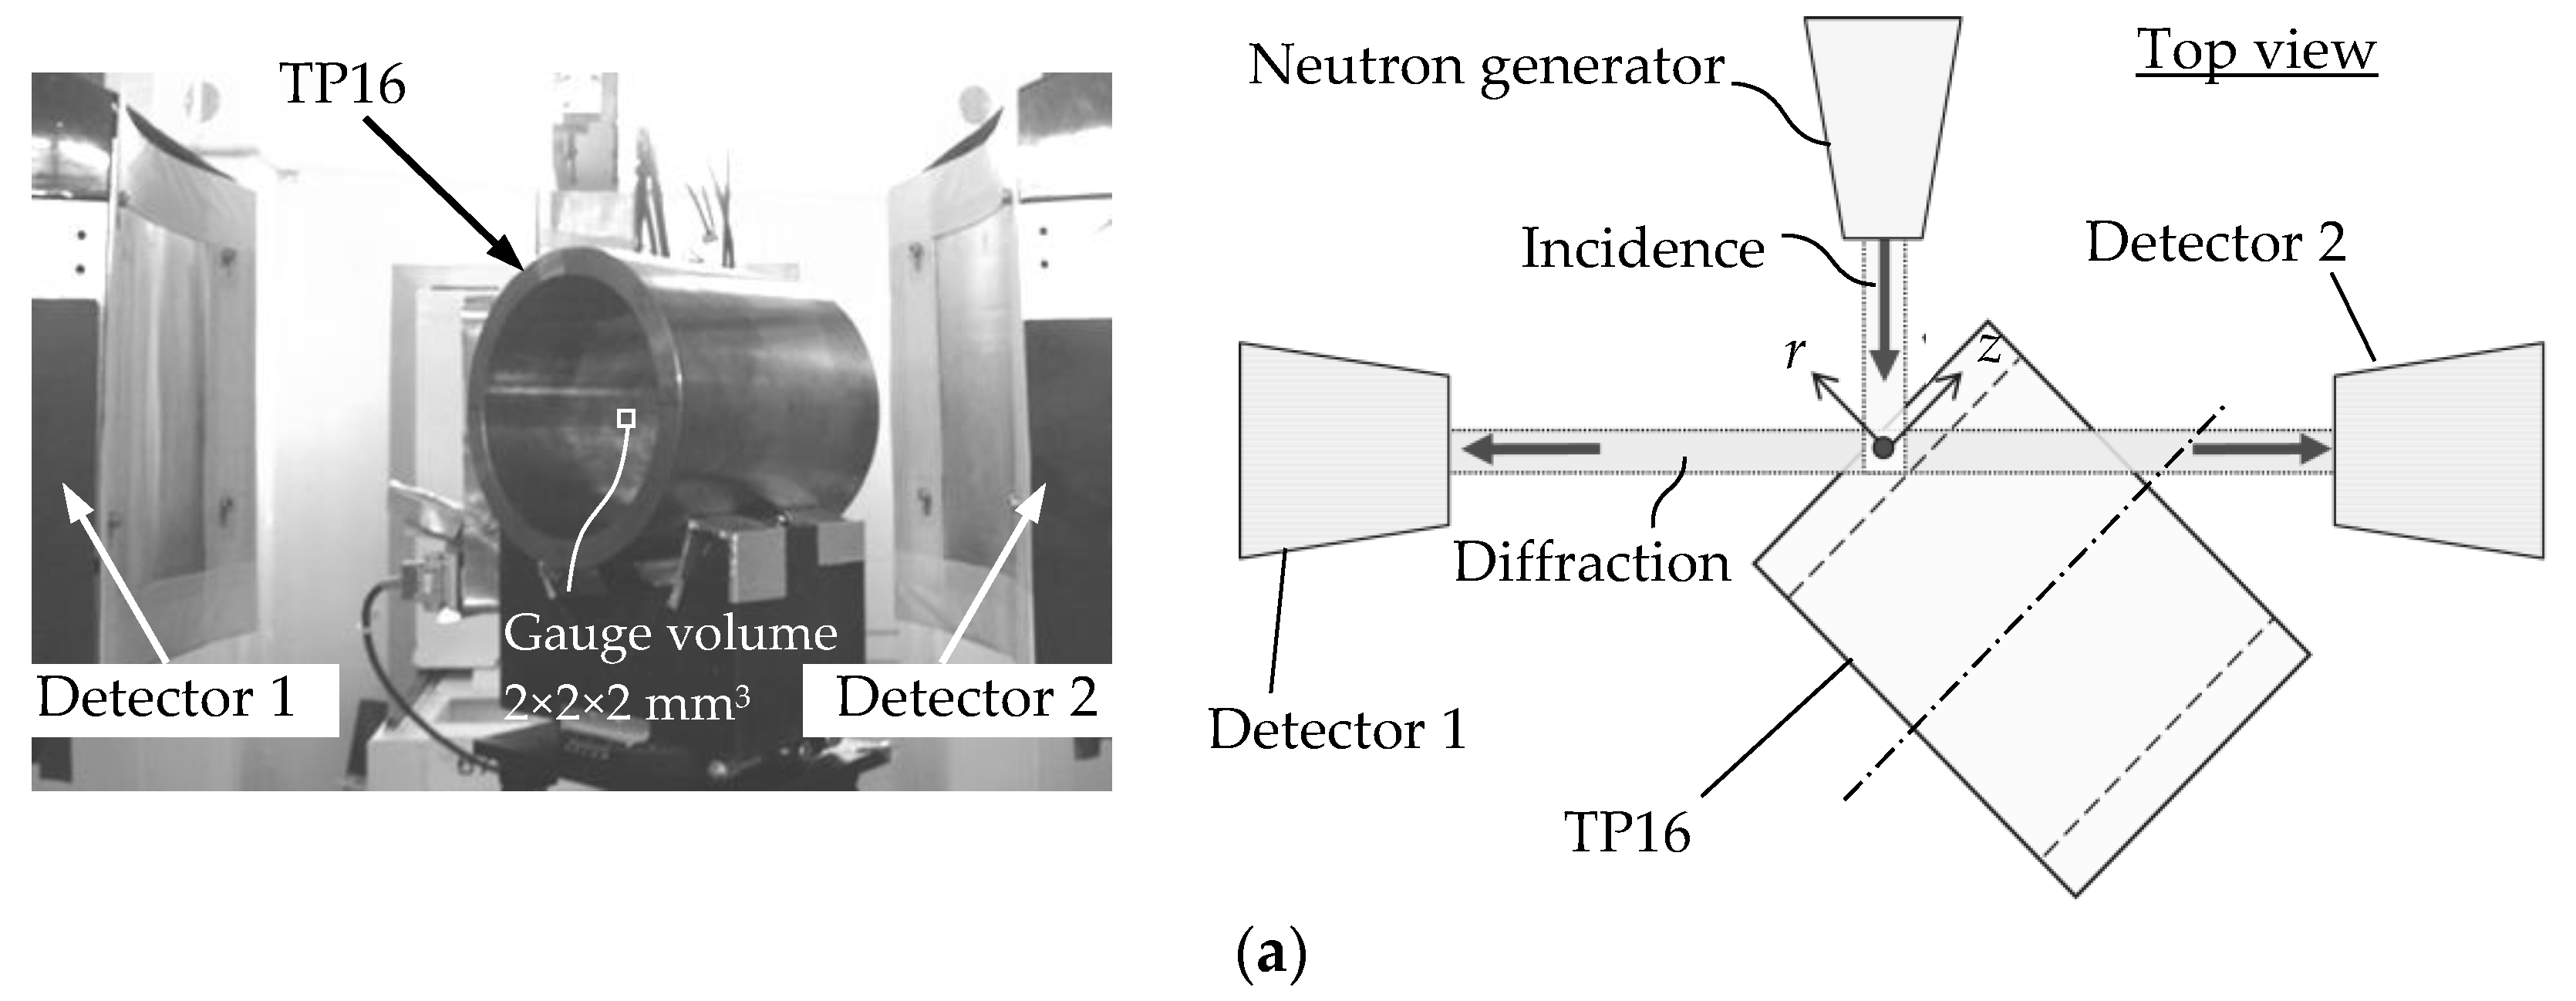
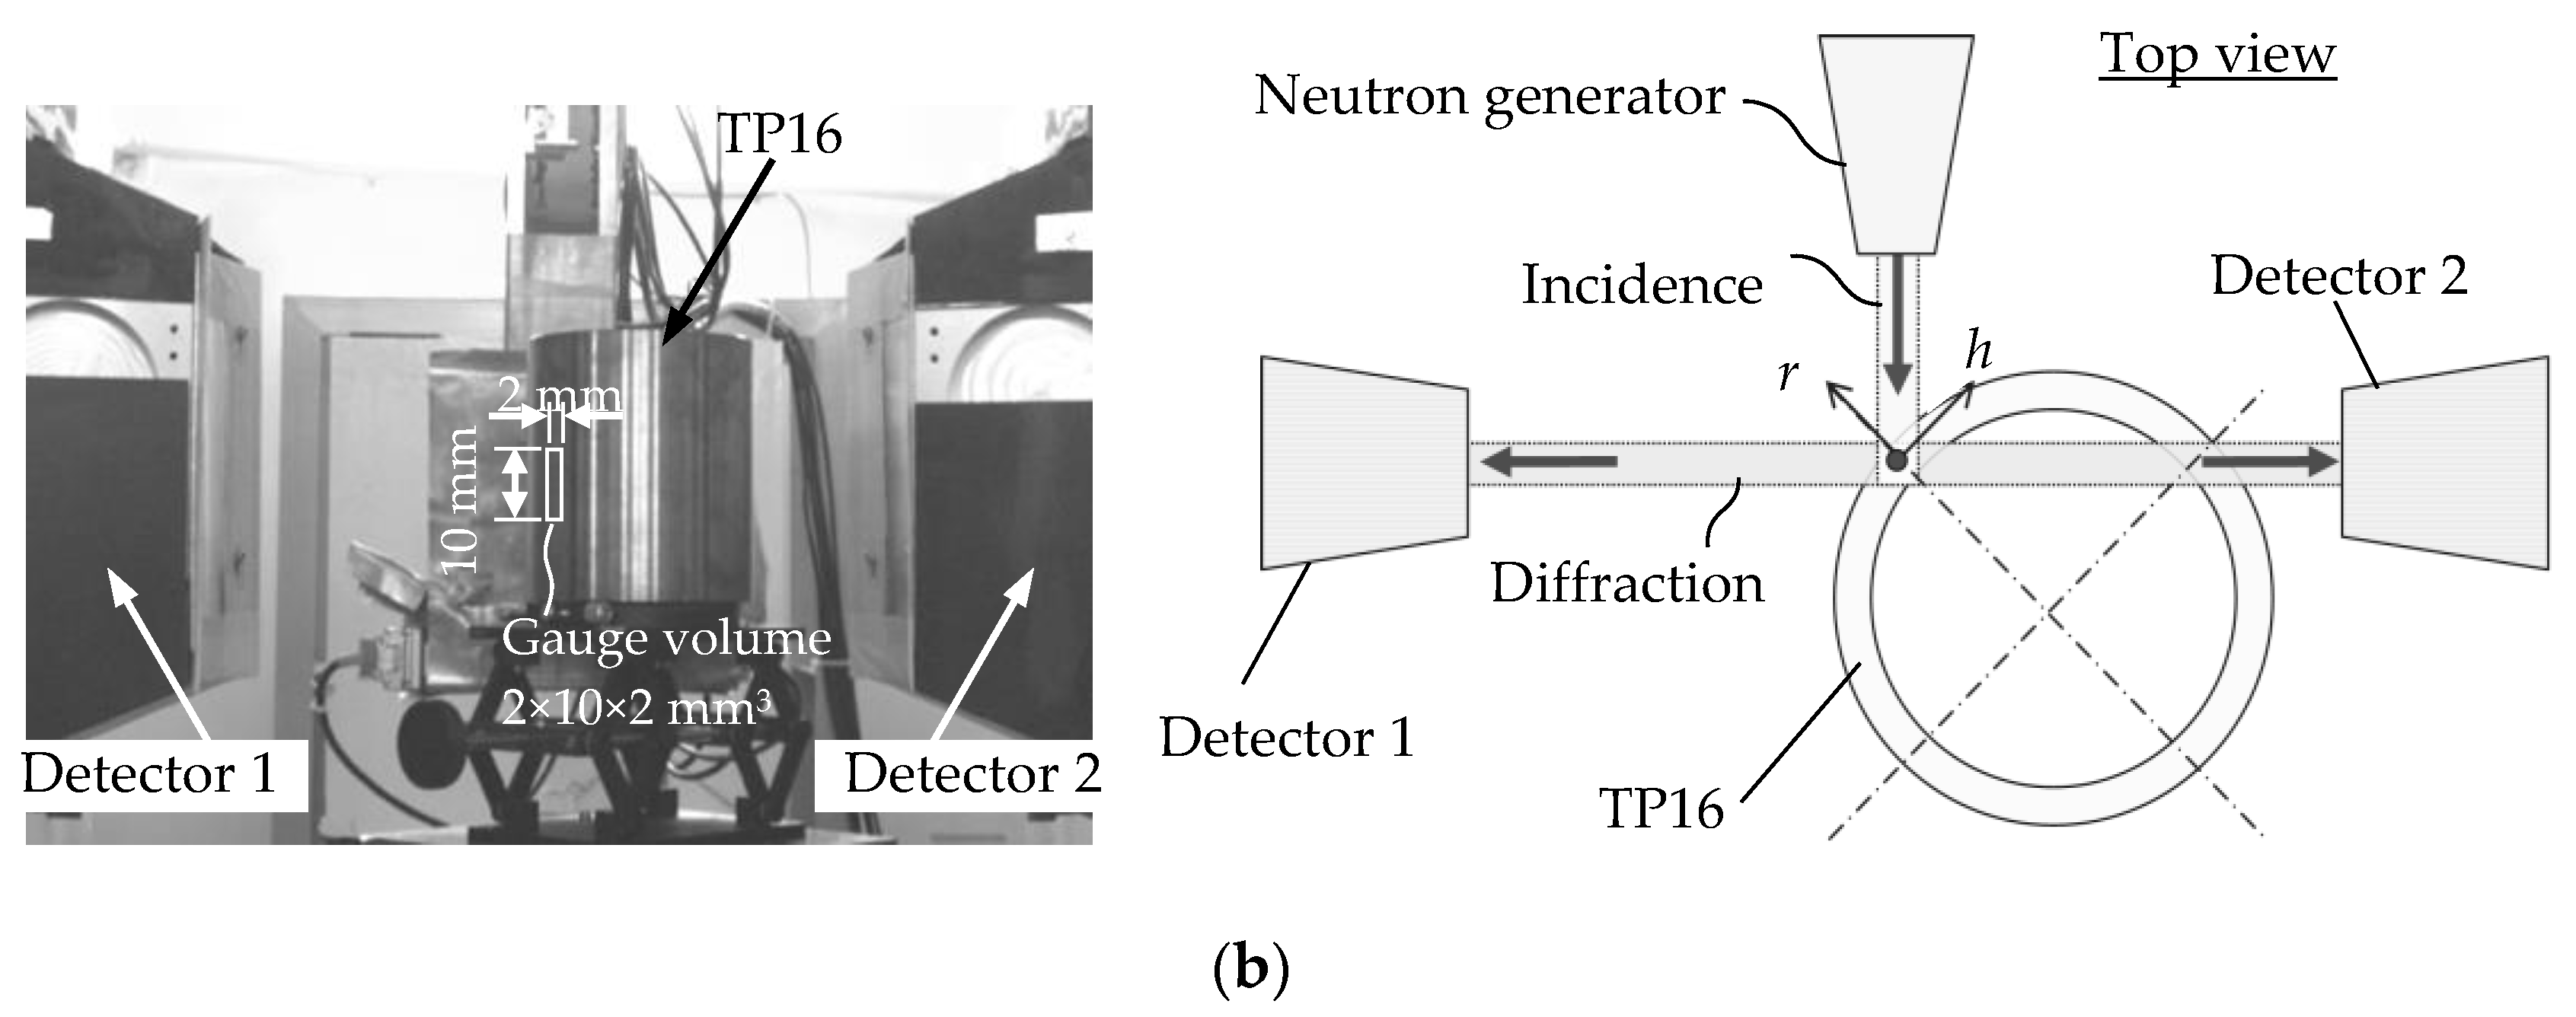
As illustrated in Figure 4, the internal residual stress distributing along the thickness direction was measured by neutron diffraction at the center of the cylinder [13]. Figure 5 shows the setup image and optical system of neutron diffraction measurement of hollow cylinder specimen T16 [13]. For triaxial stress analysis, the measurements were conducted on the cylinder with the axial direction (a) parallel and (b) perpendicular to the stage surface, respectively. The gauge volume of measurement was set as 2 mm × 2 mm × 2 mm when the cylinder axial direction is parallel to the stage surface. In the case of the measurement in Figure 5b, considering the diffraction intensity would decrease remarkably after the neutron beam had penetrated the walls of cylinder twice, the gauge volume was set as large as 2 mm (h direction) × 2 mm (r direction) × 10 mm (z direction) so that higher diffraction intensity could be acquired. The lattice constant was also evaluated by Rietveld refinement. Two specimens of T16, designated as A and B, were employed for investigating data scatter.
2.4.3. In-Situ Measurement of Lattice Strain during Tensile Test
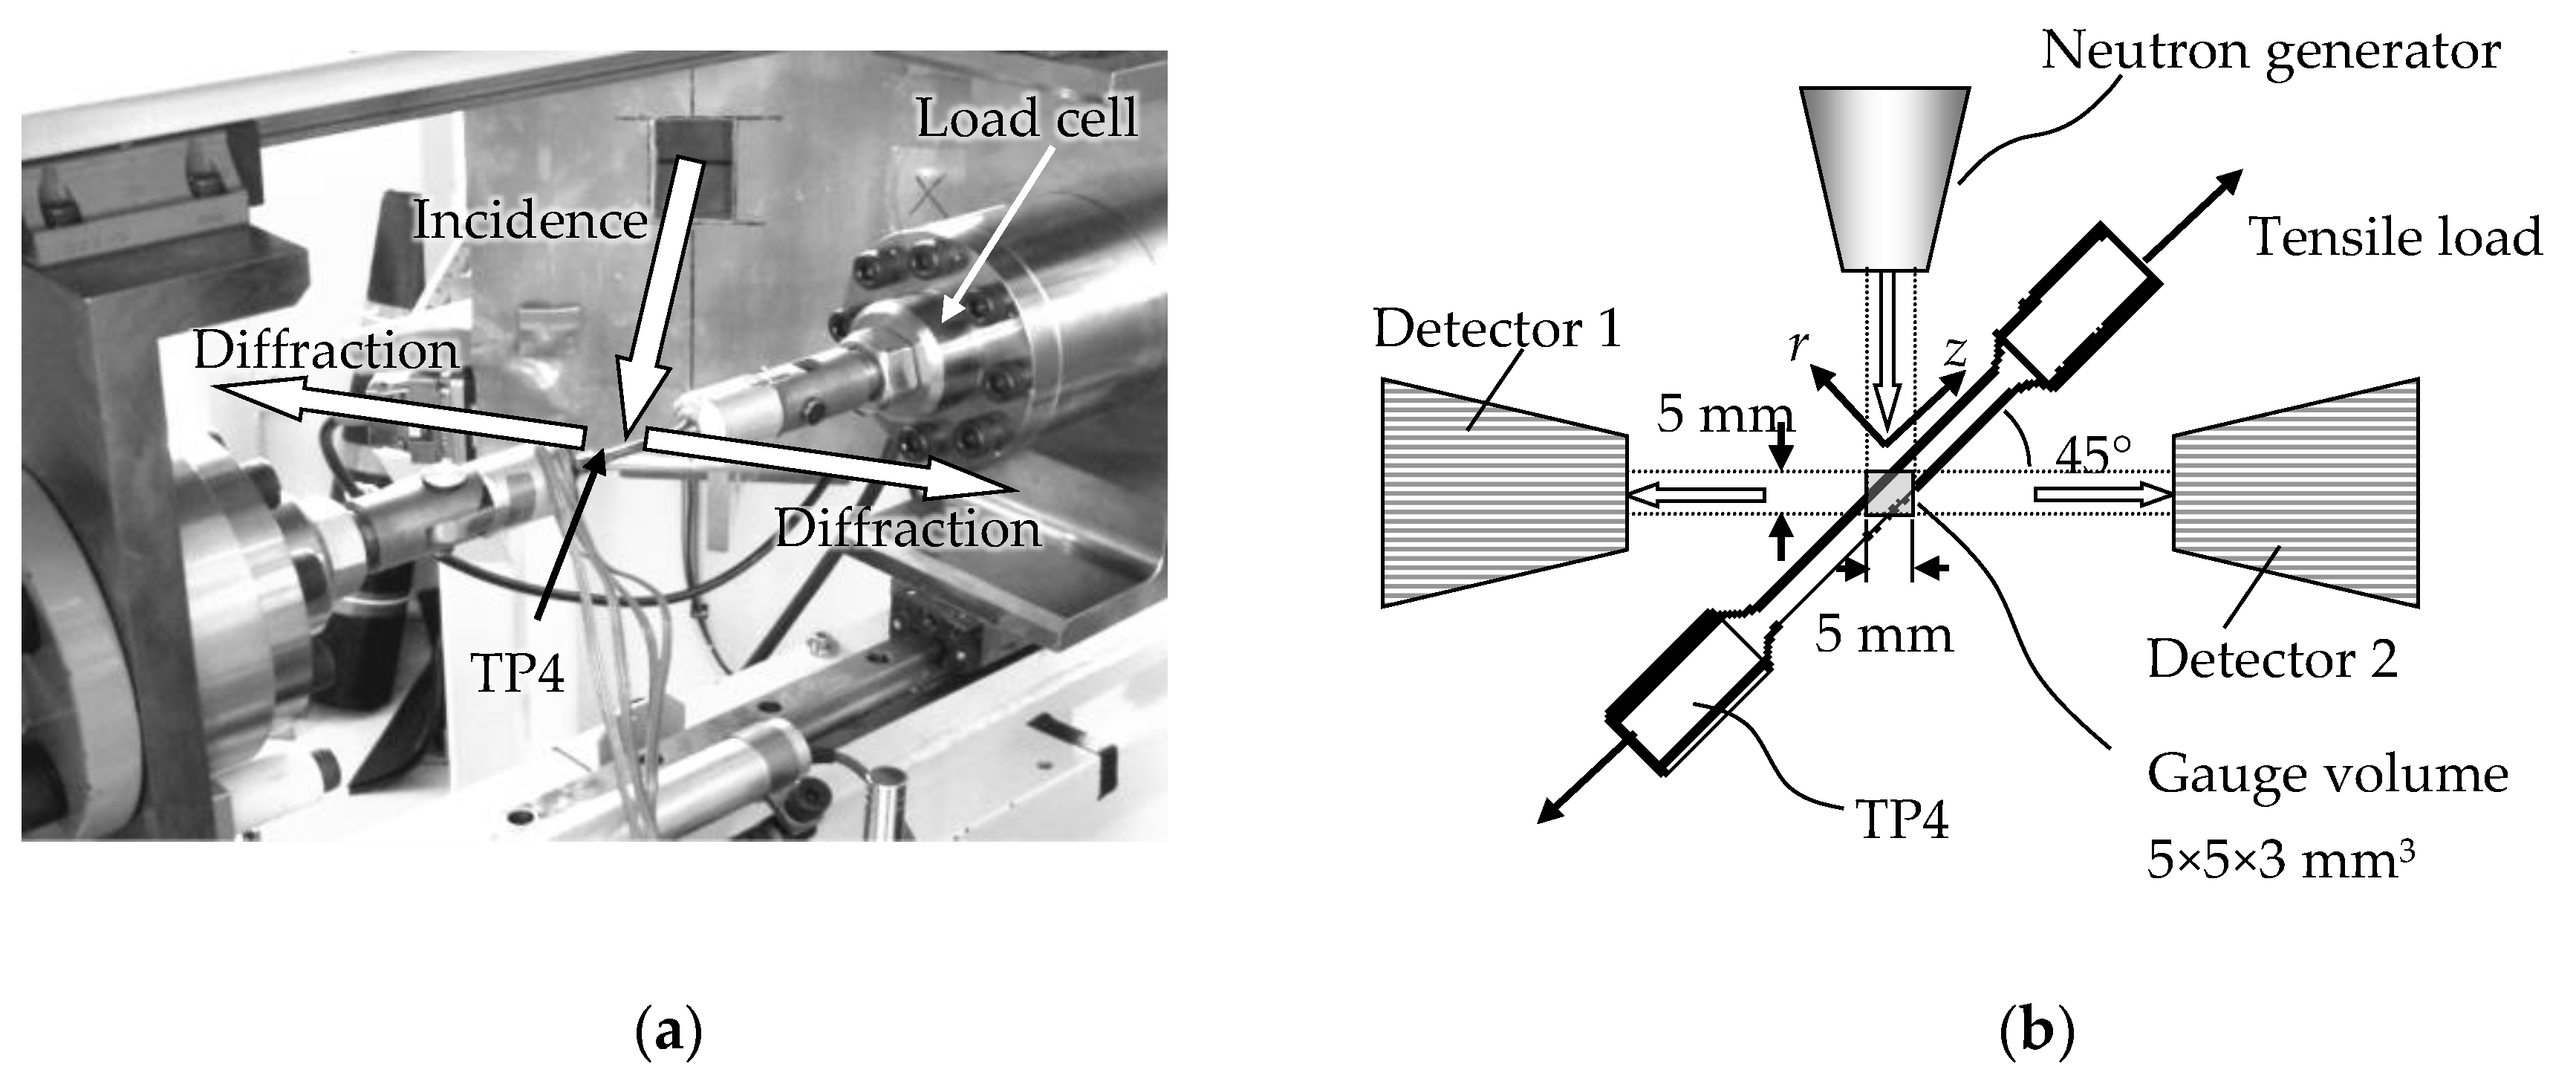
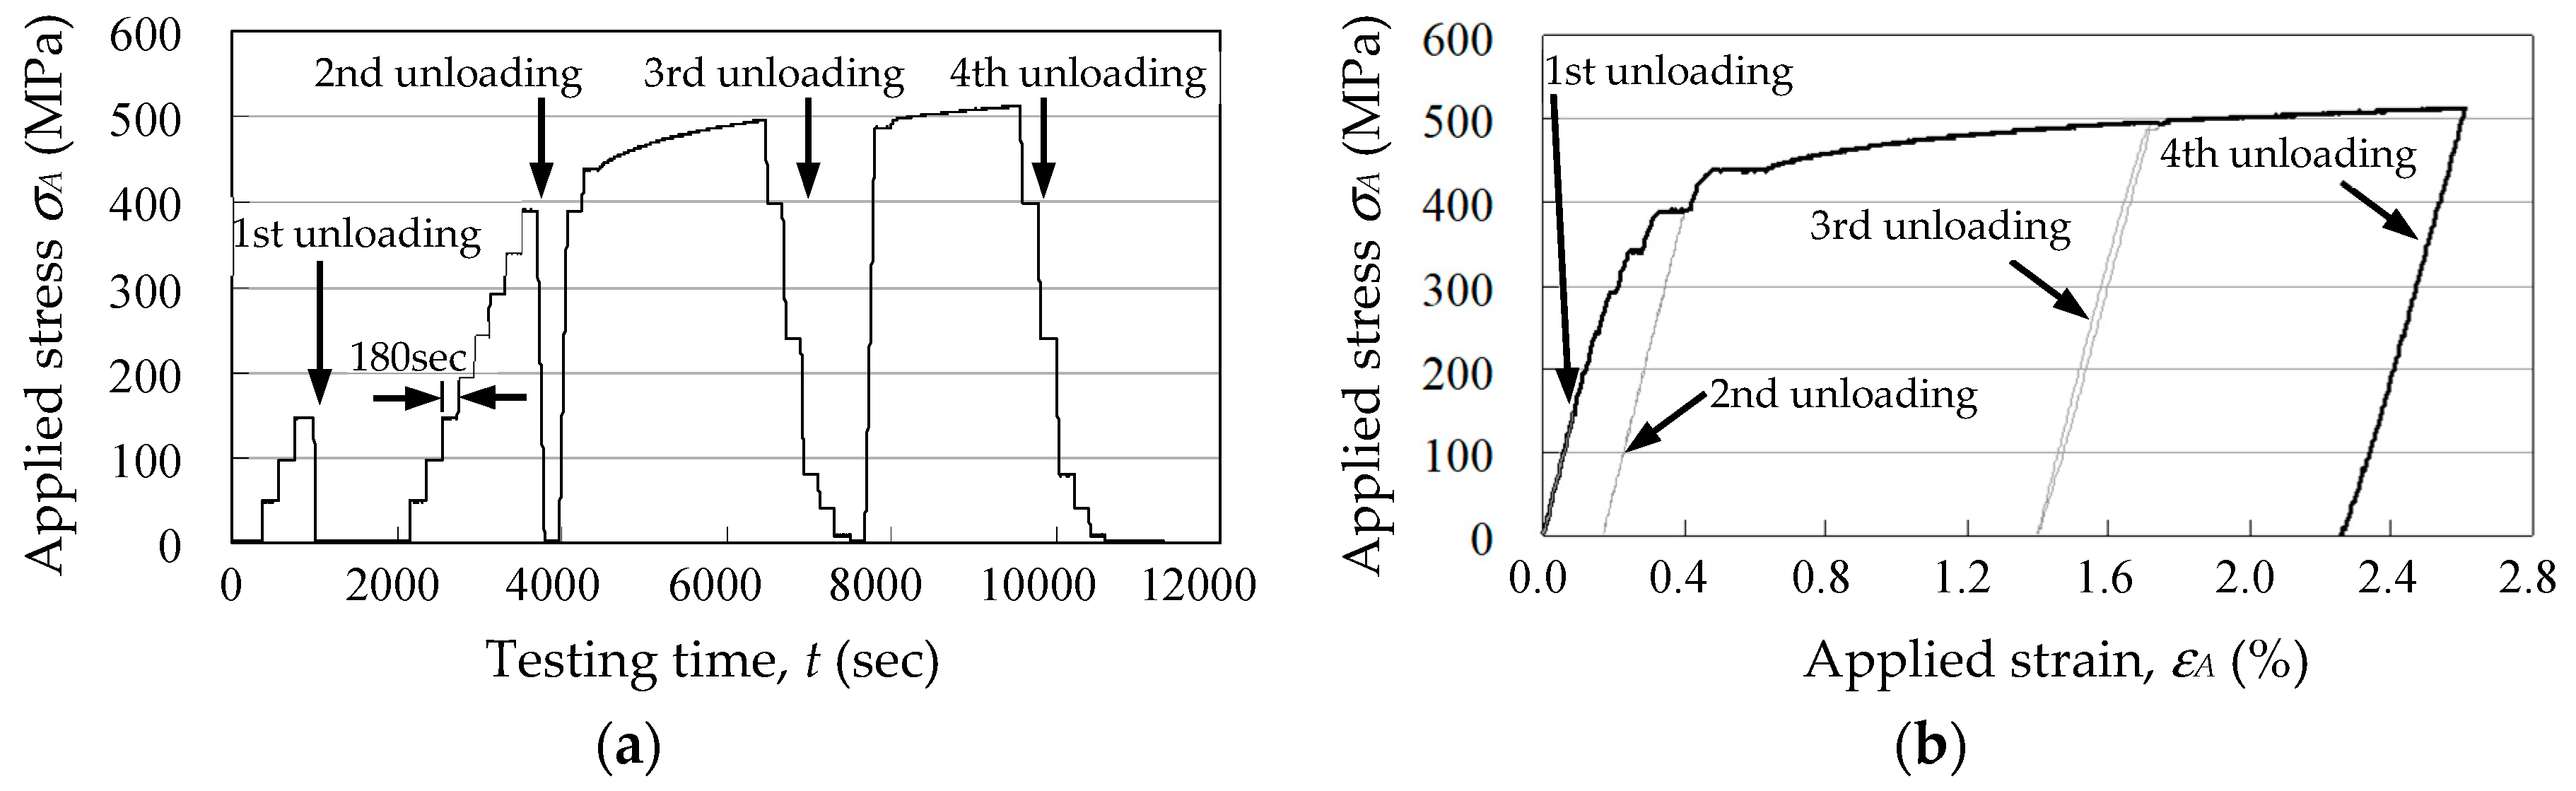
In order to clarify the phase stress evolution responding to the applied loading and even plastic deformation, the in-situ measurement of lattice strain ε was conducted during the tensile test with specimen TP4. As shown in Figure 6, the specimen was horizontally strained by a tensile tester installed at the center of the specimen stage [14]. The angle between the incidence of neutron and the longitudinal direction of the specimen was designed as 45 deg so that the two detector banks were able to detect the diffraction from the lattice planes in axial and radial directions of TP4 simultaneously. For the purpose of continuous measurement during plastic deformation, a large gauge volume in size of 5 mm × 5 mm × 3 mm was utilized to acquire high diffraction intensity. Figure 7a shows the applied stress history of the tensile test. During the elastic deformation, the applied stress σA in the axial direction of specimen was gradually increased from 0 MPa at a step of 50 MPa and held for 180 s at each loading level. However, after the plastic deformation had started, the applied stress was increased continuously. Figure 7b shows the stress-strain curve. The applied strain εA was measured by the strain gauge attached on the straight parallel part of the specimen. During the entire tensile test, the loading-unloading cycles were repeated several times until the maximum applied stress σA had approximately reached 500 MPa, just exceeding its proof stress σy by 20–30 MPa. Correspondingly, the maximum applied strain εA in the axial direction was nearly 2.6%.
3. Results
3.1. Lattice Constant of Strain-Free Specimen
A typical neutron diffraction intensity profile of thin plate specimens obtained by Detector 1 is shown in Figure 8, where the Rietveld refinement result is displayed as well. The lattice planes in both phases corresponding to the intensity peaks can be identified by the lattice spacing d, which was calculated based on the TOF method. Though the residual error scatters a little widely at the intensity peaks, the Rietveld refinement result agrees very well with the measured profile. Then the phase volume fractions, can also be evaluated as the ratio of total integrated intensity in one phase over the whole material. Based on this calculation, the phase volume fractions are fα = 0.526 and fγ = 0.474, indicating an approximate 1:1 ratio between the two phases. It should be noticed that the phase volume fractions estimated by Rietveld refinement in 3-dimensional analysis differ a little from the result obtained by the 2-dimensional EBSD analysis. Considering the texture effect can be moderated by measuring the specimens at different rotation angles, the phase volume fractions based on the Rietveld refinement should be more accurate than EBSD. Thus fα = 0.526 and fγ = 0.474 were used for the calculation of macro-stress in this study.
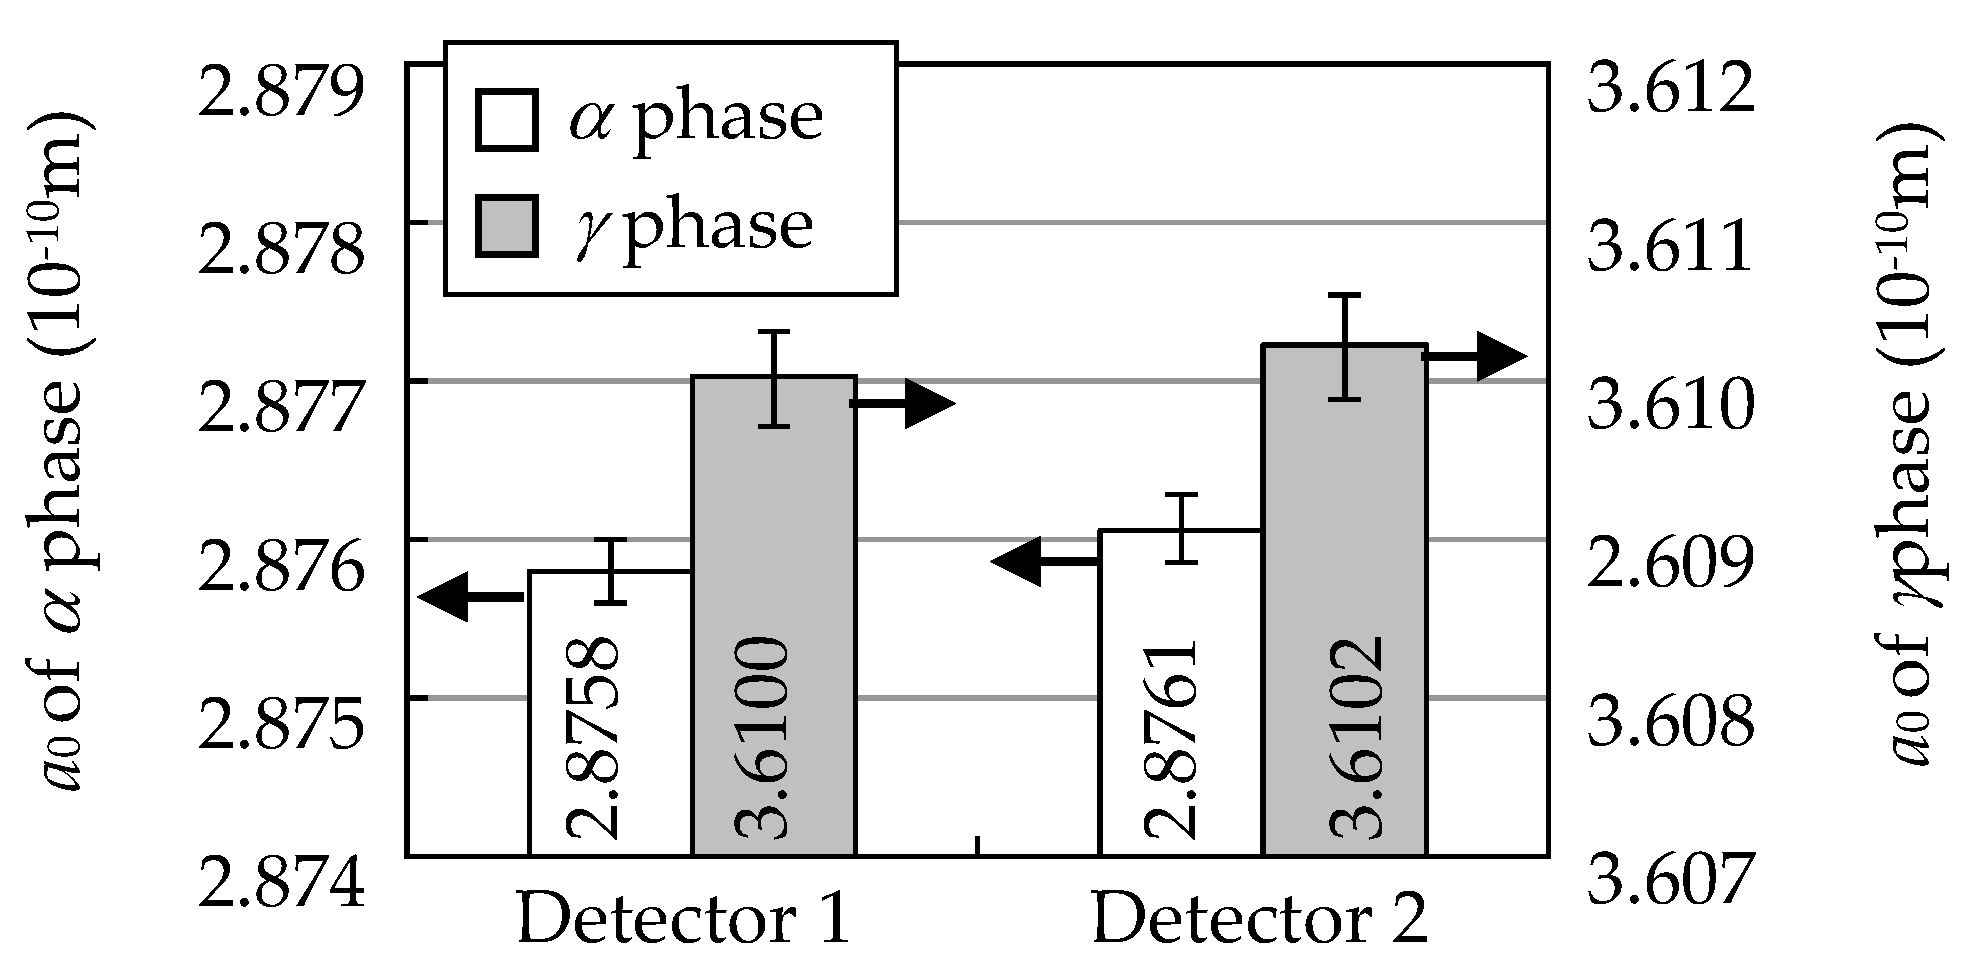
Figure 9 shows the measurement result of strain-free lattice constant a0 obtained from both detectors [13]. It should be noticed that the measured lattice constant a0 of either α phase or γ phase differs from the recommended value of single-phase material in reference [24], where a0 is 2.8665 × 10⁻¹⁰ m for α-Fe and 3.592 × 10⁻¹⁰ m for γ-Fe. It is confirmed that the scatter of a0 due to the systematic difference from variant detectors is lower than 10−13 m.
3.2. Residual Stress of Hollow Cylinder
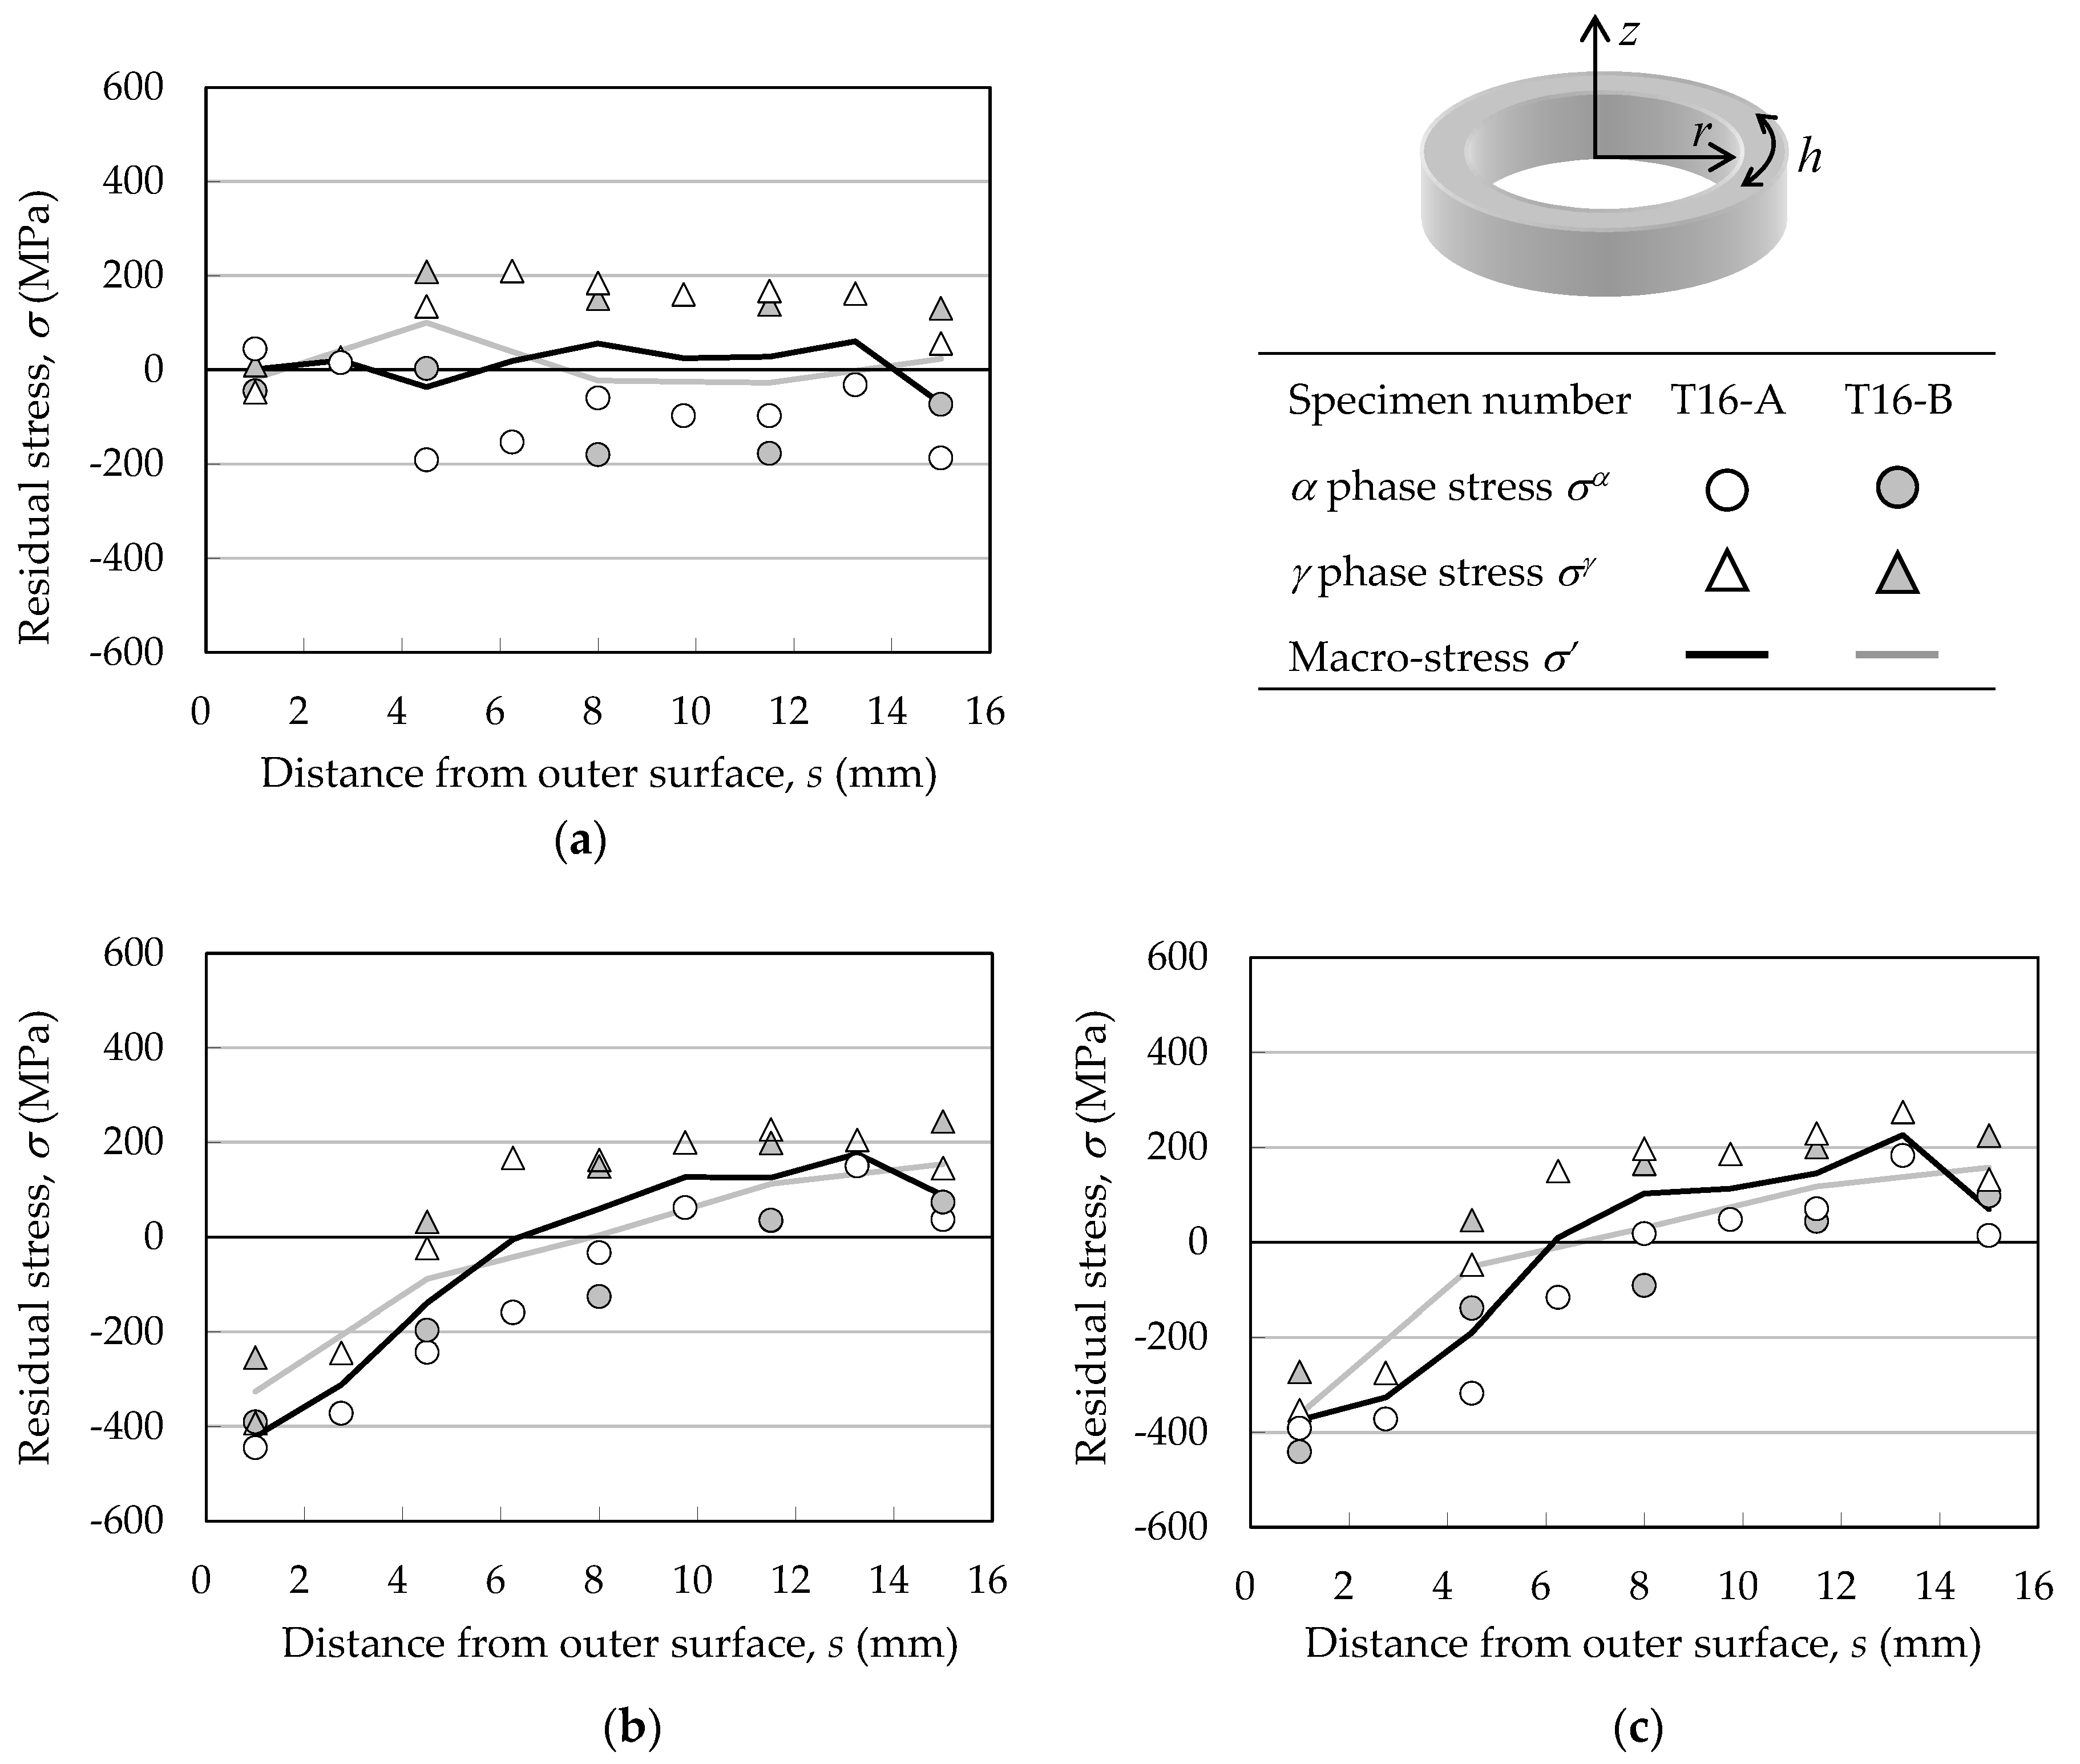
As shown in Figure 10, the residual phase stress and macro-stress distributions between the outer and inner surfaces of TP16-A and TP16-B are plotted in triaxial directions. It is confirmed that phase stress σα tends to be lower than σγ in every chart, which is consistent with the previous results from centrifugal bowl of duplex steel [6] and dual phase alloys with different phase volume fractions [7,8]. A similar tendency is recognized in the residual stress distributions of both specimens, indicating a small data scatter between different specimens. In the r direction, the phase stresses of σα and σγ are close to 0 MPa near the surface, but change to −200 MPa and 200 MPa, respectively, inside the cylinder. However, the macro-stress σ′ is approximately 0 ± 50 MPa across the thickness, indicating that there is nearly no obvious distribution of radial macro-stress along thickness direction. On the other hand, both phase stress and macro-stress distributions in the h direction are similar to those in z direction, where σα is in a range from −450 MPa to 200 MPa, σγ is from −400 MPa to 250 MPa and σ′ is from −400 MPa to 200 MPa. From these results, an equal biaxial stress state can be estimated in h and z directions. The distribution of macro-stress σ′ in triaxial directions shows realistic stress balance along thickness, indicating that the strain-free lattice constant has been accurately measured. As for the tensile macro-stress near the inner surface, the author has discussed the effect of stress relief heat treatment on this material in another publication [13].
3.3. In-Situ Measurement of Lattice Strain during Tensile Test
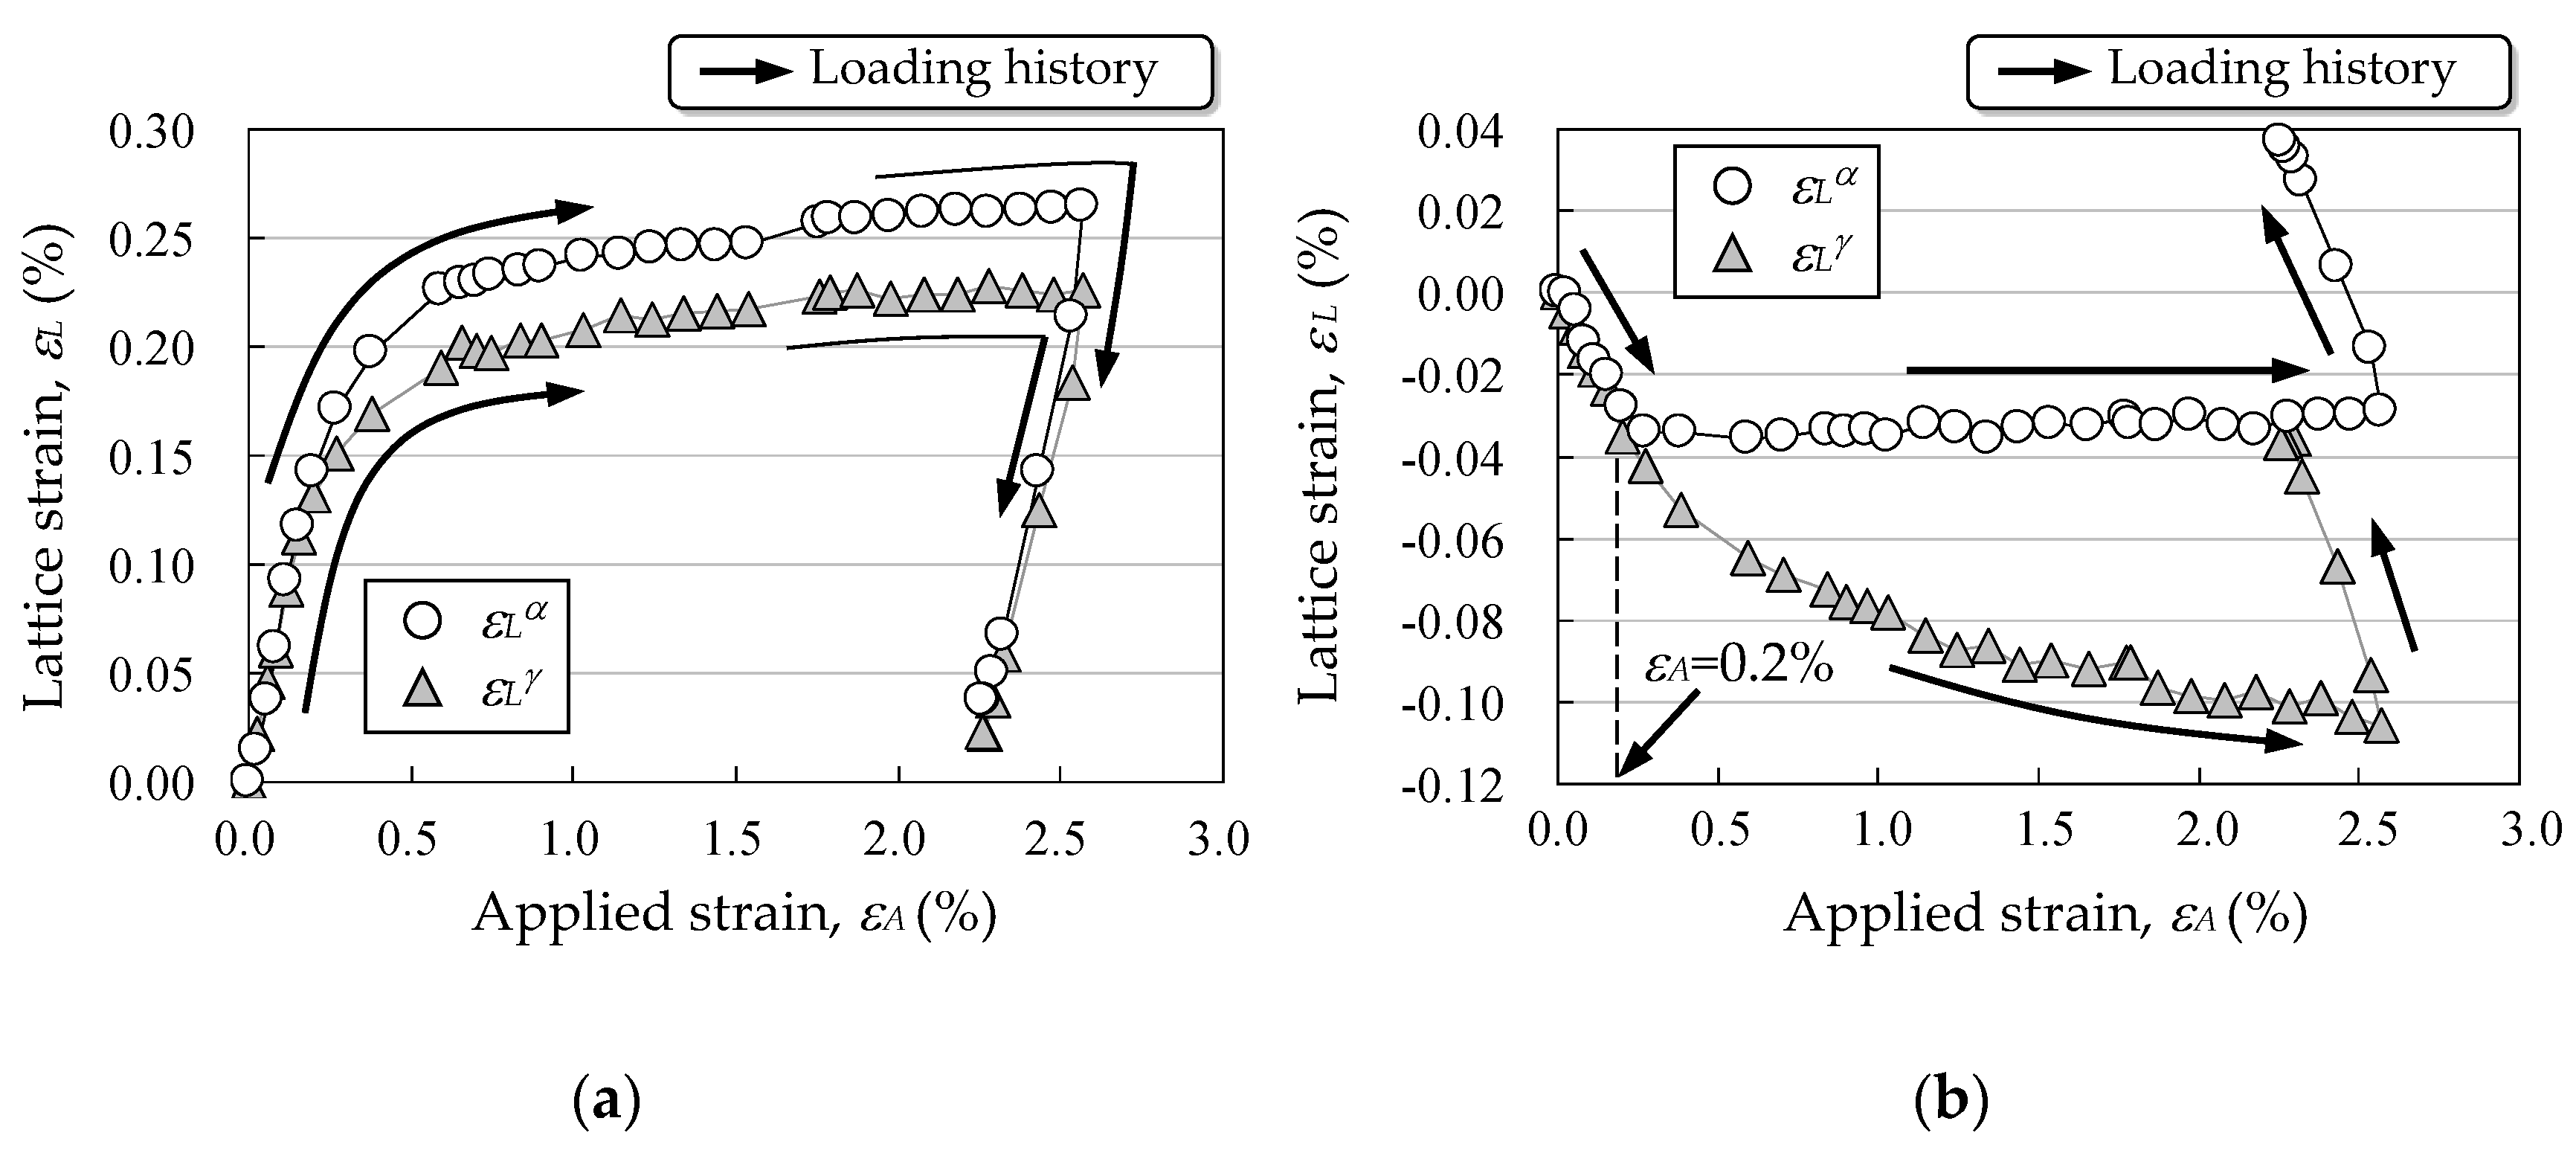
The lattice strain ε corresponding to the applied strain εA was measured during the tensile test. The discussion is focused on the cycle of “εA = 0%→2.6%→finally unloading (the 4th unloading)”, which is displayed as the black line in Figure 7b. For the sake of convenience, the original lattice strain ε0 before tensile test was excluded from the measured value ε during the tensile test, which was reflected in εL defined by the following equation.
εL = ε − ε0
The evolution of εL of both phases in the specimen axial (z) direction (h direction in cylinder) is shown in Figure 11a. At first, εLα and εLγ increase linearly in a similar proportion. Then the increasing of both εLα and εLγ slows down gradually, leading to a non-linear relationship between ε and εA. It is also revealed that εLα becomes higher than εLγ during the plastic deformation. This result can be explained by the fact that the original phase stress σα is lower than σγ, which can be derived easily from the results of Figure 10. Therefore, γ phase is expected to reach yield point earlier than α phase under applied strain, which agrees well with the results of Harjo et al., where partitioned plastic strain in γ phase was confirmed larger than that in α phase during plastic deformation under tensile loading [9].
The evolution of εL of both phases in the specimen radial (r) direction is shown in Figure 11b, εLα and εLγ are shown decreasing linearly in a similar proportion until εA has reached 0.2%. However, after εA has exceeded 0.2%, εLα stops changing but εLγ keeps increasing, causing a mismatch in lattice strain between different phases. Based on the measured εL, phase stress evolution can be discussed.
4. Discussion
4.1. Mechanism of Micro-Stress Formation
The mechanism of macro-stress distribution formed in the h and z direction of the hollow cylinder can be extrapolated by looking into the evolution of macro-stress during WQ after SHT, which is illustrated in Figure 12. At the moment the hollow cylinder at SHT temperature is immediately immersed into cold water, the water vapor surrounded by cylinder wall is briefly contained and prevented from leaving outside by the cylinder wall. As a result, the temperature drop at the inner surface is retarded in comparison to the outside surface. Therefore, as shown in Figure 12, the inner surface with higher temperature constraints the outer surface from shrinking and causes a plastic deformation, also accompanied by a tensile stress, to the outer surface. Simultaneously, the inner surface is constrained by the shrinkage of the outer surface and experiences compression after a larger plastic deformation, due to lower Young’s modulus and yield stress at high temperature. However, as shown in Figure 12, even after the thermal shrinkage has finished on the outer surface, the compressive constraint will still keep going, because the shrinkage on the inner surface will not stop until the temperature difference disappears. This scenario finally turns the stress status of outer surface from tension to compression. On the contrary, the stress of inner surface finally changes from compression to tension under the constraint of the outer surface. Based on the discussion above, the formation of micro-stress distribution along the thickness direction of the DSS hollow cylinder is explainable [13].
The combination of neutron diffraction measurement and numerical analysis is expected to be an effective approach for the practical application of not just a simple hollow cylinder, but more complicated shapes of real components. Chen et al. [25] have successfully clarified the relationship between thermal stress and distortion of a largescale DSS impeller during the casting and heat treatment by the numerical analysis. A thermoelastic-visco-plastic rheological model was used to evaluate the constrained shrinkage of the casting. Based on the simulation results, the shape of impeller was optimized to achieve a uniform and reasonable machining allowance. This precedential study shows great prospects of the relief of residual macro-stress and deformation of DSS by optimizing structural design and material processing as well.
4.2. Phase Stress Evolution under Tensile Loading
The orthogonal phase stresses are assumed to be equal in the radial direction of the round bar specimen, based on which the three main phase stresses can be calculated by the following equation:
The original phase stress σ0 before tensile test was excluded from the measured value σ during the tensile test, which was reflected in σL defined by the following equation:
σL = σ − σ0
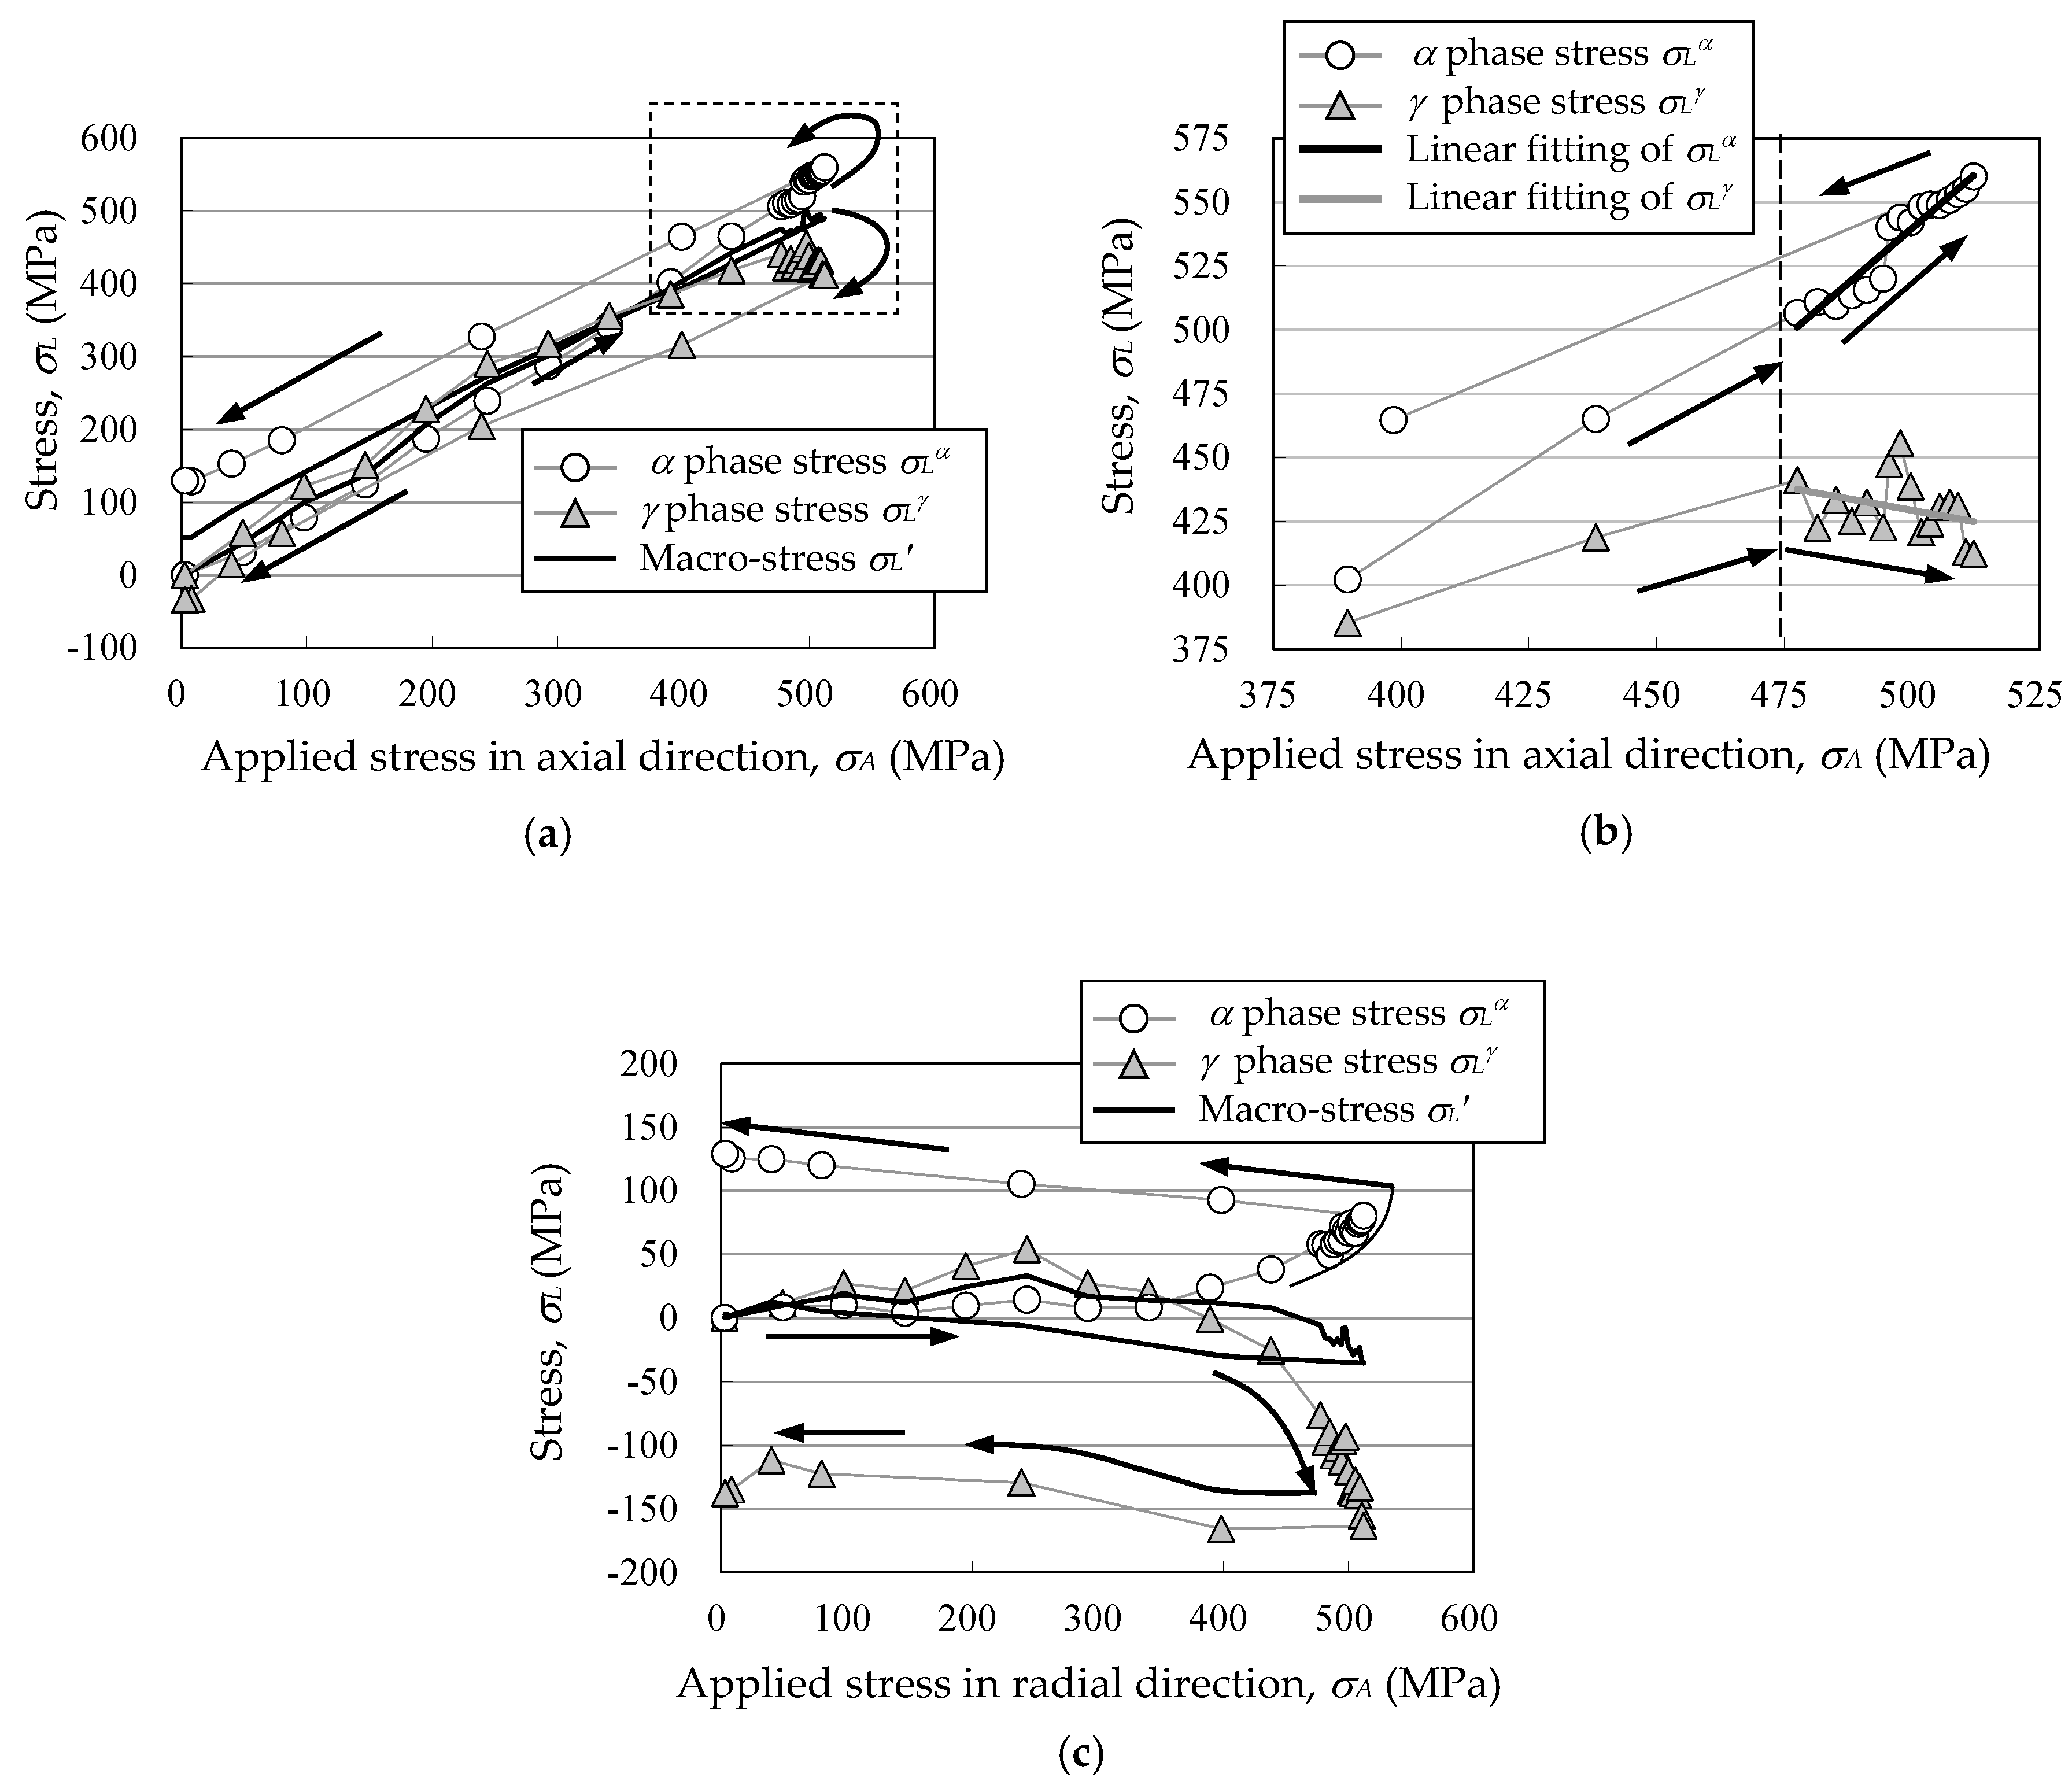
The evolution of σL of both phases and the macro-stress σL′ in the axial direction of TP4 is shown in Figure 13a. In the earlier stage, σLα and σLγ are increasing in a similar proportion. Then σLα becomes higher than σLγ and σLγ does not increase any more, indicating that the grains of γ phase start yielding. The macro-stress σL′ agrees well with the applied stress σA. The enlargement of the detail surrounded by the broken lines is shown in Figure 13b. After σA has exceeded 475 MPa, approximately the same as the yield stress in Table 2, the increasing of σLγ completely stops, which means the increment of σA is loaded only on α phase. After unloading, the σLα and σLγ become close to 130 MPa and −30 MPa, respectively. Figure 13c shows the evolution of σL of both phases and the macro-stress σL′ in the radial direction of TP4. Both σLα and σLγ remain almost 0 MPa until σA has reached 400 MPa, approximately. After σA has exceeded 400 MPa, σLα and σLγ become tension and compression, respectively. According to the mixture law, the macro-stress σL′ remains nearly 0 MPa all the time during the entire cycle of loading and unloading, agreeing well with the fact that there is no applied stress in this direction. After unloading, the σLα and σLγ become close to 130 MPa and −140 MPa, respectively.
It is interesting to note that after unloading, σLα and σLγ become tension and compression respectively, indicating that the magnitude relationship and even the tension or compression status of the two-phase stresses σα and σγ, which is caused by thermal history, might reverse after plastic deformation.
5. Conclusions
The phase stress of centrifugally cast duplex stainless steel ASTM A890 Gr.3A was measured by neutron diffraction. The main results obtained are summarized below.
- (1)
- Strain-free lattice constants of both phases were measured from the thin plates fabricated by electropolishing, based on which the measurement of triaxial phase stress was successfully conducted by neutron diffraction.
- (2)
- The triaxial phase stress distribution along the thickness direction shows that, in general, the phase stress of γ phase is in tension and higher than that of α phase.
- (3)
- The mechanism of macro-stress formation in the hollow cylinder is explainable when considering the thermal shrinkage behavior during the cooling process of water quench after solution heat treatment.
- (4)
- The magnitude relationship and even the tension or compression status of α phase and γ phase might reverse after plastic deformation, which could occur during the material process, such as plastic working. These characteristics should be taken into consideration when evaluating the material properties of DSS that are easily affected by residual stress, such as fatigue strength and stress corrosion cracking resistance.
Funding
This research received no external funding.
Acknowledgments
The author wishes to express his heartful gratitude to Stefanus Harjo and Kazuya Aizawa of J-PARC for their technical support during the neutron diffraction measurements.
Conflicts of Interest
The author declares no conflict of interest.
References
- Silberschmidt, V.V.; Werner, E.A.; Messner, C. Thermal loading of duplex steels. J. Eng. Mater. Technol. 2003, 125, 56–64. [Google Scholar] [CrossRef]
- Siegmund, T.; Werner, E.; Fischer, F.D. The Irreversible deformation of a duplex stainless steel under thermal cycling. Mater. Sci. Eng. A 1993, 169, 125–134. [Google Scholar] [CrossRef]
- Siegmund, T.; Werner, E.; Fischer, F.D. On the thermomechanical deformation behavior of duplex-type materials. J. Mech. Phys. Solids 1995, 43, 495–532. [Google Scholar] [CrossRef]
- Lodini, A.; Fitzpatrick, M.E. Analysis of Residual Stress by Diffraction Using Neutron and Synchrotron Radiation; CRC Press: Boca Raton, FL, USA, 2003. [Google Scholar]
- Hutchings, M.T.; Krawitz, A.D. Measurement of Residual and Applied Stress Using Neutron Diffraction; Kluwer Academic Publisher: Dordrecht, The Netherlands, 1992. [Google Scholar]
- Albertini, G.; Peng, R.L.; Manescu, A.; Ponzetti, A. Neutron diffraction measurement of residual stress in a centrifugal bowl of duplex steel. J. Neutron Res. 2001, 9, 305–312. [Google Scholar] [CrossRef]
- Harjo, S.; Tomota, Y.; Ono, M. Measurements of thermal residual elastic strain in ferrite-austenite Fe-Cr-Ni alloys by neutron and X-ray diffractions. Acta Mater. 1999, 47, 353–362. [Google Scholar] [CrossRef]
- Harjo, S.; Tomota, Y.; Torii, S.; Kamiyama, T. Residual thermal phase stresses in α-γ Fe-Cr-Ni alloys measured by a neutron diffraction time-of-flight methods. Mater. Trans. 2002, 43, 1696–1702. [Google Scholar] [CrossRef]
- Harjo, S.; Tomota, Y.; Lukáš, P.; Neov, D.; Vrána, M.; Mikula, P.; Ono, M. In situ neutron diffraction study of α–γ Fe–Cr–Ni alloys under tensile deformation. Acta Mater. 2001, 49, 2471–2479. [Google Scholar] [CrossRef]
- Johansson, J.; Odén, M.; Zeng, X.-H. Evolution of the residual stress state in a duplex stainless steel during loading. Acta Mater. 1999, 47, 2669–2684. [Google Scholar] [CrossRef]
- Daymond, M.R.; Priesmeyer, H.G.; Korsunsky, A.M. Elastoplastic deformation of two phase steels studied by neutron diffraction and self-consistent modelling. In Recent Advances in Experimental Mechanics; Gdoutos, E.E., Ed.; Springer: New York, NY, USA, 2002; pp. 495–506. [Google Scholar]
- Tanaka, K.; Suzuki, K.; Akiniwa, Y. Evaluation of Residual Stress by X-ray Diffraction-Fundamentals and Applications; Yokendo Ltd.: Tokyo, Japan, 2006. [Google Scholar]
- Wang, Y. Residual stress measurement of centrifugally cast duplex stainless steel by neutron diffraction. J. Soc. Mater. Sci. Jpn. 2014, 63, 789–796. [Google Scholar] [CrossRef] [Green Version]
- Wang, Y. A study on phase stress of centrifugally cast duplex stainless steel by neutron diffraction. Hamon Jpn. Soc. Neutron Sci. 2014, 24, 28–33. [Google Scholar] [CrossRef]
- Young, R.A. The Rietveld Method; Oxford University Press: Oxford, UK, 1995. [Google Scholar]
- Sasaki, T.; Lin, Z.; Hirose, Y. X-ray measurement of macro- and microstresses using imaging plate and its application to ferritic and austenitic dual phase stainless steel. Trans. JSME (A) 1996, 62, 2741–2749. [Google Scholar] [CrossRef] [Green Version]
- Suzuki, H.; Akita, K. Discussion on accuracy of weld residual stress measurement by neutron diffraction. Influence of strain free reference. J. Soc. Mater. Sci. Jpn. 2012, 61, 604–611. [Google Scholar] [CrossRef]
- Santisteban, J.R.; Steuwer, A.; Edwards, L.; Withers, P.J.; Fitzpatrick, M.E. Mapping of unstressed lattice parameters using pulsed neutron transmission diffraction. J. Appl. Crystallogr. 2002, 35, 497–504. [Google Scholar] [CrossRef]
- Withers, P.J.; Preuss, M.; Steuwer, A.; Pang, J.W.L. Methods for obtaining the strain-free lattice parameter when using diffraction to determine residual stress. J. Appl. Crystallogr. 2007, 40, 891–904. [Google Scholar] [CrossRef]
- Tomota, Y.; Harjo, S.; Tokumura, K.; Sato, H.; Ono, M. Measurements of phase stresses in a commercial dual phase stainless steel by using neutron and X-ray diffractions. Netsu Shori 1998, 38, 174–179. [Google Scholar]
- Suzuki, H.; Akita, K. Residual stress measurement of large scaled welded pipe using neutron diffraction method. Effect of SCC crack propagation and repair weld on residual stress distribution. Q. J. Jpn. Weld. Soc. 2011, 29, 294–304. [Google Scholar] [CrossRef] [Green Version]
- Oishi, R.; Yonemura, M.; Nishimaki, Y.; Torii, S.; Hoshikawa, A.; Ishigaki, T.; Morishima, T.; Mori, K.; Kamiyama, T. Rietveld analysis software for J-PARC. Nucl. Instrum. Methods Phys. Res. 2009, 600, 94–96. [Google Scholar] [CrossRef]
- Oishi-Tomiyasu, R.; Yonemura, M.; Morishima, T.; Hoshikawa, A.; Torii, S.; Ishigaki, T.; Kamiyama, T. Application of matrix decomposition algorithms for singular matrices to the Pawley method in Z-rietveld. J. Appl. Crystallogr. 2012, 45, 299–308. [Google Scholar] [CrossRef]
- JSMS Committee on X-ray Study of Mechanical Behavior of Materials. Standard Method for X-ray Stress Measurement; The Society of Materials Science: Kyoto, Japan, 2002. [Google Scholar]
- Chen, L.; Ling, Y.; Kang, X.; Xia, L.; Li, D. Numerical simulation of stress and deformation for a duplex stainless steel impeller during casting and heat treatment processes. J. Mater. Sci. Technol. 2008, 24, 364–368. [Google Scholar]
Figure 1.
Schematics of specimens (unit: mm) [14].
Figure 1.
Schematics of specimens (unit: mm) [14].

Figure 2.
Microstructure of centrifugally cast DSS ASTM A890 Gr.3A. (a) Optical microscopy, (b) Inverse pole figure (IPF) image.
Figure 2.
Microstructure of centrifugally cast DSS ASTM A890 Gr.3A. (a) Optical microscopy, (b) Inverse pole figure (IPF) image.

Figure 3.
Optical system of neutron diffraction for strain-free lattice constant measurement. (a) Side view, (b) Top view [13].
Figure 3.
Optical system of neutron diffraction for strain-free lattice constant measurement. (a) Side view, (b) Top view [13].

Figure 4.
Schematics of neutron diffraction measurement position in hollow cylinder specimen [13].
Figure 4.
Schematics of neutron diffraction measurement position in hollow cylinder specimen [13].

Figure 5.
Setup image and optical system of neutron diffraction measurement of hollow cylinder specimen. (a) Measurement in radial (r) and axial (z) directions, (b) Measurement in radial (r) and hoop (h) directions [13].
Figure 5.
Setup image and optical system of neutron diffraction measurement of hollow cylinder specimen. (a) Measurement in radial (r) and axial (z) directions, (b) Measurement in radial (r) and hoop (h) directions [13].


Figure 6.
Setup image and optical system of in-situ neutron diffraction measurement during tensile test. (a) Side view, (b) Top view [14].
Figure 6.
Setup image and optical system of in-situ neutron diffraction measurement during tensile test. (a) Side view, (b) Top view [14].

Figure 7.
Loading condition of tensile test. (a) Applied stress history, (b) Stress-strain curve [14].
Figure 7.
Loading condition of tensile test. (a) Applied stress history, (b) Stress-strain curve [14].

Figure 8.
Neutron diffraction intensity profile of strain-free specimen [13].
Figure 8.
Neutron diffraction intensity profile of strain-free specimen [13].

Figure 9.
Strain-free lattice constant a0 [14].
Figure 9.
Strain-free lattice constant a0 [14].

Figure 10.
Residual stress distribution of hollow cylinder specimens. (a) Radial (r) direction, (b) Hoop (h) direction, (c) Axial (z) direction.
Figure 10.
Residual stress distribution of hollow cylinder specimens. (a) Radial (r) direction, (b) Hoop (h) direction, (c) Axial (z) direction.

Figure 11.
Lattice strain evolution under tensile loading. (a) Axial direction, (b) Radial direction [14].
Figure 11.
Lattice strain evolution under tensile loading. (a) Axial direction, (b) Radial direction [14].

Figure 12.
Mechanism of macro-stress development during water quench after solution heat treatment [13].
Figure 12.
Mechanism of macro-stress development during water quench after solution heat treatment [13].

Figure 13.
Phase stress evolution under tensile loading. (a) Axial direction, (b) Enlargement of the area with broken lines in (a), (c) Radial direction.
Figure 13.
Phase stress evolution under tensile loading. (a) Axial direction, (b) Enlargement of the area with broken lines in (a), (c) Radial direction.


Table 1.
Chemical composition of duplex stainless steel ASTM A890 Gr.3A. (mass %).
| Specification | C | Si | Mn | P | S | Ni | Cr | Mo | N | Fe |
|---|---|---|---|---|---|---|---|---|---|---|
| <0.06 | <1.00 | <1.00 | <0.040 | <0.040 | 4.0–6.0 | 24.0–27.0 | 1.75–2.50 | 0.15–0.25 | Bal. | |
| Inspection certificate | 0.02 | 0.41 | 0.64 | 0.016 | 0.002 | 4.8 | 24.7 | 1.86 | 0.19 | - |
Table 2.
Mechanical properties of cast duplex stainless steel ASTM A890 Gr.3A.
| Young’s Modulus E′ (GPa) | Poisson’s Ratio ν′ | Proof Stress σ0.2% (MPa) | Ultimate Strength σB (MPa) | Elongation (%) |
|---|---|---|---|---|
| 197 | 0.29 | 485 | 687 | 39 |
© 2020 by the author. Licensee MDPI, Basel, Switzerland. This article is an open access article distributed under the terms and conditions of the Creative Commons Attribution (CC BY) license (http://creativecommons.org/licenses/by/4.0/).
Share and Cite
MDPI and ACS Style
Wang, Y. Phase Stress Measurement of Centrifugally Cast Duplex Stainless Steel by Neutron Diffraction. Quantum Beam Sci. 2020, 4, 28. https://0-doi-org.brum.beds.ac.uk/10.3390/qubs4030028
AMA Style
Wang Y. Phase Stress Measurement of Centrifugally Cast Duplex Stainless Steel by Neutron Diffraction. Quantum Beam Science. 2020; 4(3):28. https://0-doi-org.brum.beds.ac.uk/10.3390/qubs4030028
Chicago/Turabian StyleWang, Yun. 2020. "Phase Stress Measurement of Centrifugally Cast Duplex Stainless Steel by Neutron Diffraction" Quantum Beam Science 4, no. 3: 28. https://0-doi-org.brum.beds.ac.uk/10.3390/qubs4030028