Article

Neutron Beam Characterization at Neutron Radiography (NRAD) Reactor East Beam Following Reactor Modifications

1
Idaho National Laboratory, Idaho Falls, ID 83415, USA
2
Nuclear Engineering Department, Idaho State University, Pocatello, ID 83209, USA
*
Author to whom correspondence should be addressed.
Submission received: 18 March 2021 / Revised: 1 April 2021 / Accepted: 10 April 2021 / Published: 15 April 2021
(This article belongs to the Collection Facilities)

Abstract

:
The Neutron Radiography Reactor at Idaho National Laboratory (INL) has two beamlines extending radially outward from the east and north faces of the reactor core. The control rod withdrawal procedure has recently been altered, potentially changing power distribution of the reactor and thus the properties of the neutron beams, calling for characterization of the neutron beams. The characterization of the East Radiography Station involved experiments used to measure the following characteristics: Neutron flux, neutron beam uniformity, cadmium ratio, image quality, and the neutron energy spectrum. The ERS is a Category-I neutron radiography facility signifying it has the highest possible rank a radiography station can achieve. The thermal equivalent neutron flux was measured using gold foil activation and determined to be 9.61 × 10⁶ ± 2.47 × 10⁵ n/cm2-s with a relatively uniform profile across the image plane. The cadmium ratio measurement was performed using bare and cadmium-covered gold foils and measured to be 2.05 ± 2.9%, indicating large epithermal and fast neutron content in the beam. The neutron energy spectrum was measured using foil activation coupled with unfolding algorithms provided by the software package Unfolding with MAXED and GRAVEL (UMG). The Monte-Carlo N-Particle (MCNP6) transport code was used to assist with the unfolding process. UMG, MCNP6, and measured foil activities were used to determine a neutron energy spectrum which was implemented into the MCNP6 model of the east neutron beam to contribute to future studies.

1. Introduction

The Neutron Radiography Reactor (NRAD) facility is a TRIGA-Mark II reactor that produces power up to 250 kWth. It sits below the Hot Fuel Examination Facility (HFEF), the world’s largest inert atmosphere hot cell, providing easy access to radioactive materials that may need to be analyzed using neutron radiography. The reactor is water- and graphite-moderated and contains a total of 64 cylindrical fuel elements [1]. NRAD has two beam ports facing east and north of the reactor core. The East Radiography Station (ERS) neutron beam extends 4.57 m through air and a helium filled aluminum tube starting at the outer east edge of the reactor core. The apertures for the beam are placed about halfway in between the outer edge of the reactor core and the outer wall of the reactor vessel. The apertures are made of boron nitride with three circular holes with diameters of 8.89 cm, 3.53 cm, and 1.50 cm. The length of the beam, from the aperture to the image plane (L) and the diameter of the aperture (D) can be used to describe a specific characteristic of particle beams called the L/D ratio, which is a measure of the collimation of a neutron beam. L/D ratios for the ERS are 50, 125, and 300, corresponding to the three aperture diameters. The ERS also has an elevator shaft, filled with argon gas, directly connected to the hot cells above which allows easy access to used fuel or other highly radioactive materials in the hot cell. The elevator shaft lowers material directly in front of the beam line to enable neutron radiography using an indirect method (e.g., transfer method) to produce neutron radiographs [2,3,4], though some direct digital methods are possible as well [5,6].
Two complete neutron beam characterizations have been performed at NRAD in the past 30 years, once in 1992 [7] and again in 2013 [8]. Additional fuel elements were added to the NRAD reactor core in 2013, after which the ERS neutron beam was characterized to understand the impact of the new fuel on the beam performance [9]. Each characterization was performed after properties in the reactor core were altered resulting in changes to the neutron beam characteristics.

2. Neutron Beam Characteristics

The following sections discuss multiple characteristics that were measured and calculated for characterizing the ERS at INL’s NRAD facility. The sections will describe each characteristic and its significance to the facility, as well as how the characteristic was measured.

2.1. Neutron Beam Flux

The neutron flux incident at the image plane has a significant impact on the radiographic image and is the single most important parameter. Higher neutron flux can reduce exposure times or improve signal-to-noise ratio for longer exposures. Neutron activation analysis with gold foils was determined to be the most appropriate neutron flux measurement technique [10,11]. An array of 21 gold foils was attached to an aluminum plate that could fit into the cassette device. The cassette places the foils up against the image plane directly in the path of the neutron beam. The foils are exposed to the neutron beam for 5 h with the reactor power level at 250 kWth. A drawing that displays the dimensions and layout of the 21-gold foil array can be seen in Figure 1 along with a picture of the actual setup. The foils were wrapped in aluminum foil and aluminum tape was used as the adhesive to ensure the gold foils stayed on the plate. The gold foils were 12.7 mm diameter and 50.8 µm thick, and the mass of each foil was measured for activation calculations.
The foils were removed from the aluminum plate after neutron exposure and the resulting activity was measured. The activity emitted from the foils is caused by the reaction, 197Au (n,γ)198Au, which has a thermal neutron cross-section (σ) of 98.7 b. The radionuclide produced from the neutron interaction (198Au) has a half-life of 2.695 days and emits a gamma-ray with energy of 411.8 keV [12]. This gamma energy is unique to the decay process of 198Au and can be used to determine the activity of the activated gold foil. The HPGe detector used was manufactured by Ortec and had a relative efficiency of 50%. Canberra Apex software was used to determine the number of decays (i.e., gamma-rays) per second emitted from the gold foil. The detector was calibrated with a 152Eu source which was also used as a control during the counting process [13]. The activity of each foil was then correlated to the average thermal neutron flux incident on the image plane.
The number of radioactive nuclides produced is directly related to the activity of the foil after exposure in the neutron beam per Equation (1) [14], where A represents the activity of the foil after the exposure time texp, N is the number of atoms of the nuclide being irradiated (198Au atoms in the gold foil in this case), σ is the microscopic cross-section of the desired reaction, λ is the decay constant, ϕo is the neutron intensity (e.g., neutron flux) incident on the foil and ϕ ¯ is the uncorrected average neutron flux measured from the foils.
ϕ ¯ = A N σ ( 1 e λ t e x p )
A self-shielding correction factor, fs, is incorporated into the flux term to correct for the decrease in the neutron flux due to the high thermal neutron attenuation cross-section of the gold foils, as shown in Equation (2).
f s ϕ ¯ ϕ 0 .
Neutrons scattering inside the gold foil should also be accounted for. The correction factors can be found using Equations (3) and (4) [15], where x is the thickness of the foil, Σt is the total macroscopic cross-section, and Σs is the macroscopic scattering cross-section, and f0 is the self-shielding factor calculated assuming Σs = 0. The flux value calculated from Equation (1) can be divided by the final correction term, fs, to find the neutron flux incident on the foils [9].
f 0 = 1 e Σ t x Σ t x
f s = f 0 ( 1 Σ s Σ t ( 1 f 0 ) ) .
Two sets of gold foils were irradiated resulting in a total of 42 foils used to measure the neutron flux at the image plane. This also allows two sets of data to be compared with a better statistical value for the final result. The uncertainty for the measured flux incident on each foil is a combination of the physical parameters of the foil, measurable aspects of the experiment setup, and the error associated with the measurement of radioactive decay in the foils.
Radioactive decay can be modeled as a random process using the Poisson distribution. The Poisson distribution is characterized by a single independent parameter, the mean. The mean is represented by the number of counts over a specified time. The standard deviation for a Poisson distribution is the square root of the mean. Equations (5) and (6) can be used to derive the standard deviation (σ) of a measurement (i.e., uncertainty) by relating it to the variance and the expected sample variance (s2) to the predicted variance (σ2) [16]. The number of counts is the measured radioactive decay emitted from the foil.
s 2 = σ 2 = ( #   o f   c o u n t s )
σ = #   o f   c o u n t s .
The uncertainties are reported at a 2σ value, representing a confidence interval of 95%. The physical feature of the foils that had measured uncertainties was the weight (w). The measured uncertainties in the experimental setup included time (t) of irradiation and the physical placement (P) of the foils on the image plane. Equation (7) was used to calculate the total uncertainty in each foil flux measurement based on the parameters described.
( σ ϕ ϕ ) 2 = ( σ w w ) 2 + ( σ A A ) 2 + ( σ t t ) 2 + ( σ P P ) 2

2.2. Neutron Beam Uniformity

The beam flux uniformity is a measure of the homogeneity of the neutron flux at the image plane. An equally-distributed neutron flux across the image plane does not normally occur due to asymmetries caused by the neutron beam interacting with surrounding material. Some examples are back scattering of neutrons off the beam stop, irregular scattering off the walls of the collimator, or geometric variation of the radial distance from the aperture to each point at the image plane [17]. Asymmetries in the neutron beam can cause a peak in the middle and the flux is not as intense towards the edges of the image plane [8]. Images can become blurry if irregularities in the beam uniformity are present [17].
Neutron activation analysis can be used in the exact same way as described in the neutron flux measurements to measure the beam flux profile over the image plane. An array of gold foils was equally distributed at the image plane and exposed to the neutron beam. The foils were counted, and the average flux of each foil was compared to the position that foil was placed on the image plane. The correlation between the neutron flux and the position gives a flux profile of the beam incident on the image plane [9]. As depicted in Figure 1, the foils were spaced equal distances apart and cover the entire image plane. The results of each foil’s measured activities were compared to their position to determine if there is a relatively uniform beam over the entire 767 cm2 image plane.

2.3. Cadmium Ratio

The cadmium ratio is the ratio of the reaction rates induced by the full neutron beam energy spectrum to those of the cadmium-filtered neutron beam. A larger cadmium ratio represents a larger thermal neutron content in the neutron beam. A cadmium covered gold foil is primarily activated by epithermal neutrons and neutrons with higher energies that are incident on the gold foil after being filtered by the cadmium foil [18]. Figure 2 shows the microscopic absorption cross-sections for gold and cadmium [19], which shows that the cadmium has a threshold energy of about 0.55 eV [18], and thus cadmium will absorb a majority of the thermal neutrons before they can make it to a gold foil.
The cadmium ratio is important for a neutron beam used for neutron imaging because it affects the spatial resolution and contrast that the neutron beam can provide. Thermal neutrons are less likely to make it through an object designed to absorb thermal neutrons (i.e., nuclear fuel rods) [2] or other highly attenuating samples. For such highly attenuating samples, it may be advantageous to have a high epithermal and/or fast neutron beam content that can penetrate through the object to the imaging system. Thus, the cadmium ratio gives the NRAD facility a quantitative idea of how many epithermal and fast neutron content at the image plane.
A method for determining the cadmium ratio in a neutron flux is described in ASTM E261-10 [18]. Bare and cadmium-covered foils are exposed to the neutron flux in identical conditions (i.e., same position, same foil weight, same exposure time, reactor power). The reaction rates of the foils are then measured using a gamma spectrometer and then compared using Equation (8). The reaction rate of the bare foil is RB and the reaction rate for the cadmium covered foil is RCd [18].
R = R B R C d = A B A C d .
The same techniques used to measure the flux and flux profile of the beam were used for this measurement, but with a few key differences. The 21-gold foil array was arranged the same way as shown in Figure 1, but this time each gold foil was inserted into a 1-mm thick cadmium cover that would shield the gold from low-energy neutrons. Two sets of 21 cadmium covered gold foils were each irradiated for the same reactor power, 250 kWth, and amount of time, 5 h, as the bare gold foils. The cadmium ratio was then calculated using Equation (8) with the average activity determined at each position.

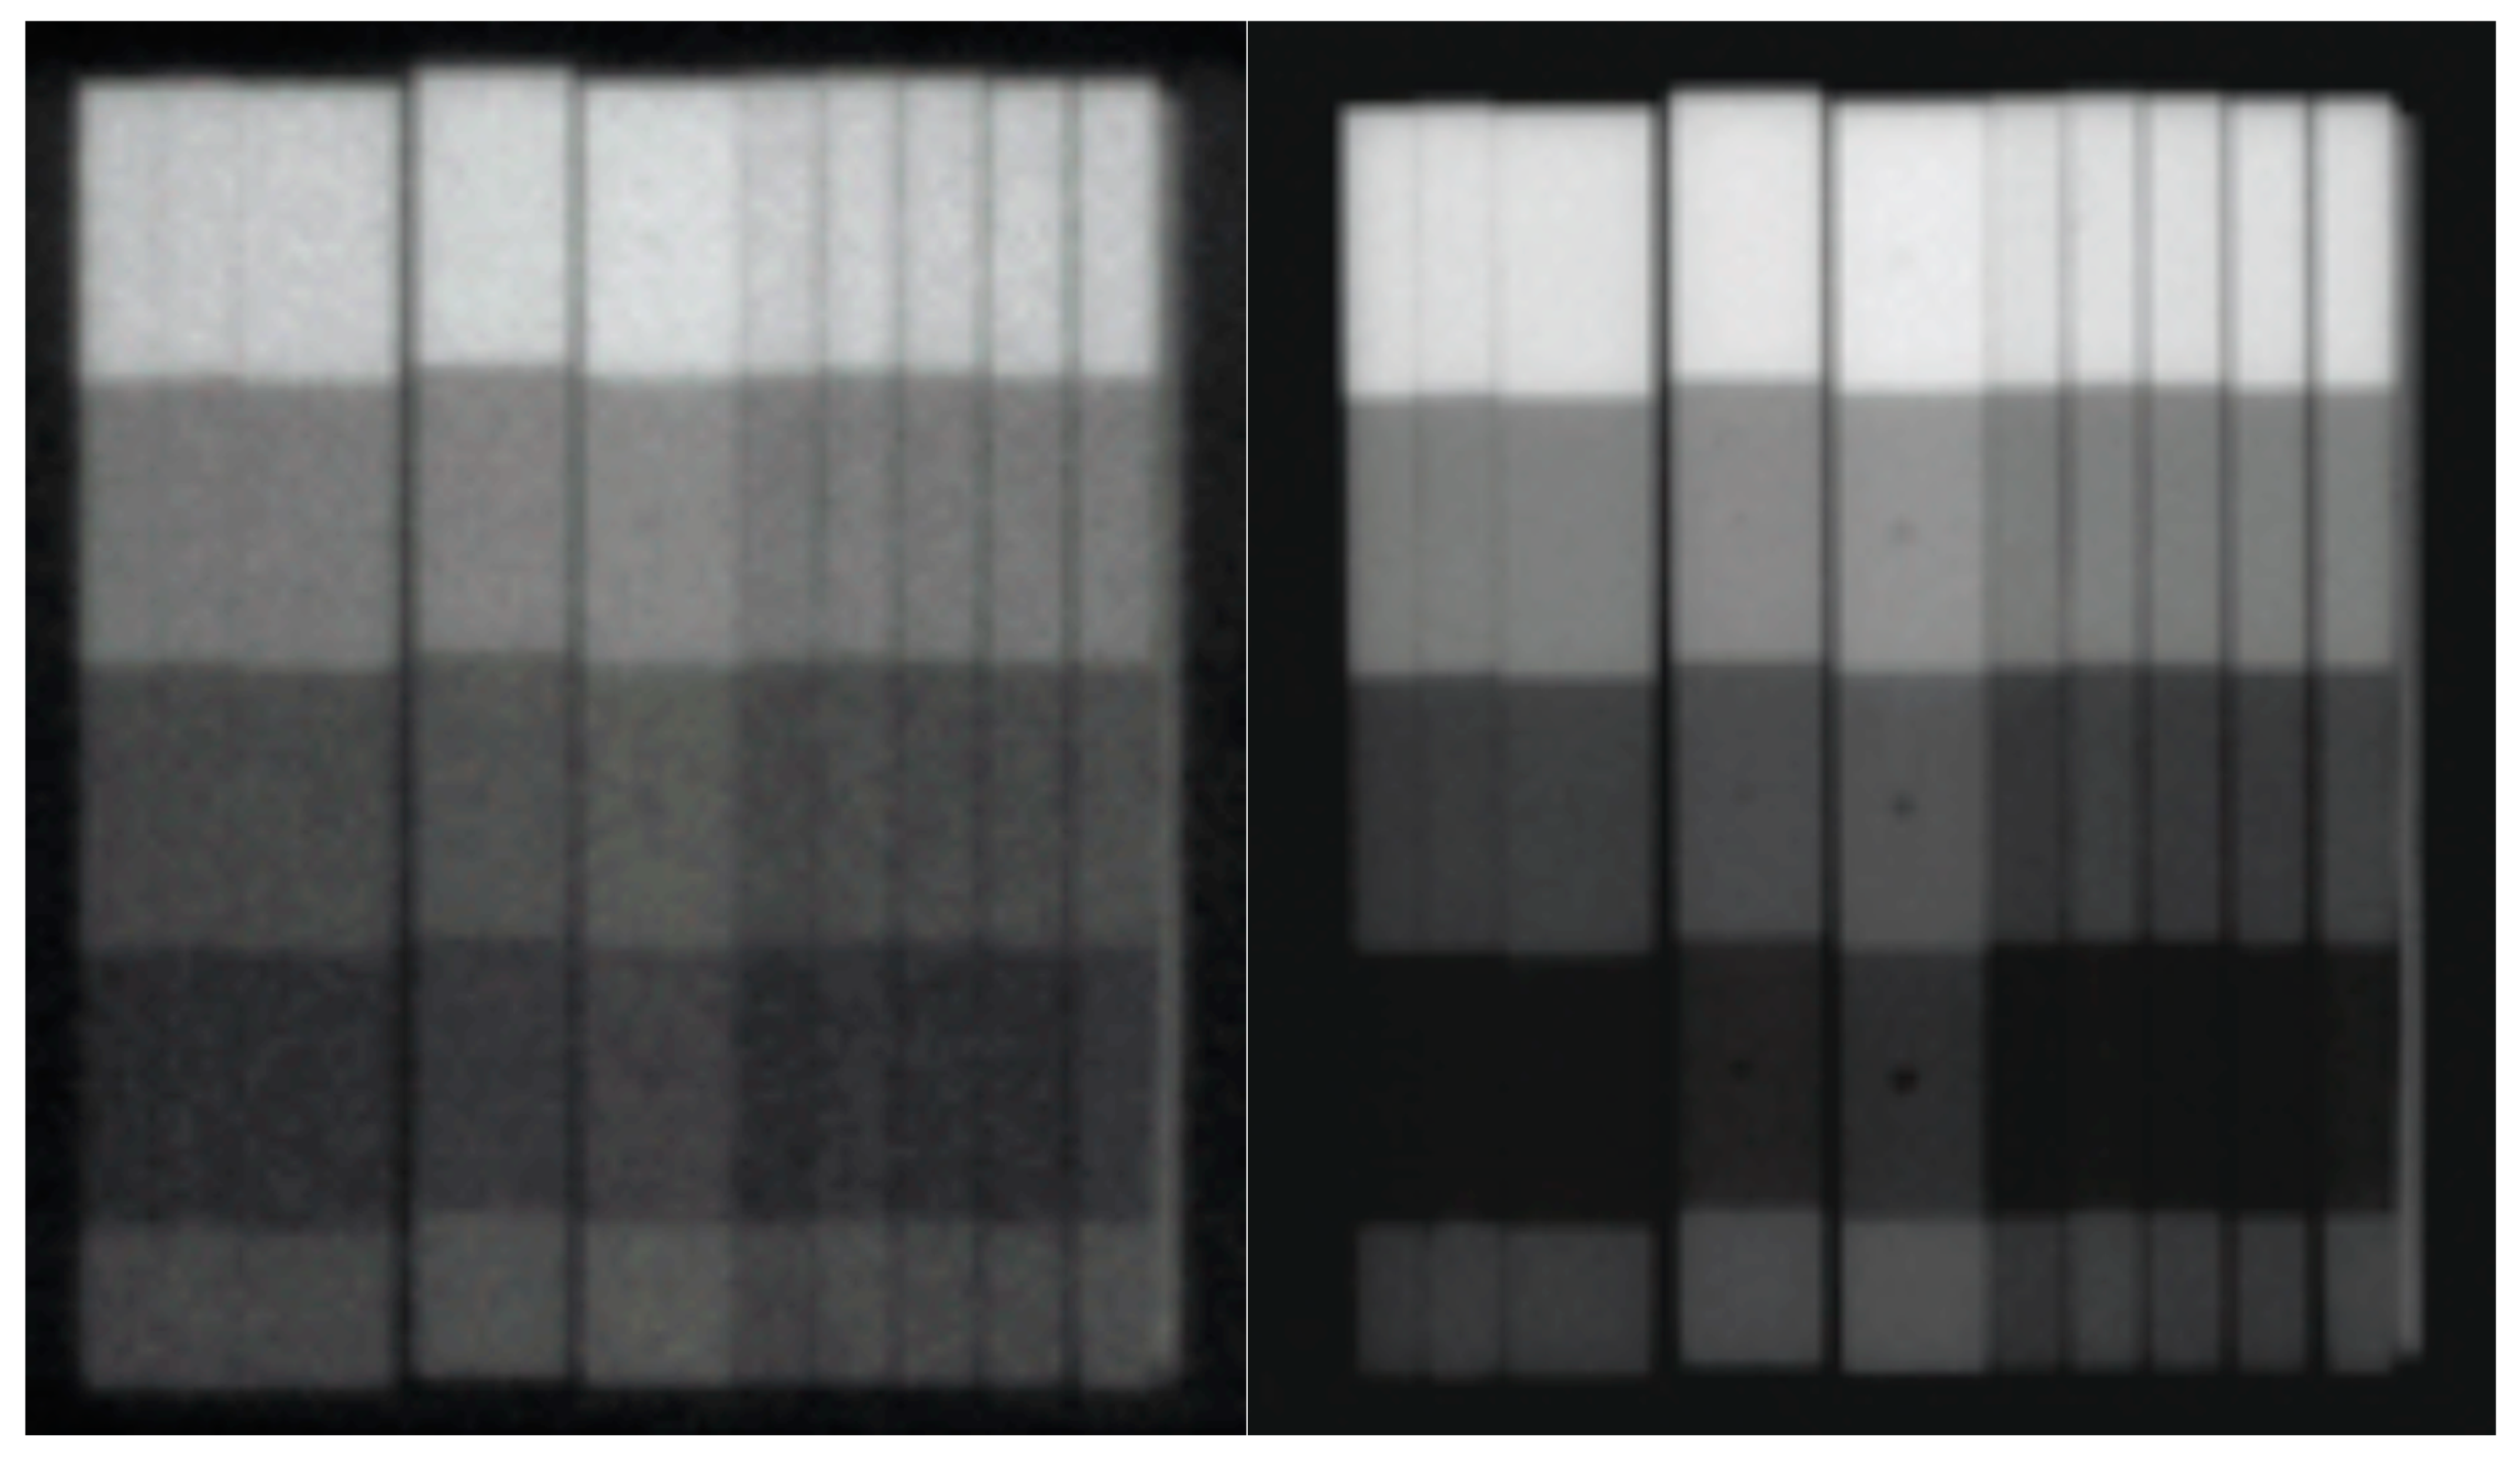
2.4. Image Quality per ASTM Standards

The image quality is an important metric to characterize for a neutron beam that is used for a neutron imaging facility. According to ASTM E545-19, Section 5.2: The only truly valid sensitivity indicator is a reference standard part. A reference standard part is a material or component that is the same as the object being neutron radiographed except with a known standard discontinuity, inclusion, omission, or flaw. The sensitivity indicators were designed to substitute for the reference standard and provide qualitative information on hole and gap sensitivity. [20]
The beam’s image quality is found by measuring four different characteristics using image quality indicators (IQIs) [20]. There are two types of image quality indicators used, the beam purity indicator (BPI) and the sensitivity indicator (SI). The SI is used to measure the sensitivity to detail the beam can produce. It is a step-wedge device that contains small gaps and holes. The SI device can be used to visually analyze the sensitivity of the radiograph (i.e., the smaller the gaps and holes one can distinguish, the more sensitive the radiograph). The BPI is a polytetrafluoroethylene block with different materials of known dimensions that can be radiographed and analyzed to obtain pertinent neutron beam facility information. The two devices are depicted in Figure 3.
The BPI is used to measure the thermal neutron content (NC), the scattered neutron content (S), the effective gamma content (γ), and the pair production content (P). The last two terms mentioned are applicable to direct conversion techniques only. The NRAD facility operates as an indirect conversion facility [2]. Indirect facilities do not expose the radiographic film directly to the neutron beam but instead expose conversion foils to the beam. The film is then exposed to the activated conversion foils away from the beamline, and the decay radiation from the activated conversion foils expose the film to produce an image. Because of the indirect method’s inherent separation of the conversion foil from the film during exposure, the amount of photons incident on the conversion foils has no effect on the resulting neutron radiograph. Thus, the gamma content and the pair production content will be ignored for all image quality measurements.
The equations used to find the values to these terms are listed below in Equations (9) and (10). Table 1 gives a brief description of the terms in the equations along with the type of material that is inserted into the various openings in the device.
N C = D H ( h i g h e r D B + Δ D L ) D H × 100
S = ( Δ D B D H ) × 100 .
Table 2 shows the values that the number of visible holes and steps represent of the SI device. The SI device is used to measure the two other characteristics shown in Table 3, the largest consecutive numbered hole that is visible (H) and the smallest gap seen at all absorber thicknesses (G) [20].
The combination of these two devices offers a qualitative understanding of the capabilities of the neutron radiography facility. A ranking system has been developed by ASTM using the parameters calculated from the indicators described. The quality level of a facility on a scale from Category I to Category V can be determined using Table 3.
The image quality of the beam was determined by taking neutron radiographs of the two IQIs using L/D of 125 and an exposure time of 22 min. The BPI surface was positioned parallel against the film cassette and the cadmium wires in it were oriented so their longitudinal axis is perpendicular to the nearest film edge. The SI device was positioned in the image plane so its thickest step is not adjacent to the BPI and it was ensured that the SI no less than 25 mm away from the edge of the exposed area. The images of the IQIs were then analyzed both visually and using a densitometer to determine the values described in Table 1 and Table 2.

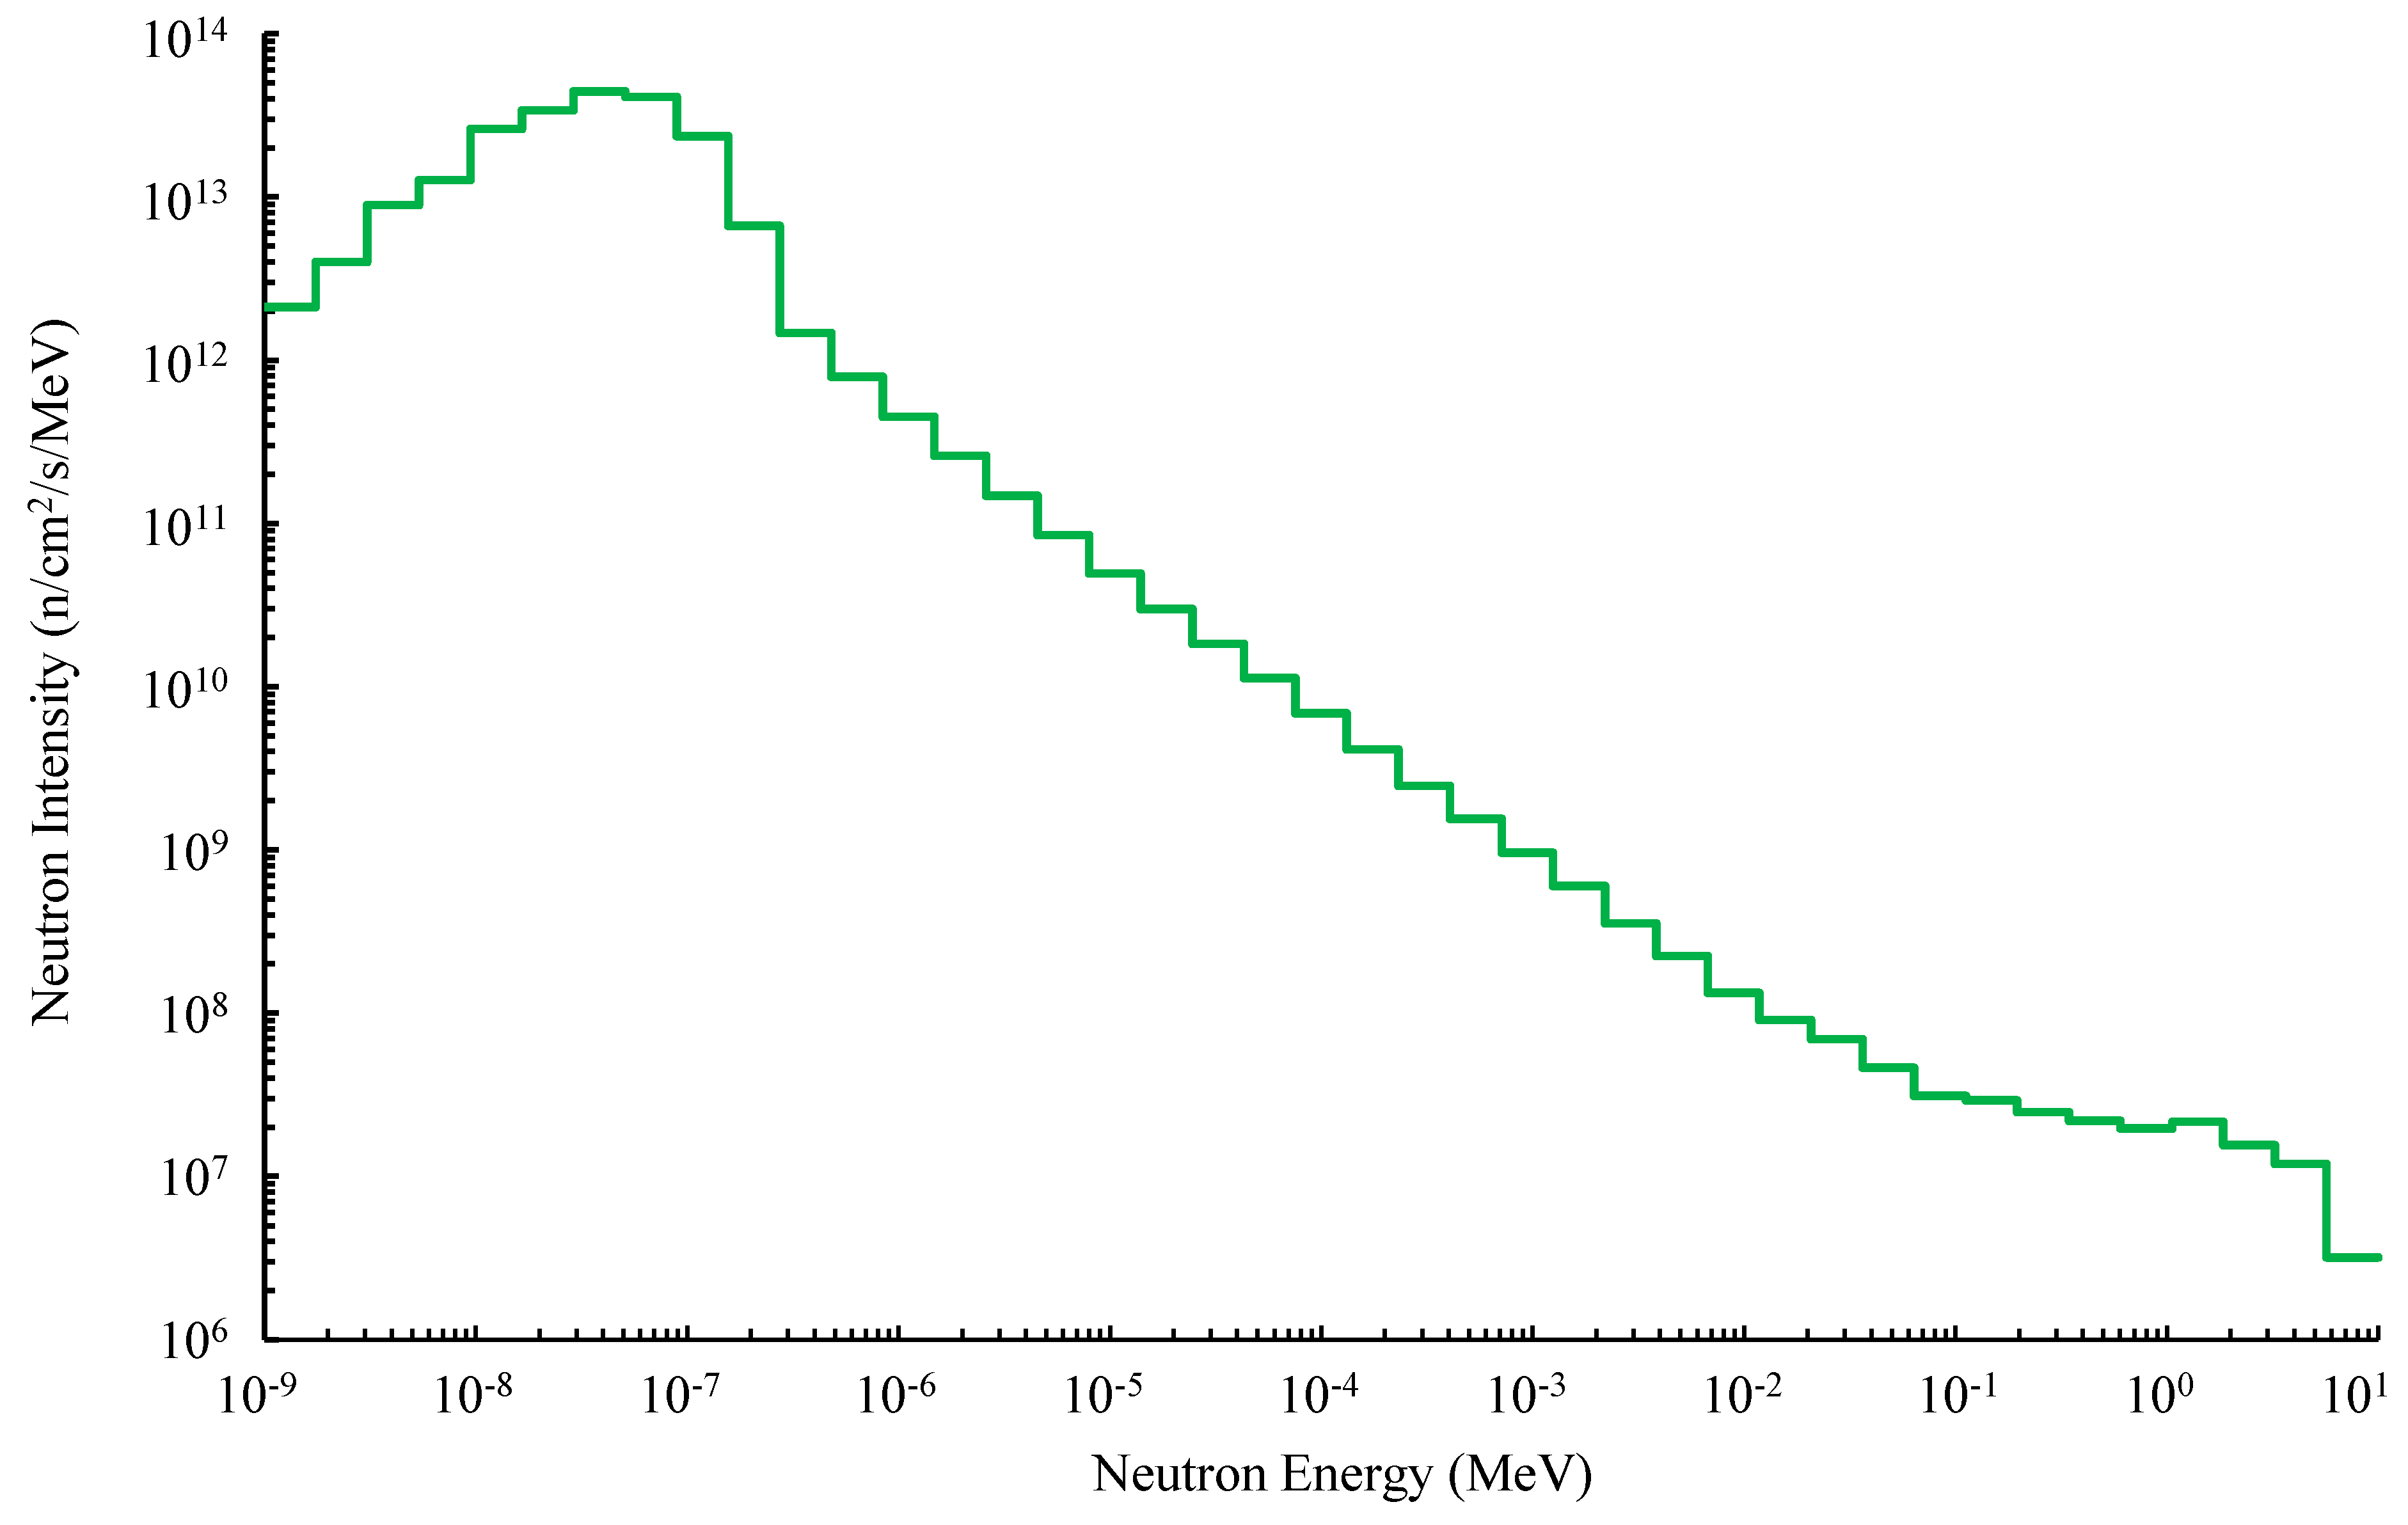
2.5. Neutron Energy Spectrum

The neutron energy spectrum is one of the most important characteristics of a neutron beam. The main purpose for determining the neutron energy spectrum at the ERS image plane is to have an accurate energy spectrum based on experimentally measured data that can support future modeling and simulation efforts.
Determining neutron energy spectra is commonly performed using foil activation methods and subsequent unfolding of the energy spectrum. An energy spectrum can be determined based on measured reactions of several different foils exposed to a neutron flux [10,21,22,23]. The neutron energy spectrum can be calculated by using three sets of data: Measured foil responses, foil response as a function of energy, and an initial guess spectrum. The foils are exposed to a neutron energy spectrum and the response of each one is calculated using the measured activity and known physical features of the foils. Computer software such as Monte Carlo N-Particle (MCNP) can be used to determine the initial energy spectrum [24,25], and Unfolding with MAXED and GRAVEL (UMG) can calculate the unfolded energy spectrum.
One bare set of 23 different foils and a separate set of 11 different cadmium covered foils were irradiated in the ERS and used to measure the foil responses. Each foil was chosen so that the entire set could interact with a wide range of neutron energies. The two sets of foils were irradiated for 10 h each, at a reactor power of 250 kWth. The activities of these foils were measured using a calibrated HPGe detector and the resulting foil responses were calculated. An MCNP6 model of the ERS was built and used to calculate the response functions of the foils and the initial guess spectrum for input into the UMG software [26].

3. Results

3.1. Neutron Beam Flux and Uniformity

Table 4 lists the measured uncertainties for each parameter described in Section 2.1. These uncertainties were used in Equation (7) to produce an average flux uncertainty of 2.6%. The uncertainty for the weight of each foil was provided by the manufacturing company. The placement error was measured using the smallest possible measurement that could be taken on the ruler used to place the foils on the aluminum sheet, and the time uncertainty was provided by the NRAD operators using the smallest possible time measurement on the timer. The measured results for the neutron flux at the image plane are shown in the Table 5.
The measured activities at the end of irradiation can be seen in the second and fifth columns of Table 5. The neutron flux was calculated using Equation (1). It should be noted that these flux values were calculated using the average thermal microscopic cross-section of gold, which is 98.7 barns. This cross-section will only account for the neutrons at the thermal and epithermal energy levels of roughly 1 eV or less [12].
The total thermal averaged flux of NRAD’s ERS neutron beam is 9.61 × 10⁶ ± 2.47 × 10⁵ n/cm2/s. The neutron energy spectrum results include the calculated neutron flux over the entire energy range (0.001 eV to 10 MeV).
Figure 4 shows the neutron flux profile results at the image plane, with tabulated values listed in Table 5. The beam is relatively flat across the surface of the image plane. This is a good indicator that any object being radiographed will be exposed to roughly the same number of neutrons regardless of where it is at on the image plane. The peak-to-average ratio of the flux measurements is 1.031, indicating very small deviation across the image plane.

3.2. Cadmium Ratio

Table 6 shows the activities of the covered foils and their resulting cadmium ratio calculated using the average activity at each position. The cadmium ratio of the neutron beam at the image plane was found after irradiating 42 gold foils (two sets of 21 foils) covered with cadmium and then comparing the activities between the cadmium-covered activities (in Table 6) and bare foil activities (in Table 5). The cadmium ratio of the gold foils is 2.05 ± 2.9%, which demonstrates that the ERS neutron beam has a high epithermal neutron content, which is quantified later in Section 3.4.

3.3. Image Quality

The film densities of the BPI can be found in Table 7, and the values obtained from visual analysis of the SI can be found in Table 8. Two neutron radiographs can be seen in Figure 5, one acquired using a cadmium filtered beam with an indium converter foil and the other using the unfiltered beam with a dysprosium converter foil [2]. The film densities were found using a calibrated Xrite model 301 densitometer that correlates the amount of light transmitted through the film to the optical density of the film [27]. It can be seen from the measured parameters in Table 8 that the ERS facility scores in the Category I range for neutron content, scattering content, and the number of visible gaps and holes. The pair production and gamma content do not apply to the ERS because the facility uses an indirect method for developing radiographs, which is completely insensitive to gamma-rays.

3.4. Neutron Energy Spectrum

The measured foil responses were coupled with the response functions of each foil and the initial guess spectrum calculated using the MCNP model to determine the neutron energy spectrum. The three sets of data were input into UMG and the GRAVEL package produced the closest match to the measured responses based on the chi-squared (χ2) results produced from both the MAXED and GRAVEL spectra. The GRAVEL spectrum displayed anomalies that were corrected by creating a hybrid spectrum that included the intermediate region calculated by MCNP and the thermal and fast regions produced by the GRAVEL unfolding software. The hybrid spectrum was shown to best mimic measured results when comparing measured activities from the foils and calculated activities from the MCNP and GRAVEL spectra [26]. The neutron energy spectrum determined at the image plane in the ERS can be seen in Figure 6 as well as tabulated values for specific energy bins which are displayed in Table 9 [26].
The thermal equivalent neutron flux measured using the average thermal cross-section of gold is 9.61 × 10⁶ n/cm2/s. However, this neutron beam is not solely a thermal beam, and detailed analysis of the energy spectrum shows that only 3.53 × 10⁶ n/cm2/s is for energies below 0.5 eV. This apparent discrepancy is only possible for neutron beams with most of the neutron flux with energies >0.5 eV and very low cadmium ratios, which is indeed the case with NRAD’s ERS neutron beam. The epithermal neutron flux (0.5 eV to 100 keV) is more than double the thermal flux, and the fast neutron flux (>100 keV) is an order of magnitude greater than the thermal flux. The total neutron flux of NRAD’s ERS neutron beam is 7.06 × 10⁷ n/cm2/s.

4. Summary and Conclusions

The neutron radiography capabilities at NRAD are unique and in high demand. Used nuclear fuel is a difficult sample for neutron imaging due to the density of the material and the high doses of gamma and neutron radiation being emitted. With the recent restart of the Transient Test Reactor (TREAT) at the Idaho National Laboratory [11,28], there will be an increased need for the abilities of the NRAD facility. It is essential that the neutron beams of the ERS and NRS are characterized to provide sufficient data to users of the facilities. The following characteristics were measured: Neutron flux, neutron beam uniformity, the cadmium ratio, image quality of the facility, and the neutron energy spectrum.
The thermal equivalent neutron flux at the in the ERS was measured using an array of 21 gold foils spread across the entire area of the image plane and the published value for gold’s thermal neutron cross-section. The thermal equivalent neutron flux was determined to be 9.61 × 10⁶ ± 2.47 × 10⁵ n/cm2/s, which is 58% higher than the previous characterization performed in 2015. The increase in flux is due to the banking rods allowing more neutrons to make it to the image plane and not be absorbed by the material in the control rods, thereby shifting the neutron flux of the reactor closer to the source of the neutron beam.
The beam uniformity was measured and demonstrated little variation across the image plane, with a peak-to-average ratio of 1.031. The cadmium ratio using the gold foils was 2.05 ± 2.9%. The cadmium ratio indicated that the ERS neutron beam has a large epithermal and fast neutron component which is highly desired for nuclear fuel imaging capabilities. The image quality of the ERS was also measured using beam purity and sensitivity indicators. The facility was determined to fall into Category I which is the highest rank a neutron imaging station can have according to ASTM standards.
The neutron energy spectrum was calculated from the measured foil responses, the foil response functions and the initial spectrum at the ERS image plane. These three sets of data were used in the UMG software to unfold an energy spectrum. The final energy spectrum was created using the output from UMG and the out from MCNP and is referred to as the hybrid spectrum based on the sections taken from two other models. The hybrid spectrum was implemented back into the MCNP model of the ERS and will assist in future simulation and modeling efforts at NRAD. Detailed analysis of the energy spectrum shows that the neutron beam is far from thermal, with high epithermal and fast neutron fluxes, giving a total neutron flux of 7.06 × 10⁷ n/cm2/s.

Author Contributions

Conceptualization, S.H.G., A.E.C. and C.L.P.; Data curation, S.H.G.; Formal analysis, S.H.G. and A.E.C.; Funding acquisition, A.E.C.; Investigation, S.H.G.; Methodology, S.H.G., A.E.C., G.C.P. and C.L.P.; Project administration, A.E.C. and C.L.P.; Resources, A.E.C. and A.T.S.; Supervision, A.E.C., G.C.P., A.T.S. and C.L.P.; Validation, S.H.G.; Writing—original draft, S.H.G.; Writing—review & editing, A.E.C., G.C.P., A.T.S. and C.L.P. All authors have read and agreed to the published version of the manuscript.

Funding

Work funded through the INL Laboratory Directed Research & Development (LDRD) Program under DOE Idaho Operations Office Contract DE-AC07-05ID14517. LDRD Project ID# 16-070.

Data Availability Statement

The data presented in this study are available on request from the corresponding author.

Acknowledgments

Work funded through the INL Laboratory Directed Research & Development (LDRD) Program under DOE Idaho Operations Office Contract DE-AC07-05ID14517. LDRD Project ID# 16-070.

Conflicts of Interest

The authors declare no conflict of interest.

References

  1. Bess, J.D.; Briggs, J.B.; Lell, R.M. Neutron Radiography (NRAD) Reactor 64-Element Core Upgrade; Idaho National Laboratory: Idaho Falls, ID, USA, 2014. [Google Scholar]
  2. Craft, A.E.; Wachs, D.M.; Okuniewski, M.A.; Chichester, D.L.; Williams, W.J.; Papaionannou, G.C.; Smolinski, A.T. Neutron radiography of irradiated nuclear fuel at Idaho National Laboratory. Phys. Proc. 2015, 69, 483–490. [Google Scholar] [CrossRef] [Green Version]
  3. Craft, A.E.; Papaioannou, G.C.; Chichester, D.L.; Williams, W.J. Conversion from film to image plates for transfer method neutron radiography of nuclear fuel. Phys. Proc. 2017, 88, 81–88. [Google Scholar] [CrossRef]
  4. Papaioannou, G.C.; Craft, A.E.; Ruddell, M.A. Conversion from film based transfer method neutron radiography to computed radiography for post irradiation examination of nuclear fuels. Mat. Res. Proc. 2020, 15, 136–141. [Google Scholar]
  5. Tremsin, A.S.; Craft, A.E.; Papaioannou, G.C.; Smolinski, A.T.; Boulton, N.M.; Ruddell, M.A.; Littell, B.J.; Riley, K.D. On the possibility to investigate irradiated fuel pins non-destructively by digital neutron radiography with a neutron-sensitive microchannel plate detector with Timepix readout. Nucl. Inst. Meth. A 2019, 927, 109–118. [Google Scholar] [CrossRef]
  6. Craft, A.; Schillinger, B.; Chuirazzi, W.; Papaioannou, G.; Smolinski, A.; Boulton, N. First neutron computed tomography with digital neutron imaging systems in a high-radiation environment at the 250 kW Neutron Radiography Reactor at Idaho National Laboratory. Mat. Res. Proc. 2020, 15, 42–47. [Google Scholar]
  7. Imel, G.R.; Urbatsch, T. Beam characterization at the Neutron Radiography Facility (NRAD). In Proceedings of the Fourth World Conference on Neutron Radiography, San Francisco, CA, USA, 10–16 May 1992; pp. 673–680. [Google Scholar]
  8. Morgan, S.W.; King, J.C.; Pope, C.L. Beam characterization at the Neutron Radiography Reactor. Nucl. Eng. Des. 2013, 265, 639–653. [Google Scholar] [CrossRef] [Green Version]
  9. Craft, A.E.; Hilton, B.A.; Papaioannou, G.C. Characterization of a neutron beam following reconfiguration of the Neutron Radiography Reactor (NRAD) core and addition of new fuel elements. Nucl. Eng. Technol. 2016, 48, 200–210. [Google Scholar] [CrossRef] [Green Version]
  10. Amsil, H.; Jalil, A.; Kabach, O.; Chahidi, H.; Bounouira, H.; Elyounoussi, C.; Chetaine, A. Neutron beam characterization for the Moroccan TRIGA Mark II reactor. J. Radioanal. Nucl. Chem. 2021, 327, 1063–1072. [Google Scholar] [CrossRef]
  11. Jensen, S.R.; Craft, A.E.; Papaioannou, G.C.; Empie, W.W.; Ward, B.R.; Batt, L.A. Restart of the transient reactor test (TREAT) facility neutron radiography program. Nucl. Technol. 2019, 205, 1325–1335. [Google Scholar] [CrossRef]
  12. Baum, E.M.; Ernesti, M.C.; Knox, H.D.; Miller, T.R.; Watson, A.M. Nuclides and Isotopes: Chart of the Nuclides; Bechtel Marine Propulsion Corporation: Niskayuna, NY, USA, 2009. [Google Scholar]
  13. Larson, N.R.; Storms, B.J. Interviewees, Email Correspondence. [Interview]. 19 September 2017. [Google Scholar]
  14. Lamarsh, J.R.; Baratta, A.J. Introduction to Nuclear Engineering, 4th ed.; Pearson: Hoboken, NJ, USA, 2018. [Google Scholar]
  15. Flemming, R. Neutron self-shielding factors for simple geometries. Appl. Rad. Iso. 1982, 33, 1263–1268. [Google Scholar] [CrossRef]
  16. Knoll, G.F. Radiation Detection and Measurement; John Wiley & Sons, Inc.: Hoboken, NJ, USA, 2010. [Google Scholar]
  17. Kobayashi, H.; Plaut, R.H. Beam formation and characterization for neutron radiography. Nondest. Test. Eval. 2001, 16, 121–129. [Google Scholar] [CrossRef]
  18. ASTM International. E262-17 Standard Test Method for Determining Thermal Neutron Reaction Rates and Thermal Neutron Fluence Rates by Radioactivation Techniques; ASTM International: West Conshohocken, PA, USA, 2008. [Google Scholar]
  19. Nuclear Data Center at KAERI. Korea Atomic Energy Research Institute. Available online: http://atom.kaeri.re.kr/ (accessed on 14 April 2021).
  20. ASTM International. E545-19 Standard Test Method for Determining Image Quality in Direct Thermal Neutron Radiographic Examination; ASTM International: West Conshohocken, PA, USA, 2010. [Google Scholar]
  21. Horkely, M.D. Neutron Spectral Measurements and Calculation Comparisons of Idaho State University ANG-201 Reactor; Idaho State University: Pocatello, ID, USA, 2013. [Google Scholar]
  22. Nimmagadda, J.K. Analysis of Fast Reactor Filter Spectra in the Advanced Test Reactor and Neutron Spectral Measurement at Idaho Accelerator Center; Idaho State University: Pocatello, ID, USA, 2012. [Google Scholar]
  23. Aghara, S.K. Characterization and quantification of an in-core neutron irradiation facility at TRIGA II research reactor. Nucl. Inst. Meth. B 2006, 248, 181–190. [Google Scholar] [CrossRef]
  24. Permana, S.; Ilham, Y. Characterization of neutron and gamma beams at the tangential beam port of TRIGA 2000 reactor using Monte Carlo methods. J. Phys. 2021, 1772, 012024. [Google Scholar]
  25. Jafari, H.; Choopan Dastjerdi, M.H.; Rajabi Moghadam, S. A Monte Carlo evaluation of neutron images quality in a research reactor based neutron radiography facility. Nucl. Inst. Meth. A 2020, 976, 164258. [Google Scholar] [CrossRef]
  26. Giegel, S.H.; Pope, C.L.; Craft, A.E. Determination of the neutron energy spectrum of a radial neutron beam at a TRIGA reactor. Nucl. Inst. Meth. B 2019, 454, 28–39. [Google Scholar] [CrossRef]
  27. How Does a Densitometer Work? US Ink, Sun Chemical Corporation. Available online: http://www.sunchemical.com/product/technical-library/ (accessed on 29 September 2017).
  28. Pope, C.L.; Jensen, B.; Gerstner, D.M.; Parry, J.R. Transient Reactor Test (TREAT) facility design and experiment capability. Nucl. Technol. 2019, 205, 1378–1386. [Google Scholar] [CrossRef]
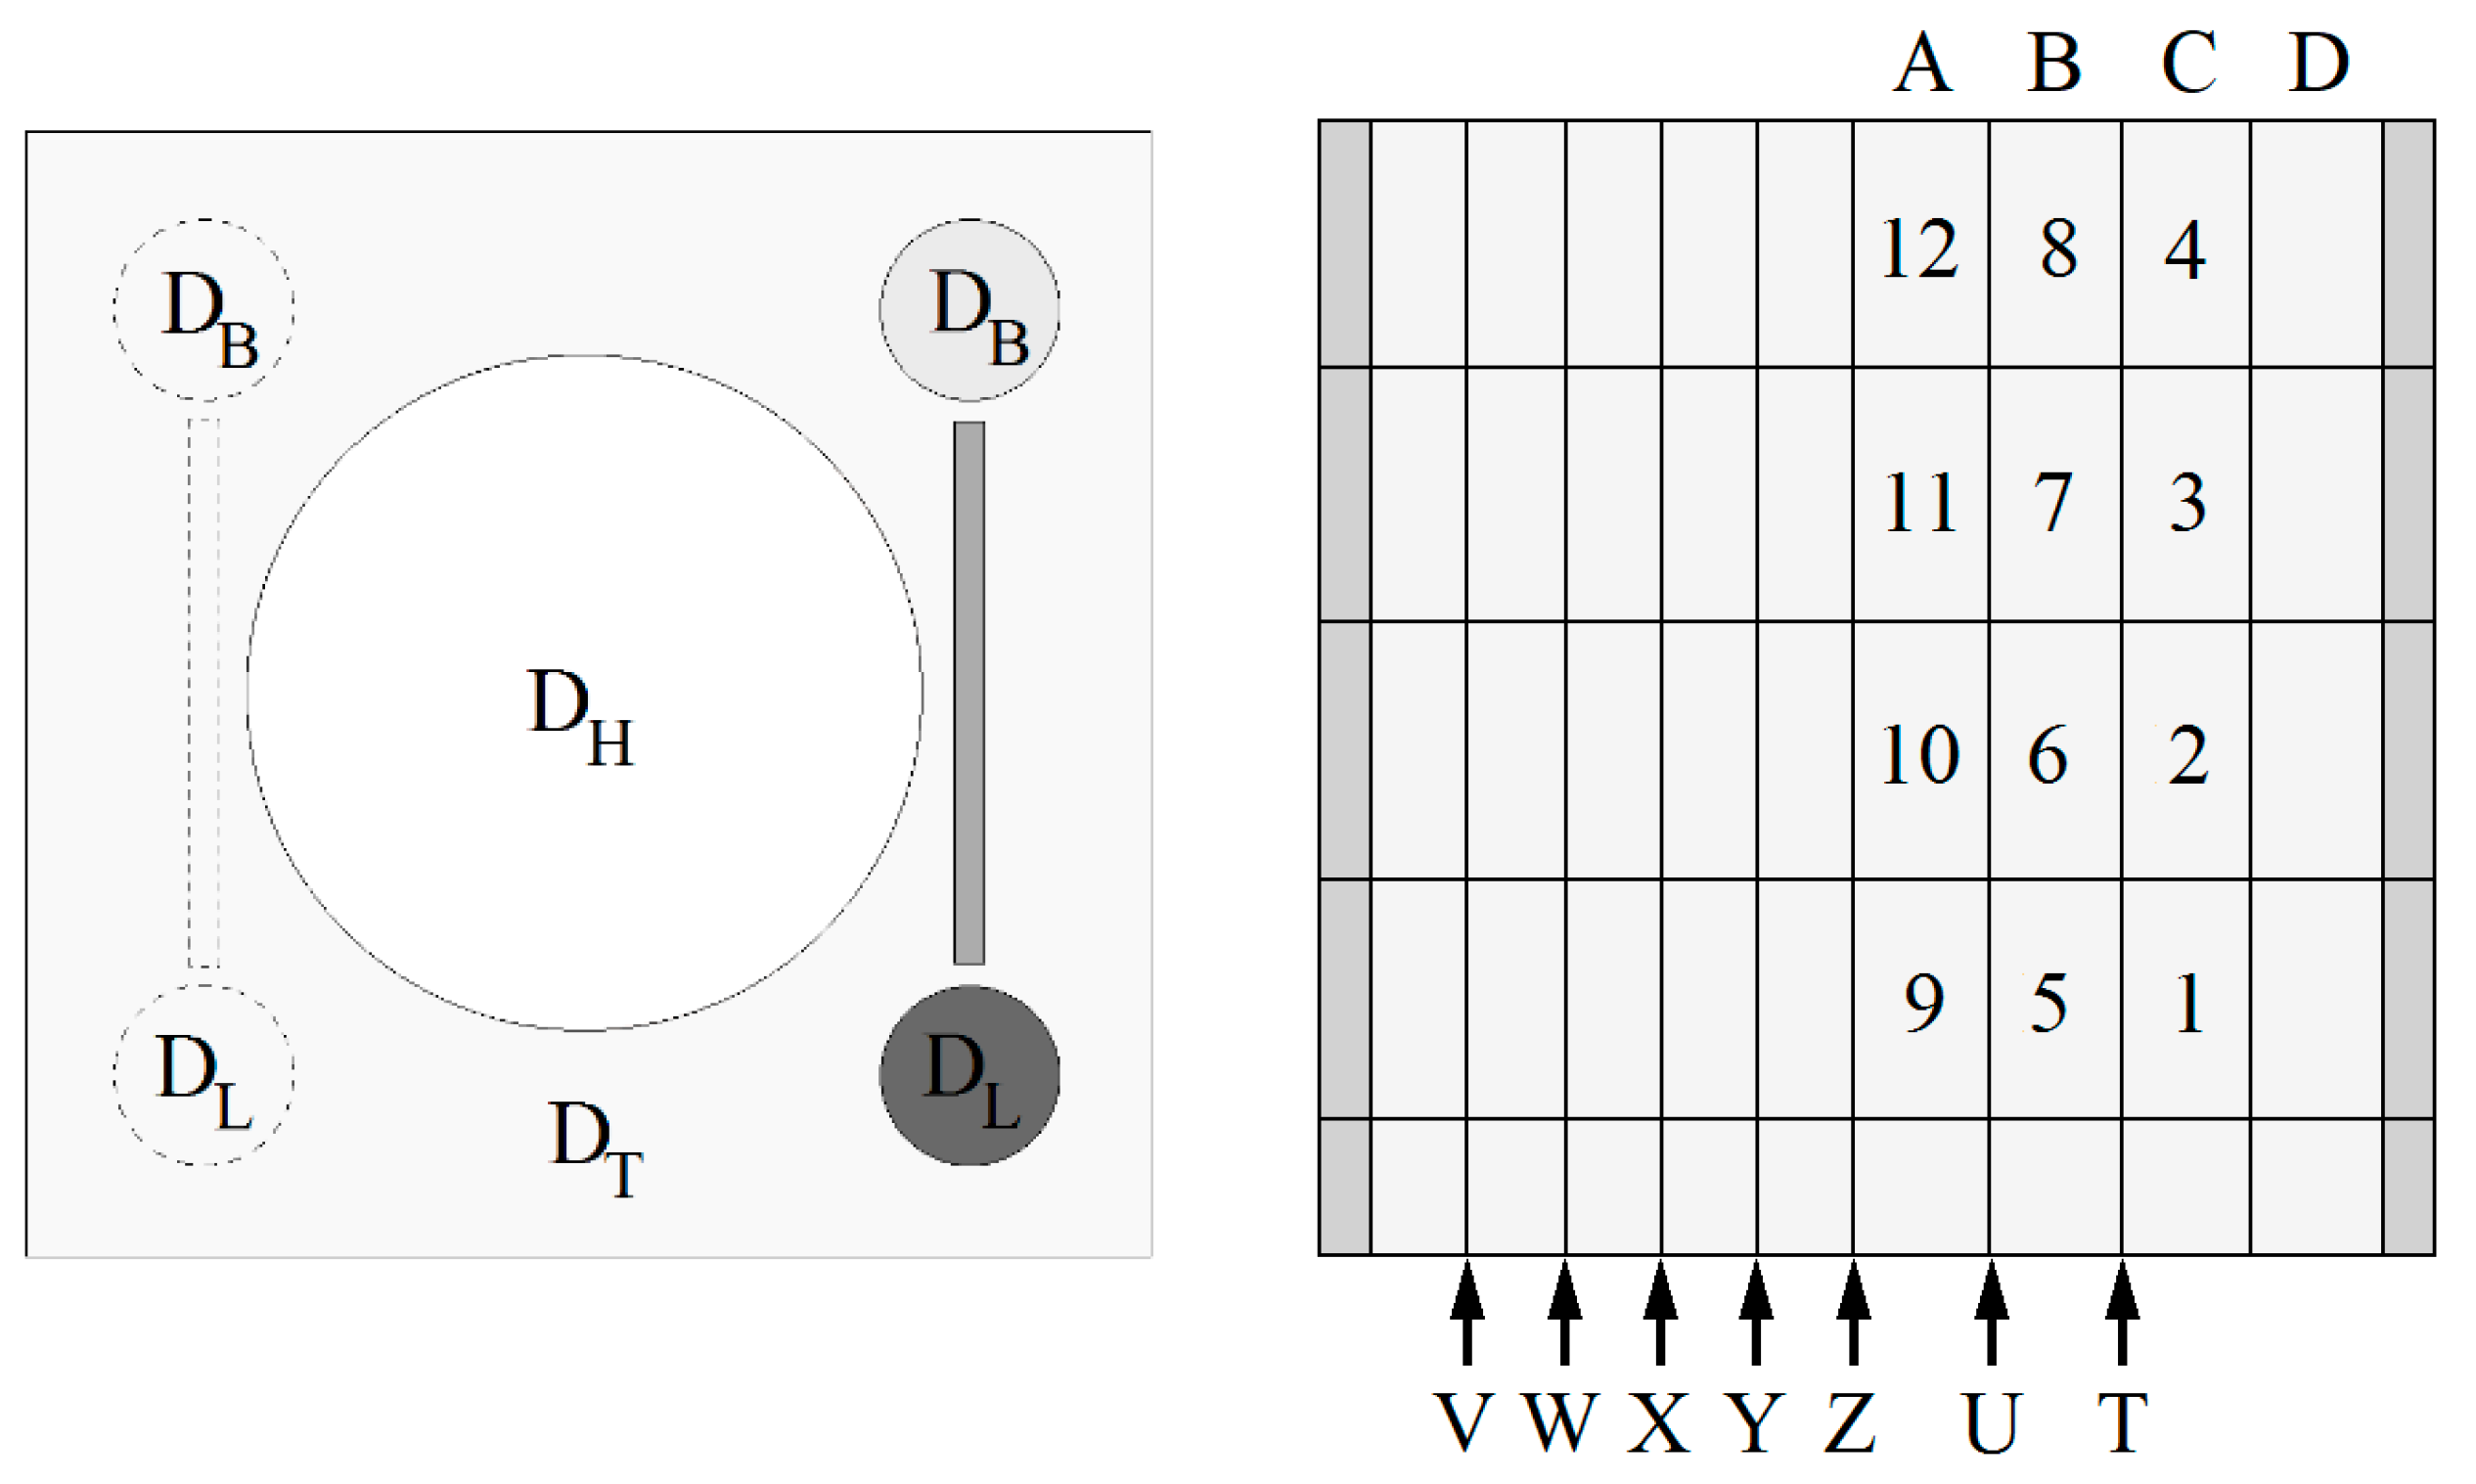
Figure 1. Schematic (left) and picture (right) of the array of 21 gold foils.
Qubs 05 00008 g001
Figure 2. Microscopic absorption cross-section of 113Cd and 197Au
Qubs 05 00008 g002
Figure 3. Schematic of the (left) beam purity indicator and (right) sensitivity indicator showing shims A–D, gaps T–Z and holes 1–12.
Qubs 05 00008 g003
Figure 4. Neutron flux as a function of position on the image plane.
Qubs 05 00008 g004
Figure 5. Neutron radiographs of IQIs using (left) an indium foil (epithermal) radiograph and (right) a dysprosium foil (thermal) radiograph.
Qubs 05 00008 g005
Figure 6. Neutron energy spectrum at the image plane of the ERS facility (energy-normalized).
Qubs 05 00008 g006
Table 1. Definitions of D parameters [20].
DBFilm densities measured through the images of the boron nitride disks
DLFilm densities measured through the images of the lead disks
DHFilm density measured at the center of the hole in the BPI
DTFilm density measured through the image of the polytetrafluorethylene
ΔDLDifference between the DL values
ΔDBDifference between the DB values
Table 2. H and G values taken from the sensitivity indicator (SI) for shims and gaps shown in Figure 3 [20].
Value of H.ShimValue of GGap
1C1T
2C2U
3C3V
4C4W
5B5X
6B6Y
7B7Z
8B
9A
10A
11A
12A
Table 3. ASTM facility categories based on image quality parameters [20].
CategoryNCHGSγP
I6566533
II6066644
III5555755
IV5045866
V4535977
Table 4. Uncertainties in measured parameters used to calculate neutron flux.
Parameter(±)(%)
Foil Weight (g)0.00050.42%
Activity (dps) *--1.5%
Time (s)0.0010.10%
Placement (in)0.06251.04%
* Error reported at 2σ.
Table 5. Neutron flux measurements at the image plane (ERS).
PositionTrial #1Trial #2Average
Activity
(dps)
Flux
(n/cm2/s)
Error
(2σ)
Activity
(dps)
Flux
(n/cm2/s)
Error
(2σ)
Flux
(n/cm2/s)
11.795 × 1049.591 × 1062.6%1.828 × 1049.753 × 1062.6%9.672 × 10⁶
21.765 × 1049.410 × 1062.6%1.799 × 1049.635 × 1062.6%9.522 × 10⁶
31.743 × 1049.479 × 1062.6%1.836 × 1049.769 × 1062.6%9.624 × 10⁶
41.769 × 1049.604 × 1062.6%1.821 × 1049.533 × 1062.6%9.568 × 10⁶
51.813 × 1049.722 × 1062.6%1.865 × 1049.813 × 1062.6%9.768 × 10⁶
61.736 × 1049.399 × 1062.6%1.780 × 1049.512 × 1062.6%9.456 × 10⁶
71.788 × 1049.713 × 1062.6%1.839 × 1049.591 × 1062.6%9.652 × 10⁶
81.806 × 1049.715 × 1062.6%1.832 × 1049.630 × 1062.6%9.672 × 10⁶
91.799 × 1049.691 × 1062.6%1.832 × 1049.661 × 1062.6%9.676 × 10⁶
101.784 × 1049.692 × 1062.6%1.865 × 1049.845 × 1062.6%9.769 × 10⁶
111.802 × 1049.695 × 1062.7%1.843 × 1049.480 × 1062.7%9.588 × 10⁶
121.780 × 1049.672 × 1062.6%1.821 × 1049.381 × 1062.6%9.527 × 10⁶
131.784 × 1049.668 × 1062.6%1.828 × 1049.434 × 1062.6%9.551 × 10⁶
141.839 × 1049.902 × 1062.5%1.832 × 1049.552 × 1062.5%9.727 × 10⁶
151.806 × 1049.838 × 1062.6%1.906 × 1049.827 × 1062.6%9.832 × 10⁶
161.780 × 1049.713 × 1062.6%1.799 × 1049.333 × 1062.6%9.523 × 10⁶
171.765 × 1049.560 × 1062.6%1.865 × 1049.656 × 1062.6%9.608 × 10⁶
181.780 × 1049.664 × 1062.6%1.802 × 1049.421 × 1062.6%9.542 × 10⁶
191.758 × 1049.504 × 1062.6%1.765 × 1049.138 × 1062.6%9.321 × 10⁶
201.795 × 1049.568 × 1062.6%1.839 × 1049.453 × 1062.6%9.511 × 10⁶
211.825 × 1049.460 × 1062.6%1.791 × 1049.857 × 1062.6%9.659 × 10⁶
Table 6. Cadmium covered gold foil activity measurements (ERS).
Trial #1Trial #2Averaged
PositionActivity
(dps)
Error
(2σ)
Activity
(dps)
Error
(2σ)
Cd
Ratio
Error (2σ)
18.96 × 1032.9%8.33 × 1032.9%2.102.9%
28.96 × 1032.9%8.48 × 1032.9%2.042.9%
38.73 × 1032.9%8.44 × 1032.9%2.082.9%
48.62 × 1032.9%8.29 × 1032.9%2.122.9%
58.81 × 1032.9%8.55 × 1032.9%2.122.9%
68.92 × 1032.9%8.62 × 1032.9%2.002.9%
78.88 × 1032.9%8.33 × 1032.9%2.112.9%
89.44 × 1032.9%8.48 × 1032.9%2.032.9%
91.05 × 1042.9%8.62 × 1032.9%1.902.9%
108.92 × 1032.9%8.62 × 1032.9%2.082.9%
118.62 × 1032.9%8.81 × 1032.9%2.092.9%
129.18 × 1032.9%8.66 × 1032.9%2.022.9%
138.73 × 1032.9%8.48 × 1032.9%2.102.9%
148.92 × 1032.9%8.44 × 1032.9%2.122.9%
151.01 × 1042.9%8.62 × 1032.9%1.982.9%
168.66 × 1032.9%8.77 × 1032.9%2.052.9%
179.25 × 1032.9%8.85 × 1032.9%2.012.9%
188.92 × 1032.9%8.51 × 1032.9%2.062.9%
199.10 × 1032.9%8.62 × 1032.9%1.992.9%
209.29 × 1032.9%8.59 × 1032.9%2.032.9%
218.92 × 1032.9%8.70 × 1032.9%2.052.9%
Table 7. Beam purity indicator optical film densities.
BPI Parameters
DB0.470.44
DL2.132.23
DH2.77
DT2.19
ΔDL0.1
ΔDB0.03
Table 8. Image quality indicator (IQI) measured values compared to a Category I facility.
ParameterERSCategory I
NC79≥65
S1≤5
PNA≤3
γNA≤3
G7≥6
H7≥6
Table 9. Tabulated neutron flux (n/cm2/s) values from the hybrid spectrum.
Thermal Region
(0–0.5 eV)
Intermediate Region
(0.5 eV–100 keV)
Fast Region
(100 keV–10 MeV)
Total
3.53 × 1068.14 × 1065.89 × 1077.06 × 107
Publisher’s Note: MDPI stays neutral with regard to jurisdictional claims in published maps and institutional affiliations.

