Production of Fuels and Chemicals from a CO2/H2 Mixture


Institute for Development of Energy for African Sustainability (IDEAS), University of South Africa, cnr Christiaan de Wet and Pioneer Road, Florida, Private Bag X6 Florida 1710, South Africa
*
Author to whom correspondence should be addressed.
Reactions 2020, 1(2), 130-146; https://0-doi-org.brum.beds.ac.uk/10.3390/reactions1020011
Submission received: 8 October 2020
/
Revised: 2 November 2020
/
Accepted: 18 November 2020
/
Published: 19 November 2020
(This article belongs to the Special Issue Catalytic Conversion of Carbonaceous Materials to Fuels and Chemicals)
Abstract
:In order to explore co-production alternatives, a once-through process for CO2 hydrogenation to chemicals and liquid fuels was investigated experimentally. In this approach, two different catalysts were considered; the first was a Cu-based catalyst that hydrogenates CO2 to methanol and CO and the second a Fisher–Tropsch (FT) Co-based catalyst. The two catalysts were loaded into different reactors and were initially operated separately. The experimental results show that: (1) the Cu catalyst was very active in both the methanol synthesis and reverse-water gas shift (R-WGS) reactions and these two reactions were restricted by thermodynamic equilibrium; this was also supported by an Aspen plus simulation of an (equilibrium) Gibbs reactor. The Aspen simulation results also indicated that the reactor can be operated adiabatically under certain conditions, given that the methanol reaction is exothermic and R-WGS is endothermic. (2) the FT catalyst produced mainly CH4 and short chain saturated hydrocarbons when the feed was CO2/H2. When the two reactors were coupled in series and the presence of CO in the tail gas from the first reactor (loaded with Cu catalyst) significantly improves the FT product selectivity toward higher carbon hydrocarbons in the second reactor compared to the standalone FT reactor with only CO2/H2 in the feed.
1. Introduction
Utilization of CO2 as a raw material for the synthesis of valuable chemicals and fuels is of interest not only as carbon source but also as a way of mitigating its environmental impact as a greenhouse gas [1,2,3]. Methanol production is of interest due to its large global market as a bulk chemical product and as a key component in C1 chemistry, in addition to its low hydrogen requirement during production [4,5,6,7,8]. Methanol synthesis from CO2 hydrogenation occurs together with the reverse water gas shift (R-WGS) reaction and is subjected to three major limitations [1,9,10,11]: (1) the thermodynamic equilibrium limits the process to low conversion per pass and, therefore, a large recycle of unconverted gas would be needed to achieve a reasonable overall conversion. (2) A poor methanol selectivity due to the R-WGS reaction. (3) The reaction is also strongly exothermic and thus requires significant cooling duties. These limitations are largely responsible for the high investment and operating cost of methanol synthesis plants.
Various researchers have reported activity data, which clearly shows that CO2 readily hydrogenated to hydrocarbons over Fischer–Tropsch (FT) catalysts [12,13,14,15,16], which is also another promising way of producing chemicals and fuels from CO2. However, there is a high selectivity to CH4 and short chain hydrocarbons, which may not be commercially attractive. Fortunately, results from previous work [15] show that when even small amounts of CO are added to the feed, the product distribution changes to favor the production of higher hydrocarbons.
CO2 hydrogenation to methanol and hydrocarbon fuels over their respective appropriate catalysts has been shown to be feasible, but it comes with some important limitations and undesirable by-products. However, in their recent work, Sempuga and Yao [17] have demonstrated the potential benefits of co-production of chemicals by CO2 hydrogenation; the work looked at a number of CO2 hydrogenation processes and showed that all of them are potentially inefficient in conserving the chemical potential of hydrogen in their final respective products. Co-production of chemicals seemed to be the only way that can fully conserve the chemical potential of hydrogen and can minimize heat duty requirements, thereby potentially leading to lower capital and operating costs. One of the ways of doing this is to couple methanol synthesis with Fischer–Tropsch synthesis (FTS) in series, where CO2 and the byproduct, CO, from the R-WGS reaction occurring during methanol synthesis are converted to useful chemicals and transport fuels in downstream FT synthesis sections.
Furthermore, methanol, with its low price and high oxygen content, has been widely considered to be an additive in blended fuels; the addition of methanol could increase the heat of evaporation and reduce soot formation when the fuel is combusted [18,19]. Combining the reactions of CO2 methanol synthesis, WGS and FT could convert CO2 and H2 to both methanol and diesel fuels. As a consequence, these two groups of products could be blended together to produce an alternative fuel with good combustion characteristics and reduced production of particulates.
In order to explore these co-production alternatives, laboratory experiments were conducted where methanol and hydrocarbons were co-produced by using a configuration of reactors in series. CO2 hydrogenation over a copper-based catalyst (for methanol synthesis and WGS) and a cobalt based catalyst (for FT synthesis) under different reaction conditions were carried out in two plug flow reactors (PFR) which were configured in series. The catalysts activity and selectivity and product distribution were measured, analyzed and compared. Finally, a potentially optimized process for CO2 hydrogenation to produce methanol and hydrocarbon fuels is suggested based on simulation and experimental results.
2. Experimental Set Up
2.1. Catalyst Preparation
A commercial Cu-based catalyst from Imperial Chemical Industries (ICI), London, UK was used for the methanol synthesis experiments. The test results showed that the catalyst was active for both the R-WGS and methanol synthesis reactions.
A supported Co catalyst (10% Co/90% TiO2 by mass) was used for the FT CO2 hydrogenation experiments. The catalyst was prepared by impregnation of TiO2 (Degussa P25, Degussa Africa Ltd., Midrand, Gaudeng, South Africa) with the cobalt nitrate solution (Co(NO3)2·6H2O, Sigma-Aldrich, St. Louis, MO, USA). The procedure for the catalyst preparation is described in Yao et al. [15].
2.2. Experimental Setup and Procedure
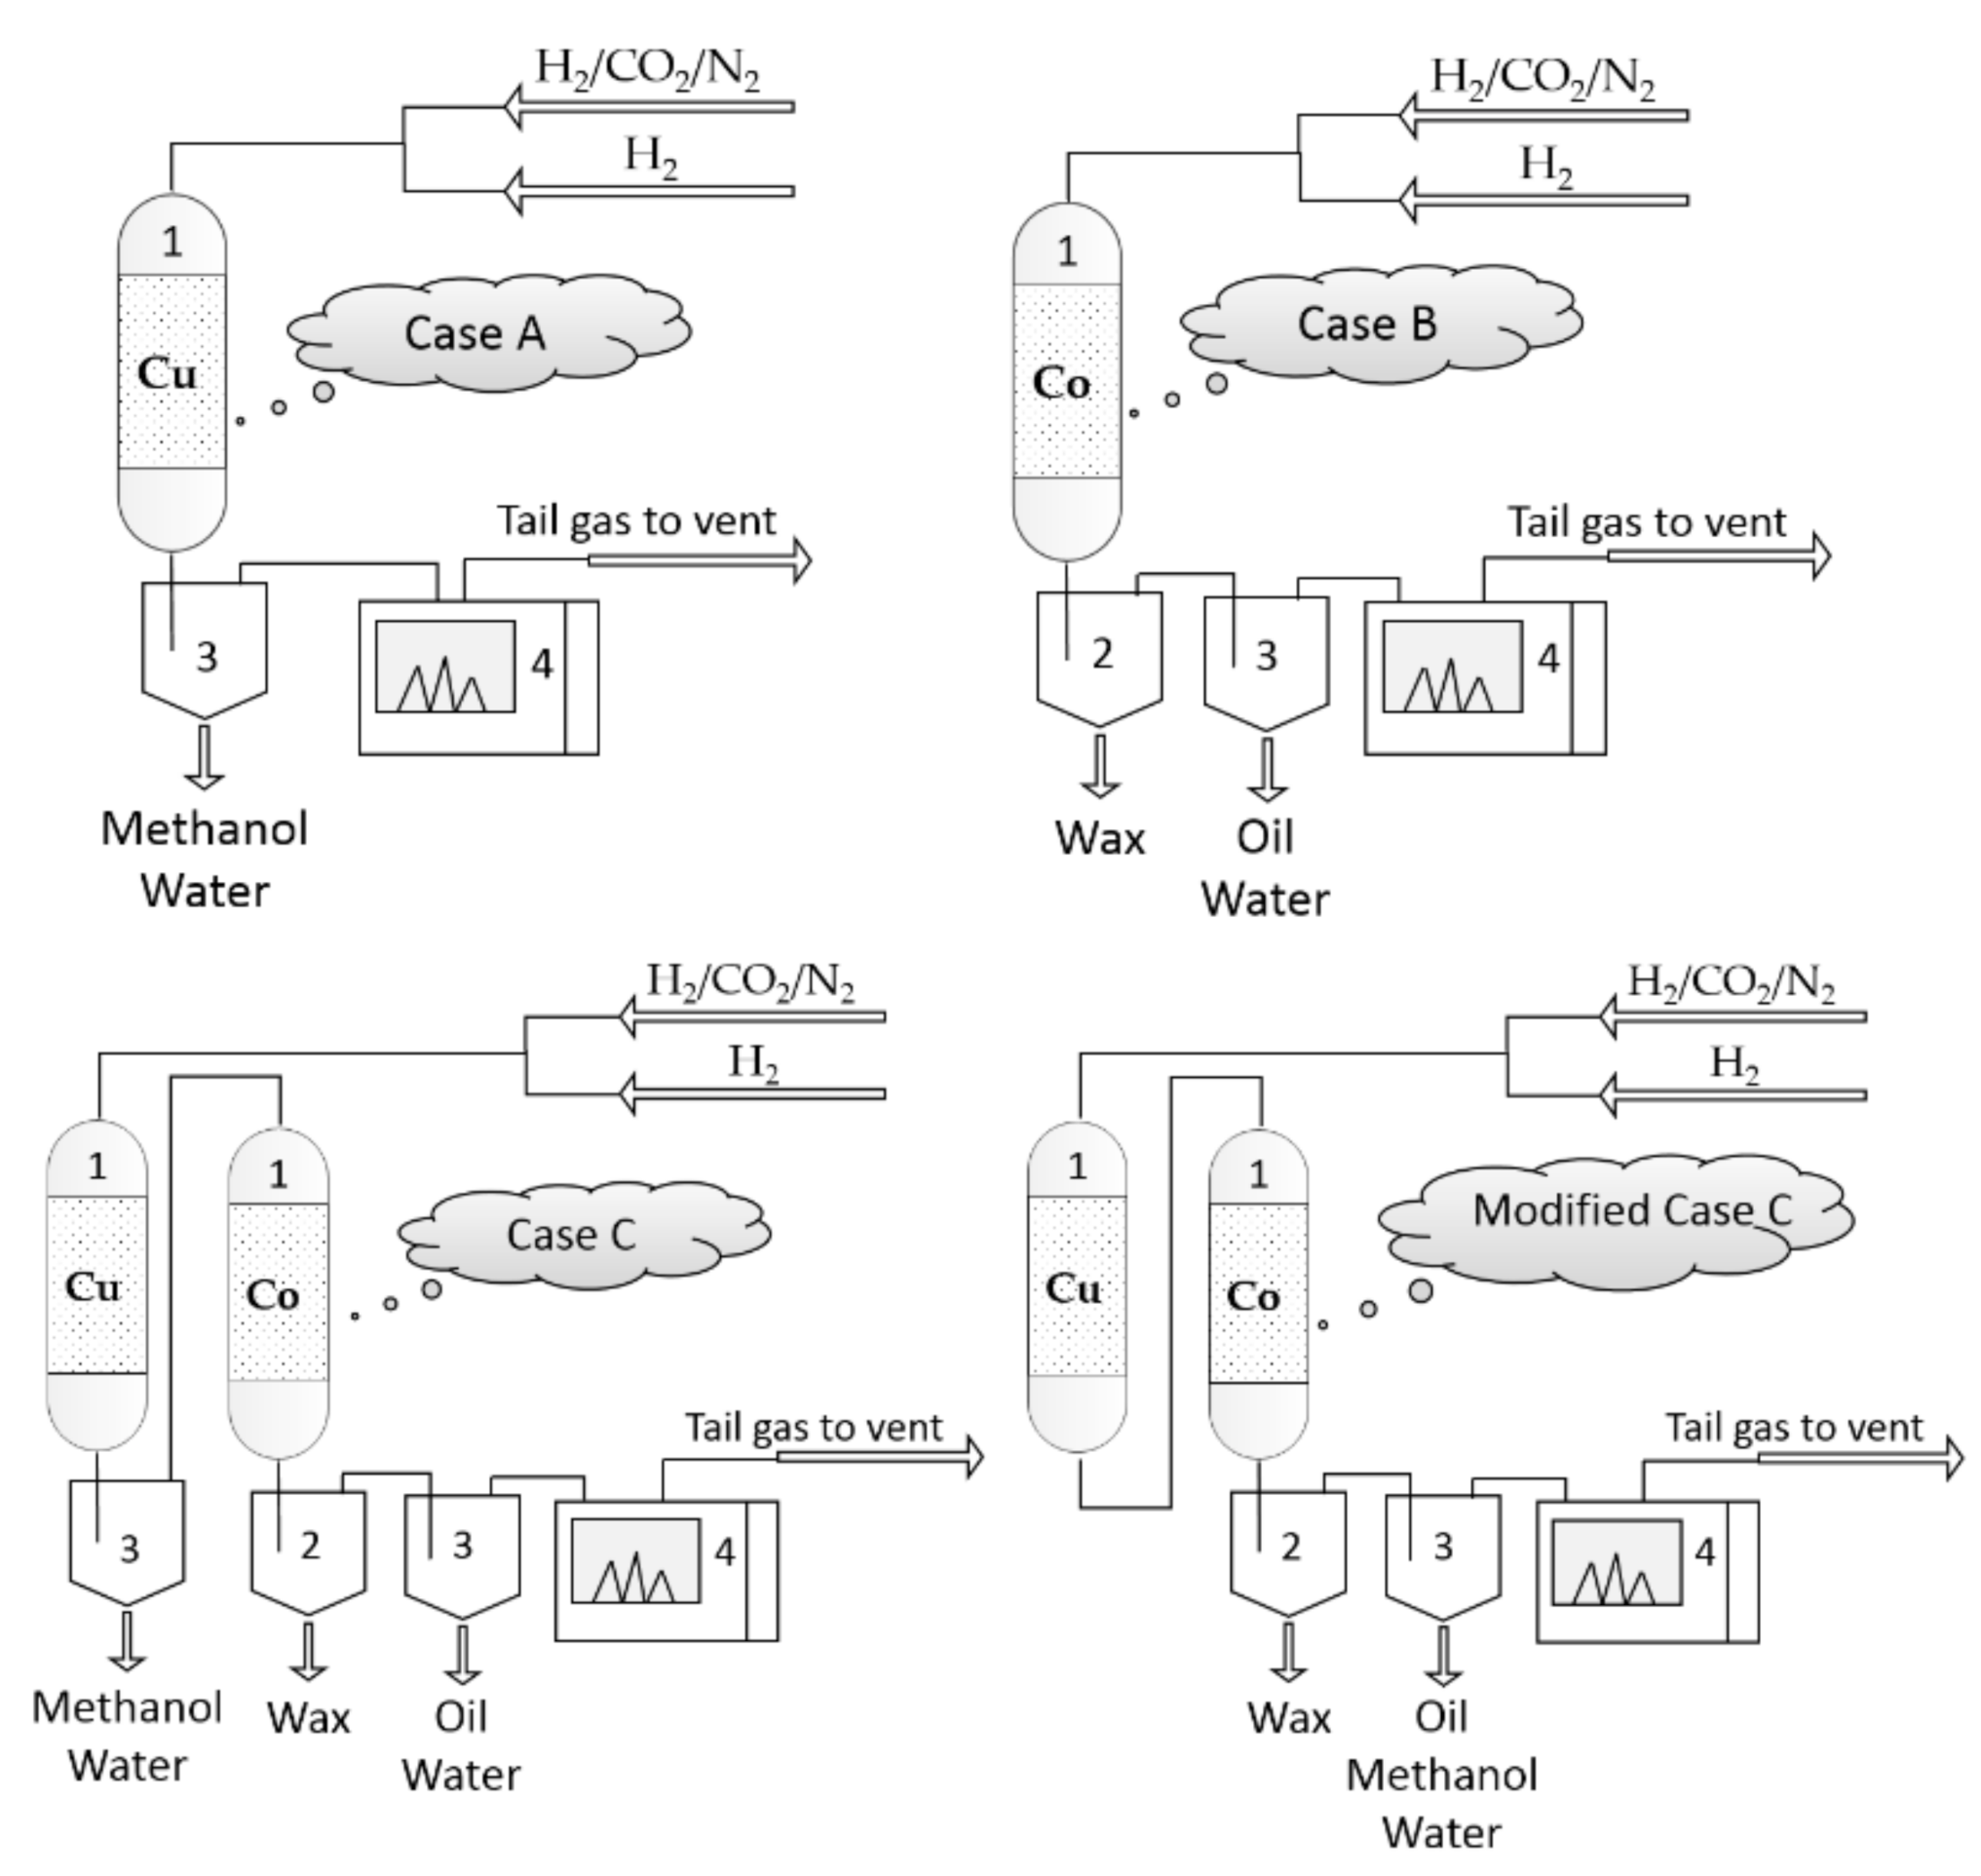
Three cases were investigated by using two plug flow reactors configured as shown in Figure 1: in Case A and Case B the reactors are set up to perform CO2 hydrogenation separately, one using a Cu-based catalyst (Cu-reactor) and the other using a Co-based catalyst (Co-reactor). In Case C, the Cu-reactor is connected in series to the Co-reactor. The gas exiting the Cu-reactor is fed to the Co-reactor after it is cooled, and the condensate knocked out. The detailed experimental set up and procedure for each case is described below.
- ➢ Case A: CO2 hydrogenation over a Cu-based catalyst
One gram of the Cu-based catalyst was loaded into the plug flow reactor. The reduction of the catalyst was done for 24 h at atmospheric pressure and at a temperature of 200 °C with H2 (99.999%) at a flowrate of 60 mL/min. Once the reduction was completed, the reactor was allowed to cool down to room temperature. Feed gas, of composition H2: 67.6%, CO2: 22.6% and N2 (as an internal standard for mass balance calculations) 9.8%, was then introduced into the reactor at a flow rate of 60 mL(NTP)/(min·gcat) (NTP stands for Normal Temperature and Pressure). The reactor was run at a pressure of 20 bar (gauge), and at temperatures ranging from 200 °C to 350 °C. The temperature at each set point was kept constant for 72 h during which the tail gas composition was measured frequently to ensure that the system reached steady state. The feed and reaction conditions for CO2 hydrogenation over the Cu-based catalyst are listed in Table 1.
- ➢ Case B: CO2 hydrogenation over a Co-based catalyst.
In the same way as in Case A, one gram of the Co/TiO2 catalyst was loaded into a plug flow reactor. The reduction of the catalyst was affected for 24 h at atmospheric pressure and at a temperature of 350 °C with H2 (99.999%) at a flowrate of 60 mL/min. Once the reduction was completed, the reactor was allowed to cool down to room temperature. Feed gas, of composition H2: 67.6%, CO2: 22.6% and N2 (as an internal standard for mass balance calculations) 9.8%, was then introduced into the reactor at a flow rate of 60 mL (NTP)/(min·gcat). The reactor was run at a pressure of 20 bar (gauge), and at a constant temperature of 200 °C for 72 h. The feed and reaction conditions for CO2 hydrogenation over the Co-based catalyst are given in Table 1.
- ➢ Case C: CO2 hydrogenation in a reactor loaded with Cu-based catalyst in series with a reactor loaded with Co-based catalyst.
The experiments in Case C were conducted with a Cu-reactor and a Co-reactor configured in series. Initially a trap was place in between the reactors to condense the methanol and water produced in the Cu-reactor. The tail gas after this condensation trap was introduced into the second reactor. The experimental program for each reactor was exactly the same as when they were run separately, that is: the Cu-catalyst was run at temperatures ranging between 200 °C and 350 °C at constant pressure and flowrate, and the temperature in the reactor was kept constant for 72 h, and the Co-reactor was kept at the same temperature and pressure (200 °C and 20 bar) for all runs. This is summarized in Table 1. For each of these runs, the products and un-reacted materials passed from the exit of the first reactor through the product trap which set at room temperature to condense the water and methanol. The uncondensed gases were fed to the second reactor (see Figure 1 Case C).
With the aim to simplify the process, a modified process named “Modified Case C” was used, in which the condensation trap was removed, so that all the products and unreacted reactants were fed to the Co-reactor (see Figure 1: Modified Case C). The same reaction conditions as those used in Case C were used, and the only difference was that the temperature range was between 200 °C and 260 °C.
2.3. Product Analysis
The tail gas was analyzed every 90 min using an online DANI gas chromatograph (GC) (DANI Analitica, Milan, Lombardy, Italy). The online GC was equipped with four columns and three detectors for the analysis of H2 (Molecular Sieve 5A column connected to a thermal conductivity detector (TCD)), N2, CO, CO2 (Porapack Q packed and molecular sieve 13X columns connected to a TCD) and gas phase hydrocarbon products (PoraPLot Q-HT column connected to a flame ionization detector (FID). The aqueous from the methanol synthesis reactor was collected in a cold trap (kept at room temperature). Two condensable product traps were used after the FTS reactor: a hot trap (kept at 150 °C) was used to collect the wax products and a cold trap (kept at room temperature) was used for the collection of liquid products. The condensed products (aqueous, wax and oil) from the condensable product traps were collected for further analysis using two off-line GCs.
3. Results
3.1. Case A: CO2 Hydrogenation Over a Cu-Based Catalyst
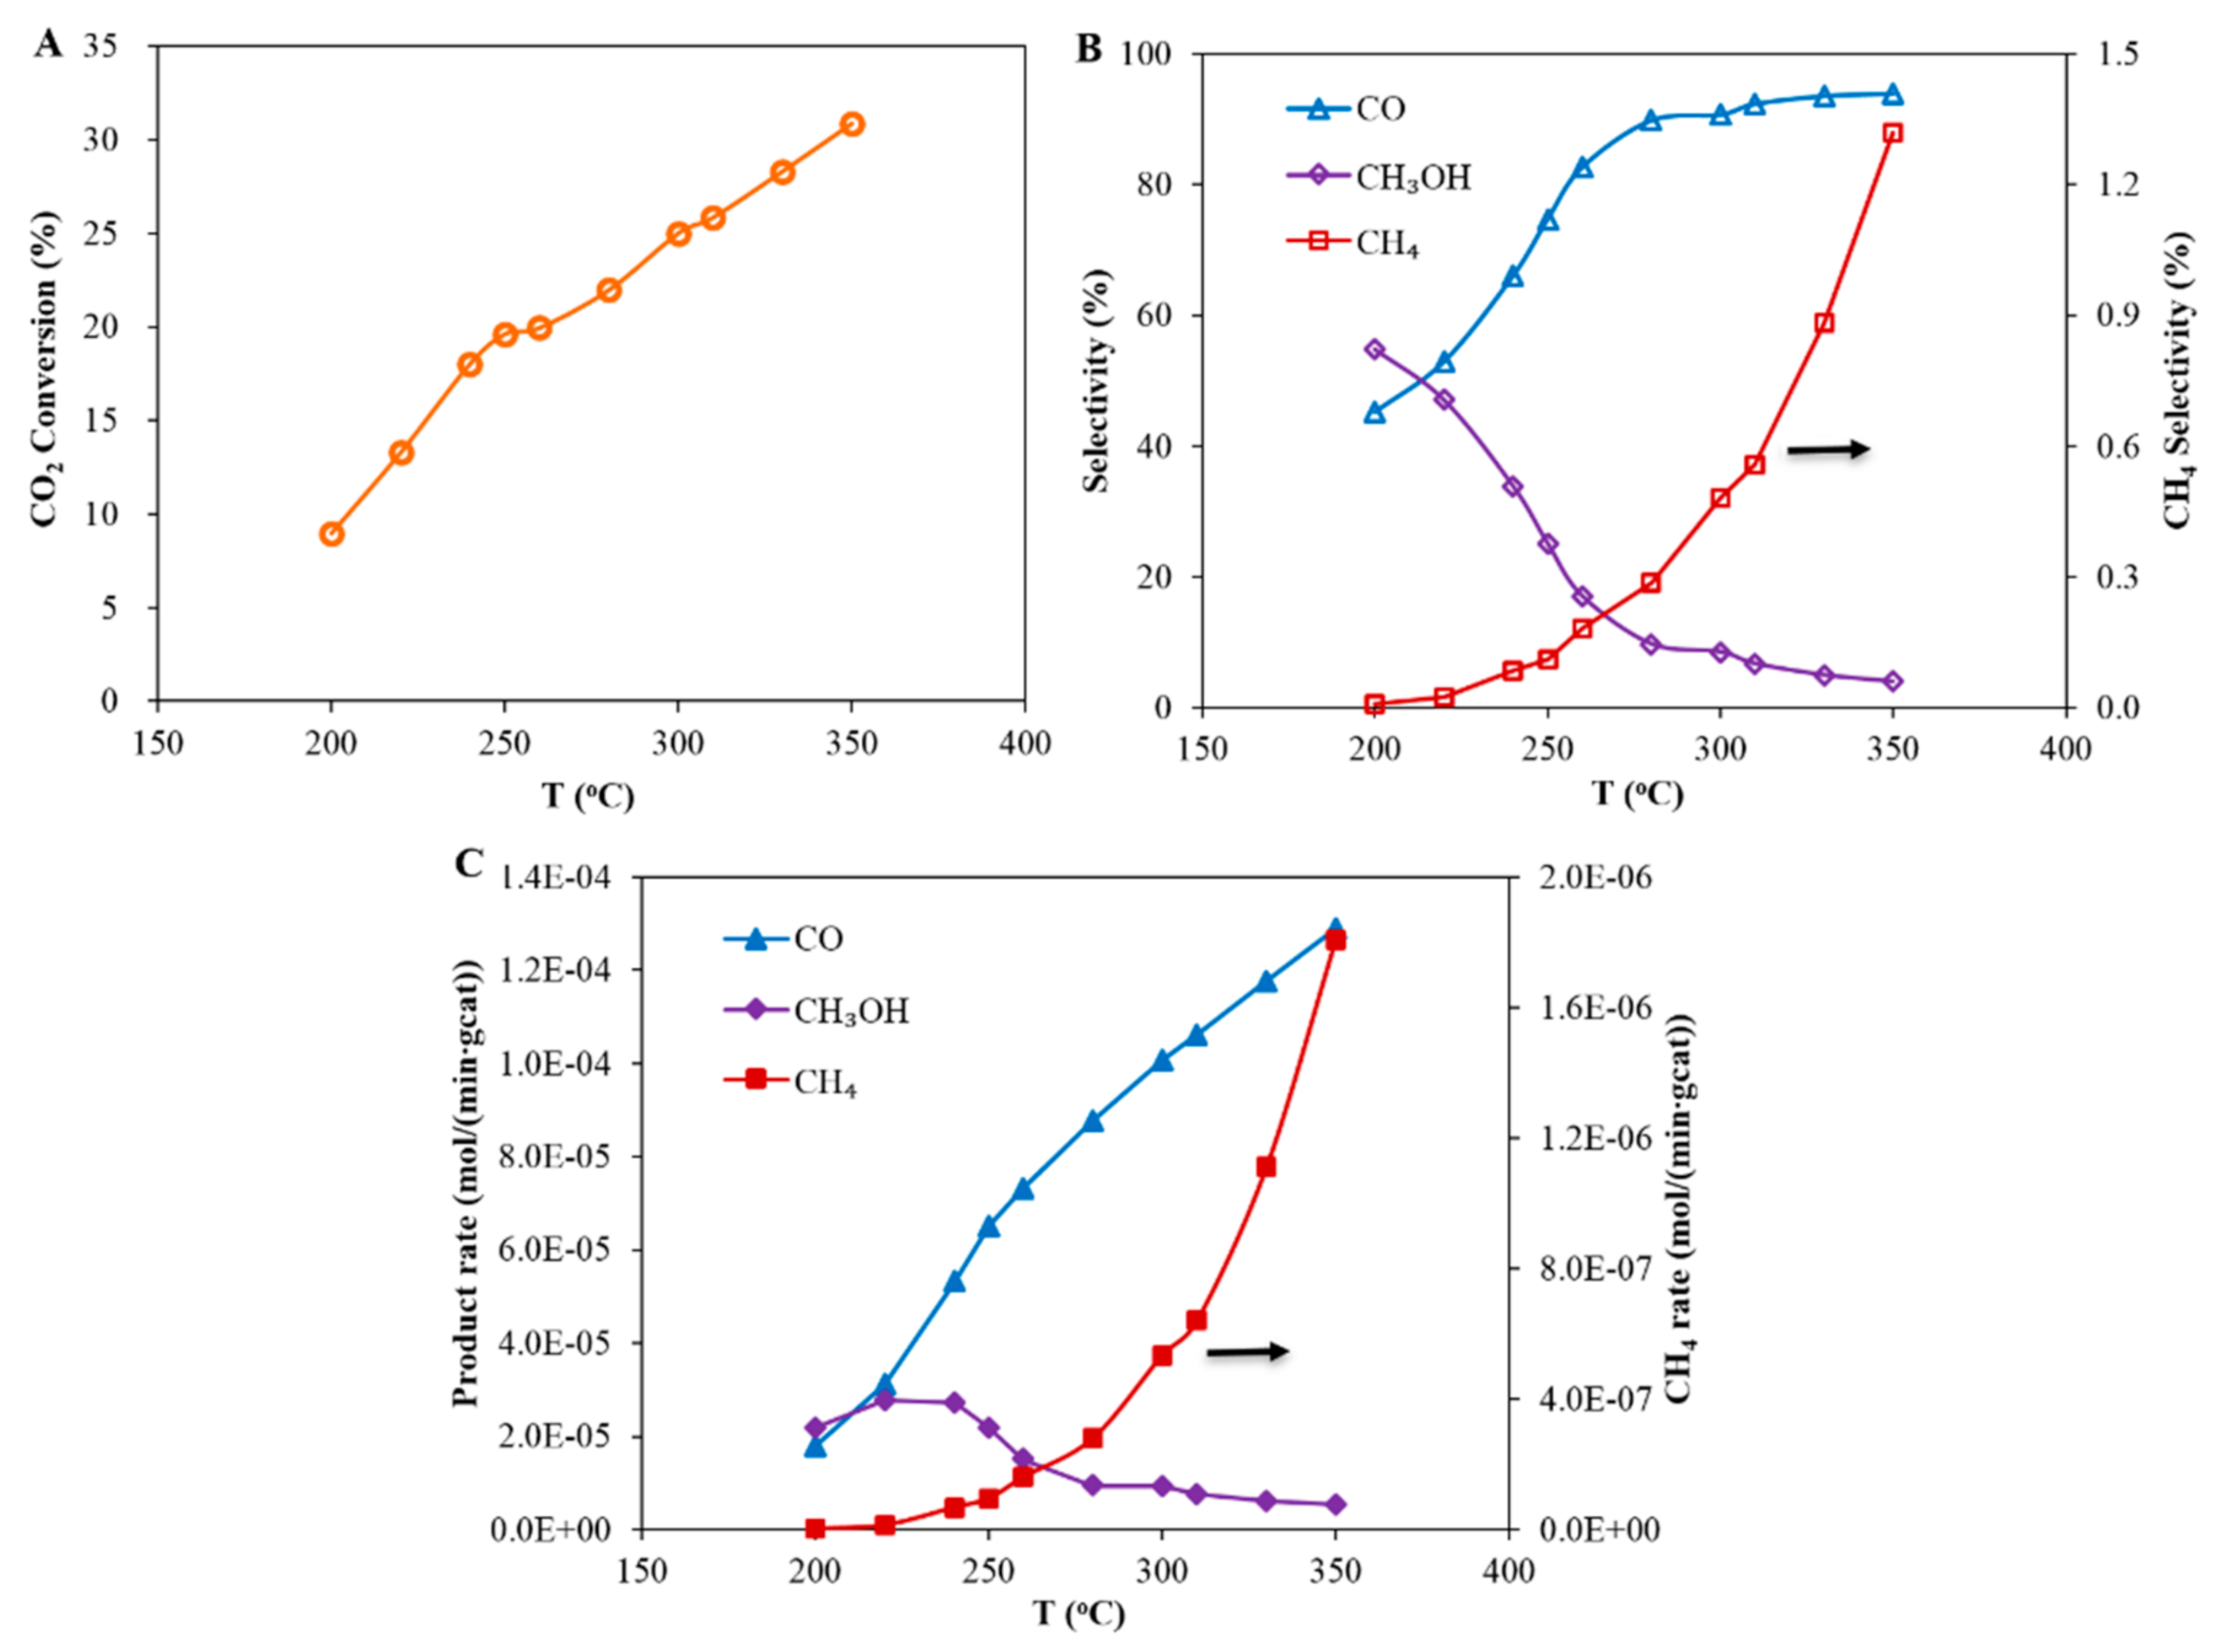
The effect of reaction temperature on the hydrogenation of CO2 over a Cu-based catalyst is shown in Figure 2A. Figure 2A clearly shows that CO2 conversion increases steadily with increasing reaction temperature. According to the product analysis, the main products for CO2 hydrogenation were methanol, CO and water. A small amount of CH4 (less than 1.5%) was detected. The product selectivity as a function of temperature is shown in Figure 2B; it can be seen that CO and CH4 selectivity increases with temperature. Conversely, the methanol selectivity reduces with increasing temperature. Similar trends are observed when looking at the product formation rates (Figure 2C). The rates of formation of both CO and CH4 increase steadily with increasing temperature. However, the rate of formation of methanol initially increases, reaches a maximum between 220 °C and 240 °C and then drops as the temperature is further increased.
The experimental data exhibit that two major competing reactions are involved in the CO2 hydrogenation to methanol process; these are the methanol synthesis reaction and the R-WGS reaction. Equilibrium limits what can be achieved in a once-through process and this will determine the maximum amounts of CO2 that can be converted to methanol and CO. Since CO2 hydrogenation to methanol is an exothermic reaction and the R-WGS reaction is endothermic, analyzing the overall heat of reaction is of interest. This will determine the heat load of the reactor and reducing it could potentially reduce operating and capital costs. With the aim of testing how far our experimental results are away from the equilibrium limitation, Aspen Plus ®V8.6 was used to investigate equilibrium for the methanol synthesis process. In the simulation the following assumptions are made:
- The base method is the Peng-Robinson Equation of State (EOS).
- The RGibbs reactor was used to calculate equilibrium.
- The feed was: H2 with a flow rate of 3 kmol/h and CO2 with a flow rate of 1 kmol/h
- The outlet was: H2, CO, CO2, H2O and methanol
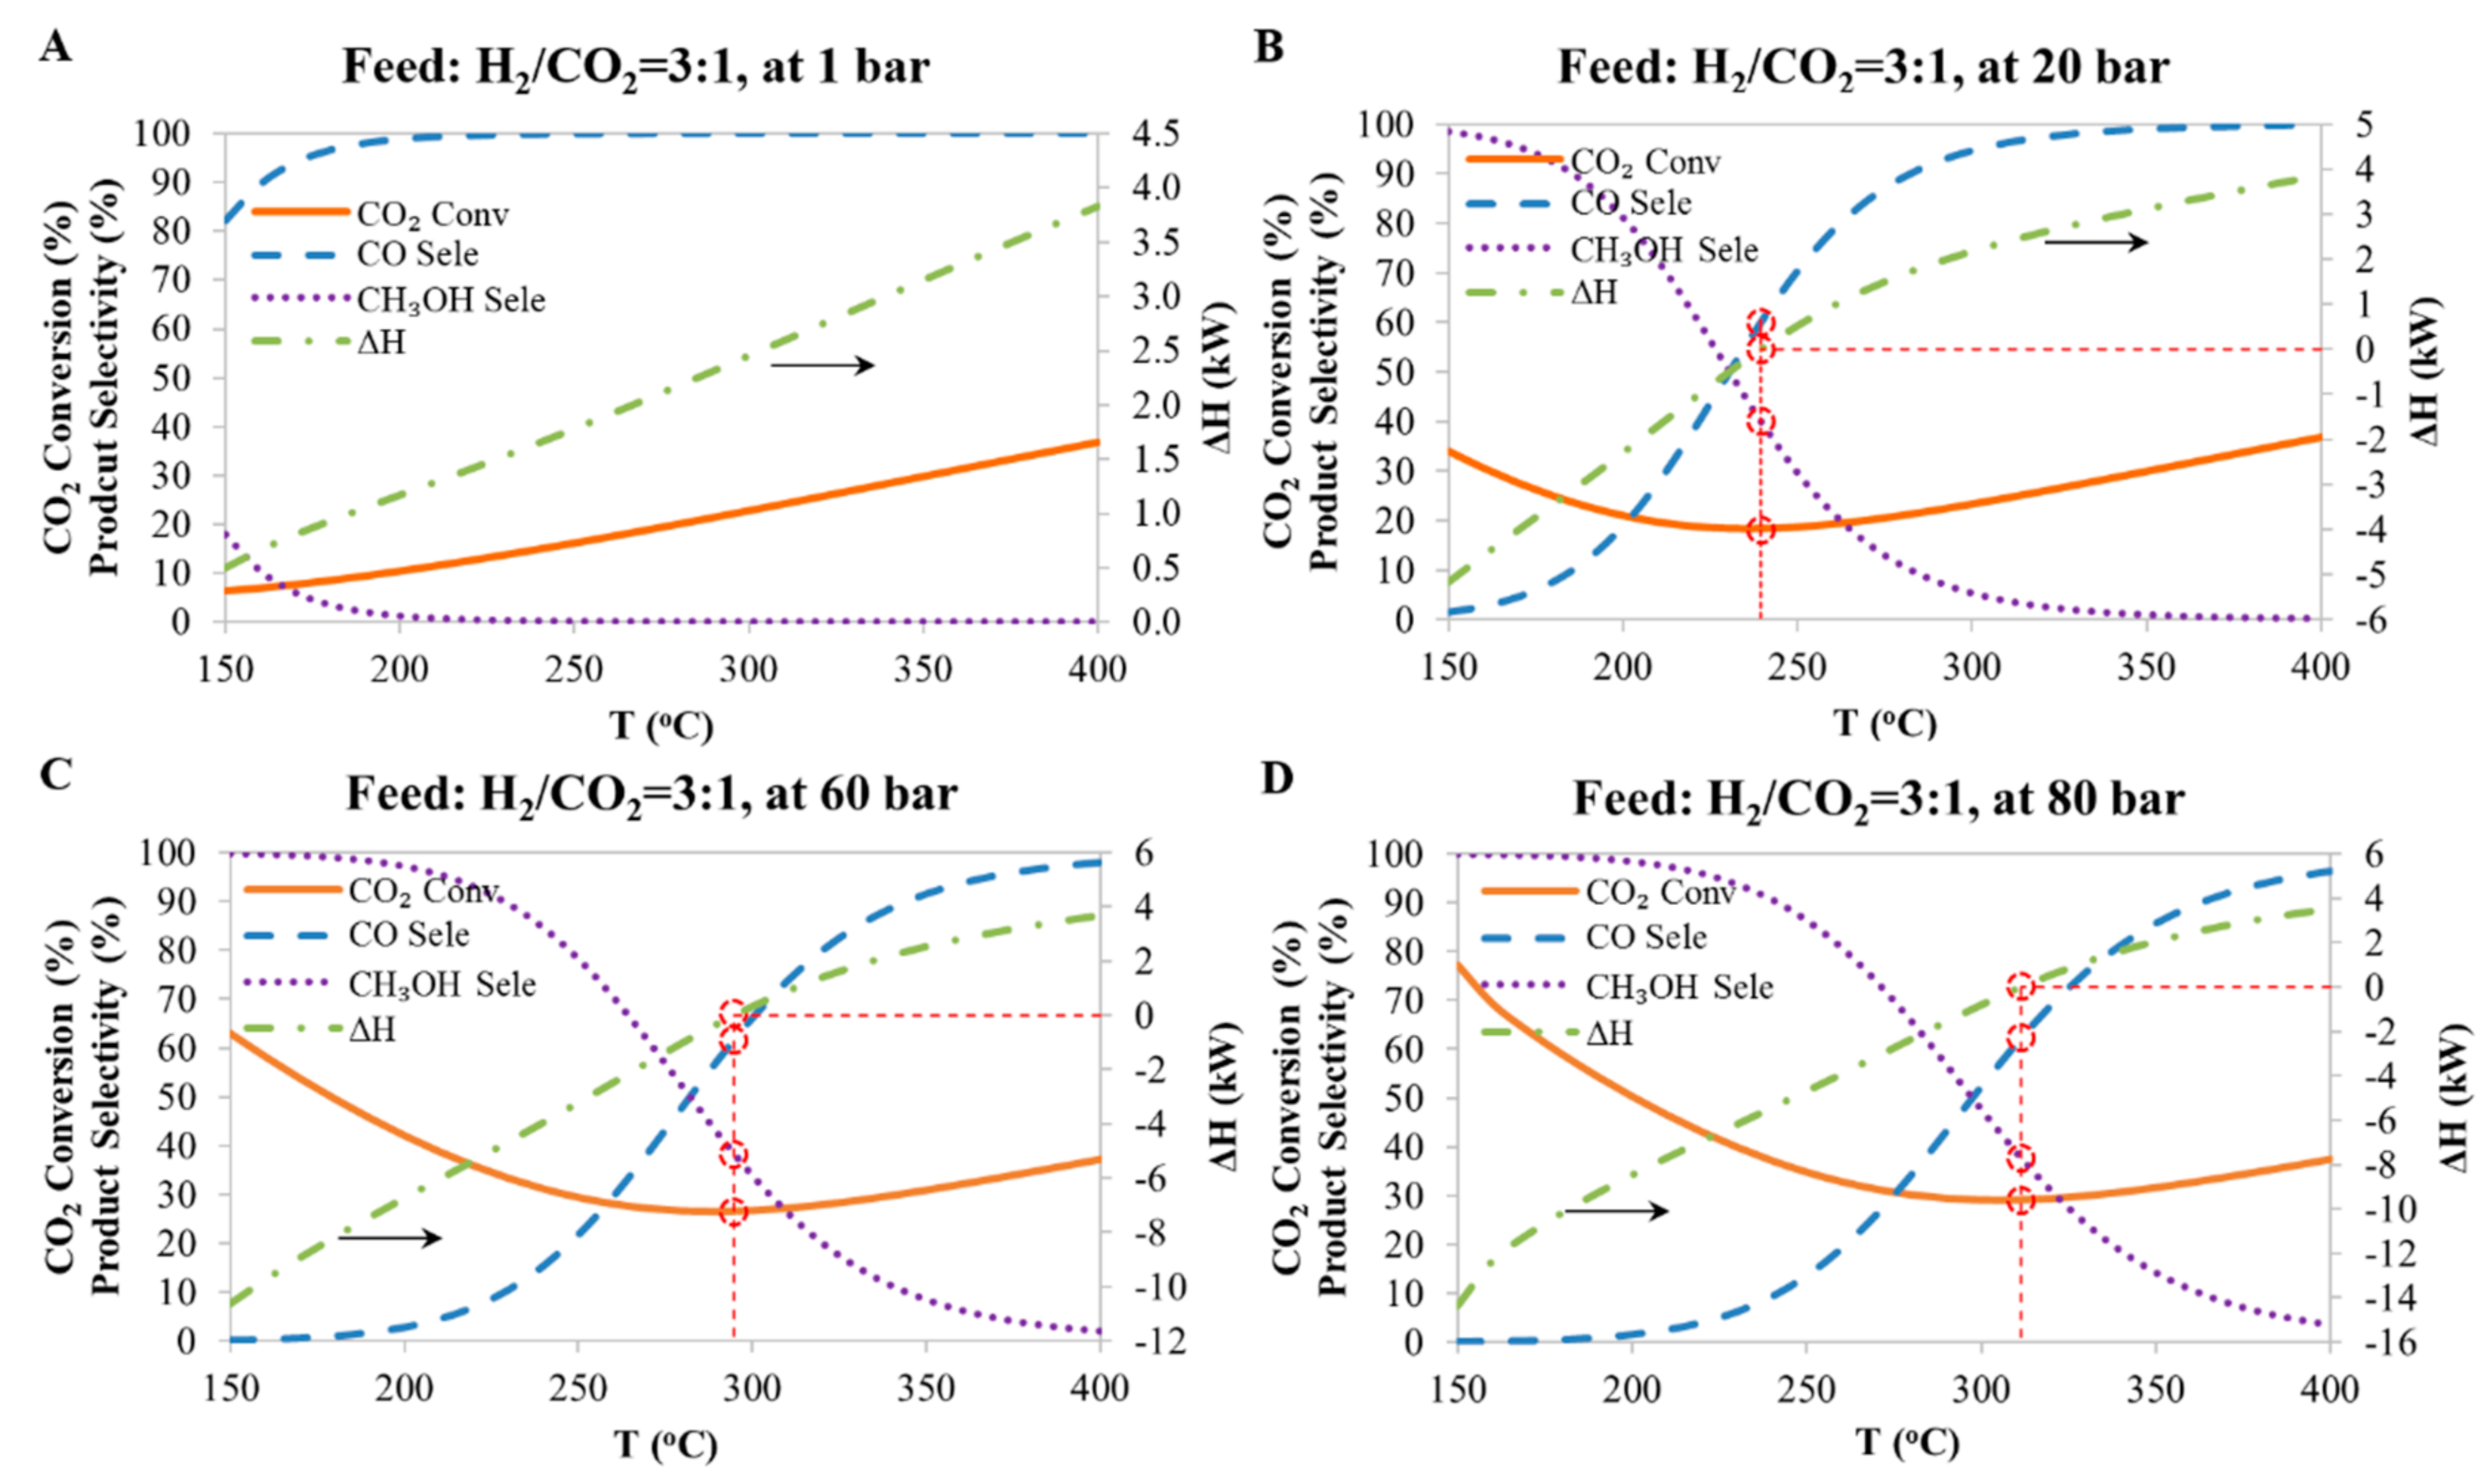
The simulation results, namely the CO2 conversion, the product selectivity and the heat of reaction as a function of reaction conditions (pressure and temperature) are plotted in Figure 3. It can be seen that: (1) the CO2 conversion for pressures greater than 1 bar, decreases, goes through a minimum and then increases as the temperature is increased from 150 °C to 400 °C. It also shows that the higher the pressure, the higher the total CO2 conversion. (2) Higher temperatures and lower pressures favor the production of CO, while conversely lower temperature and higher pressure favors methanol production. (3) The heat of the reaction is negative at high methanol selectivity and is positive at higher CO selectivity. It can also be seen that the heat of the reaction goes through zero (shown by the red dashed lines) indicating that an adiabatic process is possible at equilibrium. Table 2 summarizes the conditions when both ΔH and ΔG are equal to 0 kW for the methanol synthesis system.
Figure 4 compares the results from the experiments and those predicted by the Aspen simulation. The experimental and simulation results compare well from a temperature above 240 °C, suggesting that equilibrium was reached in the experiments run at this temperature or higher. Therefore, a thermodynamic model based on equilibrium can be used to predict the behavior of the Cu-reactor at pressures which were not covered in these experiments; from the results (Figure 3), it can be concluded that methanol formation from CO2 is thermodynamically favored at low temperature and high pressure, whereas CO formation is favored at high temperature. It can also be seen that CO formation decreases with increasing pressure; however, this is due to the increase in methanol selectivity, rather than the increase in pressure, since the R-WGS reaction is not affected by pressure. Daza and Kuhn [20] also mentioned that the R-WGS reaction is equilibrium limited, and its conversion is affected by temperature as it is an endothermic reaction, rather than by pressure due to the stoichiometry of the reaction.
3.2. Case B: CO2 Hydrogenation Over a Co-Based Catalyst
Hydrogenation of CO2 over a Co-based catalyst was conducted under normal FTS reaction conditions and in this experiment all the conditions were kept constant, at a pressure of 20 bar gauge, temperature of 200 °C and at a feed gas flowrate of 60mL(NTP)/(min·gcat).
The results from the experiments are shown in Table 3. The results show that CO2 hydrogenation over a Co-based catalyst produces mostly short chain saturated hydrocarbons (paraffins) rich in CH4 (92.5%). These results correspond to results obtained by many other researchers [12,13,14]. Table 3 also includes results obtained from previous experiments [15] where hydrogenation was done with a feed containing pure CO (third column of Table 3) and where hydrogenation was done with a mixture of CO and CO2 (fourth column of Table 3). By looking at the results in Table 3 the following observations can be made:
- For CO2 hydrogenation (second column), the product is almost entirely composed of short chain paraffins, rich in CH4. The analysis results show that CH4 selectivity is more than 90% and no olefin was detected in the products.
- FT CO hydrogenation (third column) produces mainly long chain hydrocarbons (including paraffins and olefins) with CH4 selectivity less than 10%.
- For a feed which is a mixture of CO and CO2 (fourth column) with only small quantities of CO (5.9%), the product analysis shows that selectivity of CH4 is much lower compared to CO2 hydrogenation only and the products also contain longer chain hydrocarbons in a considerable amount, although still lower compared to CO hydrogenation only.
The above results indicate that even a small amount of CO in the CO2 rich feed changes the product selectivity significantly. This presents an opportunity for effective conversion of CO2 by co-production of methanol and R-WGS. In this process, relatively long chain hydrocarbons can be achieved by combining the two catalytic reactors in series: a Cu-reactor for methanol production which also produces CO as by-product, followed by a Co-reactor fed with the tail gas from the Cu-reactor which contains a mixture of unreacted CO2 and CO formed during methanol formation. The presence of the CO in the tail gas leads to improved selectivity of long chain hydrocarbons in the Co-reactor as shown in Table 3. This combination of reactors in series was tested in the lab as Case C and the results are presented below.
3.3. Case C: CO2 Hydrogenation Using a Cu-Based Catalyst in Series with a Co-Based Catalyst
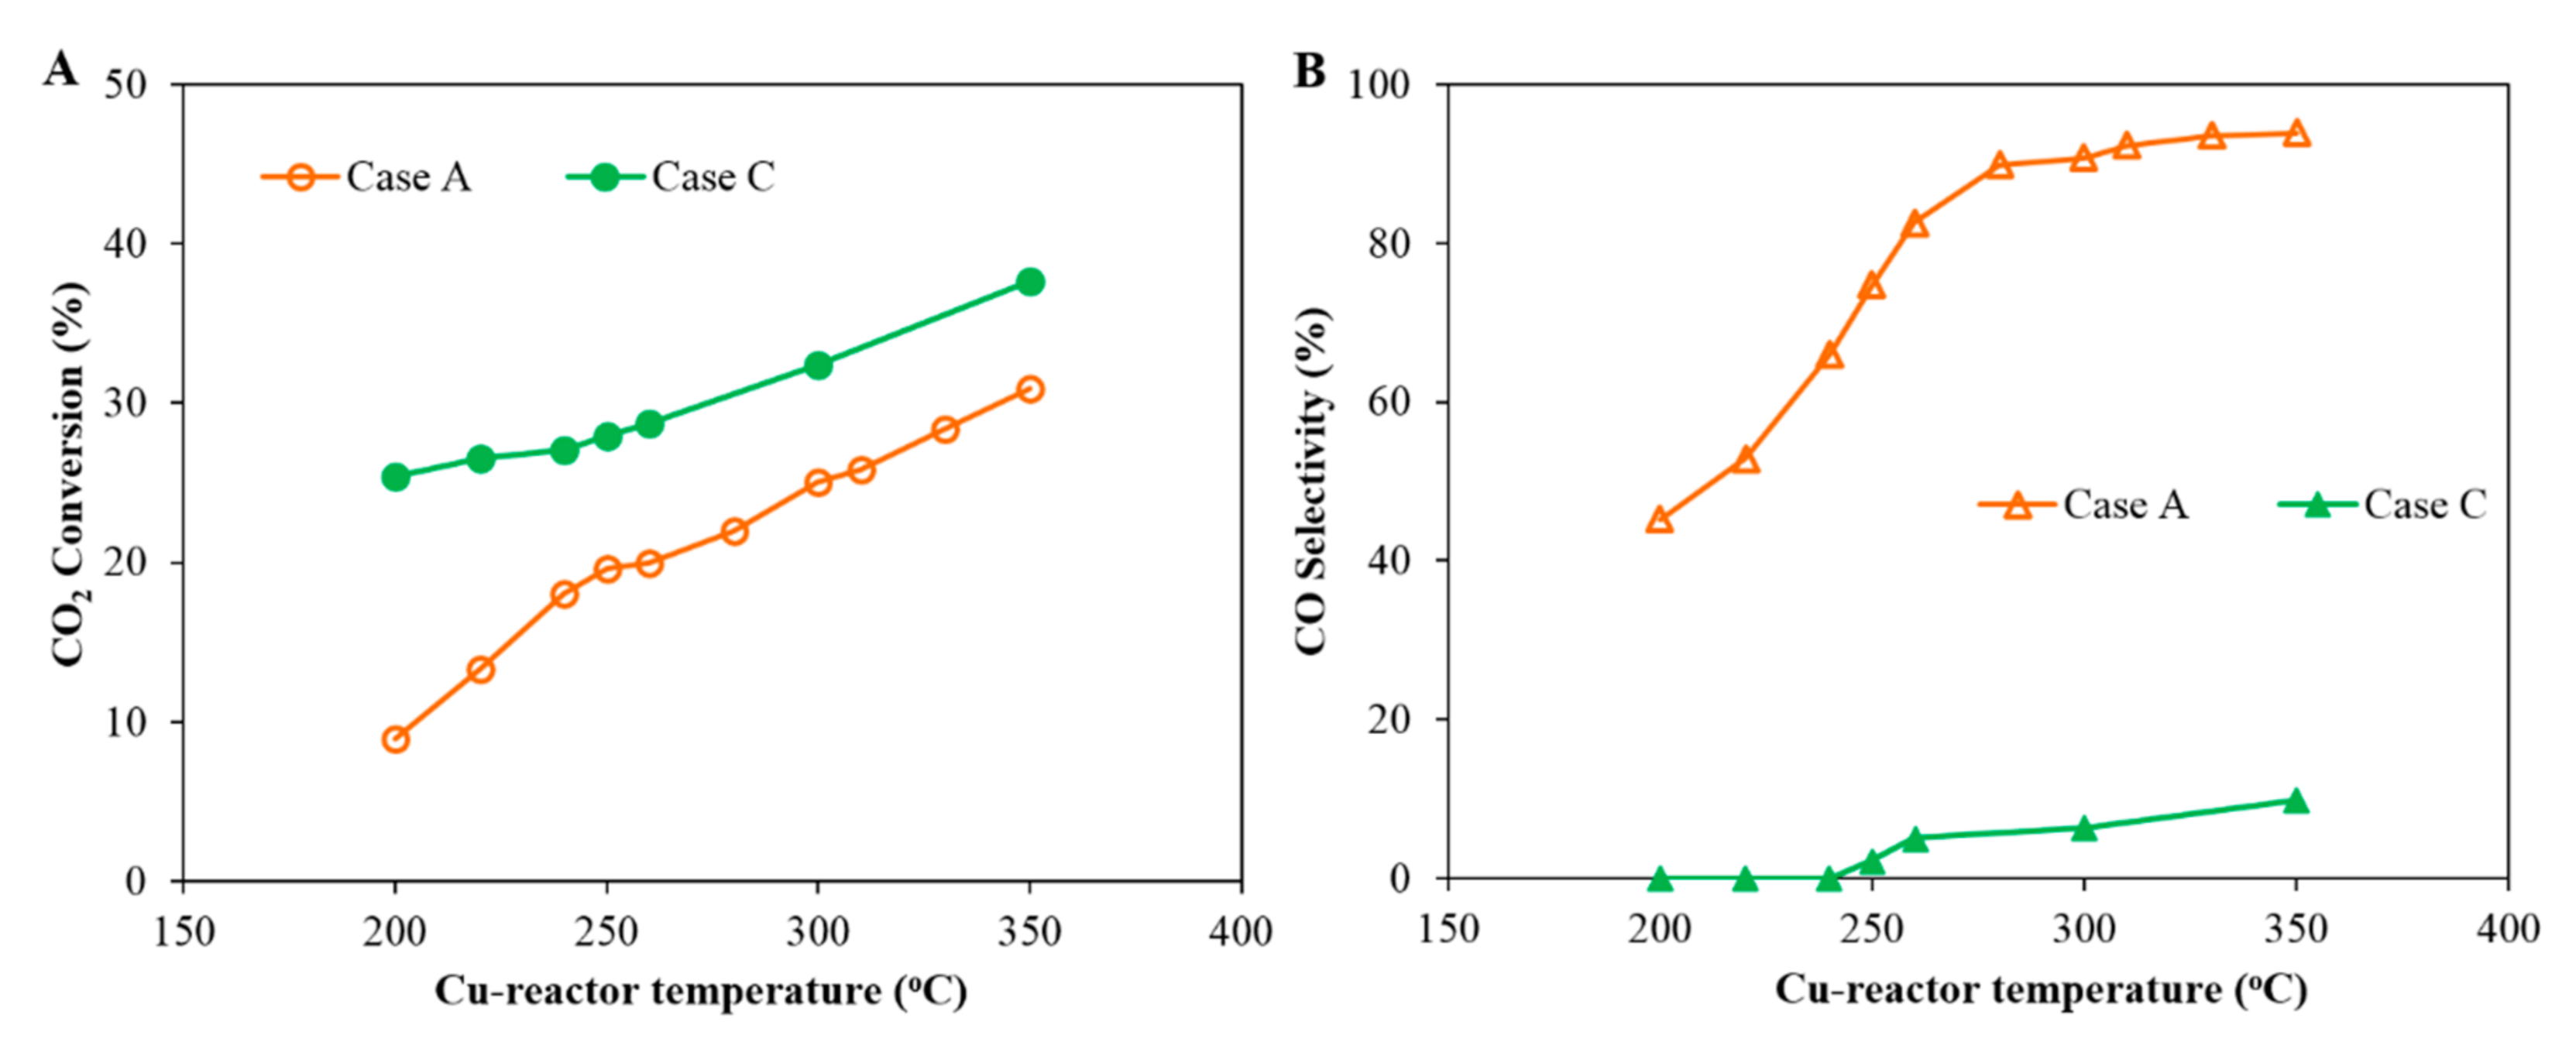
Figure 5 shows the comparison of the CO2 conversion between Case A and Case C as a function of temperature, where temperature is varied in the Cu-reactor only while the Co-reactor temperature is kept constant. It is clear that total CO2 conversion increases with temperature in both cases and that the conversion in Case C is greater than that of Case A, due to the added reactor in Case C. The comparison of the CO selectivity for both Case A and Case B is shown in Figure 5B. No CO could be detected in the exit from the FT reactor when the temperature of the Cu-reactor was below 250 °C. It is worth noting that the CO selectivity in Case C is much lower than that of Case A, which indicates that the undesirable CO produced in the Cu-reactor was reacted in the Co-reactor (the second reactor in Case C) to valuable hydrocarbon products.
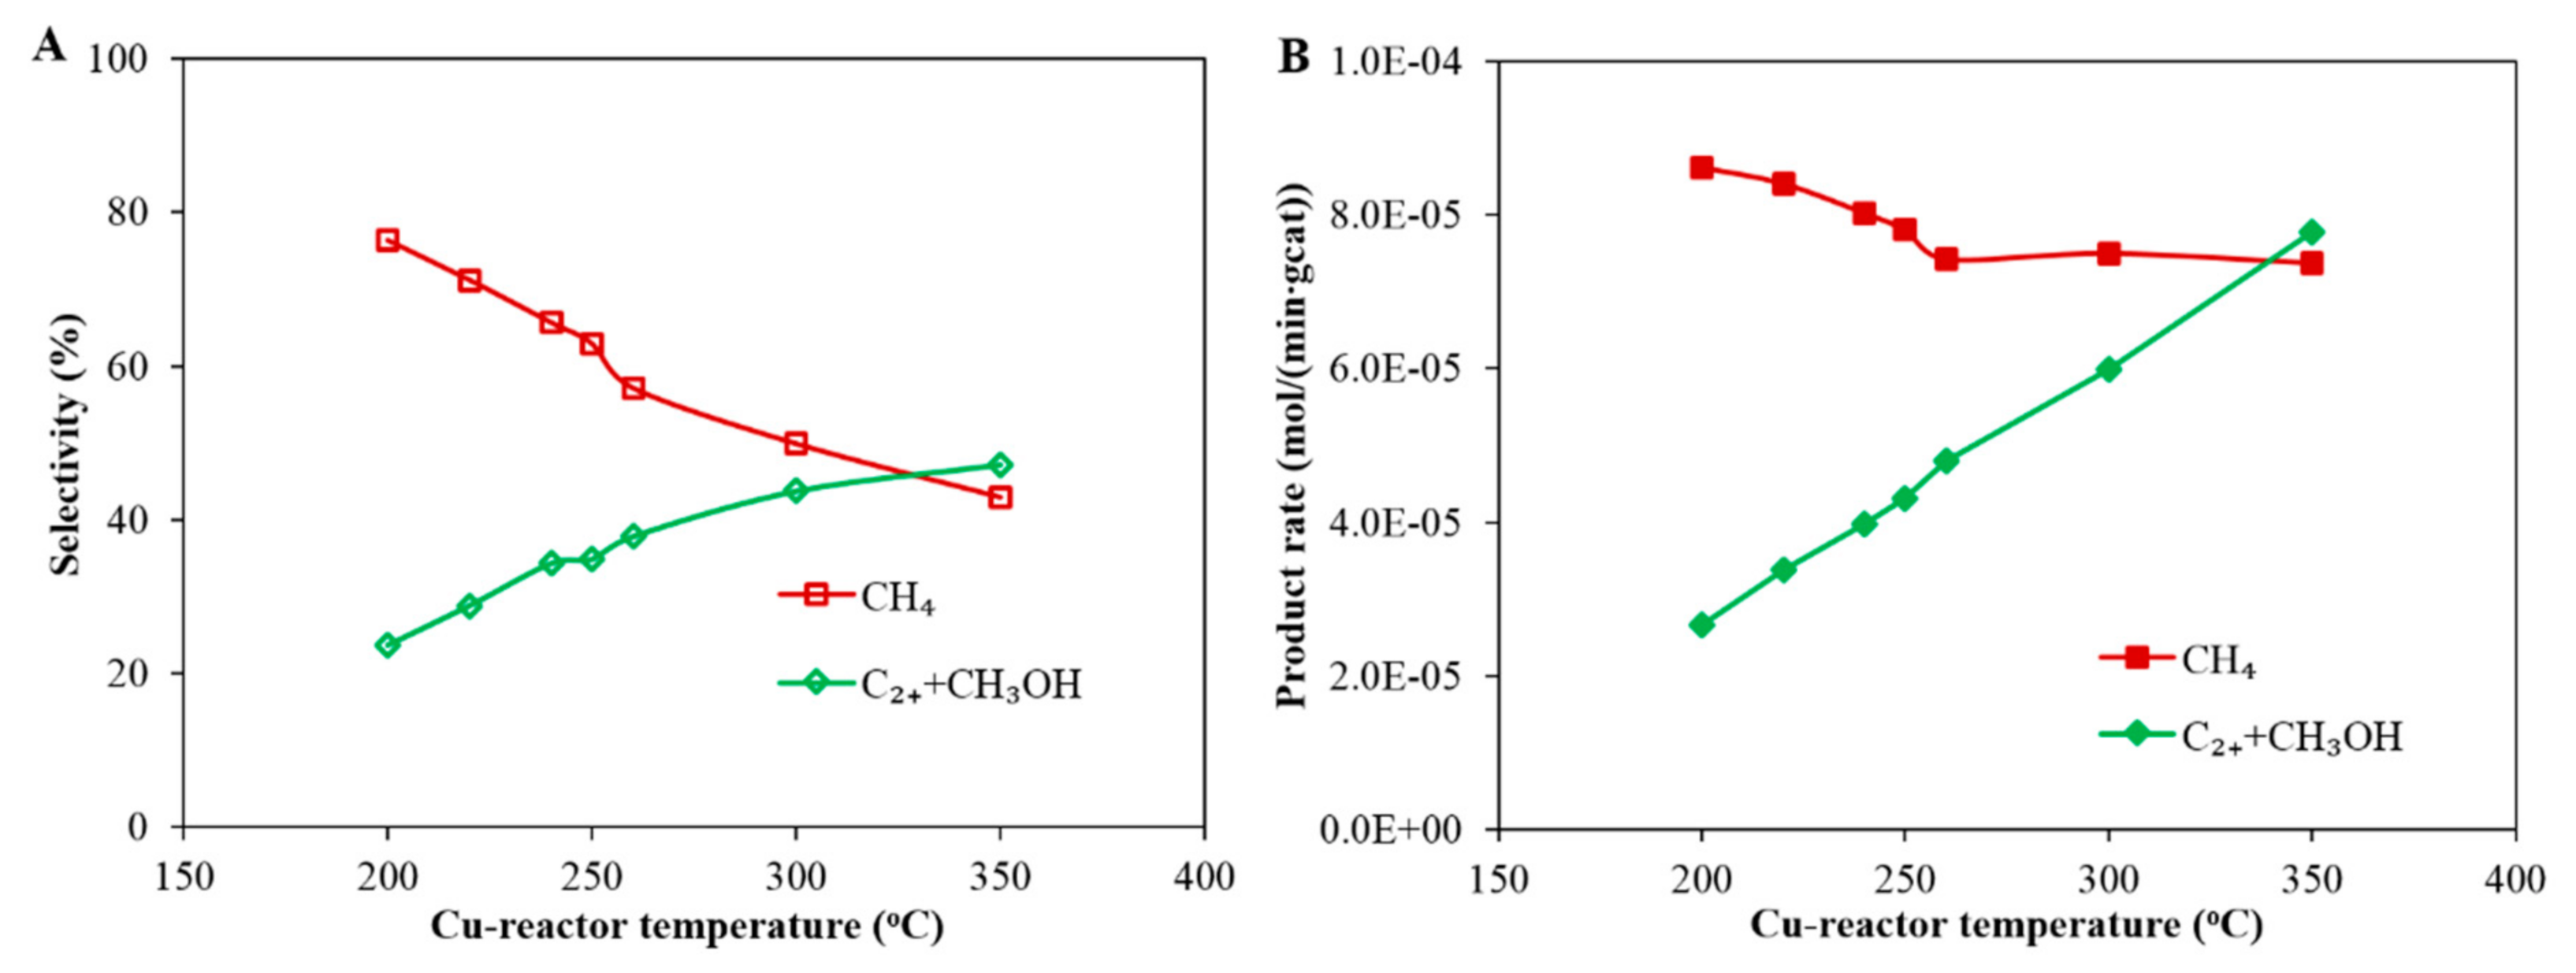
The overall product selectivity and formation rates as a function of temperature of the Cu-reactor are shown in Figure 6. Note that the temperature of Cu-reactor was gradually increased from 200 to 350 °C, while the Co-reactor was maintained at 200 °C. The results in Figure 6A show that CH4 selectivity decreases with increasing operating temperature of the Cu-reactor, while the selectivity of the desired products (methanol + C2+) increases. A similar trend is observed when looking at the reaction rate in Figure 6B where the rate of formation of desired products (methanol + C2+) increases with increasing temperature of the Cu-reactor while the rate of formation of CH4 decreases from 8.6 × 10⁻⁵ mol/(min·gcat) to 7.4 × 10⁻⁵ mol/(min·gcat), as the temperature of Cu-reactor increases from 200 to about 250 °C and then remains fairly constant as the temperature increases further.
Figure 6A also shows that the CH4 selectivity in Case C is below 80% and decreases with increasing operating temperature of the Cu-reactor. The CH4 selectivity is lower than that measured in Case B (92.5%); this is due to the presence of CO in the feed gas to the Co-reactor. It is known that the H2/CO ratio in the reactor influences the product selectivity [21,22]: low H2/CO ratio leads to low CH4 selectivity and high long chain hydrocarbon selectivity. Therefore, the selectivity of CH4 in the Co-reactor in Case C decreases as more CO is produced in the Cu-reactor thereby decreasing the H2/CO ratio of the feed gas to the Co-reactor. Since the selectivity and product distribution are linked, it is therefore important to compare the product distribution between Case C and Case B.
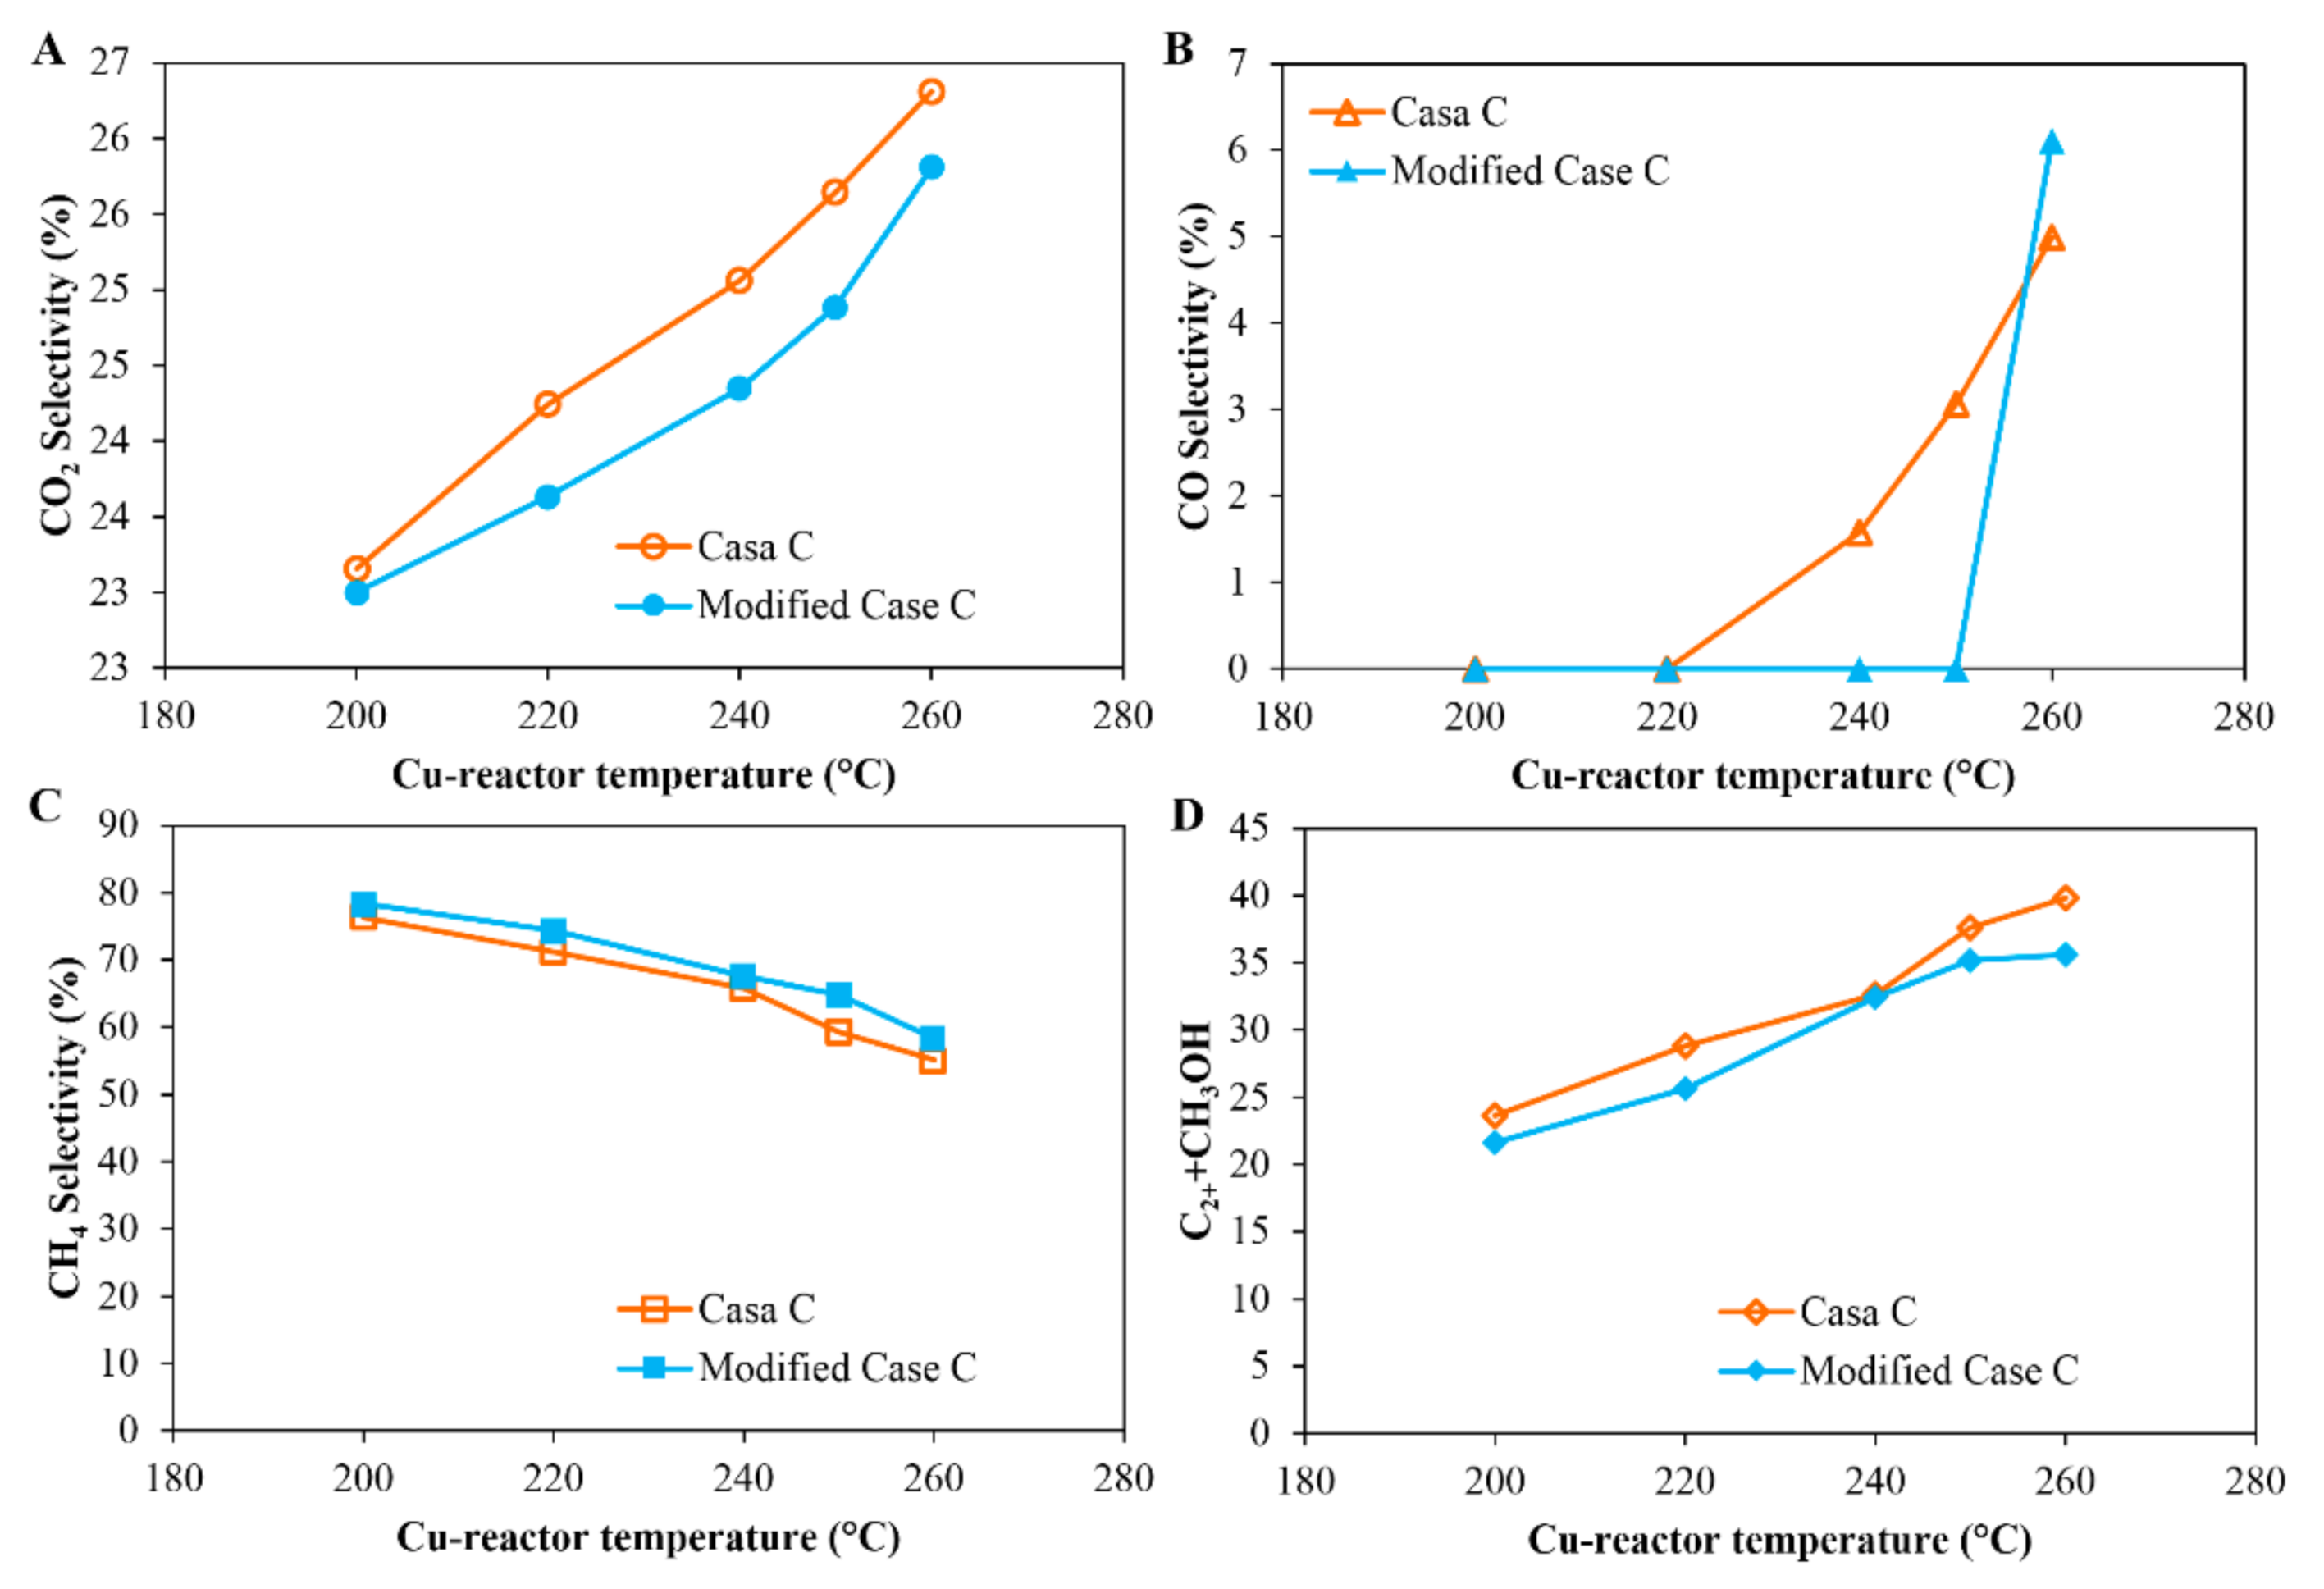
Case C was a process in which two reactors were configured in series; a condensation trap, to condense the methanol and water produced from the first reactor (Figure 1: Case C), was placed between the Cu-reactor and the Co-reactor. In order to simplify the process, a modified process named “Modified Case C” was also tested by removing the condensate trap between the methanol (Cu catalyst) and the FT (Co-catalyst) reactors (see Figure 1: Modified Case C), so that all the products as well as the unreacted feed gas from the Cu-reactor were fed to the Co-reactor. Figure 7 compares the performance of the reactor system for Case C and Modified Case C. Figure 7 shows that a slightly lower CO2 conversions and higher CH4 selectivity are obtained for the Modified Case C compared to that of Case C, which indicates that there is a negative effect on the FT reaction when methanol and water produced from the Cu-reactor were introduced to the Co-reactor.
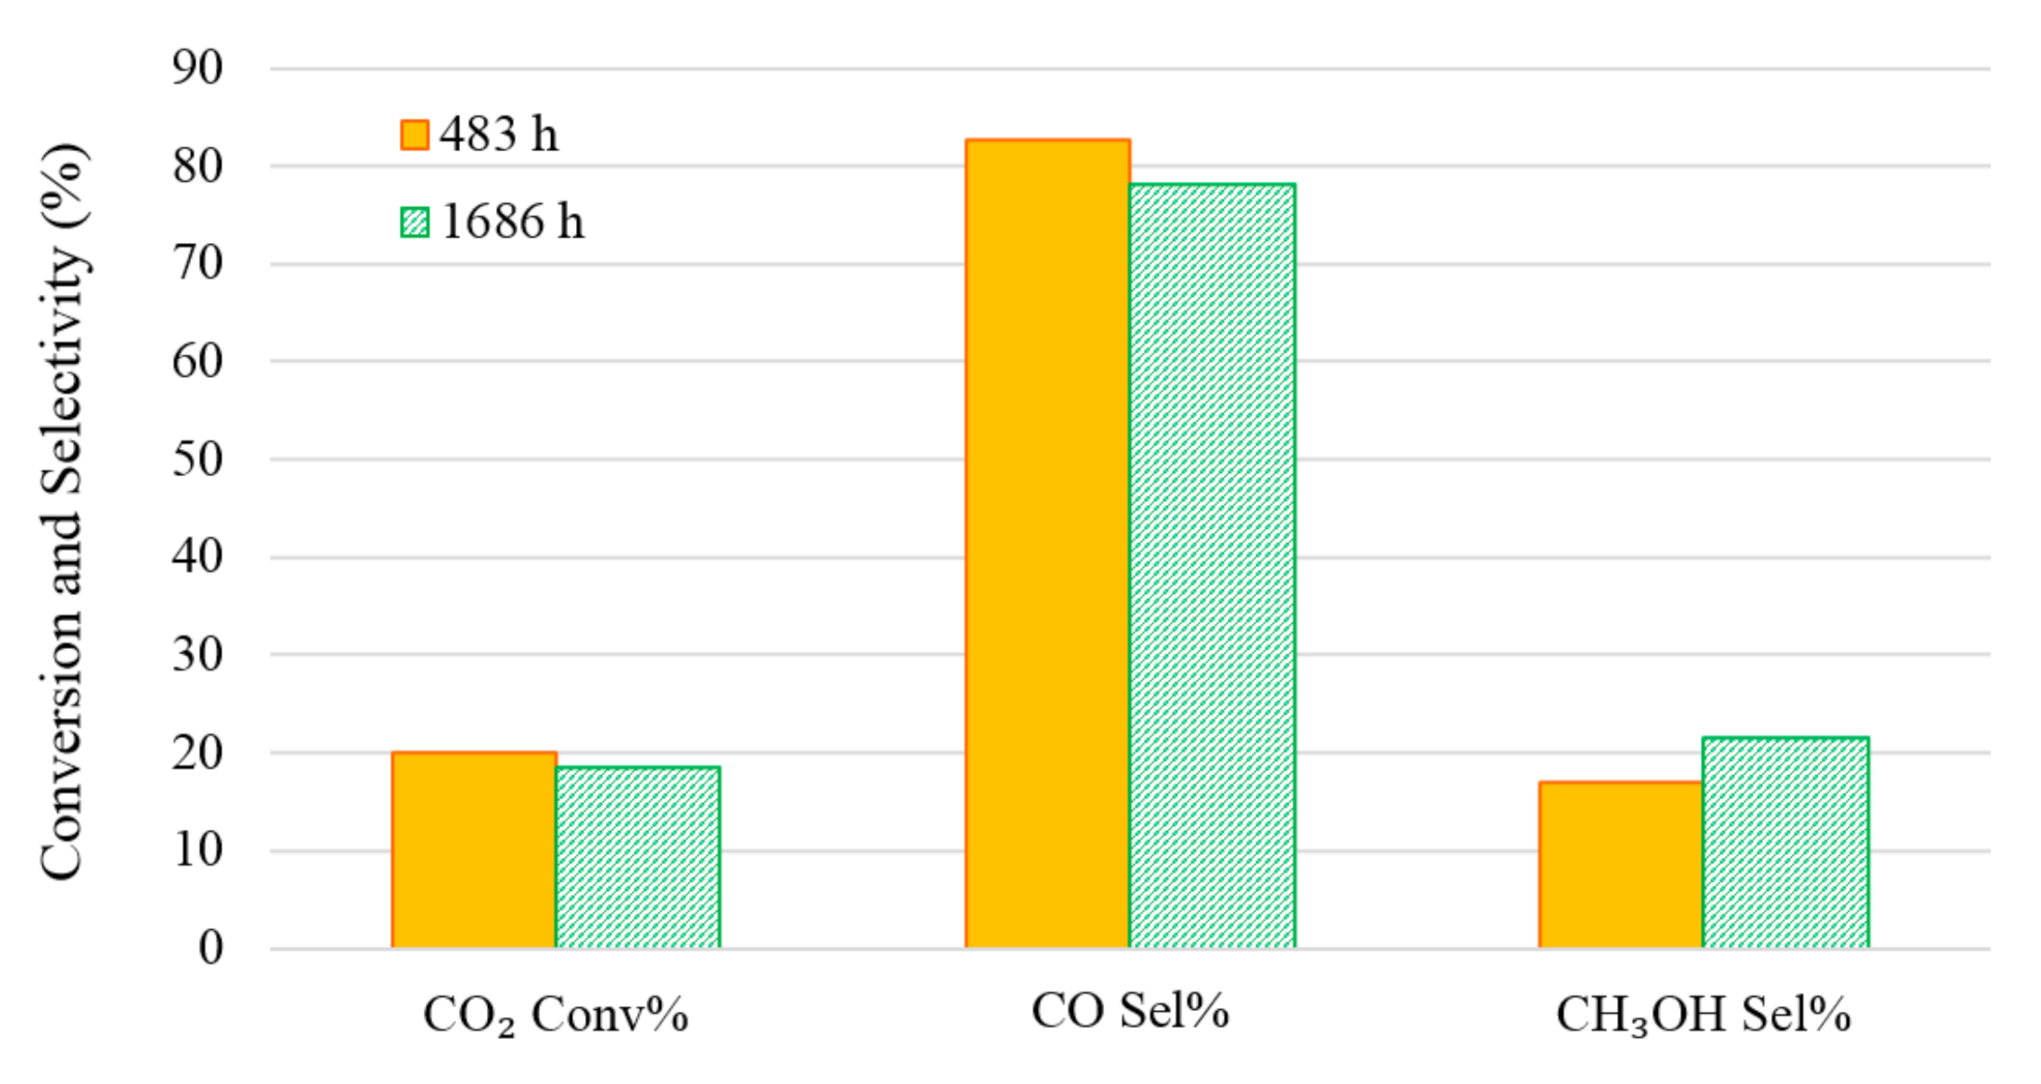
There was concern that the Cu-based catalyst might deactivate during the experiments as the reaction temperature was varied over a wide range (200–350 °C) during the experiments in Cases A and C. An experimental run was repeated to test the Cu-based catalyst stability at 260 °C. Figure 8 clearly shows that after 1600 h running, there is no significant deactivation of the catalyst.
The Anderson–Schulz–Flory (ASF) distribution model has been used extensively and has been successful in describing and predicting the product distribution in FTS. If it is assumed that the hydrocarbon chain is formed by step-wise insertion or addition of CH2 intermediates with constant growth probability (α), then the chain length distribution can be described by the ASF model [23]. If it is further assumed that α is independent of the hydrocarbon chain length, the ASF distribution is described by:
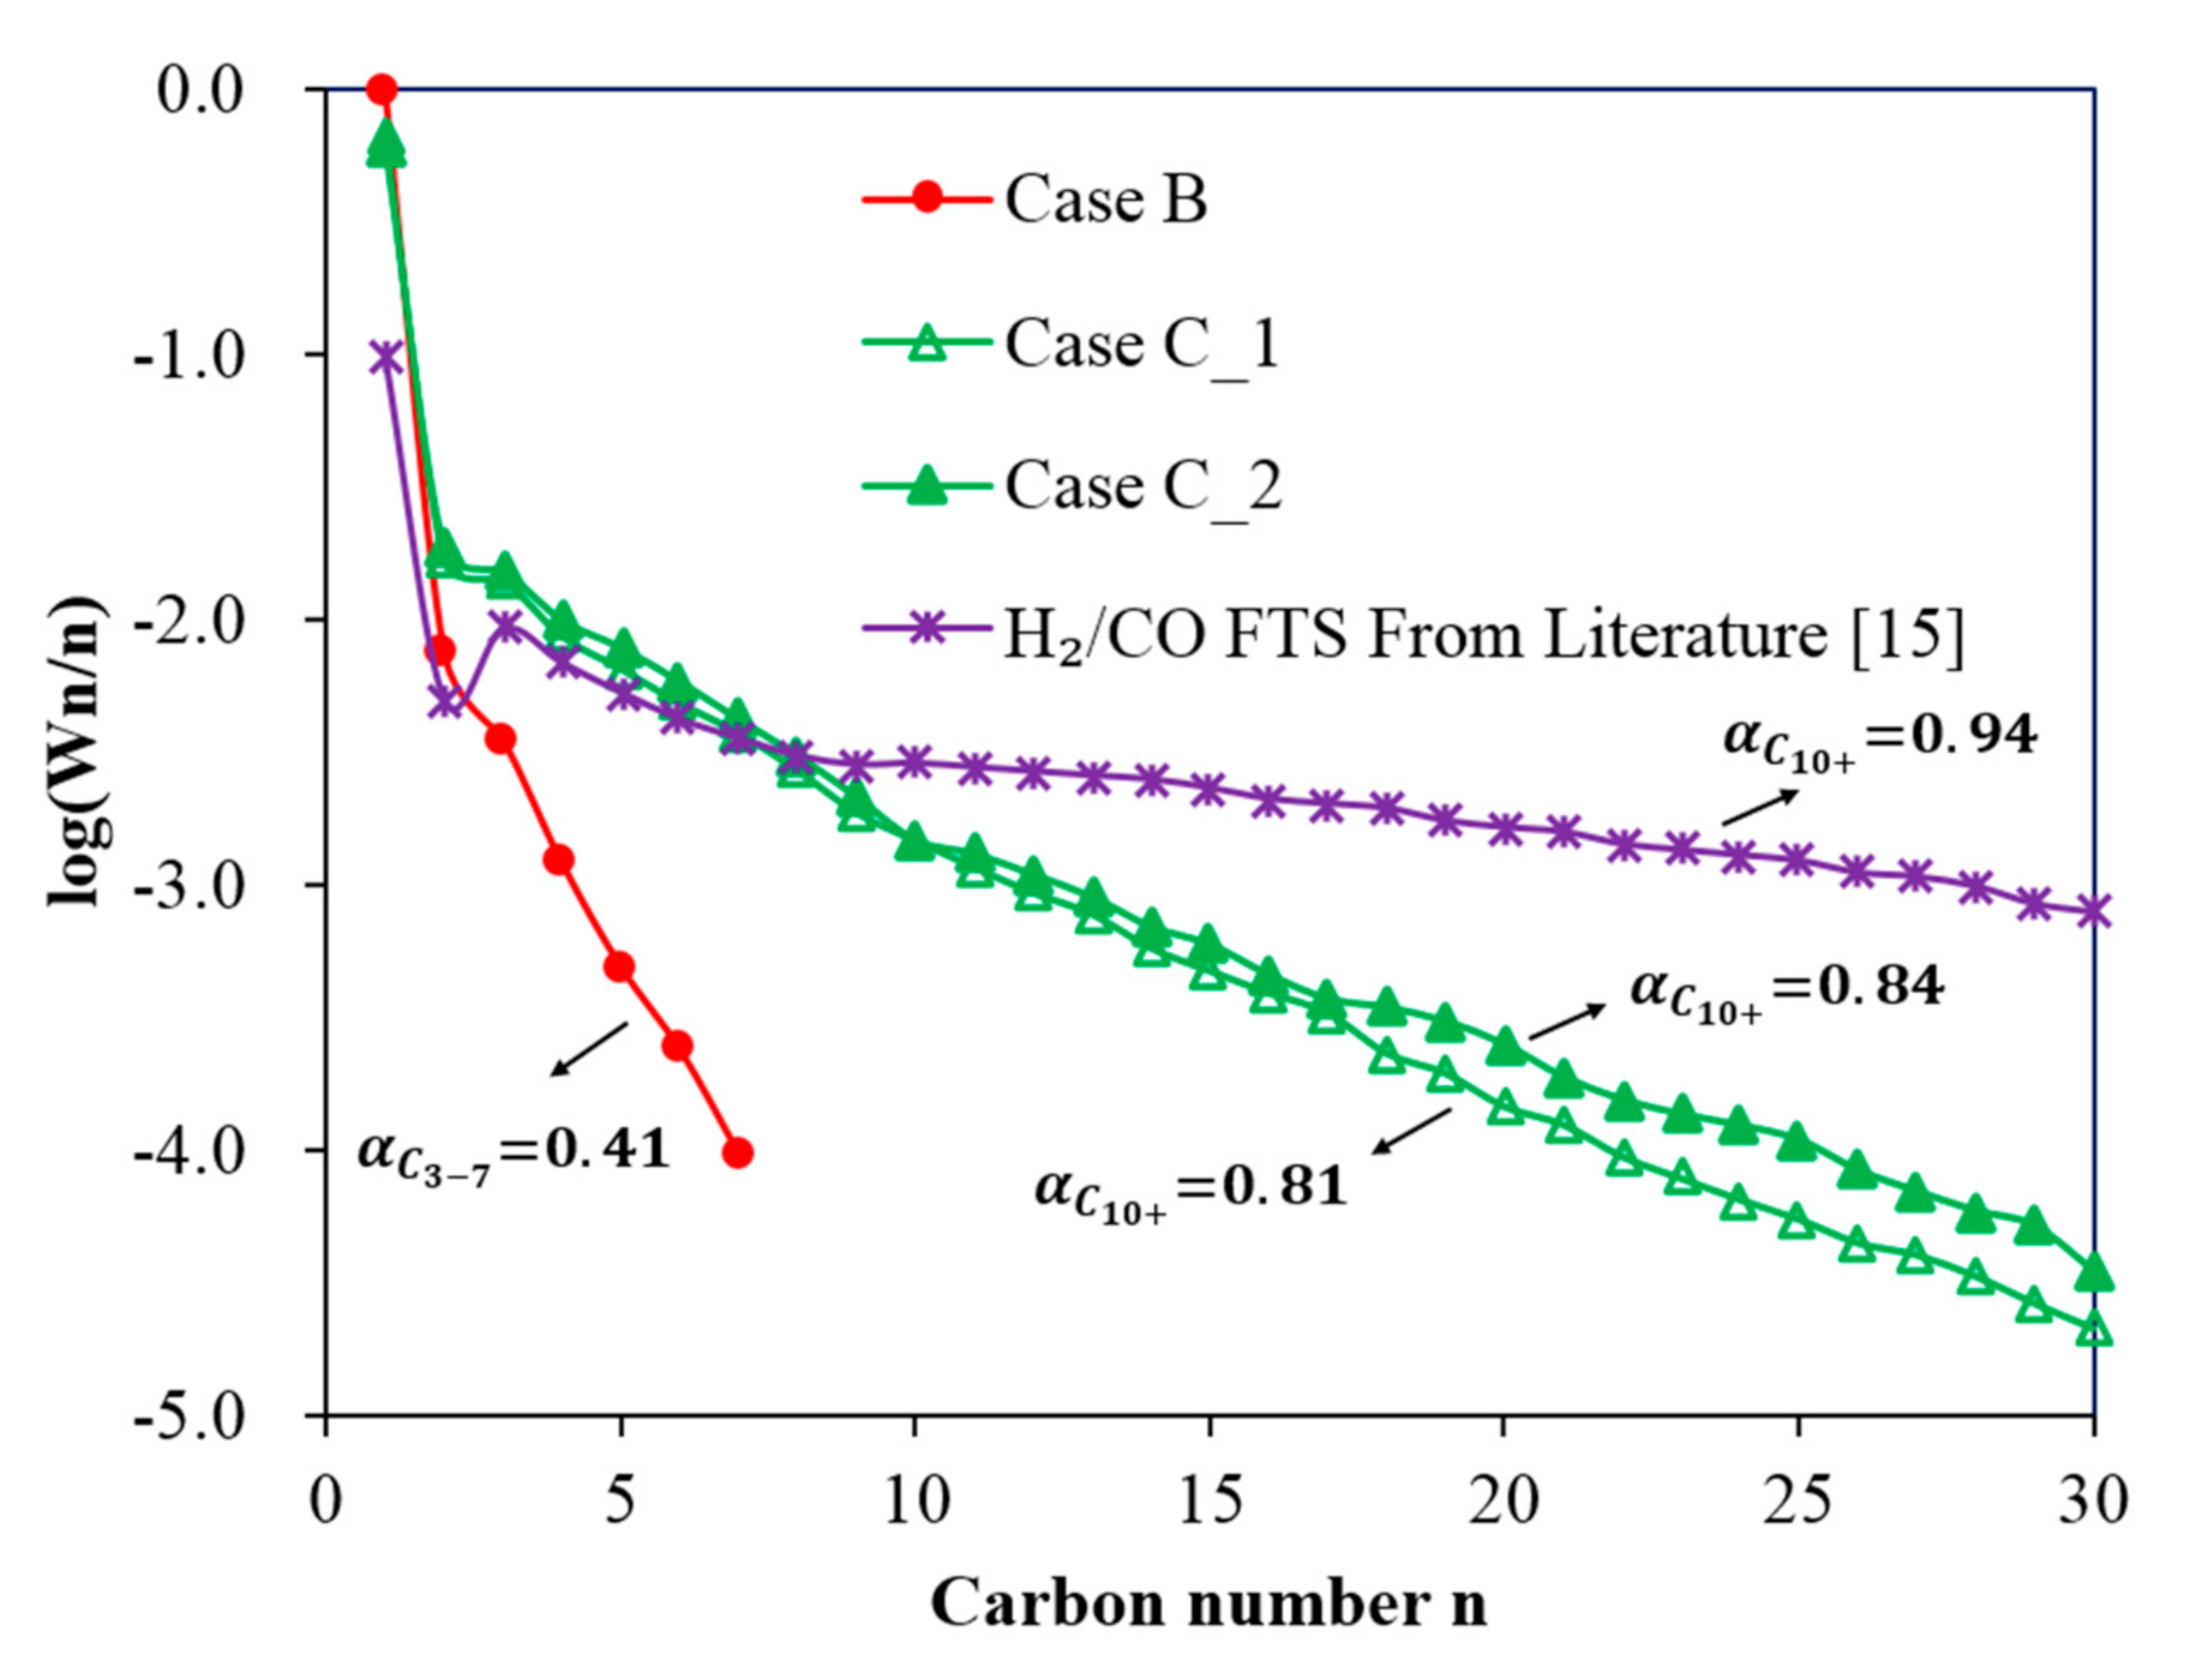
where Wn is the mass fraction of a hydrocarbon with chain length n. Plotting versus gives a straight line whose slope () is used to calculate the value of α. A higher α value indicates that a heavier hydrocarbon product should be expected. Figure 9 shows the ASF product distributions for Case B and Case C and the results obtained from previous experiments in Yao et al. [15]. The following can be observed:
- In Case B, with a single Co-reactor (H2/CO2 feed gas, Table 1), the results show that CH4 is the dominant product with a small quantity of short chain hydrocarbons being formed. The results follow a typical ASF distribution with a low α value of 0.41.
- In Case C, with a Cu-reactor connected in series to a Co-reactor (H2/CO2 feed gas Table 1), two conditions are considered: Case C_1 and Case C_2, which consider the product distribution of the Co-reactor at two temperatures of the Cu-reactor, 300 °C and 350 °C, respectively. Figure 9 shows that the slope of the distribution of Case C_2 is slightly smaller than that of Case C_1 and thus the α value of Case C_2 is slightly higher than that of Case C_1 (0.81 < 0.84). This is due to the higher CO concentration in the product from the Cu-reactor in Case C_2, due to the higher operating temperature. The CO concentration is higher at high temperatures because, as can be seen in Figure 2B, the CO selectivity in the Cu-reactor increases with temperature. By comparing the α value in Case B with that of both cases in Case C, the results indicate that a better FT product distribution is obtained by coupling the Co-reactor to the Cu-reactor.
From these results, it can be concluded that the combined reactor in series (Case C) was found to greatly enhance CO2 conversion and increase the long chain hydrocarbon product selectivity, although it still cannot achieve the same performance as CO hydrogenation.
4. Discussion and Implications
4.1. Comparason between the Current Work with the Results Reported in the Literature
Figure 5, Figure 6, Figure 7 and Figure 9 shows that two reactors in series (a Cu-reactor followed by a Co-reactor) significantly increase the long chain hydrocarbon product selectivity compared to using only a Co-reactor. The catalytic activity and selectivity of this study has been compared to that reported in the literature (see Table 4). Table 4 lists CO2 hydrogenation results under different reaction conditions over different catalysts, which shows: (1) generally, Cobalt catalysts promote the CO2 hydrogenation reaction to form methane (>80%); however, He et al. [24] reported a Co6/MnOx nano-catalyst which could efficiently catalyze CO2 hydrogenation to form long chain hydrocarbons (53.2% in Table 4); they ran the experiments in batch mode with a liquid solvent; (2) iron catalysts can catalyze the CO2 hydrogenation and have a low CH4 selectivity, while one of the drawback is the high selectivity to CO. Table 4 indicates that both Co and Fe catalyst have the potential to catalyze CO2 hydrogenation to liquid fuels by either combining two catalysts (current work), preparing a bifunctional catalyst [25] or selecting a suitable support [14,26].
In addition, our experimental results (Table 3 and Figure 5, Figure 6 and Figure 7) suggest a stepwise conversion of CO and CO2 in the FT reactor. Firstly, most of the CO is converted to hydrocarbons via the FT reaction, then CO2 is hydrogenated to short chain hydrocarbons, mainly methane. Therefore, further experiments with different ratios of Cu to Co-based catalysts are highly recommended. In addition, more attention needs to be paid to the effect of total pressure on the catalyst performance, as both methanol yield and long chain hydrocarbon selectivity are favored at higher pressure due to the stoichiometry of both the methanation and the FT reaction. Furthermore, a bifunctional catalyst may be another option to convert CO2 to liquid fuels.
4.2. Multi-Rreactor System
A number of studies are available where the direct hydrogenation of CO2 and CO/CO2 mixtures to hydrocarbons are reported using traditional FTS catalysts at FT reaction conditions [27]. At present there are two methods of operation favoured for commercial FTS processes [28,29,30]. The first is the high-temperature (300–350 °C) process, which employs iron-based (Fe-based) catalysts, for the production of gasoline and linear low molecular mass olefins. The second is the low-temperature (180–250 °C) process over either iron or Co catalysts, which produces high molecular weight linear waxes, which in turn can be hydro-cracked to produce diesel of high quality. Iron based catalysts are active for both WGS (R-WGS) and FT reactions [31], and are commercially used for high temperature FT (HTFT) [32]. For HTFT (300–350 °C), the water-gas shift (WGS) reaction is typically sufficiently rapid so that it nearly reaches equilibrium [12]. HTFT synthetic crude (syncrude) typically consists of more highly olefinic intermediate hydrocarbons (predominantly α-olefins) and is rich in oxygenates, such as alcohols, aldehydes, ketones and acids [33]. Olefins and oxygenates are therefore extracted for the production of chemicals [34]. In principle, iron catalysts would be ideal for use in FTS with CO2-containing syngas feeds [14,15,16,17,18,19,20,21,22,23,24,25,26,27,28,29,30,31,32,33,34,35]. Currently, the production of light alkanes [36] and alkenes [37,38] from CO2 is fundamentally a modification of HTFT, where CO2 is used instead of CO.
CO2 hydrogenation over an Fe-catalyst is active for both HTFT and WGS reactions. Thus, the introduction of an iron catalyst in the process can help overcome the challenges of co-producing methanol and hydrocarbon fuels when using the Cu and Co catalysts only.
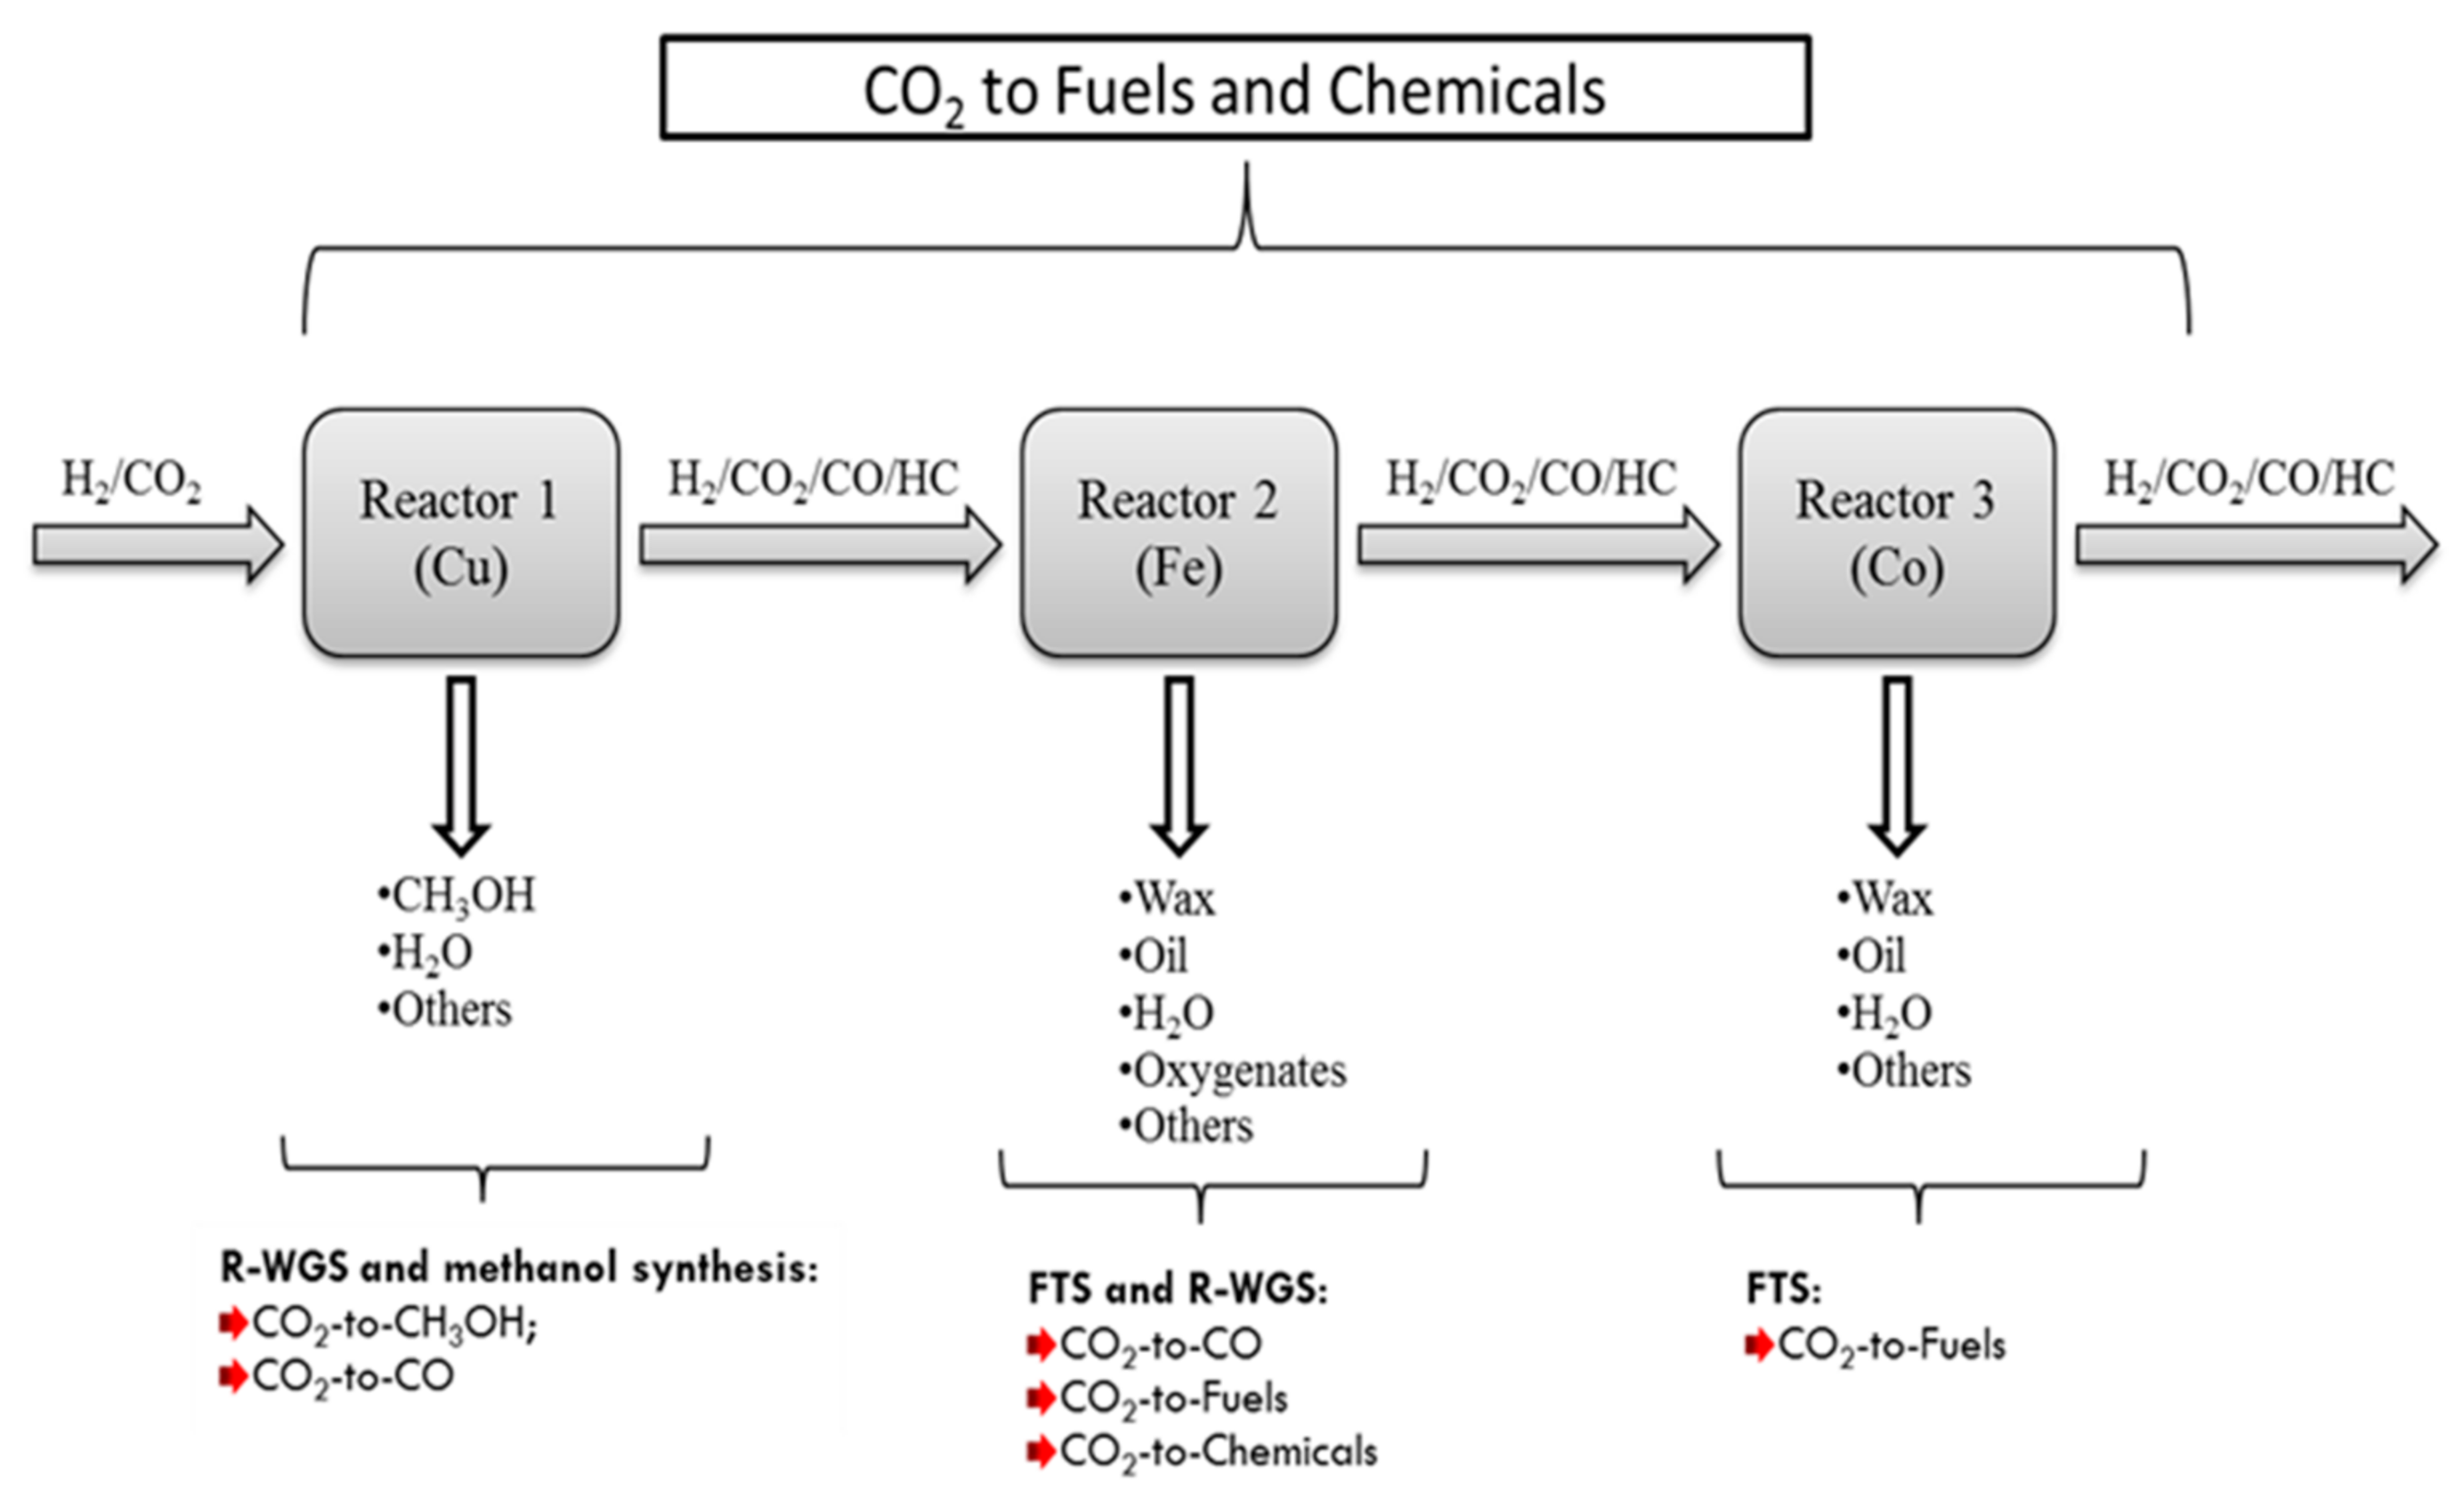
The Fe-catalyst reactor can be introduced as an intermediate between the Cu-reactor and the Co-reactor (Figure 10):
- In the first reactor, as in Case C, a Cu-based catalyst is used to convert CO2 to methanol with CO as the byproduct. In this case methanol production is favored by setting reactions conditions to low temperature and high pressure. The aqueous product (a mixture of methanol and H2O) is removed from the produced stream, and the tail gas (a mixture of H2/CO/CO2 with a small amount of CH4) is introduced into the Fe-catalyst reactor.
- HTFT occurs over an Fe-based catalyst, where the tail gas from the first reactor (H2/CO/CO2 mixture) is converted to short olefins and oxygenates. Since the feed stream does not contain water, the equilibrium limitation of the R-WGS reaction occurring in the first reactor is eliminated in the second reactor and thus more CO2 is converted to CO, and because the iron catalyst is WGS active, a new equilibrium can be rapidly reached. Part of the CO formed is consumed in FT reactions within the reactor to produce light and medium olefinic hydrocarbons with small amounts of oxygenates, and the remaining CO, goes out in the tail gas (after removal of condensable FT products and water). CO2 may also react with H2 to produce FT products on the iron catalyst depending on the amount of CO undergoing FT reaction.
- The third reactor is a low temperature FT reactor over a Co-based catalyst. This reactor receives a CO rich tail gas mixture (H2/CO/CO2) from the second reactor, thus allowing a high selectivity for heavier hydrocarbons relative to lighter ones as discussed previously. Furthermore, if CO is an undesired product, this reactor will reduce the CO to low levels by converting it to FT products.
We therefore see that the introduction of an Fe-based catalyst intermediate reactor may greatly diversify the products from the process. CO2 conversion to liquid products will be improved and methane selectivity will be reduced.
A possible improvement of the process that would make it more economical, would be to combine Reactor 1 and Reactor 2 into a single reactor. This can be done by mixing the Cu and Fe catalysts at an appropriate ratio, run the reaction at a relatively higher temperature (such as 300 °C) and high pressure, to enable sufficient methanol selectivity and iron catalyst activity. Such a process would enable heat and work integration directly between WGS, methanol and FT synthesis in a single reactor.
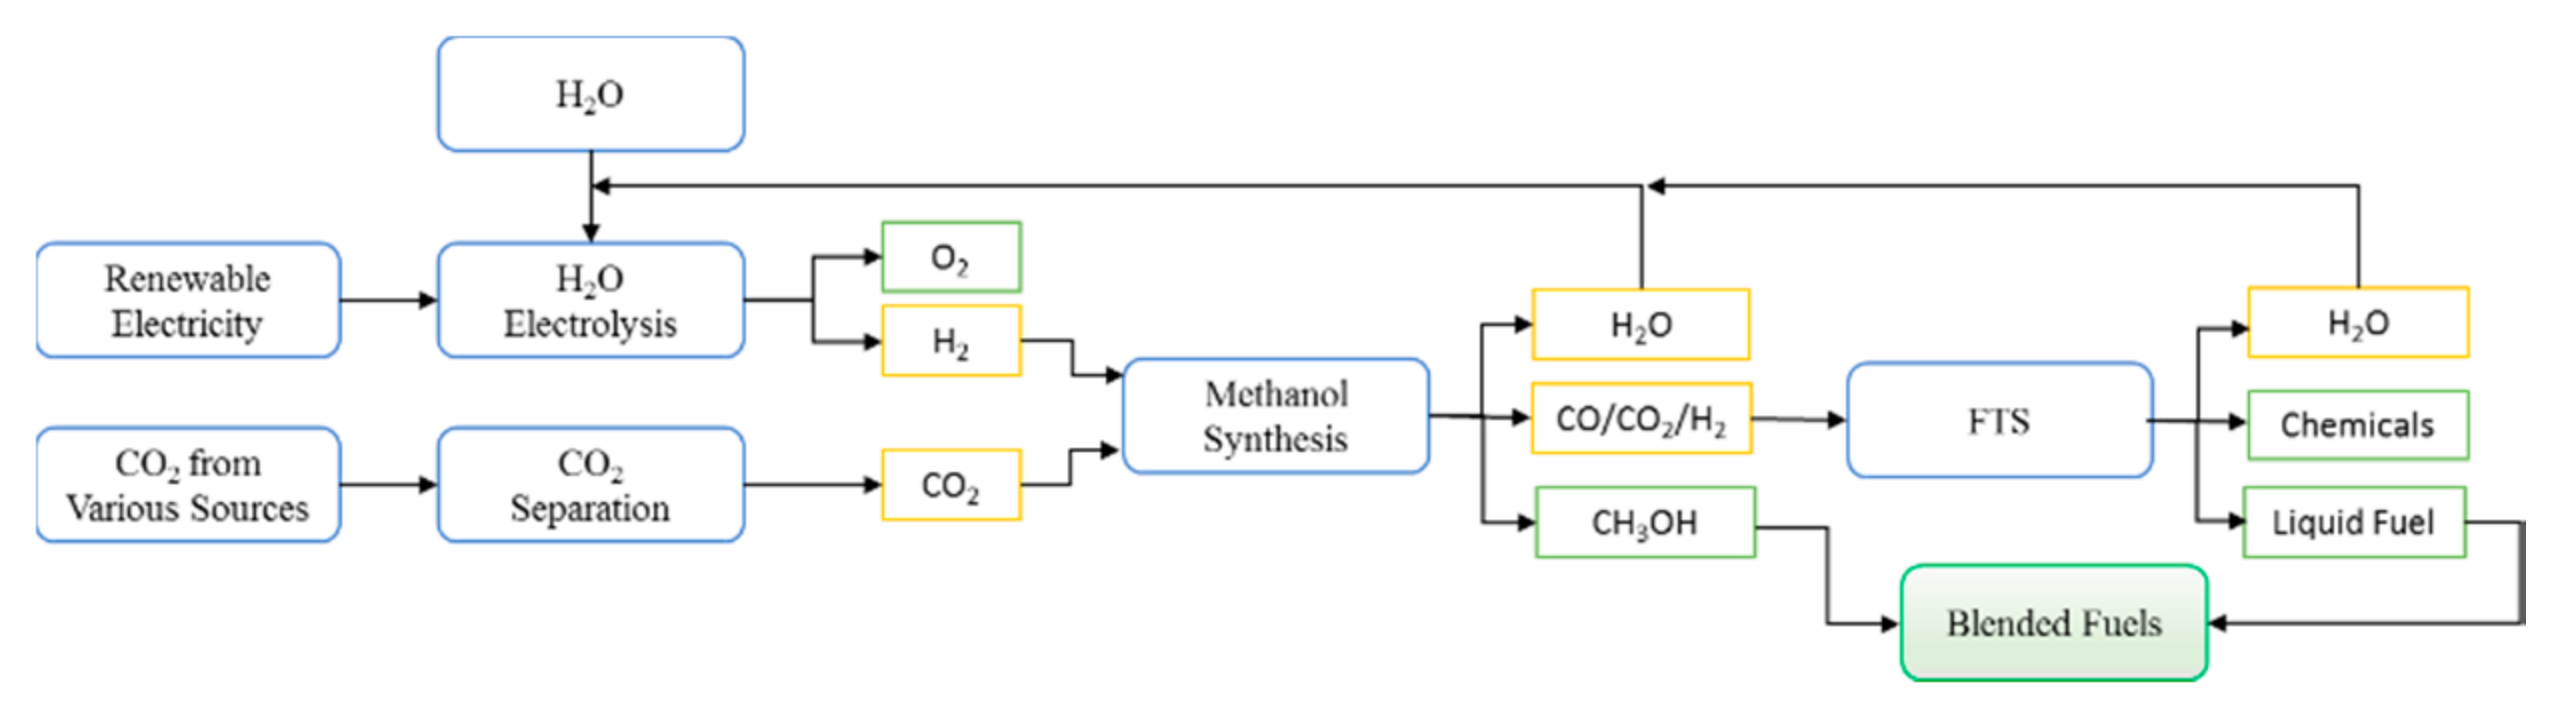
4.3. A Proposed “Greener” Process for the Conversion of CO2 to Valuable Products
Concerns over global warming have led to the search for ways of safe CO2 disposal; CO2 hydrogenation could be one of the solutions as it would act as a CO2 re-use and thereby reduce net CO2 production [14]. However this requires an environmental friendly source of H2, which will not produce more CO2, such as hydro, solar, or nuclear energy [39,40,41]. If we assume that these sources of hydrogen are available, a greener process can be proposed as shown in Figure 11, in which the methanol synthesis and FTS are combined to convert CO2 to chemicals and hydrocarbons. The proposed process is much more flexible and controls the yields of methanol and hydrocarbon products by changing the operating conditions. The water produced in each section of the process can be recycled to produce H2 to be used in the process (via electrolysis using renewable sources of energy suggested above). The diesel fuels and methanol produced from this process could be blended together with different proportions, which will reduce the greenhouse emission with zero aromatic, nitrogen and sulfur components.
Furthermore CO2 hydrogenation could also be a way of storing hydrogen in more easily transportable and safer compounds (methanol and hydrocarbons) compared to hydrogen itself, at the same time using CO2 as green source of carbon compared to conventional sources [14,17,41]. The other advantage for using CO2 as a source of carbon as opposed to CO, is that CO2 hydrogenation is less exothermic and therefore the lower heat duty will result in reduced capital and operating costs.
5. Conclusions
Two reactors configured in series were used for the hydrogenation of CO2 to methanol and hydrocarbon fuels by combining methanol synthesis, R-WGS and subsequently FTS. First, the experiments for methanol synthesis and hydrocarbon fuels were conducted in separate reactors. The reactors were then coupled in series in the second set of experiments. Experimental results for CO2 hydrogenation over the Cu-catalyst, showed that both methanol synthesis and R-WGS reactions reach equilibrium and the conversion of CO2 per pass is relatively low. Experimental results of CO2 hydrogenation over the Co-catalyst, showed a high CH4 selectivity (92.5%) and also the production of short chain paraffins with a typical low α ASF distribution. It has been previously shown that co-feeding even small amounts of CO with a H2/CO2 feed mixture can significantly change the FT product selectivity [15]. This was effectively achieved in the second set of experiments where the two reactors were coupled in series; the tail gas from the Cu-reactor, containing unreacted feed gas and CO was fed into the Co-reactor. The results showed a significant increase in the long chain hydrocarbon selectivity and an increase in the overall CO2 conversion. The two reactors in series enhanced the CO2 conversion and increased the liquid product selectivity but did not achieve the same performance as the normal FT CO hydrogenation.
Author Contributions
Conceptualization, Y.Y.; methodology, Y.Y., D.H., B.C.S. and X.L.; software, B.C.S; validation, X.L. and D.H.; formal analysis, Y.Y.; investigation, Y.Y. and B.C.S.; resources, X.L.; writing—original draft preparation, Y.Y.; writing—review and editing, D.H., B.C.S. and X.L.; supervision, D.H.; project administration, X.L.; funding acquisition, D.H.. All authors have read and agreed to the published version of the manuscript.
Funding
The authors are grateful for the support received from the University of South Africa (UNISA) and the South Africa National Research Foundation (NRF UID 95445 and 117793).
Conflicts of Interest
The authors declare no conflict of interest. The funders had no role in the design of the study; in the collection, analyses, or interpretation of data; in the writing of the manuscript, or in the decision to publish the results.
References
- Park, S.-E.; Nam, S.S.; Choi, M.J.; Lee, K.W. Catalytic Reduction of Carbon Dioxide. The Effects of Catalysts and Reductants. Energy Convers. Manag. 1995, 36, 573–576. [Google Scholar] [CrossRef]
- Yao, L.; Shen, X.; Pan, Y.; Peng, Z. Synergy between Active Sites of Cu-In-Zr-O Catalyst in CO2 Hydrogenation to Methanol. J. Catal. 2019, 372, 74–85. [Google Scholar] [CrossRef]
- Blumberg, T.; Morosuk, T.; Tsatsaronis, G. CO2-Utilization in the Synthesis of Methanol: Potential Analysis and Exergetic Assessment. Energy 2019, 175, 730–744. [Google Scholar] [CrossRef]
- Joo, O.-S.; Jung, K.-D.; Moon, I.; Rozovskii, A.Y.; Lin, G.I.; Han, S.-H.; Uhm, S.-J. Carbon Dioxide Hydrogenation to Form Methanol via a Reverse-Water-Gas-Shift Reaction (the CAMERE Process). Ind. Eng. Chem. Res. 1999, 38, 1808–1812. [Google Scholar] [CrossRef]
- Zhang, Y.; Fei, J.; Yu, Y.; Zheng, X. Study of CO2 Hydrogenation to Methanol over Cu-V/γ-Al2O3 Catalyst. J. Nat. Gas Chem. 2007, 16, 12–15. [Google Scholar] [CrossRef]
- Bahruji, H.; Bowker, M.; Hutchings, G.; Dimitratos, N.; Wells, P.; Gibson, E.; Jones, W.; Brookes, C.; Morgan, D.; Lalev, G. Pd/ZnO Catalysts for Direct CO2 Hydrogenation to Methanol. J. Catal. 2016, 343, 133–146. [Google Scholar] [CrossRef] [Green Version]
- Li, S.; Guo, L.; Ishihara, T.S.C. Hydrogenation of CO2 to Methanol over Cu/AlCeO Catalyst, Catal. Today 2020, 339, 352–361. [Google Scholar] [CrossRef]
- Lonis, F.; Tola, V.; Cau, G. Renewable Methanol Production and Use through Reversible Solid Oxide Cells and Recycled CO2 Hydrogenation. Fuel 2019, 246, 500–515. [Google Scholar] [CrossRef]
- Lange, J.-P. Methanol Synthesis: A Short Review of Technology Improvements. Catal. Today 2001, 64, 3–8. [Google Scholar] [CrossRef]
- Pérez-Fortes, M.; Schöneberger, J.C.; Boulamanti, A.; Tzimas, E. Methanol Synthesis Using Captured CO2 as Raw Material: Techno-Economic and Environmental Assessment. Appl. Energy 2015, 161, 718–732. [Google Scholar] [CrossRef]
- Farsi, M.; Jahanmiri, A. Methanol Production in an Optimized Dual-Membrane Fixed-Bed Reactor. Chem. Eng. Process. Process Intensif. 2011, 50, 1177–1185. [Google Scholar] [CrossRef]
- Zhang, Y.; Jacobs, G.; Sparks, D.E.; Dry, M.E.; Davis, B.H. CO and CO2 Hydrogenation Study on Supported Cobalt Fischer-Tropsch Synthesis Catalysts. Catal. Today 2002, 71, 411–418. [Google Scholar] [CrossRef]
- Visconti, C.G.; Lietti, L.; Tronconi, E.; Forzatti, P.; Zennaro, R.; Finocchio, E. Fischer-Tropsch Synthesis on a Co/Al2O3 Catalyst with CO2 Containing Syngas. Appl. Catal. A Gen. 2009, 355, 61–68. [Google Scholar] [CrossRef]
- Riedel, T.; Claeys, M.; Schulz, H.; Schaub, G.; Nam, S.-S.; Jun, K.-W.; Choi, M.-J.; Kishan, G.; Lee, K.-W. Comparative Study of Fischer–Tropsch Synthesis with H2/CO and H2/CO2 Syngas Using Fe- and Co-Based Catalysts. Appl. Catal. A Gen. 1999, 186, 201–213. [Google Scholar] [CrossRef]
- Yao, Y.; Hildebrandt, D.; Glasser, D.; Liu, X. Fischer-Tropsch Synthesis Using H2/CO/CO2 Syngas Mixtures over a Cobalt Catalyst. Ind. Eng. Chem. Res. 2010, 49, 11061–11066. [Google Scholar] [CrossRef]
- Shafer, W.D.; Jacobs, G.; Graham, U.M.; Hamdeh, H.H.; Davis, B.H. Increased CO2 Hydrogenation to Liquid Products Using Promoted Iron Catalysts. J. Catal. 2019, 369, 239–248. [Google Scholar] [CrossRef]
- Sempuga, B.C.; Yao, Y. CO2 Hydrogenation from a Process Synthesis Perspective: Setting up Process Targets. J. CO2 Util. 2017, 20, 34–42. [Google Scholar] [CrossRef]
- Datta, A.; Dutta, S.; Mandal, B.K. Effect of methanol addition to diesel on the performance and emission characteristics of a CI engine. J. Phys. Conf. Ser. 2014, 1, 8–13. [Google Scholar] [CrossRef]
- Zhu, L.; Cheung, C.S.; Zhang, W.G.; Huang, Z.; Zhu, L.; Cheung, C.S.; Zhang, W.G.; Huang, Z. Influence of methanol—Biodiesel blends on the particulate emissions of a direct injection diesel engine influence of methanol—Biodiesel blends on the particulate emissions of a direct injection diesel engine. Aerosol Sci. Technol. 2010, 44, 362–369. [Google Scholar] [CrossRef] [Green Version]
- Daza, Y.A.; Kuhn, J.N. CO2 conversion by reverse water gas shift catalysis: Comparison of catalyststs, mechanisms and their consequences for CO2 conversion to liquid fuels. RSC Adv. 2011, 6, 49675–49691. [Google Scholar] [CrossRef]
- De la Osa, A.R.; De Lucas, A.; Romero, A.; Valverde, J.L.; Sánchez, P. Fischer-Tropsch Diesel Production over Calcium-Promoted Co/Alumina Catalyst: Effect of Reaction Conditions. Fuel 2011, 90, 1935–1945. [Google Scholar] [CrossRef]
- Zhou, W.; Chen, J.G.; Fang, K.G.; Sun, Y.H. The Deactivation of Co/SiO2 Catalyst for Fischer-Tropsch Synthesis at Different Ratios of H2 to CO. Fuel Process. Technol. 2006, 87, 609–616. [Google Scholar] [CrossRef]
- Tavakoli, A.; Sohrabi, M.; Kargari, A. Application of Anderson—Schulz—Flory (ASF) Equation in the Product Distribution of Slurry Phase FT Synthesis with Nanosized Iron Catalysts. Chem. Eng. J. 2008, 136, 358–363. [Google Scholar] [CrossRef]
- He, Z.; Cui, M.; Qian, Q.; Zhang, J.; Liu, H.; Han, B. Synthesis of liquid fuel via direct hydrogenation of CO2. PNAS 2019, 116, 12654–12659. [Google Scholar] [CrossRef] [Green Version]
- Choi, Y.H.; Jang, Y.J.; Park, H.; Kim, W.Y.; Lee, Y.H.; Choi, S.H.; Lee, J.S. Carbon dioxide Fischer-Tropsch synthesis: A new path to carbon-neutral fuels. Appl. Catal. B 2017, 202, 605–610. [Google Scholar] [CrossRef]
- Prasad, P.S.S.; Bae, J.W.; Jun, K.W.; Lee, K.W. Fischer-Tropsch synthesis by carbon dioxide hydrogenation on Fe-based catalyst. Catal. Surv. Asia 2008, 12, 170–183. [Google Scholar] [CrossRef]
- Martinelli, M.; Visconti, C.G.; Lietti, L.; Forzatti, P.; Bassano, C.; Deiana, P. CO2 Reactivity on Fe–Zn–Cu–K Fischer–Tropsch Synthesis Catalysts with Different K-Loadings. Catal. Today 2014, 228, 77–88. [Google Scholar] [CrossRef]
- Dry, M.E. The Fischer-Tropsch Process: 1950–2000. Catal. Today 2002, 71, 227–241. [Google Scholar] [CrossRef]
- Gorimbo, J.; Muleja, A.; Lu, X.; Yao, Y.; Liu, X.; Hildebrandt, D.; Glasser, D. Lu Plot and Yao Plot: Models to Analyze Product Distribution of Long-Term Gas-Phase Fischer-Tropsch Synthesis Experimental Data on an Iron Catalyst. Energy Fuels 2017, 31, 5682–5690. [Google Scholar] [CrossRef]
- Wu, Y.; Feng, J.; Li, W. System Development of Integrated High Temperature and Low Temperature Fischer-Tropsch Synthesis for High Value Chemicals. Chem. Eng. Res. Des. 2017, 1–12. [Google Scholar] [CrossRef]
- Van der Laan, G.P.; Beenackers, A.A.C.M. Intrinsic Kinetics of the Gas-solid Fischer-Tropsch and Water Gas Shift Reactions over a Precipitated Iron Catalyst. Appl. Catal. A Gen. 2000, 193, 39–53. [Google Scholar] [CrossRef]
- Steynberg, A.P.; Espinoza, R.L.; Jager, B.; Vosloo, A.C. High Temperature Fischer–Tropsch Synthesis in Commercial Practice. Appl. Catal. A Gen. 1999, 186, 41–54. [Google Scholar] [CrossRef]
- Huang, Y.; Yi, Q.; Wei, G.; Kang, J.; Li, W.; Feng, J. Energy Use, Greenhouse Gases Emission and Cost e Ff Ectiveness of an Integrated High- and Low- Temperature Fisher-Tropsch Synthesis Plant From. Appl. Energy 2018, 228, 1009–1019. [Google Scholar] [CrossRef]
- Leckel, D. Hydroprocessing Euro 4-Type Diesel from High-Temperature Fischer-Tropsch Vacuum Gas Oils. Energy Fuels 2009, 23, 38–45. [Google Scholar] [CrossRef]
- Dry, M.E. Practical and Theoretical Aspects of the Catalytic Fischer-Tropsch Process. Appl. Catal. A Gen. 1996, 138, 319–344. [Google Scholar] [CrossRef]
- Saeidi, S.; Amin, N.A.S.; Rahimpour, M.R. Hydrogenation of CO2 to Value-Added Products—A Review and Potential Future Developments. J. CO2 Util. 2014, 5, 66–81. [Google Scholar] [CrossRef]
- Satthawong, R.; Koizumi, N.; Song, C.; Prasassarakich, P. Light Olefin Synthesis from CO2 Hydrogenation over K-Promoted Fe-Co Bimetallic Catalysts. Catal. Today 2015, 251, 34–40. [Google Scholar] [CrossRef]
- Zhang, J.; Lu, S.; Su, X.; Fan, S.; Ma, Q.; Zhao, T. Selective Formation of Light Olefins from CO2 Hydrogenation over Fe–Zn–K Catalysts. J. CO2 Util. 2015, 12, 95–100. [Google Scholar] [CrossRef]
- Hildebrandt, D.; Glasser, D.; Hausberger, B.; Patel, B.; Glasser, B.J. Chemistry. Producing Transportation Fuels with Less Work. Science 2009, 323, 1680–1681. [Google Scholar] [CrossRef]
- Milani, D.; Khalilpour, R.; Zahedi, G.; Abbas, A. A Model-Based Analysis of CO2 Utilization in Methanol Synthesis Plant. J. CO2 Util. 2015, 10, 12–22. [Google Scholar] [CrossRef]
- Prieto, G. Carbon Dioxide Hydrogenation into Higher Hydrocarbons and Oxygenates: Thermodynamic and Kinetic Bounds and Progress with Heterogeneous and Homogeneous Catalysis. ChemSusChem 2017, 10, 1–16. [Google Scholar] [CrossRef] [PubMed]
Figure 1.
Simplified flow schemes of plug flow reactors used in the experiments for Case A, Case B, Case C and modified Case C: (1) plug flow reactor; (2) hot condensable product trap (150 °C); (3) cold condensable product trap (room temperature); (4) online gas chromatograph (GC).
Figure 1.
Simplified flow schemes of plug flow reactors used in the experiments for Case A, Case B, Case C and modified Case C: (1) plug flow reactor; (2) hot condensable product trap (150 °C); (3) cold condensable product trap (room temperature); (4) online gas chromatograph (GC).

Figure 2.
The effect of the temperature on the catalytic performance for CO2 hydrogenation over a Cu-based catalyst. Reaction conditions: pressure 20 bar (gauge), flow rate 60 mL (NTP)/(min·gcat) and feed gas H2/CO2/N2 = 67.6%/22.6%/9.8%: (A) CO2 conversion, (B) product selectivity and (C) product formation rates.

Figure 3.
The predicted CO2 conversion, product selectivity and the change in the overall enthalpy of the reaction at equilibrium as a function of reaction conditions for methanol synthesis system. A: at 1 bar; B: at 20 bar; C: at 60 bar; D: at 80 bar.
Figure 3.
The predicted CO2 conversion, product selectivity and the change in the overall enthalpy of the reaction at equilibrium as a function of reaction conditions for methanol synthesis system. A: at 1 bar; B: at 20 bar; C: at 60 bar; D: at 80 bar.

Figure 4.
Comparison of the predicted equilibrium data and the experimental results for CO2 hydrogenation over a Cu-based catalyst. Reaction conditions: pressure 20 bar (gauge), flow rate 60 mL (NTP)/(min·gcat) and feed gas H2/CO2/N2 = 67.6%/22.6%/9.8%.
Figure 4.
Comparison of the predicted equilibrium data and the experimental results for CO2 hydrogenation over a Cu-based catalyst. Reaction conditions: pressure 20 bar (gauge), flow rate 60 mL (NTP)/(min·gcat) and feed gas H2/CO2/N2 = 67.6%/22.6%/9.8%.

Figure 5.
Comparison of the CO2 conversion and CO selectivity as a function of the Cu-reactor temperature in Case A and Case C: (1) Case A: CO2 hydrogenation over a Cu-based catalyst. Reaction conditions: pressure 20 bar (gauge), flow rate 60 mL (NTP)/(min·gcat) of feed gas H2/CO2/N2 = 67.6%/22.6%/9.8%, and (2) Case C: CO2 hydrogenation in a Cu-reactor and Co-reactor in series. Reaction conditions: the first reactor was loaded with a Cu-based catalyst under the following conditions: pressure 20 bar (gauge), flow rate 60 mL (NTP)/(min·gcat) of feed gas H2/CO2/N2 = 67.6%/22.6%/9.8%; the second reactor was loaded with a Co-based catalyst and received the tail gas from the first reactor at a reaction temperature of 200 °C. (A) CO2 conversion and (B) CO selectivity.

Figure 6.
Product selectivity (A) and rate of product formation (B) as a function of reaction temperature in the Cu-reactor during CO2 hydrogenation in Case C: the first reactor was loaded with a Cu-based catalyst and operated at the following reaction conditions: pressure 20 bar (gauge), flow rate 60 mL(NTP)/(min·gcat) and feed gas H2/CO2/N2 = 67.6%/22.6%/9.8%. The second reactor was loaded with a Co-based catalyst and operated at a reaction temperature of 200 °C.

Figure 7.
Comparison of the CO2 conversion and product selectivity as a function of the temperature of the Cu-reactor in Case C and Modified Case C: (1) Case C: CO2 hydrogenation in a Cu-reactor and Co-reactor in series; a condensate trap is placed between the two reactors to condense the methanol and water produced from the Cu-reactor. (2) Modified Case C: CO2 hydrogenation in a Cu-reactor and Co-reactor in series; there is no condensate trap between the two reactors. Reaction conditions: The first reactor was loaded with a Cu-based catalyst and operated under the following conditions: pressure 20 bar (gauge), flow rate 60 mL (NTP)/(min·gcat) of feed gas H2/CO2/N2 = 67.6%/22.6%/9.8%; the second reactor was loaded with a Co-based catalyst and received the gas from the first reactor; the reaction temperature was set at 200 °C. (A) CO2 conversion; (B) CO selectivity; (C) CH4 selectivity; and (D) selectivity of (C2+ + methanol).

Figure 8.
Cu-based catalyst stability testing. Reaction conditions: temperature 260 °C, pressure 20 bar (gauge), flow rate 60 mL (NTP)/(min·gcat) and feed gas H2/CO2/N2 = 67.6%/22.6%/9.8%.
Figure 8.
Cu-based catalyst stability testing. Reaction conditions: temperature 260 °C, pressure 20 bar (gauge), flow rate 60 mL (NTP)/(min·gcat) and feed gas H2/CO2/N2 = 67.6%/22.6%/9.8%.

Figure 9.
Fischer–Tropsch synthesis (FTS) product distribution over a Co-based catalyst under the following reaction conditions: pressure 20 bar (gauge), flow rate 60 mL(NTP)/(min·gcat): (1) Case B: FT CO2 hydrogenation at a temperature of 200 °C and feed gas H2/CO2/N2 = 67.6%/22.6%/9.8%; (2) Case C_1: dual-reactor in series: the first reactor was loaded with a Cu-based catalyst operated at 300°C and feed gas H2/CO2/N2 = 67.6%/22.6%/9.8%. The second reactor was loaded with a Co-based catalyst and operated at 200 °C; (3) Case C_2: Dual-reactor in series: the first reactor was loaded with a Cu-based catalyst operated at 350 °C and feed gas H2/CO2/N2 = 67.6%/22.6%/9.8%. The second reactor was loaded with a Co-based catalyst and operated at temperature of 200 °C; (4) H2/CO FTS [15]: FT CO hydrogenation at a temperature of 200 °C and feed gas H2/CO/N2 = 58.8%/30.3%/10.3% over the same Co-based catalyst as the one used in the present work.

Figure 10.
A new simplified flow scheme for hydrogenation of CO2 to fuels and chemicals (HC stands for hydrocarbons).
Figure 10.
A new simplified flow scheme for hydrogenation of CO2 to fuels and chemicals (HC stands for hydrocarbons).

Figure 11.
Schematic diagram of the conversion of CO2 to liquid fuel and chemicals by both methanol synthesis and FTS.
Figure 11.
Schematic diagram of the conversion of CO2 to liquid fuel and chemicals by both methanol synthesis and FTS.


Table 1.
Reaction and feed conditions for hydrogenation of CO2: (a) a single reactor loaded with a Cu-based catalyst (Case A); (b) a single reactor loaded with a Co-based catalyst (Case B); and (c) the two reactors in series (Case C).
Table 1.
Reaction and feed conditions for hydrogenation of CO2: (a) a single reactor loaded with a Cu-based catalyst (Case A); (b) a single reactor loaded with a Co-based catalyst (Case B); and (c) the two reactors in series (Case C).
| Items | Case A | Case B | Case C | |
|---|---|---|---|---|
| Reactor | One fixed bed | One fixed bed | Two fixed bed reactors in series | |
| Reactor 1 | Reactor 2 | |||
| Catalyst | Cu | Co | Cu | Co |
| Catalyst weight (g) | 1 | 1 | 1 | 1 |
| Feed: H2/CO2/N2 | 67.6%/22.6%/9.8% | 67.6%/22.6%/9.8% | 67.6%/22.6%/9.8% | / |
| Temperature (°C) | 200–350 | 200 | 200–350 | 200 |
| Flow rate (ml(NTP)/(min·gcat)) a | 60 | 60 | 60 | / |
| Pressure (bar gauge) | 20 | 20 | 20 | / |
a NTP stands for Normal Temperature and Pressure.
Table 2.
Summary of simulation results when both ΔH and ΔG are equal to 0 kW/mol for the methanol synthesis and reverse-water gas shift (R-WGS) system.
Table 2.
Summary of simulation results when both ΔH and ΔG are equal to 0 kW/mol for the methanol synthesis and reverse-water gas shift (R-WGS) system.
| CO2:H2 | P (bar) | T (°C) | CO2 Conversion (%) | Methanol Selectivity (%) | CO Selectivity (%) |
|---|---|---|---|---|---|
| 3:1 | 20 | 239.5 | 18.4 | 40.0 | 60.0 |
| 3:1 | 60 | 294.7 | 26.6 | 38.3 | 61.7 |
| 3:1 | 80 | 311.4 | 29.2 | 37.7 | 62.3 |
Table 3.
Catalytic performance of a Co-based catalyst: CO, CO2 and (CO + CO2) hydrogenation at 200 −°C, 20 bar gauge and 60 mL (NTP)/(min·gcat).
Table 3.
Catalytic performance of a Co-based catalyst: CO, CO2 and (CO + CO2) hydrogenation at 200 −°C, 20 bar gauge and 60 mL (NTP)/(min·gcat).
| CO2 Hydrogenation | CO Hydrogenation a | (CO+CO2) Hydrogenation a | |
|---|---|---|---|
| Feed gas | H2/CO2/N2 = 67.6%/22.6%/9.8% | H2/CO/N2 = 58.8%/30.3%/10.3% | H2/CO2/CO/N2 = 65.7%/18.3%/5.9%/9.7% |
| CO Conversion (%) | --- | 14.6 | 100.0 |
| CO2 Conversion (%) | 24.2 | --- | 13.0 |
| CH4 Selectivity (%) | 92.5 | 8.0 | 66.3 |
| C2+ Selectivity (%) | 7.5 | 92.0 | 33.7 |
| C2−4 Selectivity (%) | 6.5 | 19.8 | 24.5 |
| C5+ Selectivity (%) | 1.0 | 72.1 | 9.1 |
| O2/P2 b | 0.0 | 0.24 | 0.0 |
| O3/P3 c | 0.0 | 1.7 | 0.0 |
| O4/P4 d | 0.0 | 1.1 | 0.0 |
a: Data come from Ref. [15]. b: Olefin to Paraffin ratio with chain length 2. c: Olefin to Paraffin ratio with chain length 3. d: Olefin to Paraffin ratio with chain length 4.
Table 4.
Comparison between the present work with the results reported in the literature.
| Reactor | Catalyst | CO2 Conv (%) | CH4 Sel (%) | C5+ + CH3OH Sel (%) | CO Sel (%) | Reaction Conditions | Ref |
|---|---|---|---|---|---|---|---|
| One reactor | Co/TiO2 | 24.2 | 92.5 | 1.0 | 0.0 | H2/CO2 = 3, 200 °C, 60 ml(NTP)/(min·gcat), 20 bar | Current work |
| Two reactors in series | Cu-200_Co-200 | 23.2 | 76.4 | 17.6 | 0.0 | Reactor one: Cu catalyst; 200–350 °C; 60 ml(NTP)/(min·gcat), 20 bar; reactor two: Co/TiO2, 200 °C | Current work |
| Cu-250_Co-200 | 25.6 | 62.9 | 28.6 | 2.2 | |||
| Cu-300_Co-200 | 30.6 | 50.0 | 33.0 | 6.3 | |||
| Cu-350_Co-200 | 35.6 | 43.0 | 44.8 | 9.8 | |||
| One reactor | Co6/MnOx | 15.3 | 46.4 a | 53.2 | 0.4 | H2/CO2 = 1, 200 °C, 8 bar, no flow (batch mode), solvent: squalane | [24] |
| Co6/ZnOx | / | 80.7 a | 19.2 | 0.1 | |||
| Co6/CeOx | / | 89.8 a | 9.8 | 0.0 | |||
| Co6/AlOx | / | 94.2 a | 5.7 | 0.0 | |||
| One reactor | Co/MnO/SiO2/Pt | 18.0 | 95.0 | H2/CO2 = 2, 190 °C, 30(ml(NTP)/(min·gcat),10 bar | [14] | ||
| Fe/TiO2 | 11.5 | 33.3 | 4.4 | 35.7 | H2/CO2 = 3, 300 °C, 31.6 (ml(NTP)/(min·gcat),10 bar | ||
| Fe/Al2O3 | 22.8 | 38.3 | 7.8 | 11.4 | |||
| Fe/SiO2 | 6.9 | 23.4 | 0.1 | 71.0 | |||
| Fe-K/Al2O3 | 30.4 | 7.6 | 23.5 | 40.5 | |||
| One reactor | Fe/Cu/K | 10.8 | 9.1 | 26.9 | 39.3 | H2/CO2 = 3, 300 °C, 8 bar, 60ml/(min·gcat), 10–20 bar | [26] |
| Fe/Cu/Al/K | 11.3 | 8.5 | 27.1 | 45 | |||
| Fe/Cu/Si/K | 10.2 | 21.1 | 8.8 | 43.4 | |||
| Fe/Cu/Al/K (2) | 15.6 | 9.9 | 39.4 | 22.8 | |||
| One reactor | Fe2O3 | 14.3 | 40.2 | 1.5 | 33.2 | H2/CO2 = 3, 300 °C, 60ml/(min·gcat), 10 bar | [25] |
| CuFeO2-6 | 17.3 | 1.8 | 45.3 | 31.7 | |||
| Cu2O-Fe2O3 | 15.7 | 41.0 | 1.8 | 28.9 |
a C1-4 selectivity (%).
Publisher’s Note: MDPI stays neutral with regard to jurisdictional claims in published maps and institutional affiliations. |
© 2020 by the authors. Licensee MDPI, Basel, Switzerland. This article is an open access article distributed under the terms and conditions of the Creative Commons Attribution (CC BY) license (http://creativecommons.org/licenses/by/4.0/).
Share and Cite
MDPI and ACS Style
Yao, Y.; Sempuga, B.C.; Liu, X.; Hildebrandt, D. Production of Fuels and Chemicals from a CO2/H2 Mixture. Reactions 2020, 1, 130-146. https://0-doi-org.brum.beds.ac.uk/10.3390/reactions1020011
AMA Style
Yao Y, Sempuga BC, Liu X, Hildebrandt D. Production of Fuels and Chemicals from a CO2/H2 Mixture. Reactions. 2020; 1(2):130-146. https://0-doi-org.brum.beds.ac.uk/10.3390/reactions1020011
Chicago/Turabian StyleYao, Yali, Baraka Celestin Sempuga, Xinying Liu, and Diane Hildebrandt. 2020. "Production of Fuels and Chemicals from a CO2/H2 Mixture" Reactions 1, no. 2: 130-146. https://0-doi-org.brum.beds.ac.uk/10.3390/reactions1020011