Article

Adsorption-Based Hydrogen Storage in Activated Carbons and Model Carbon Structures

1
M.M. Dubinin Laboratory of Sorption Processes, A.N. Frumkin Institute of Physical Chemistry and Electrochemistry (IPCE RAS), Russian Academy of Sciences, 31, Build. 4, Leninsky Prospect, 119071 Moscow, Russia
2
GAZPROM PJSC, BOX 1255, 190900 St. Petersburg, Russia
3
UNESCO “Green Chemistry for Sustainable Development”, Institute of Chemistry and Problems of Sustainable Development, D. Mendeleev University of Chemical Technology, Miusskaya Sq., 9, 125047 Moscow, Russia
*
Authors to whom correspondence should be addressed.
Submission received: 27 April 2021 / Revised: 25 June 2021 / Accepted: 5 July 2021 / Published: 7 July 2021
(This article belongs to the Special Issue Hydrogen Production and Storage)

Abstract

:
The experimental data on hydrogen adsorption on five nanoporous activated carbons (ACs) of various origins measured over the temperature range of 303–363 K and pressures up to 20 MPa were compared with the predictions of hydrogen density in the slit-like pores of model carbon structures calculated by the Dubinin theory of volume filling of micropores. The highest amount of adsorbed hydrogen was found for the AC sample (ACS) prepared from a polymer mixture by KOH thermochemical activation, characterized by a biporous structure: 11.0 mmol/g at 16 MPa and 303 K. The greatest volumetric capacity over the entire range of temperature and pressure was demonstrated by the densest carbon adsorbent prepared from silicon carbide. The calculations of hydrogen density in the slit-like model pores revealed that the optimal hydrogen storage depended on the pore size, temperature, and pressure. The hydrogen adsorption capacity of the model structures exceeded the US Department of Energy (DOE) target value of 6.5 wt.% starting from 200 K and 20 MPa, whereas the most efficient carbon adsorbent ACS could achieve 7.5 wt.% only at extremely low temperatures. The initial differential molar isosteric heats of hydrogen adsorption in the studied activated carbons were in the range of 2.8–14 kJ/mol and varied during adsorption in a manner specific for each adsorbent.

1. Introduction

A global transformation of the energy sector involves decarbonization, which is intended to reduce greenhouse gas emissions by 25–40% by 2030 compared to 1990 or 2005 (as a part of the Paris agreement), as well as an increase in the share of renewable energy manifold [1]. Hydrogen offers one of the most efficient ways to provide long-term energy storage. As a fuel, hydrogen is characterized by high specific energy on a mass basis (energy efficiency) and environmental safety; combined with the unlimited resource base, these features make it an advanced alternative for fossil fuel systems [2,3]. Indeed, hydrogen as an energy source can be used for a variety of applications such as power and manufacturing industries, transport, and housing maintenance and utilities. According to various estimates reported in [3], by 2050, the share of hydrogen in the global energy balance may be within the range of 7–24%.
However, its wide utilization in practice is problematic because of the low density in the gaseous state under atmospheric pressure and the second lowest (after helium) liquefaction temperature (Tb = 20.38 K). The extensive use of hydrogen as an environmentally friendly energy source depends on how successfully the problems of its efficient storage and transportation will be solved. Additionally, its high explosion hazard requires the development of efficient and safe facilities.
Methods of hydrogen storage can be divided into two groups [2,4]. The first group involves the storage methods for hydrogen in the high-density state based on physical processes of compression at high pressures and liquefaction at cryogenic temperatures. These methods store hydrogen in a molecular state, in which it weakly interacts with the storage medium. The high-pressure (300–700 bar) gaseous hydrogen storage needs to use special steels and composite materials to ensure increased strength for the gas vessels and power-consuming fueling equipment. The storage of hydrogen at 20.38 K in the liquefied state provides a high density of ~700 m3 (NTP (m3(NTP)·m−3 is cubic meter of hydrogen at normal temperature and pressure (293 K, 101 kPa) referred to cubic meter of the storage system volume.)/m3) [2], but the liquefication process consumes more than 30% of the overall energy content. This technique is favorable for gas transportation in large volumes. The storage system should always be open for the drainage of evaporating hydrogen, which creates additional problems concerning fire and explosion safety and results in gas losses during storage.
The second group of hydrogen storage methods includes those using physicochemical (or chemical processes). Among them are chemical interactions that afford, for example, such compounds as metal hydrides [5,6], organic or chemical hydrides [7], ammonia [8], and alloys based on magnesium and nickel [9,10,11], LaNi5 [12], and silicon [13]. The disadvantages of these methods are the high energies that must be supplied to the hydrogen recovery systems, susceptibility to impurities, and extremely large mass of sorbing materials.
Attempts to use hydrogen as motor fuel for an internal combustion engine vehicle led to the estimation of the necessary volumetric density of a hydrogen system not lower than 62 kg of H2 per m3 of the storage system capacity or 695 m3 (NTP)/m3, which is equivalent to 6.5 wt.% [14]. This system must operate at 233–358 K and 0.3–10 MPa. In this case, the high fire and explosion safety of this system should be provided. The new perspective trend of using hydrogen batteries in pilotless vehicles with electrochemical fuel cells also demands high hydrogen storage parameters [15,16].
Systems in which hydrogen storage is based on physical adsorption can satisfy the entire range of the requirements mentioned above. The adsorbed hydrogen storage in highly active microporous adsorbents can be used to fabricate energy-capacitive, explosive safe, lightweight, and economic hydrogen batteries. In these microporous materials, adsorbed hydrogen exists in the adsorption field created by overlapped fields of opposite micropore walls of the solid body. The pore diameter (width) is comparable to the sizes of sorbed molecules. In such pores, adsorption occurs via the mechanism of the volume filling of micropores caused by the superposition of potential fields [17]. Generally, the adsorption energy is determined by the interactions of adsorbate molecules with the adsorbent surface and the adsorbate–adsorbate interactions with the formation of adsorption associates [18,19,20].
The explosive hazard of microporous adsorbent–hydrogen systems can virtually be excluded due to the high degree of gas dispersion by the microporous structure of an adsorbent. In this case, each micropore contains, on average, from one to several dozens of hydrogen molecules, and their diffusion is impeded [21]. Adsorbed hydrogen exists in the bound state. Physical adsorption is reversible and requires no significant energy consumption for desorption.
In recent decades, serious attention has been paid to studies of hydrogen adsorption, which were intended to solve energy storage problems. Hydrogen adsorption was examined on various microporous adsorbents: zeolites [22,23], metal–organic and covalent–organic frameworks (MOFs and COFs) [24,25,26], activated carbons (ACs) [27,28,29,30,31,32], and nanodispersed carbon materials, i.e., carbon nanotubes (CNT) [33,34,35,36], carbon nanofibers [33,34,37], and graphene structures [38,39,40].
Figure 1 demonstrates a diagram of the physical adsorption-based hydrogen storage systems using various nanoporous carbon materials compared with the target density and that provided by compressed storage. We do not show the excellent data for hydrogen adsorption capacities demonstrated by MOFs and COFs [24,25,26] due to technical challenges to scaling up their manufacturing.
According to numerous predictions, carbon single- and multiwall nanotubes (SWCNTs and MWCNTs) are promising adsorbents for hydrogen storage systems [33,34,43]. A rich set of experimental data indicate a significant impact of structure on the hydrogen adsorption capacity of CNTs. For example, according to the calculations confirmed by experimental data, the closed SWCNTs with a perfect graphite layer arranged like a bunch in the triangular packing via coordinating by cumene molecules demonstrated an extremely high hydrogen gravimetric capacity at 20 MPa, increasing from 23 wt.% at 400 K to 38 wt.% at 77 K due to secondary porosity [36]. Different ways of CNT functionalization to improve their hydrogen capacity were analyzed by Dillon and Heben [43] and Mohan et al. in a recent review [45].
Various graphene materials are also considered to be potential adsorbents for hydrogen storage, which can be realized by physical adsorption and chemosorption. The experimentally measured amounts of adsorbed hydrogen in graphene structure at room temperatures have been relatively low (<3 wt.%); the best experimental results and theoretical predictions were summarized by Tozinni and Pelegrinni [39] and, more recently, by Alekseeva et al. [40].
As follows from most of these studies, some results of which are provided in Figure 1, the available data on the hydrogen capacity of ACs can be arranged into two groups: 0.3–2 wt.% (at room temperatures) and 2–9 wt.% (at cryogenic temperatures) [30,44,45,46,47,48]. For example, Fomkin et al. observed the value of hydrogen adsorption of 6.2 wt.%, which was close to the DOE target, for microporous carbon adsorbents at a temperature of 77 K and pressures up to 10 MPa [44]. Exceptional gravimetric and volumetric capacities (7 wt.% and 50 g/L, respectively) were obtained for the densified zeolite templated carbons at 77 K and 2 MPa [47]. The mechanical compaction of the powdered polymer-derived activated carbon also resulted in the high values of hydrogen adsorption capacity, whereas using PVA as a binder reduced the adsorbent efficiency [48]. However, when analyzing these achievements, one should take the premise that all investigations of promising adsorbents aim to develop an effective hydrogen storage system operating at near ambient temperatures and not extremely high pressures. However, at room temperatures (293–303 K), the amounts of adsorbed hydrogen on industrial carbon adsorbents were found to be no higher than 2%, and the filling of the micropore volume was about 15–20% [44]. This fact implies that hydrogen adsorption energy is mainly determined by the interactions of hydrogen molecules with the adsorbent surface and that the energy of association of hydrogen molecules in micropores is low. Thus, like a porous structure, the surface chemistry of a carbon adsorbent, namely its heterogeneity, is essential for the hydrogen adsorption capacity [30,44,45]. Numerous studies have provided evidence that both a precursor and synthesis route determine the surface chemistry and porous structure of AC [49,50,51,52] and, consequently, its adsorption behaviors [33,52]. In terms of the theory of volume filling of micropores (TVFM) developed by Dubinin [17,53], the adsorption capacity of a microporous adsorbent is determined by the structural and energy parameters of its porous structure, namely micropore volume, pore width, and characteristic energy of adsorption. Additionally, the amount of adsorbed molecules in this adsorbent can be maximized by choosing the optimum thermodynamic conditions [54].
The above analysis of the possibilities of the hydrogen storage methods motivated us to study hydrogen adsorption on several nanoporous carbon adsorbents of various origins that differed in the porous structure and chemical state of the surface at the near ambient temperatures and not-extreme high pressures. Therefore, this study was aimed to determine the factors affecting the efficiency of hydrogen adsorption-based storage with AC as an adsorbent, namely the influence of thermodynamic conditions and structural and energy characteristics. For this purpose, we first evaluated the structural and energy characteristics of the model microporous carbon structures and a series of ACs. Then, we examined the effect of thermodynamic conditions on the hydrogen adsorption capacity by comparing the experimental data for ACs as a function of temperature and pressure with the results of calculations for the model carbon structures by the TVFM. Finally, we considered the heat effects of the hydrogen adsorption processes in the ACs by estimating the essential thermodynamic parameter: the differential molar isosteric heat of adsorption.

2. Materials and Methods

2.1. Microporous Carbon Adsorbents

2.1.1. Activated Carbons

The microporous carbon adsorbents PAC-700, AUK, FAC-3, FAC-2008, and ACS of diverse genesis were studied. The carbon adsorbent PAC-700 was prepared by the thermal decomposition of poly(vinylidene chloride) in an inert gas followed by the gas-vapor activation with overheated water vapor at ~1100 K [55]. The microporous carbon adsorbent AUK was synthesized from silicon carbide (SiC) at ~1173 K by thermochemical leaching of silicon in a chlorine flow to form volatile SiCl4 [55,56]. The ACs of the FAC type, FAC-3 and FAC-2008, were prepared by the liquid-phase polymerization of furfural as round spherical grains 0.2–3 mm in diameter, carbonization in an inert gas medium at ~1073–1123 K, and gas-vapor activation of the granules with overheated water vapor and CO2 at 1173 K [57]. The KOH thermochemical activation of a mixture of phenol formaldehyde resin, corn dextrin, and ethylene glycol at 750 °C was used to produce the ACS carbon adsorbent [58].

2.1.2. Model Porous Carbon Structures

A slit-like pore model is often employed to describe the porous structure of microporous activated carbons [53,59]. According to this model, micropores are formed in graphite-like nanocrystallites via the burnout of individual layers of hexagonal carbon through the high-temperature steam activation process (Figure 2).
The effect of burnout selectivity during the high-temperature steam activation at 1073–1173 K is caused by the different chemical activities of hexagonal carbon layers in graphite-like structures. The distance between hexagonal layers in graphite (denoted as c in Figure 2) is 0.335 nm [60], the density of crystalline graphite (ρgr) is 2.267 g/cm3 [50], and the surface density of carbon atoms in the hexagonal layer of graphite (ρac) is 0.3818 atom Å−2. In our calculations, we used a model cell of an activated nanocrystallite with the pores resulting from the burnout of the prescribed number of the burned-out layers; the walls of the pores were set to be composed of one or two carbon hexagonal layers. The size of a carbon atom is 0.142 nm [61]. Thus, we obtained the model micropores separated by a single-layer carbon wall during the sequential burnout of one of three (AC 1:3) (see Figure 2), two of four (AC 2:4), and so on to seven burnt carbon layers (AC 7:9). The number of burned-out layers in the elemental graphite crystal is restricted by a maximal pore size of 3.0–3.2 nm, imposed by Dubinin’s definition for micropores [53], where adsorption proceeds via the volume filling mechanism.
It should be noted that the synthesis of microporous carbon adsorbents with pores separated by the single-layer carbon walls is practically impossible because of the high reactivity of carbon. Therefore, we considered these model structures only as a reference point for the theoretically possible limiting adsorption in micropores of specified width.

2.2. Hydrogen

Gaseous hydrogen of the extra-pure grade was used. Hydrogen has the following physicochemical characteristics [2]: temperature of triple point Ttr = 13.95 K, temperature of normal boiling Tb = 20.38 K, critical temperature Tc = 33.23 K, critical pressure Pc = 13.16 bar, and density of liquid hydrogen at boiling point ρ = 0.0708 g/cm3.

2.3. Measurement of Hydrogen Adsorption

Hydrogen adsorption was measured by the volumetric–gravimetric method using the setup described in [62] according to the recently reported route [63]. The range of temperatures from 303 to 363 K and pressures up to 20 MPa were chosen to be close to the DOE target. The measured value of adsorption was corrected to a skeletal volume of the carbon adsorbents (~2.0 g/cm3) determined via helium pycnometry [64]. The amount adsorbed was calculated as the absolute content of the adsorbate in micropores as follows:
a = ( N ( V V a ) · ρ g ) / ( μ · m 0 )
where N is the amount of hydrogen introduced into a measuring unit (g), V is the total geometric volume of the measuring system (cm3), Va is the volume of an adsorbent with micropores (cm3), ρg is the density of gaseous phase (g/cm3) at specified values of pressure P and temperature T, μ is the molar mass of gas (mmol/g), and m0 is the mass of a regenerated adsorbent (g). The volume of the adsorbent with micropores (Va (cm3)) was calculated as a sum of a volume determined via helium pycnometry (VHe (cm3)) and product m·W0, where micropore volume (W0 (cm3/g)) is evaluated from the adsorption data for benzene standard vapors at 293 K using the TVFM equation [53] (see below).
Before the experiments, the adsorbents were regenerated at the temperature of 573 K and pressures less than 0.01 Pa. The inaccuracy of adsorption measurement was ~±0.1%.

3. Results and Discussion

3.1. Structural and Energy Characteristics of the Model and Real Carbon Adsorbents

The structural and energy characteristics (SEC) of the activated carbons, i.e., micropore volume (W0 (cm3/g)), characteristic energy of adsorption (E (kJ/mol)), and effective half-width of micropores (x0 (nm)), were calculated from the isotherms of adsorption of standard benzene vapors at 293 K represented in the coordinates of the well-known Dubinin–Radushkevich (D–R) equation [53] offered by the TVFM:
a = a 0 exp [ ( A / E 0 ) 2 ]
where a is the value of adsorption (mmol/g) ,   A = R T l n ( P s / P ) (kJ/mol) is the differential molar work of adsorption, Ps is the saturation pressure, a0 (mmol/g) is the limiting value of adsorption at the temperature T (K), W0 is calculated from a0 under the assumption that density of the adsorbate (ρad) is equal to the liquid density (ρL) at Ps/P = 1: W0 = a0/ρL. According to the TVFM, the effective slit-like micropore half-width x0 (nm) is related to the characteristic adsorption energy of standard benzene vapor E0 as follows: x0 = 12/E0.
Table 1 shows a comparison of the AC adsorbents for the parameters of their porous structure, including the specific BET surface calculated by the well-known BET equation [65]. The data pointed to the significant differences in the porous structures of the adsorbents, which were obviously related to the discrepancies both in the precursors and synthesis conditions. The KOH thermochemical activation of the mixture of polymers at the lowest activation temperature yielded a highly microporous adsorbent ACS with a bimodal porous structure, including mesopores. At the same time, the gas-vapor activation at higher temperatures enabled the formation of PAC-700 and AUK with significantly less developed porous structures. All these samples were chosen for hydrogen adsorption measurements in order to reveal the effect of SEC on hydrogen capacity. The packing density of the AC adsorbents, ρ (kg/m3) was determined in accordance with the Russian State Standard (GOST R 55959): Activated Carbon test method for bulk density [66].
Table 2 represents the density of the model adsorbents (ρads) calculated for each structure from the number of carbon layers and the density of crystallite graphite in the model unit cell, and their SEC values were evaluated using the previously reported relationships [54,59]:
2 x 0 = ( n + 1 ) · c q · d ;   W 0 = 2 x 0 ( b + c ) b · ρ gr · q · c ;   E 0 = 12 x 0 .
where n is the number of burned-out carbon layers (degree of activation), d is the diameter of a carbon atom, q is the number of layers composing the pore walls, and b is the size of a model graphite crystal. As mentioned in Section 2.1.1, we considered two cases: q = 1 and 2.
The characteristic adsorption energy of hydrogen was determined as E = βE0, where β = Π/Π0 = 0.165 is the affinity coefficient determined as the ratio of parachors of the studied vapor (hydrogen) Π to standard benzene vapor Π0 at the boiling points. The parachor of hydrogen was calculated according to the well-known formula by Sugden [67]:
Π = M σ 1 / 4 ρ l ρ v a p o r = 34.24   J 1 / 4 cm 5 / 2 / mol   ,
where M is the molar mass of hydrogen (g/mol), σ is the surface tension of hydrogen (mJ/m2) and ρl and ρvapor are the densities of liquid and vapor at the boiling point, respectively (g/cm3). The value of the parachor for benzene was determined from atomic fractions: Π0 = 207.1 J1/4cm5/2/mol.
As follows from Table 2, the increase in the number of burned-out graphite layers from AC 1:3 to AC 7:9 in both cases of q logically resulted in the expansion of pores accompanied by an increase in the pore volume. The characteristic energy of adsorption decreased by almost five times. The density of the model adsorbents decreased threefold.
When the wall thickness doubled, the density of the adsorbent increased by a factor of ~1.33 (compare AC 1:3 and AC 1:5) and ~1.78 (AC 7:9 and AC 7:11), and, consequently, the pore volume decreased twofold. The increase in the pore wall thickness of the model adsorbents had no effect on the characteristic energies of adsorption (E0 and EH2) since the pore widths coincided.

3.2. Hydrogen Adsorption

3.2.1. Hydrogen Adsorption in the Model Carbon Adsorbents

In order to search for the best carbon adsorbents with optimum SEC values, we calculated the hydrogen adsorption on the model carbon structures with the single-layer pore walls at 20.38 K and 101 kPa (see Table 3) using TVFM equations. When employing the D–R Equation (2), we assumed that:
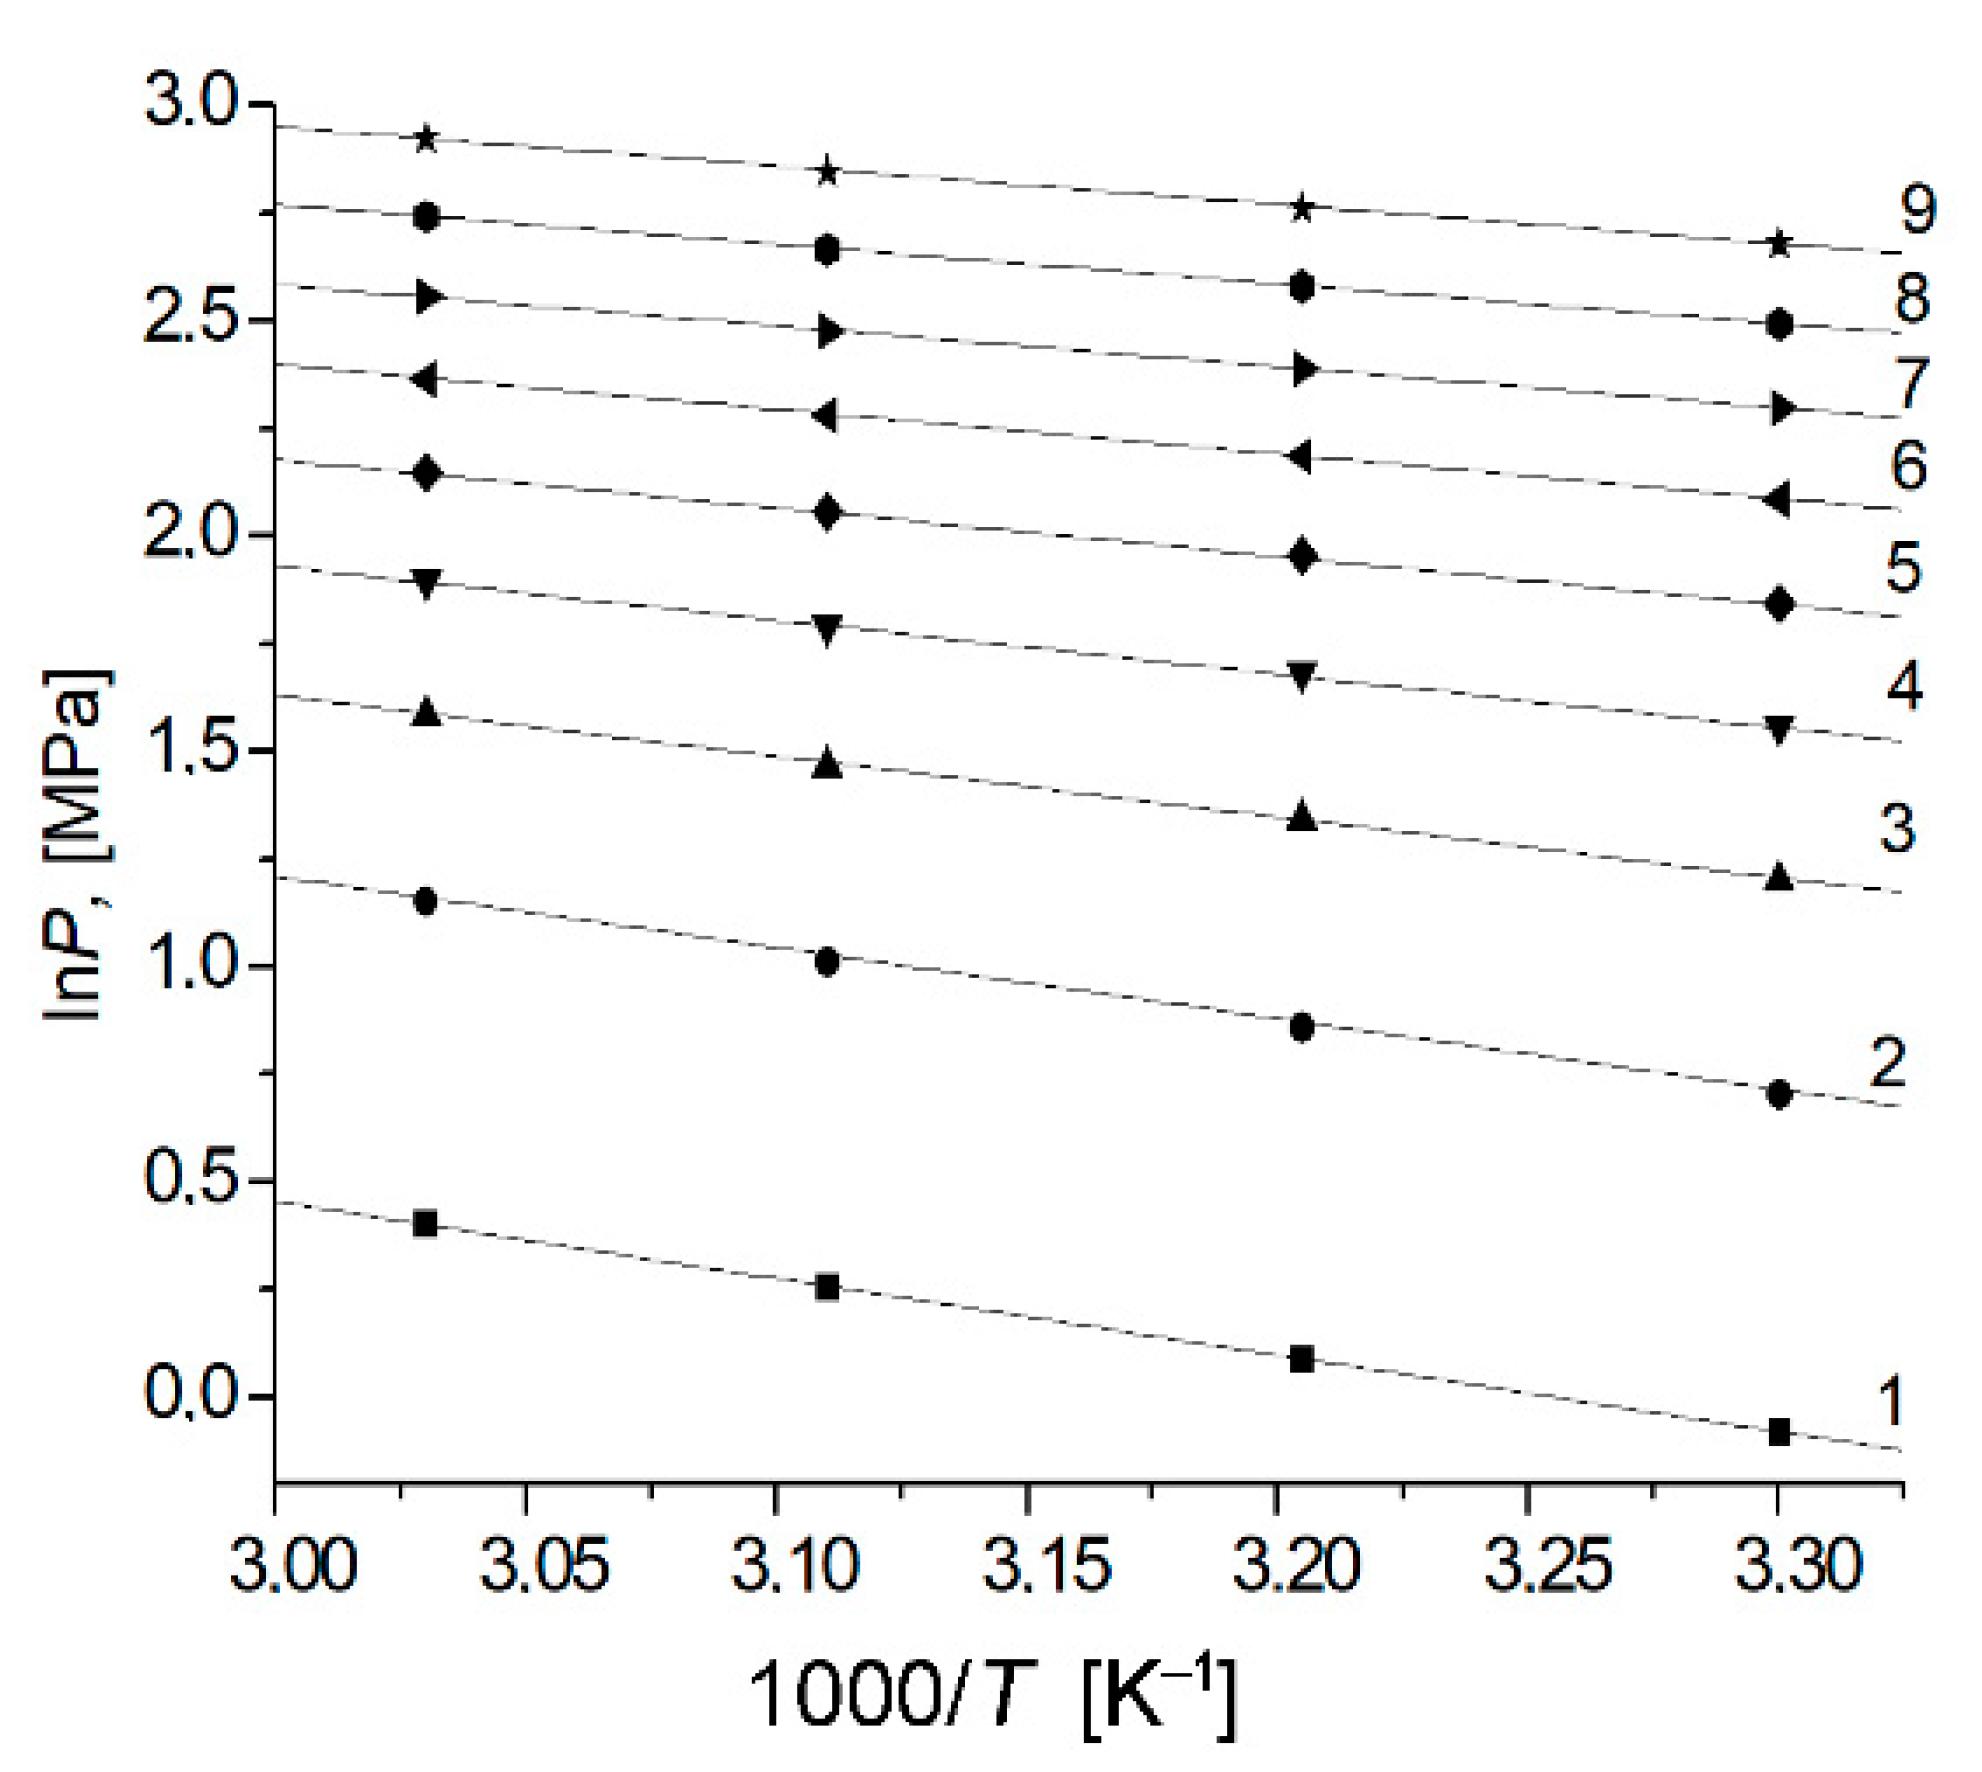
  • The differential molar work of adsorption was calculated as A = RTln(fs/f) using reference data for hydrogen. Here, R is the universal gas constant, fs is the volatility of saturation vapor of hydrogen, and f is the volatility of an equilibrium phase.
  • For the temperatures T within a range from the boiling point Tb to the triple point temperature TTP on the saturation line, we assumed that the density of an adsorbate (ρad) was equal to the density of the liquid, ρl. Therefore, the limiting value of hydrogen adsorption was calculated as follows: a0(T) = W0·ρl.
In our calculations, we used the data from Table 2. As follows from the results summarized in Table 3, at 20.38 K, except for AC 1:3, all model carbon structures demonstrated high efficiencies of hydrogen storage.
Then, we considered the action of temperature on their hydrogen capacity by calculating the gravimetric capacity versus pore width for different P,T-conditions (see Figure 3a–c).
For higher temperatures, from Tb to the critical temperature Tc, the temperature dependence of the limiting amount of adsorbed hydrogen was calculated from the Dubinin–Nikolaev formula [68]:
a 0 ( T ) = a 0 ( T b ) exp [ α ( T T b ) ]
where a0(Tb) is the limiting amount of adsorbed substance at the boiling point and α = −(dlna0/dT)Ps is the thermal coefficient of limiting adsorption (1/K). For hydrogen, the value of α = 4.87 × 10⁻³ 1/K was evaluated from the empirical dependence of the isosteric heat of adsorption at the medium micropore loading of carbon adsorbents, which was established for various adsorbates [69].
The isotherms of hydrogen adsorption over the region of supercritical temperatures were calculated by Equation (2), where the saturated pressure (Ps) was determined by the linear extrapolation of a function:
ln P s ( T ) = M N T ,
where M and N are the constants that can be evaluated for hydrogen from two characteristic points (Tb, Ps) and (Tcr, Pcr). The limiting adsorption a0 at the saturation pressure was found by linear extrapolation of the Dubinin–Nikolaev Equation (5).
It follows from the data in Figure 3a for gravimetric hydrogen capacities at room temperature that the GH2 = f(X0) functions had a maximum. With an increase in pressure, the width of the maximum increased, and its position shifted towards the wider pores. The decrease in temperature resulted in the transformation of the extremal dependences of GH2 = f(X0) to the increasing ones over the entire pressure range (Figure 3b,c). More specifically, it can be noted that at room temperature and the pressures of 10 and 20 MPa, the structures with small pore sizes in the range of 0.6–0.7 nm were the most optimal adsorbents for hydrogen storage, whereas, at 27 MPa, the highest hydrogen density was achieved in the structures with the pore sizes of about 1.8 nm (AC 5:7). It should be noted that with a decrease in temperature to 77 K (Figure 3c), except for AC 1:3, all other model structures demonstrated a gravimetric capacity exceeding the DOE target value. In other words, a high gravimetric density of adsorbed hydrogen in the model carbon structures resulted from an optimum combination of the SEC values and thermodynamic parameters (pressure and temperature) of the storage system.
Since the increase in the pore wall thickness of the model adsorbents did not affect the characteristic energy of adsorption EH2, we suggest that a decrease in the values of hydrogen adsorption in the model structures with the double-layer pore walls was only caused by a contraction of the pore volume.

3.2.2. Hydrogen Adsorption in the Activated Carbons

The measurements of hydrogen adsorption in the studied AC samples over the temperature range of 303–368 K up to the pressure of 20 MPa revealed a smooth increase of the amount of adsorbed hydrogen with increasing pressure without a tendency to saturation, even at 20 MPa. Figure 4a,b demonstrates the experimental isotherms of hydrogen adsorption in all the AC samples at 303 and 333 K.
Hydrogen adsorption was found to be reversible for all the adsorbents, and its value decreased with the temperature rise. As follows from the analysis of all the isotherms, the ACS sample is the most efficient adsorbent for hydrogen storage.
Table 4 summarizes the amounts of adsorbed hydrogen (gravimetric capacity GH2 (wt.%)) on the studied samples measured at 303 K and 10 and 20 MPa, as calculated by TVFM equations for the normal boiling point (20.38 K and 101 kPa). It can be seen that for all the ACs, the gravimetric capacity at 303 K and 10 MPa was about 20% of the limiting amount adsorbed at the normal boiling point. One can compare these values with that evaluated for the model carbon structure AC 3:5, which appeared to be the most efficient adsorbent at room temperature and 20 MPa (see Figure 3a)
It follows from Table 1 and Table 4 that the adsorbents with the wider pores, higher pore volume, and higher specific BET surface exhibited the higher gravimetric capacity. However, even the maximum experimental values of GH2 for ACS at 10 and 20 MPa were significantly lower than the DOE requirements [14]. According to Table 4, the gravimetric capacity of ACS exceeded the DOE target only under the P,T-conditions corresponding to the boiling point. However, maintaining such low temperatures is an energy-consuming process.
Figure 5 illustrates the relationship between the gravimetric and volumetric capacities of the carbon adsorbents, which differed in their SEC values and density (see Table 1) at the conditions indicated in Table 4.
An analysis of Table 4 and Figure 3, Figure 4 and Figure 5 leads us to the following conclusion that at commonly accepted industrial temperatures (237–333 K) and moderate pressures, microporous carbon adsorbents with the most developed porosity do not ensure a substantial improvement of the efficiency of the hydrogen storage. Indeed, as follows from Table 1 and Table 4, the increase in the micropore size and, consequently, micropore volume reduces the main advantage of microporous adsorbents, namely the high level of adsorption energy caused by overlapping of the potential fields of opposite pore walls. In addition, it leads to a decrease in the adsorbent density and, consequently, affects its volumetric capacity. In our previous work, we observed and analyzed a similar dependence of the volumetric methane capacity of carbon adsorbents on the packing density [70].
It should be noted that in addition to the variations in the thermodynamic parameters of the hydrogen storage system, another way to improve its efficiency is to optimize the porous structure of the adsorbent and to change the chemical state of the adsorbent via surface modification, thereby increasing the energy of hydrogen/adsorbent interactions. In this regard, it seems reasonable to analyze the differential molar isosteric heat of hydrogen adsorption, which is one of the important thermodynamic parameters of the adsorption system, as a function of the amount of adsorbed hydrogen. This function reflects the variations in the ratio between the adsorbate-adsorbent and adsorbate-adsorbate interactions during the adsorption process.

3.3. Thermodynamics of Hydrogen Adsorption in the Carbon Adsorbents

One of the adsorption characteristics of an adsorbent that provides a significant amount of adsorbed hydrogen at ambient conditions is the heat of adsorption [43]. Indeed, it is related to the intensity of binding hydrogen with the adsorbent surface. In other words, the higher the heat of adsorption, the stronger the hydrogen interacts with the adsorbent and less pressure or cooling is required to reach the same amount of adsorbed hydrogen.
According to the definition [71,72], the differential molar isosteric heats of adsorption, qst, is determined as a difference between the molar enthalpy of the gas phase, hg, and differential molar enthalpy of the adsorption system, H a = ( H 1 a ) T :
q st = h g H a
The heat of adsorption was calculated by the known equation [72,73] that considers the nonideal character of the gas phase at high pressures and noninert character of the adsorbent during adsorption:
q st = R · Z · [ ( l n P ) ( 1 / T ) ] a · [ 1 ( V a a ) T / v g ] ( P a ) T · [ V a T · ( V a T ) a ]
where R is the universal gas constant (J/(mol·K), Z = P·vg/(RT) is the compressibility of an equilibrium gas phase at pressure P (Pa) and temperature T (K), vg is the specific gas phase volume (m3/kg), Va = V0 (P,T)/m0 is the reduced volume of the adsorbent/adsorbate system (cm3/g), and V0 and m0 are the volume and mass of the regenerated adsorbent, respectively. Thus, Formula (7) considers isothermal adsorption-induced deformation (∂Va/∂a)T, temperature isosteric deformation (∂Va/∂T)a, the slopes of the isotherm of adsorption (∂P/∂a)T and isosteres (∂lnP/∂ (1/T))a, and the non-ideality of a gas phase or compressibility Z.
Estimations have shown that for adsorption of gases in the temperature range significantly exceeding the critical temperature—for the adsorption of hydrogen, in particular—the relative adsorption deformation of the adsorbents does not exceed 1% [74,75,76]. The temperature-induced deformations of the carbon adsorbents are negligible. In addition, the differential molar volume of the adsorption system (∂Va/∂a)T << vg. Therefore, the heat of adsorption of hydrogen was calculated as follows:
q st = R · Z · [ ( l n P ) ( 1 / T ) ] a ( P a ) T · V a
According to Equation (9), the value of qst for the studied adsorption systems could be calculated from the experimental isosteres of hydrogen adsorption. Figure 6 demonstrates the isosteres of hydrogen adsorption on the carbon adsorbents.
As follows from Figure 6, the isosteres of hydrogen adsorption on the PAC-700 adsorbent are well-described by a linear function. It should be mentioned that the linearity of adsorption isosteres is characteristic of many adsorption systems, including methane/ACs [63,70,77] and inert gases in zeolites [78,79,80,81]. Figure 7 demonstrates the isosteric heats of hydrogen adsorption, qst (a), on the studied carbon adsorbents, which were evaluated from the isosteres using Equation (9).
As follows from Figure 7, the dependences qst (a) for the studied adsorbents were found to be different. The initial heats of hydrogen adsorption on the adsorbents of the same chemical nature—in particular, those synthesized from furfural, FAC-2008 and FAC-3—were 2.8 and 3.7 kJ/mol, respectively. An increase in the amount of adsorbed hydrogen on FAC-2008, having wide pores of 1.7 nm and a low standard characteristic adsorption energy of 14 kJ/mol, resulted in a smooth decrease in the heat of adsorption, indicating a low heterogeneity of the adsorbent surface and the convergence of the average density of the adsorbate in micropores and the density of the gas phase at high pressures.
Unlike FAC-2008, the heat of hydrogen adsorption on the FAC-3 adsorbent increased weakly upon hydrogen adsorption and achieved a value of about 5.0 kJ/mol. This behavior of the heat of adsorption also indicated a low heterogeneity of the adsorbent surface and manifestation of the energy contribution of attraction between the adsorbed hydrogen molecules for the micropore filling to 8 mmol/g. Similar phenomena have been observed, for example, for methane adsorption on a microporous carbon adsorbent [77]. According to estimations [82], the average number of hydrogen molecules in a single micropore of the FAC-3 adsorbent at 8 mmol/g for the monoporous model is ~7–8 molecules per cavity. It is most likely that the effects of cooperative interactions in the adsorbate already begin to manifest themselves at these micropore fillings.
As seen from Figure 7, at the early stage of adsorption, the isosteric differential heats of adsorption on the ACS and PAC-700 adsorbents were higher than the typical values reported for most carbon adsorbents 4–8 kJ/mol [30]. A dramatic decrease in the qst values observed in the course of hydrogen adsorption in ACS and PAC-700 indicated a high energy heterogeneity of their surface caused by the conditions of their synthesis. The specific adsorption sites, which are not occupied by oxide groups [83] and favor an increase in the adsorption energy, arose on the surface of these carbon adsorbents due to chemical bond cleavage during thermochemical activation. It can be assumed that the highest initial heat of hydrogen adsorption on PAC-700 of about 14 kJ/mol was a consequence of adsorption on the high-energy nonstoichiometric adsorption sites that appeared during microporous structure formation upon the thermal decomposition of poly (vinylidene chloride) (see in Section 2.1.1). The uncompleted “hangling” specific bonds of carbon sharply increased the adsorption energy. However, as the amount of adsorbed hydrogen achieved 4–5 mmol/g, these sites were filled, and the heat of adsorption decreased to ~5.5 kJ/mol. This energy level corresponded to the average heat of adsorption of hydrogen on the carbon surface [30]. The range of 4–5 mmol/g, in which the heat of adsorption of hydrogen decreased sharply, could serve as a criterion of estimation of the number of specific adsorption sites of the carbon adsorbent.
The variations of the heat of hydrogen adsorption during hydrogen adsorption on AUK were close to that for PAC-700. At the early stage of hydrogen adsorption on AUK, the heat of hydrogen adsorption was found to be 9 kJ/mol, but it dropped sharply to ~ 5 kJ/mol at a = 4 mmol/g. We attributed this decrease to the energetic heterogeneity of the adsorbent caused by the presence of various adsorption sites arising from the thermochemical leaching of silicon from SiC in the chlorine flow, which resulted in the formation of free bonds of carbon.
The high heats of hydrogen adsorption were obtained for the hydrogen/ACS adsorption system. During the adsorption process, the heat of adsorption smoothly decreased from 11.0 to 4.0 kJ/mol. Except for the initial value, the heat of hydrogen adsorption on this adsorbent exceeded that for other activated carbons nearly in the whole range of a from 2.0 to 12.0 mmol/g. This behavior of the heat of adsorption could be due to the broad pore size distribution manifested by the bimodal character of the porous structure indicated in Table 1.

4. Conclusions

The examination of hydrogen adsorption on the microporous carbon adsorbents of various origin with the specific micropore volumes from 0.46 to 2.00 cm3/g at temperatures from 303 to 363 K and pressures up to 20 MPa revealed the following patterns:
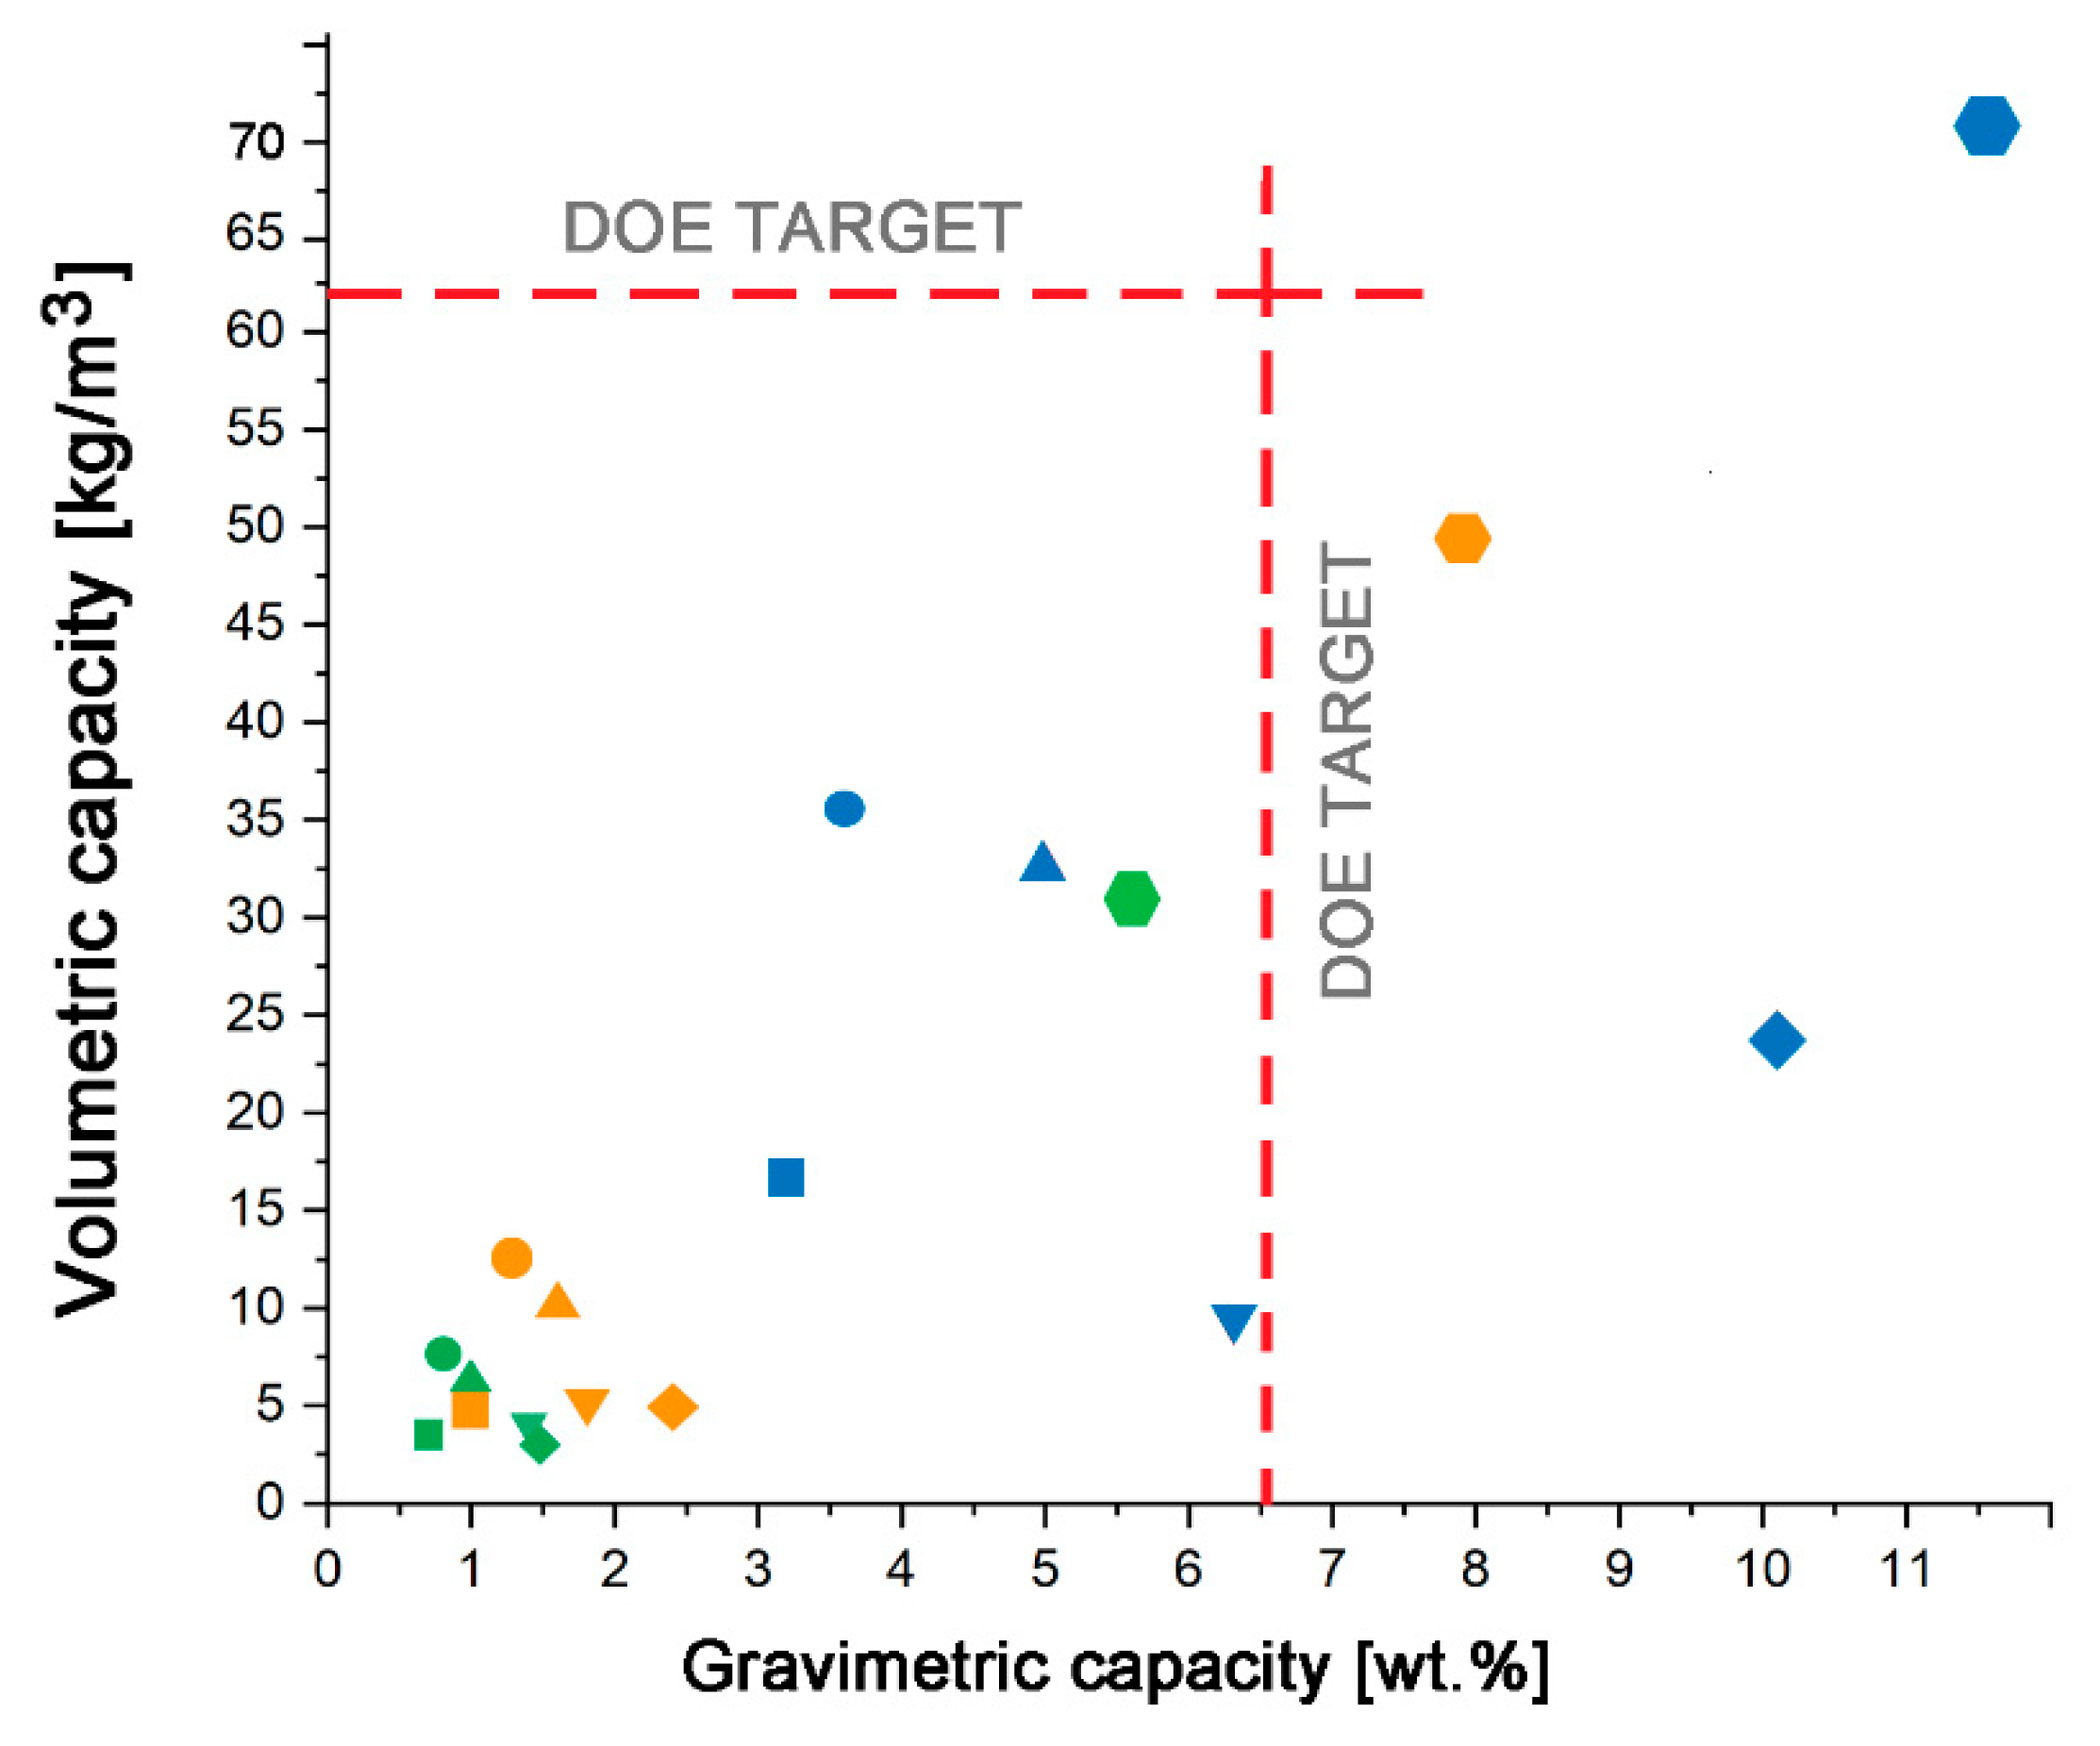
  • Both at ambient and low temperatures, the highest gravimetric hydrogen density found for the ACS adsorbent at high pressures could be attributed to the largest micropore volume, bimodal pore size distribution, and specific BET surface among the rest samples.
  • Under the same conditions, the highest values of AC density combined with the high energy of adsorption provided the advantage in the volumetric capacity of the AUK adsorbent, although it demonstrated the lower gravimetric capacity compared to ACS.
  • A decrease in temperature led to an expected increase in the amount of adsorbed hydrogen on the studied carbon adsorbents. At the P,T-conditions corresponding to the hydrogen boiling point, the gravimetric hydrogen capacity of ACS (which was calculated by the TVFM) exceeded the DOE target.
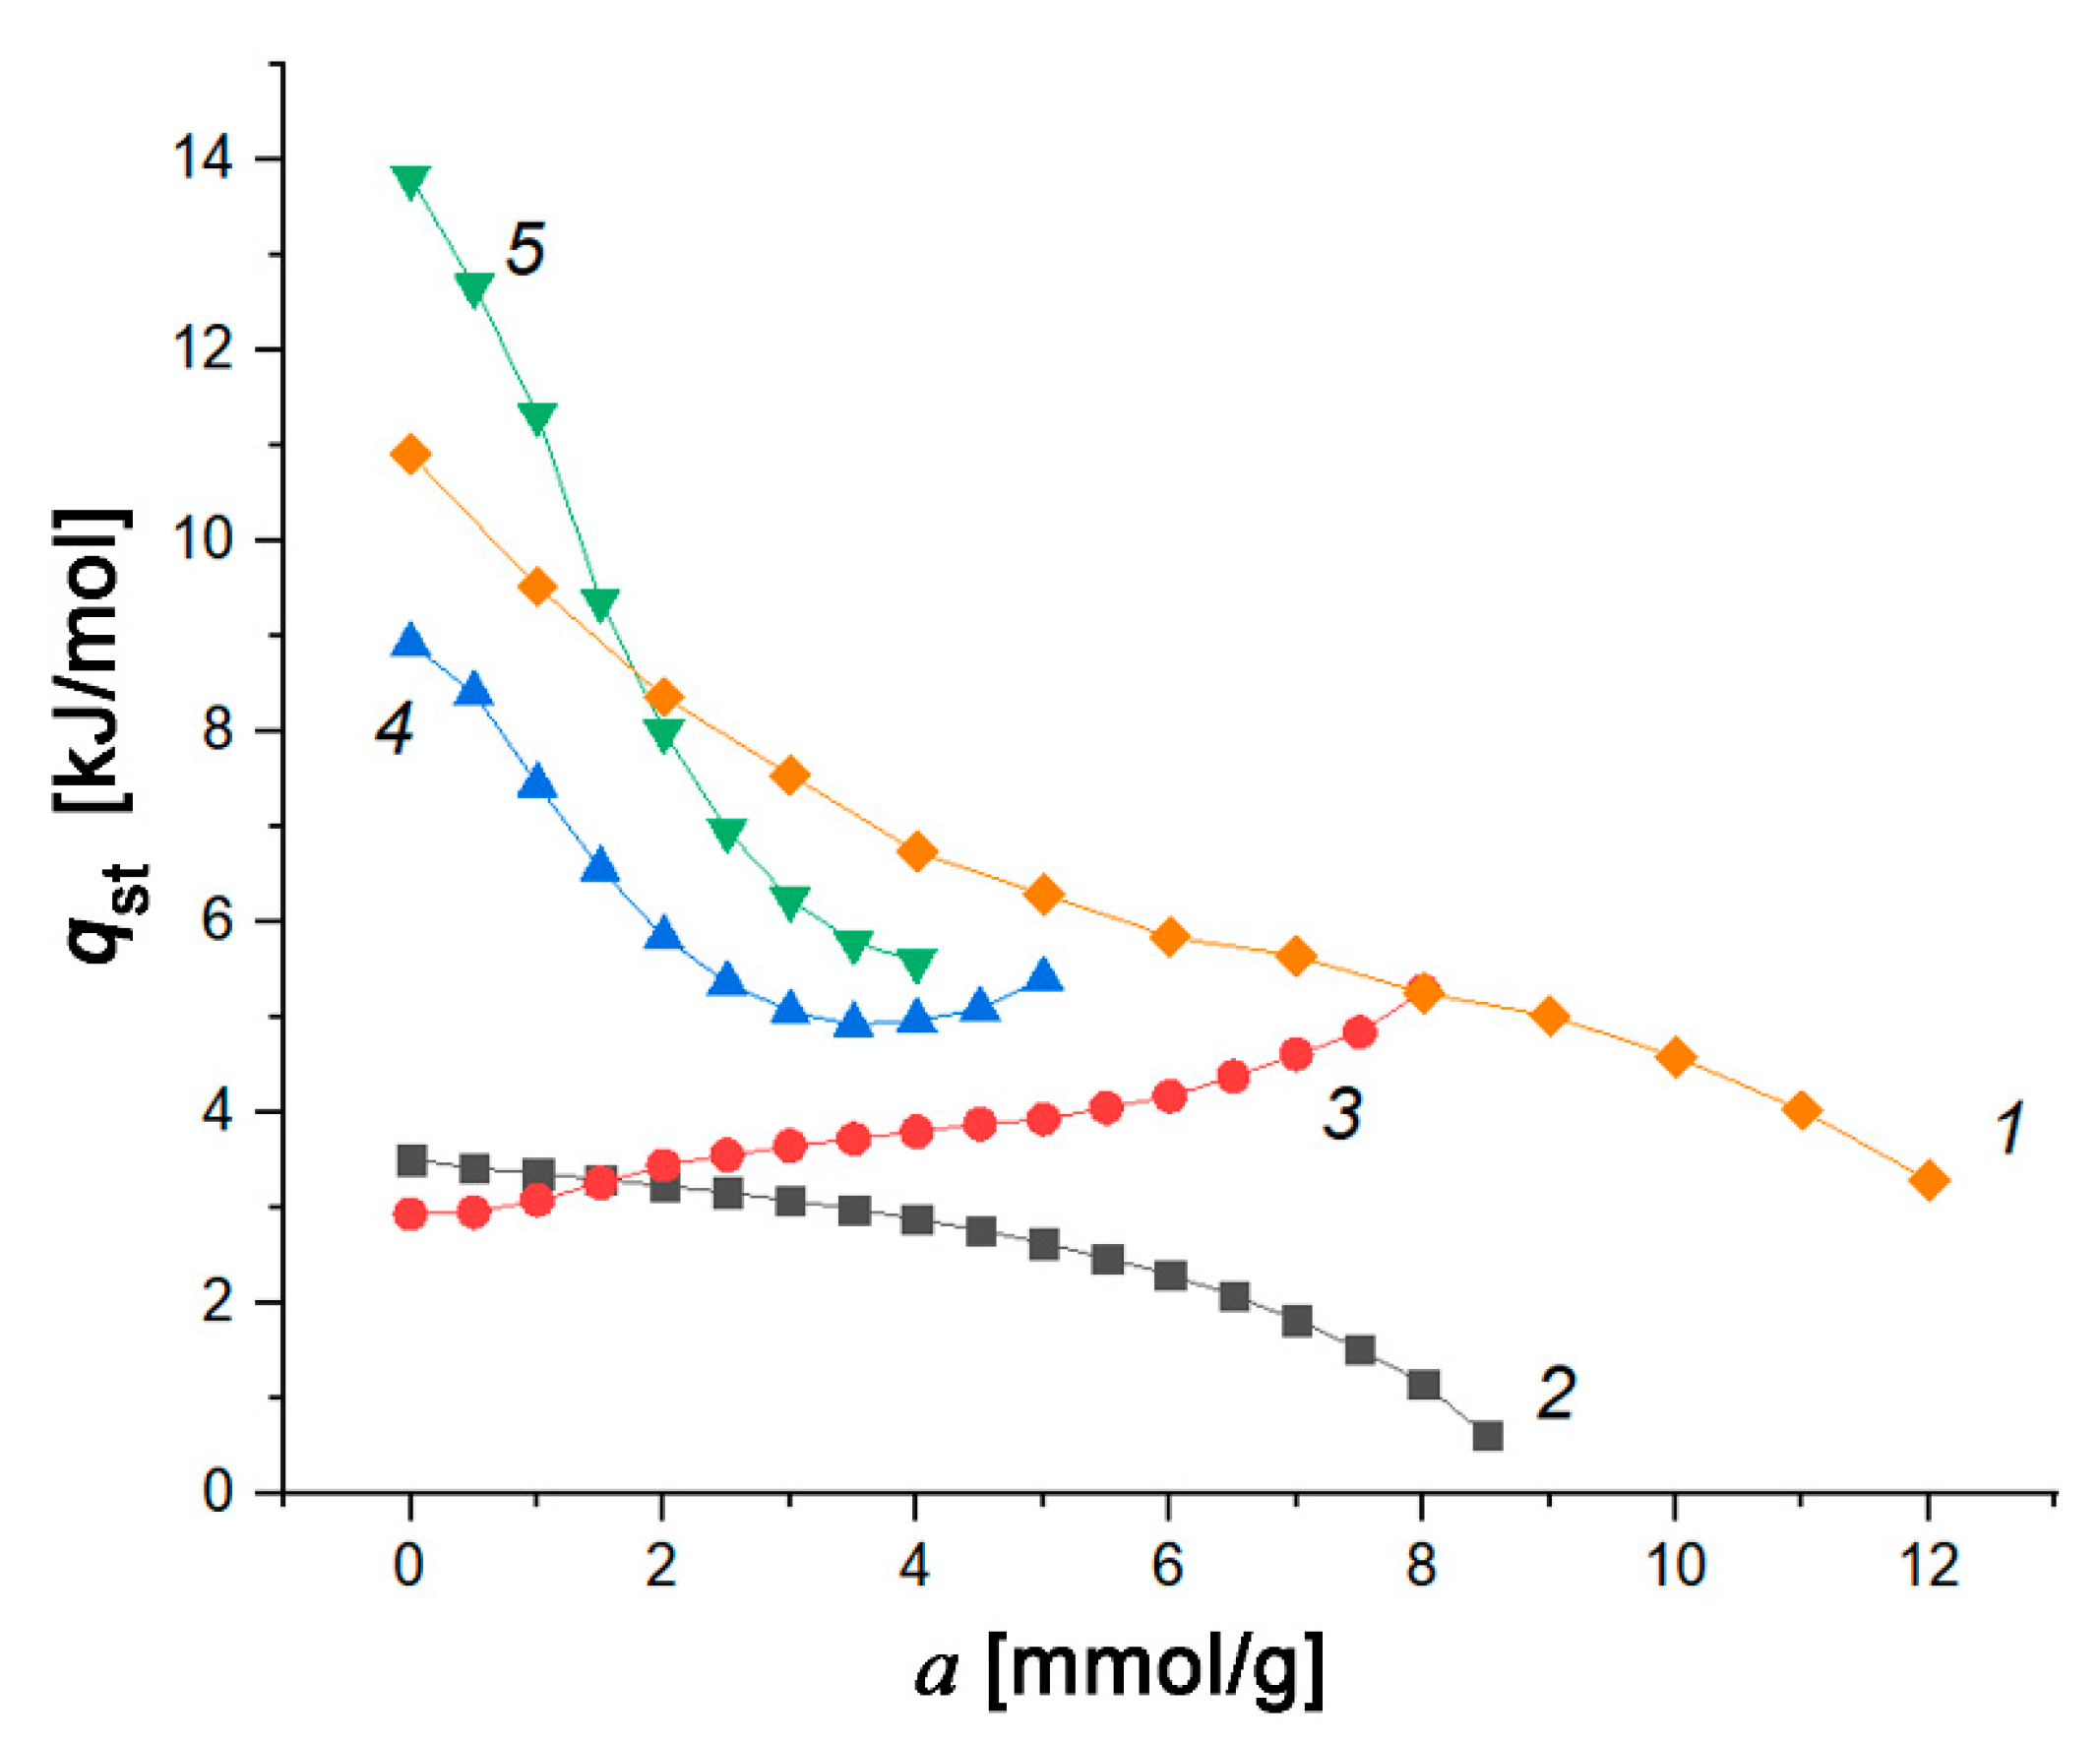
  • The highest differential molar isosteric heats of hydrogen adsorption on ACS, PAC-700, and AUK were determined by the significant amounts of high-energy adsorption sites, which were determined by a precursor and synthesis procedure.
These patterns agree with the results of the hydrogen adsorption calculated by the TVFM for the model graphite-like adsorbents with the slit-like pore width from 0.53 to 2.54 nm separated by single-layer and two-layer carbon walls. The calculations showed that the maximum amount of adsorbed hydrogen in the model carbon structures with slit-like pores could reach 23 wt.%. At 200 K and 20 MPa, the amount of adsorbed hydrogen in the model slit-like structures with a pore width of 2.2 nm exceeded the DOE requirements.
The diverse variations in the differential molar isosteric heat of hydrogen adsorption on the studied activated carbons were attributed to the differences in the adsorption sites depending on both the precursor and activation conditions.
In our opinion, the obtained results are essential for selecting an appropriate carbon adsorbent and predicting the efficiency of an adsorption-based hydrogen storage system under optimal thermodynamic conditions.

Author Contributions

Conceptualization, A.F., O.A., and A.I.; methodology, A.P., A.S., and I.M.; software, I.M., A.S.; validation, A.F., K.R.; formal analysis, I.M. and A.S.; investigation, A.P., A.S., and I.M.; resources, A.S., A.F., and A.I.; data curation, A.F. and E.K.; writing—original draft preparation, A.F.; writing—review and editing, E.K.; visualization, A.S. and E.K.; supervision, A.F., O.A., and A.I.; project administration, O.A., A.I., and A.F.; funding acquisition, A.F. All authors have read and agreed to the published version of the manuscript.

Funding

The research was carried out within the State Assignment of the Russian Federation (Project No. 0081-2019-0018) and the plan of the RAS Scientific Council (Theme No. 20-03-460–01).

Institutional Review Board Statement

Not applicable.

Informed Consent Statement

Not applicable.

Data Availability Statement

Data presented in this article is available at reasonable request from the corresponding authors.

Acknowledgments

We thank V. Yakovlev for his participation in the discussion of the results.

Conflicts of Interest

The authors declare no conflict of interest.

References

  1. Melnikov, Y.; Mitrova, T.; Chugunov, D. The Hydrogen Economy: A Path towards Low Carbon Development, SKOLKOVO Energy Centre, Moscow School of Management SKOLKOVO. June 2019. Available online: https://energy.skolkovo.ru/downloads/documents/SEneC/Research/SKOLKOVO_EneC_Hydrogen-economy_Eng.pdf (accessed on 13 December 2020).
  2. Gamburg, D.Y.; Semenov, V.P.; Dubovkin, N.F.; Smirnova, L.N. Hydrogen; Khimiya: Moscow, Russia, 1989; p. 672. [Google Scholar]
  3. Aksyutin, O.; Ishkov, A.; Romanov, K. Hydrogen, methane, carbon: New markets, new opportunities. Oil Gas Vert. 2021, 1–2, 40–47. [Google Scholar]
  4. Niaz, S.; Manzoor, T.; Pandith, A.H. Hydrogen storage: Materials, methods and perspectives. Renew. Sustain. Energy Rev. 2015, 50, 457–469. [Google Scholar] [CrossRef]
  5. Graetz, J. Metastable Metal Hydrides for Hydrogen Storage. ISRN Mater. Sci. 2012, 2012, 863025. [Google Scholar] [CrossRef] [Green Version]
  6. Zaluska, A.; Zaluski, L.; Strom-Olsen, J.O. Sodium alanates for reversible hydrogen storage. J. Alloys Compd. 2000, 298, 125–134. [Google Scholar] [CrossRef]
  7. Zhu, Q.-L.; Xu, Q. Liquid organic and inorganic chemical hydrides for high-capacity hydrogen storage. Energy Environ. Sci. 2015, 8, 478–512. [Google Scholar] [CrossRef]
  8. Klerke, A.; Christensen, C.H.; Nørskov, J.K.; Vegge, T. Ammonia for hydrogen storage: Challenges and opportunities. J. Mater. Chem. 2008, 18, 2304–2310. [Google Scholar] [CrossRef]
  9. Klyamkin, S.N. Metal-hybrid compositions based on magnesium as materials for hydrogen batteries. Russ. Chem. J. 2006, L(6), 49–55. [Google Scholar]
  10. Zaluska, A.; Zaluski, L.; Strom-Olsen, J.O. Nanocrystalline magnesium for hydrogen storage. J. Alloys Compd. 2000, 288, 217–225. [Google Scholar] [CrossRef]
  11. Rodrigo Leiva, D.R.; de Almeida Costa, H.C.; Huot, J.; Pinheiro, T.S.; Jorge, A.M., Jr.; Ishikawa, T.T.; Botta, W.J. Magnesium-Nickel Alloy for Hydrogen Storage Produced by Melt Spinning Followed by Cold Rolling. Mater. Res. 2012, 15, 813–817. [Google Scholar] [CrossRef] [Green Version]
  12. Liang, G.; Huot, J.; Schulz, R. Hydrogen storage properties of the mechanically alloyed LaNi5-based materials. J. Alloys Compd. 2001, 320, 133–139. [Google Scholar] [CrossRef]
  13. Alexandrou, S.; Joseph, P.; Cook, J.P. Silicon Fuel: A hydrogen storage material. Int. J. Hydrogen Energy 2021, 46, 1627–1633. [Google Scholar] [CrossRef]
  14. DOE. Fuel Cell Technologies Office Multi-Year Research, Development, and Demonstration Plan. 2013. Available online: http://energy.gov/eere/fuelcells/downloads/fuel-cell-technologies-office-multi-year-research-development-and-22 (accessed on 9 March 2019).
  15. Bradley, T.H.; Moffitt, B.A.; Mavris, D.N.; Parekh, D.E. Development and experimental characterization of a fuel cell powered aircraft. J. Power Sources 2007, 171, 793–801. [Google Scholar] [CrossRef]
  16. Stroman, R.O.; Schuette, M.W.; Swider-Lyons, K.; Rodgers, J.A.; Edwards, D.J. Liquid hydrogen fuel system design and demonstration in a small long endurance air vehicle. Int. J. Hydrogen Energy 2014, 39, 11279–11290. [Google Scholar] [CrossRef]
  17. Dubinin, M.M. Physical Adsorption of Gases and Vapors in Micropores. Prog. Surf. Membr. Sci. 1975, 9, 1–70. [Google Scholar]
  18. Vlasov, A.I.; Bakaev, V.A.; Dubinin, M.M.; Serpinskii, V.V. Monte Carlo modeling of argon adsorption on active carbons. Dokl. Akad Nauk SSSR 1981, 260, 904–906. [Google Scholar]
  19. Meconi, G.M.; Zangi, R. Adsorption-induced clustering of CO2 on graphene. Phys. Chem. Chem. Phys. 2020, 22, 21031–21041. [Google Scholar] [CrossRef] [PubMed]
  20. Shkolin, A.V.; Fomkin, A.A.; Tsivadze, A.Y.; Anuchin, K.M.; Men’shchikov, I.E.; Pulin, A.L. Experimental study and numerical modeling: Methane adsorption in microporous carbon adsorbent over the subcritical and supercritical temperature regions. Protect. Metals Phys. Chem. Surf. 2016, 52, 955–963. [Google Scholar] [CrossRef]
  21. Kel’tsev, N.V. Foundations of Adsorption Technique; Khimiya: Moscow, Russia, 1976. [Google Scholar]
  22. Breck, D.W. Zeolite Molecular Sieves; Wiley-Interscience: New York, NY, USA, 1974. [Google Scholar]
  23. Langmi, H.W.; Walton, A.; Al-Mamouri, M.M.; Johnson, S.R.; Book, D.; Speight, J.D.; Edwards, P.P.; Gameson, I.; Anderson, P.A.; Harris, I.R. Hydrogen adsorption in zeolites A, X, Y and RHO. J. Alloys Compd. 2003, 356–357, 710–715. [Google Scholar] [CrossRef]
  24. Isaeva, V.I.; Kustov, L.M. Metal-organic frameworks—New materials for hydrogen storage. Russ. J. Gen. Chem. 2007, 77, 721–739. [Google Scholar] [CrossRef]
  25. Rostami, S.; Pour, A.N.; Salimi, A.; Abolghasempour, A. Hydrogen adsorption in metal-organic frameworks (MOFs): Effects of adsorbent architecture. Int. J. Hydrogen Energy 2018, 43, 7072–7080. [Google Scholar] [CrossRef]
  26. Li, Y.; Yang, R.T. Hydrogen storage in metal-organic and covalent-organic frameworks by spillover. AlChE 2008, 54, 269–279. [Google Scholar] [CrossRef]
  27. Ahmed, A.; Seth, S.; Purewal, J.; Wong-Foy, A.G.; Veenstra, M.; Matzger, A.J.; Siegel, D.J. Exceptional hydrogen storage achieved by screening nearly half a million metal-organic frameworks. Nat. Comm. 2019, 10, 1568. [Google Scholar] [CrossRef] [Green Version]
  28. Srtobel, R.; Jorissen, L.; Schiermann, T.; Trapp, V.; Schutz, W.; Bohmhammel, K.; Wolf, G.; Garche, J. Hydrogen adsorption on carbon materials. J. Power Sources 1999, 84, 221–224. [Google Scholar]
  29. Shindo, K.; Kondo, T.; Arakowa, M.; Sakurai, Y.J. Hydrogen adsorption/desorption properties of mechanically milled activated carbon. J. Alloys Comp. 2003, 359, 267–271. [Google Scholar] [CrossRef]
  30. Sevilla, M.; Mokaya, R. Energy storage applications of activated carbons: Supercapacitors and hydrogen storage. Energy Environ. Sci. 2014, 7, 1250–1280. [Google Scholar] [CrossRef] [Green Version]
  31. Sethia, G.; Sayari, A. Activated carbon with optimum pore size distribution for hydrogen storage. Carbon 2016, 99, 289–294. [Google Scholar] [CrossRef]
  32. Kostoglou, N.; Koczwara, C.; Prehal, C.; Terziyska, V. Nanoporous activated carbon cloth as a versatile material for hydrogen adsorption, selective gas separation and electrochemical energy storage. Nano Energy 2017, 40, 49–64. [Google Scholar] [CrossRef]
  33. Darkrim, F.L.; Malbrunot, P.; Tartaglia, G.P. Review of hydrogen storage by adsorption in carbon nanotubes. Int. J. Hydrogen Energy 2002, 27, 193–202. [Google Scholar] [CrossRef]
  34. Tibbetts, G.G.; Meisher, G.P.; Olk, C.H. Hydrogen storage capacity of carbon nanotubes, filaments, and vapor-grown fibers. Carbon 2001, 39, 2291–2301. [Google Scholar] [CrossRef]
  35. Jimenez, V.; Ramirez-Lucas, A.; Sanchez, P.; Valverde, J.L.; Romero, A. Hydrogen storage in different carbon materials: Influence of the porosity development by chemical activation. Appl. Surf. Sci. 2012, 258, 2498–2509. [Google Scholar] [CrossRef]
  36. Shkolin, A.V.; Fomkin, A.A. Supramolecular microporous structures based on carbon nanotubes and coordinating cumene (C9H12) molecules. Colloid. J. 2017, 79, 701–706. [Google Scholar] [CrossRef]
  37. Park, C.; Anderson, P.E.; Tan, C.D.; Hidalgo, R.; Rodrigez, N.M. Further Studies of the Interaction of Hydrogen with Graphite Nanofibers. J. Phys. Chem. B 1999, 103, 10572–10581. [Google Scholar] [CrossRef]
  38. Ivanovskaya, V.; Zobelli, A.; Teillet-Billy, D.; Rougeau, N.; Sidis, V.; Briddon, P.R. Hydrogen adsorption on graphene: A first principles study. Eur. Phys. J. B 2010, 76, 481–486. [Google Scholar] [CrossRef]
  39. Tozzini, V.; Pellegrini, V. Prospects for hydrogen storage in graphene. Phys. Chem. Chem. Phys. 2013, 15, 80–89. [Google Scholar] [CrossRef] [Green Version]
  40. Alekseeva, O.K.; Pushkareva, I.V.; Pushkarev, A.S.; Fateev, V.N. Graphene and Graphene-Like Materials for Hydrogen Energy. Nanotechnol. Russ. 2020, 15, 273–300. [Google Scholar] [CrossRef] [PubMed]
  41. Zacharia, R.; Rather, S. Review of Solid State Hydrogen Storage Methods Adopting Different Kinds of Novel Materials. J. Nanomater. 2015, 2015, 914845. [Google Scholar] [CrossRef] [Green Version]
  42. Gordon, R. Composite Pressure Vessels for Gaseous Hydrogen-Powered Vehicles in Hydrogen Energy Progress; Veziroglu, T.N., Taylor, J.B., Eds.; Pergamon: New York, NY, USA, 1984; pp. 1225–1236. [Google Scholar]
  43. Dillon, A.C.; Heben, M.J. Hydrogen storage using carbon adsorbents: Past, present and future. Appl. Phys. A 2001, 72, 133–142. [Google Scholar] [CrossRef]
  44. Fomkin, A.A.; Sinitsyn, V.A.; Gur’yanov, V.V. Hydrogen adsorption on nanoporous carbon adsorbents prepared from furaldehyde by thermochemical synthesis. Colloid J. 2008, 70, 372–376. [Google Scholar] [CrossRef]
  45. Mohan, M.; Sharma, V.K.; Kumar, E.A.; Gayathri, V. Hydrogen storage in carbon materials—A review. Energy Starage 2019, 1, e35. [Google Scholar] [CrossRef]
  46. Xu, W.C.; Takahashi, K.; Matsuo, Y.; Hattori, Y.; Kumagai, M.; Ishiyama, S.; Kaneko, K.; Iijima, S. Investigation of hydrogen storage capacity of various carbon materials. Int. J. Hydrogen Energy 2007, 32, 2504–2512. [Google Scholar] [CrossRef]
  47. Masika, E.; Robert Mokaya, R. Exceptional gravimetric and volumetric hydrogen storage for densified zeolite templated carbons with high mechanical stability. Energy Environ. Sci. 2014, 7, 427–434. [Google Scholar] [CrossRef]
  48. Romanos, J.; Barakat, F.; Abou Dargham, S. Nanoporous Graphene Monolith for Hydrogen Storage. Mater. Today Proc. 2018, 5, 17478–17483. [Google Scholar] [CrossRef]
  49. Ania, C.O.; Raymundo-Piñero, E. Nanoporous Carbons with Tuned Porosity. Chapter 5. In Nanoporous Materials for Gas Storage, 1st ed.; Rodríguez-Reinoso, F., Kaneko, K., Eds.; Springer Nature Singapore Pte Ltd.: Singapore, 2019; pp. 91–135. [Google Scholar]
  50. Fenelonov, V.B. Poristyi Uglerod (Porous Carbon); Izd. IK RAN: Novosibirsk, Russia, 1995; p. 518. (In Russian) [Google Scholar]
  51. Mukhin, V.M.; Tarasov, A.V.; Klushin, V.N. Aktivnie ugli Rossii (Active Carbons of Russia); Metallurgiya: Moscow, Russia, 2000; p. 352. [Google Scholar]
  52. Men’shchikov, I.E.; Shiryaev, A.A.; Shkolin, A.V.; Vysotskii, V.V.; Khozina, E.V.; Fomkin, A.A. Carbon adsorbents for methane storage: Genesis, synthesis, porosity, adsorption. Korean J. Chem. Eng. 2021, 38, 276–291. [Google Scholar] [CrossRef]
  53. Dubinin, M.M. Fundamentals of the theory of adsorption in micropores of carbon adsorbents: Characteristics of their adsorption properties and microporous structures. Carbon 1989, 27, 457–467. [Google Scholar] [CrossRef]
  54. Men´shchikov, I.E.; Fomkin, A.A.; Shkolin, A.V.; Yakovlev, V.Y.; Khozina, E.V. Optimization of structural and energy characteristics of adsorbents for methane storage. Russ. Chem. Bull. 2018, 67, 1814–1822. [Google Scholar] [CrossRef]
  55. Ivakhnyuk, G.K.; Sevryugov, L.B.; Plachenov, T.G. Preparation, Structure, and Properties of Adsorbents; Izd. LTI im. Lensoveta: Leningrad, Russia, 1977; p. 19. [Google Scholar]
  56. Fedorov, N.F.; Ivakhnyuk, G.K.; Gavrilov, D.N.; Tetenev, V.V.; Smetanin, G.N.; Samonin, V.V.; Babkin, O.E.; Zaitsev, Y.A. Carbon Adsorbents and Their Application in Industry; Nauka: Moscow, Russia, 1983; p. 20. [Google Scholar]
  57. Guryanov, V.V.; Mukhin, V.M.; Kurilkin, A.A. Development of high-strength ash-free spherical carbon catalyst supports. Catal. Ind. 2012, 2, 41–48. (In Russian) [Google Scholar]
  58. Tkachev, A.G.; Melezhik, A.V.; Solomakho, G.V. Method of Obtaining Mesoporous Carbon. Patent for Invention RU2630404C1, 25 May 2017. [Google Scholar]
  59. Anuchin, K.M.; Fomkin, A.A.; Korotych, A.P.; Tolmachev, A.M. Adsorption concentration of methane. Dependence of adsorbate density on the width of slit-shaped micropores in activated carbons. Prot. Met. Phys. Chem. Surf. 2014, 50, 173–177. [Google Scholar] [CrossRef]
  60. Pauling, L. The Nature of the Chemical Bond and the Structure of Molecules and Crystals: An Introduction to Modern Structural Chemistry; Cornell University Press: Ithaca, NY, USA, 1939; 429p. [Google Scholar]
  61. Vainshtein, B.; Fridkin, V.; Indenbom, V. Structure of Crystals, 2nd ed.; Modern Crystallography, Springer: Berlin/Heidelberg, Germany, 1995; p. 82. [Google Scholar]
  62. Pribylov, A.A.; Serpinskii, V.V.; Kalashnikov, S.M. Adsorption of Gases by Microporous Adsorbents under Pressures up to Hundreds of Megapascals. Zeolites 1991, 11, 846–849. [Google Scholar] [CrossRef]
  63. Men’shchikov, I.E.; Shkolin, A.V.; Khozina, E.V.; Fomkin, A.A. Thermodynamics of Adsorbed Methane Storage Systems Based on Peat-Derived Activated Carbons. Nanomaterials 2020, 10, 1379. [Google Scholar] [CrossRef]
  64. Fomkin, A.A.; Seliverstova, I.I.; Serpinskii, V.V. Determination of the parameters of the microprobe structure of solid adsorbents. Communication 1. Method of determination of the specific volume of totally microporous adsorbents. Russ. Chem. Bull. 1986, 35, 256–259. [Google Scholar] [CrossRef]
  65. Brunauer, S.; Emmett, P.H.; Teller, E. Adsorption of gases in multimolecular layers. J. Am. Chem. Soc. 1938, 60, 309–319. [Google Scholar] [CrossRef]
  66. GOST R 55959-2014. Activated Carbon. Standard Test Method for Bulk Density. Available online: http://docs.cntd.ru/document/1200109447?section=text (accessed on 25 June 2021).
  67. Sugden, S. The Parachor and Valency; George Routledge&Sons: London, UK, 1930; 224p. [Google Scholar]
  68. Nikolaev, K.M.; Dubinin, M.M. Concerning adsorptional properties of carbon adsorbents 3. A study of adsorption isotherms of gases and vapors on active carbons over a wide interval of temperatures, including the critical region. Russ. Chem. Bull. 1958, 7, 1124–1133. [Google Scholar] [CrossRef]
  69. Fomkin, A.A.; Sinitsyn, V.A. Hydrogen adsorption on a carbon adsorbent with slitlike micropores below and above the critical temperature. Colloid. J. 2008, 70, 112–117. [Google Scholar] [CrossRef]
  70. Men’shchikov, I.E.; Fomkin, A.A.; Tsivadze, A.Y.; Shkolin, A.V.; Strizhenov, E.M.; Khozina, E.V. Adsorption accumulation of natural gas based on microporous carbon adsorbents of different origin. Adsorpt. J. 2017, 23, 327–339. [Google Scholar] [CrossRef]
  71. Hill, T.L. Theory of Physical Adsorption. In Advances in Catalysis and Related Subjects; Frankerburg, Y.I., Ed.; Academic Press: New York, NY, USA, 1952; Volume 4, pp. 211–258. [Google Scholar]
  72. Bakaev, V.A. One possible formulation of the thermodynamics of sorption equilibrium. Bull. Acad. Sci. USSR Div. Chem. Sci. 1971, 20, 2516–2520. [Google Scholar] [CrossRef]
  73. Fomkin, A.A. Adsorption of gases, vapors and liquids by microporous adsorbents. Adsorption 2005, 11, 425–436. [Google Scholar] [CrossRef]
  74. Shkolin, A.V.; Fomkin, A.A. Deformation of AUK microporous carbon adsorbent induced by methane adsorption. Colloid J. 2009, 71, 119–124. [Google Scholar] [CrossRef]
  75. Potapov, S.V.; Shkolin, A.V.; Fomkin, A.A. Deformation of AUK microporous carbon adsorbent induced by krypton adsorption. Colloid J. 2014, 76, 351–357. [Google Scholar] [CrossRef]
  76. Shkolin, A.V.; Potapov, S.V.; Fomkin, A.A. Deformation of AUK microporous carbon adsorbent induced by xenon adsorption. Colloid J. 2015, 77, 812–820. [Google Scholar] [CrossRef]
  77. Shkolin, A.V.; Fomkin, A.A.; Yakovlev, V.Y. Analysis of adsorption isosteres of gas and vapor on microporous adsorbents. Russ. Chem. Bull. 2007, 56, 393–396. [Google Scholar] [CrossRef]
  78. Bering, B.P.; Zhukovskaya, E.G.; Rakhmukov, B.K.; Serpinskii, V.V. Adsorption in micropores. Communication 2. Experimental isosteres of adsorption. Izv. Akad. Nauk SSSR. Ser. Khim. 1967, 16, 1662–1669. [Google Scholar]
  79. Barrer, R.M.; Papadopoulos, R. The sorption of krypton and xenon in zeolites at high pressures and temperatures I. Chabazite. Proc. Roy. Soc. Lond. Ser. A Math Phys. Sci. 1972, 326, 315–330. [Google Scholar]
  80. Fomkin, A.A.; Serpinskii, V.V.; Fidler, K. State of an adsorbed substance in the micropores of zeolites at high degrees of filling. Bull. Acad. Sci. USSR Div. Chem. Sci. 1982, 31, 1071–1077. [Google Scholar] [CrossRef]
  81. Bülow, M.; Shen, D.; Jale, S. Measurement of sorption equilibria under isosteric conditions: The principles, advantages and limitations. Appl. Surf. Sci. 2002, 196, 157–172. [Google Scholar] [CrossRef]
  82. Dubinin, M.M. Carbon Adsorbents and Their Use in Industry; Nauka: Moscow, Russia, 1983; p. 100. [Google Scholar]
  83. Tarkovskaya, I.A. Oxidized Carbon; Naukova Dumka: Kiev, Ukrain, 1981; p. 198. [Google Scholar]
Figure 1. The state diagram of the H2 storage systems employing nanoporous carbon materials. A red asterisk indicates the DOE target value of 6.5 wt.% or 62 kg/m3 (at 233–358 K and 3–100 bar [14,41]). A solid green circle corresponds to the liquid state of hydrogen [2]. The data in circles 1 and 2 correspond to the hydrogen storage in the cylinders made of polymer composite material (circle 1) and fiberglass/aluminum (circle 2) under the pressures: 20 (A), 24.8 (B), 40 (C), and 60 (D) MPa [42,43]. The yellow areas containing black squares (3) indicate the data for physical hydrogen adsorption in carbon nanotubes (square symbols indicate the predicted data for CNTs with diameters of 1.22, 1.36, 1.63, and 2.00 nm [43], as well as experimental results [39,43]). An orange circle (4) corresponds to the hydrogen adsorption in the graphene structures at room temperatures [39]. A light-blue ellipse (5) shows the data on hydrogen adsorption on the industrial activated carbons at room temperatures [44,45]. The light blue areas with rhombs (6) include the data for hydrogen adsorbed in various microporous ACs at 77 K at 5–20 MPa [44,45,46,47,48].
Reactions 02 00014 g001
Figure 2. Schematical representation of the formation of a micropore in a graphite-like crystallite via the selective burnout of a hexagonal carbon layer upon high-temperature steam activation accompanied by devolatilization.
Reactions 02 00014 g002
Figure 3. Gravimetric density of hydrogen GH2 (wt.%) versus micropore width X0 (nm) in the model microporous carbon adsorbents with the single-layer pore walls at temperatures of 293 (a), 200 (b), and 77 K (c), as well as at pressures of 10 (1), 20 (2), and 27 (3) MPa. Dashed lines show the pore widths corresponding to the model structures from Table 2.
Reactions 02 00014 g003aReactions 02 00014 g003b
Figure 4. The isotherms of hydrogen adsorption at the temperature of 303 K (a) and 333 K (b) on the adsorbents ACS (1), FAC-2008 (2), FAC-3 (3), AUK (4), and PAC-700 (5).
Reactions 02 00014 g004
Figure 5. The hydrogen gravimetric capacity versus volumetric capacity of the AC samples shown by different symbols—PAC-700 (square), AUK (circle), FAC-3 (triangle), FAC-2008 (upside triangle), ACS (rhomb), and model structure AC 3:5 (hexagon)—at differential P,T-conditions: 101 kPa and 20.38 K (blue symbols), 20 MPa and 303 K (orange symbols), and 10 MPa and 303 K (green symbols).
Reactions 02 00014 g005
Figure 6. The experimental isosteres of hydrogen adsorption for different amounts of adsorbed hydrogen in PAC-700, a (mmol/g): 0.5 (1), 1.0 (2), 1.5 (3), 2.0 (4), 2.5 (5), 3.0 (6), 3.5 (7), 4.0 (8), and 4.5 (9).
Reactions 02 00014 g006
Figure 7. The differential molar isosteric heat of adsorption versus the amount of adsorbed hydrogen at 303 K on the adsorbents: ACS (1), FAC-2008 (2), FAC-3 (3), AUK (4), and PAC-700 (5).
Reactions 02 00014 g007
Table 1. The parameters of the porous structure and density of the AC adsorbents.
AdsorbentW0 [cm3/g]E0 [kJ/mol]2x0 [nm]SBET [m2/g]ρ [kg/m3]
PAC-7000.4629.30.801021500
AUK0.5129.00.821340950
FAC-30.7118.01.341830620
FAC-20080.9614.01.702015285
ACS2.00E01 = 16.94
E02 = 3.95
2x01 = 1.42
2x02 = 3.8
2760200
Table 2. The SEC values (Equation (3)) and densities of the model carbon structures with the slit-like pores separated by single- and double-layer carbon walls, and the characteristic energy of hydrogen adsorption evaluated as E = βE0, where β = 0.165.
Single-Layer Carbon Pore Wall
SECAC 1:3AC 2:4AC 3:5AC 4:6AC 5:7AC 6:8AC 7:9
X0 = 2x0 [nm]0.530.871.201.541.872.212.54
W0 [cm3/g]0.701.141.582.022.462.903.34
E0 [kJ/mol]45.327.720.015.612.810.99.4
ρads [g/cm3]1.1370.7580.5680.4550.3790.3250.284
EH2 [kJ/mol]7.54.63.32.62.11.81.6
Double-Layer Carbon Pore Wall
SECAC 1:5AC 2:6AC 3:7AC 4:8AC 5:9AC 6:10AC 7:11
X0 = 2x0 [nm]0.530.871.201.541.872.212.54
W0 [cm3/g]0.350.570.791.011.231.451.67
E0 [kJ/mol]45.327.820.015.612.810.99.4
ρads [g/cm3]1.5151.1370.9090.7580.6490.5680.505
EH2 [kJ/mol]7.54.63.32.62.11.81.6
Table 3. The calculated hydrogen adsorption capacities of the model carbon adsorbents with the slit-like pores separated by the single-layer carbon walls at 20.38 K and 101 kPa.
Parameters of
Hydrogen Adsorption
Single-Layer Carbon Pore Wall
AC 1:3AC 2:4AC 3:5AC 4:6AC 5:7AC 6:8AC 7:9
Limiting amount of
adsorbed hydrogen,
a0 [mmol/g]
24.540.155.671.186.6102.1117.6
Gravimetric density of adsorbed hydrogen, GH2 [wt.%]4.98.111.214.317.520.623.7
Volumetric density of adsorbed hydrogen,
VH2 [m3(H2, NTP)/m3]
671730760777789798804
Table 4. The gravimetric capacities of the different microporous activated carbons measured at 303 K and 10 and 20 MPa, as well as predicted for the normal boiling point by TVFM Equations (2) and (5) compared with that for the model carbon structure AC 3:5.
Amount of Adsorbed
Hydrogen, GH2 [wt.%]
Adsorbent
PAC-700AUKFAC-3FAC-2008ACSAC 3:5
GH2 (101 kPa; 20.38 K)3.23.65.06.310.0811.3
GH2 (10 MPa; 303 K)0.70.81.01.41.485.3
GH2 (20 MPa; 303 K)1.01.31.61.82.4 17.9
1 result of extrapolation.
Publisher’s Note: MDPI stays neutral with regard to jurisdictional claims in published maps and institutional affiliations.

