Article

Phosphorus Recovery from Wastewater: Bioavailability of P Bound to Calcareous Material for Maize (Zea Mays L.) Growth

1
Department of Biology, Aarhus University, Ole Worms Allé 1, 8000 Aarhus C, Denmark
2
Aarhus University Centre for Water Technology (WATEC), Ny Munkegade 120, 8000 Aarhus C, Denmark
3
Sino-Danish Centre for Education and Research (SDC), Niels Jensens Vej 2, 8000 Aarhus C, Denmark
4
Department of Bioscience, Aarhus University, Vejlsøvej 25, 8600 Silkeborg, Denmark
5
Aarhus Institute of Advanced Studies (AIAS), Høgh-Guldbergs Gade 6B, 8000 Aarhus C, Denmark
6
Department of Food Science, Aarhus University, Agro Food Park 48, 8200 Aarhus N, Denmark
*
Author to whom correspondence should be addressed.
Submission received: 2 March 2021 / Revised: 7 April 2021 / Accepted: 8 April 2021 / Published: 13 April 2021
(This article belongs to the Special Issue Reuse of Wastewater: Recovery of Water, Nutrients, and Energy)

Abstract

:
(1) Phosphorus (P) is an essential plant nutrient, and P deficiency negatively affects plant growth and development. Furthermore, P is a finite and nonrenewable resource, and there is an urgent need to recover P from some of the important waste streams in society. Newly engineered calcareous materials (sol–gel coated cat litter (CATSAN®)) can bind P from wastewater in decentralized treatment systems and potentially enable P recycling into agricultural production by direct addition of the P saturated material. (2) The effects of the addition of two P-enriched calcareous materials as fertilizers for maize (Zea mays L.) growth were investigated in a mesocosm experiment. We compared fertilization with the P-enriched materials at rates of 6, 12, 25, 50, 100 kg P ha−1 yr−1 with fertilization with commercial NPK fertilizer. (3) The P fertilization by the P-enriched materials had a significant positive effect on plant height, biomass, maximum light-saturated photosynthetic rate, respiration rate, and total P content in biomass. However, plants fertilized by the commercial NPK fertilizer performed significantly better in the majority of measured parameters at identical fertilization rates. (4) The bioavailability of the P bound to the calcareous material was very low. However, the studied material has the potential to be used as part of a decentralized treatment solution to remove and subsequently recover and recycle P from wastewater.

1. Introduction

Phosphorus (P) is an essential plant macronutrient and an important part of biochemical compounds used in respiration and photosynthesis [1,2]. P deficits will negatively affect plant growth and development [3] and result in reduced biomass production and lower grain quality and yield [4]. Hence, an adequate P supply via fertilization is crucial to maintain a sustainable agricultural food production. Currently, P fertilizers are mainly obtained from phosphate rock reserves, which, however, are finite and have been estimated to become depleted in the 22nd–23rd century at current extraction rates [5,6]. However, the phosphate rock reserve estimations have been heavily debated due to the type of models used, parameters included and assumptions made, e.g., finite reserves or price-driven changes in the size of reserves, supply–demand dynamics, future reuse and recycling, etc. [7,8]. Nevertheless, the demand for P is increasing with the growing human population, but at the same time, the P supply is decreasing [9]. Therefore, it is imperative to find strategies and processes that allow safe recovery and recycling in agriculture of P from waste streams that otherwise would be lost.
One of several solutions to recover P is to increase the harvesting and recycling of P from wastewaters back to agricultural production [10], giving added value to the wastewater. To some extent, this is already occurring in regions using irrigation with wastewater and sludge from wastewater treatment facilities as a common agricultural practice. However, this practice is getting less common in agriculture because of the other adverse effects of direct applications of wastewater and sludge to agricultural land [11].
Several decentralized wastewater treatment solutions have been developed during the past decades, among others, nature-based technologies such as treatment wetlands (TWs). TWs are engineered wetland systems designed to utilize natural processes for improving water quality. Generally, the systems have proven efficient in removing organic material and nitrogen (N) but have proven elusive in P removal [12]. The main P removal processes in TWs are sedimentation, precipitation, sorption, and biomass uptake with subsequent harvest [13]. Quantitatively the P removal is dominated by the sorption of P to the bed material and hence the P sorption capacity of the material [14].
Previous research has shown, that the P removal capacity of various inorganic materials is correlated to the calcium (Ca) content of the material [14,15]. In previous research, we have documented that Ca-rich materials can have P removal capacities of up to 32 mg P g−1 dry weight (DW). These materials can be installed as part of the treatment train in TWs, preferably outside the main bed since this eases the later exchange of the material once it is P saturated. The installation of P binding materials offers a simple and relatively passive solution to overcome the P removal limitations of TWs. Ideally, when P saturated, the material could be added directly to agricultural fields as a slow-release P fertilizer.
In this study, we aim to (i) evaluate the bioavailability of material-bound P through plant growth and photosynthetic parameters, (ii) evaluate if material-bound P is as bioavailable as commercial fertilizer, and (iii) evaluate if two different coatings will affect the P bioavailability. We hypothesized that (i) the addition of P-enriched calcareous materials will have a positive effect on plant growth and photosynthesis, (ii) fertilization at equal P levels (50 kg P ha−1 yr−1) with the P-enriched materials and a commercial NPK fertilizer will result in similar plant responses, and (iii) that fertilization with two P-enriched materials with different coatings will affect plant performance differently.

2. Materials and Methods

2.1. Engineered Materials for P Removal

The calcareous material used in this experiment was CATSAN®, which is a cat litter product composed of granules made from quartz sand and chalk. Fitting the linear form of the Langmuir adsorption–isotherm equation to the isotherm data for the material determined the P adsorption capacity of the raw CATSAN material to 32 mg P g−1 DW (data not reported here). To improve the physical stability of the CATSAN® material for installation in a P filter, the material underwent an engineering process performed by the coating group at the Danish Technological Institute (DTI). The material was coated using inorganic silica (SiO2) based hydrosol coating process, which is a technology used to improve the function of materials and substrates [16]. In brief, the two engineered materials were prepared by diluting a base coating solution of the inorganic silica sol–gel coat in demineralized water with dilution ratios of 1:10 and 1:1. Subsequently, batches of CATSAN® were soaked in beakers with the coating solutions (500 g material to 1 L coating solution) for 5 min at room temperature. The mixture with material and coating solution was carefully stirred halfway through the exposure period with a spatula until no air bubbles from the CATSAN® material were observed. After ended exposure, the excess coating solution was drained by filtration, and the materials were oven dried (140 °C for 1 h). The resultant materials were designated as material I and II, referring to the ratios of 1:10 and 1:1, respectively. The coating process was performed to improve the mechanical properties of the material while, at the same time, maintaining a high P-sorption capacity. The P adsorption capacity of the coated materials was, however, reduced, compared to that of raw CATSAN®. The P adsorption capacity of material I and II were estimated to be 26 and 12 mg P g−1 DW, respectively, by fitting the linear form of the Langmuir adsorption-isotherm equation to the isotherm data (data not reported here).

2.2. P-Enriched Material Preparation

The P-enriched materials were prepared by 13 days of exposure to deionized water spiked with KH2PO4. This was performed to mimic water-saturated conditions in P-filter treating wastewater, but with accelerated P load, compared to the normal load in wastewater. More specifically, four containers (10 L) were each prepared with 4.5 L deionized water, 500 mL stock solution (6.4 g PO43−-P L−1), and 1.2 kg engineered material. Throughout the exposure period, the P solution was amended with an additional P four times in an attempt to maintain a P concentration of 640 mg P L−1 in the solution. The number of P additions was based on the apparent P-sorption capacity of the materials because we strived to P-saturate the materials, resulting in material P concentrations similar to their P-sorption capacities. The solutions were hand mixed once every day and continuously stirred with a water pump to ensure a homogeneous exposure. Afterward, the materials were removed from the mixture, oven dried (105 °C for 3 days), and their P concentration analyzed (7.6 and 12.0 mg P g−1 DW for material I and II, respectively; analytical details will follow).

2.3. Plant Preparation

The plant species used in the experiment was maize (Zea mays L.). Seeds of Northern Extra Sweet Z. mays (article no. 8719, Weibulls, Econova, SE) were soaked in tap water for 24 h and pregerminated in well-watered commercial organic growth substrate (Sphagnum, substrate mixture no. 4, Pindstrup Mosebrug A/S) in a walk-in growth chamber. The climatic settings were set to a 14/10 h light/dark cycle with day/night temperature of 25/20 °C and relative air humidity of 60/80%. The light intensity (Photon Flux Density) was 400 µmol photons m−2 s−1 during the light phase. The germination trays were covered with white plastic to retain moisture and protect the emerging seedlings throughout the pre-germination period. After one week, 60 similar-sized seedlings were transplanted to the experimental units containing the preprepared growth medium.

2.4. Experimental Setup and Growth Medium Preparation

The experimental setup consisted of 12 treatments each with five replicates; control, NPK fertilizer, and five levels of P-enriched material I and II, respectively. Each experimental unit was composed of a plastic pot (Asurface = 0.023 m2, V = 3.5 L, D = 0.17 m) with a saucer containing the preprepared growth medium and a pregerminated seedling. The base of the growth medium for each unit consisted of a mixture of 2 L low nutrient custom-made sphagnum (Pindstrup Mosebrug A/S, DK) and 1 L sand (washed beach sand, DK), with additions of P-enriched material and/or commercial fertilizers according to the treatments. The growth medium and nutrients added were thoroughly mixed to ensure a homogenized soil. The P addition to the material treatments and NPK fertilizer treatment was based upon the P area requirements established by the Danish Ministry of the Environment and Food [17] of 30 kg P ha−1 yr−1. A range of material treatments of 6, 12, 25, 50, 100 kg P ha−1 yr−1 were designed, spanning the recommended P area requirements. The amount of P-enriched material added to the experimental units was estimated based on the desired fertilization level and the P concentration in the materials. Treatments with P-enriched materials were supplemented with inorganic NK fertilizer to secure that the treatments only differed in P level added. The commercial NK fertilizer (Pioner NK Macro 14-0-27 + Mg Hortensia, Horticoop Scandinavia A/S, DK) was added, both to the material treatments and the control treatment; hence, no P source was added to the control treatment. To achieve treatment of 50 kg P ha−1 yr−1 for the NPK fertilizer treatment, the commercial fertilizer (Pioner NPK Macro 10-4-25 + Mg Yellow, Horticoop Scandinavia A/S, DK) was added, and due to discrepancy in the N content compared to the remaining treatments, the N content was adjusted by adding ammonium nitrate (NH4NO3) to ensure all treatment had an N addition of 250 kg N ha−1 yr−1. Hence, the P addition in treatment 50 for material I and II corresponds to the P content in the NPK treatment. Mass balance calculations were made for both P and N to ensure that the treatments only differed in the P addition.

2.5. Plant Growth and Morphological Measurements

The experiment was performed in the same growth chamber with the climatic settings as described in Section 2.3. The experimental units were distributed with 6 units in 10 boxes in a randomized block design; hence, each box contained five levels of material treatment and control or an NPK fertilizer treatment with both the unit position in the box and the positions of the boxes being randomized. The plants were grown for eight weeks and every second day, deionized water with a commercial micronutrient (Pioner micro plus with iron, Horticoop Scandinavia A/S, DK) of 0.1 mL L−1 was supplied containing boron (B) 0.25%, copper (Cu) 0.13%, iron (Fe) 1.61%, manganese (Mn) 0.63%, molybdenum (Mo) 0.06% and zinc (Zn) 0.31%. Water was slowly added every second day until reaching the field capacity of the growth medium to avoid any overflow from the saucer and nutrient leaching. The boxes were repositioned once weekly to minimize chamber edge effects.
Weekly measurements of plant morphological parameters, i.e., plant height, number of leaves, and chlorophyll content were performed. The maximum height was measured from the soil surface to the tip of the longest leaf stretched out vertically. When counting leaves both dead and alive leaves were noted separately. The relative chlorophyll content (ChlSPAD) in the youngest fully developed (YFD) leaf was nondestructively measured with a SPAD-502 Plus Chlorophyll Meter (Spectrum Technologies Inc., Aurora, IL, USA).

2.6. Photosynthetic Measurements

The photosynthetic measurements were performed on the second youngest fully developed (2YFD) leaf of each plant with an LI-6400 XT infrared gas analysis technique (IRGA) (LI-COR Biosciences Inc., Lincoln, NE, USA, 6400–02B red–blue LED source) after the plants had grown for eight weeks in the treatments. The leaf microclimate control system was set to a CO2 concentration at 400 μmol mol−1, an airflow rate at 400 μmol s−1, and a temperature at 25 °C. The measurements were performed during five consecutive days in a time window from 10 a.m. to 3 p.m. To determine the maximum light-saturated photosynthetic rate (Amax) light was supplied at a photosynthetic photon flux density of 1600 μmol PAR photons m−2 s−1. The stomatal conductance (gs) and transpiration rate (E) were determined simultaneously with Amax, while the respiration rate (Rd) was measured in darkness.

2.7. Biomass Harvest

The above- and belowground biomass were harvested for each unit after the plants had grown for eight weeks in the treatments. The aboveground biomass was divided into stems, leaves (alive and dead leaves, and 2YFD leaf), while the belowground biomass constituted all plant biomass below the soil surface. The 2YFD leaf was photographed and later processed using ImageJ version 1.50d (LOCI, Madison, WI, USA) for calculation of the leaf area (LA). The biomass fractions were dried (60 °C for 4–5 days) and the fractions weighted (DW). The DW of the 2YFD leaf was used for the calculation of specific leaf area (SLA) based on the ratio between the leaf surface area and the dry weight (m2 kg−1 DW).

2.8. Soil and Tissue Concentrations of P and Other Elements

Soil samples were collected from each unit after harvest of belowground biomass. To ensure a representative and homogenized soil sample, the growth medium was mixed in a tray and nine subsamples (15 mL) were pooled in one sample (135 mL) and dried to constant weight (60 °C for 5–7 days). Soil samples (n = 3) and biomass fractions (n = 3) were ground in a MKM6003 rotating blade grinder (Bosch, Gerlingen-Schillerhöhe, DE). Subsamples of the grounded material (0.4–0.5 g DW) were digested in 4 mL nitric acid (65% HNO3) and 2 mL hydrogen peroxide (30% H2O2) in a Multiwave 3000 microwave digestion system (Anton Paar, Graz, A). Blanks were included in all analyses.
The concentrations of P, Ca, magnesium (Mg), iron (Fe), and aluminum (Al) for soil samples and P, Ca, Mg, Fe, Al, manganese (Mn), and potassium (K) for biomass fractions were analyzed in an Optima 2000 DV ICP-OES (Perkin Elmer Instruments Inc., Shelton, CT, USA) equipped with an autosampler. The total P content (mg P) in the plant biomass was estimated based on the average biomass DW fractions and average P concentrations in the plant fractions.

2.9. Statistics

The effects of P addition and material type on plant growth parameters were analyzed by one-way and two-way ANOVAs. Prior to statistical analysis, all data were tested for homogeneity of variance by Levene’s test, and if necessary logarithmic transformed before analysis. For clarity, all data are presented as untransformed values. The NPK fertilizer and control treatments were excluded in the two-way ANOVA analysis, resulting in the “P addition” effect having five levels (6, 12, 25, 50, 100 kg P ha−1 yr−1) and the “Material” effect having two levels (material I and II). All 12 treatment combinations were included in the one-way ANOVAs, and post hoc Tukey tests were applied to identify significant differences between individual treatment combinations from the one-way ANOVAs. Multivariable correlation analysis was performed for a selection of the parameters (plant height, number of leaves, chlorophyll content, total biomass, total P content in biomass, Amax, and SLA) to explore correlations among parameters. All statistical analyses were conducted in JMP 14 at a significance level of 0.05 and figures were prepared in GraphPad Prism 7.00.

3. Results

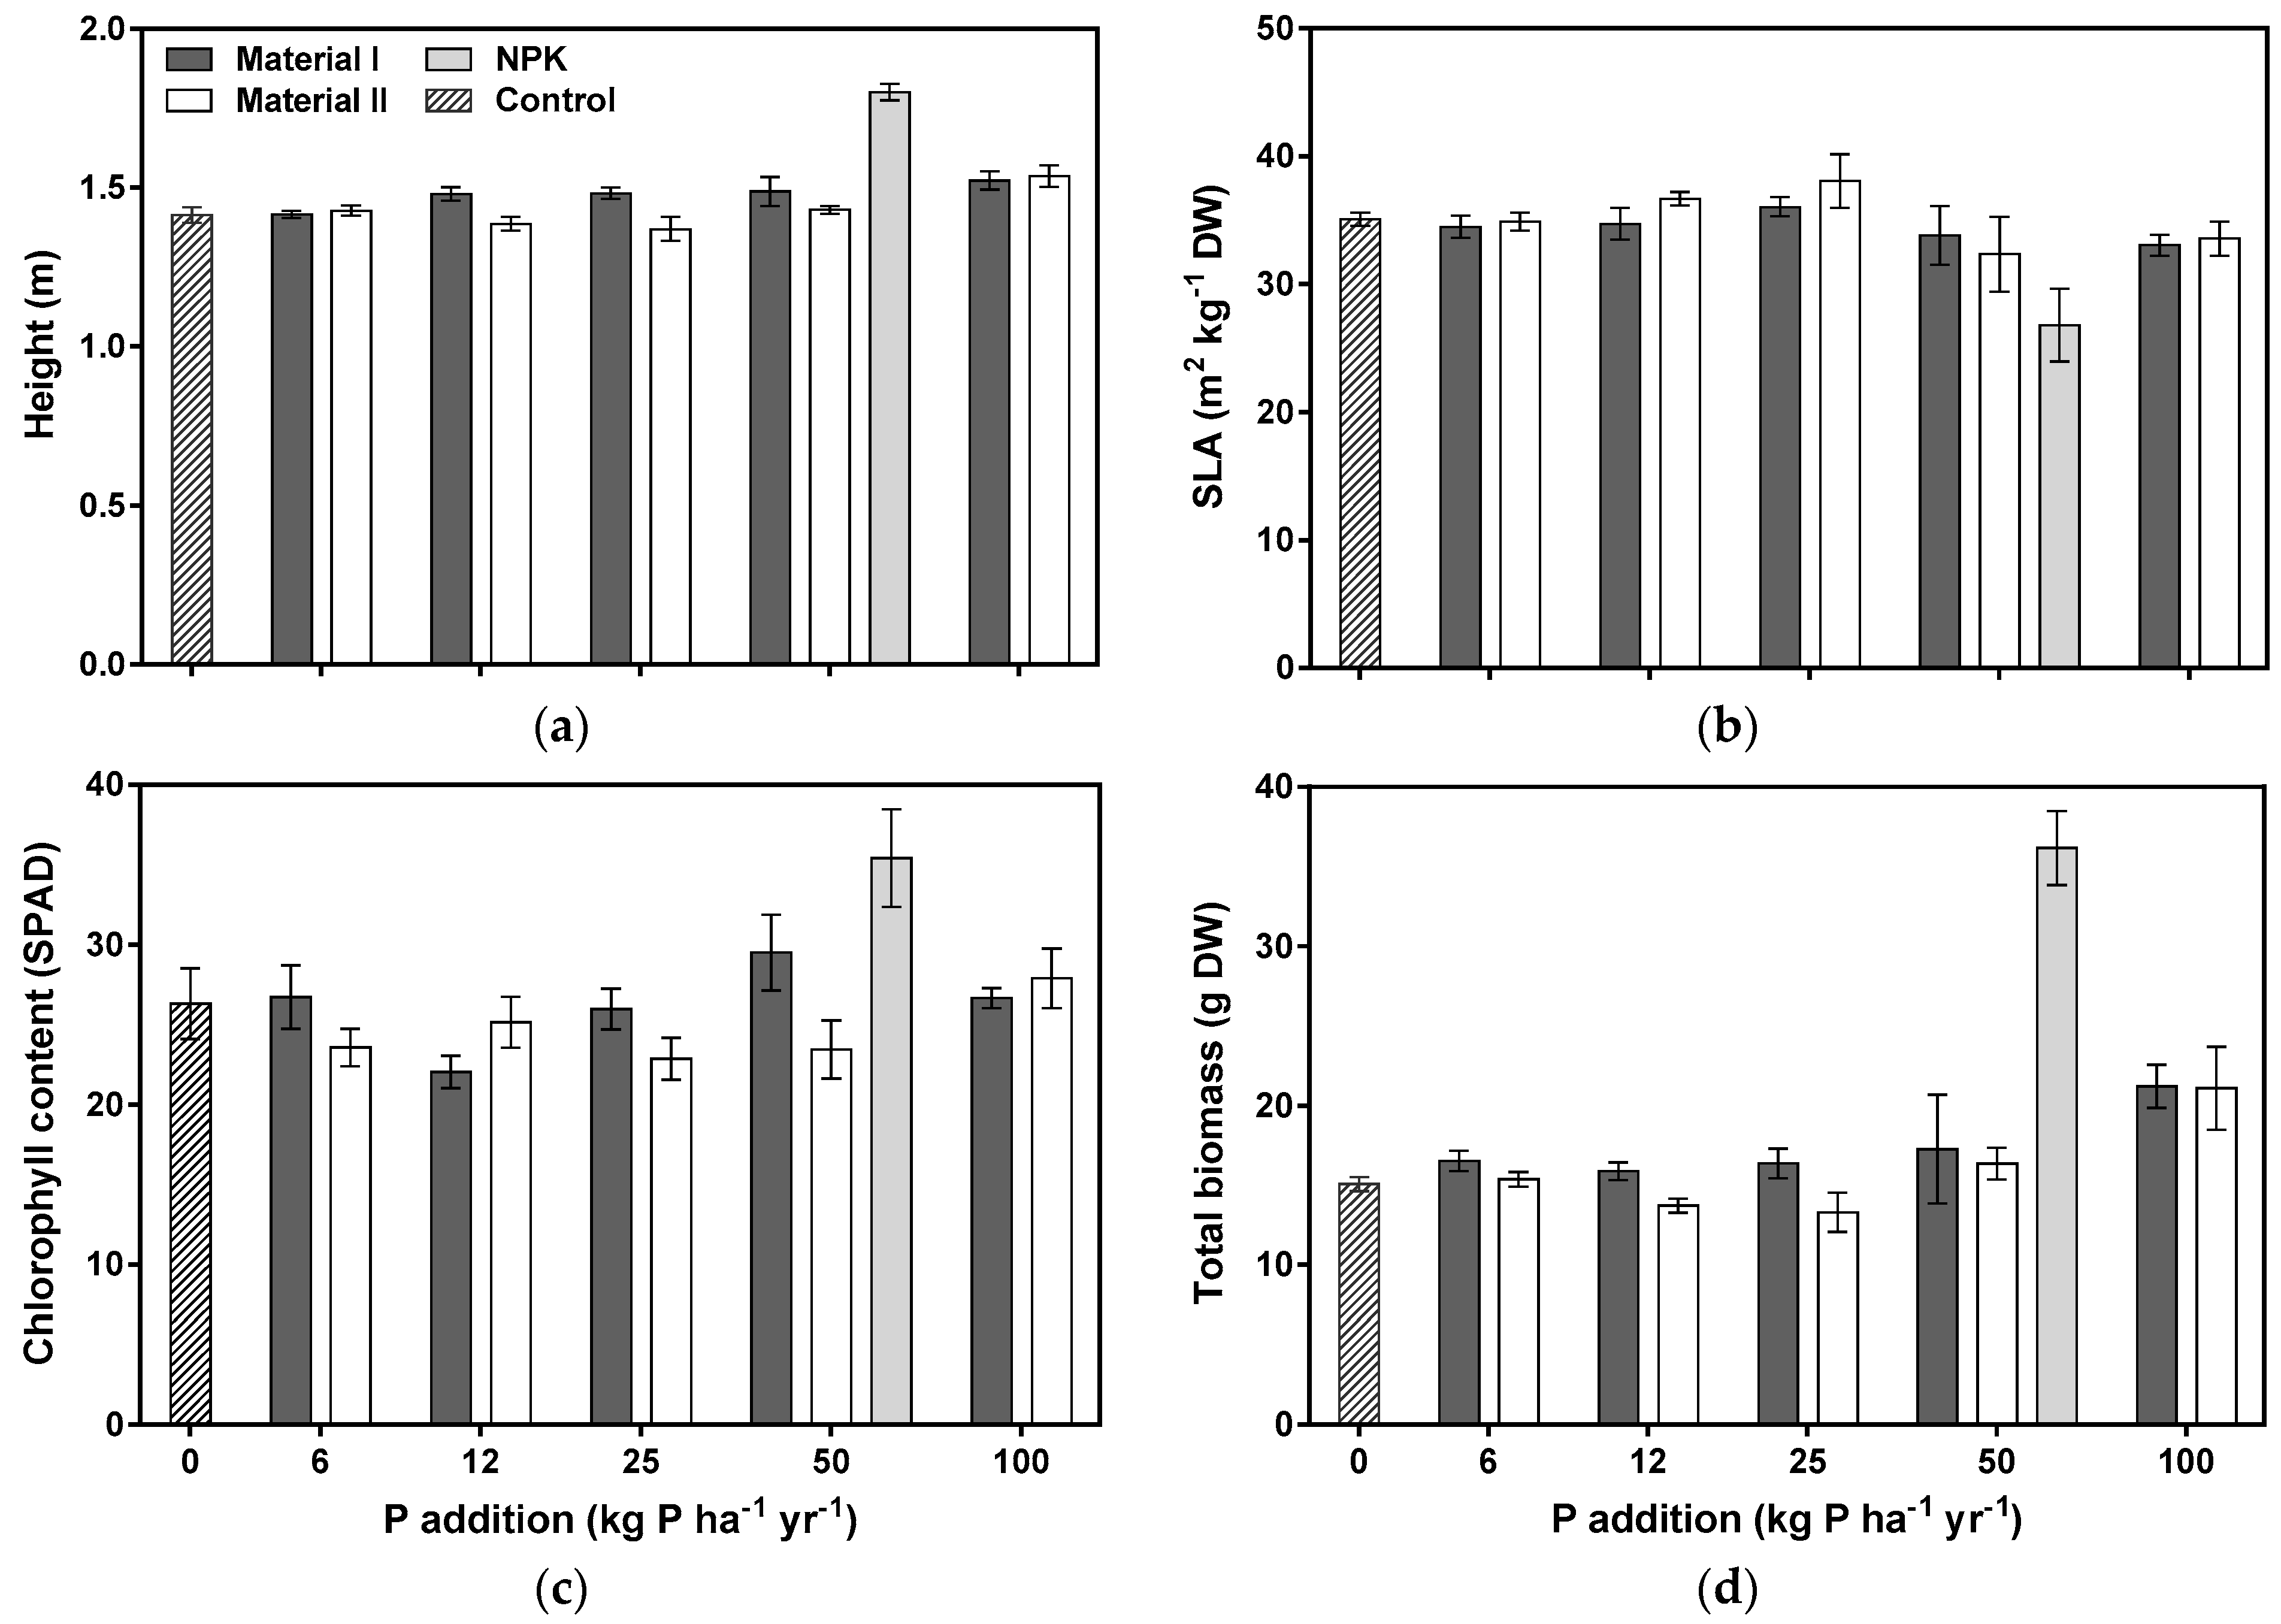
3.1. Plant Growth and Morphological Measurements

The P addition had a significant effect on the height and the total biomass, with the P addition explaining 24.5% and 33.9% of the variability, respectively (Table 1, Figure 1a,d). Hence, an addition of the P-enriched material resulted both in taller plants and higher total biomass production. Furthermore, a significant effect of the type of material was observed for the plant height, explaining 7.1% of the variability (Table 1, Figure 1a). Hence, material I resulted in slightly taller plants, compared to material II. None of the remaining growth and morphological parameters, i.e., number of leaves, biomass, SLA, or ChlSPAD were affected by the type of material added (Table 1). Likewise, there were no effect of the P addition on the number of leaves, SLA, or ChlSPAD (Table 1). However, despite no main parameter effects, the only significant two-way interaction for all parameters tested was for the relative chlorophyll content, in which the two-way interaction contributed to 18.0% of the variability in the data (Table 1).
In addition, one-way ANOVAs for all treatments were performed to identify differences between treatments. Significant differences in plant growth and morphological parameters were observed for the plant height (F(11, 48) = 14.74, p < 0.0001) and the total biomass (F(11, 48) = 15.00, p < 0.0001). Tukey–Kramer post hoc tests revealed that plants grown in the NPK treatment were significantly taller and had a larger total biomass than plants grown in remaining treatments. The plants in the NPK treatment produced 52–55% more biomass, compared to plants grown in the 50 kg P ha−1 yr−1 material treatments.

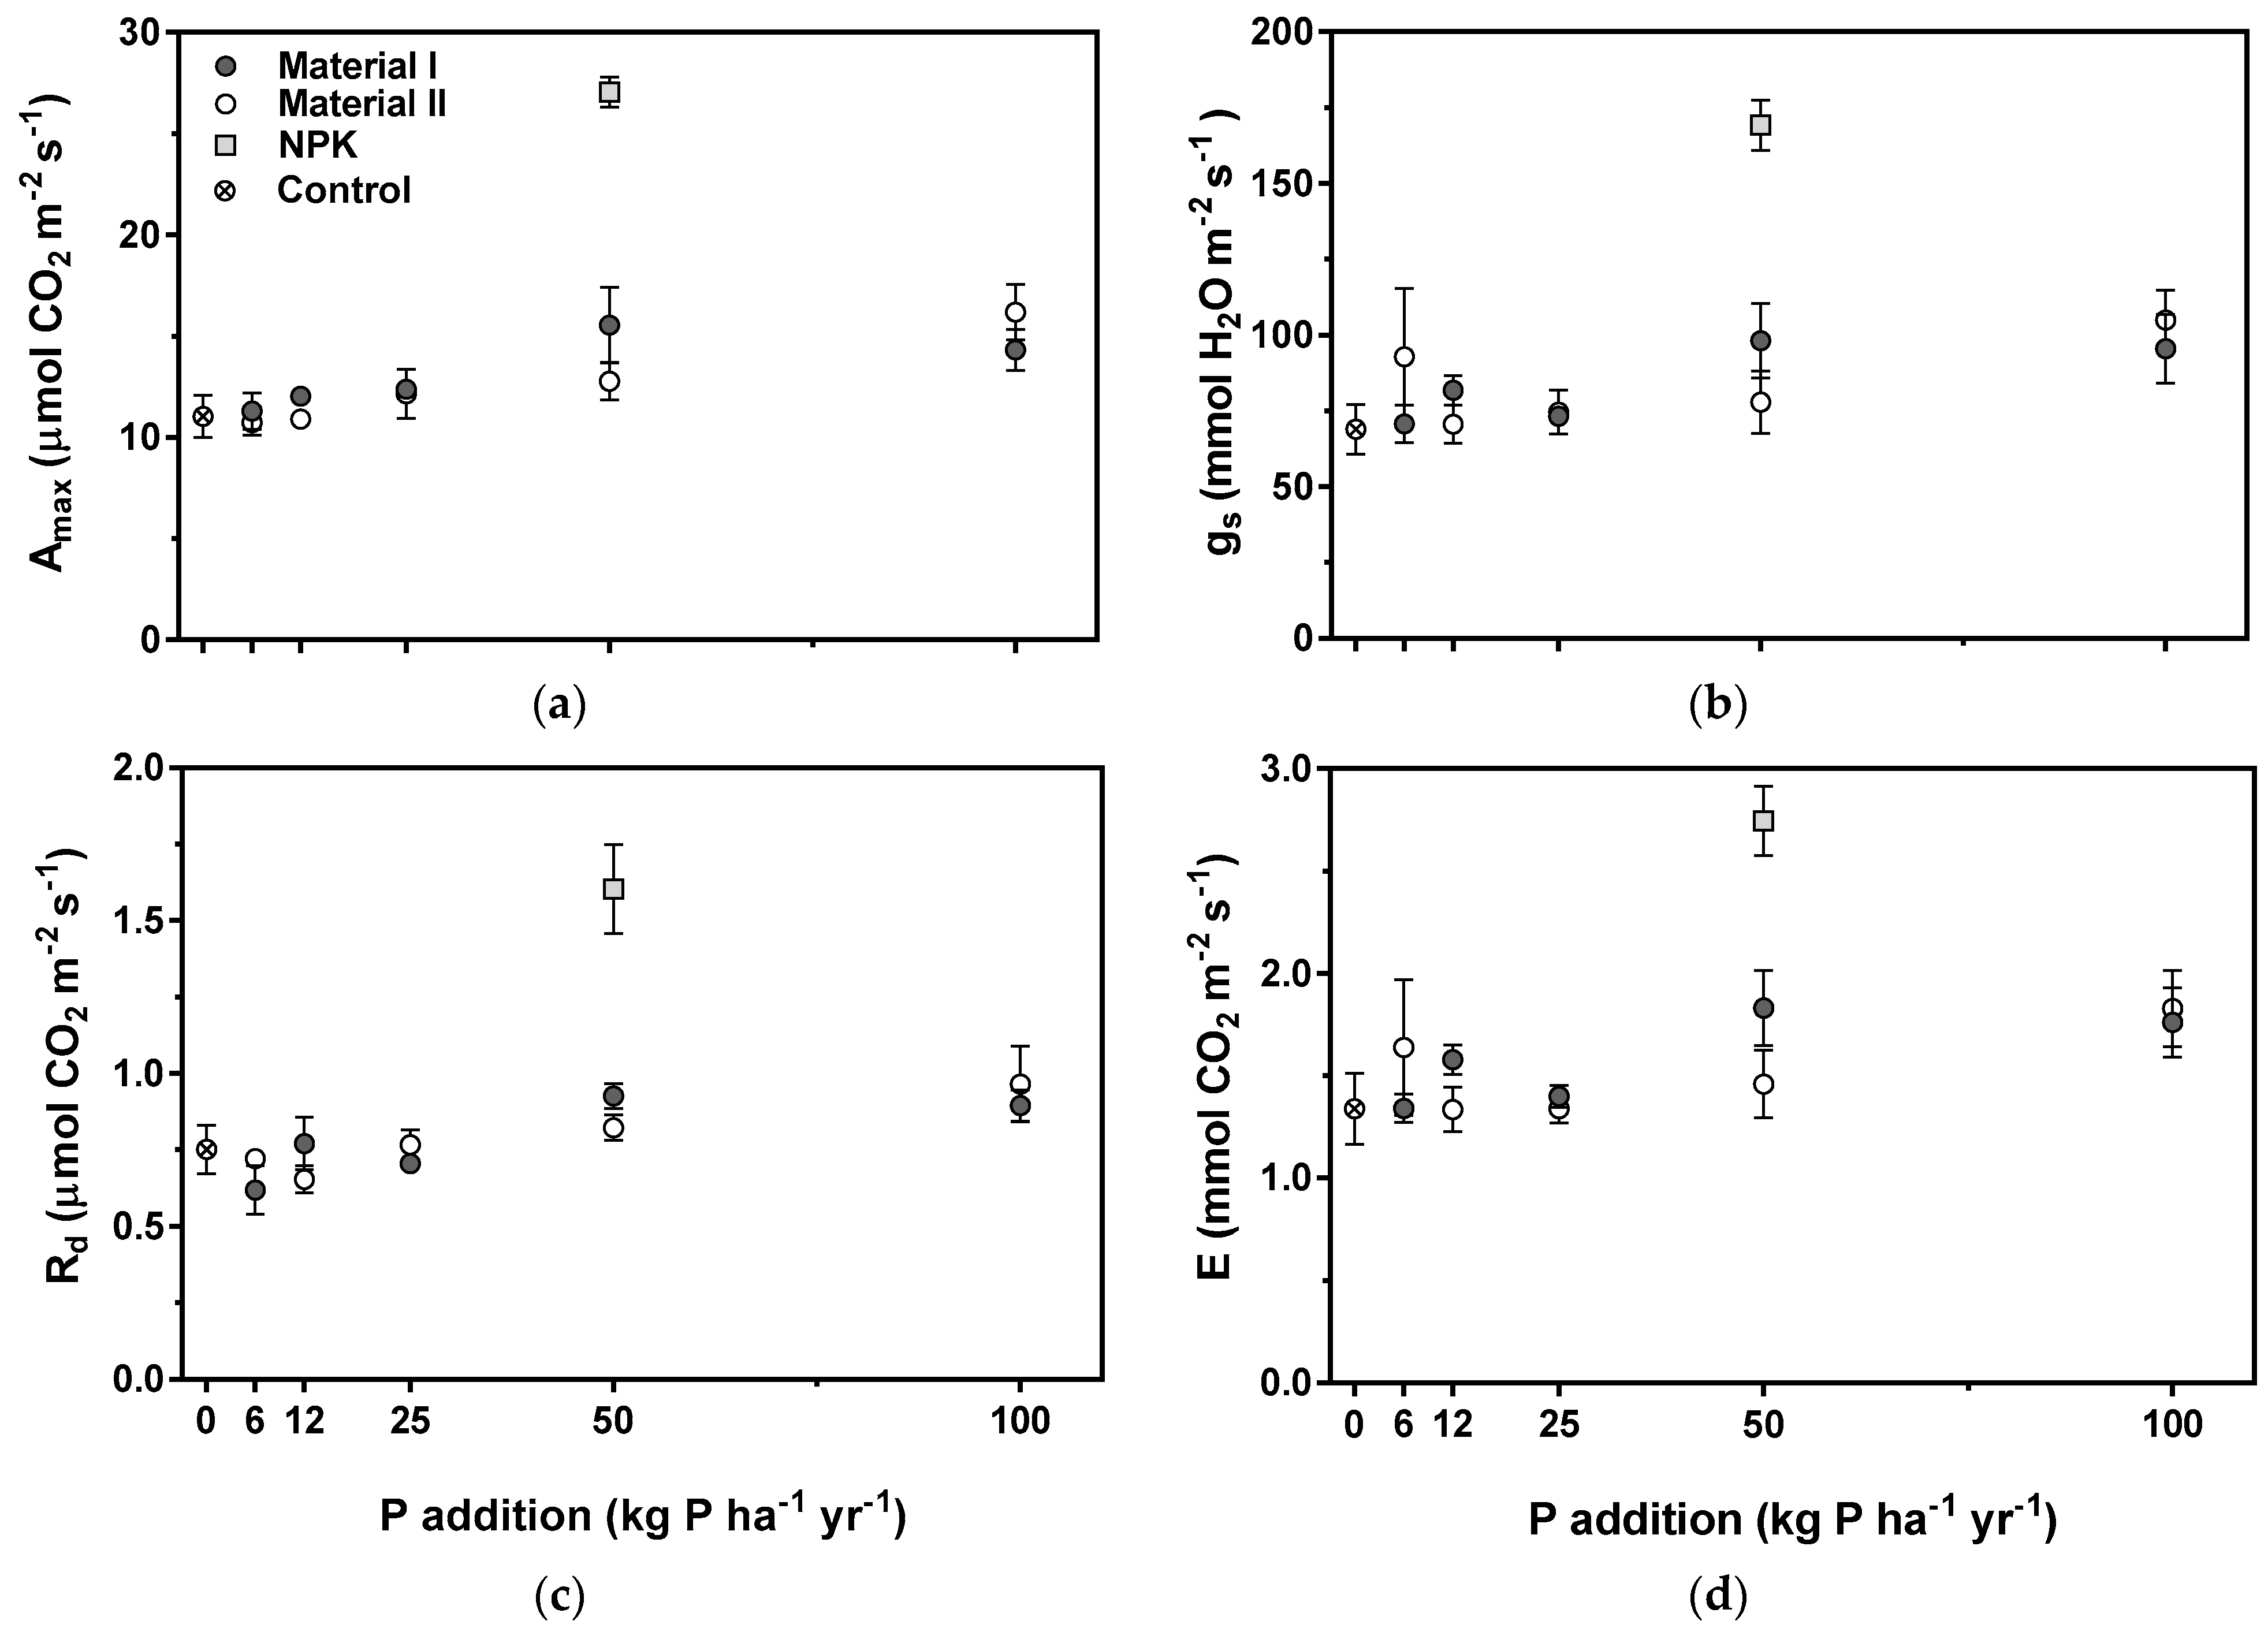
3.2. Photosynthetic Measurements

The P addition had a significant effect on the maximum light-saturated photosynthetic rate and the respiration rate, with the P addition explaining 35.0% and 35.3% of the variability, respectively (Table 1, Figure 2a,c). Hence, the addition of the P-enriched material resulted in higher Amax and Rd rates. On the other hand, no effects of the P addition were observed for the transpiration and the stomatal conductance (Table 1, Figure 2b,d). The type of material did not affect any of the photosynthetic parameters, and likewise, no significant two-way interactions were found for any of the parameters (Table 1).
Additionally, one-way ANOVAs for all twelve treatments in the photosynthetic measurements were performed, and significant differences between all the photosynthetic parameters (Amax (F(11, 48) = 20.08, p < 0.0001), gs (F(11, 48) = 7.38, p < 0.0001), Rd (F(11, 48) = 11.88, p < 0.0001) and E (F(11, 48) = 5.94, p < 0.0001)) were found. As for the growth and morphological parameters, the Tukey–Kramer post hoc test revealed that plants grown in the NPK fertilizer treatment had significantly higher rates for all photosynthetic parameters, compared to plants grown in all other treatments.

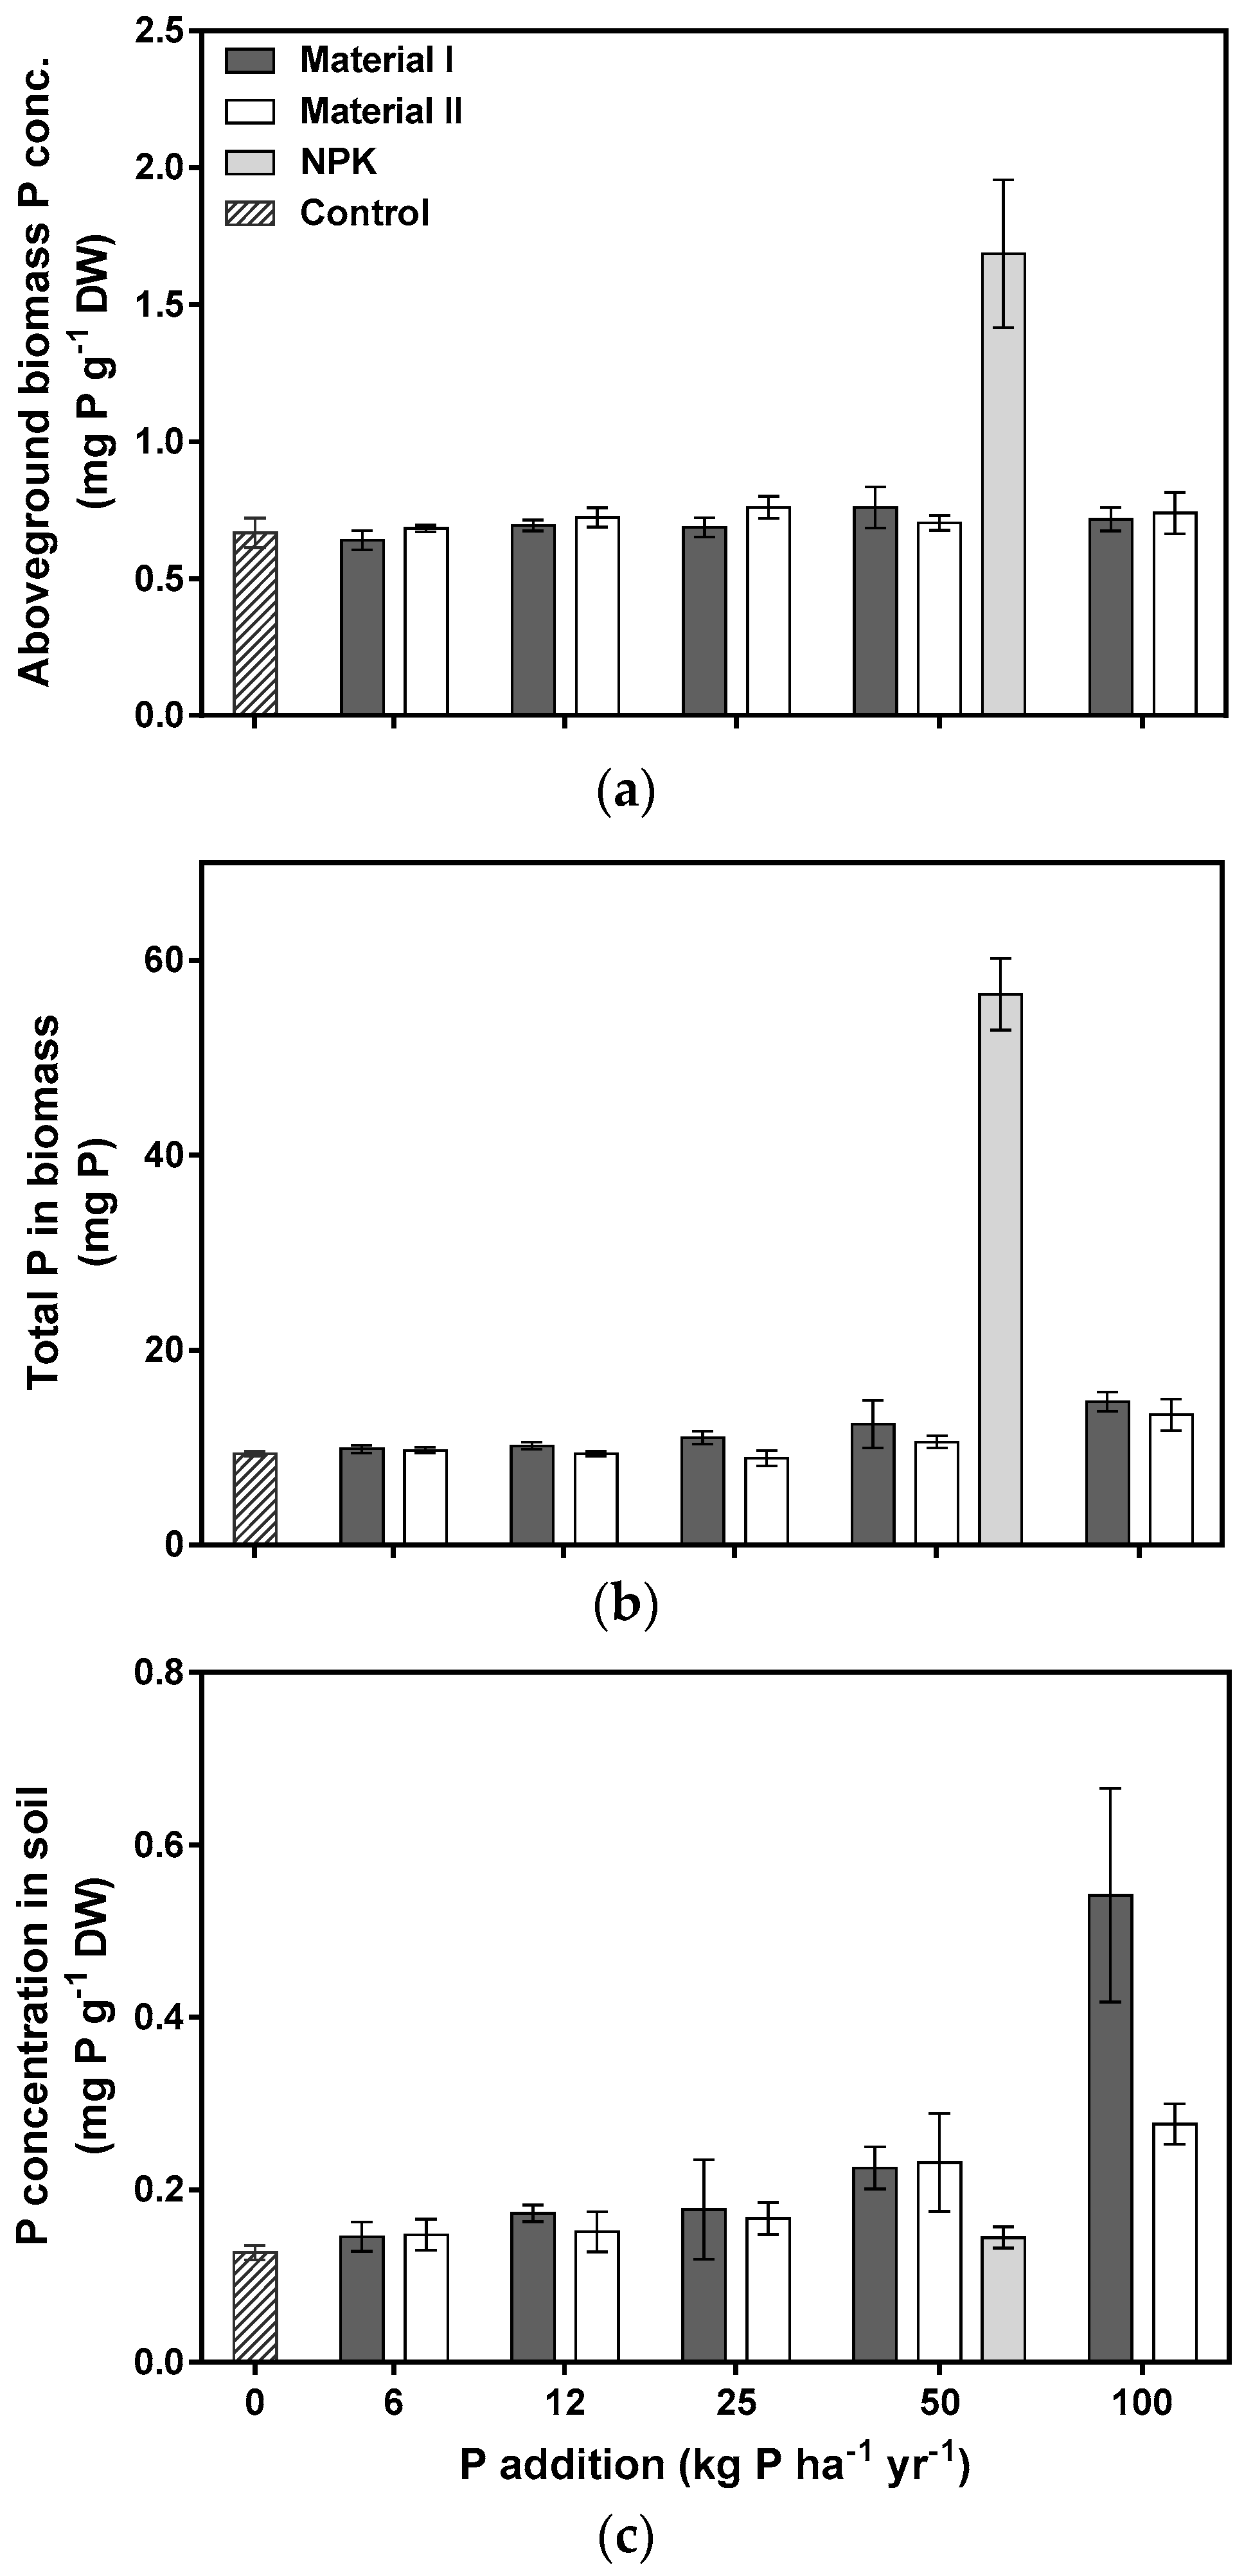
3.3. Soil and Tissue Concentrations of P and Other Elements

The P addition had no significant effect on the average P concentration in the aboveground biomass (Table 1, Figure 3a). However, the P addition had a significant effect on the total biomass P content with the P addition explaining 34.6% of the variability (Table 1). Thus, the addition of P-enriched material significantly increased the total P content in the biomass but did not increase the average tissue P concentration. Moreover, the P addition had a significant effect on the soil P concentration, with the P addition explaining 52.4% of the variability (Table 1, Figure 3b). Hence, the increased P addition also resulted in a larger soil P concentration. However, none of the parameters, i.e., total biomass P content, aboveground biomass P concentration, and soil P concentration, showed any significant effect of the type of material added (Table 1).
One-way ANOVAs for all treatments revealed significant differences in the P concentration for the aboveground biomass (F(11, 24) = 10.23, p < 0.0001) and the total biomass P content (F(11, 48) = 84.35, p < 0.0001). The following Tukey-Kramer post hoc test revealed that plants grown in the NPK treatment had the highest P concentration in the aboveground biomass and the largest total biomass P content.
The results for the mineral element concentrations in the soils showed that the NPK fertilizer treatment contained less Al and K than the remaining treatments, and that the control treatment contained more Fe and Al than the remaining treatments (Table 2). However, in general, the NPK treatment contained less of all elements, compared to the control treatment. Similar element concentrations of Ca, Mg, and Mn were found for all treatments (Table 2). In addition, the soil P concentration was also similar across the different treatments, with the exception of the material I of 100 kg P ha−1 yr−1 having a larger soil P concentration (Figure 3c). The only difference in the element concentrations for the biomass was found for K concentration since the plants grown in the NPK treatment contained half as much K as plants in the other treatments (Table 3).

3.4. Multivariate Correlations Analysis

Several significant correlations between the seven plant parameters were found in the multivariate correlation analysis. The total P content in the biomass was positively correlated (p < 0.001, R > 0.62) with plant height, total biomass, ChlSPAD, and Amax (Table 4). Hence, the plants with the highest total P content in the biomass were the tallest plants, had the largest biomass, the highest chlorophyll content, and the highest maximum light-saturated photosynthetic rate. Furthermore, the total biomass was positively correlated (p < 0.001, R > 0.66) with plant height, ChlSPAD and Amax (Table 4). In addition, the SLA was significantly negatively correlated (p < 0.05, R < −0.27) with the height, ChlSPAD, total biomass, total P content in biomass, and Amax (Table 4), showing that the plants with a low SLA had larger biomass and total P content in biomass and vice versa, indicating that plants with the highest biomass had thicker leaves with lower SLA values.

4. Discussion

4.1. The Material-Bound P Was Partly Bioavailable for Maize Growth

In hypothesis (i), we predicted that the P-enriched material addition would cause positive effects on the total P content, biomass production, and photosynthetic parameters of the plants. As explained below, our results supported hypotheses (i).
The P addition increased the total P content in the biomass, and this was explained by a higher biomass production. The total P content increased with higher P additions, and it was caused by a larger biomass and was not due to an increase in the tissue P concentration. This was apparent since we found an effect of the P addition on the biomass production and no effect for the tissue P concentration. These positive effects support the first part of hypothesis (i) and are in agreement with previous findings for total P content [15,18,19] and biomass production [15,19,20,21] in relation to P addition.
Furthermore, the positive effects of the increased P addition also resulted in plants growing thicker leaves with a larger surface area. In the matrix correlation, we found that the specific leaf area was negatively correlated with the total P content and biomass production. Both SLA parameters (leaf area and dry weight) increased with the P addition, but further data inspection of the correlation data revealed that the percentage-based increase was larger for leaf DW. Hence, the smaller SLA values were a consequence of a greater increase in DW, compared to LA, and the observed negative correlation between SLA and total P content was therefore caused by plants growing thicker leaves. The sensitivity of leaf surface area and leaf biomass under P deficiency is supported by former research, with plants reducing both leaf area and leaf biomass in response to low P availability [3,22].
Moreover, plants with a larger total P content, biomass, and thicker leaves had a higher relative chlorophyll content. The correlation matrix showed that the ChlSPAD was negatively correlated with SLA and positively correlated with the total P content and biomass production. This indicates that as the leaves grew larger and thicker with the increasing total P content and biomass, a simultaneous increase in the chlorophyll content was observed. This implies that the plants’ overall health status increased with the P addition. This is in agreement with former research, e.g., Usuda [3] found that total P content, fresh weight, and chlorophyll content increased with P availability. These positive effects on the ChlSPAD support hypothesis (i) because the P addition had a positive effect on the plant growth in which ChlSPAD is included.
Lastly, the thicker leaves with a higher chlorophyll content enabled a higher maximum light-saturated photosynthetic rate and a higher respiration rate. The correlation matrix showed that Amax was positively correlated with the chlorophyll content, as we would have expected based on former research [2,3]. This is supported by the positive ANOVA main effect of P addition on Amax and Rd. Furthermore, the matrix correlation revealed that the SLA was negatively correlated with Amax. The increase in Amax with P addition was thus explained by a combination of thicker leaves and a higher chlorophyll content, enabling higher photosynthetic activity per unit leaf area. The increase in Amax was not due to an increase in the tissue P concentration since we did not find any effect of P addition on the tissue P concentration. To sum up, this increase in Amax and Rd was in agreement with hypothesis (i).

4.2. The Material-Bound P Was Not as Bioavailable as the Commercial Fertilizer

The plants grown in NPK fertilizer treatment performed better in the majority of measured parameters compared to plants grown in the material treatments. This result contradicted hypothesis (ii) which predicted that treatments with equal P addition (50 kg P ha−1 yr−1) would perform similarly in the measured parameters. If the material-bound P was as bioavailable as the P in the commercial NPK fertilizer, similar growth and photosynthetic responses would have been expected. However, plants grown in the NPK treatment had five times higher total P content, twice the biomass production, and twice the maximum light-saturated photosynthetic rate, compared with material grown plants in equal P addition. Plants grown in the NPK fertilizer treatment even outperformed the material treatment with the double amount of P added (100 kg P ha−1 yr−1). Even if the results were not as expected, our findings show that the material-bound P was partly bioavailable for maize plant uptake since several parameters were positively affected by the material addition. However, the plants grown in the NPK fertilizer treatment outperformed plants grown in the material treatments, and we, therefore, had to reject hypothesis (ii).

4.3. The Photosynthetic Rates and Chlorophyll Content for Material Treatments Were Low

The photosynthetic rates for plants grown in material treatments were low, compared to both the NPK treatment and other studies. The range of Amax rates measured for 50 kg P ha−1 yr−1 material treatments was 12.8–15.5 µmol CO2 m−2 s−1, and this was less than the range reported from former research with Amax rates of 17.5–25.3 CO2 m−2 s−1 [2,3,23] for field- and pot-grown maize plants. Furthermore, the materials’ Amax rates differed substantially from the rate of 27.1 µmol CO2 m−2 s−1 measured for the plants grown in the NPK fertilizer treatment. These results show that the plants grown in material treatments were P limited and not able to perform as well as plants grown with commercial fertilizer.
The effect of the P-enriched material addition on the chlorophyll content was not as apparent as expected, and the ChlSPAD levels for the materials treatments were low. We expected that the ChlSPAD content would increase with the P addition since former research has shown that the chlorophyll content in maize was negatively affected by P deficiency [2,3]. However, we did not observe any main effect of the P addition on ChlSPAD, and therefore, no direct effect of the P addition. Nevertheless, we found an interaction between the total P content and ChlSPAD in the matrix correlation, which supported the expected relationship. Moreover, the ChlSPAD levels for the material treatments were low, e.g., the material treatment of 50 kg P ha−1 yr−1 had a ChlSPAD content range of 23–30, which were below both the ChlSPAD content for plants grown in the NPK treatment and the content reported by Liu et al. [24] of 37–38 for field-grown maize of same vegetative stage with similar N and P addition. These results also supported the fact that the material-bound P was not as bioavailable as the commercial fertilizers.

4.4. The P Content for Material Treatments Were Less than Expected

The total P content in the biomass for plants grown in the NPK treatment was comparable with those reported in other studies, but plants grown in the material treatments contained less than expected. The total P content in the biomass of 25 kg P ha−1 for the plants grown in the NPK fertilizer treatment was in the range of other experimental findings, e.g., the total P contents in the aboveground biomass for field-grown maize with a P addition of 30 kg ha−1 were 21 kg P ha−1 [25] and 29–34 kg P ha−1 [26]. However, our NPK fertilizer treatment had a higher P addition but was not allowed to reach full maturity, as it was for the case in the experiment performed by Miller et al. and Key et al. [25,26]. Material treatments obtained much smaller total P contents of 5 kg P ha−1, hence, much less than the reported yields from the literature and our NPK fertilizer treatment.
Furthermore, plants grown in the material treatments had low tissue P concentrations, compared to those observed for plants grown both with the NPK fertilizer treatment and in other studies. The aboveground tissue P concentration for plants grown in the material treatments ranged 0.64–0.76 mg P g−1 DW, which was considerably lower than the shoot-tissue P concentration of 1.8–1.9 mg P g−1 DW for pot-grown maize plants reported by Dessougi et al. and Assuero et al. [20,22]. This was also supported by an experiment with field-grown maize running for 15 years, in which Tang et al. [27] found an overall average tissue P concentration of 1.8 mg P g−1 DW with a P addition of 15.7–60.3 kg P ha−1. The tissue P concentration of the plants grown in the NPK treatment was comparable with the findings in literature report above, with a P concentration of 1.7 mg P g−1 DW.
The tissue P concentrations indicated that plants grown in the material treatments were below the limit for optimal growth. According to former research, the tissue P concentration for optimal maize growth has been reported to 1.5–2.9 mg P g−1 DW [19,25,28,29]. Plants grown in the material treatments had concentrations well below this limit, with P concentrations ranging 0.64–0.76 mg P g−1 DW, while plants grown in the NPK treatment was in the reported internal P requirement range. These results show that the plants grown in the materials treatments were P limited, even though a P addition effect of the materials was found.

4.5. The Bioavailability of P Is Affected by Different Parameters

Previous studies have found numerous parameters affecting the P bioavailability [15,26,30,31,32], and it can be difficult to conclude which parameter played the greatest role in this experiment. Blake et al. [30] compared the P balance for three European agricultural soils in a long-term (30 years) field experiment and found contrasting differences due to soil type, but the climate and the balance of other major nutrients also affected the P dynamics. In addition, parameters such as specific soil bacteria capable of increasing the bioavailable P [26,31], the type of fertilizer [33,34], plant-related factors [35,36], and soil sorption and desorption characteristics [15,30] have been reported to affect the bioavailability of P. Some of these parameters may contribute to explain the lack of a strong dose–response curve between the P-enriched material and measured parameters. However, the single most obvious explanation is that the P bound in the P-enriched calcareous materials tested in this study, has a low bioavailability, at least in the short term (weeks).
The material-bound P was partly bioavailable because a slow P release occurred; however, it was not as bioavailable as we expected. The sorption characteristic of the materials may be responsible for the low bioavailability of the material-bound P. Previous research has shown that soils with a high P sorption capacity needed a larger P addition, compared to soils with a lower sorption capacity to achieve equal P concentrations in the soil water [15]. It could therefore be speculated that materials with high sorption capacities could also be prone to a low P bioavailability because the sorption could influence the exchange of P between the material, soil water, and plant. The two materials differed in their P adsorption capacities, with material I having the largest P sorption capacity. We, therefore, predicted in hypothesis (iii) that the two materials would affect the bioavailability differently, and these differences would be observed in the measured plant response parameters. However, we did not generally observe any difference in the measured response parameters caused by the type of material, as we only found an effect of the material type on plant height and no effect for the remaining parameters. We, therefore, had to reject hypothesis (iii) and conclude that the bioavailability not was affected by the material type.

5. Conclusions

The results from this experiment showed a low bioavailability of the material-bound P because and it was only partly bioavailable in the short term. Nevertheless, the P addition through material-bound P increased plant height, biomass, maximum light-saturated photosynthetic rate, respiration rate and the total P content in the biomass. The low P bioavailability was especially evident in the low tissue P concentrations and maximum light-saturated photosynthetic rates when comparing the plants grown in the material treatments with the NPK fertilized plants.
It is, however, important to stress that the studied calcareous material provides the potential for P removal from wastewater, as a P filter can be easily installed/post-installed as part of a decentralized treatment system. More experiments are, however, needed (i) with higher P levels in the material treatments and other growth substrates to clarify the bioavailability of the material-bound P and (ii) to optimize the coating of the material in relation to both removal of P from wastewater and the possibility for P recovery and recycling in agriculture.

Author Contributions

Conceptualization, C.E., S.M.J., D.K., C.A.A., and H.B.; methodology, C.E., S.M.J., D.K., C.A.A., and H.B.; software, S.M.J., C.E., and D.K.; validation, S.M.J. and C.E.; formal analysis, S.M.J., C.E., and D.K.; investigation, S.M.J., C.E., D.K., and C.A.A.; resources, C.A.A. and H.B.; data curation, S.M.J., C.E., and D.K.; writing—original draft preparation, S.M.J.; writing—review and editing, C.E., S.M.J., D.K., C.A.A., and H.B.; visualization, S.M.J. and C.E.; supervision, D.K., C.A.A., and H.B.; project administration, C.E., S.M.J., D.K., and C.A.A.; funding acquisition, C.A.A. and H.B. All authors have read and agreed to the published version of the manuscript.

Funding

The study was funded as INCOVER EU project from the European Union’s Horizon 2020 research and innovation program under grant agreement nº 689242 and INTEXT EU project funded from the European Union’s LIFE LIFE18 ENV/ES/000233.

Institutional Review Board Statement

Not applicable.

Informed Consent Statement

Not applicable.

Data Availability Statement

The data presented in this study are available on request from the corresponding author. The data are not publicly available due to the ongoing work and planning of further development of the coated calcareous materials.

Acknowledgments

S.M.J acknowledges a PhD scholarship from the Aarhus University Centre for Water Technology (WATEC) and Sino-Danish Centre for Education and Research (SDC).

Conflicts of Interest

The authors declare no conflict of interest. The funders had no role in the design of the study; in the collection, analyses, or interpretation of data; in the writing of the manuscript, or in the decision to publish the results.

References

  1. Ganie, A.H.; Ahmad, A.; Pandey, R.; Aref, I.M.; Yousuf, P.Y.; Ahmad, S.; Iqbal, M. Metabolite Profiling of Low-P Tolerant and Low-P Sensitive Maize Genotypes under Phosphorus Starvation and Restoration Conditions. PLoS ONE 2015, 10, 1–25. [Google Scholar] [CrossRef] [PubMed]
  2. Jacob, J.; Lawlor, D.W. Stomatal and Mesophyll Limitations of Photosynthesis in Phosphate Deficient Sunflower, Maize and Wheat Plants. J. Exp. Bot. 1991, 42, 1003–1011. [Google Scholar] [CrossRef]
  3. Usuda, H. Phosphate Deficiency in Maize. V. Mobilization of Nitrogen and Phosphorus within Shoots of Young Plants and Its Relationship to Senescence. Plant Cell Physiol. 1995, 36, 1041–1049. [Google Scholar] [CrossRef]
  4. Kok, D.J.D.; Pande, S.; van Lier, J.B.; Ortigara, A.R.C.; Savenije, H.; Uhlenbrook, S. Global Phosphorus Recovery from Wastewater for Agricultural Reuse. Hydrol. Earth Syst. Sci. 2018, 22, 5781–5799. [Google Scholar] [CrossRef] [Green Version]
  5. Koppelaar, R.H.E.M.; Weikard, H.P. Assessing Phosphate Rock Depletion and Phosphorus Recycling Options. Glob. Environ. Chang. 2013, 23, 1454–1466. [Google Scholar] [CrossRef]
  6. Edixhoven, J.D.; Gupta, J.; Savenije, H.H.G. Recent Revisions of Phosphate Rock Reserves and Resources: A Critique. Earth Syst. Dyn. 2014, 5, 491–507. [Google Scholar] [CrossRef] [Green Version]
  7. Walan, P.; Davidsson, S.; Johansson, S.; Höök, M. Phosphate Rock Production and Depletion: Regional Disaggregated Modeling and Global Implications. Resour. Conserv. Recycl. 2014, 93, 178–187. [Google Scholar] [CrossRef] [Green Version]
  8. Vaccari, D.A.; Mew, M.; Scholz, R.W.; Wellmer, F.-W. Chapter 2 Exploration: What Reserves and Resources? In Sustainable Phosphorus Management: A Global Transdisciplinary Roadmap; Scholz, R.W., Roy, A.H., Brand, F.S., Hellums, D.T., Ulrich, E.A., Eds.; Springer: Berlin/Heidelberg, Germany, 2014; pp. 129–151. [Google Scholar] [CrossRef]
  9. Rittmann, B.E.; Mayer, B.; Westerhoff, P.; Edwards, M. Capturing the Lost Phosphorus. Chemosphere 2011, 84, 846–853. [Google Scholar] [CrossRef] [PubMed]
  10. Smil, V. Phosphorus in the Environment: Natural Flows and Human Interferences. Annu. Rev. Energy Environ. 2000, 25, 53–88. [Google Scholar] [CrossRef] [Green Version]
  11. Desmidt, E.; Ghyselbrecht, K.; Zhang, Y.; Pinoy, L.; van der Bruggen, B.; Verstraete, W.; Rabaey, K.; Meesschaert, B. Global Phosphorus Scarcity and Full-Scale P-Recovery Techniques: A Review. Crit. Rev. Environ. Sci. Technol. 2015, 45, 336–384. [Google Scholar] [CrossRef]
  12. Wu, S.; Kuschk, P.; Brix, H.; Vymazal, J.; Dong, R. Development of Constructed Wetlands in performance Intensifications for Wastewater Treatment: A Nitrogen and Organic Matter Targeted Review. Water Res. 2014, 57, 40–45. [Google Scholar] [CrossRef] [PubMed]
  13. Kadlec, R.H.; Knight, R.L. Chapter 10: Phosphorus. In Treatment Wetlands, 2nd ed.; CRC Press: Boca Raton, FL, USA, 1996; pp. 349–401. ISBN 9781566705264. [Google Scholar]
  14. Arias, C.A.; Brix, H. Phosphorus Removal in Constructed Wetlands: Can Suitable Alternative Media Be Identified? Water Sci. Technol. 2005, 51, 267–273. [Google Scholar] [CrossRef]
  15. Mahmood-ul-Hassan, M.; Rashid, A.; Akhtar, M.S. Phosphorus Requirement of Corn and Sunflower Grown on Calcareous Soils of Pakistan. Commun. Soil Sci. Plant Anal. 1993, 24, 1529–1541. [Google Scholar] [CrossRef]
  16. Ciriminna, R.; Fidalgo, A.; Pandarus, V.; Béland, F.; Ilharco, L.M.; Pagliaro, M. The Sol–Gel Route to Advanced Silica-Based Materials and Recent Applications. Chem. Rev. 2013, 113, 6592–6620. [Google Scholar] [CrossRef] [PubMed]
  17. Ministry of the Environment and Food Ministry of Agriculture (Miljø- og Fødevareministeriet Landbrugsstyrelsen). Guidance on Fertilization and Harmony Rules (Vejledning Om Gødsknings- Og Harmoniregler); Ministry of the Environment and Food Ministry of Agriculture: Copenhagen, Denmark, 2018; ISBN 9788771203424. [Google Scholar]
  18. Föhse, D.; Classen, N.; Jungk, A. Phosphorus Efficiency of Plants. External and Internal P Requirement and P Uptake Efficiency of Different Plant Species. Plant Soil 1988, 110, 101–109. [Google Scholar] [CrossRef]
  19. Sattar, S.; Maqsood, M.A.; Hussain, S.; Rahmatullah. Internal and External Phosphorus Requirements of Maize Genotypes on Typic Calciargid. Commun. Soil Sci. Plant Anal. 2011, 42, 184–193. [Google Scholar] [CrossRef]
  20. Dessougi, H.E.; Dreele, A.; Claassen, N. Growth and Phosphorus Uptake of Maize Cultivated Alone, in Mixed Culture with Other Crops or after Incorporation of Their Residues. J. Plant Nutr. Soil Sci. 2003, 254–261. [Google Scholar] [CrossRef]
  21. Ubi, W.; Ubi, G.M.; Ubi, M.W.; Okweche, T.; Ojei, P.W. Optimizing NPK Fertilizer and Plant Spacing in Maximizing Yield and Yield Attributes of Maize (Zea Mays) in Southern Nigeria. Ann. Bot. 2016, 4, 1–2. [Google Scholar] [CrossRef] [Green Version]
  22. Assuero, S.G.; Mollier, A.; Pellerin, S. The Decrease in Growth of Phosphorus-Deficient Maize Leaves Is Related to a Lower Cell Production. Plant Cell Environ. 2004, 27, 887–895. [Google Scholar] [CrossRef]
  23. Verheul, M.J.; Picatto, C.; Stamp, P. Growth and Development of Maize (Zea Mays L.) Seedlings under Chilling Conditions in the Field. Eur. J. Agron. 1996, 5, 31–43. [Google Scholar] [CrossRef]
  24. Liu, Z.; Gao, J.; Gao, F.; Liu, P.; Zhao, B.; Zhang, J. Photosynthetic Characteristics and Chloroplast Ultrastructure of Summer Maize Response to Different Nitrogen Supplies. Front. Plant Sci. 2018, 9, 1–13. [Google Scholar] [CrossRef] [PubMed]
  25. Miller, M.H.; Mitchell, W.A.; Stypa, M.; Barry, A. Effects of Nutrient Availability and Subsoil Bulk Density on Corn Yield and Nutrient Absorption. Can. J. Soil Sci. 1987, 67, 281–292. [Google Scholar] [CrossRef]
  26. Krey, T.; Vassilev, N.; Baum, C.; Eichler-Löbermann, B. Effects of Long-Term Phosphorus Application and Plant-Growth Promoting Rhizobacteria on Maize Phosphorus Nutrition under Field Conditions. Eur. J. Soil Biol. 2013, 55, 124–130. [Google Scholar] [CrossRef]
  27. Tang, X.; Li, J.; Ma, Y.; Hao, X.; Li, X. Phosphorus Efficiency in Long-Term (15 Years) Wheat-Maize Cropping Systems with Various Soil and Climate Conditions. Field Crop. Res. 2008, 108, 231–237. [Google Scholar] [CrossRef]
  28. Chaudhary, E.H.; Ranjha, A.M.; Gill, M.A.; Mehdi, S.M. Phosphorus Requirement of Maize in Relation to Soil Characteristics. Int. J. Agric. Biol. 2003, 5, 625–629. [Google Scholar]
  29. Rashid, A.; Bughio, N. Plant Analysis Diagnostic Indices for Phosphorus Nutrition of Sunflower, Mungbean, Maize, and Sorghum. Commun. Soil Sci. Plant Anal. 1994, 25, 2481–2489. [Google Scholar] [CrossRef]
  30. Blake, L.; Mercik, S.; Koerschens, M.; Moskal, S.; Poulton, P.R.; Goulding, K.W.T.; Weigel, A.; Powlson, D.S. Phosphorus Content in Soil, Uptake by Plants and Balance in Three European Long-Term Field Experiments. Nutr. Cycl. Agroecosystems 2000, 56, 263–275. [Google Scholar] [CrossRef]
  31. Kaur, G.; Sudhakara Reddy, M. Influence of P-Solubilizing Bacteria on Crop Yield and Soil Fertility at Multilocational Sites. Eur. J. Soil Biol. 2014, 61, 35–40. [Google Scholar] [CrossRef]
  32. Zhao, B.Q.; Li, X.Y.; Liu, H.; Wang, B.R.; Zhu, P.; Huang, S.M.; Bao, D.J.; Li, Y.T.; So, H.B. Results from Long-Term Fertilizer Experiments in China: The Risk of Groundwater Pollution by Nitrate. NJAS Wagening. J. Life Sci. 2011, 58, 177–183. [Google Scholar] [CrossRef] [Green Version]
  33. Gandahi, A.W.; Baloch, F.B.; Sarki, M.S.; Gandahi, R.; Lashari, M.S. Impact of Rice Husk Biochar and Macronutrient Fertilizer on Fodder Maize and Soil Properties. Int. J. Biosci. 2015, 7, 12–21. [Google Scholar] [CrossRef]
  34. Zhai, L.; Cai, Z.J.; Liu, J.; Wang, H.; Ren, T.; Gai, X.; Xi, B.; Liu, H. Short-Term Effects of Maize Residue Biochar on Phosphorus Availability in Two Soils with Different Phosphorus Sorption Capacities. Biol. Fertil. Soils 2015, 51, 113–122. [Google Scholar] [CrossRef]
  35. van de Wiel, C.C.M.; van der Linden, C.G.; Scholten, O.E. Improving Phosphorus Use Efficiency in Agriculture: Opportunities for Breeding. Euphytica 2016, 207, 1–22. [Google Scholar] [CrossRef] [Green Version]
  36. Dixon, M.; Simonne, E.; Obreza, T.; Liu, G. Crop Response to Low Phosphorus Bioavailability with a Focus on Tomato. Agronomy 2020, 10, 617. [Google Scholar] [CrossRef]
Figure 1. Effects of increasing phosphorus (P) supply when added as P-enriched material (I or II) with five P levels (6, 12, 25, 50, 100 kg P ha−1 yr−1) on Zea mays (a) height (m), (b) specific leaf area (SLA; m2 kg−1 DW), (c) relative chlorophyll content (ChlSPAD; unitless), and (d) total biomass (g DW). The control treatment had no P supplied and the NPK fertilizer treatment had a P supply corresponding to 50 Kg P ha−1 yr−1. The experiment was performed on Zea mays in a growth chamber with controlled conditions and measurements were performed after the plants had grown for eight weeks in the treatments. Values are averages ± SEM (n = 5).
Recycling 06 00025 g001
Figure 2. Effects of increasing phosphorus (P) supply when added as P-enriched material (I or II) with five P levels (6, 12, 25, 50, 100 kg P ha−1 yr−1) on Zea mays (a) photosynthetic rate (Amax; µmol CO2 m−2 s−1), (b) stomatal conductance (gs; mol H2O m−2 s−1), (c) dark respiration (Rd; µmol CO2 m−2 s−1), and (d) transpiration (E; mol CO2 m−2 s−1). The control treatment had no P supplied, and the NPK fertilizer treatment had a P supply corresponding to 50 kg P ha−1 yr−1. The experiment was performed on Zea mays in a growth chamber with controlled conditions and measurements were performed after the plants had grown for eight weeks in the treatments. The measurements were performed in a time window from 10 a.m. to 3 p.m. on the second youngest fully developed leaf with an IRGA. Values are averages ± SEM (n = 5).
Recycling 06 00025 g002
Figure 3. Effects of increasing phosphorus (P) supply when added as P-enriched material (I or II) with five P levels (6, 12, 25, 50, 100 kg P ha−1 yr−1) on (a) P concentration in aboveground Zea mays biomass (mg P g−1 DW), (b) total P content in Zea mays biomass (mg P), and (c) P concentration in the soil after harvest of belowground biomass (mg P g−1 DW). The control treatment had no P supplied, and the NPK fertilizer treatment had a P supply corresponding to 50 kg P ha−1 yr−1. Values are averages ± SEM (n = 3).
Recycling 06 00025 g003
Table 1. Summary of two-way ANOVA (percentages of total sum of squares (%SS)), showing the effects of two materials (material I and II) and five levels of P addition (6, 12, 25, 50, and 100 kg P ha−1 yr−1). The experiment was performed on Zea mays in a growth chamber with controlled conditions and measurements were performed after the plants had grown for eight weeks in the treatments. The NPK and control treatments were excluded from the two-way ANOVA analysis, and the P addition has five levels (6, 12, 25, 50, 100 kg P ha−1 yr−1) and the material effect has two levels (material I and II).
Parameter Data Main EffectsTwo-Way Interaction
Shown inP AdditionMaterialP Addition × Material
Height (m)Figure 1a24.5 **7.1 *10.7 ns
Specific Leaf Area (SLA; m2 kg−1 DW)Figure 1b3.2 ns0.2 ns0.8 ns
Relative chlorophyll content (ChlSPAD; unitless)Figure 1c11.9 ns4.2 ns18.0 *
Total biomass (g DW)Figure 1d33.9 **3.4 ns1.6 ns
Leaves (no)not shown7.5 ns1.0 ns11.5 ns
Photosynthetic rate (Amax; µmol CO2 m−2 s−1)Figure 2a35.0 ***1.1 ns7.4 ns
Stomatal conductance (gs; mol H2O m−2 s−1)Figure 2b15.0 ns0.1 ns12.0 ns
Dark respiration (Rd; µmol CO2 m−2 s−1)Figure 2c35.3 ***<0.1 ns7.3 ns
Transpiration (E; mol CO2 m−2 s−1)Figure 2d15.9 ns0.7 ns9.6 ns
Aboveground biomass P concentration (mg P g−1 DW)Figure 3a12.7 ns12.5 ns8.9 ns
Total P content in biomass (mg P) aFigure 3b34.6 ***4.9 ns9.3 ns
P concentration in soil (mg P g−1 DW)Figure 3c52.4 ***4.8 ns15.0 ns
D.f. material = 1, d.f. P addition = 4, d.f. interaction = 4 and d.f. residual = 40 for all parameters, apart from d.f. residual for aboveground biomass P concentration, total P content in biomass and P concentration in soil after harvest of belowground biomass = 20. * p < 0.05; ** p < 0.01; *** p < 0.001; ns, not significant. a Total P content in biomass = tissue P concentration × tissue dry weight.
Table 2. Mineral element concentrations in soil samples at the end of the experiment. Phosphorus (P) was added as P-enriched material (I or II) with five P levels (6, 12, 25, 50, 100 kg P ha−1 yr−1). The control treatment had no P supplied, and the NPK fertilizer treatment had a P supply corresponding to 50 kg P ha−1 yr−1. Values are averages (n = 3). The soil samples were collected after removing the belowground biomass and homogenizing the soil.
Treatment (kg P ha−1 yr−1)ControlNPKMaterial IMaterial II
05061225501006122550100
Ca (mg Ca g−1 DW) 4.963.744.616.004.224.756.524.014.894.525.304.80
Mg (mg Mn g−1 DW) 0.820.670.780.850.720.790.900.680.820.760.780.77
Fe (mg Fe g−1 DW) 3.122.192.902.152.172.512.352.802.402.472.102.13
Al (mg Al g−1 DW) 0.090.040.080.080.070.070.060.070.070.060.060.09
K (mg K g−1 DW) 0.810.390.780.630.490.530.590.680.590.590.530.61
Mn (mg Mn g−1 DW) 0.080.070.080.070.070.080.110.100.080.100.070.06
Table 3. Mineral element concentrations in Zea mays biomass. Phosphorus (P) was added as P-enriched material (I or II) with five P levels (6, 12, 25, 50, 100 kg P ha−1 yr−1). The control treatment had no P supplied and the NPK fertilizer treatment had a P supply corresponding to 50 kg P ha−1 yr−1. The biomass was harvest and divided into biomass fractions and element concentrations were analyzed in all biomass fractions. Values are averages (n = 12).
Treatment (kg P ha−1 yr−1)ControlNPKMaterial IMaterial II
05061225501006122550100
P (mg P g−1 DW)0.591.490.570.620.610.670.630.600.640.670.620.63
Ca (mg Ca g−1 DW) 3.242.853.683.164.073.583.433.753.413.463.593.37
Mg (mg Mn g−1 DW) 1.962.412.171.892.342.142.102.202.082.072.132.11
Fe (mg Fe g−1 DW) 0.040.040.030.030.030.030.050.030.030.040.030.06
K (mg K g−1 DW) 31.217.631.030.828.730.431.629.931.829.429.930.6
Mn (mg Mn g−1 DW) 0.060.050.060.070.080.060.060.070.070.080.080.07
Table 4. Multivariate correlation analysis. Analysis performed for all 12 treatments for selected parameters (plant height, number of leaves, chlorophyll content, total biomass, total P content in biomass, Amax, and SLA)) showing R-values.
HeightLeavesChlSPADBiomassAmaxTotal PSLA
Height (cm)1
Leaves (no)0.215 ns1
Chlorophyll content (ChlSPAD; unitless)0.529 ***0.146 ns1
Total biomass (g DW)0.863 ***0.221 ns0.661 ***1
Photosynthetic rate (Amax; µmol CO2 m−2 s−1)0.781 ***0.169 ns0.476 ***0.732 ***1
Total P content in biomass (mg P) a0.809 ***0.238 ns0.630 ***0.822 ***0.921 ***1
Specific Leaf Area (SLA; m2 kg−1 DW)−0.456 ***0.223 ns−0.279 *−0.418 *−0.273 *−0.363 ***1
* p < 0.05; *** p < 0.001; ns, not significant. a Total P in biomass = tissue P concentration × tissue biomass.
Publisher’s Note: MDPI stays neutral with regard to jurisdictional claims in published maps and institutional affiliations.

