Article

Sustainability Assessment of Reuse and Recycling Management Options for End-of-Life Computers-Korean and Japanese Case Study Analysis

1
Department of Informatics, The University of Electro-Communications, 1-5-1 Chofugaoka, Tokyo 182-8585, Japan
2
Department of Systems Innovation, School of Engineering, The University of Tokyo, 7-3-1 Hongo, Bunkyoku, Tokyo 113-8656, Japan
3
Department of Mechanical Engineering Informatics, Meiji University, 1-1-1 Higashi-Mita, Kawasaki, Kanagawa 214-8571, Japan
*
Author to whom correspondence should be addressed.
Submission received: 30 April 2021 / Revised: 23 July 2021 / Accepted: 29 July 2021 / Published: 26 August 2021
(This article belongs to the Special Issue Feature Papers in Recycling 2021)

Abstract

:
The depletion of natural resources and global warming have increased in severity globally. In the industrial field, assembly products, such as electronic products, should be disassembled for recycling and reuse to deal with these problems. Reuse and recycling can contribute to reducing GreenHouse Gas (GHG) emissions and less depletion of natural resources since GHG emissions for virgin material production can be saved using reused components and recycled materials. However, each component of selling revenue and material-based GHG emissions depends on the country because of the different energy mixes of electrical power. Moreover, each collected component embedded in End-of-Life (EOL) products needs to be selected as a life cycle option based on its remaining life. The purpose of this study is to decide life cycle options such as reuse, recycling, and disposal of each component environmentally-friendly and economically in Korea and Japanese cases for computers. Firstly, selecting the life cycle option for each component was formulated by 0–1 integer programming with ε constraints. Next, GHG emissions, profits, and costs in Korea and Japan were estimated and analyzed for each component. Finally, Korean and Japanese cases were analyzed to obtain an economic value in the same material-based GHG saving rate with each component’s life cycle option selection by comparing each EOL product data. In the experiments, GHG recovery efficiency was higher in Japan 43 [g/Yen] than one in Korea 28 [g/Yen]. Therefore, it was better to retrieve and reutilize the components in Korea. However, if the maximum GHG recovery efficiency is desired, Japan is a better option.

1. Introduction

For decades, the environmental issues of natural resource depletion and global warming have been increasing in severity. The continuous consumption of electronic products, such as home appliances and automobiles, which are made of natural resources, leads to the depletion of natural resources. Furthermore, GreenHouse Gas (GHG) emissions associated with the manufacturing of these products contribute to global warming. Although electronic waste accounts for only 1–3% of hazardous waste, such products are composed of many components and emit harmful toxins when buried in landfills [1]. However, assembled products, such as electronic products, are often disposed of as waste even when they retain some useful components and materials that can be recovered by reuse and recycling as the End-of-Life (EOL) stage [2]. Life cycle option selection involves the reuse, recycling, and disposal of each component by disassembly [3,4]. These options can prevent the wastage of virgin materials and GHG emissions by reutilizing the components. However, product disassembly and life cycle options require additional process and high labor cases. In addition, each country has differences in market prices, labor environment, and production. Therefore, the country-specific economic and environmental aspects of product disassembly and reuse and recycling need to be investigated to establish the best life-cycle options by each country.
Some studies already proposed several models considering remanufacturing and Closed-Loop Supply Chain (CLSC) as shown in a contribution (Table 1). Sarkar et al. [5] proposed a multi-echelon CLSC model. This model minimized the total cost of the Supply Chain (SC) by considering a hybrid system with Third-Party Logistics that provided transportation and collection services. The results of the model proved the importance of transportation and carbon emission costs in CLSC models. Sarkar et al. [6] also developed a multi-attribute CLSC model for self-healing polymers based returnable transport packaging with single supplier, single manufacturer, and multi-retailers under budget and storage constraints. This research contributed an improvement in environmental performance of the proposed SC management by considering carbon emission reduction objectives in the model development. Moreover, Sarkar et al. [7] investigated the model of an impact on random defective rates in an imperfect production system with multiple products and planned backorders in a single-stage production system. For this model, they minimized the cost of defective products by reducing defective products through remanufacturing and reworking. Saxena et al. [8] investigated the policy that proved that the optimum in reduction of waiting time for the primary market under policies could be feasible. A mathematical model has been developed to analyze two approaches of the replenishment cycles (the production and remanufacturing cycles run simultaneously or not) with respect to the waste management. Ullah et al. [9] also developed an optimal remanufacturing strategy for a manufacturing remanufacturing system that used Returnable Transport Items (RTIs) for product transportation and the key supply chain drivers of the Closed-Loop Supply Chain Management (CLSCM) under the stochastic environment. In order to minimize the environmental effects of the supply chain, the proposed model considered remanufacturing, RTIs, and carbon discharge/emissions from production and transportation. According to the Marinello et al. [10], there was a smaller amount of research on the consideration of GHG emissions and life cycle option for the international product. Yoda et al. [11] demonstrated the merit of remanufacturing by adding a remanufacturing process to the existing disassembly component selection model [3] by selecting life cycle options for recovery rate and profit.
On the other hand, globality for manufacturing and EOL product stages is important because the difference in procurement costs, labor costs, production cost, and sales profit in each country creates an economic gap in the production of components. Additionally, GHG emissions need to be reduced as the causes of global environmental problems such as GHG emissions are different depending on where the component is produced. However, globality environmentally-friendly and economically was not considered in those studies.
In contrast to the previous studies on the globality for the selection of life cycle options as the EOL stage, Hasegawa et al. [3] proposed a life cycle option selection model for analyzing German and Japanese reused data. The analysis suggested an optimal solution by considering Japanese material-based CO2 emissions and the German and Japanese reuse profits for the reused components in each country. In the optimal solution, products would be produced and dismantled in Japan, and then the life cycle option process for getting higher profit would be conducted in Germany, as suggested in the experiment. Han et al. [12] conducted the life cycle option selection that considered cases of Korea, Germany, and Japan for CO2 emissions and profits. In these results, the mother board had the highest reuse profit in Korea. It was found that the case of Korea might be an intermediate role among three countries. However, it did not take into account the difference in the amount of GHG emissions when the components were produced in the other countries besides Japan. This consideration is the critical point to make changes for different life cycle options for each country and GHG saving rate.
This study analyzes Korean and Japanese cases to obtain an economic value under the GHG saving rate with each component’s life cycle option selection by comparing the EOL product data. The novelty of this paper is that the results of this study can address setting the manageable GHG saving and profit goals according to economic or environmental factors for the managers in factory or recycling companies. The contribution of this study is that optimal recovered values for the components from the EOL product are given for each determined life cycle option in different countries. The results are compared and analyzed considering the difference in GHG emissions, the price of the secondhand market in each country, and the cost of procurement and recycling.
The rest of this paper is organized as follows: Section 2 describes the assumptions used in this study, an overview of the progress, and the formulation by selecting disassembly components and maximizing profit for GHG saving rate. Section 3 compares the reuse profit, recycling cost, procurement amounts and GHG emissions for the components obtained in a computer. Section 4 discusses a comparison and analysis of the resulting life cycle option selection in a numerical experiment on Korean and Japanese cases. Finally, the conclusions are presented in Section 5.

2. Method

2.1. Overview

This section outlines the procedures of this study and the system boundary for GHG emissions, profits, and costs. The procedure in this study is shown in Figure 1.
(1) Estimation of material based GHG saving rate and cost for components.
The GHG emissions for each component of the computer are estimated based on the Asian Life Cycle Inventory (LCI) database using the Bills of Material (BOM) to obtain the GHG saving rate and the cost of the computer through software [13]. Additionally, the disposal cost, assembly cost, sales of material, landfill cost, and disassembly cost are calculated using the Recyclability Evaluation Method (REM) software by Hitachi Ltd. [14].
(2) Formulation for selecting life cycle options in disassembly components using 0–1 integer programming with ε constraint method.
Each component for reuse, recycling, and disposal is selected by 0–1 integer programming [15] with ε constraint [16] to achieve higher profit and a target GHG saving rate in each country. In addition, obsolescence of each component and precedence were considered in the disassembly process as well as [3].
(3) Analysis and comparison of Korean and Japanese cases.
The reuse costs for each component in each country are collected from their market site. The life cycle options for each component differed between the two countries. These results are analyzed and compared to discuss the different life cycle options according to the environmental and economic aspects [3].

2.2. Formulation of Life Cycle Option Selection by Component Reuse, Material Recycled, and Disposed

This study adopted the life cycle option selection in consideration of the environment and economy based on Hasegawa et al. [3] to Korean and Japanese cases. The life cycle option is applied in this study to handle the EOL components for reuse, recycling, or disposal. Considering the profit data and GHG emissions when producing components, the model in this study informs how the EOL components should be treated in the life cycle option.
A bi-objective problem is solved for maximizing (1) the GHG saving rate and (2) the profit by setting the ε constraint method on each result on 0–1 integer programming to select the life cycle option for each component. Table 2 lists the notations in this study.
The objective functions for total profit and total GHG saving are as follows:
P r o f = j = 1 N C t r e j x j + j = 1 N C r s j l j u l j y j j = 1 N C d i s j x j + y j j = 1 N z j Z M a x
E = j = 1 N e j x j + y j M a x
The constraints for life cycle option selection and disassembly are as follows:
E     ε G H G
z i z j i   P j , j J
x j + y j + z j = 1 , j J
u y j < l j ,   j J
According to Hasegawa et al. [3], the first objective function in Equation (1) maximizes profits when only one life cycle option is selected for each component within a product. The costs, treatment and disposal costs, and disassembly costs are included in this Equation (1) while recycling profits and reuse profits are also composed of. The crush cost occurs when a component is chosen for disposal [12]. The straight-line method is applied for considering obsolescence to estimate reuse component prices because the reuse price is sensitive to the number of usage years as well as [3]. The cost of disposal for materials is included in the treatment and disposal cost Ctrej; additionally, this study considers the cost of crushing the component when the component is selected for disposal [12].
The GHG saving rate is a recovery rate for original GHG volumes that can be obtained by reutilizing existing components by reuse or recycling without producing new components [3]. The second objective function in Equation (2) is to maximize the GHG saving rate. When components within a product are selected as the reuse or recycling, the ε constraint is used to simultaneously perform Equations (1) and (2) with 0–1 integer programming to select the life cycle option for the components. In Equation (3), the ε constraint is adopted into Equation (2) to treat this bi-objective problem. Moreover, Equation (1) derives the maximum value from the increasing ε value from Equations (3) with (2) as well as Hasegawa et al. [3].
Equation (4) refers to the precedence relationship (Appendix A) among the product components. Some components have priority that are pre-disassembled before they are disassembled. If the preceding component is not disassembled, it cannot be selected for a life cycle option, even if the component has higher economic and environmental value. Equation (5) states that reuse, recycle, and disposal can occur only once for each component in the life cycle option. Equation (6) states that the usage year of each component should not exceed the lifetime of that component.

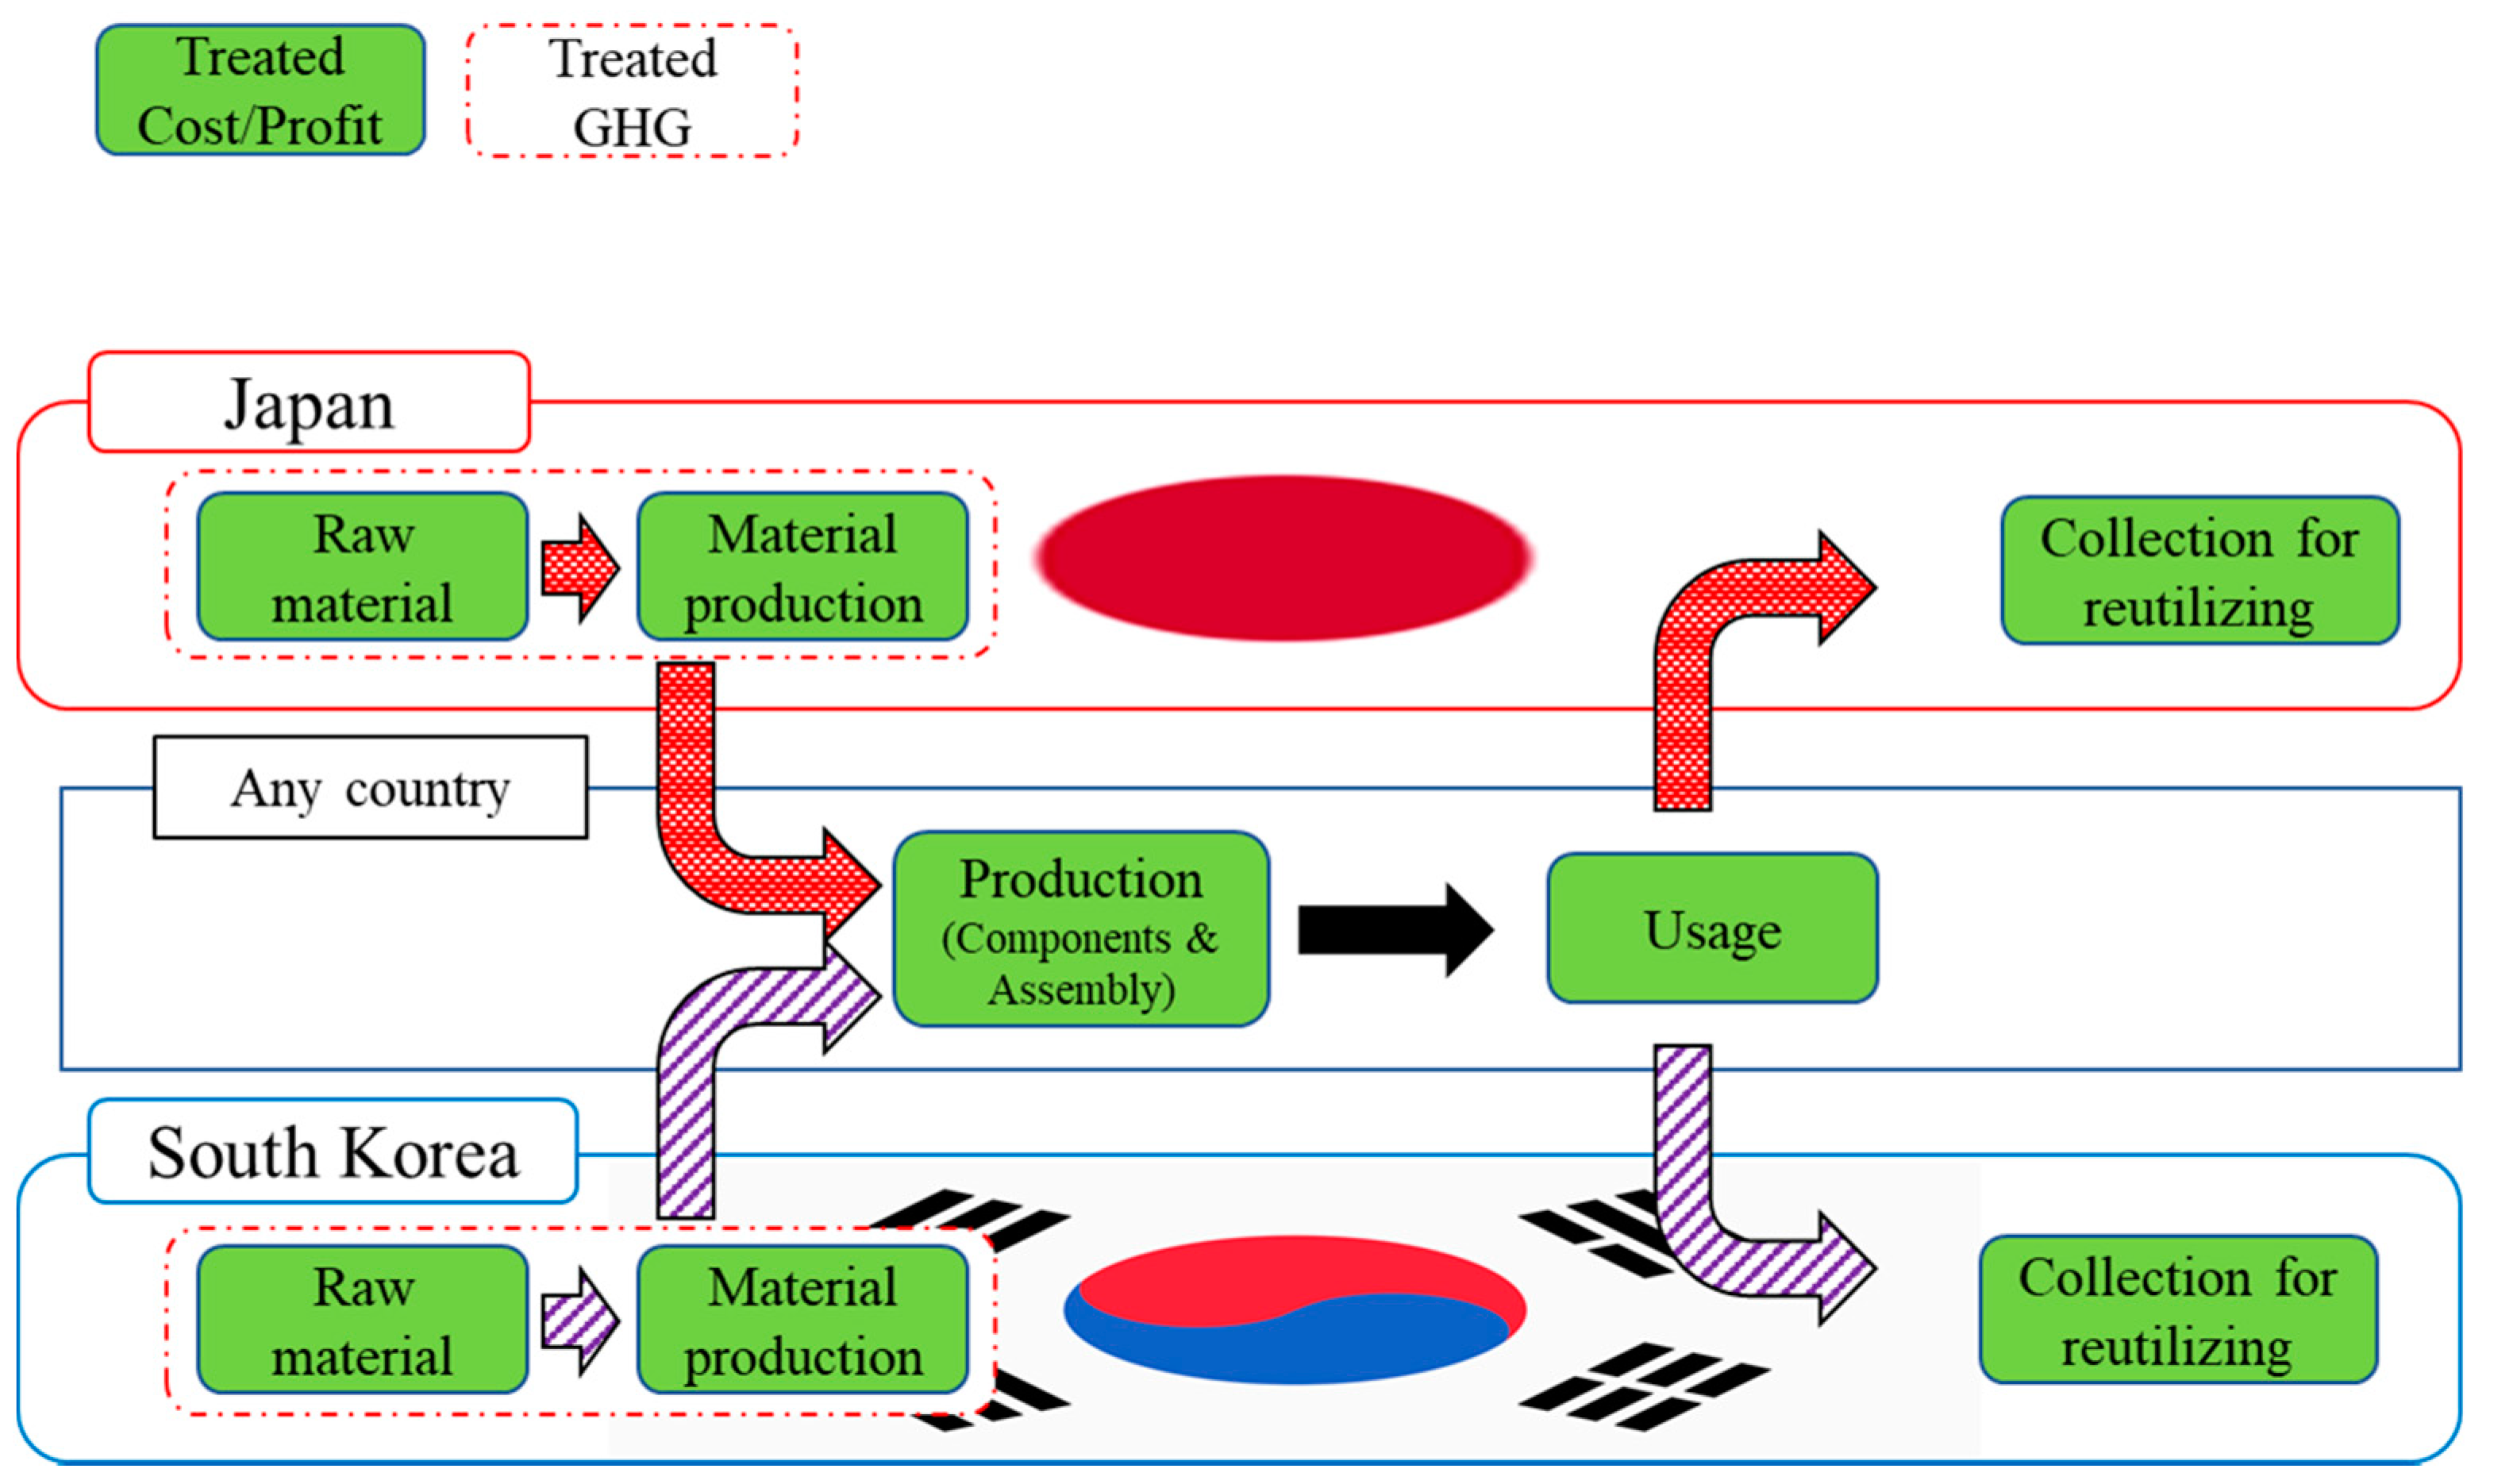
2.3. System Boundary for GHG Emissions and Profit

In this section, a system boundary for GHG emissions and profit is presented. Material-based GHG emissions associated with the computer for a case are considered from the raw material production level to the material production level regarding the Life Cycle Assessment (LCA) [13,17,18]. This is because, according to the SHARP Company’s environmental report and the LCA case study, more than 90% of GHG emissions occur at two stages in the supply chain: the raw material and the material production level [19].
The system boundary for GHG emissions and cost used in this study is illustrated in Figure 2 for Korean and Japanese cases of GHG emissions, profits and costs. Figure 2 describes the treated cost and GHG emissions in this study. Additionally, the GHG emissions on raw material level and the material production level are shown on the red dot line. The cost is addressed on each level as procurement cost, reuse profit, recycling profit, and treatment and disposal cost. Thus, Korean and Japanese GHG missions and cost are different.
I.
Sales revenues for reused components in the Korean case were surveyed on Korea Auction [20] and Joonggo-nara [21], which are the largest internet market sites in Korea. In the Japanese case, the prices used in Hasegawa et al. [3] were applied here.
II.
The disassembly cost in Korea was calculated using the minimum wage rate in Korea based on Japanese data. The crush cost was set to JPY 0 in this study.
III.
Treatment and disposal costs in Korea were estimated based on the Starbucks index [22] as per the Japanese price.
IV.
Recycling profit in this study is defined as the sum of the treatment and disposal costs and disassembly costs.
V.
The target total GHG saving rate changed from 0% to 100% to obtain solutions by selecting reused, recycled, and disposed components while maximizing total profits. The currency used in this study is the Japanese Yen [¥].
VI.
There are six GHGs associated with production and life cycle options of electronics, where and CO2 accounts for the largest proportion Kokubu et al. [4]. Therefore, all GHGs were converted into units of CO2-equivelant [g-CO2eq].
VII.
Component #7 Switch was always set as disposed owing to limitations of the survey in this study that is not defined by REM and reuse selling revenue [3].
VIII.
It is assumed that component production, assembly, and usage are carried out in any country.
IX.
To consider the life expectancy for each component, it is assumed that each component in the computer had a use-expectancy of five years.

3. Analysis of Material-Based GHG Emissions and Recycling Profit: Korea vs. Japan

All countries have different working conditions, market prices, and production environments. This creates differences in procurement costs, GHG emissions, and other profits when such components are reutilized in other countries. With this difference, choosing a lifecycle option for each component varies from country to country. Thus, Section 3 analyzes for Korean and Japanese cases. The GHG emissions and the procurement cost for each component of the computer were estimated based on the LCI database with Asian Input-Output (I/O) tables using the BOM to obtain the GHG saving rate and the cost of the computer using software [13]. In this study, procurement costs were estimated using the input–output table for 2015 [23].

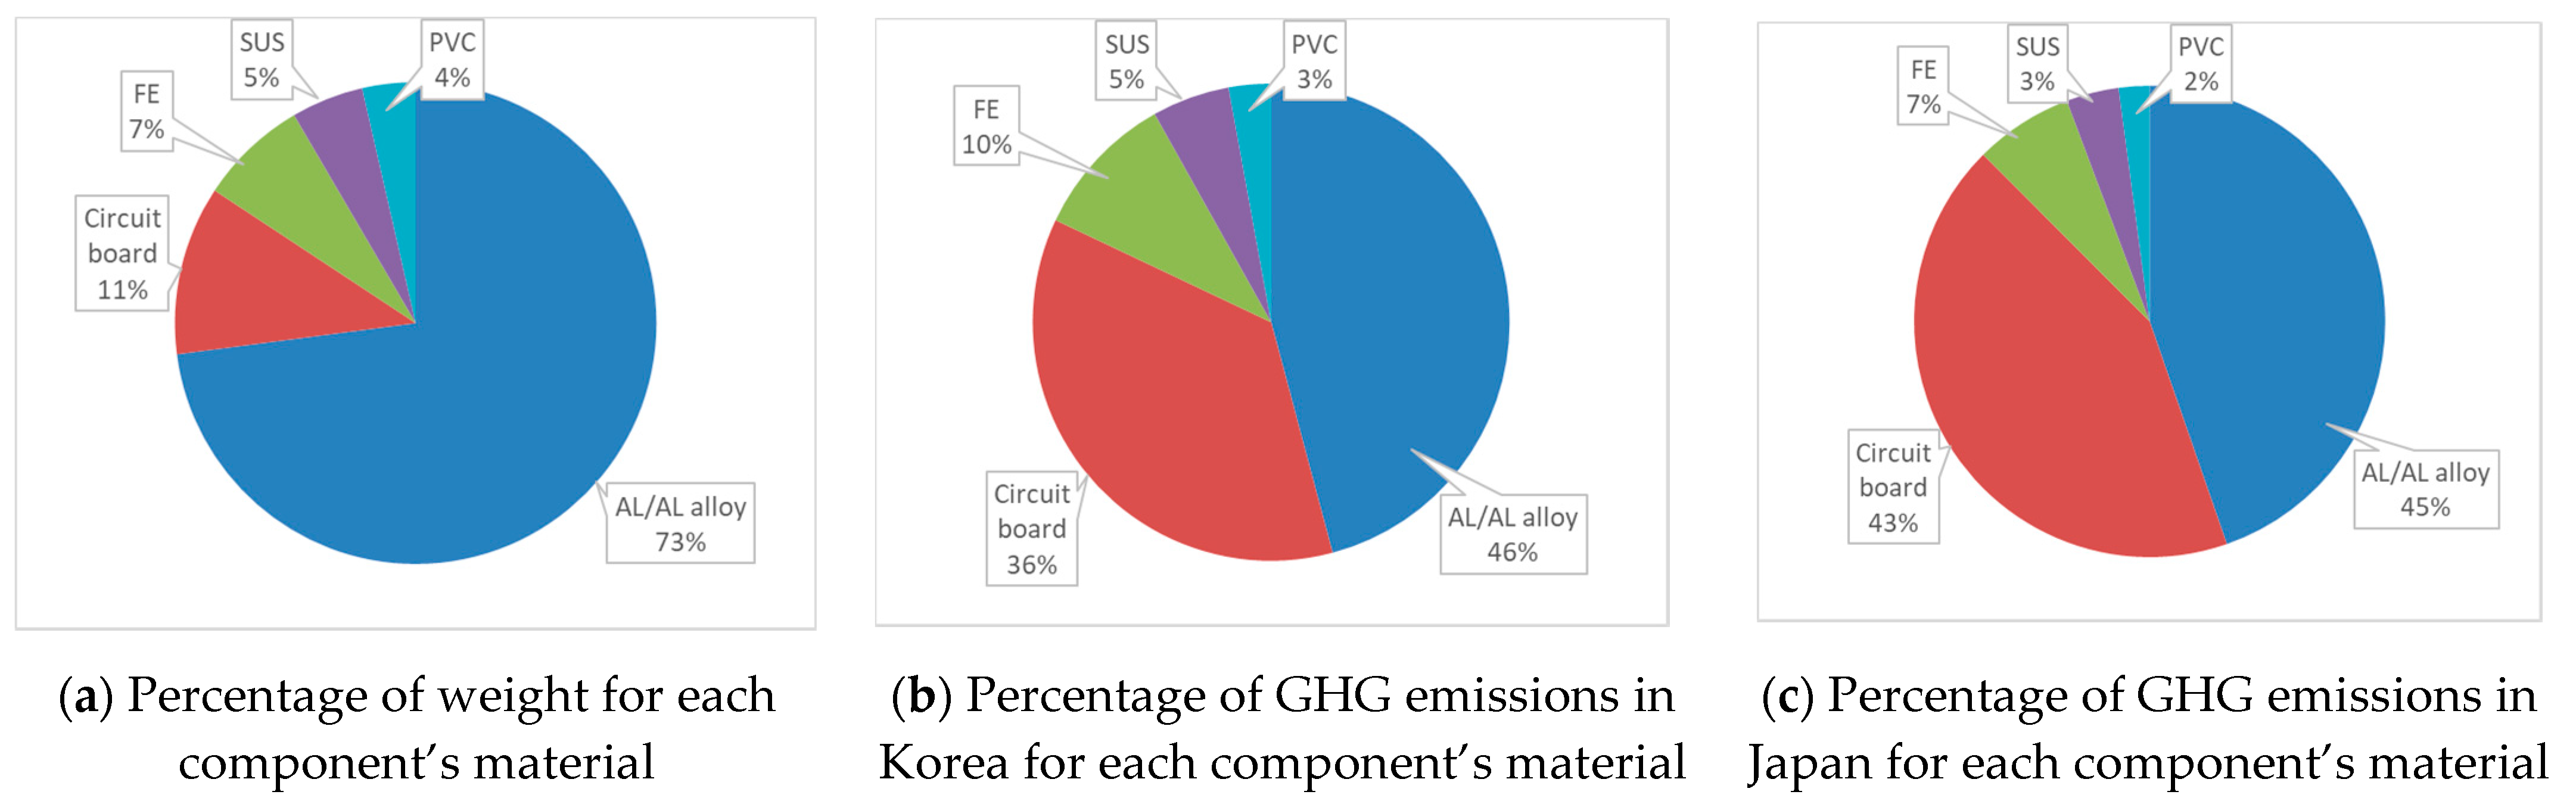
3.1. Analysis of Material-Based GHG Emissions

Figure 3 shows the amount of GHG emissions associated with the production of 14 computer components in Korea and Japan. The shape of the graph shows that both countries exhibit similar trends. For instance, the main board (#14) has the largest GHG emissions of all the components. To obtain a higher GHG saving rate, the main board has the highest priority for reuse or recycling. However, the total GHG emissions in Korea are 17,116 [g-CO2eq], which is approximately 1.7 times higher than one for 10,040 [g-CO2eq] in Japan. Since GHG emissions vary depending on energy mix such as solar, nuclear, and coal, even if the same product is produced, there is a difference in emissions in each country.

3.2. Analysis of Procurement Costs

Figure 4 represents the procurement costs incurred when components of the product are produced at each production site. Unlike Figure 3, procurement costs incurred in the two countries are almost the same and appear to be largely graphically overlapped. In Japan, total cost of procurement is 2211 [Yen] compared to Korea, which as a procurement cost of 2078 [Yen]. This shows that Korea has by 6% lower total cost of procurement.

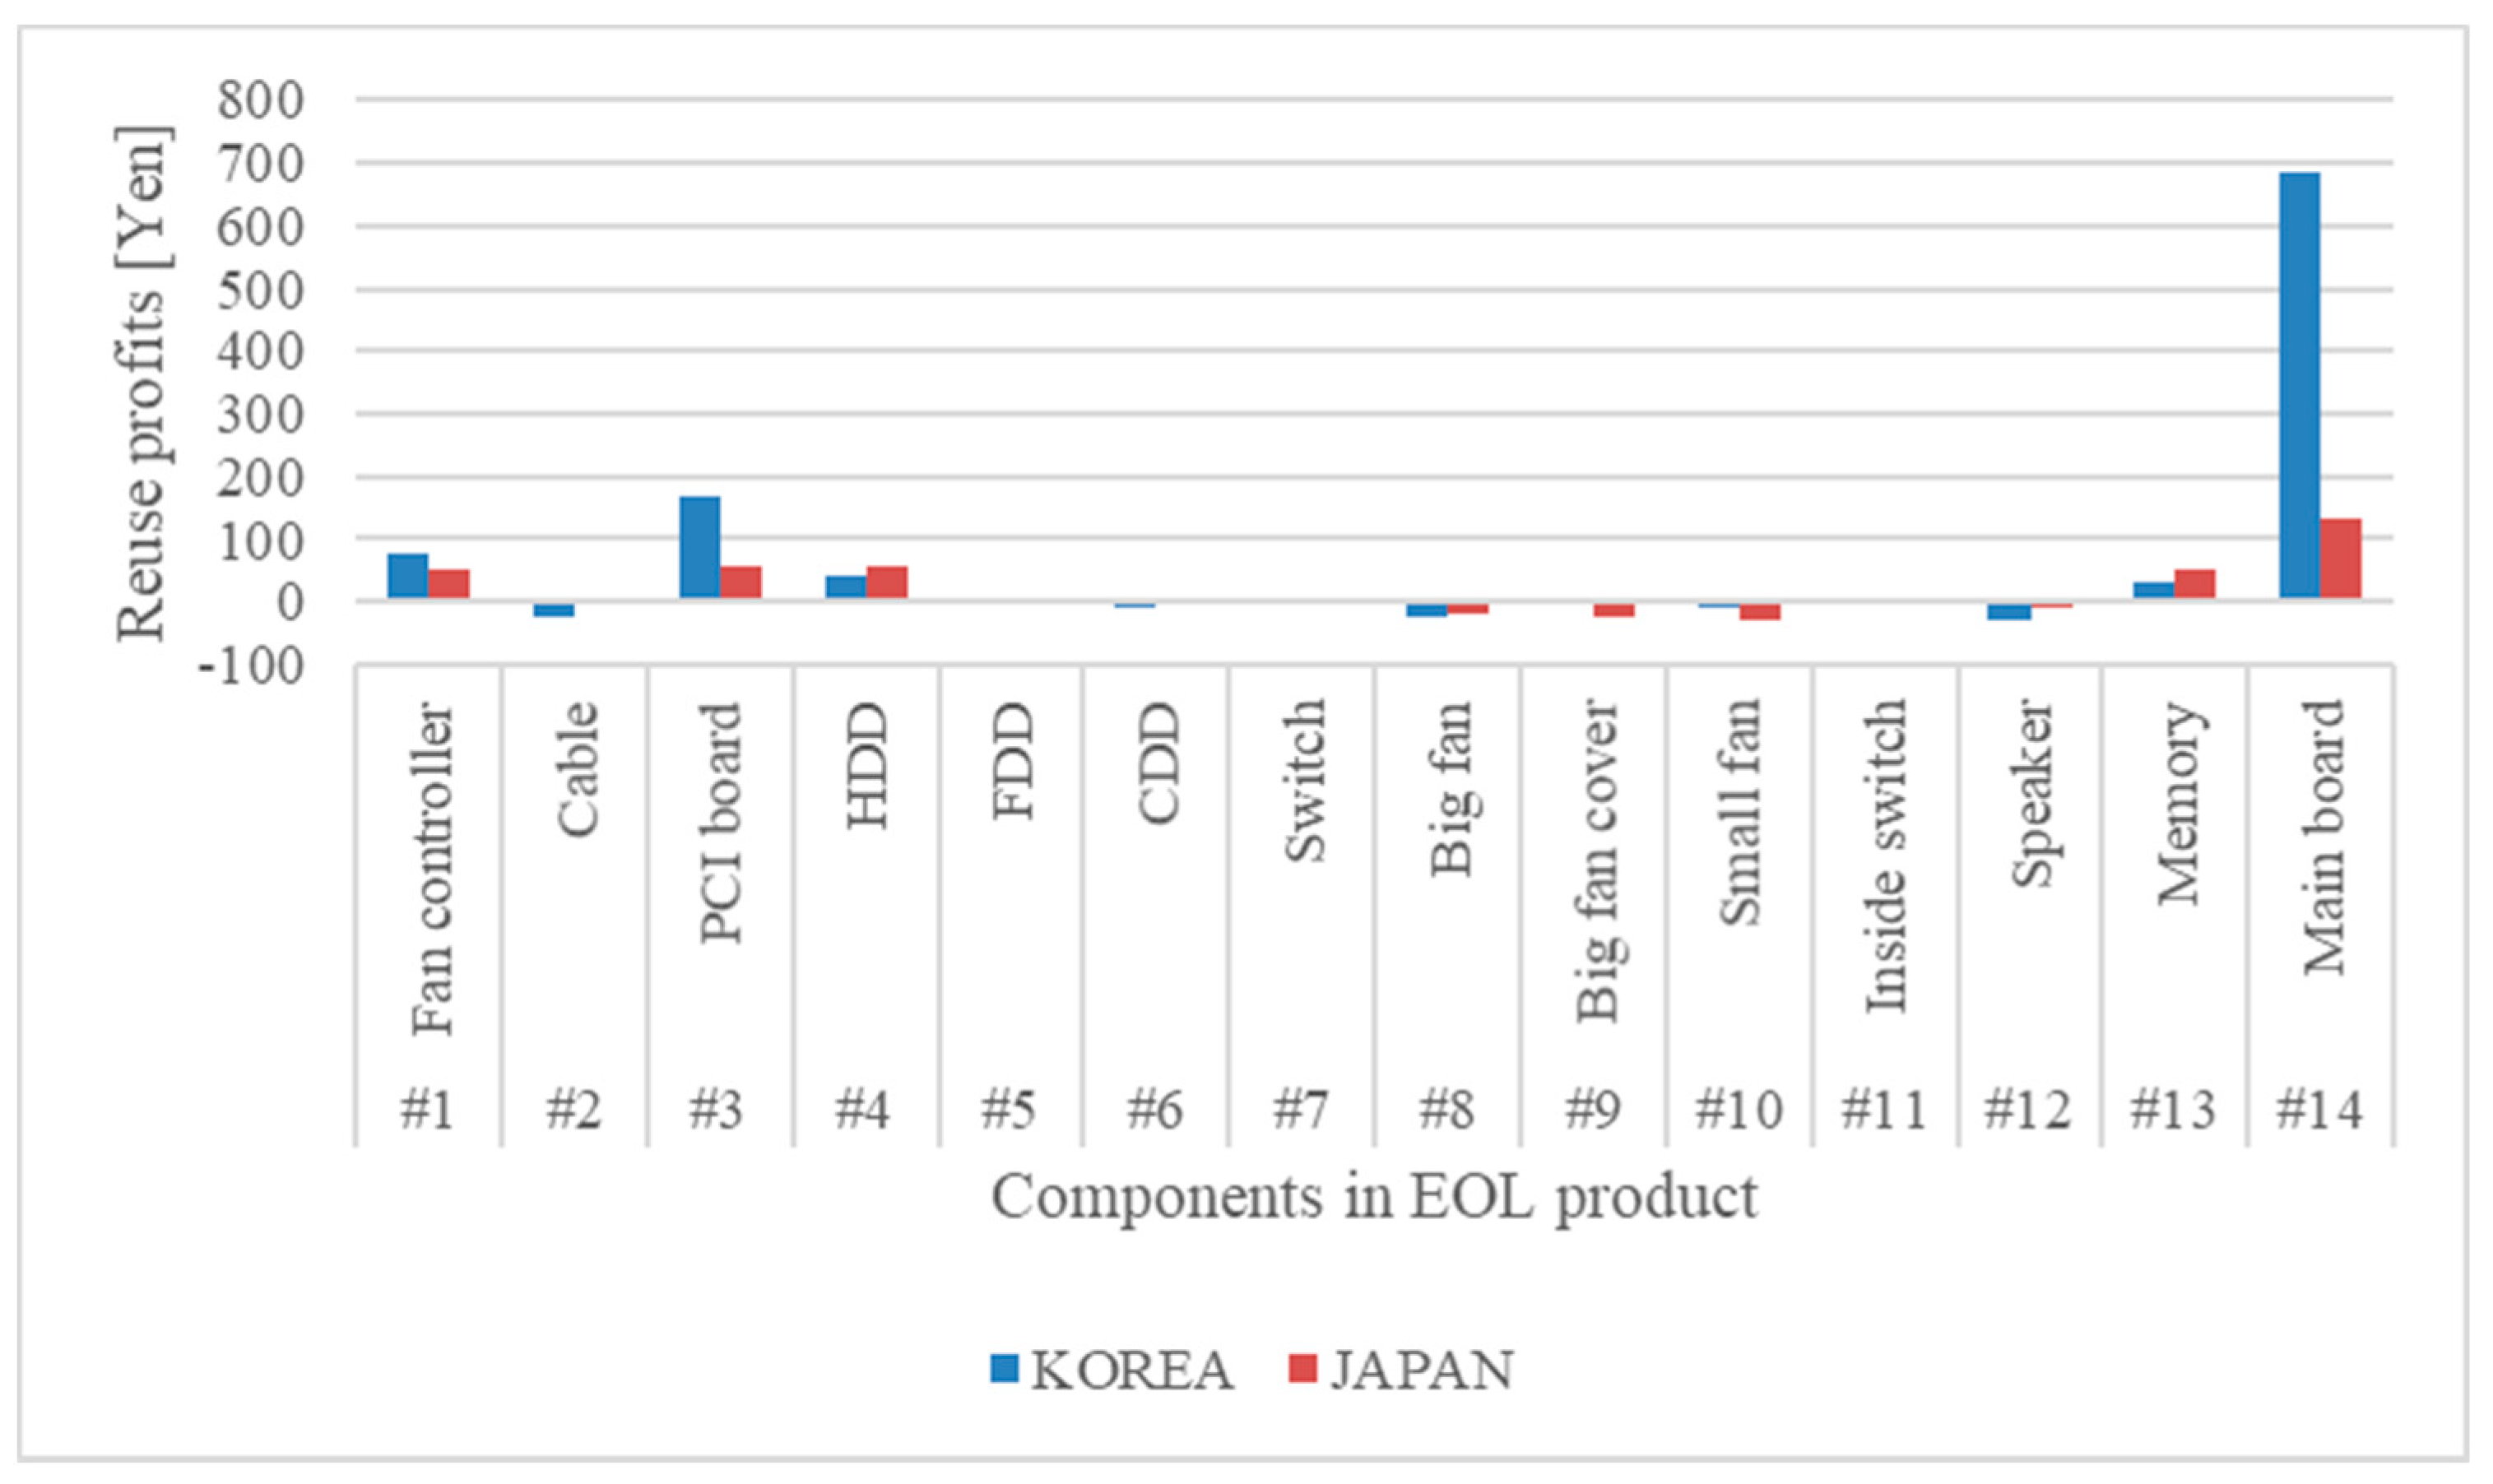
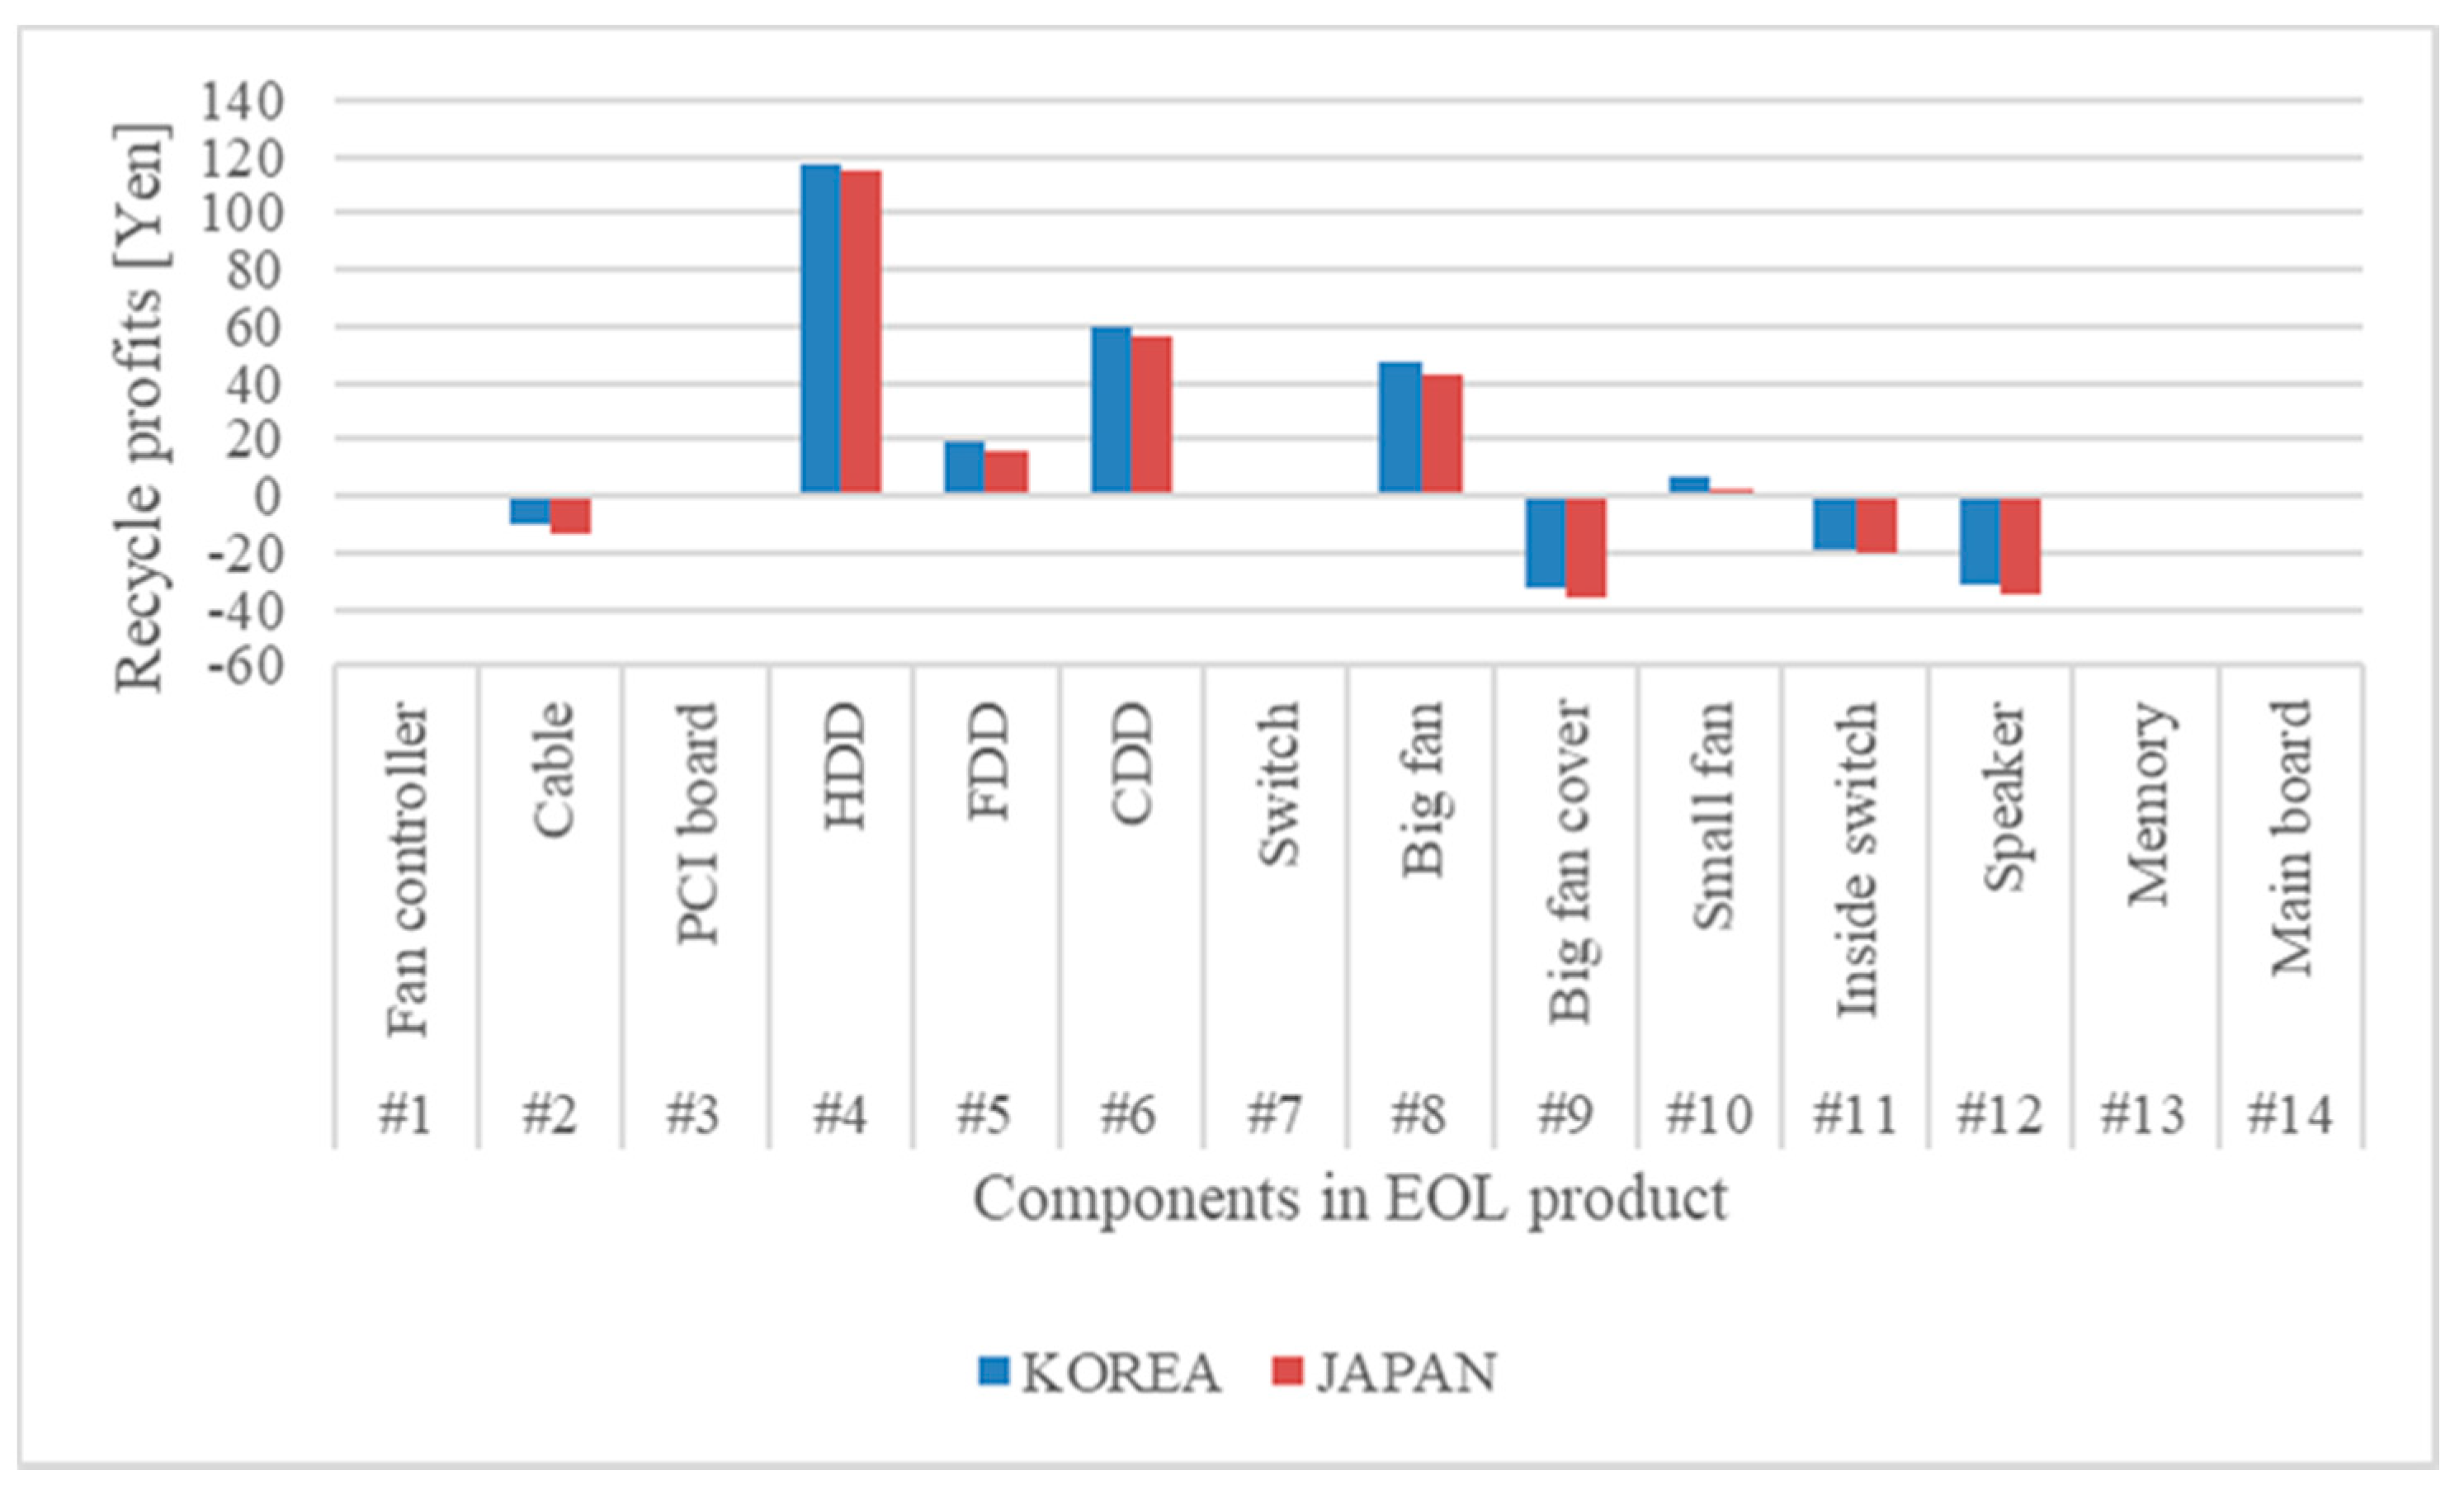
3.3. Analysis of Reuse Selling and Recycling Profits

The selling price for each component by reuse is shown in Figure 5. The life cycle option selection affects the profits made in each country because the prices in used markets in each country are different. Comparing data from Korea and Japan, most components are manufactured at similar prices. However, reuse prices in the Korean data show a larger profit in the Main board, PCI Board, and Big Fan cover than ones in the Japanese data. In particular, the Main Board is about five times more valuable in Korea, and the PCI board is twice as valuable as in Japan. It is noted that the reuse profit of the component is zero because there is no data on the sale of the products in the two countries. The reuse profits of some components do not cover disassembly cost. This is why some components have costs which mean negative profits on reuse such as #2 Cable, #5 FDD, #6 CDD, #8 Big Fan, #9 Big Fan Cover, #10 Swithch, and #12 Speaker.
The profits from recycling components are shown in Figure 6. Recycling profit is the sum of the treatment and disposal costs and the amount required to disassemble the components. The treatment and disposal costs are calculated by adding up the costs of disassembling, selling materials, and landfill costs. There is little difference between the two cases as the Korean data are obtained by multiplying the Japanese amount by the wage conditions. It is noted that the recycling profits are 0 for #1 Fan controller, #3 PCI board, #7 Switch, #13 Memory, and #14 Main board because no data were obtained for those components through the REM [14]. In Figure 6, some components also have negative profits such as #2 Cable, #9 Big Fan Cover, #11 Inside Switch, and #12 Speaker since those components’ treatment costs do not cover the disassembly cost.

3.4. The Difference of Two Countries

Figure 7 displays the percentage of GHG emissions and weight for each component’s material. Figure 7a shows the weight percentage according to the material of the components in the product. It is assumed that Korea and Japan produce the same product; thus, they obtained the same weight percentage ratio.
Figure 7b,c show the GHG emissions percentages according to the material of the components when the product is produced in Korea and Japan, respectively. The materials with the highest percentages by weight are AL/AL alloy (73%), followed by the Circuit Board (11%), FE (7%), SUS (5%), and PVC (4%), as shown in Figure 7a. The largest emissions in Figure 7b for Korea are the AL/AL alloy (46%), followed by the Circuit Board (36%), FE (10%), SUS (5%), and PVC (3%). PVC and SUS have relatively small percentages compared to other materials because only one component of the product is made using these materials. Japanese GHG emissions in Figure 7c also have approximately the same ratio as Korean ones that are shown in Figure 7b. However, the percentage is different, even though the two countries produce the same product. As shown in Figure 7, AL/AL alloy accounts for the largest proportion of GHG emissions and weight, but the GHG generation proportion for AL/AL alloy is lower than that of its weight. However, FE, PVC, and SUS had similar rates of 1:1 on both sides.
With respect to the Circuit Board that accounted for the second largest percentage, while the weight-based percentage accounted for 11%, the GHG emissions were larger with percentages of 36% in Korea (Figure 7b) and 43% in Japan (Figure 7c), respectively. To achieve a higher GHG saving rate, collecting the AL/AL alloy material and the Circuit Board are preferred in both countries when the components are selected by reuse or recycling as a life cycle option. However, considering additional costs such as transportation by weight, the circuit board could be the best choice for obtaining a high GHG saving rate. Estimating all data used in Section 2 and Section 3 for calculating the two objectives are listed in Table A1 in Appendix B.

4. Analysis of Life Cycle Option Selection in Each Country

Currently, materials are procured from all over the world when a product is produced. Because of this global supply chain, it is said that manufacturing countries share the responsibility for reducing natural resource usage and GHG emissions [24]. Collaboration between countries can enhance environmental and economic efficiency. However, each country has different market formats and values, such as the reuse of products as well as GHG emissions, minimum wages, and demand for products. This means that there are different reuse sales revenue and GHG emissions in each country. Thus, in this section, considering the reuse sale revenue and the GHG emissions in each country, multi-national data are compared to find a cost-effective way for components to be reused, recycled, or disposed of, and which country should collect components for obtaining higher profits through the best life cycle option selection.

4.1. Results of Life Cycle Option Selection

Table 3 shows results of life cycle option selection in Korean and Japanese cases for a five usage-years computer. Total profit refers to how much profit can be gained by selecting the life cycle option, while total GHG saving rate shows how many GHG emissions can be saved by using the life cycle option. The selected solutions were determined using numerical experiments.
First, reuse components such as #1 Fan Controller, #3 PCI Board, #13 Memory, and #14 Main Board were identified in both Korea and Japan for all target GHG saving rates. This is because the reuse profits of these components were higher than the recycling costs as shown in Figure 5 and Figure 6. Next, recycled components such as #2 Cable, #4 HDD, #5 FDD, #6 CDD, #8 Big Fan, #9 Big Fan Cover, and #10 Small Fan were always recycled for all targeting rates because the recycling profit is higher than reuse ones for those components. Finally, the other components for the #11 Inside Switch and #12 Speaker could be disposed of by changing the target GHG saving rates.
In the disassembly phases, when some of the components are disassembled, they have disassembly precedence relationships as shown in Figure A1 in Appendix A among the disassembly tasks. According to the disassembly precedence relationship for the computer in Appendix A, #2 Cable, which has one of the low GHG emissions, must be removed to disassemble components #4 HDD, #5 FDD, and #6 CDD. This is because they can obtain more profits from the component’s revenue and higher GHG emissions than disassembling other components. Thus, #2 Cable should be recycled as it enables the recycling of #4 HDD, #5 FDD, and #6 CDD, even though the #2 Cable has a lower GHG emissions relative to the profit compared with the other components.
When the resulting life cycle option selection for each component is compared in Korean and Japanese cases, the results of the Japanese cases are similar to those of the Korean cases in Table 3. Through obtaining the GHG saving rate, the different profit and GHG saving rates resulted because each country has a different market reselling price, labor cost, and GHG emissions. However, the life cycle option for some components can be differed. As an example, 13 out of 14 components for the computer are handled as in the Korean cases, but only component #12 Speaker is handled for reuse. From Table 3, the total profits of the Korean cases are three times higher than those of the Japanese cases because of the big gap of reselling price in Figure 5. On the other hand, the percentage of recovered GHG emissions and the life cycle option selection were similar in both cases; however, the amounts of GHG emissions are different.
Furthermore, considering the recovered GHG emissions efficiency from the results on Table 3, the maximum recovered GHG emissions per yen in the Korean case is 28 [g/yen] compared to 43 [g/yen] in Japan. Considering the recovered GHG emission efficiency, it is suggested that more cost-effective life cycle options can be implemented in Japan. Thus, when producing new products, it is better to consider production in Japan instead of Korea in terms of environment friendliness, but the components for reutilization through the life cycle option can provide a higher profit in Korea.

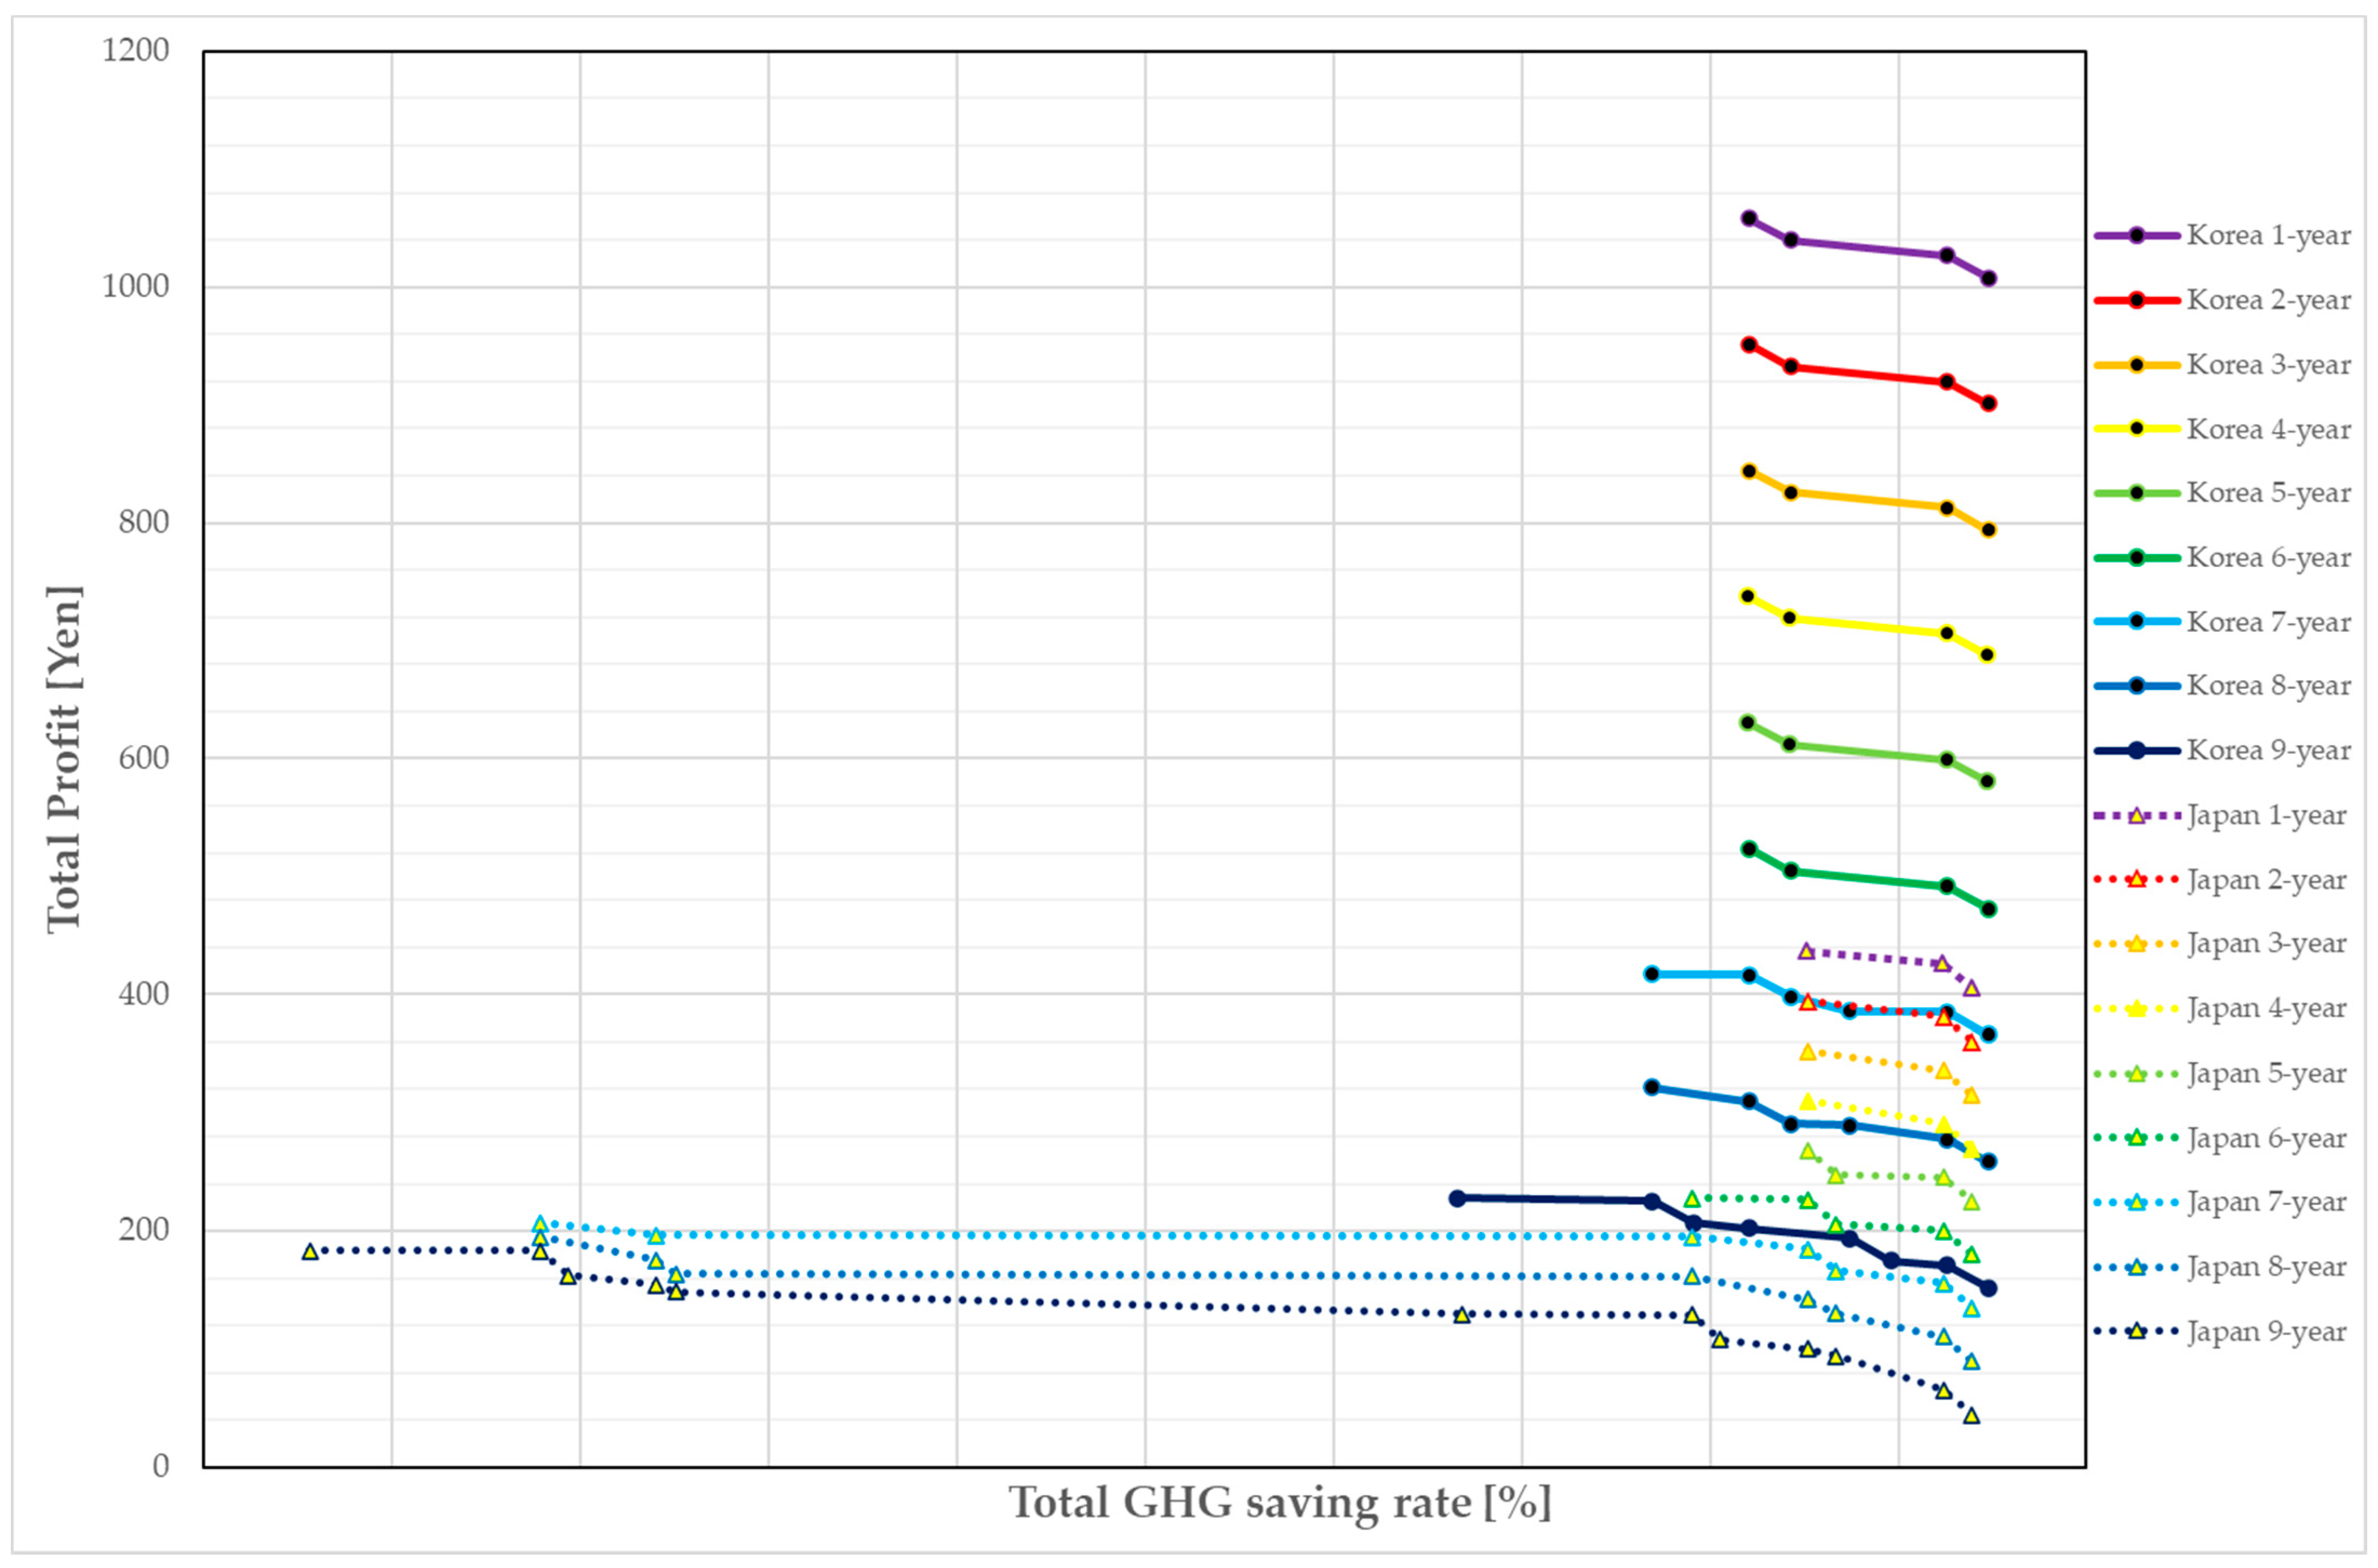
4.2. Effects of Difference by Usage Year

In the previous Section 4.1, the usage year of the product was assumed as five years. However, the collected EOL products have a variety of usage years for individual users. In this Section 4.2, the total GHG emissions and total profit are analyzed according to the usage year period of the product. Figure 8 shows how products in Korea and Japan change over their usage period. The points for total profit and total GHG emissions on the graph were obtained through the selected life cycle option for each component: the left vertical axis represents the range of total profit [Yen], and the horizontal axis shows GHG saving rates [%]. The usage-year period is set from one year to nine years. Overall, Korean cases achieve at least 80% of the GHG saving rate and profits of approximately 1100 [Yen]. Japanese cases achieve at least a 50% GHG saving rate and approximately 440 [Yen] in total profit.
In Figure 8, Korean data generally appear to have a similar tendency on graphs ranging from one to nine years. Results from one to six usage-years vary in total profit over the period of usage year; however, the same GHG saving rate is seen when components are reutilized throughout the life cycle. From seven to nine years, the price of reuse changes according to the period of usage.
In the Japanese cases, usage of one to four years obtained the same GHG saving rate, but there is a difference in profits depending on the components. The lines that represent five usage-years show the same three results that can obtain the same GHG saving rate such as one to four years but different results for GHG saving rate in the second point of five usage-years. Additionally, graphs from six to nine usage-years mean a low GHG saving rate of 50%, but they show new results from years one to five. For nine years of use, when 58% of the GHG saving rate is recovered, it shows the ability to obtain similar profits to the products with eight years of usage.
Comparing the data by different usage years between two countries showed approximately the same decreasing profit gap over their usage lifetime. However, GHG saving rate in Korea did not significantly change compared to one in Japan. Moreover, in the case of Korea, products with longer usage years did not bring similar results to the benefits of the previous usage years. However, Japanese data can produce various results depending on the year of usage, whereas Korean cases are always at a high level in terms of profit, even if the product is still recycled.

5. Conclusions

This study applied the life cycle option models to Korea and Japanese comparison cases for reducing GHG emissions and making profits simultaneously using 0–1 integer programming with the ε constraint. Firstly, the GHG emissions for each component were estimated using the LCI databases with Asian I/O tables with software [13], and profits were calculated using the REM software by Hitachi Ltd. [14] and the Korean market survey. Secondly, the bi-objectives for GHG emissions and profits were formulated to select components for identifying the best life cycle option. Finally, the results for each country were compared in terms of material-based GHG emissions and profits. The main findings are as follows:
  • The proposed Korean and Japanese analysis enables us to evaluate reusing components in EOL products environmentally-friendly and economically instead of using new raw materials. These can contribute to sustainable consumption and production in one of the goals of the Sustainable Development Goals (SDGs) and reduce waste. This study also shows the difference between the two countries, rather than the life cycle option of products in one country in view of globality. Through this study, effects of environmentally-friendly and economically factors are described for managers who prioritize environmental or economic factors to managers’ goals considering the global environment.
  • Total GHG emissions are 17,116 [g-CO2eq] in Korea, which is approximately 1.7 times higher than the 10,040 [g-CO2eq] in Japan. The procurement cost and profit by reuse and recycling were almost the same in both countries. Most of the reuse profits were priced at a similar level, except for two components. The price in Korea for the #3 PCI Board was more than double, and one for the #14 Main Board was more than five times higher than the Japanese prices in Korea. When producing new products, Japan’s production of low GHG with similar procurement amounts could be a better choice.
  • The results of life cycle option selection on a computer used for five years are shown in each country’s BOM table. The GHG saving rate was up to 97.39% in Korea and 96.95% in Japan, while the Korean case showed a minimum total profit of 579.99 [Yen] and for the Japanese at least 225.08 [Yen]. Although the Korean case showed higher GHG emissions than the Japanese one, most GHG emissions were recovered through the selected life cycle option, and profits were approximately three times higher than one in Japan. However, GHG recovery efficiency was higher in Japan 43 [g/yen] than in Korea 28 [g/yen]. In order to attain more profits, it was better to retrieve and reutilize the components in Korea; however, if the maximum GHG recovery efficiency is desired, Japanese is a better option.
  • The selection in the life cycle option based on usage year indicated that both countries’ data fell by the same gap of profit each year. The Korean cases resulted in a minimum GHG saving rate of 80% or more, even if the usage year increased; however, the Japanese cases brought a minimum GHG saving rate of 50% when the number of usage years increased. The Korean cases did not make a higher profit in shorter usage years, but it always obtained a more than 80% GHG saving rate. Even if the length of use-years increased, the Japanese cases could have similar profits as the results of the previous period if they chose between 50% and 70%. This is because only components with large profits from recycling compared to GHG emissions are selected for the life cycle options between 50% and 70%.
  • Although there are differences in GHG emissions, used market prices, and recycling prices in each country, it is shown that higher profits and GHG saving rate can be achieved through reutilization of several components. In general, the shorter period of usage brings a higher amount of recycling profits, but the longer the period of usage, the smaller the profit. However, the amount and the proposal are given to choose various results, where reuse of components can be more profitable than the benefits of recycling.
Future study should consider processes other than life cycle options when products are produced in various countries in consideration of globality. (1) There are additional processes such as remanufacturing and upgrading. Remanufacturing is defined to reproduce a product (or a module) as good as new, in which an end-of-life (EOL) product is completely disassembled into components [11]. Upgrading refers to changing some components on used products and making them improve the product’s performance [25]. These two processes should be considered to make various results and give more suggestions. (2) Consideration of supply chain by region using globality should be considered. This is because, currently, the cost of production can vary greatly depending on the regional production environment or the characteristics of the country, and this effect has a significant impact on production.

Author Contributions

J.H., Y.K. and T.Y. conceptualized the goals and aims of this study and T.Y provided resources. J.H., H.I., Y.K. and T.Y. designed the methodology. T.Y. acquired funds. J.H., Y.K., S.Y. and M.I. generated the metadata. J.H., Y.K. and H.I. formulated and performed the numerical experiments. Additionally, J.H. programmed and validated the formulation, visualized the results, and wrote the original draft assisted by H.I., Y.K., H.I. and T.Y. T.Y managed the project and supervised the overall content and reviewed this paper. Finally, J.H., H.I. and T.Y. revised the manuscript. All authors have read and agreed to the published version of the manuscript.

Funding

This study was partially supported by the Japan Society for the Promotion of Science (JSPS), KAKENHI, Grant-in-Aid for Scientific Research (A), JP18H03824, from 2018 to 2021.

Data Availability Statement

Not applicable.

Acknowledgments

The authors would like to thank Norihiro Itsubo at Tokyo City University for providing the LCI database with Asian I/O tables, Masaru Morohoshi in Hitachi, Ltd., who generously provided their Recyclability Evaluation Method (REM), and Hayate Irie at the University of Electro-Communications for his helpful comments.

Conflicts of Interest

The authors declare no conflict of interest.

Appendix A. Precedence Relationship of Computer

Figure A1. The precedence relationships of a computer [26].
Recycling 06 00055 g0a1
The precedence relationships for the disassembly process for a computer are shown in Figure A1 [26]. For disassembly, precedence relationships must be satisfied among the components. The solid line indicates that a precedence relationship exists among the components. For example, component #2 Cable must be disassembled for disassembling #4 HDD, #5 FDD, #6 CDD, and the #9 Big Fan Cover can be disassembled after the #8 Big Fan is disassembled. The dotted line indicates that there are no relationships among the components.

Appendix B. The Estimated Data of Each Component

Table A1. All estimated data of each component on a five usage-years computer.
NoPart NameMaterial TypeDisassembly Cost [Yen]Treatment and Disposal Cost [Yen]Recycling Profit [Yen]Procurement Cost [Yen]Reuse Profit [Yen]GHG Saving Rate [%]Life
Expectancy [year]
KoreaJapanKoreaJapanKoreaJapanKoreaJapanKoreaJapanKoreaJapan
#1Fan controllerCircuit board−34.28−37.710.000.00−34.28−37.71−72.20−76.81112.2090.002.583.0610
#2CablePVC−32.10−35.3122.4422.00−9.66−13.31−25.88−27.546.350.002.862.1010
#3PCI boardFe−3.58−3.940.000.00−3.58−3.94−58.49−62.22169.3460.006.564.5110
#4HDDAL/AL alloy−4.99−5.49122.40120.00117.41114.51−302.38−321.6848.0360.0015.2814.905
#5FDDAL/AL alloy−21.97−24.1740.8040.0018.8315.83−100.79−107.2316.600.005.094.975
#6CDDAL/AL alloy−21.97−24.1781.6080.0059.6355.83−201.58−214.4514.8720.0010.199.935
#7SwitchCircuit board−19.17−21.090.000.00−19.17−21.09−72.20−76.810.000.002.583.0610
#8Big fanAL/AL alloy−34.28−37.7181.6080.0047.3242.29−201.58−214.459.2316.0010.199.935
#9Big fan coverFe−33.19−36.510.820.80−32.37−35.71−19.50−20.740.0012.002.191.5010
#10Small fanAL/AL alloy−34.28−37.7140.8040.006.522.29−100.79−107.2323.3410.005.094.975
#11Inside switchFe−19.17−21.090.410.40−18.76−20.69−9.75−10.370.000.001.090.7510
#12SpeakerSUS−34.28−37.712.452.40−31.83−35.31−46.88−49.882.7030.005.263.6110
#13MemoryCircuit board−5.92−6.510.000.00−5.92−6.51−144.41−153.6236.3460.005.176.1210
#14Main boardCircuit board−68.26−75.090.000.00−68.26−75.09−722.03−768.12751.99210.0025.8430.6010
Totals−367.46−404.21393.31385.625.85−18.61−2078.47−2211.141190.99568100100
All estimated data of each component on a five usage-years computer are described in Table A1. In this study, procurement costs were estimated using the 2015 input–output table of the Ministry of Internal Affairs and Communications [23]. The material-based GHG emissions of the computer were estimated using a decision support tool [13] based on the LCI database with Asian I/O tables. The other costs were calculated using the REM [14].

References

  1. Shevchenko, T.; Saidani, M.; Danko, Y.; Golysheva, I.; Chovancová, J.; Vavrek, R. Towards a Smart E-Waste System Utilizing Supply Chain Participants and Interactive Online Maps. Recycling 2021, 6, 8. [Google Scholar] [CrossRef]
  2. Kinoshita, Y.; Yamada, T.; Gupta, S.M.; Ishigaki, A.; Inoue, M. Disassembly parts selection and analysis for recycling rate and cost by goal programming. J. Adv. Mech. Des. Syst. Manuf. 2016, 10, 1–15. [Google Scholar] [CrossRef] [Green Version]
  3. Hasegawa, S.; Kinoshita, Y.; Yamada, T.; Bracke, S. Life cycle option selection of disassembly parts for material-based GHG saving rate and recovery cost: Analysis of different market value and labor cost for reused parts in German and Japanese cases. Int. J. Prod. Econ. 2019, 213, 229–242. [Google Scholar] [CrossRef]
  4. Kokubu, K.; Itsubo, N.; Nakajima, M.; Yamada, T. Low Carbon Supply Chain Management; Chuokeizai-sha Inc.: Tokyo, Japan, 2015. (In Japanese) [Google Scholar]
  5. Sarkar, B.; Ullah, M.; Kim, N. Environmental and economic assessment of closed-loop supply chain with remanufacturing and returnable transport items. Comput. Ind. Eng. 2017, 111, 148–163. [Google Scholar] [CrossRef]
  6. Sarkar, B.; Tayyab, M.; Kim, N.; Habib, M.S. Optimal production delivery policies for supplier and manufacturer in a constrained closed-loop supply chain for returnable transport packaging through metaheuristic approach. Comput. Ind. Eng. 2019, 135, 987–1003. [Google Scholar] [CrossRef]
  7. Sarkar, B.; Dey, B.K.; Pareek, S. A single-stage cleaner production system with random defective rate and remanufacturing. Comput. Ind. Eng. 2020, 150, 106861. [Google Scholar] [CrossRef]
  8. Saxena, N.; Sarker, B.; Singh, S.R. Selection of remanufacturing/production cycles with an alternative market: A perspective on waste management. J. Clean. Prod. 2020, 245, 118935. [Google Scholar] [CrossRef]
  9. Ullah, M.; Asghar, L.; Zahid, M.; Omair, M.; AlArjani, A.; Sarkar, B. Ramification of remanufacturing in a sustainable three-echelon closed-loop supply chain management for returnable products. J. Clean. Prod. 2021, 290, 125609. [Google Scholar] [CrossRef]
  10. Marinello, S.; Gamberini, R. Multi-criteria decision making approaches applied to waste electrical and electronic equipment (WEEE): A comprehensive literature review. Toxics 2021, 9, 13. [Google Scholar] [CrossRef] [PubMed]
  11. Yoda, K.; Irie, H.; Kinoshita, Y.; Yamada, T.; Yamada, S.; Inoue, M. Remanufacturing option selection with disassembly for recovery rate and profit. Int. J. Autom. Technol. 2020, 14, 930–942. [Google Scholar] [CrossRef]
  12. Han, J.; Yoda, K.; Irie, H.; Kinoshita, Y.; Yamada, T. Comparison of Korean, Japanese and German Cases by Life Cycle Option Selection for Material-Based CO2 Saving Rate and Cost. In Proceedings of the 2020 Northeast Decision Sciences Annual Meeting, Cambridge, MA, USA, 26–28 March 2020; pp. 684–691. [Google Scholar]
  13. Umeda, K.; Kondo, R.; Kinoshita, Y.; Yamada, T.; Yamada, S.; Inoue, M. Development of a decision support tool for GHG emission and procurement costs with material recommendation. J. Jpn. Soc. Des. Eng. 2020, 55, 277–294. (In Japanese) [Google Scholar]
  14. Akahori, T.; Matsuno, Y.; Adachi, Y.; Yamamoto, N.; Hamatsuka, Y.; Nishi, T. Application of REM (Recyclability Evaluation Method) to home electric appliances: Evaluation of recycling rates and cost . J. Jpn. Soc. Waste Manag. Experts 2008, 19, 44–50. (In Japanese) [Google Scholar] [CrossRef] [Green Version]
  15. Lieberman, G.; Hillier, F.S. Introduction to Operations Research; McGraw-Hill: New York, NY, USA, 2005. [Google Scholar]
  16. Eskandarpour, M.; Dejax, P.; Miemczyk, J.; Péton, O. Sustainable supply chain network design: An optimization-oriented review. Omega 2015, 54, 11–32. [Google Scholar] [CrossRef]
  17. Klöpffer, W. Life cycle assessment. Environ. Sci. Pollut. Res. 1997, 4, 223–228. [Google Scholar] [CrossRef] [PubMed]
  18. Sugiyama, H.; Fukushima, Y.; Hirao, M.; Hellweg, S.; Hungerbühler, K. Using standard statistics to consider uncertainty in industry-based life cycle inventory databases. Int. J. Life Cycle Assess 2005, 10, 339–405. [Google Scholar] [CrossRef]
  19. SHARP, 2002. Environmental Report. Available online: https://global.sharp/corporate/eco/report/backnumber/pdf/esr2002e.pdf (accessed on 26 December 2019).
  20. Auction Korea. Available online: www.auction.co.kr (accessed on 10 October 2019).
  21. Joong-go-nara. Available online: https://cafe.naver.com › joonggonara (accessed on 11 October 2019).
  22. Finder. Available online: https://www.finder.com/starbucks-index (accessed on 27 October 2019).
  23. Ministry of Internal Affairs and Communications, Input-Output Tables. Available online: https://www.soumu.go.jp/toukei/ (accessed on 15 November 2020).
  24. Halada, K. Resource Efficiency, Circular Economy and Material Technology. 2018. Available online: http://susdi.org/doc/170830Resource%20Efficiency,%20Circular%20Economy%20and%20Material%20Technology.pdf (accessed on 27 October 2019). (In Japanese).
  25. Yamada, S.; Miyazima, S.; Yamada, T.; Bracke, S.; Inoue, M. Decision support method for upgrade cycle planning and product architecture design of an upgradable product. Int. J. Autom. Technol. 2020, 14, 919–929. [Google Scholar] [CrossRef]
  26. Igarashi, K.; Yamada, T.; Inoue, M. Disassembly system design with environmental and economic parts selection using the recyclability evaluation method. J. Jpn. Ind. Manag. Assoc. 2013, 64, 293–302. [Google Scholar]
Figure 1. Analysis procedure of reuse and recycling option selection for components.
Recycling 06 00055 g001
Figure 2. System boundary: Treated GHG emissions are inside the dotted red line while addressed cost and profit are in the green boxes.
Recycling 06 00055 g002
Figure 3. Comparison of GHG emissions of each component in Korea and Japan.
Recycling 06 00055 g003
Figure 4. Comparison of procurement cost of each component in Korea and Japan.
Recycling 06 00055 g004
Figure 5. Comparison of reselling profits for each component in Korea and Japan.
Recycling 06 00055 g005
Figure 6. Comparison of recycling profits for each component in Korea and Japan.
Recycling 06 00055 g006
Figure 7. Percentage of each component’s material (a) based on weight; (b) based on GHG emissions in Korea; (c) based on GHG emissions in Japan.
Recycling 06 00055 g007
Figure 8. Comparison of the results of total GHG emissions and total profit in Korea and Japan depending on usage-year.
Recycling 06 00055 g008
Table 1. Literatures on life cycle option by considering objectives for environmentally-friendly and economy.
AuthorsLife Cycle OptionObjectives
EnvironmentEconomy
ReuseRecycleGlobalityCarbon/GHG EmissionsProfitCost Reduction
Sarkar et al. (2017)OO O O
Sarkar et al. (2019)OO OOO
Sarkar et al. (2020) O O
Saxena et al. (2020)O O
Ullah et al. (2021)OO O O
Hasegawa et al. (2019)OOOOOO
Han et al. (2020)OOOOOO
Yoda et al. (2020)OO OO
This studyOOOOOO
Table 2. Notation of parameters and variables used in this study.
NotationTerms
Sets and Indices
iIndex for the predecessors of component j with task j
jIndex of components/tasks (j = 1, 2, ..., N)
NNumbers of components
PjSet of tasks precedence task j at component j
Decision Variables
xjBinary value: 1 if component j is recycled, otherwise 0
yjBinary value: 1 if component j is reused, otherwise 0
zjBinary value: 1 if component j is crushed and disposed of, otherwise 0
Parameters
ljLife expectancy of component j
CtrejTreatment and disposal cost of component j
CrsjReuse profits of component j
CdisjDisassembly cost of component j
ZCrush cost from disposal component
ejGHG saving rate at component j
uUsage year of a product
Evaluations
ETotal GHG saving rate of components
P r o f Total profit of components
ε G H G Constraint of total GHG saving rate of selected components
Table 3. The results of life cycle option selection on Korea and Japan: five usage-years computer.
No.Part NameMaterial TypeTotal
Weight [g]
Korean CasesJapanese Cases
Targeted GHG Saving Rate [%]
09192960939496
1Fan controllerCircuit board50reusereusereusereusereusereusereusereuse
2CablePVC220recyclerecyclerecyclerecyclerecyclerecyclerecyclerecycle
3PCI boardFe300reusereusereusereusereusereusereusereuse
4HDDAL/AL alloy1500recyclerecyclerecyclerecyclerecyclerecyclerecyclerecycle
5FDDAL/AL alloy500recyclerecyclerecyclerecyclerecyclerecyclerecyclerecycle
6CDDAL/AL alloy1000recyclerecyclerecyclerecyclerecyclerecyclerecyclerecycle
7SwitchCircuit board50disposedisposedisposedisposedisposedisposedisposedispose
8Big fanAL/AL alloy1000recyclerecyclerecyclerecyclerecyclerecyclerecyclerecycle
9Big fan coverFe100recyclerecyclerecyclerecyclerecyclerecyclerecyclerecycle
10Small fanAL/AL alloy500recyclerecyclerecyclerecyclerecyclerecyclerecyclerecycle
11Inside switchFe50disposerecycledisposerecycledisposerecycledisposerecycle
12SpeakerSUS300disposedisposerecyclerecycledisposedisposereusereuse
13MemoryCircuit board100reusereusereusereusereusereusereusereuse
14Main boardCircuit board500reusereusereusereusereusereusereusereuse
Total Saving Rate [%]91.0492.1396.3097.3992.5993.3496.2096.95
Total Profit [Yen]630.58611.82598.75579.99238.48227.79225.77215.08
Total GHG Emissions [g-CO2eq]15,586.1415,773.3816,486.6716,673.919294.179369.619657.009732.44
Publisher’s Note: MDPI stays neutral with regard to jurisdictional claims in published maps and institutional affiliations.

