1. Introduction
In the last decades, plastic has surged to a position of near prominence as a crafting material not only for common household goods, but also for its contribution to overcoming recent and constantly emerging environmental challenges. Global production since the 1960s has increased twenty-fold, up to 368 million tons in 2019 [
1]. Plastics, for example, may be employed as insulation material to improve energy efficiency for heating and cooling, and as lighter materials in mobility applications, such as planes or cars, to save fuel and reduce polluting emissions, or, more recently, for 3d printing [
2]. Nonetheless, the production, use and discarding of plastic is more often than not wasteful and harmful for the environment, lacking a circular approach that could reduce some of these impacts. Plastics, and in particular polyolefins, are a low-cost, hydrophobic, possibly transparent and bio-inert alternative to other, classic materials.
Each year, more than 29 million tons of plastic waste are produced in Europe, with the largest share being made of thermoplastic polyolefins polypropylene (PP) and polyethylene (PE) [
1]. PP, representing 19% of plastics in Europe, while less dense, is generally harder and more thermally and chemically resistant than PE, which comprises nearly 30% of plastics in Europe, summing both low-density (LD) and high-density (HD) PE. PP is commonly employed for food wraps, automotive parts or pipes, while LD-PE is used for reusable bags, containers or food wrapping films, and HD-PE can be found in bottles, toys or pipes.
Of all produced and wasted plastic in Europe, nearly 25% ends up in a landfill [
1]. Landfilled plastic is, on one hand, a missed opportunity for either energy recovery or recycling, and on the other hand, a direct, harmful pressure on the environment, for example, as marine litter entangling, or ingested by, marine organisms [
3]; as microplastics produced by degradation of larger waste plastic and transported through the atmosphere even to remote locales, with known harmful effects on human health [
4]; as a source of persistent organic pollutants such as polychlorinated biphenyls [
5]; or a cause behind the loss of potentially productive land [
6]. Energy recovery through incineration directly leads to the emission of greenhouse gases and to pollutants harmful to human health, such as formaldehyde or dioxins, where the off-gas is uncontrolled and released without thorough purification, making it an environmentally suboptimal choice [
7,
8]. Moreover, the production of plastics is very energy intensive, with resins incorporating 62–108 MJ/kg of energy, much higher than required for paper, wood, glass or most metals, and about 4% of fossil fuels is yearly employed for the production of plastics, with another 3–4% being used in their manufacture to supply energy [
6,
9].
To date, plastic waste has not been specifically covered in EU legislation. Only Packaging Directive 94/62/EC has set a specific recycling target for plastic packaging. In contrast, the Waste Framework Directive (2008/98/EC) set a general recycling target for household waste, which also applies to plastic waste, and established a waste hierarchy (prevention, preparation for reuse, recycling, recovery, and disposal). The latest EU Multiannual Financial Framework (MFF) set a so called “plastic tax” of 0.80 EUR/kg for non-recycled plastic packaging as of 1 January 2021. Nonetheless, while hard plastic recycling is not obligatory and not registered, several European companies already process hard plastic waste (HPW), and recycling is already common in multiple European countries.
Consequently, considering the costs and drawbacks of producing, landfilling or incinerating plastic, there is a growing, urgent need to increase the effort toward plastic recycling. Two important causes that explain why only about a fourth of all waste plastic is actually recycled are that recycled plastic may not be used for the same application for health and environmental protection reasons, and that post-consumer plastic generally consists of blends of polymers that are difficult to separate [
10].
Plastic recycling begins at collection, either via source separation by private citizens or via mechanical recovery from mixed municipal solid waste. In both cases, techniques have been developed for the separation of the mixed plastic streams by exploiting differences in chemical and physical properties of plastics, such as gravimetric, optic or electrostatic [
11], while technology is still struggling regarding multi-material waste [
12]. PE and PP are usually separated together from the plastic waste stream as gravimetric methods are easy and cost-effective; these polyolefins generally comprise the lighter fraction of the waste stream, as opposed to polymers with density higher than water [
11]. The properties of recycled plastic are generally less desirable than those of virgin plastic [
13] because of physical and chemical changes to the molecular structure of plastic polymers, or because of common contaminants such as alcohols, esters and ketones, which are rarely present in virgin plastic [
14]. A common method of enhancing the inferior characteristics (such as rheological and mechanical properties) of recycled plastic is blending polymers with fillers, such as talc or glass fibers [
13].
Recycling plastic is a sensible choice when the environmental benefits outstrip the potential economic costs. The largest environmental benefits result from a reduction in fossil hydrocarbons needed in the manufacture of virgin plastic and the consequent avoided negative greenhouse gas emissions, particulate matter emissions and acidification potential [
15]. The current recycling rate of 9% for plastics [
16] needs to be increased for any benefit to be felt and for plastic recycling to significantly impact climate change mitigation. One way to evaluate the environmental benefits of alternative scenarios and technology is to perform a life cycle assessment (LCA) analysis. Several literature reviews and case studies exist [
15,
17,
18,
19], offering a strong framework and basis for further and more specific applications of the LCA methodology, although most previous studies focus on plastic wraps and containers instead of hard plastics. In general, no single recycling technology is universally superior to other choices, requiring a thorough evaluation for each specific real-life scenario to identify the most effective solution, whether it may be reuse or energy recovery. Being an energy and cost intensive process, plastic waste recycling is generally supported by national systems based on different taxation frameworks and/or incentives. However, these systems are often limited to specific kinds of plastic waste, namely, containers such as bottles, boxes, blisters etc. Hard plastic products that are not intended to be used as containers are generally excluded from these recycling chains: for instance, this is the case for chairs, basins, crates, toys etc. As a consequence, today these materials are generally not recycled and are instead sent to incinerators or landfills, despite generally being made of PE and PP similarly to container plastic waste [
20]. As described above, new policies strongly support a further increase in the share of recycled plastic, and consequently it is expected that hard plastic waste management will significantly and rapidly change in this upcoming decade.
Moreover, the quality of recycled plastic is to be considered when comparing recycling scenarios with virgin plastic production. During production, plastic polymers are blended together with dyes, plasticizers, fillers and inclusions. As such, recovered materials are not pure and usually are characterized by lower quality and, consequently, need to be downcycled to be used again [
15,
19], which can be seen as a secondary recycling technique [
21]. This translates directly to open-loop strategies, where recycled plastic derived from specific items or applications cannot substitute virgin plastic needed for the same purpose because of its decreased quality and properties. Optimal strategies to overcome this obstacle would be upstream policy changes, ensuring the production of less contaminated plastics, or downstream technological developments, pushing toward the recovery of higher quality recycled polymers. Thus, there is an urgent need to understand the properties of plastic blends prepared from hard plastic waste. Unfortunately, most of the previous literature has been focused on plastic blends made on container plastic waste, generally wasted bottles. Recycled plastic packages have to contend with physical degradation, polymeric or molecular contamination [
22] and hygroscopicity due to polar contaminants originating from prints, glues, etc. [
23]. Contaminants such as VOCs are generally the result of insufficient cleaning during recycling, of degradation processes or of additives in the polymeric matrix [
24,
25,
26]. HPW, on the other hand, must contend with a different set of obstacles: for example, due to the long life of most hard plastic consumer products compared to that of plastic packaging, degradation processes are arguably more significant for the development of secondary contaminants, together with additives and residues from additives. At the same time, hard plastic items contain fewer components that are made from different polymers, so polymeric contamination is more likely to originate from sorting mistakes, if present, than from components made from different polymers. Hard plastic items are also devoid of inks, glues or other hygroscopic contaminants, and are less likely to be employed as containers, reducing the impact of product residues as molecular contaminants. Finally, hard plastic is prominently produced via injection molding, while plastic packages are produced with a mixture of injection and blow molding technologies, resulting in different MFI profiles.
The blending of virgin and recycled plastic has also been studied for thermoplastics employed in 3d printing [
27] and for plastic packages. For instance, a recent study [
28] demonstrated the usefulness of blending virgin polypropylene with recycled mixed polyolefins from beverage bottle enclosures, highlighting how mixing defined quantities of post-consumer polyolefins with virgin plastic could lead to better results for desired properties. For example, 80% of post-consumer polyolefins mixed with 20% of virgin polypropylene directly produced a 14% increase in the tensile modulus compared to pure virgin polypropylene. Curtzwiler et al. report on a series of analyses, such as thermogravimetric analysis, melt flow index testing and electromechanical testing, to define the contribution of post-consumer polyolefin to the physical and chemical properties of blends, concluding that in most cases the law of mixing may be used to predict the blends’ properties as relations are generally linear.
However, to the best of our knowledge, the effects of post-consumer hard plastic on the properties of plastic blends have not been investigated yet. This is particularly critical because hard plastic materials have a completely different composition in terms of additives, plasticizers, etc.
This study aimed to assess the effect of adding mixed, uncharacterized hard polyolefin-based waste to polypropylene plastic blends, and to identify the maximum amount of post-consumer material not affecting the overall properties of the secondary raw material, thus indirectly studying the properties of Italian recycled hard plastic. For this purpose, post-consumer (PC) and post-industrial (PI) polyolefin blends were prepared and characterized in order to assess whether their rheological characteristics were compliant with injection molding or thermoforming requirements. Moreover, an LCA analysis was performed to evaluate the environmental benefits of employing high quality recycled polyolefin blends instead of virgin plastics, aiming for a closed-loop system by recovering polymers that do not need to be downcycled for reuse.
3. Results and Discussion
3.1. Thermal and Thermogravimetric Analysis
Regarding differential scanning calorimetry tests, as a preliminary investigation pure blends (PC100-PI0 and PC0-PI100) were analyzed to characterize base materials and allow more objective comparisons between them.
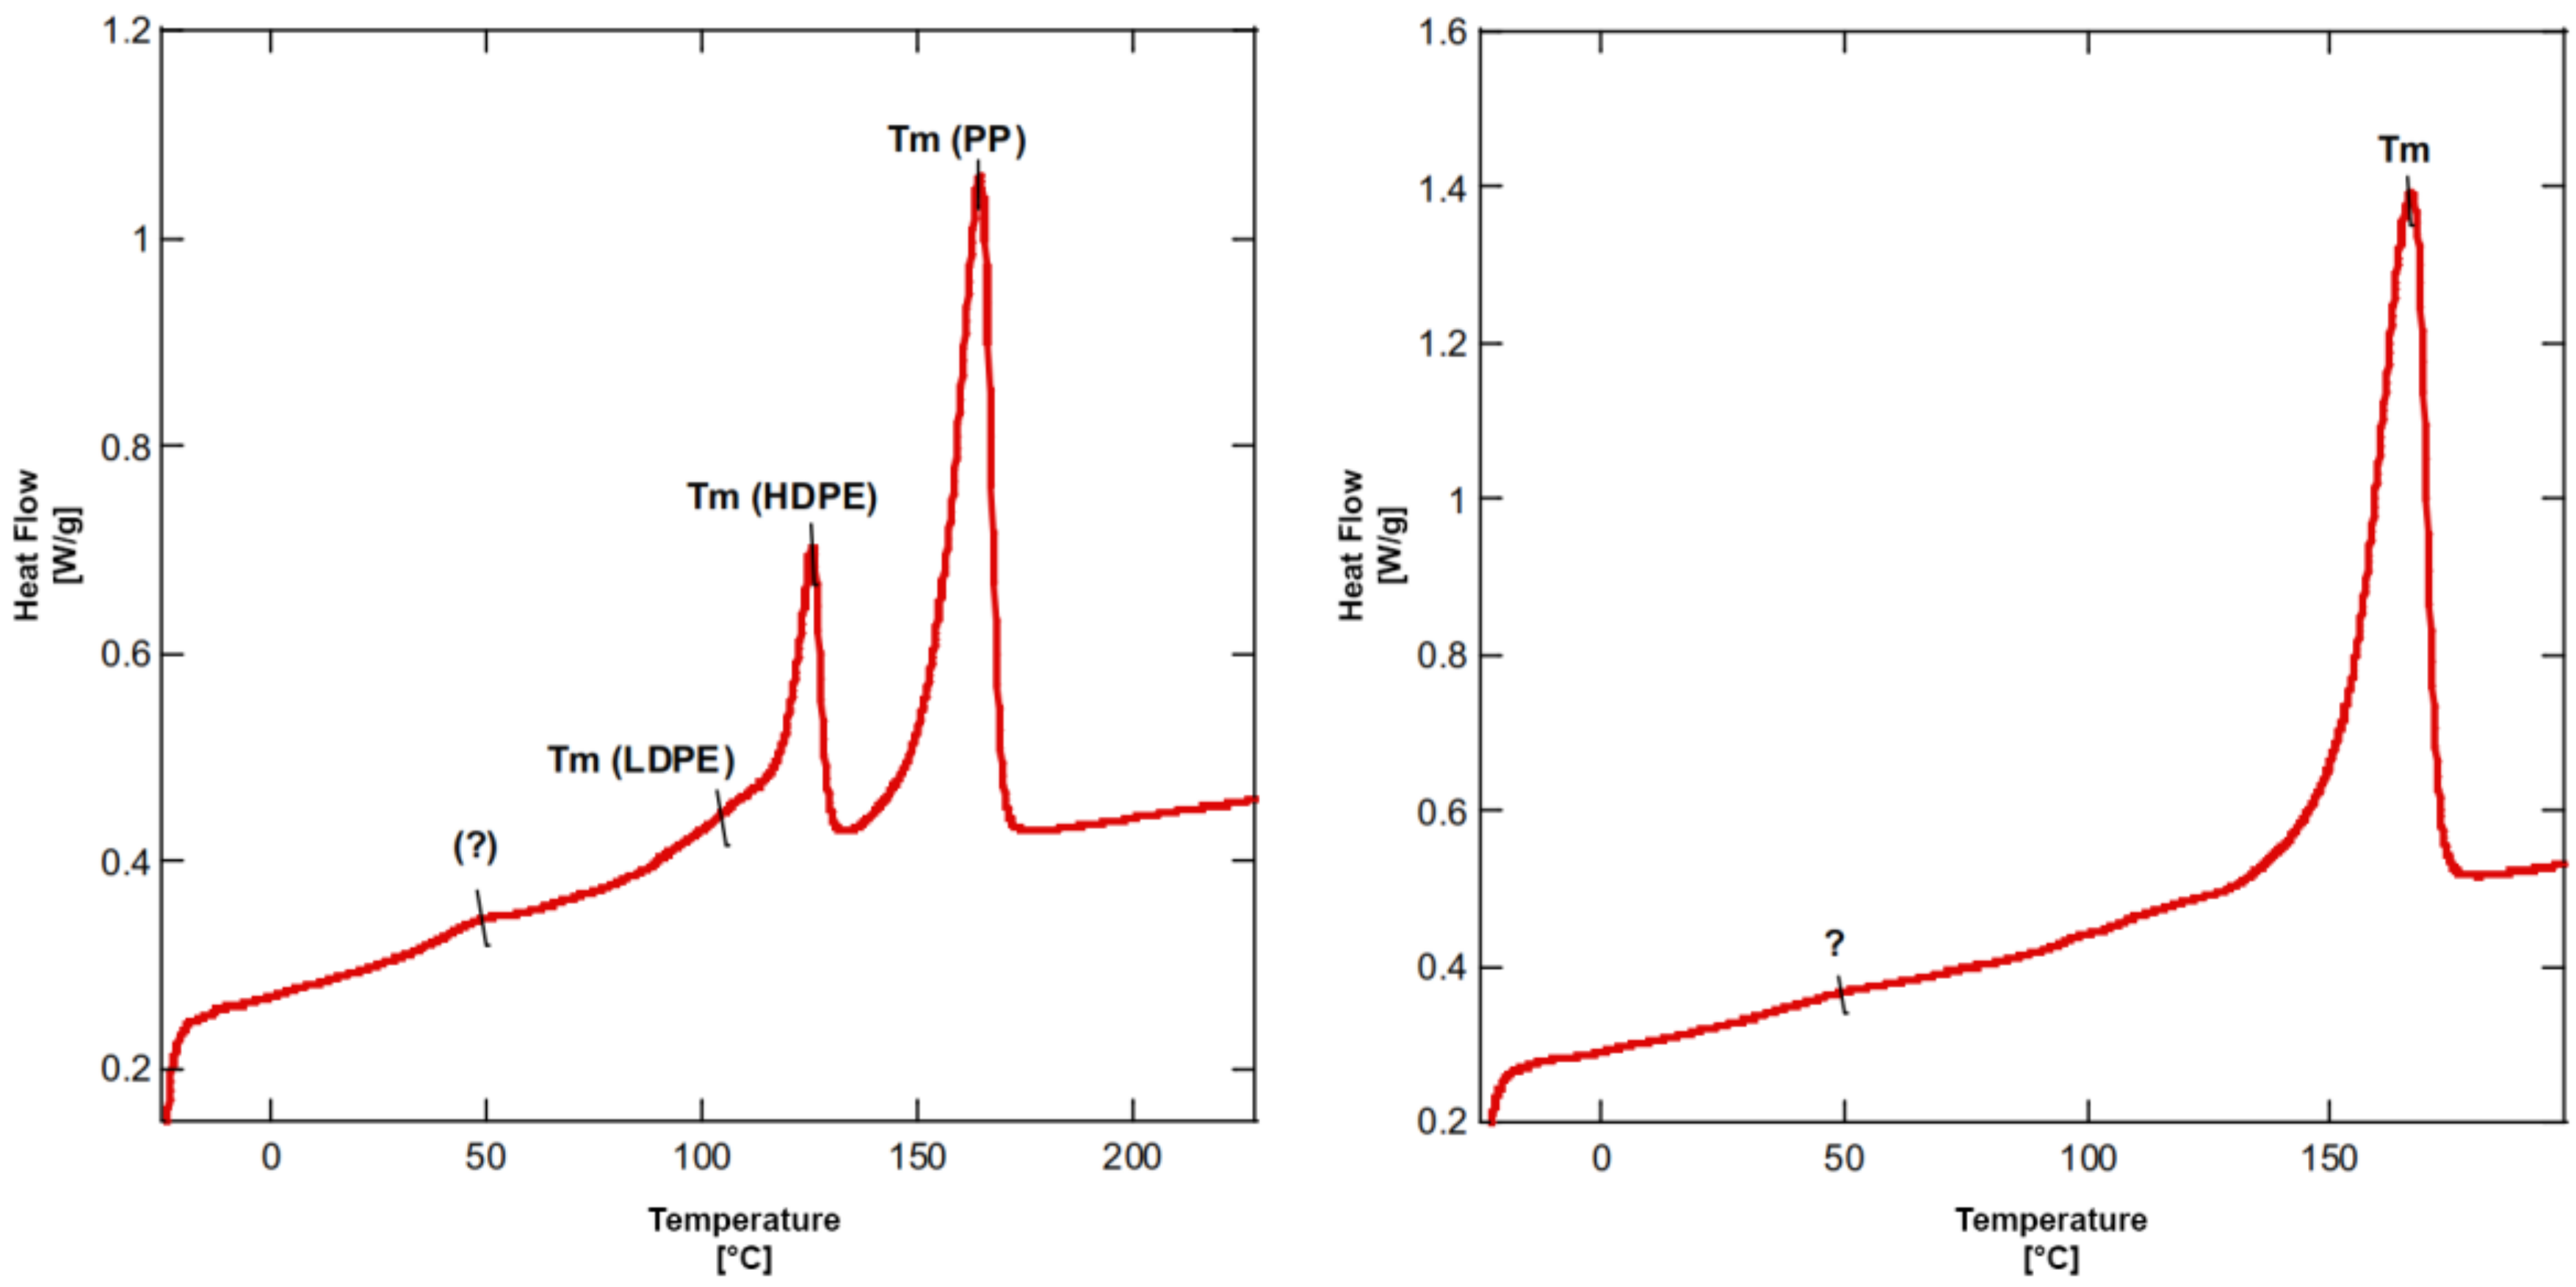
Figure 3 (left) shows the thermogram for pure post-consumer plastic. The diagram highlights the different polymers that can be found in this non-preselected plastic; several melting transitions are clearly visible and may be associated with several compounds. In particular, at a temperature of 106 °C there is a short peak that can be attributed to low-density PE, which has a melting temperature between 105 °C and 115 °C. A higher, narrower and clear peak, probably consistent with the melting transition of a high-density PE, occurs at about 125 °C. The highest peak occurs at 164 °C and can be attributed to the PP. There is also another small peak around 50 °C, indicated as “?” in the figure, which may be due to a low melting point compound or to the evaporation or an evolution of unidentified additives. As an alternative, the described phenomenon may be due to previous treatments or processes, because in the second heating phase, this peak was not detected.
Figure 3 (right) shows the thermogram for pure post-industrial plastic. Compared to
Figure 3 (left), low temperature transitions are much less evident or absent, with only a neat peak at 166 °C for PP. This is in line with previous results reported in Larsen et al. and Brachet et al., where PE and PP blends of differing compositions showed comparable peaks and behavior [
38,
39]. These results show the complexity of PC plastic, which is mainly composed of PP, HDPE and LDPE, while PI plastic is mostly homopolymer grade and, to a lesser extend, a co-polymer.
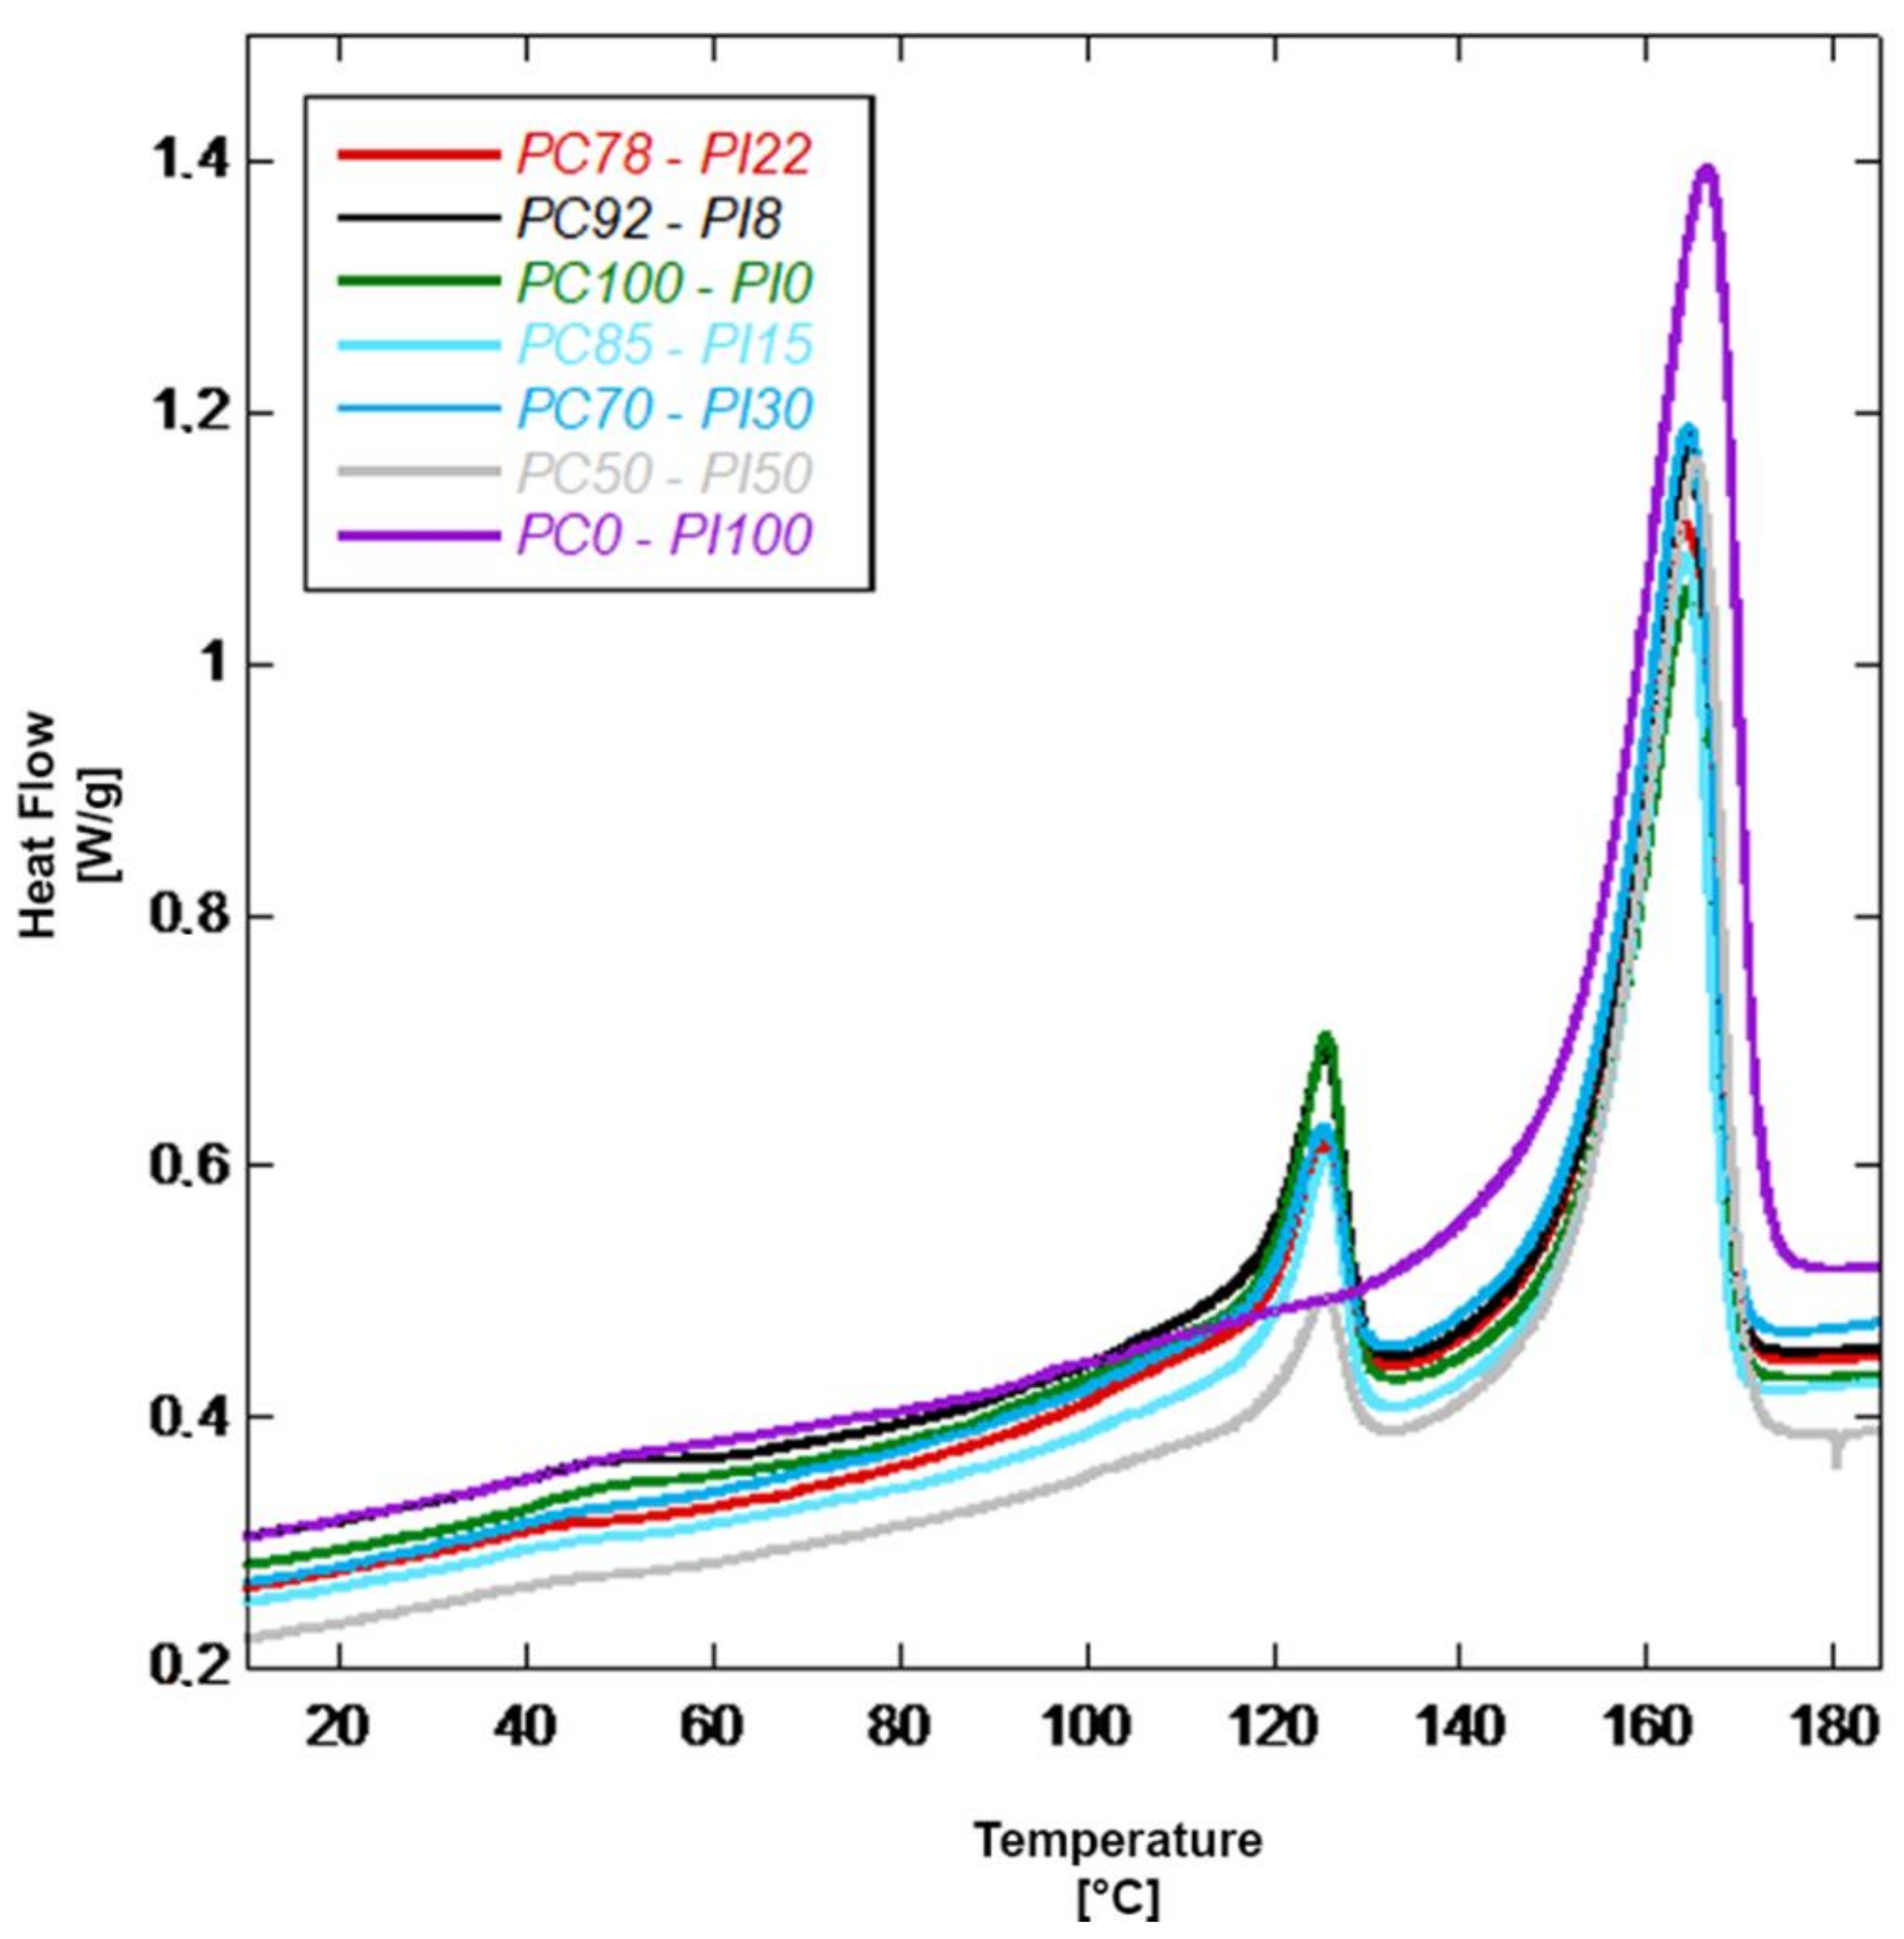
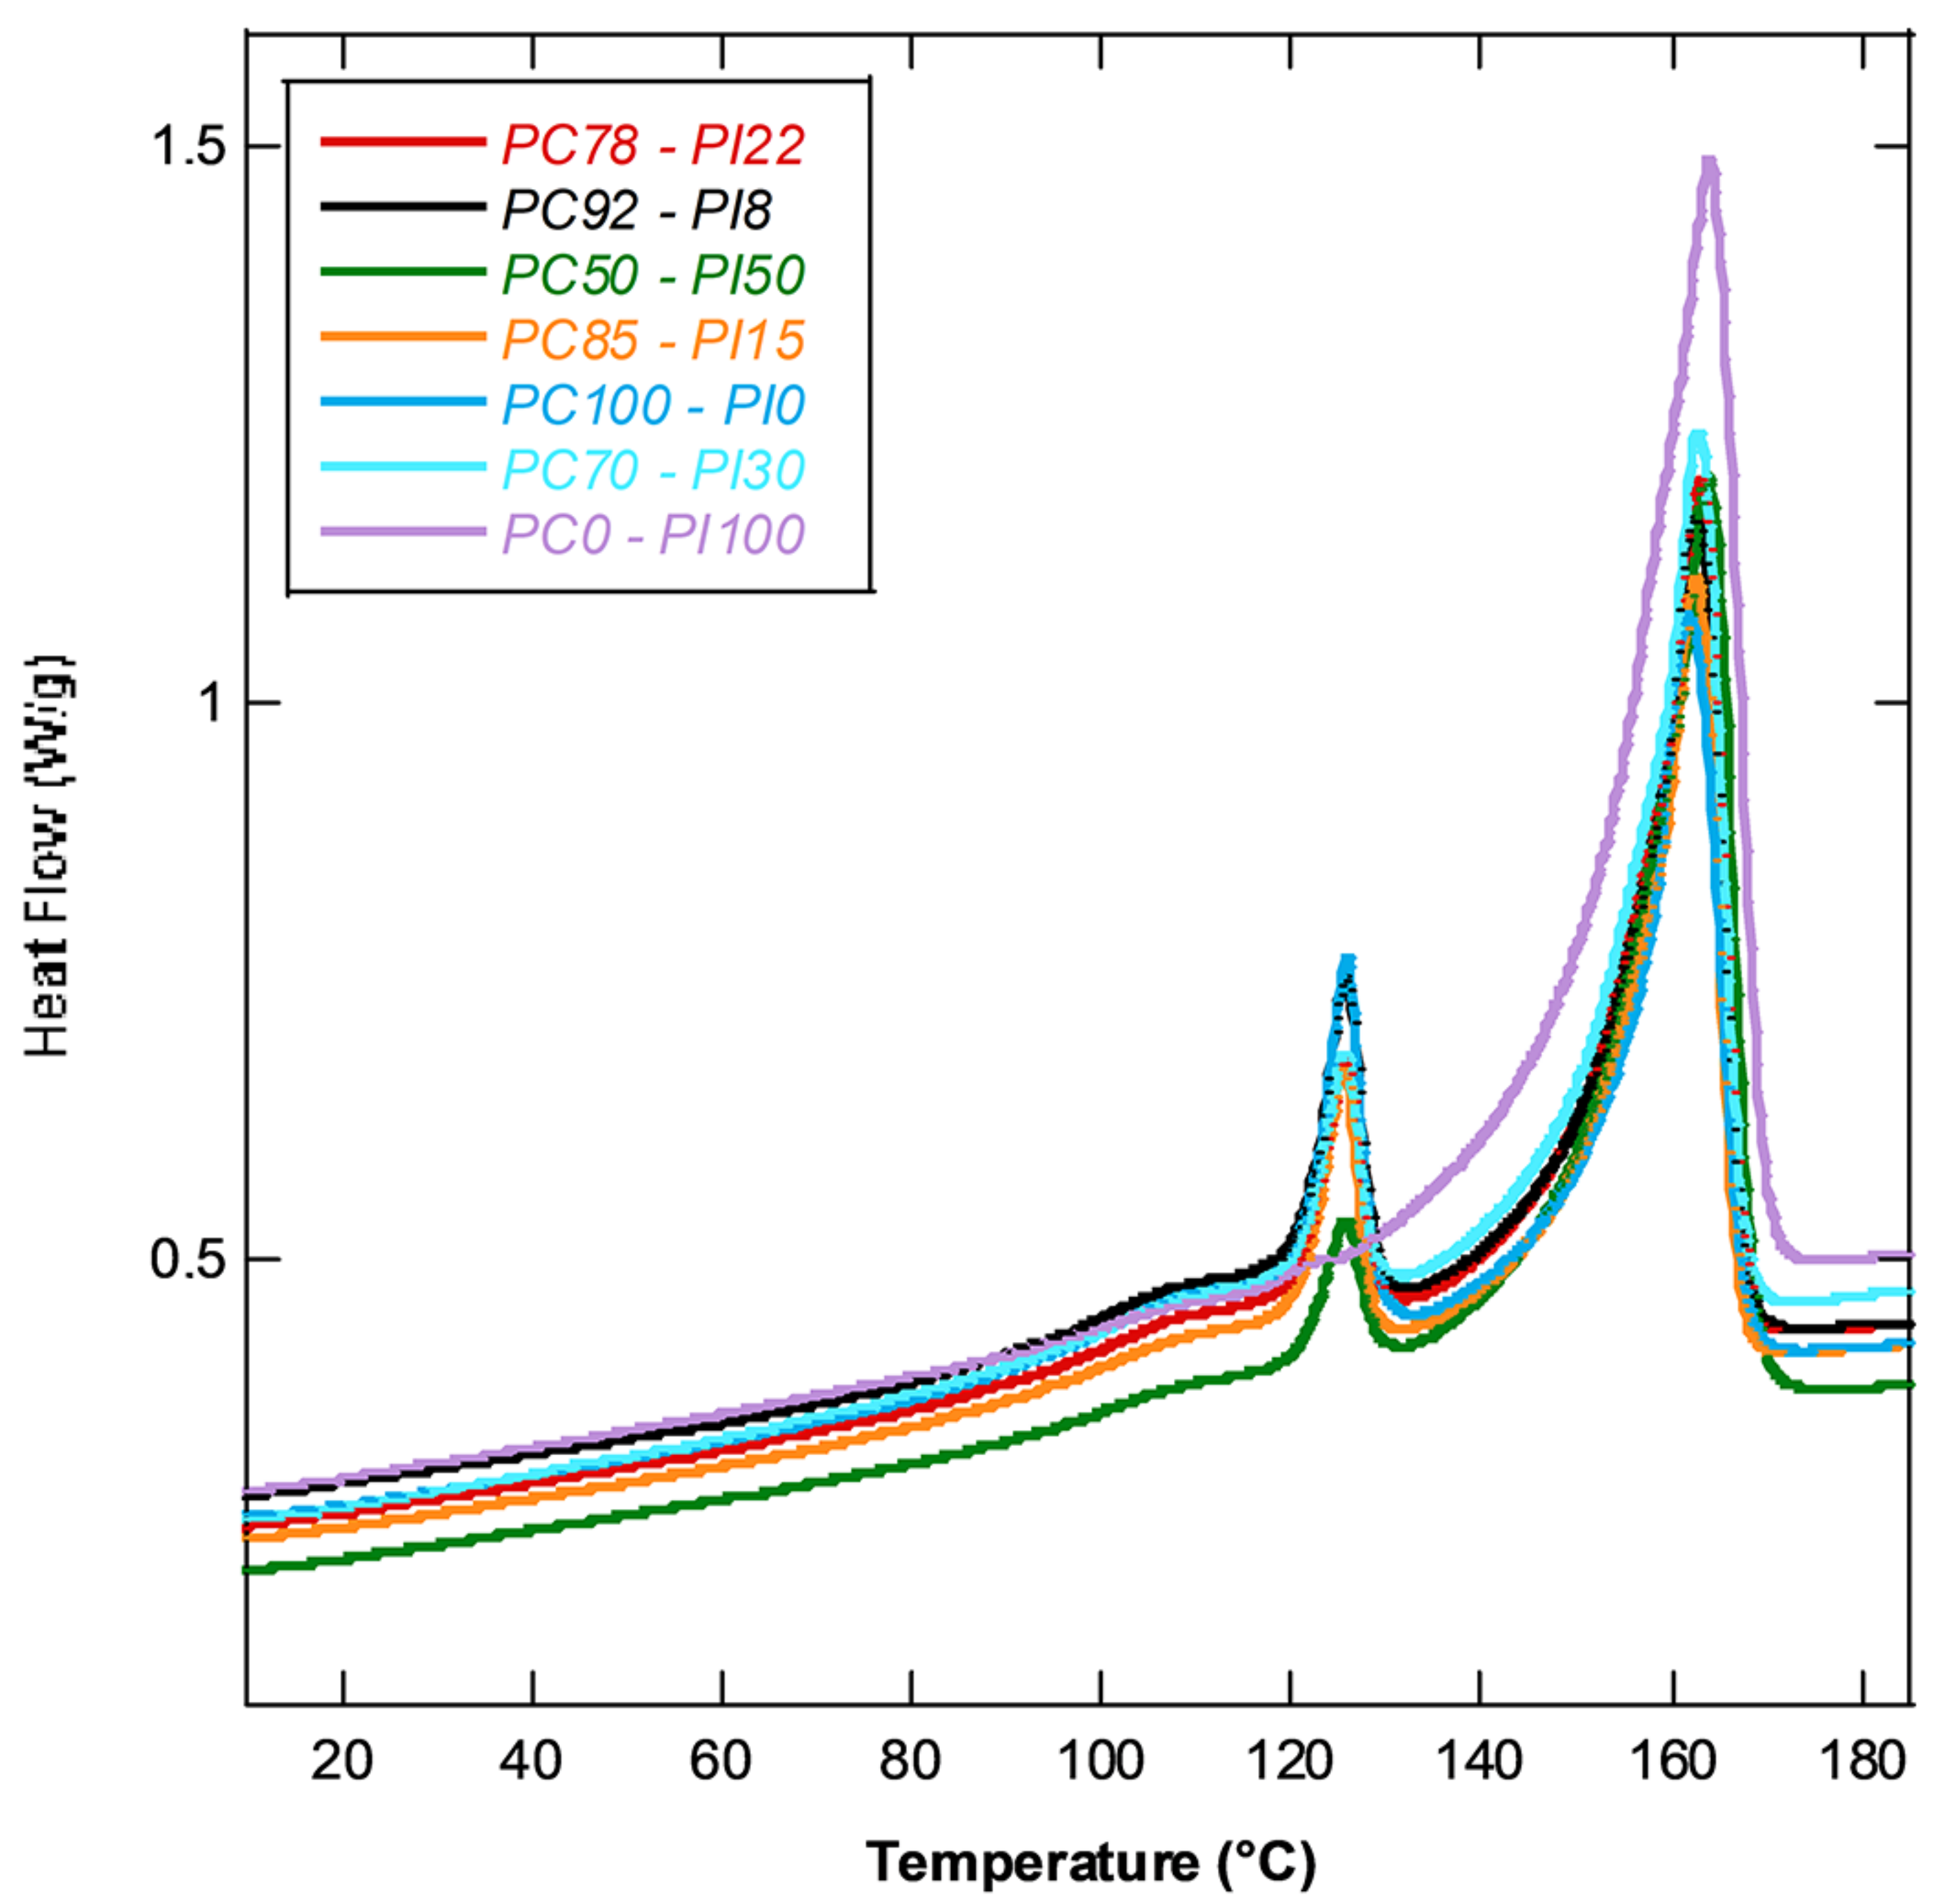
Figure 4 shows thermograms for the first heating phase of all the blends. While it is not impossible to identify a definite temperature trend depending on PC content, there may be a slight increase in PP melting temperature as PI percentage increases, but the described differences are quantitatively in the range of experimental error.
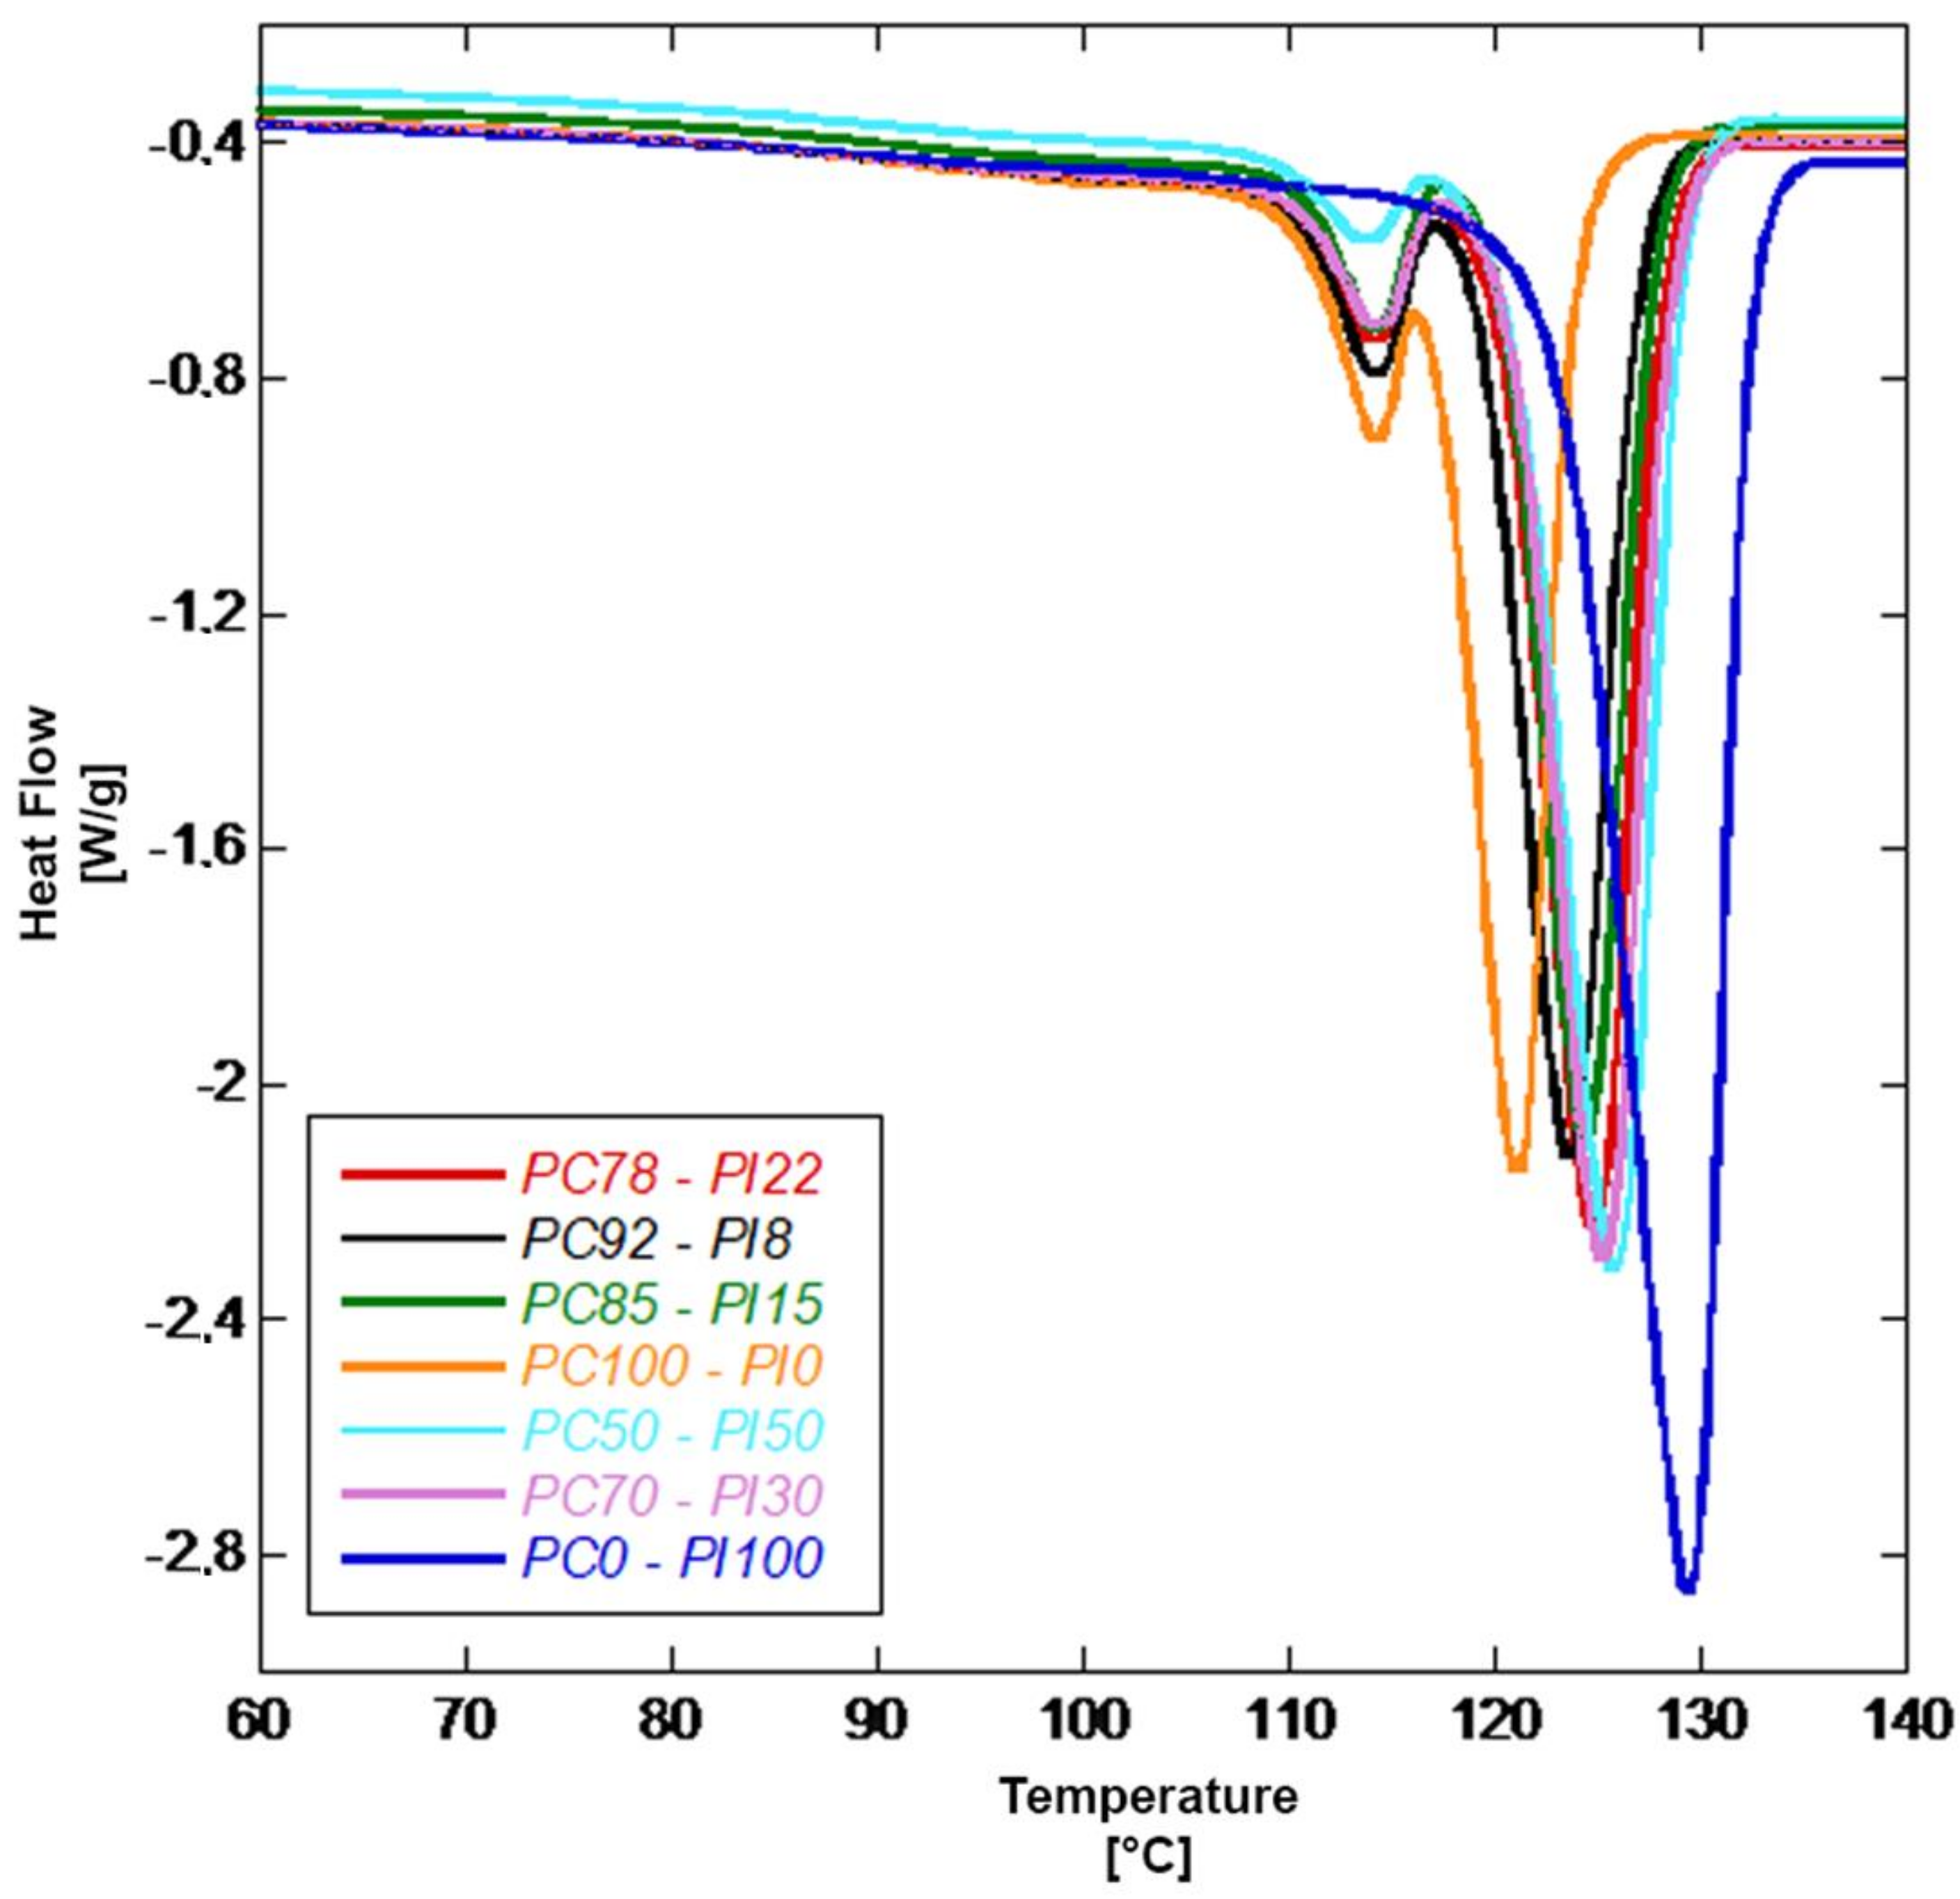
Figure 5 shows thermograms for the cooling phase of all the blends. This graph highlights how the recrystallization temperature relative to the polypropylene phase experiences a sharp increase as the percentage of PC material increases, with a maximum for the PC0-PI100 blend. On the contrary, no differences for the recrystallization temperature of PE-based components were measured. A similar behavior is shown in Aumnate et al. for both PP/LDPE and PP/HDPE blends [
40].
The graph for the second heating phase (
Figure 6) is very similar to the one obtained in the first heating scan, except for the lack of the slight peak around 50 °C, validating the formulated hypothesis: it is probably the result of a molecular, slightly ordered arrangement, or minor phase, induced by the extrusion process, which is completely removed by the first heating treatment (scan).
Table 4 summarizes melting enthalpies for each blend detected in the three scanning phases carried out. Maximum values correspond to pure post-industrial plastic, confirming temperature results shown in the previous graphs.
These values were directly calculated via the Universal Analysis 2000 software, which the measurement apparatus was equipped with. These experimental procedures, together with the TGA measurements, were carried out with the aim to identify the main polymers included in the blend, as well as the related inert additives, and also to provide a process framework in terms of temperatures for potential industrial end-users. Through the DSC analysis, the lower temperature threshold where compound melting occurs was measured, while through the TGA analysis, the higher limit was obtained, to indicate the processing conditions that would prevent any significant degradation phenomena in the investigated material.
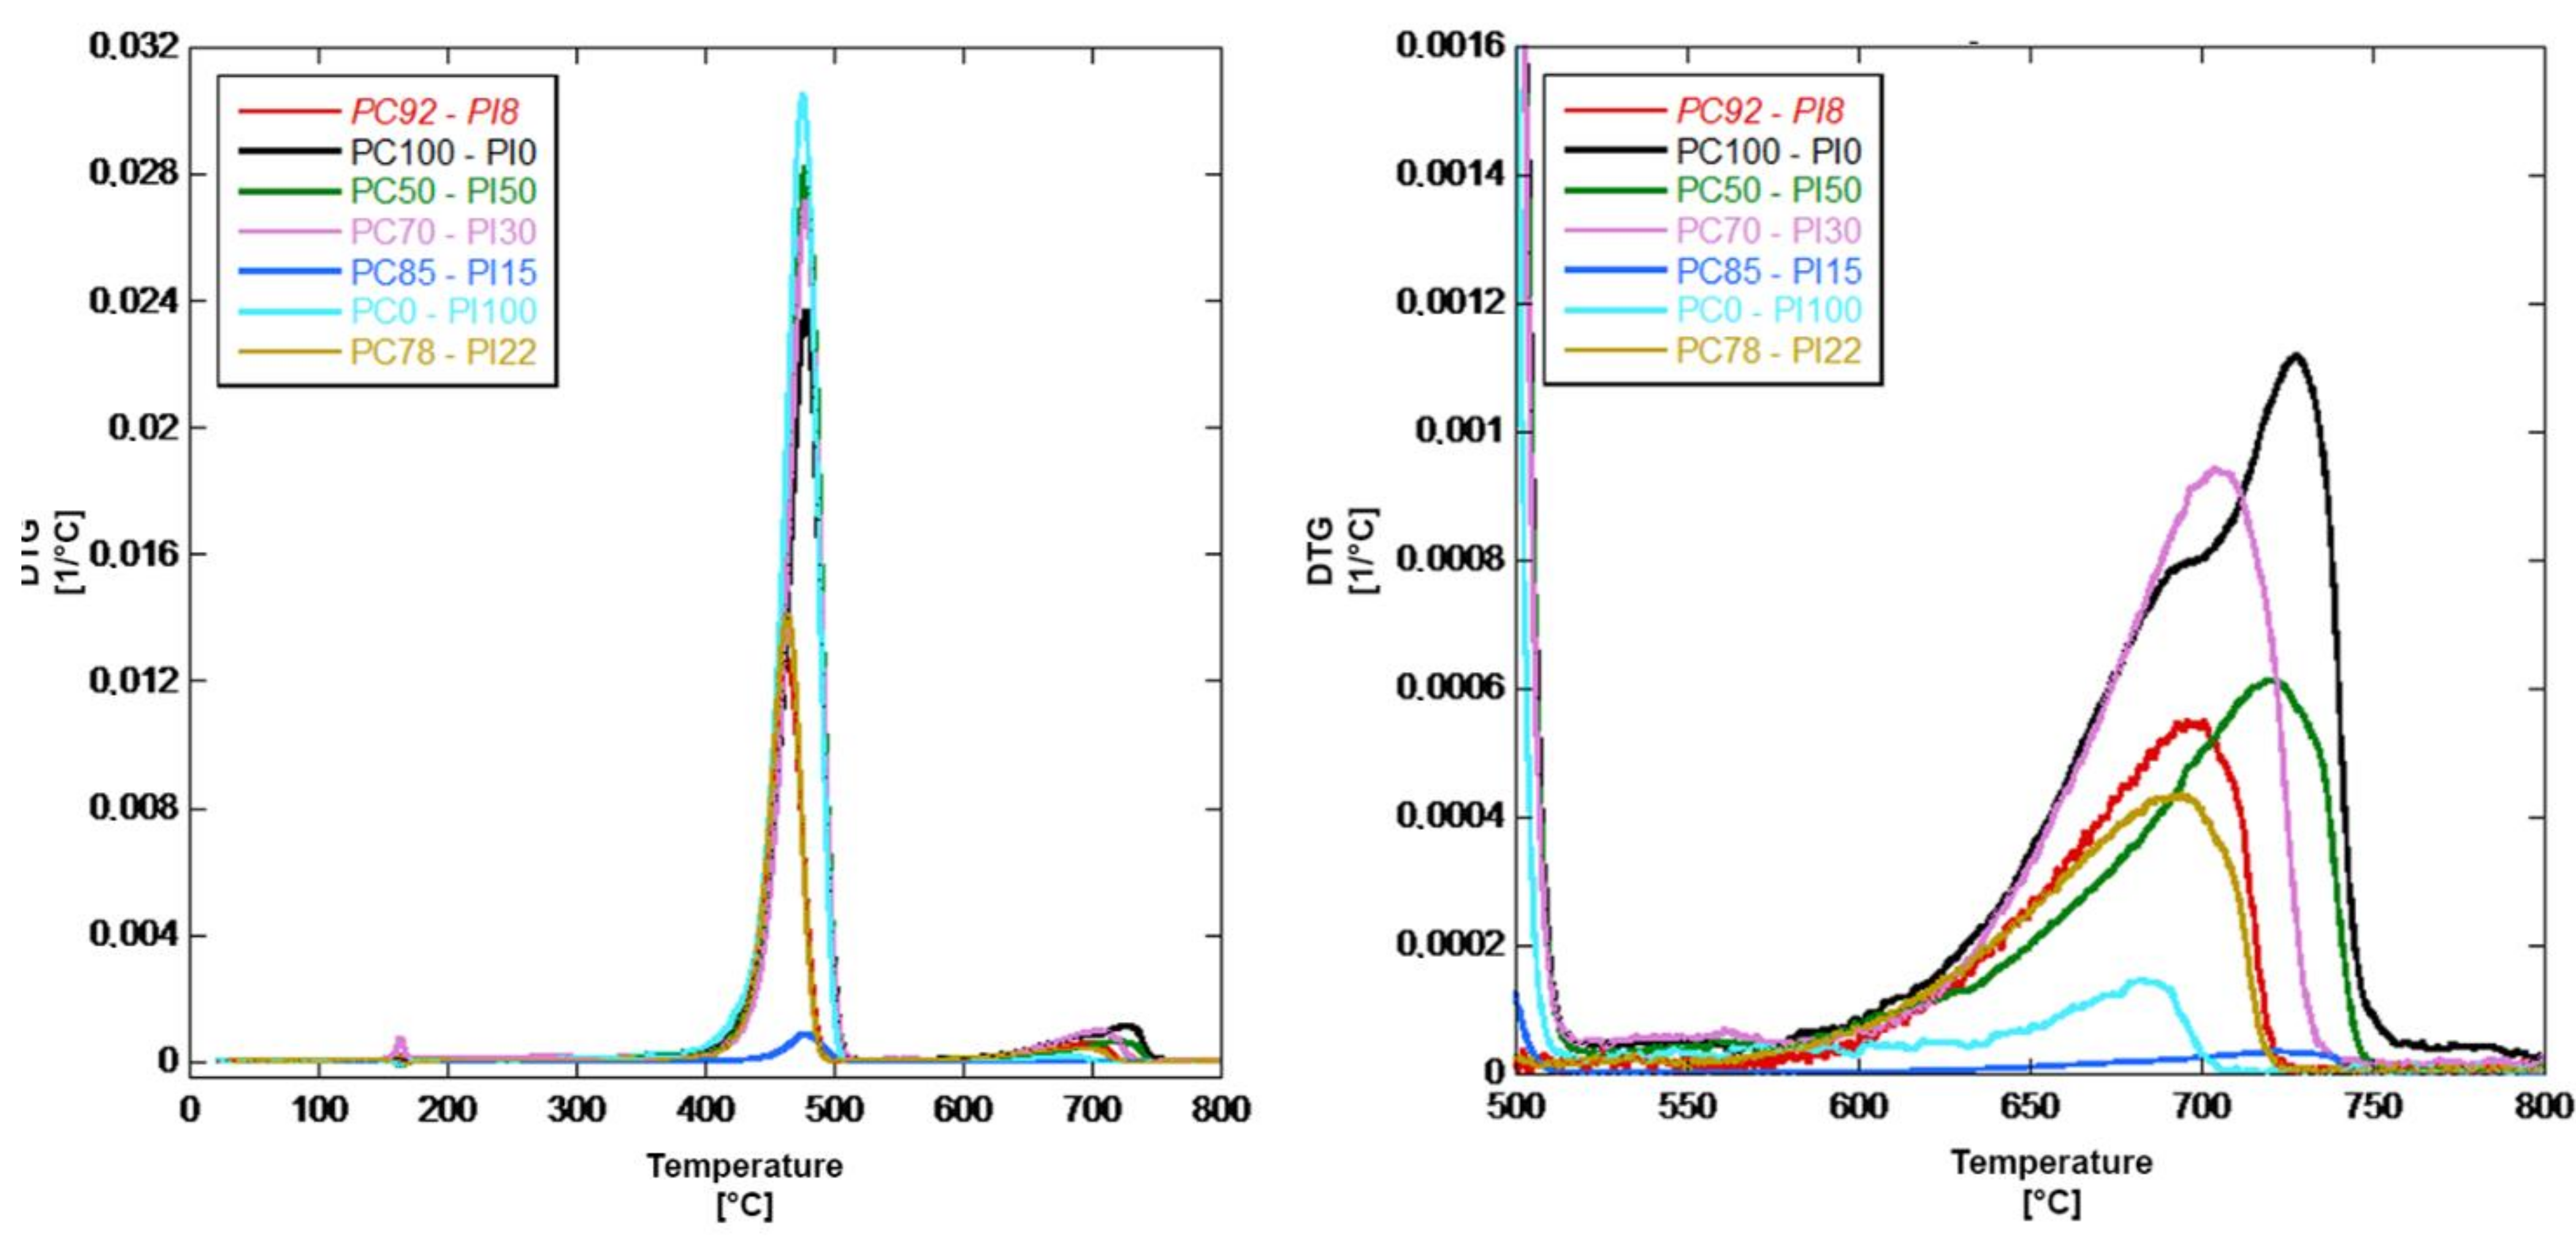
As for DTG analysis,
Figure 7 shows the trend for all the blends, highlighting an interesting phenomenon around 160 °C; the analysis identified a sudden and unexpected weight loss followed by a quick weight gain to almost the starting values. Such a phenomenon was particularly marked for PC70-PI30 and could be observed for each blend, whereas it did not occur for PC0-PI100. This was possibly due to some unidentified compound, contained in small quantities in random samples of PC plastic, whose thermal degradation led to the formation of gasses that almost immediately or quickly evolved outside of the plastic matrix, causing the crucible to vibrate and shake together with its content, temporarily perturbing the measure.
It is evident from
Figure 7 that there were two distinct degradation mechanisms, the main one ending around at 500 °C, and the second occurring in the temperature range between 650 and 750 °C. The first mechanism involved the degradation of polyolefins (PP and PE) found in the blends and exhibiting similar degradation behaviors. The second mechanism was instead related to a large amount of inclusions, such as carbon black in very small quantities for PC0-PI100, or calcium carbonate, dyes and inert components for PC plastics. The figure also shows a detail of this degradation mechanism, highlighting how there were actually two degradation rates that may be associated with different inclusion families.
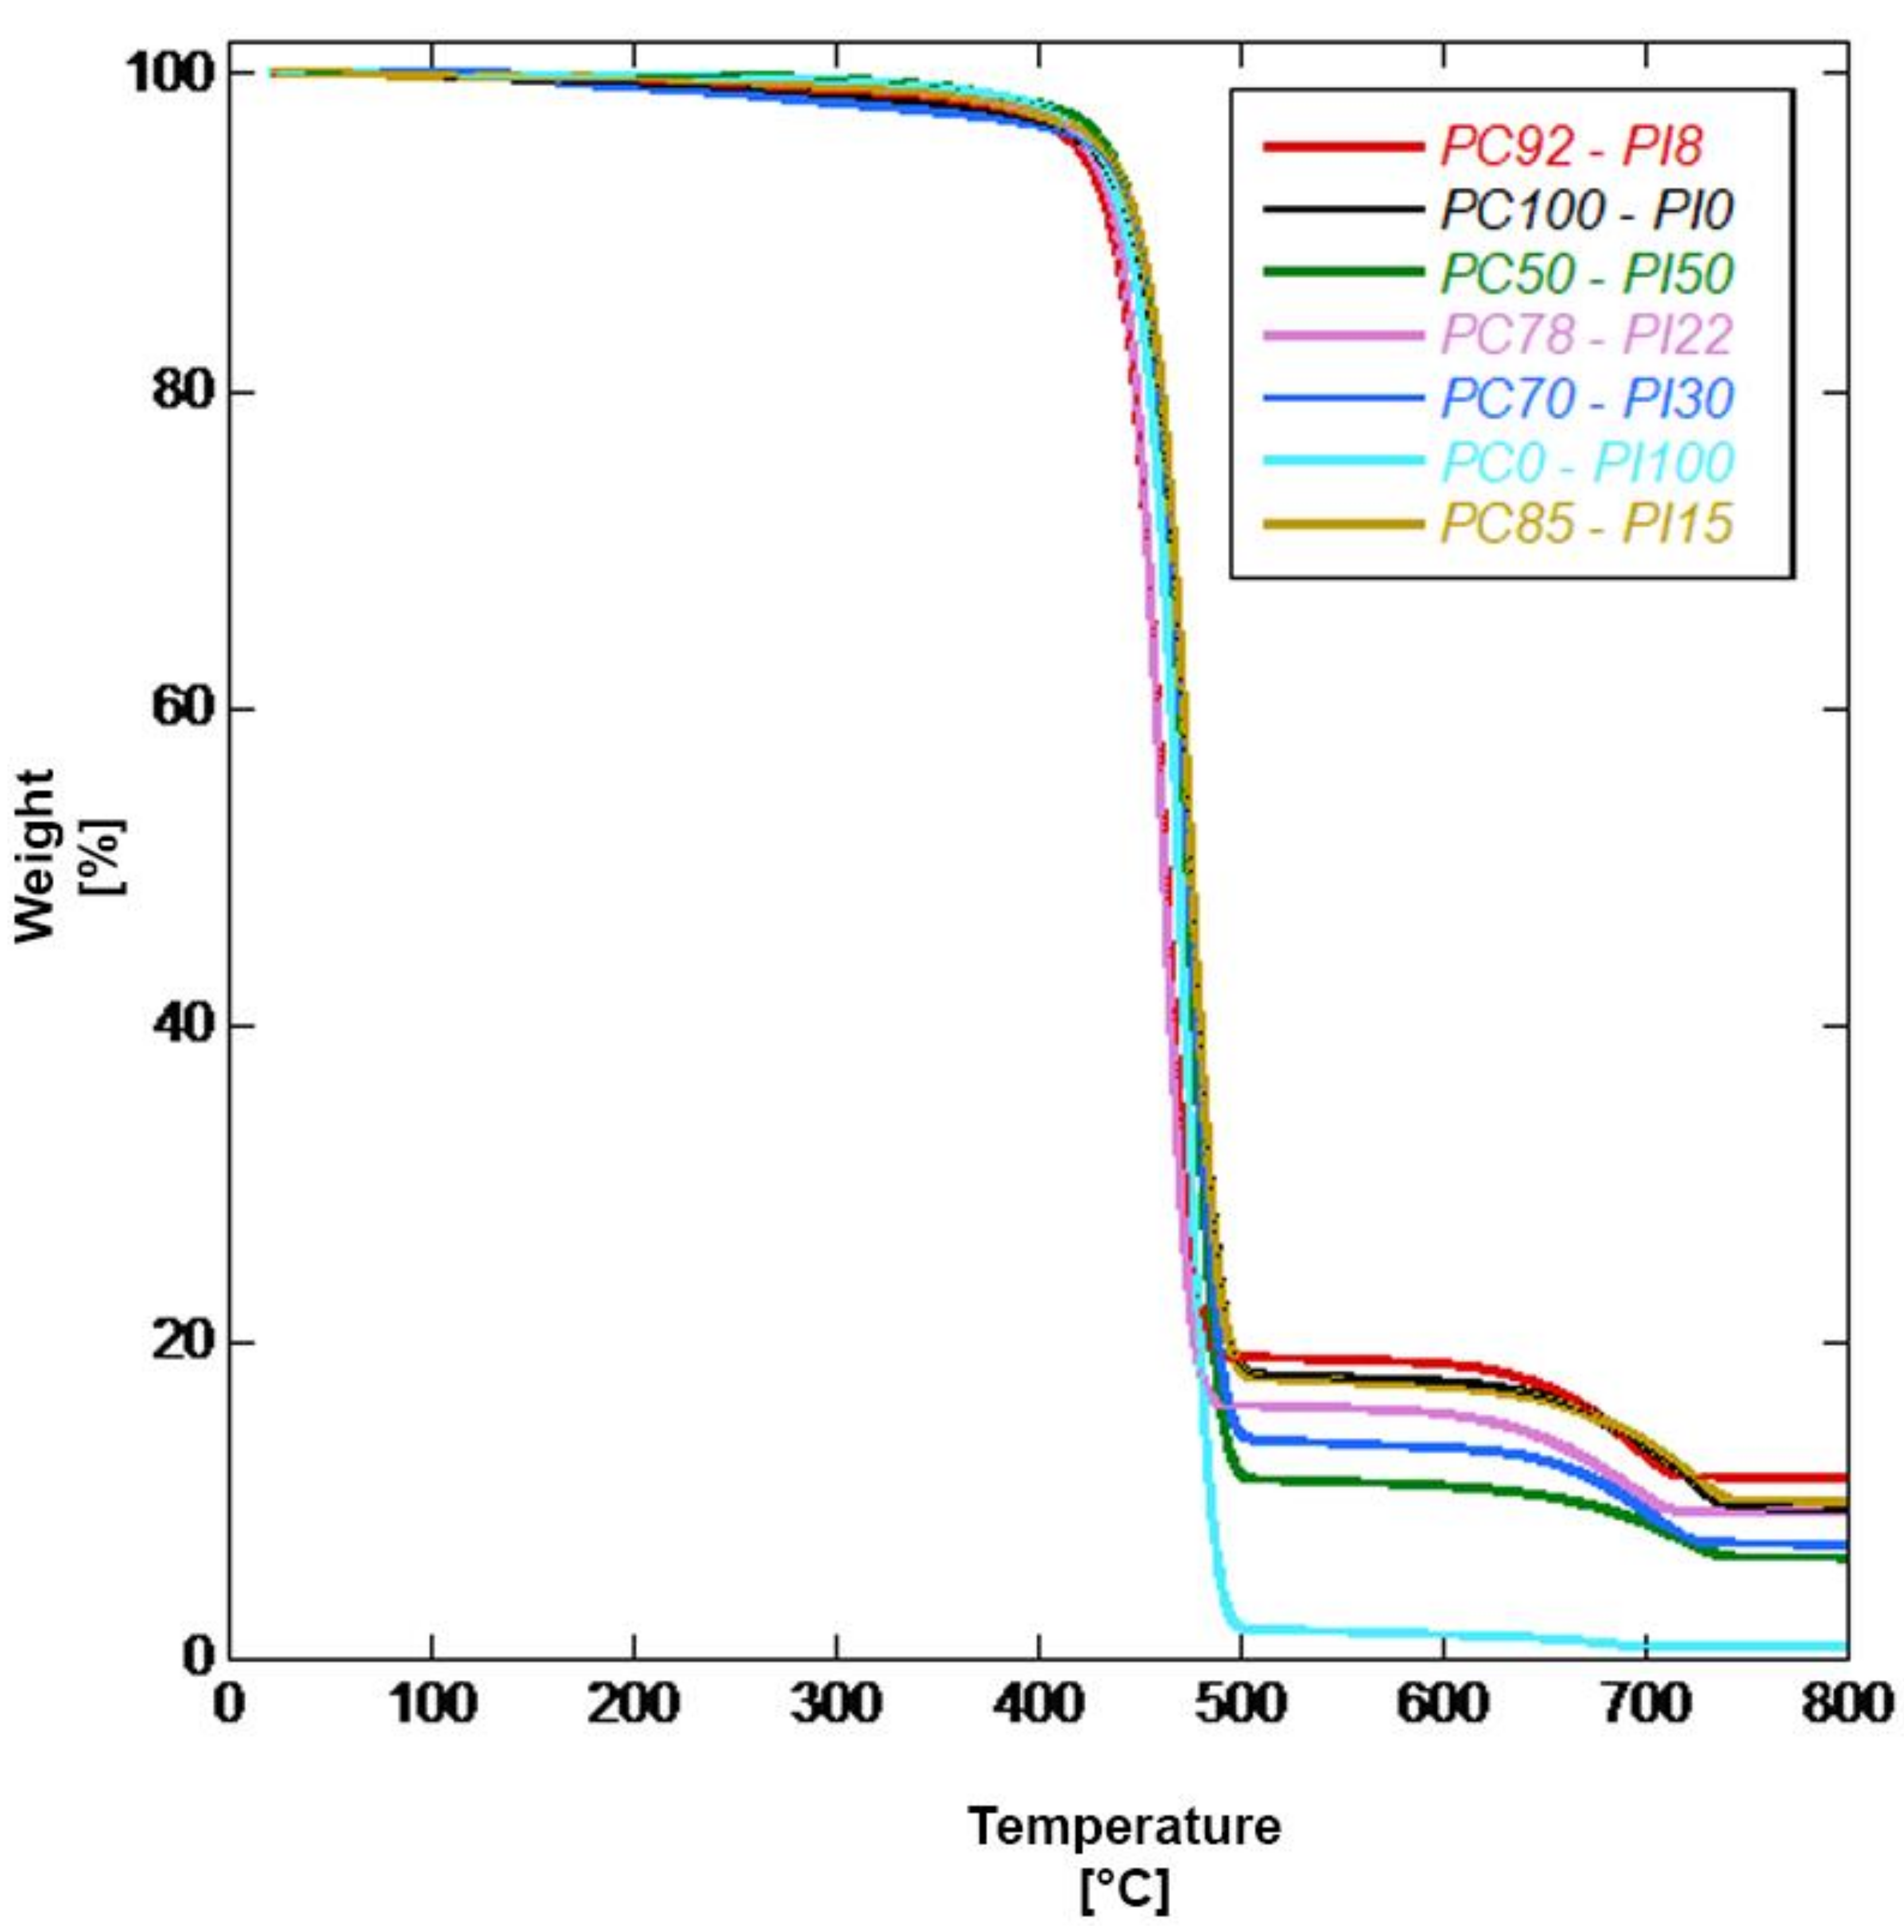
Figure 8 shows the trend of weight loss versus temperature. It shows that no degradation effects occurred below a temperature of 400 °C. Beyond this threshold, a significant weight loss occurred between the range of the mentioned lower limit and about 500 °C, accordingly to the framework depicted by the diagram in
Figure 7.
No further weight losses occurred up to a temperature of about 645 °C, while between this temperature and 715 °C, another degradation reaction occurred, which was attributed to the fillers included in the investigated systems. It is also evident that the amount of residues grew as PC content increased, going from less than 1% for PC0-PI100 to 11% for PC92-PI8, similarly to the system based on the pure PC.
As previously noted, other than information on the polymers and fillers included in the investigated compounds, these analyses could also suggest a process frame for future industrialization. About this, the processing temperature, both in the compounding stage and the injection molding stage, could be chosen within the range from 190 °C to 360 °C, with the aim of obtaining the best compromise between material performance or quality and productivity. The extreme values of the temperature range have to be avoided: the upper limit to prevent degradation induced by shear stresses induced by additional heating, and the lower one to optimize the material flowing ability.
3.2. Melt Index Tests
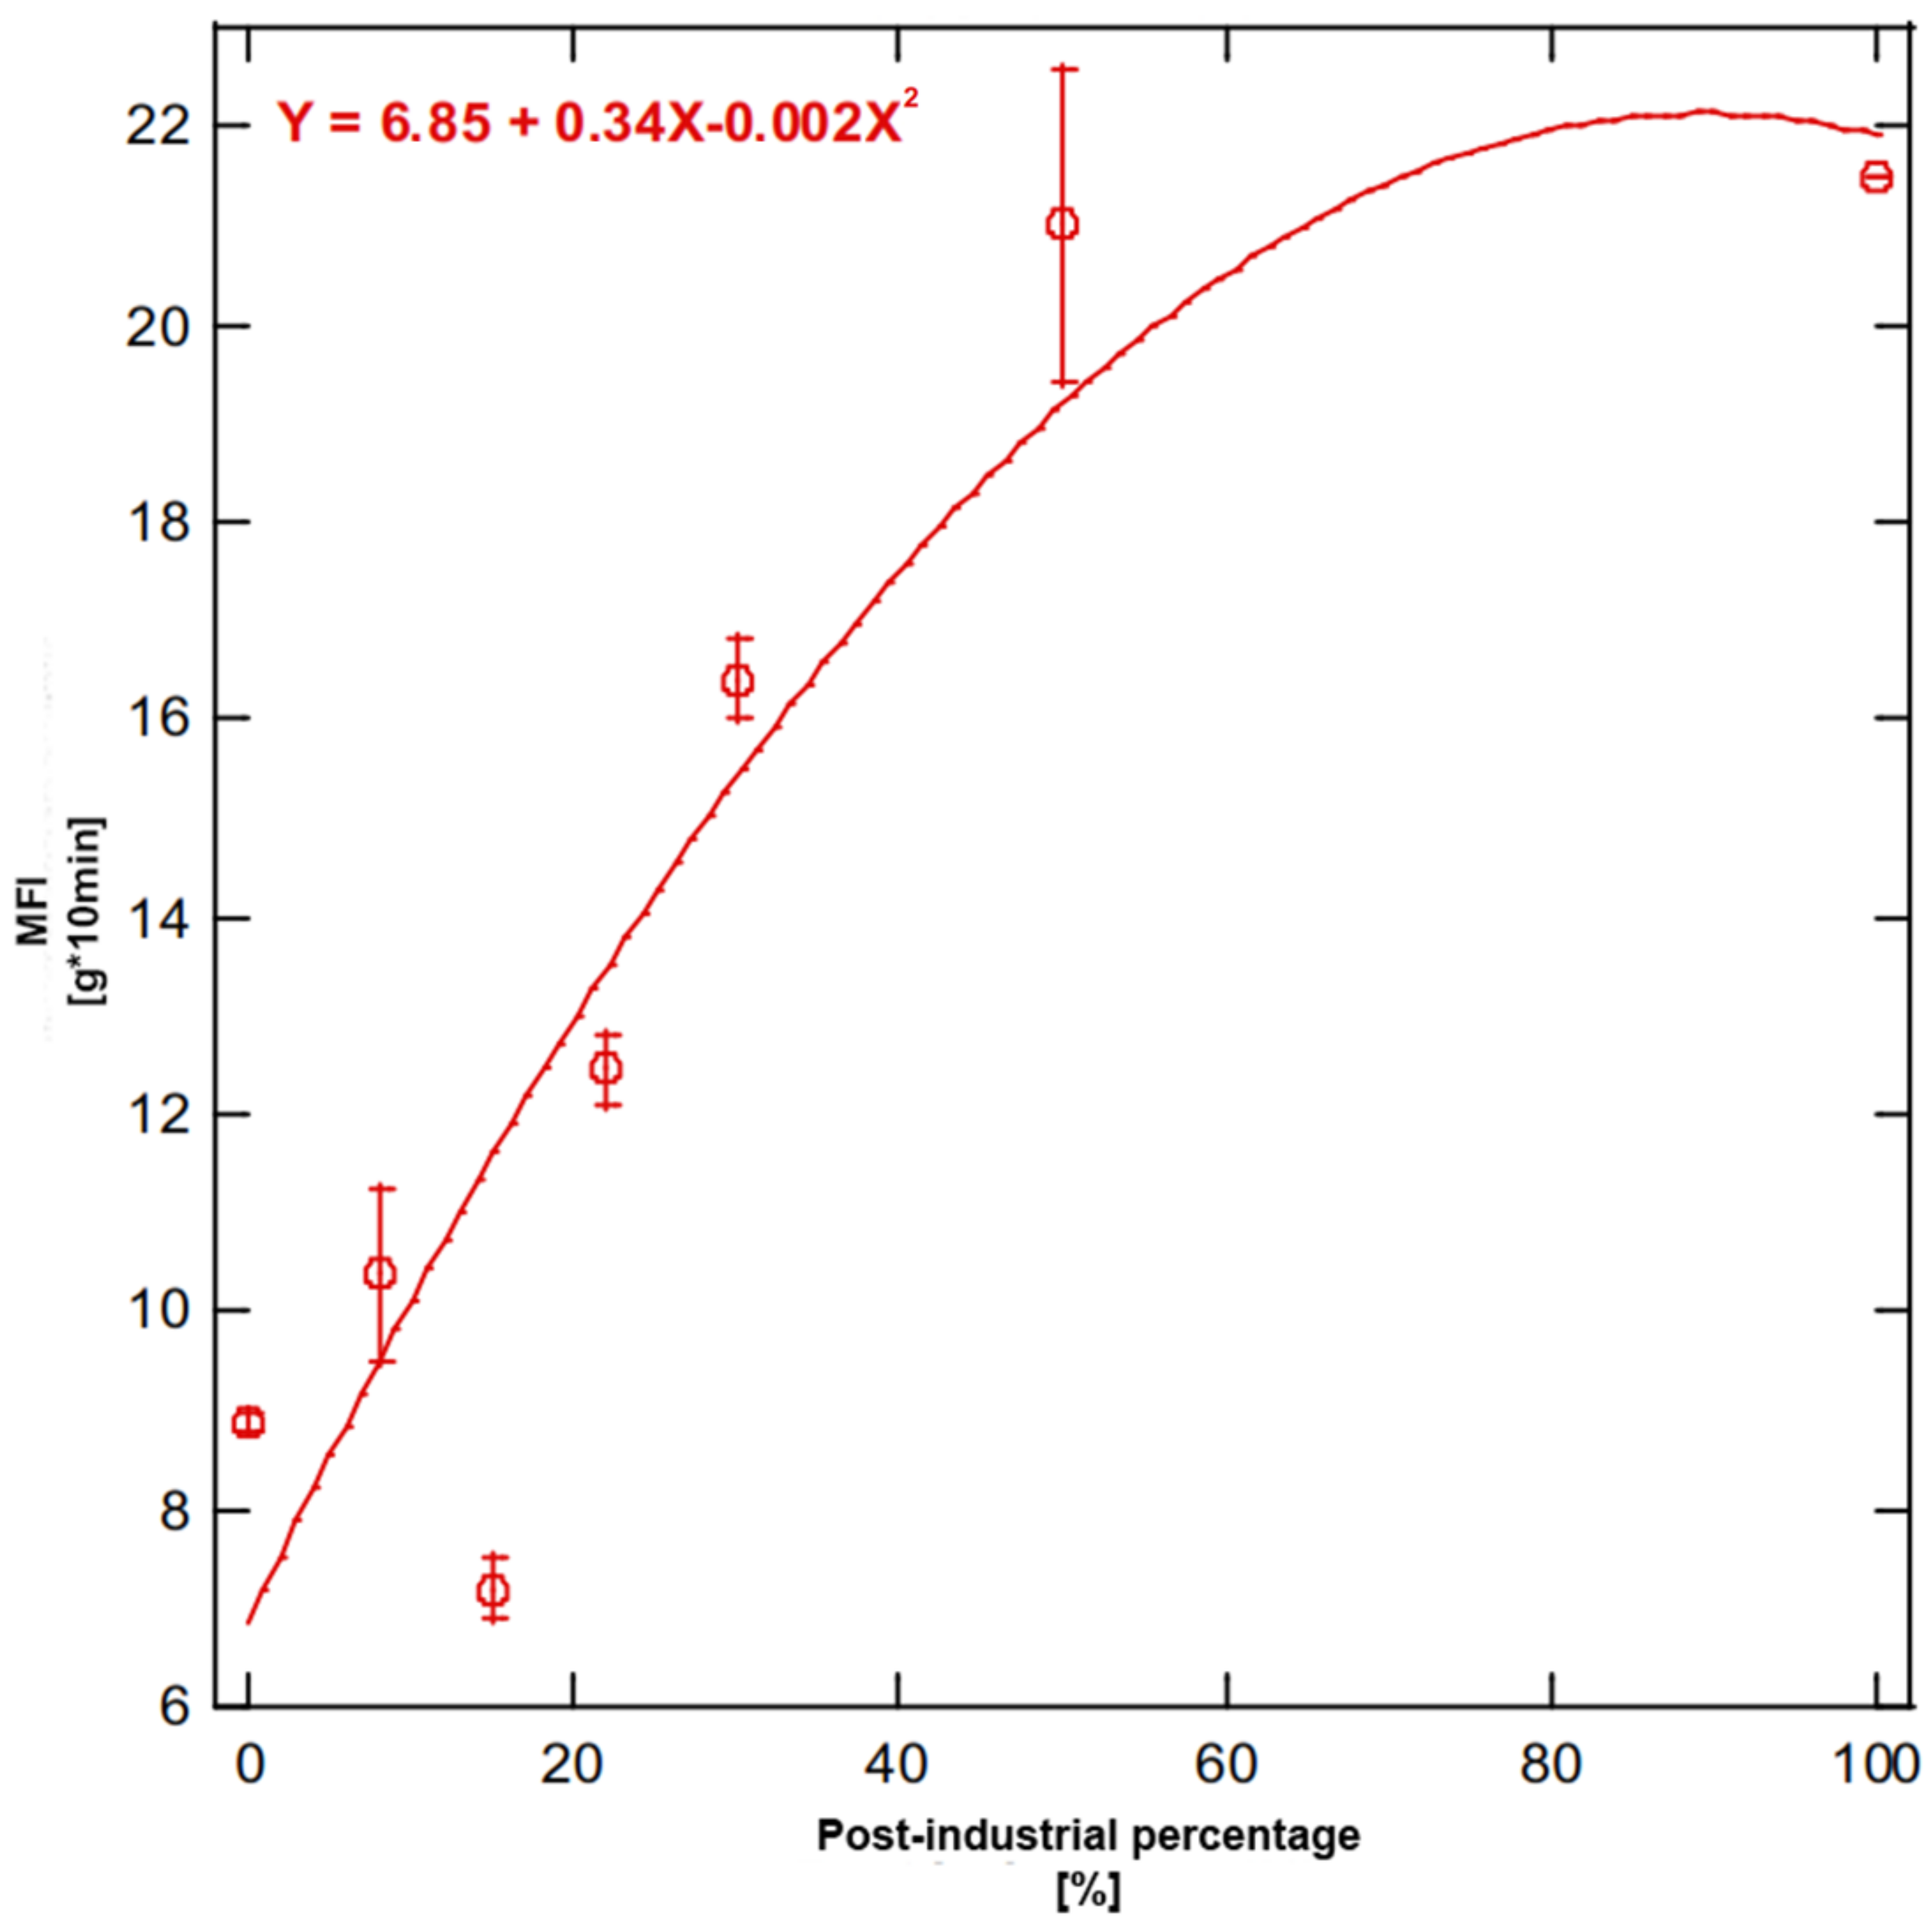
Figure 9 shows results for the melt index tests and highlights how this value is very low for blends characterized by a high percentage of PC, with a minimum for the PC85-PI15 blend. Low values for blends completely or mostly made of PC can partially be attributed to the presence of HDPE as contaminant and partially due to the predominance of relatively long-chain co-polymers. The highest value was obtained for the PC0-PI100 blend (21.5 ± 0.01 g/10 min), which was quite close to the result for PC50-PI50 (21.00 ± 1.60 g/10 min). As evidenced by these results, melt flow index increased as the percentage of PI PP increased, although the obtained trend was not linear. The MFI value roughly increased as the PI percentage increased up to 50% in weight; with higher PI content, a constant value was obtained for MFI, although some deviation from the expected behavior occurred as the blend containing 18% in weight of PI was unexpectedly characterized by the lowest value of MFI. As this blend was the result of material collected from a different batch in comparison to the one used for the first five blends, these results could have been affected by a less homogeneous composition and, consequently, by the presence of a higher amount of inert materials, fillers and inclusions. This behavior is quite common in low performance or general purpose hard plastic materials and is also in line with previous literature focused on recycled PC polyolefins, where the likely traces of other polymers with a higher liquefaction temperature can obstruct the capillary [
41]. Moreover, MFI values for PC polyolefins were lower than values for plastic packaging recycled polyolefins found in the literature; this may have been due to lower requirements in originating items, as bulkier objects require lower melting capabilities during molding, or to a prevalence of blow molded objects.
In general, the MFI of the blend proportionally increased with the amount of PI, as the latter was characterized by a lower viscosity.
It can be hypothesized that when the percentage of PI is lower than 50% the two systems are sufficiently miscible and quite finely dispersed phases are formed, as the rule of mixture is approximately matched. This is a proportional rule, which states that when two substances are mixed, the property of the mixture is a ratio of the properties of each substance, weighted by the proportion of each substance in the mixture [
42]. This law is given in Equation (1) with
Xi the property and
Vi the volume fraction of the
ith constituent material.
The deviation from the linear behavior for MFI for blends with a higher amount of PI was probably due to the formation of two or more coarse and separate phases, related to each system included in the blend (two different kinds of polyethylene, both HDPE and LDPE, as well as polypropylene).
On the basis of these results, it may be safely claimed that blends with at least 22% in PI PP can be recommended for injection molding. Compared to the same test performed on plastic bottles, there was a substantial inversion of the trend, with lower values for pure PC mixed polyolefin and higher values for pure PI PP. In any case, melt flow index values were generally much higher for hard plastic, which is generally injection molded, than for bottle plastics, which are usually subjected to blow molding processes [
28].
3.3. Mechanical Tests
Three types of mechanical tests were carried out: tensile, impact and Shore hardness test.
Table S1 in
Supplementary Materials reports values for tensile properties.
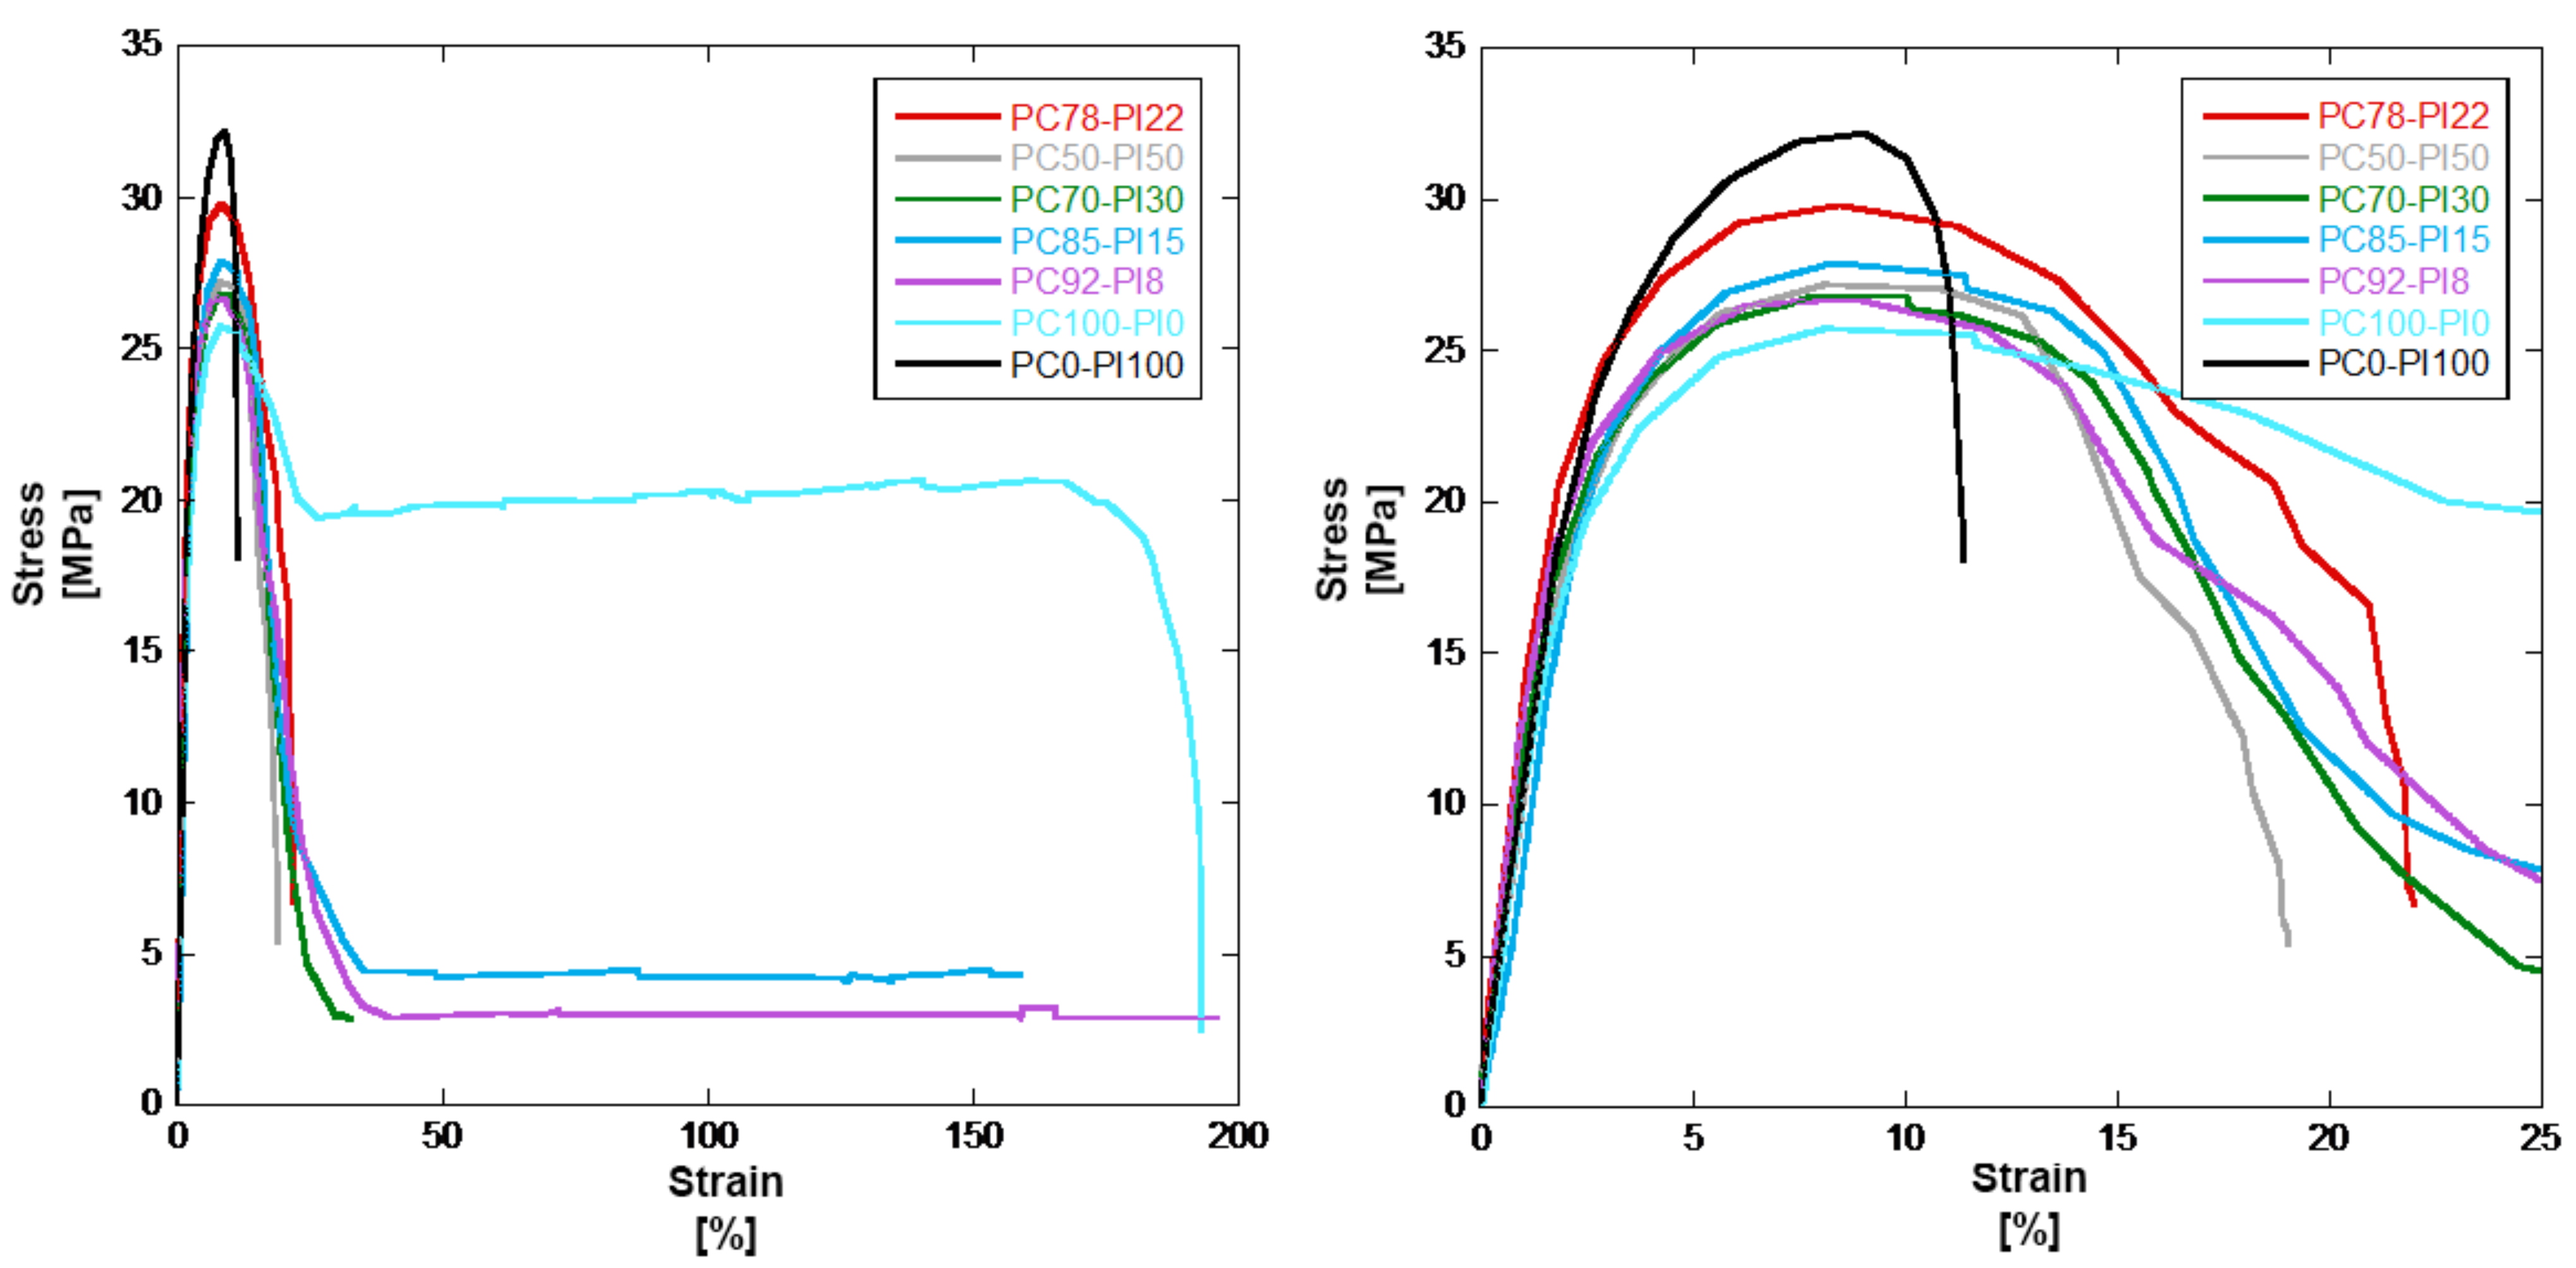
Figure 10 shows the averaged results of the ensile tests. From the graphs it is evident that post-consumer material showed a clear plastic deformation pattern. The average value of strain at break ε
br was 140 ± 90%, and the experienced high standard deviation depended on the fact that samples for PC100-PI0 behaved in very different ways, some breaking at low strain and some at high strain levels, probably due to an incomplete homogenization of polypropylene types even after the whole processing stage of extrusion and injection molding.
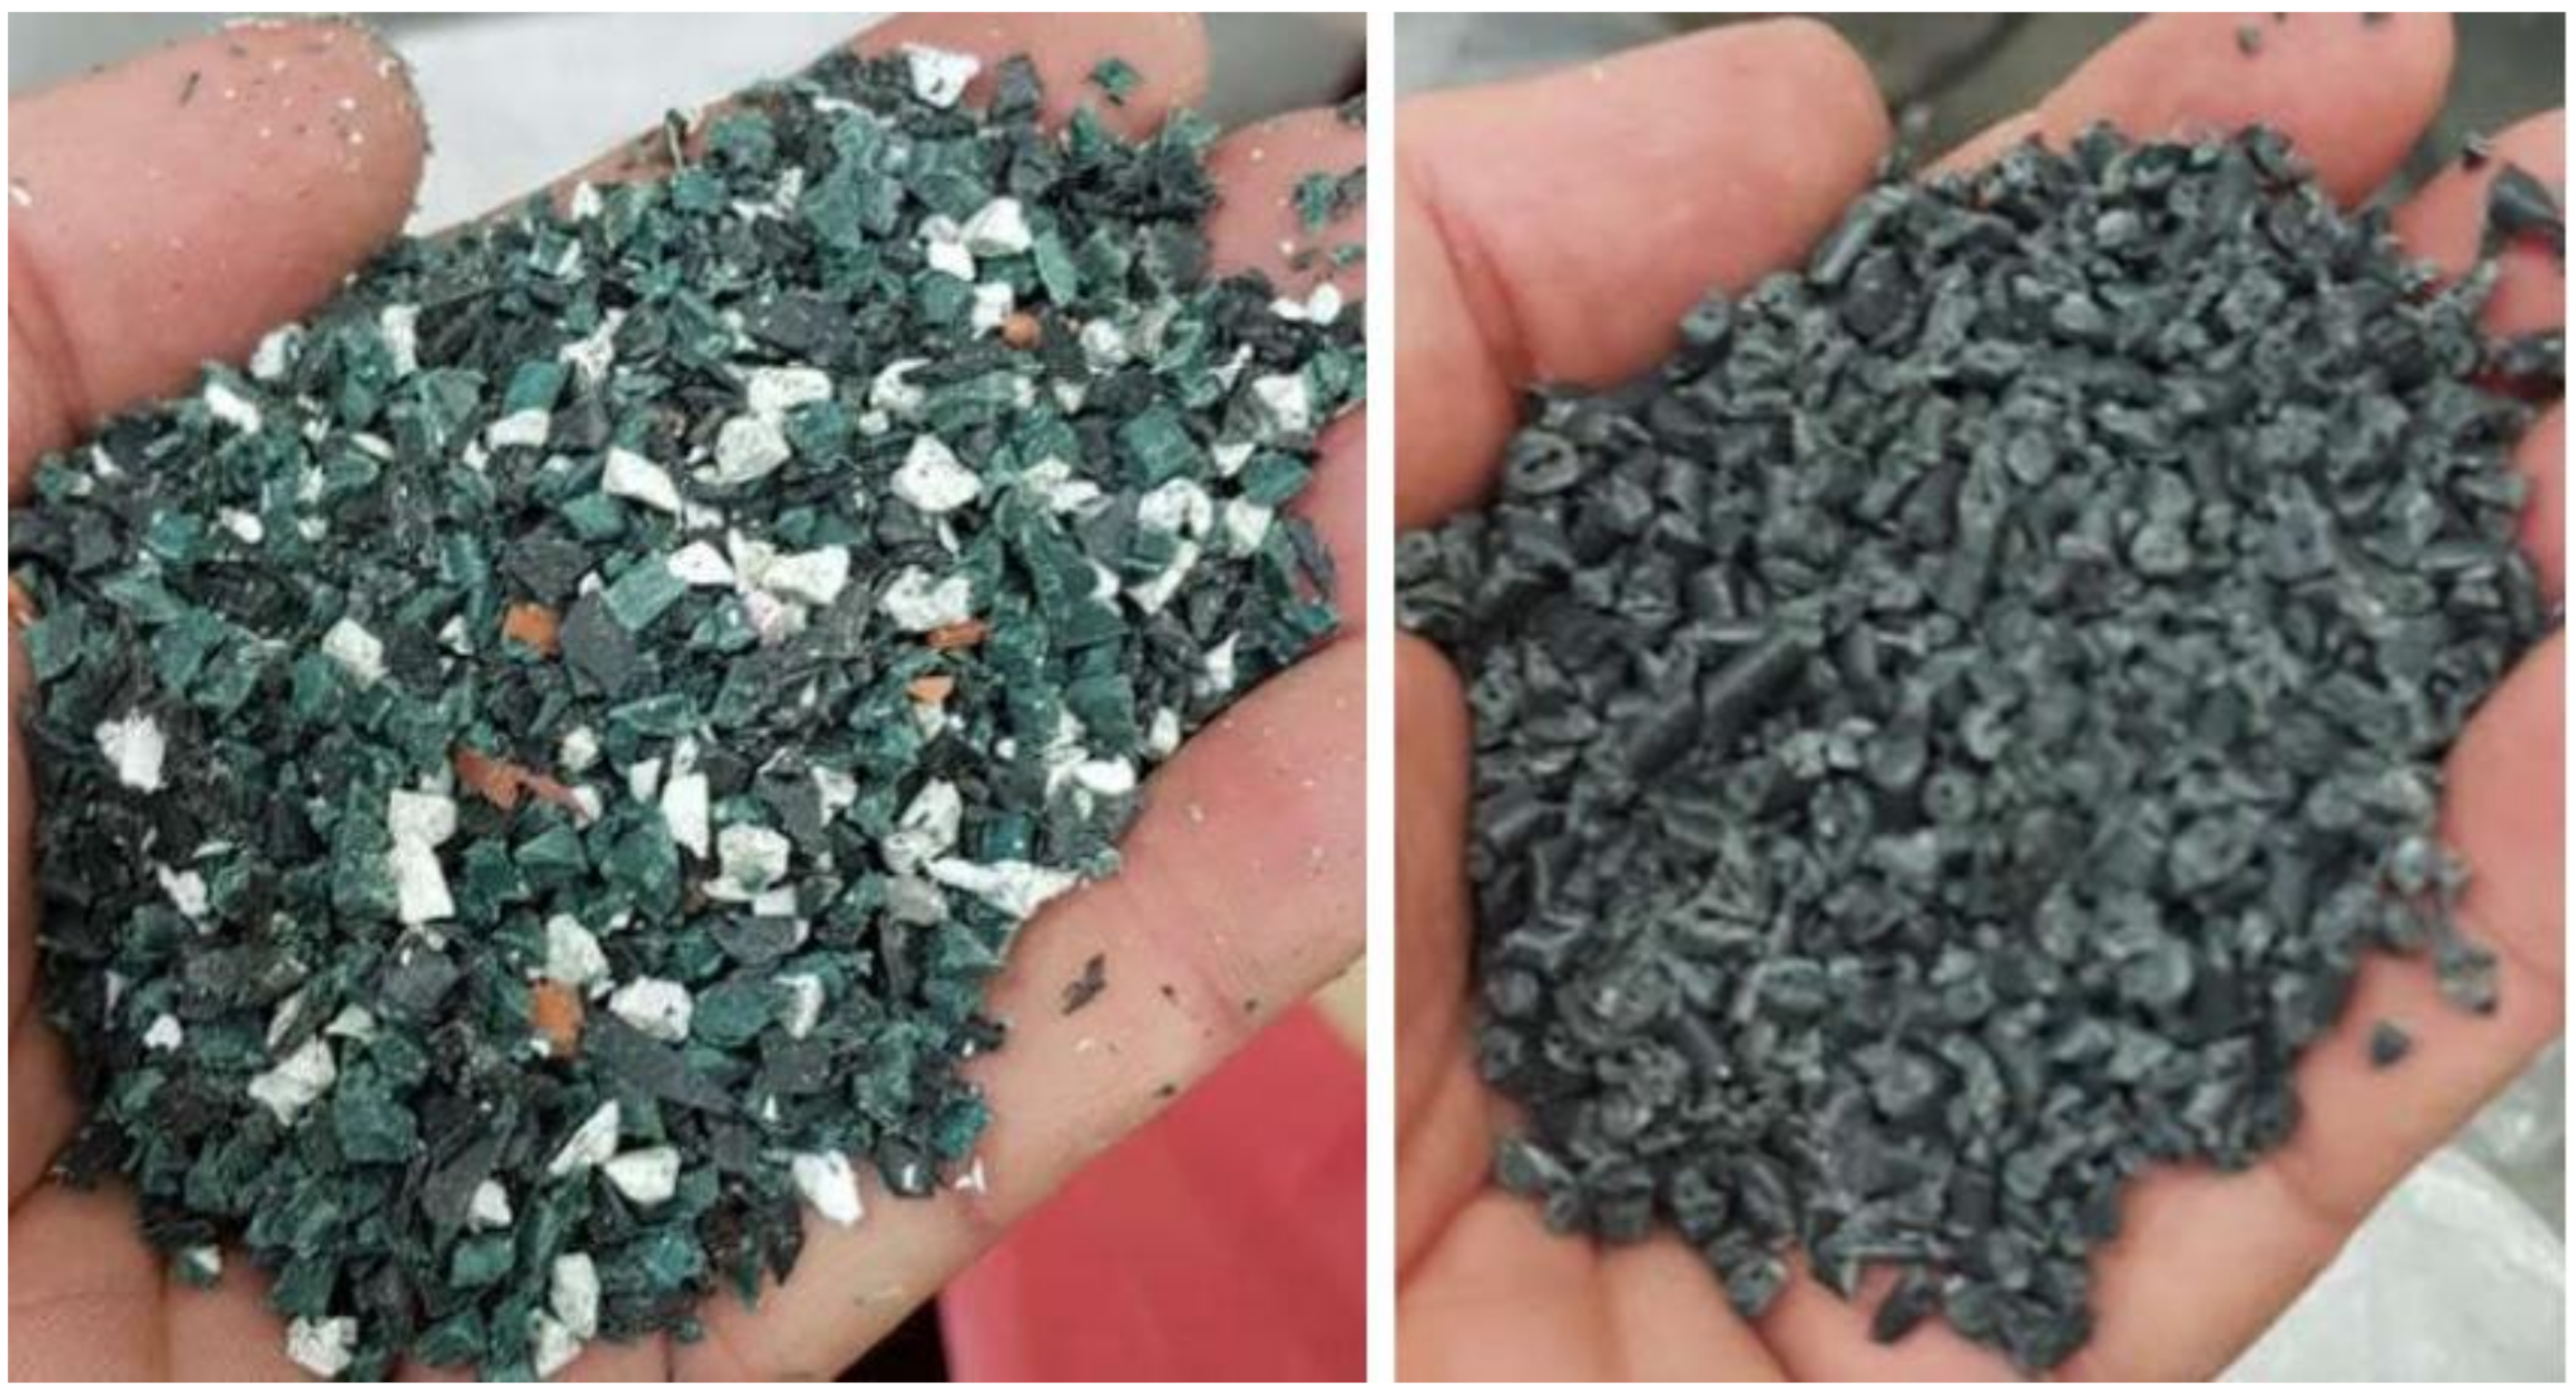
Figure 1 (left side) shows different colors for the starting material, thus different sources and reasonably a different composition. A similarly large standard deviation was reported for PC plastic with non-homogenous, mixed polyolefin composition, underlining the high variability of this type of sample [
14]. There was a marked reduction in the plastic strain in blends containing post-industrial plastic, up to a complete lack of this plastic feature, as in the system PC0-PI100. A similar, although less marked, behavior was reported for PP/LDPE and PP/HDPE blends, where maximum strain and plastic behavior increased as PP content decreased [
40].
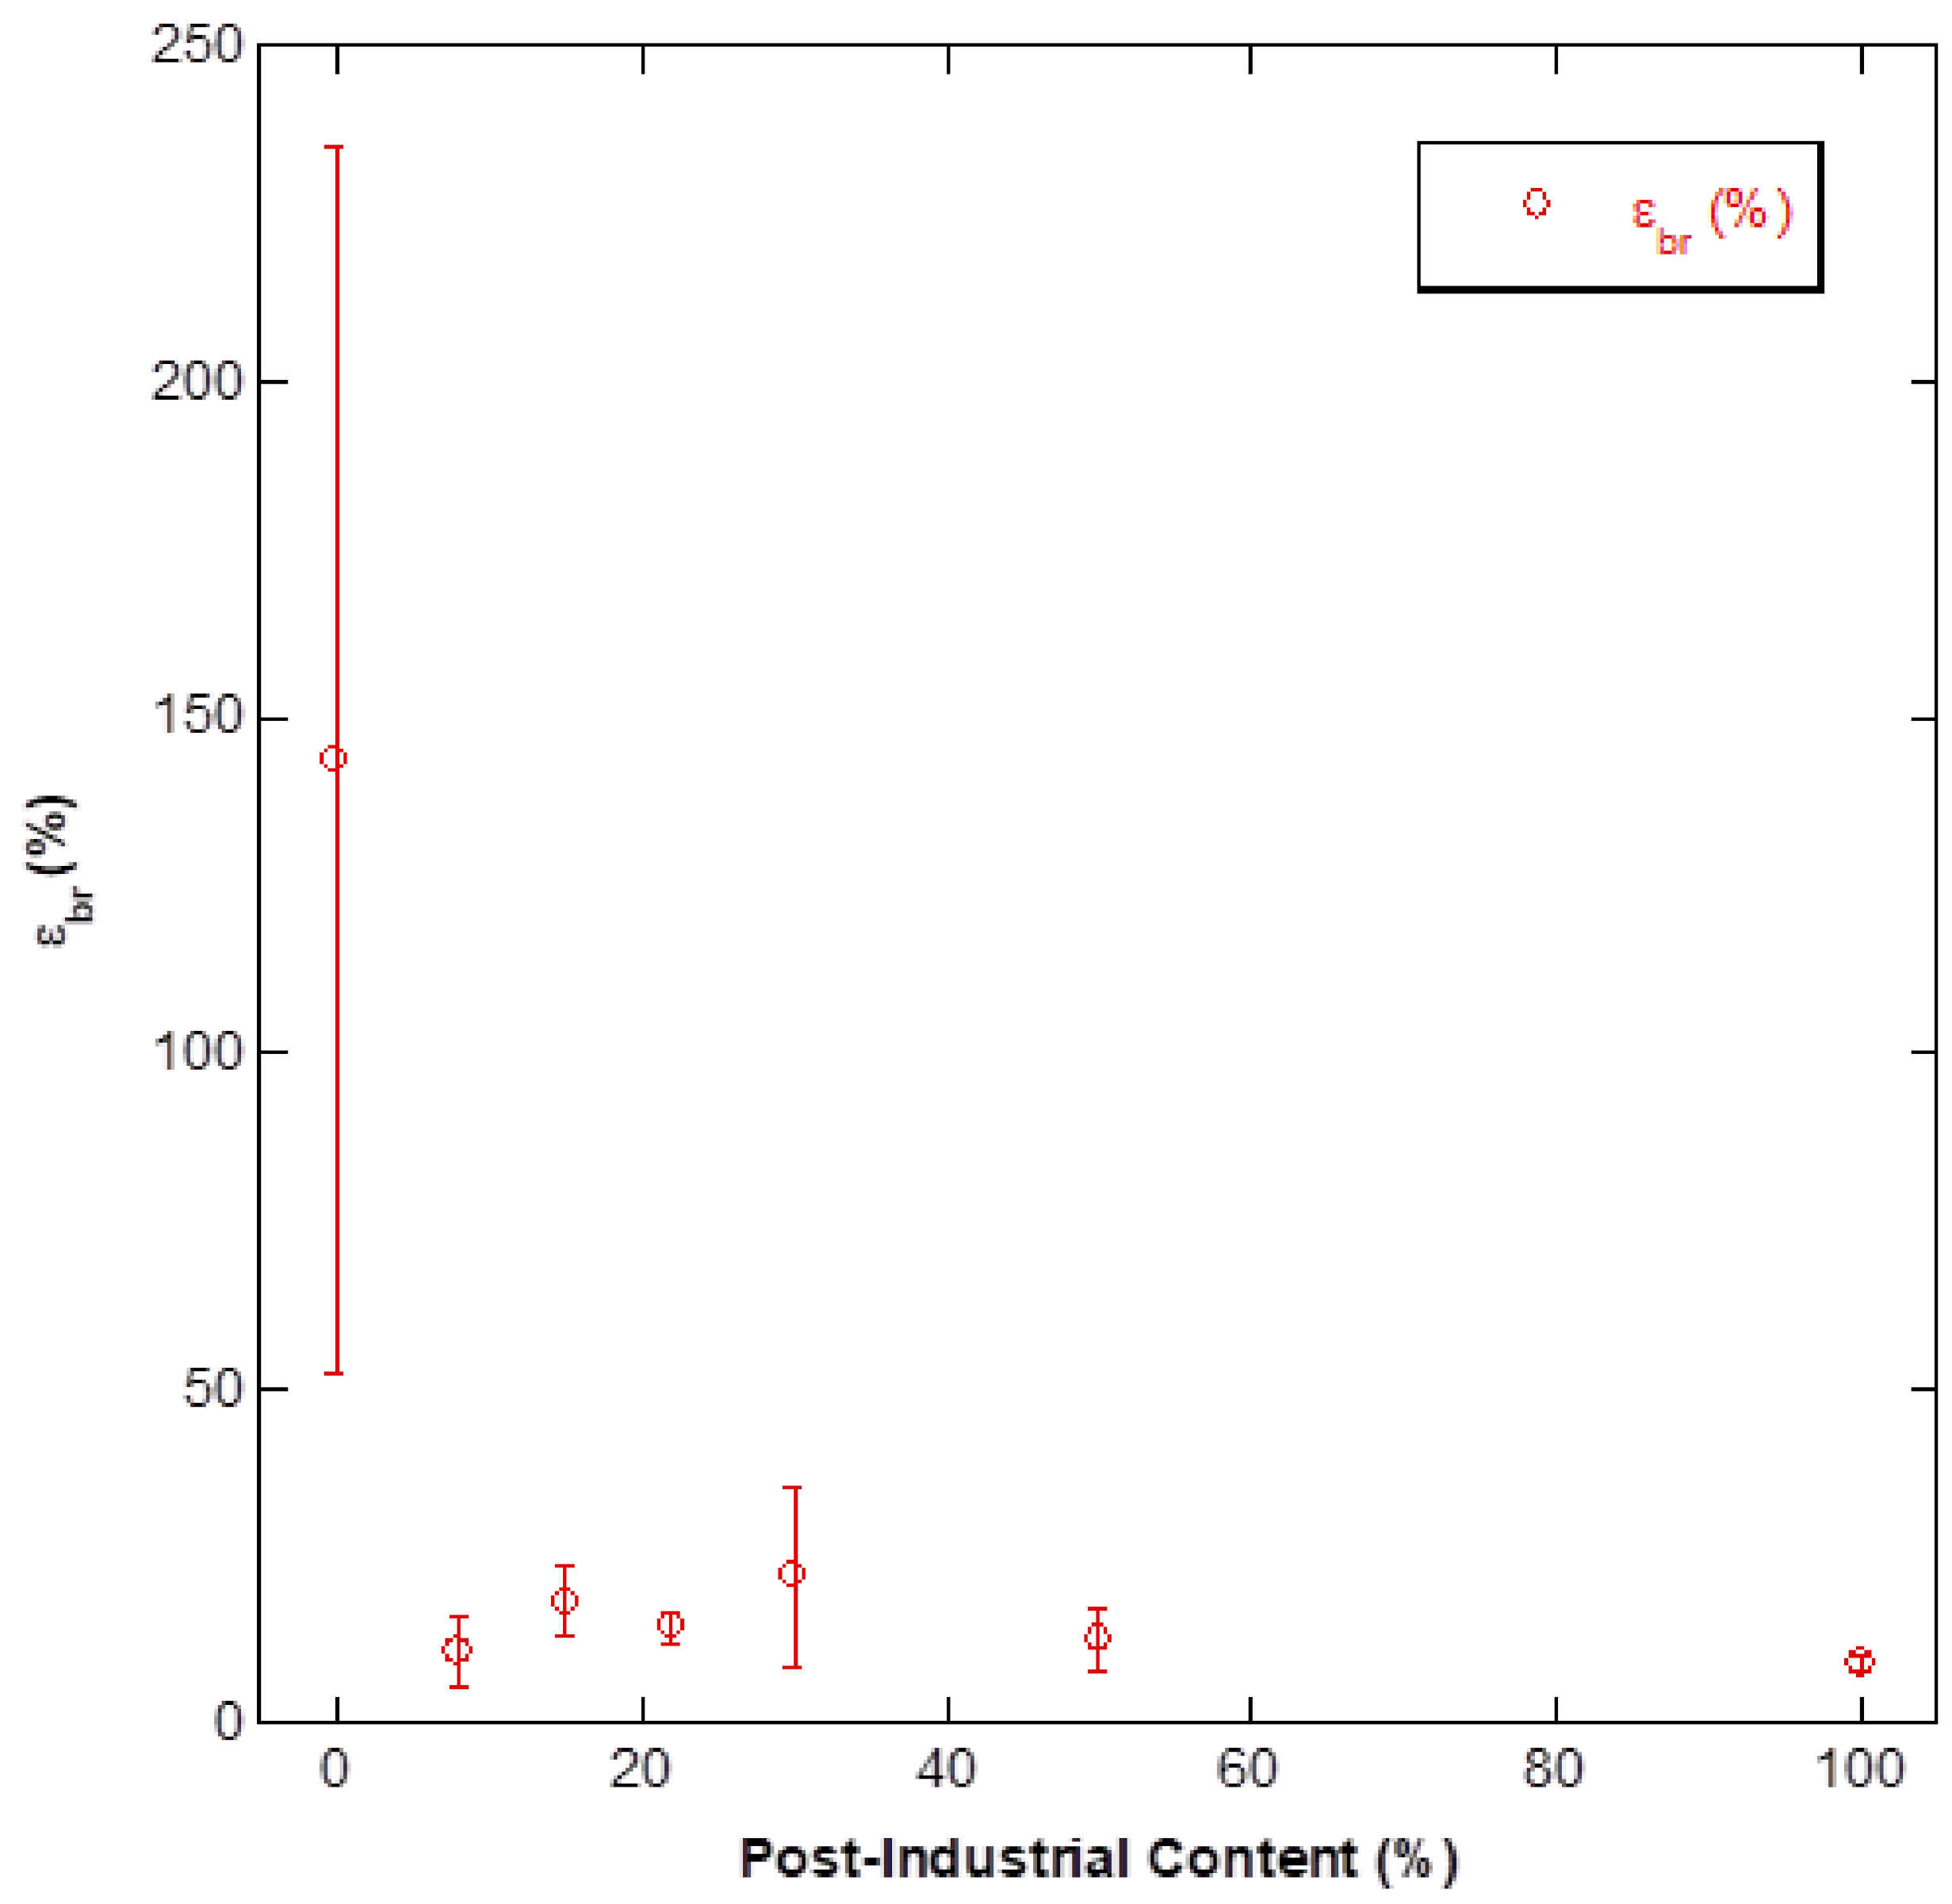
Figure 11 shows the strain at break versus post-industrial content, in which the behavior of post-consumer plastic was confirmed. In this case, standard deviation was high for post-consumer plastic because of the difficulties of obtaining a homogeneous system in terms of composition and, more importantly, in filler content.
It was also found that the lowest value of yield strength was measured for the system based on the post-consumer plastic, while the highest was measured for pure post-industrial polypropylene. Small differences occurred in the value of the yield strength for the intermediate blends, probably due to the difficulties of obtaining homogenous materials. In any event, it was possible to observe a slight yield strength increase with post-industrial content percentages up to 22% PI content, which subsequently decreased for higher PI content. Values for low PI content blends were below 8.4%, while the pure PI blend reached 8.7%. These results are more or less comparable to those obtained for bottle plastic, as the range was between 5 and 9%. The exception was the much larger standard deviation for hard plastic samples, probably a result of higher inhomogeneity [
28].
It can be concluded that in terms of static mechanical properties the blends exhibited similar performance, which was higher than the pure PC system and lower than the PI blend.
Impact strength tests were again characterized by a high standard deviation, partially explaining the apparently random trend found for low PI content plastic.
Table S2 in
Supplementary Materials summarizes impact strength results. Analogous results were found in the literature [
13]. Similarly to the tensile strength, PC0-PI100 and PC78-PI22 showed the best results, at 4.1 KJ/mm
2. This is in line with results from [
28], who showed a similar approach with recycled beverage bottle enclosure, concluding that blends containing different amounts of recycled polyolefin may be engineered to obtain desired properties.
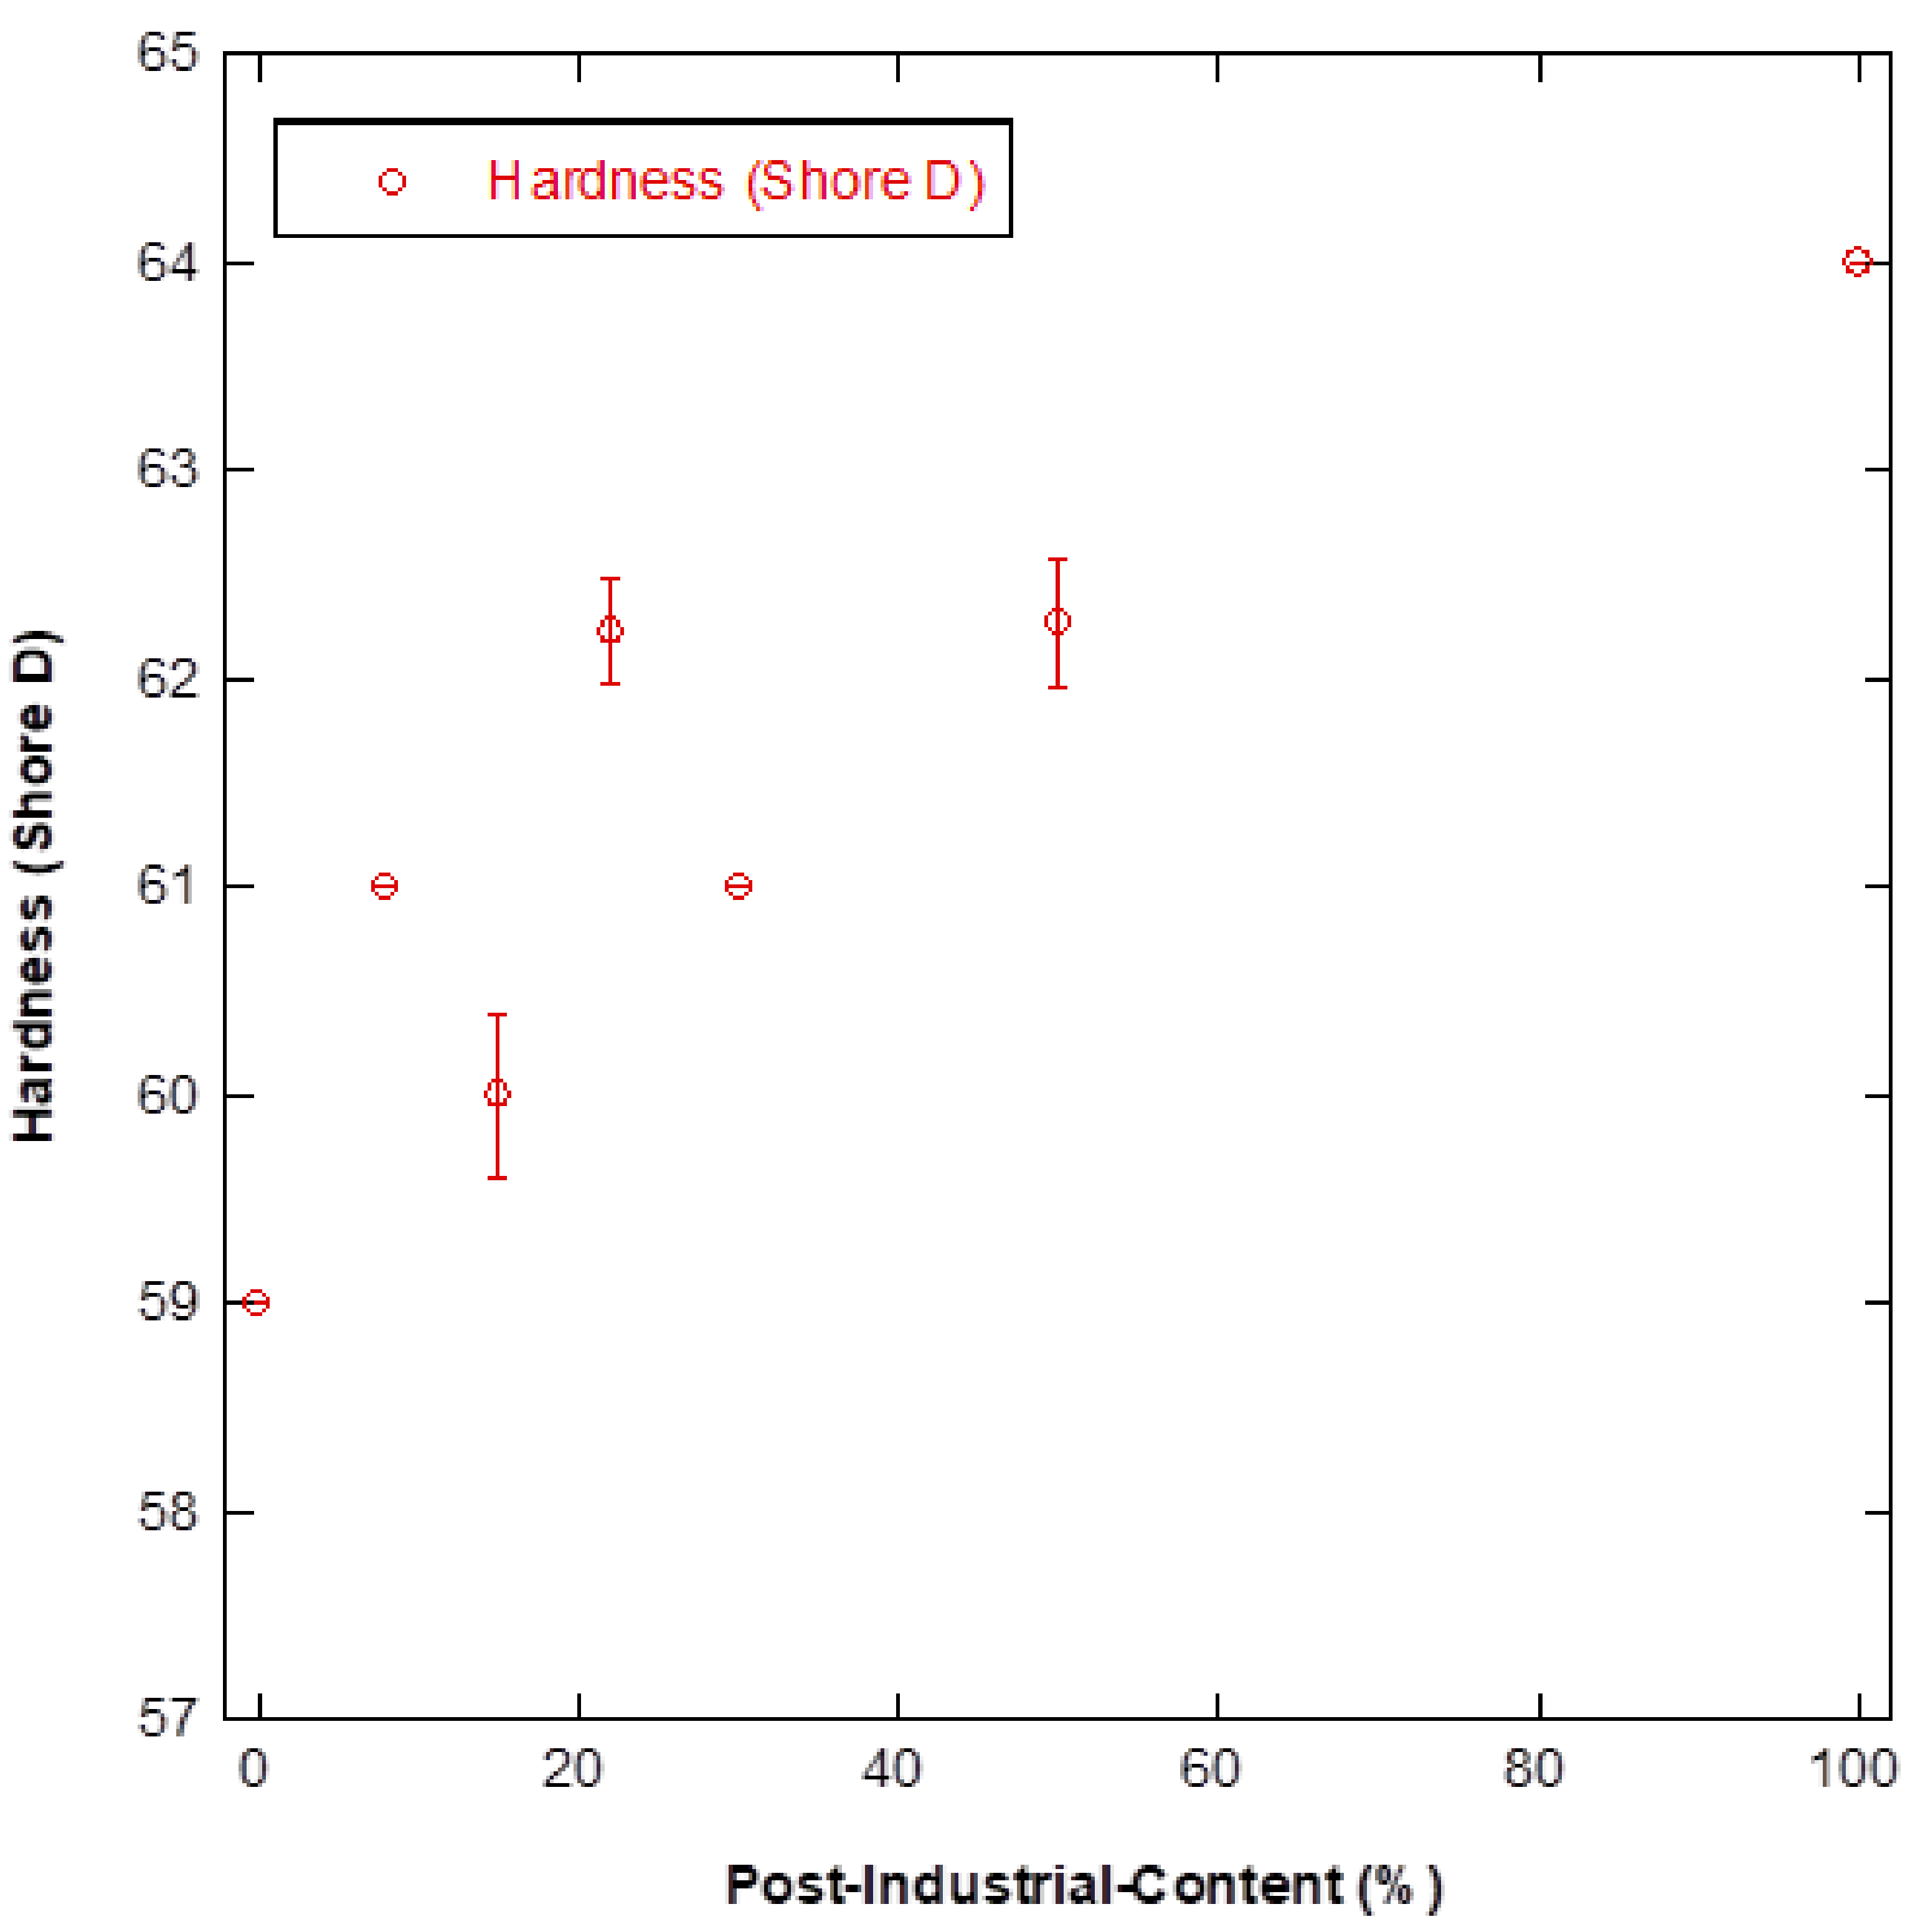
The trend for Shore hardness (
Figure 12) showed a direct increase in hardness corresponding to an increase in PI content, as a direct consequence of an increase in pure polypropylene content.
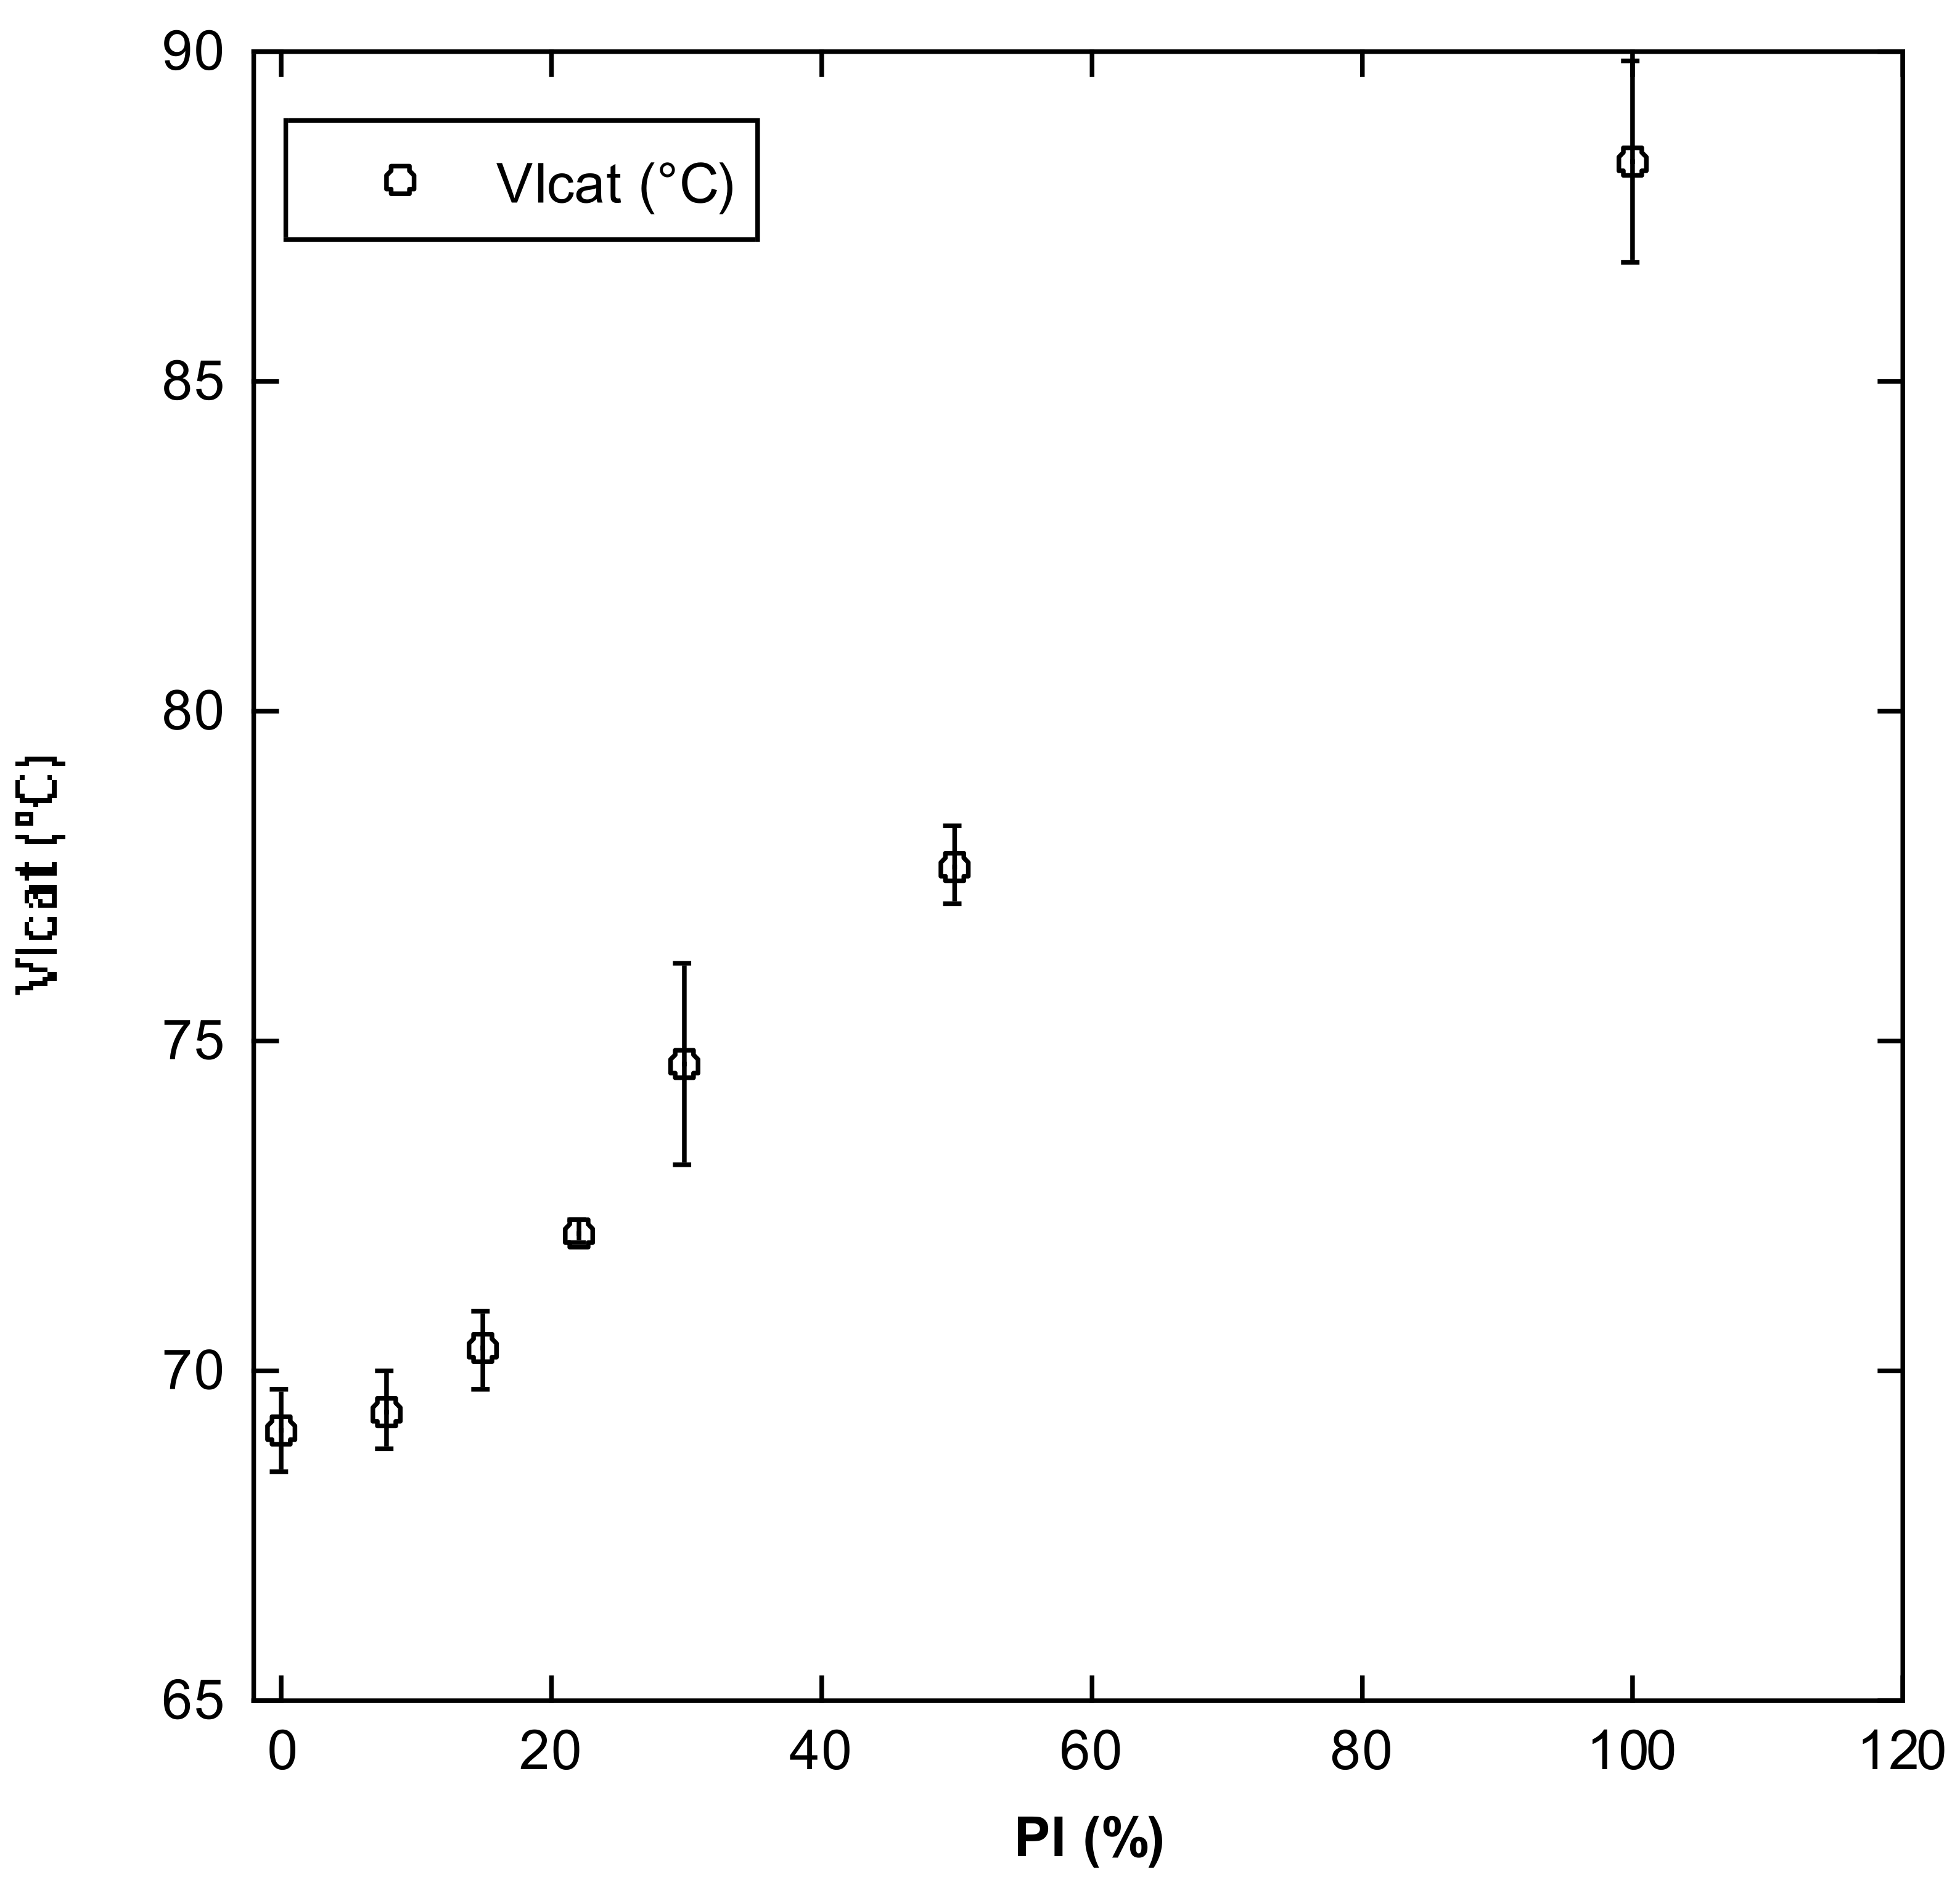
3.4. Vicat Softening Tests
The Vicat trend (
Figure 13) was quite linear, increasing directly as PI plastic content increased, and, consequently, as PE content decreased, except for PC92-PI8, which behaved in an anomalous manner, as the related value for the measured property was quite similar to the value measured for pure PC.
For systems characterized by a low amount of PI (up to 18%), the Vicat softening variation was lower than 3% in comparison to pure PC. On the contrary, for higher weight fractions of PI, that is, beyond the mentioned threshold, more significant variation occurred, as the softening temperature increased by 0.2 °C for each 1% increase in PI content.
The behavior of the material rich in PC polymer could be explained again by the difficulty of obtaining homogeneous material with lab scale batches and apparatus. Probably, this issue can be significantly improved in the case of industrial production, which is based on high production volumes, including the volume reduction and dry mixing stages and the extrusion process.
The presence of non-polyolefin-based inclusions, rubbers and fillers contributes to the difficulty of obtaining a homogeneous system, characterized by constant properties.
3.5. LCA
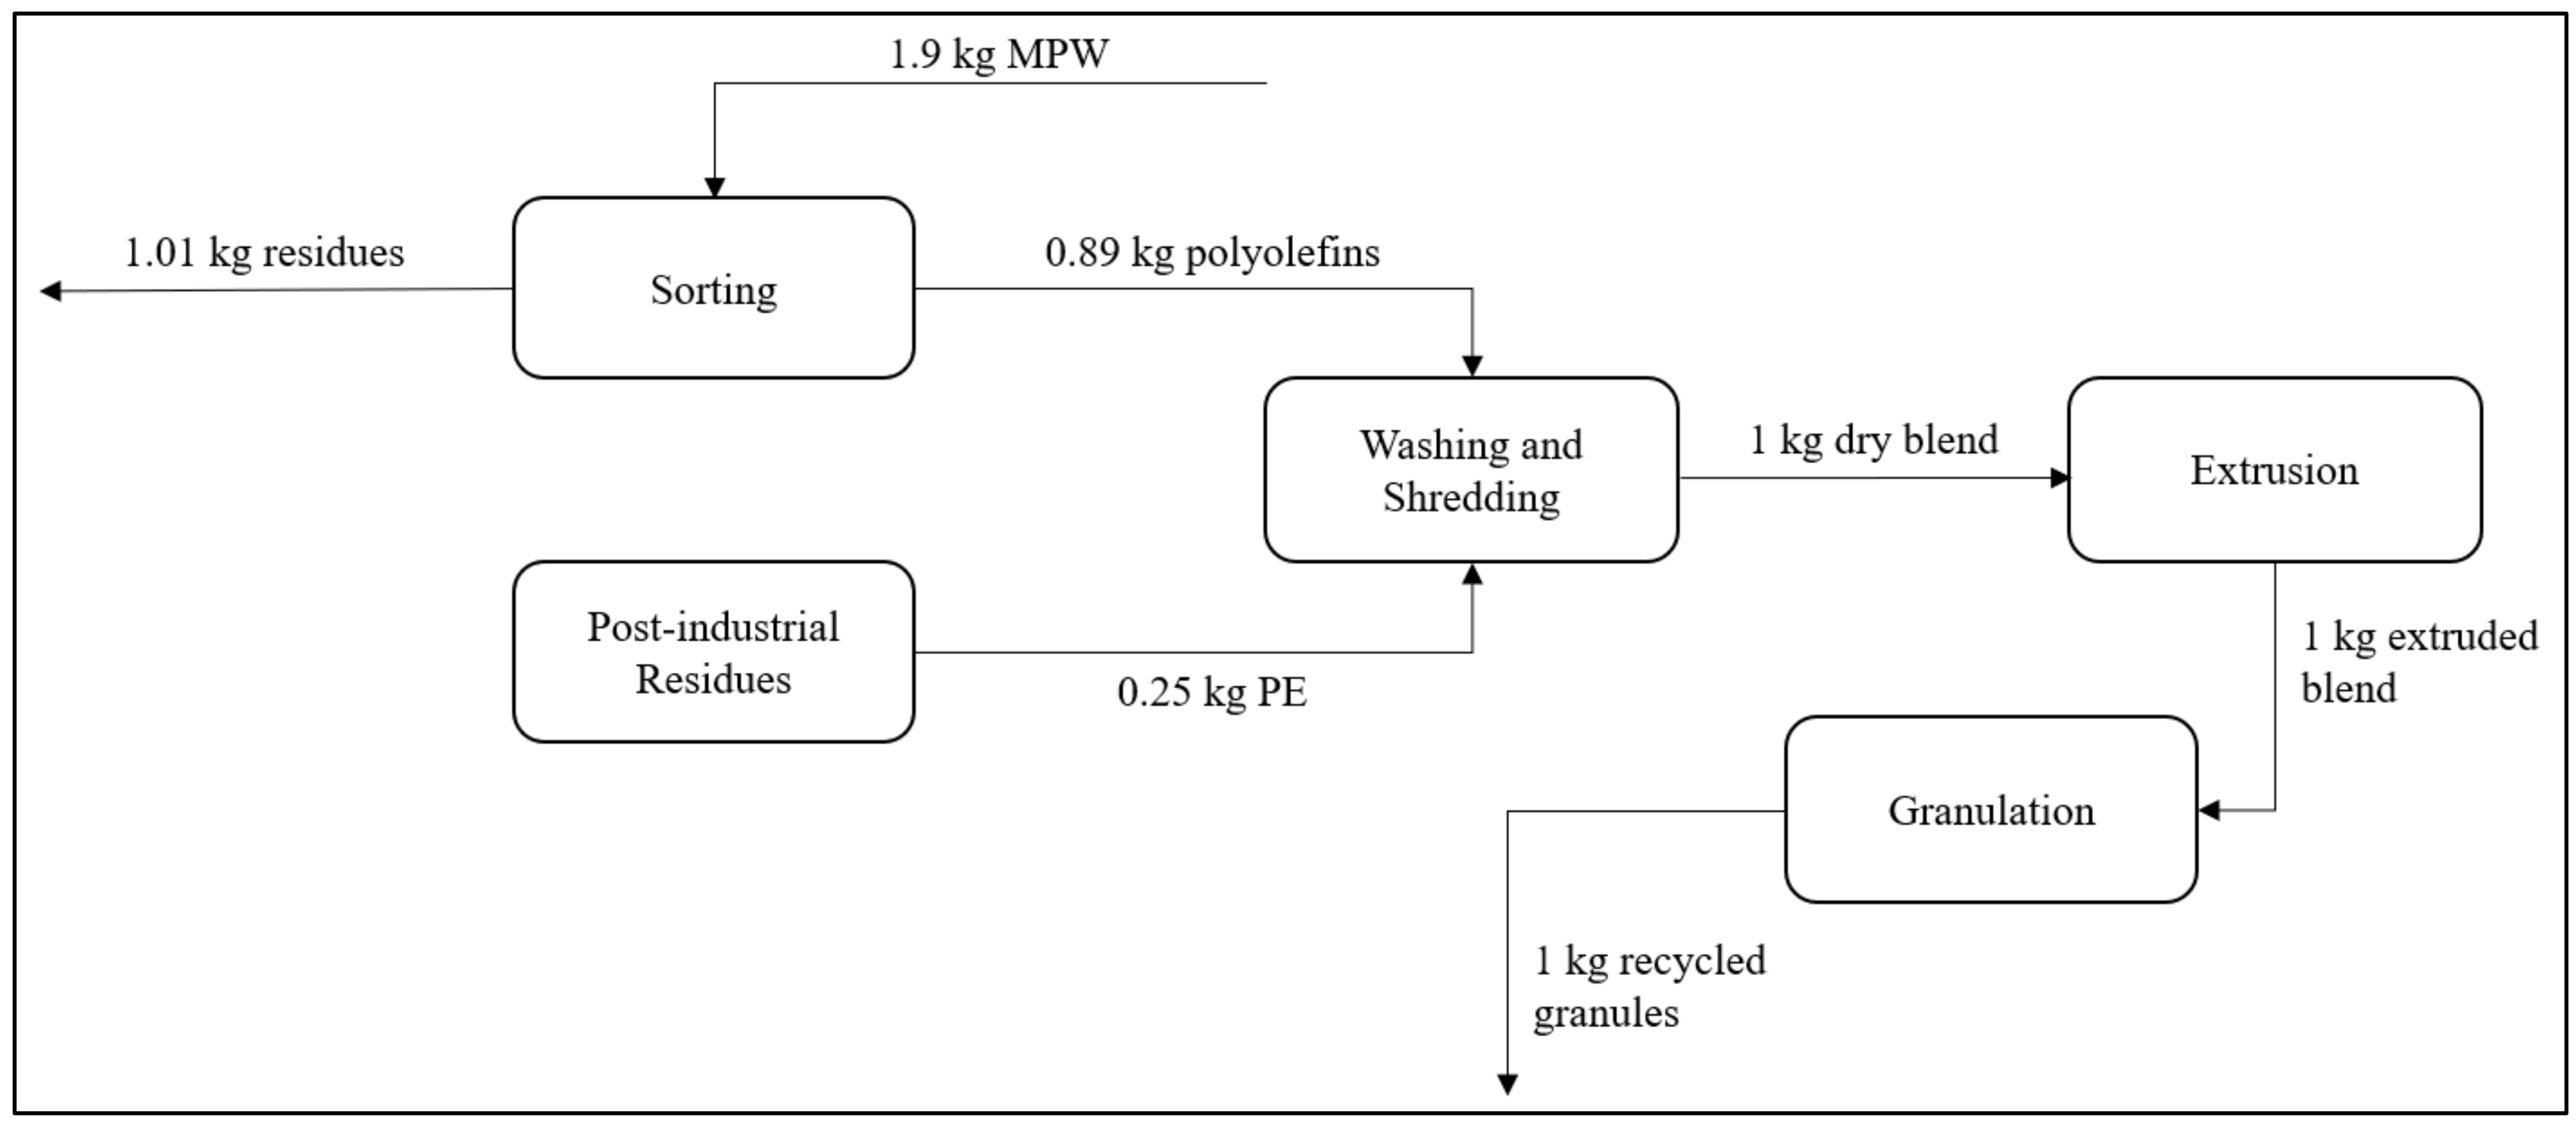
The life cycle assessment analysis was carried out comparing a baseline scenario of virgin polypropylene production from fossil fuels with a recycling process, shown in
Figure 2. Blend PC78-PI22 was used as a model, considering that it was the most promising according to the tests described in earlier chapters. Laboratory procedures were scaled-up to industrial level for this simulation. For the use of recycled plastics, the recycling scenario received credits in each impact category equal to the impact avoided, in that same category, by not producing an equivalent amount of virgin plastic. Results for both scenarios are shown in
Table 5.
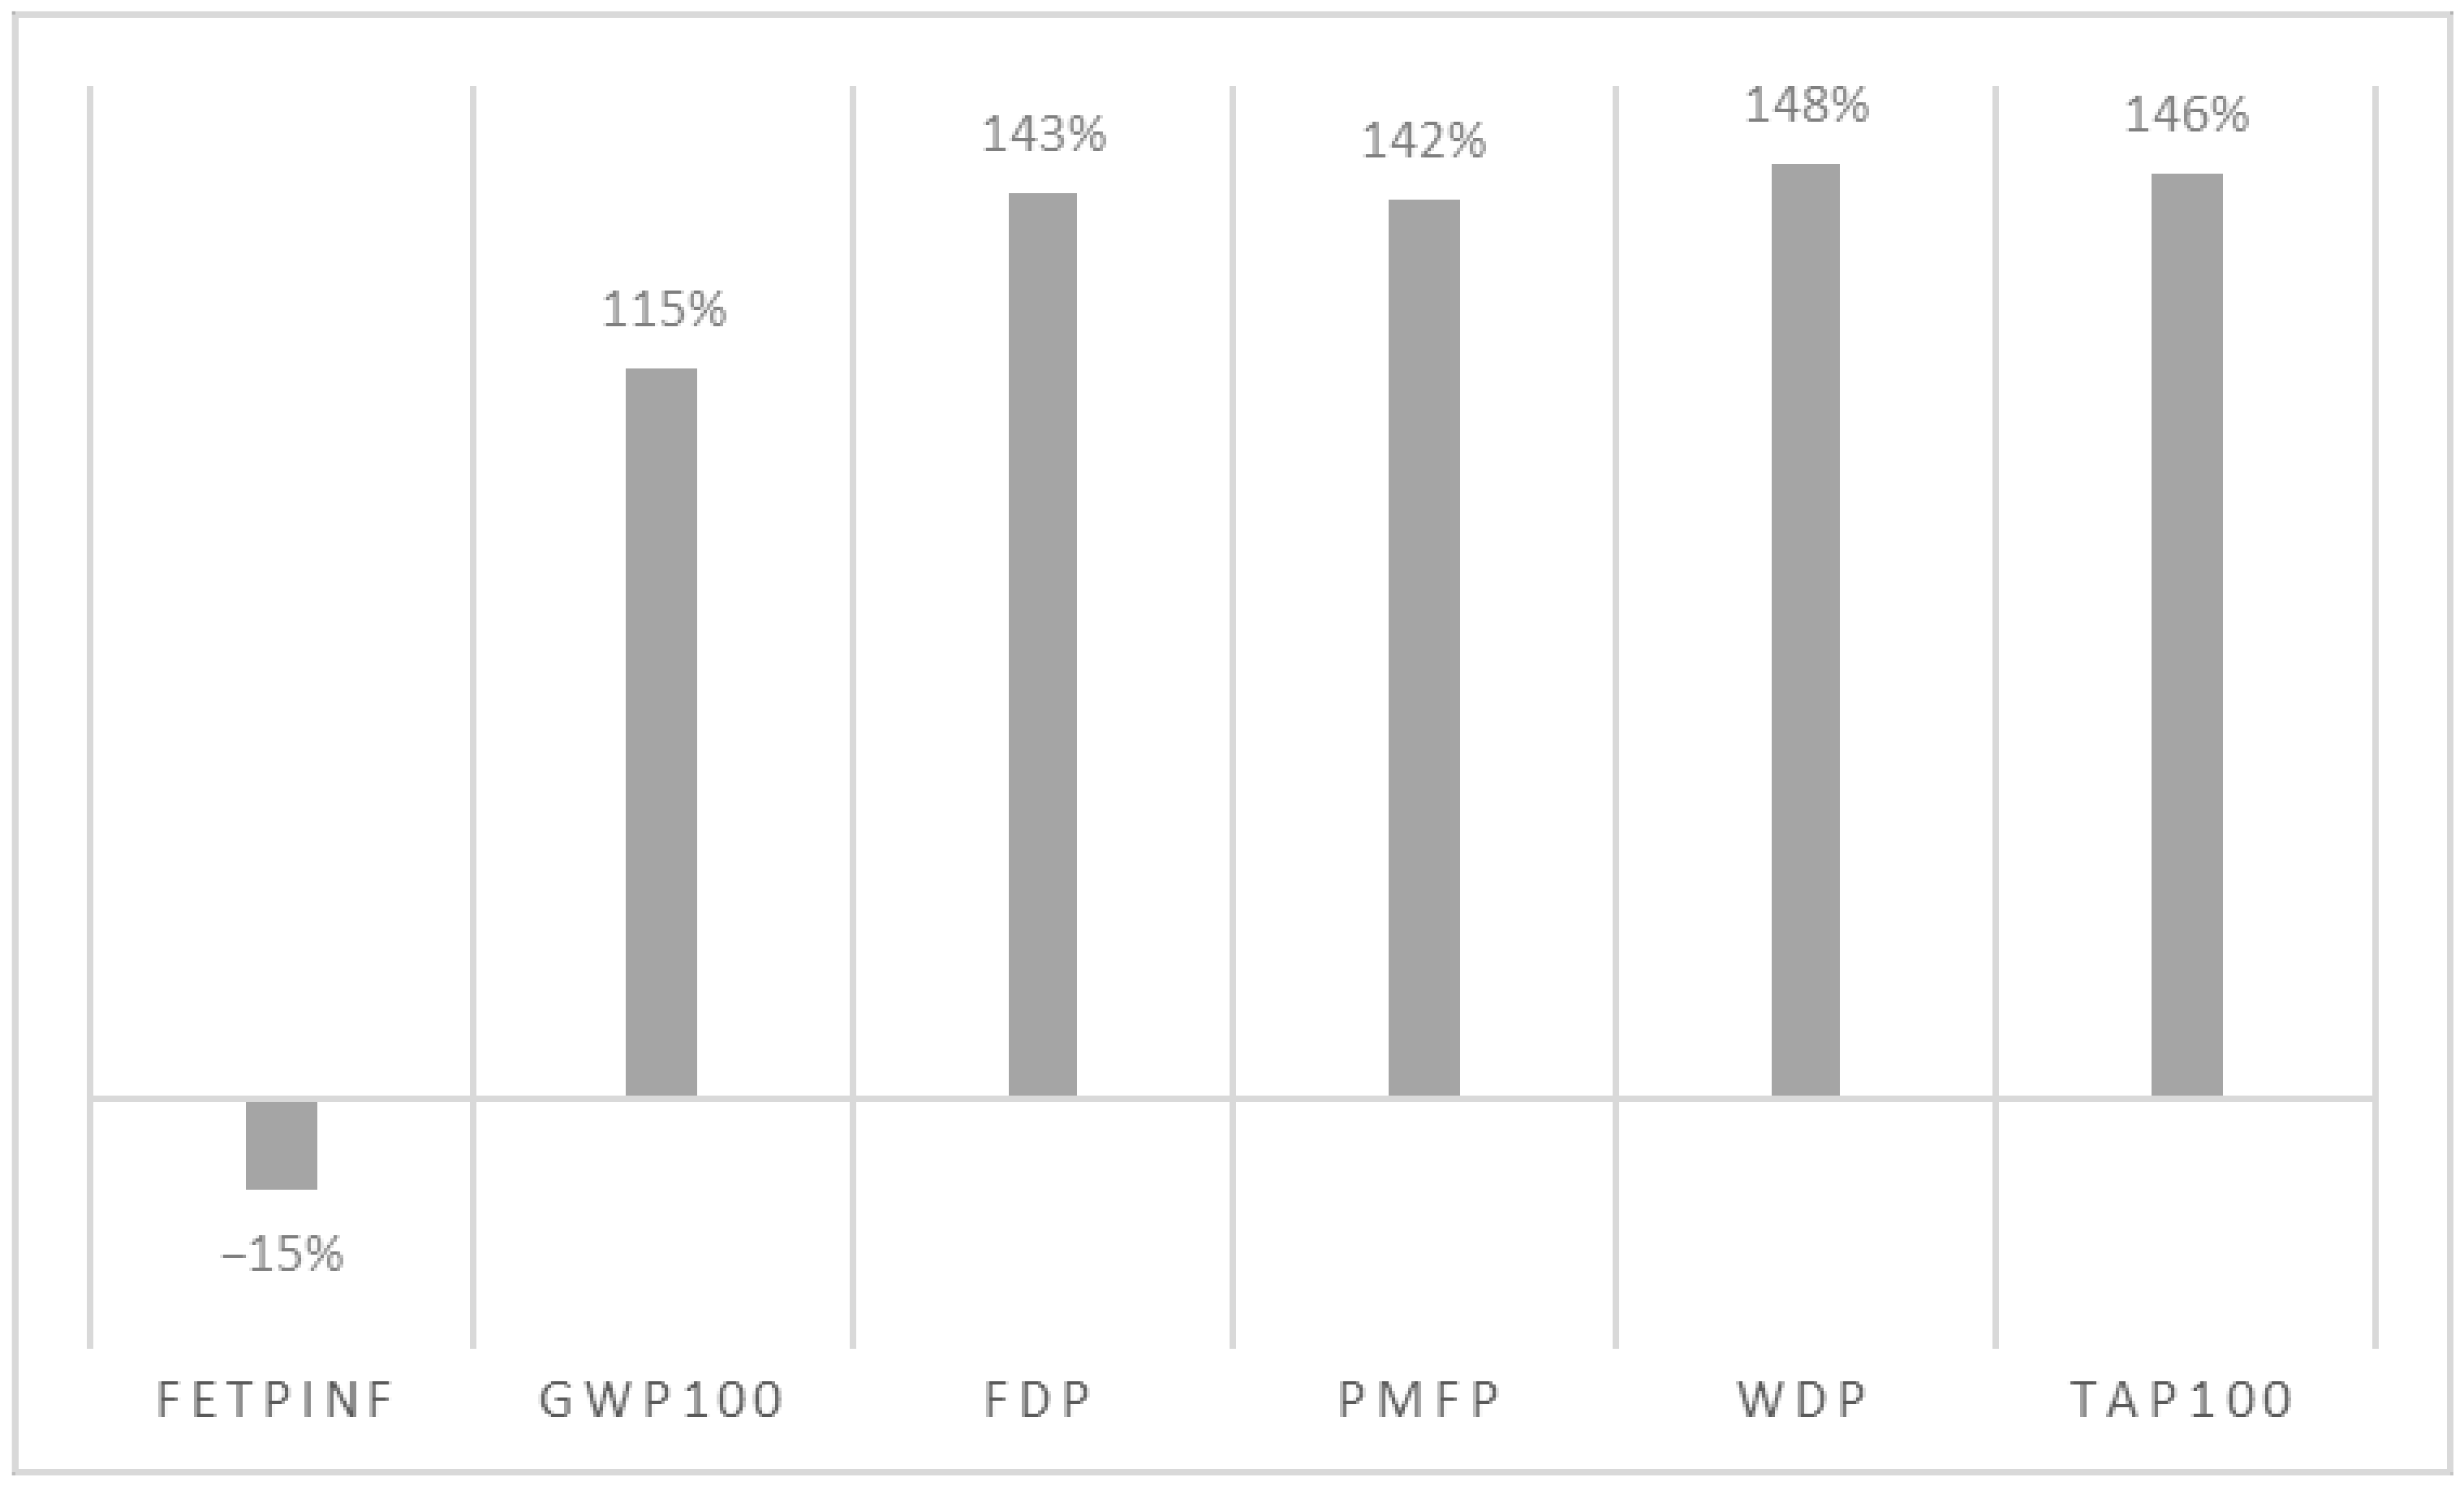
The percentage variation for each category is shown graphically in
Figure 14. It is clear that for most impact categories, the recycling scenario was characterized by considerable reductions compared to the baseline scenario. Assuming that plastic use will remain constant, hard plastic recycling could also help reduce climate change and fossil fuel depletion; the avoided production of virgin plastic, in fact, directly translates into a marked reduction in fossil hydrocarbons used for the synthesis of artificial polymers and for energy production. Moreover, water depletion was drastically lowered, as one of the most impactful processes in PP production in this regard was completely avoided [
34].
Previous literature [
18,
43] highlights the problems arising from a reduction in quality due to product use and recycling. In general, when a closed-loop production chain cannot be achieved because of lowered quality of the recycled material, an open-loop production chain should be modeled considering possible uses of recovered materials. As plastic recycling becomes more commonplace and recycled plastic finds new uses, defining which virgin products could be potentially substituted by recycled plastic can be difficult. Thus, to account for the lower quality of recycled plastic, the use of a substitution ratio is suggested for LCA studies focusing on recycling processes. For the Italian market, for example, Rigamonti et al. suggest a substitution ratio of 1:0.81 [
43]. In this study, recycled plastic was blended with pure industrial plastic residues: 1 kg of recycled blend actually contained 0.78 kg of recycled plastic. This ratio was a direct consequence of the lower properties of pure recycled plastic and as such, subsumes the substitution ratio within it. This ratio, equal to 1:0.78, is in line with previous studies on the recycling of other plastic species.
4. Conclusions
This study provided a characterization of post-consumer hard plastic and its blends with post-industrial PP waste plastic. As expected, post-consumer hard plastic is very heterogeneous compared to post-consumer plastic bottles; significant amounts of polypropylene, polyethylene (both high and low density), other plastic polymers and inclusions were found in the studied PC samples. Even after twin screw extrusion and injection molding, a true homogenization could not be achieved, as highlighted by the high standard deviation values for thermogravimetric tests and mechanical tests. Consequently, several mechanical properties of the blends could not be predicted, with the interesting exceptions of the hardness and Vicat tests, for which empirical relations were found.
Such variability may lead to difficulty in the design of custom blends for specific uses. In order to meet the needs of the recycled plastic industry, this study showed that even slight additions of post-industrial plastic can improve the mechanical properties of the blend, e.g., tensile and impact strength: the 78% post-consumer blends showed the most promising results, quite close to pure post-industrial PP, a direct increase in hardness with increases in PI content, and a softening temperature increase of 0.2 °C for each 1% increase in PI content.
This research highlighted some difficulties in treating recovered hard plastic, but also identified some useful approaches to improve the overall quality of the blend. Specifically, twin screw extrusion treatment and blending with pure waste PP may result in an exploitable, valuable secondary raw material. Moreover, an LCA analysis showed the environmental benefits deriving from the industrialization of this process, blending recycled plastic with pure industrial plastic residues to reach performances comparable to virgin plastic while, at the same time, markedly reducing fossil hydrocarbon use, greenhouse gas emissions and water depletion.
This result opens the way to potential applications that are already cost-effective; indeed the lighter fraction of hard plastic, being mostly PE and PP, can be separated by simple flotation [
11], thus making available a very large quantity of plastic waste. The mechanical properties of the more promising blends of PC and PI suggest potential uses in the automotive industry [
44] or for bulky, simple hard plastic items such as baskets, boxes, bins or gardening supplies.


 ,
, 


