
Tracking the Fate of Aluminium in the EU Using the MaTrace Model


Research Group Sustainable Systems Engineering (STEN), Ghent University, Coupure Links 653, 9000 Ghent, Belgium
*
Author to whom correspondence should be addressed.
Resources 2021, 10(7), 72; https://0-doi-org.brum.beds.ac.uk/10.3390/resources10070072
Submission received: 20 May 2021
/
Revised: 13 June 2021
/
Accepted: 8 July 2021
/
Published: 12 July 2021
Abstract
:Aluminium is a metal of high economic importance for the European Union (EU), presenting unique properties (e.g., light weight and high corrosion resistance) and with applications in important sectors (e.g., transportation, construction and packaging). It is also known for its high recyclability potential, but relevant losses occur in its life cycle, compromising the amount of aluminium available for secondary production. A novel methodology that allows the identification of these losses and their impact on the aluminium flows in society is the MaTrace model. The objective of this article is to perform a dMFA of the secondary production of aluminium in the EU technosphere using the modified version of MaTrace, in order to estimate flows of the metal embedded in 12 product categories. Twelve scenarios were built in order to assess the impact of changes in policies, demand and technology. The flows were forecasted for a period of 25 years, starting in 2018. The results of the baseline scenario show that after 25 years, 24% of the initial material remains in use, 4% is hoarded by users, 10% has been exported and 61% has been physically lost. The main contributor to the losses is the non-selective collection of end-of-life products. The results of the different scenarios show that by increasing the collection-to-recycling rates of the 12 product categories, the aluminium that stays in use increase up to 32.8%, reaffirming that one way to keep the material in use is to improve the collection-to-recycling schemes in the EU.
1. Introduction
The constant population growth along with the growing resource consumption represents an important challenge in the transition to more sustainable systems. Managing natural resources is a key aspect in this regard. The continued exploitation of resources may lead to their depletion and/or their scarcity, plus their associated environmental burdens [1].
Presently, the linear economy is the preponderant system in the industry. This system is based on a “take-make-dispose” model [2]. Nevertheless, an alternative to this system is provided by the circular economy, which is based on “the principles of designing out waste and pollution, keeping products and materials in use, and regenerating natural systems” [2]. This approach has gained global relevance. It is to be highlighted that the European Union (EU) has made significant progress with this topic by implementing policy and strategies to move to a more circular approach, for example, the Circular Economy Action Plan [3].
The mining industry is not alien to this reality. Technological innovations and the rapid growth of emerging economies have led to increasing global demand for these materials [4]. In this line, the EU has launched some initiatives and strategies that seek to reinforce the continent’s approach to improving access to raw materials through fair and sustainable supply from international sources, boosting resource efficiency and recycling [5].
A specific metal with high economic importance in the EU is aluminium (Al). The region is one of the largest end-users of this metal in the world. Nevertheless, it depends highly on imports due to limited ore resources and energy constraints [6,7]. Aluminium presents unique properties such as light weight, high corrosion resistance, good formability and non-toxicity [6,8]. In addition, it has great economic potential and environmental benefits due to its recycling possibilities, making this metal a strategic material to enable carbon neutral and circular value chains [9,10].
To acquire the above-mentioned properties, aluminium is alloyed with other elements, resulting in more than 450 alloy compositions. These are divided into two major categories: wrought and cast alloys and are defined by the impurity tolerance of the compound [11,12]. Wrought alloys admit a maximum of 5% of impurities whereas cast alloys admit up to 20% of them [12,13]. These compositions are a crucial variable in current recycling systems. Compounds with an accumulation of impurities can no longer be considered a valuable material for recycling [12,13].
Due to the economic and environmental relevance of aluminium, it is imperative to evaluate the anthropogenic cycle of this material. Dynamic material flow analysis (dMFA) is a methodology widely used to reproduce historical flows and stocks of metal resources, by quantifying and tracking the fate of materials at different geographic boundaries [7,14,15,16].
A good example of a dMFA application is the MaTrace model [15]. The model allows the tracking of a recycled material through the supply chain by combining a dynamic MFA of the use phase of the metal with a linear model of the waste management, the remelting processes, the manufacturing sectors and the markets for end-of-life (EoL) products, scrap, secondary material and final products [17]. The aim of this model is to trace the fate of metals contained in EoL products over time in open-loop recycling, through successive rounds of recovery and refinement, considering losses incurred in each transformation process and the quality of scrap. The original version of the model was the result of a dMFA and an input-output analysis (IO). It was implemented in Japan, to trace over a 100-year period the fate of steel that was initially part of a car [15].
A more recent and modified version was developed by Godoy León et al. [18]. The model was adapted to trace the fate of cobalt within the EU technosphere in a timeframe of 25 years. Here, the authors incorporated new features into the model, such as the hoarding rate of products (i.e., dead storage of a product that has reached the end of its use [19]) and made clear distinctions for the export of recycled material, manufactured products and end-of-service (EoS) and EoL products.
Other models have been derived from MaTrace: MaTrace—Alloy and MaTrace Global. The former was developed to track the fate of metals embodied in each product over multiple life cycles of products considering compositional details at the level of both alloys and products [16]. The latter is a multiregional extension of MaTrace with a global scope, and was as well, applied for steel in passenger cars and machinery [17]. Table 1 shows a summary of the previous studies done with the model.
It is noteworthy to mention that the model MaTrace has some limitations. For instance, it does not consider the aluminium that enters the economy after year 0, that is, new material produced and traded after this year. Moreover, it is not possible to track the fate of the exported material with this model.
The objective of this research is to perform a dMFA of the secondary production of aluminium in the EU technosphere, making use of the adapted version of the model MaTrace developed by Godoy León et al. [18], in order to assess the transition of the metal and trace its fate and losses in the region in a 25-year period.
2. Methodology
2.1. System Boundaries
The adapted version of the model MaTrace [15,18] was applied to track the flows of aluminium in the EU over 25 years.
The system is defined by both, spatial and temporal boundaries. The spatial boundary is the EU28. The temporal boundary is the period 2018–2043 (25 years). The starting year was chosen due to the availability of data regarding the initial distribution of aluminium embedded in final products [20]. The aluminium cycle is described in three phases: production, use and end-of-life; as a chain of five processes: semi-manufacturing, manufacturing, collection, pre-treatment and recycling; and with two stocks in the use phase: in-use and hoarding.
The starting point of the model is an initial stock of products of aluminium in use and analyses their transition over time. To obtain this information, eight aluminium sectors of economic relevance in the EU were studied, which in turn were divided into 12 product categories (see Table 2).
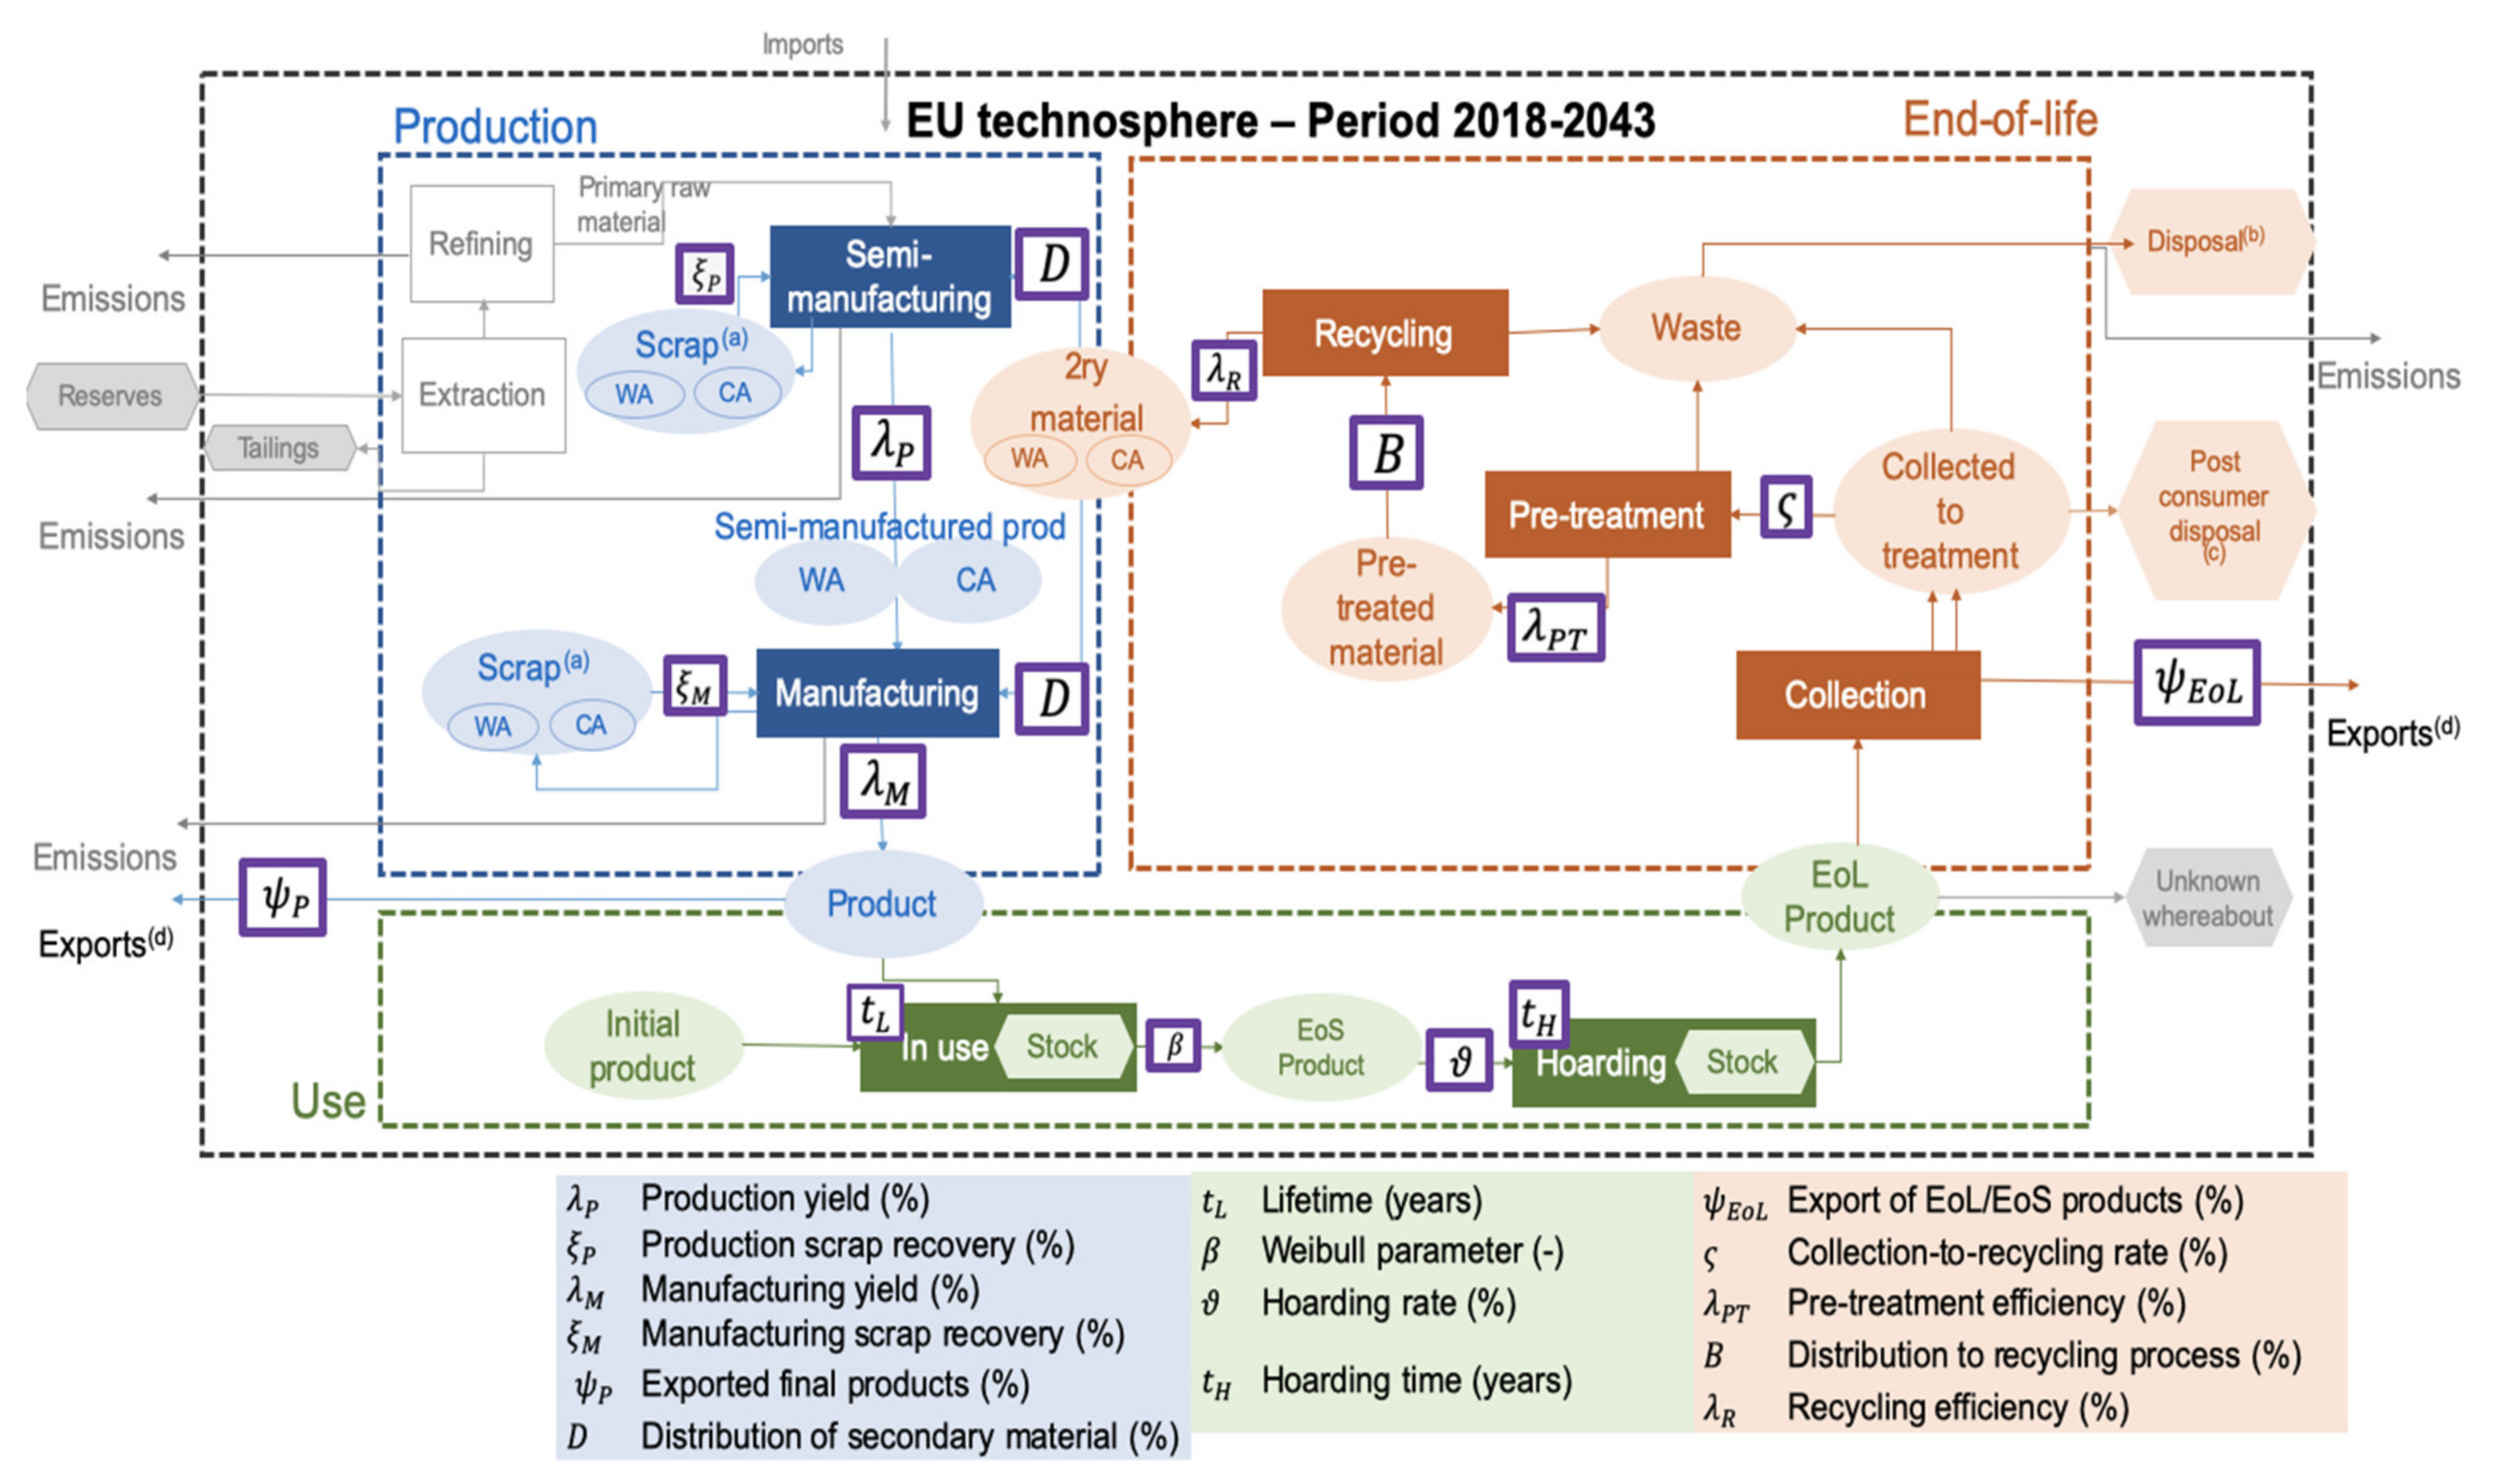
The representation of the studied system is shown in Figure 1. The system focuses on the secondary production of aluminium, therefore all the flows corresponding to primary production (in grey) are out of the scope of this study. However, these flows are depicted in order to provide a general idea of the life cycle of the metal.
From recycling to manufacturing, the flow of aluminium is split into two alloy categories (i.e., cast and wrought alloys). These are combined after manufacturing since both alloys are incorporated in the production of new products.
2.2. Data Sources
The research focused on the physical flows of aluminium, concerning the metal embedded in final products in order to build a complete dataset of aluminium and its products according to the parameters shown in Figure 1.
Based on that, an exhaustive literature research was carried out. Factors such as the geographical and temporal representation and the communication format were taken into account. Regarding the geographical and temporal representation of the information, the focus was on representative data for the EU in 2018. However, due to data availability, some values were taken from the EU’s single-member countries, global studies and from countries with similar economies (i.e., similar GDP). In terms of temporal representation of the values, only sources in English published between 2000 and 2020 were consulted. The data was divided into two categories: recent data, which corresponds with those values reported in the last 10 years (2010–2020), and old data, which corresponds to those reported between 2000 and 2010.
The communication format refers to the type of source of information. In this research, the data were mostly acquired from scientific papers, books and official reports from European and International organizations (e.g., European Aluminium Association, International Aluminium Association) and official databases such as Eurostat. Nevertheless, non-scientific sources (e.g., newspapers, magazines) were also necessary in order to overcome data gaps. The gathered and applied data are presented in the Supplementary Material.
2.3. Model and Data
2.3.1. Treatment of the Data
The data required to run the MaTrace model were not always reported per single product category nor were they always reported for a specific product category. In the former case, assumptions, hypotheses and proxy values were used. For the latter, average values were employed per product category. The complete description of the treatment of the data is available in the Supplementary Material.
2.3.2. Model Implementation
The MaTrace model uses a set of equations in each phase of the life cycle of the final products. These equations calculate the transition of the metal across products and across time. The complete set of equations used in this research can be found in Godoy León et al. [18]. A brief description of the main equations used per life cycle phase is as follows.
Use Phase
This phase includes the in-use and hoarding stocks. Moreover, it evaluates the lifetime of the product. This work considers the service lifetime of the final products, which refers to the period where the products function and can be put to use [21].
Similar to the work of Nakamura et al. [15] and Godoy León et al. [18], this work uses the Weibull distribution [19] to estimate the lifetime distribution of each product category.
During this phase, the final products reach the end of their lifetimes and become end-of-service (EoS) products. Ideally, these products should be discarded and collected for recycling or disposal. However, in reality, some pass to another stock known as hoarding. Hoarding refers to the dead storage of a product by its user when it is no longer in use. Hoarding is also known as hibernation [19]. It is important to mention that due to lack of data availability, it was assumed that there is no re-use of products in the region.
The material available from EoS products i in year t () is calculated by Equation (1).
In the equation, is the mass of material under consideration in the final product i produced at time r. At time 0 (), the variable corresponds to the initial distribution of the material and its value was obtained from Passarini et al. (2018) [20].
End-of-Life-Phase
This phase considers the collection, pre-treatment and recycling of EoL products. An EoS product turns into an EoL product after their storage (i.e., hoarding) period. As indicated by Godoy León et al. [18], the collection process can happen in two ways: selective and non-selective. According to UNEP [22], selective collection refers to the amount of EoL material that is collected and enters the recycling chain. In contrast, the non-selective collection refers to the amount of EoL material that is collected but have been misplaced in waste bins [23], hence, it ends up in landfills or incinerated. Following the process, a portion of the collected EoL products is exported (i.e., outside of the boundaries of the system). For the aluminium case, the number of EoL products exported was not considered, since the reported value was negligible [20].
The products that remain in the EU will go to treatment. Some of these EoL products are disposed (i.e., post-consumer disposal), which constitutes a loss for the system.
The portion of material that is not disposed of is recycled (i.e., collected-to-recycling). Prior to the recycling process itself, the products are pre-treated (e.g., separated, sorted).
It is noteworthy that the scrap resultant from the previous processes does not have the same quality as the original material. The obtained quality will depend on the initial material as well as on its specific alloy composition, which will determine the recycling process to apply. In this work, two recycling processes were considered, remelting and refining, producing cast and wrought alloys, respectively. In order to allocate the scraps to the mentioned processes, the model uses a matrix named matrix B [15,18].
A factor to consider is the quality of the alloys, which can be affected during the recycling process. For instance, wrought alloys can turn into cast alloys due to their low tolerance to impurities. Currently, these alloys are destined for the transportation sector [24].
Production Phase
The recycled material obtained is ready to be processed into final product categories. Aside from the fractions of material lost during the production processes (i.e., production losses), all the secondary material is destined to become part of a final product. The allocation of the recycled material to the final products is given by matrix D. This operation is of critical importance for the model. Matrix D can be estimated with input-output tables (IOTs [15]. Nevertheless, this information is not always available. For this work, matrix D was estimated with published data sources and back calculations (e.g., Hatamaya et al., 2007 [24]; Modaresi & Müller, 2012 [25]; Løvik et al., 2014 [26]).
Losses
The MaTrace model considers physical and economic losses. The former refers to the material dissipated into the environment and the technosphere. It considers the resultant losses from the inefficiencies of the processes (i.e., semi-manufacturing, manufacturing, pre-treatment, recycling) and the non-selectively disposed material. Economic losses refer to the material that leaves the system through export. Exports are considered losses because the material “leaves” the region in which it was originally used.
The losses are calculated as a total loss for the system and as aggregated losses (Equation (2)), which correspond to the added losses in time.
where is the amount of product types i in use in the region in year t, and is the amount of EoL products i released in a year t.
Stocks
This model allows the calculation of different stocks such as the final products that remain in use, the hoarded products and the losses.
The stock of product i that stay in use in the year t is obtained by Equation (3):
Finally, the system must be balanced according to the law of conservation of mass. The equation that calculates the mass balance is given by Equation (4).
where the right side represents the initial distribution of the material in the system and the left side gives its allocation over time until year t into applications and losses. and correspond to the stock of losses and stock of released hoarded products, respectively.
2.4. Scenarios
The baseline scenario consists of a business as usual (BAU) simulation, in which the value of the parameters is constant in time (25 years). It represents the current situation regarding the management of EoL products of aluminium and their secondary production.
The BAU scenario considers the 12 product categories, on one hand, and on the other hand the alloy composition. The former analyses the transition of the aluminium in these products, whereas the latter analyses the transition of aluminium per alloy group (i.e., cast and wrought alloys).
In addition to the BAU scenario, five other scenarios were built in which different parameters of the model were modified. These modifications include changes in the collection-to-recycling rates, in the demand of aluminium for the production of automobiles, in the distribution of secondary material in the transport sector and in the export of material. For each scenario, only the target parameter was changed, the rest were kept as in the BAU scenario. Table 3 summarizes the changes done per scenario.
Scenario 1 (S1) considered a change in the allocation of secondary material for the transportation sector. This assumption was based on the projections for the transportation sector regarding the use of aluminium. Dokker [27] stated that in four years the use of wrought alloys increased by 8%. However, an increasing demand for wrought alloys in the transportation sector could heavily influence the allocation and management of this material (i.e., cast alloys). Modaresi & Müller (2012) [25] and Løvik et al. (2014) [26] mentioned that a high risk of scrap surplus is possible if this trend continues. In that sense, three sub-scenarios were built: S1.1, S1.2, S1.3, considering a constant increase of 5, 8 and 16% of wrought alloys in the sector every five years (i.e., a yearly increase of 1, 1.5 and 3% respectively).
Scenario 2 (S2) contemplated that no export of scrap takes place in the system. The export of final products is still considered in this scenario.
Scenario 3 (S3) increases the collection-to-recycling rates of the packaging sector by 0.5, 2 and 5%. Same as S1, three sub-scenarios were developed (S3.1, S3.2, S3.3). The aim of S3 is to reach the collection-to-recycling rate established in the EU’s Packaging and Packaging Waste Directive EU2018/852/ [28] which is established as 70% by the end of 2030.
Scenario 4 (S4) assessed how the changes in the demand for aluminium in the transport sector impact the flows of the metal. For this case, an increase of 33% of aluminium in automobiles during the first 7 years was assumed, based on the projections made by the European Aluminium Association [29].
Finally, Scenario 5 (S5) assumed an ideal scenario in which all product categories are collected to be recycled. Three sub-scenarios were built: S5.1, S5.2 and S5.3, in which a constant increase of 5, 10 and 15% in the collection-to-recycling rates per year were considered. After reaching the target level, the collection-to-recycling rates remained constant.
3. Results and Discussion
3.1. Baseline Scenario
3.1.1. Analysis per Sector
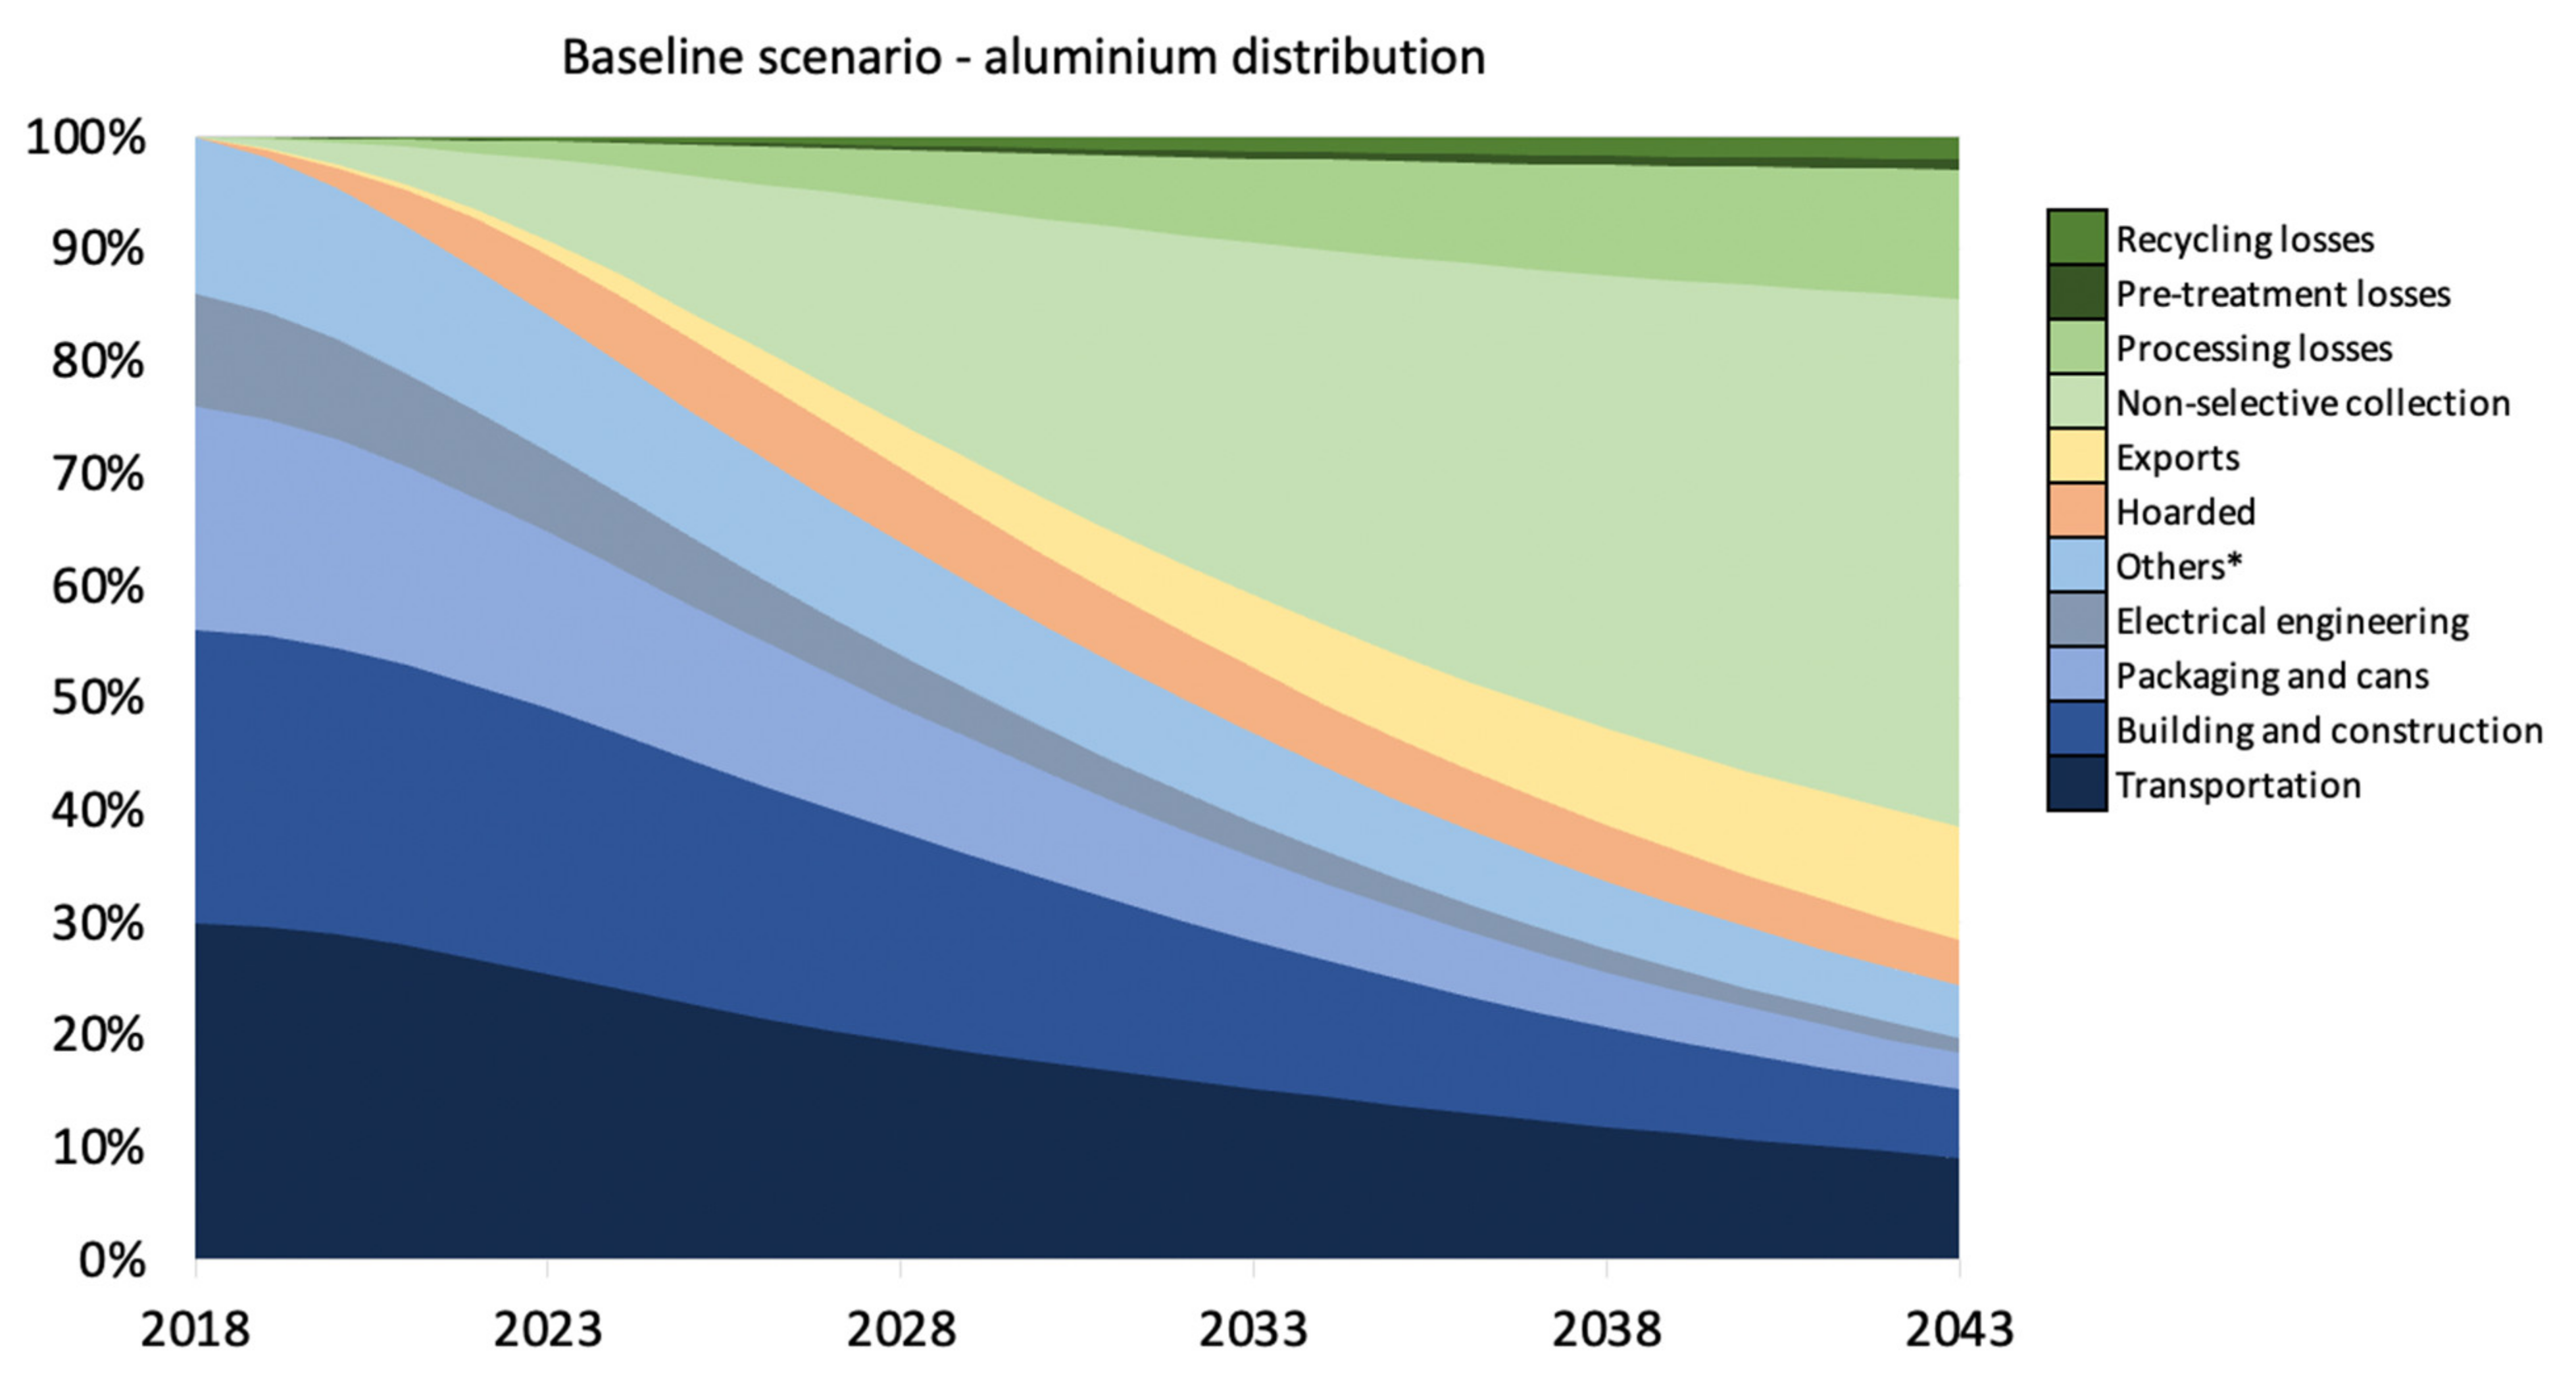
Figure 2 shows the evolution of the initial stock of aluminium over a period of 25 years in five sectors: transportation, building and construction, packaging and cans, electrical engineering and others. In order to have a better visualization, the product categories were aggregated into their respective sectors. In addition, due to their low contribution to the stocks, “consumer durables”, “industrial machinery and equipment” and “others” were aggregated in a single category named “others”. The losses since its initial occurrence in year 0 (2018) and the stock of hoarded products are also shown in Figure 2.
The losses refer to the exports and to the non-selective collection, production, pre-treatment and recycling losses. The hoarded stock refers to the potential material that could be recovered in the future.
The graphics showing the transition of aluminium per product categories are available in the Supplementary Material.
The BAU scenario shows that after 25 years, 24% of aluminium remains in use, 4% is being hoarded, 10% has been exported and 47% has been lost due to non-selective collection. The losses during the recycling and production processes account for 14%. Despite the fact that 72% of the initial material has been lost after the studied period, the portion of recycled aluminium that remains in use is high if it is compared with other metals analysed with the same model. For instance, in the research developed by Godoy León et al. (2020) [18], the authors found that only 8% of cobalt remains in use. It is noteworthy to mention that for both materials the non-selective collection remains the major source of losses.
This relatively “high” amount of aluminium in use is due to the recycling potential of the metal. According to the European Aluminium Association (EAA) [30] currently recycled aluminium (pre-and-post-consumer scrap) represents 36% of the aluminium metal supply in Europe, with 20% coming exclusively from post-consumer recycled aluminium. In addition, the EAA states that in order for aluminium to reach full circularity, well-developed collection-to-recycling schemes are needed across Europe.
Nevertheless, as the results of this research show, not all the aluminium scrap is managed properly, especially during collection. Warrings & Fellner (2018) [31] suggest that despite the high collection-to-recycling rates of some product categories, if the metal is not collected separately and enters the subsequent waste treatment process, its recovery becomes much less likely and its material quality is reduced.
During production (i.e., semi-manufacturing and manufacturing processes), 12% of the material is lost. These losses are related to the quality of the secondary alloys. Since cast alloys tolerate more impurities than wrought alloys, it is expected that these have higher production than the former. Nevertheless, in order to meet quality requirements, dilution processes can take place in which impurities can be diluted by the addition of primary aluminium [26,32]. If these impurities are not diluted, the material is discarded.
The production phase is also limited by the quantity of the available scrap. Long lifespans of products delay the availability of the material for recycle and its consequent introduction in the production chain [33]. For instance, two of the main sectors of aluminium (i.e., transportation and building and construction) have an average lifespan of 20 and 46 years, respectively. This means that during the studied period a portion of this material did not reach the EoL phase, therefore, it was not collected, recycled and re-integrated in the production line.
Regarding the hoarded stock, after 25 years, it represents a small source of material kept by the user (4%). This is related to the hoarding periods and rates of the analysed product categories. It is important to mention that the building and construction sector have a hoarding time of 30 years, and it exceeds the studied period. This means that no material from this sector was released from being hoarded. Sectors such as consumer durables, electrical engineering and others have the highest hoarding rates (50%), and their hoarding period is of only four years. However, their share between the sectors is small.
The exports represent 10% of the material losses after the studied period. This refers to the export of final products and EoL scrap. Export of secondary material was not considered in this research due to the reported value being negligible (0.07%) [20]. Finally, the pre-treatment and recycling represent the smallest source of losses (1 and 2% respectively). This is related to the efficiency of these processes. It is important to mention that the model only considers the efficiency of the mentioned processes. Other models that have focused only on a specific pre-treatment process (i.e., sorting) present higher losses for the recycling process [13]. Furthermore, as indicated previously, in this work, average values were used. Hence the results are not widely affected by this parameter.
3.1.2. Analysis per Alloy Group
From Figure 2, it can be seen that the main product categories of aluminium are given by the sectors transportation, building and construction and packaging and cans. This has a direct relationship with the initial distribution of aluminium in-use (see SM) and with the destination of the secondary material used for their production. It can be observed that the transportation sector has the highest amount of aluminium embedded in products and maintains the same trend after 25 years, unlike the other sectors.
This behaviour is related to the alloy composition and the secondary material allocation of these sectors. The transportation sector uses more than 70% of cast alloys and has the ability to absorb the scrap from other sectors [26]. On the contrary, sectors as building and construction and packaging and cans do not use high amounts of cast alloys and do not have the ability to absorb this material from other sectors; they can only absorb their own scrap. Therefore, due to quality constraints, part of the wrought alloys from the mentioned product categories would end up as part of the transportation sector in the form of cast alloys. As mentioned by Cui & Roven [32] it is a current practice to produce cast alloys with the wrought aluminium alloys’ mixture.
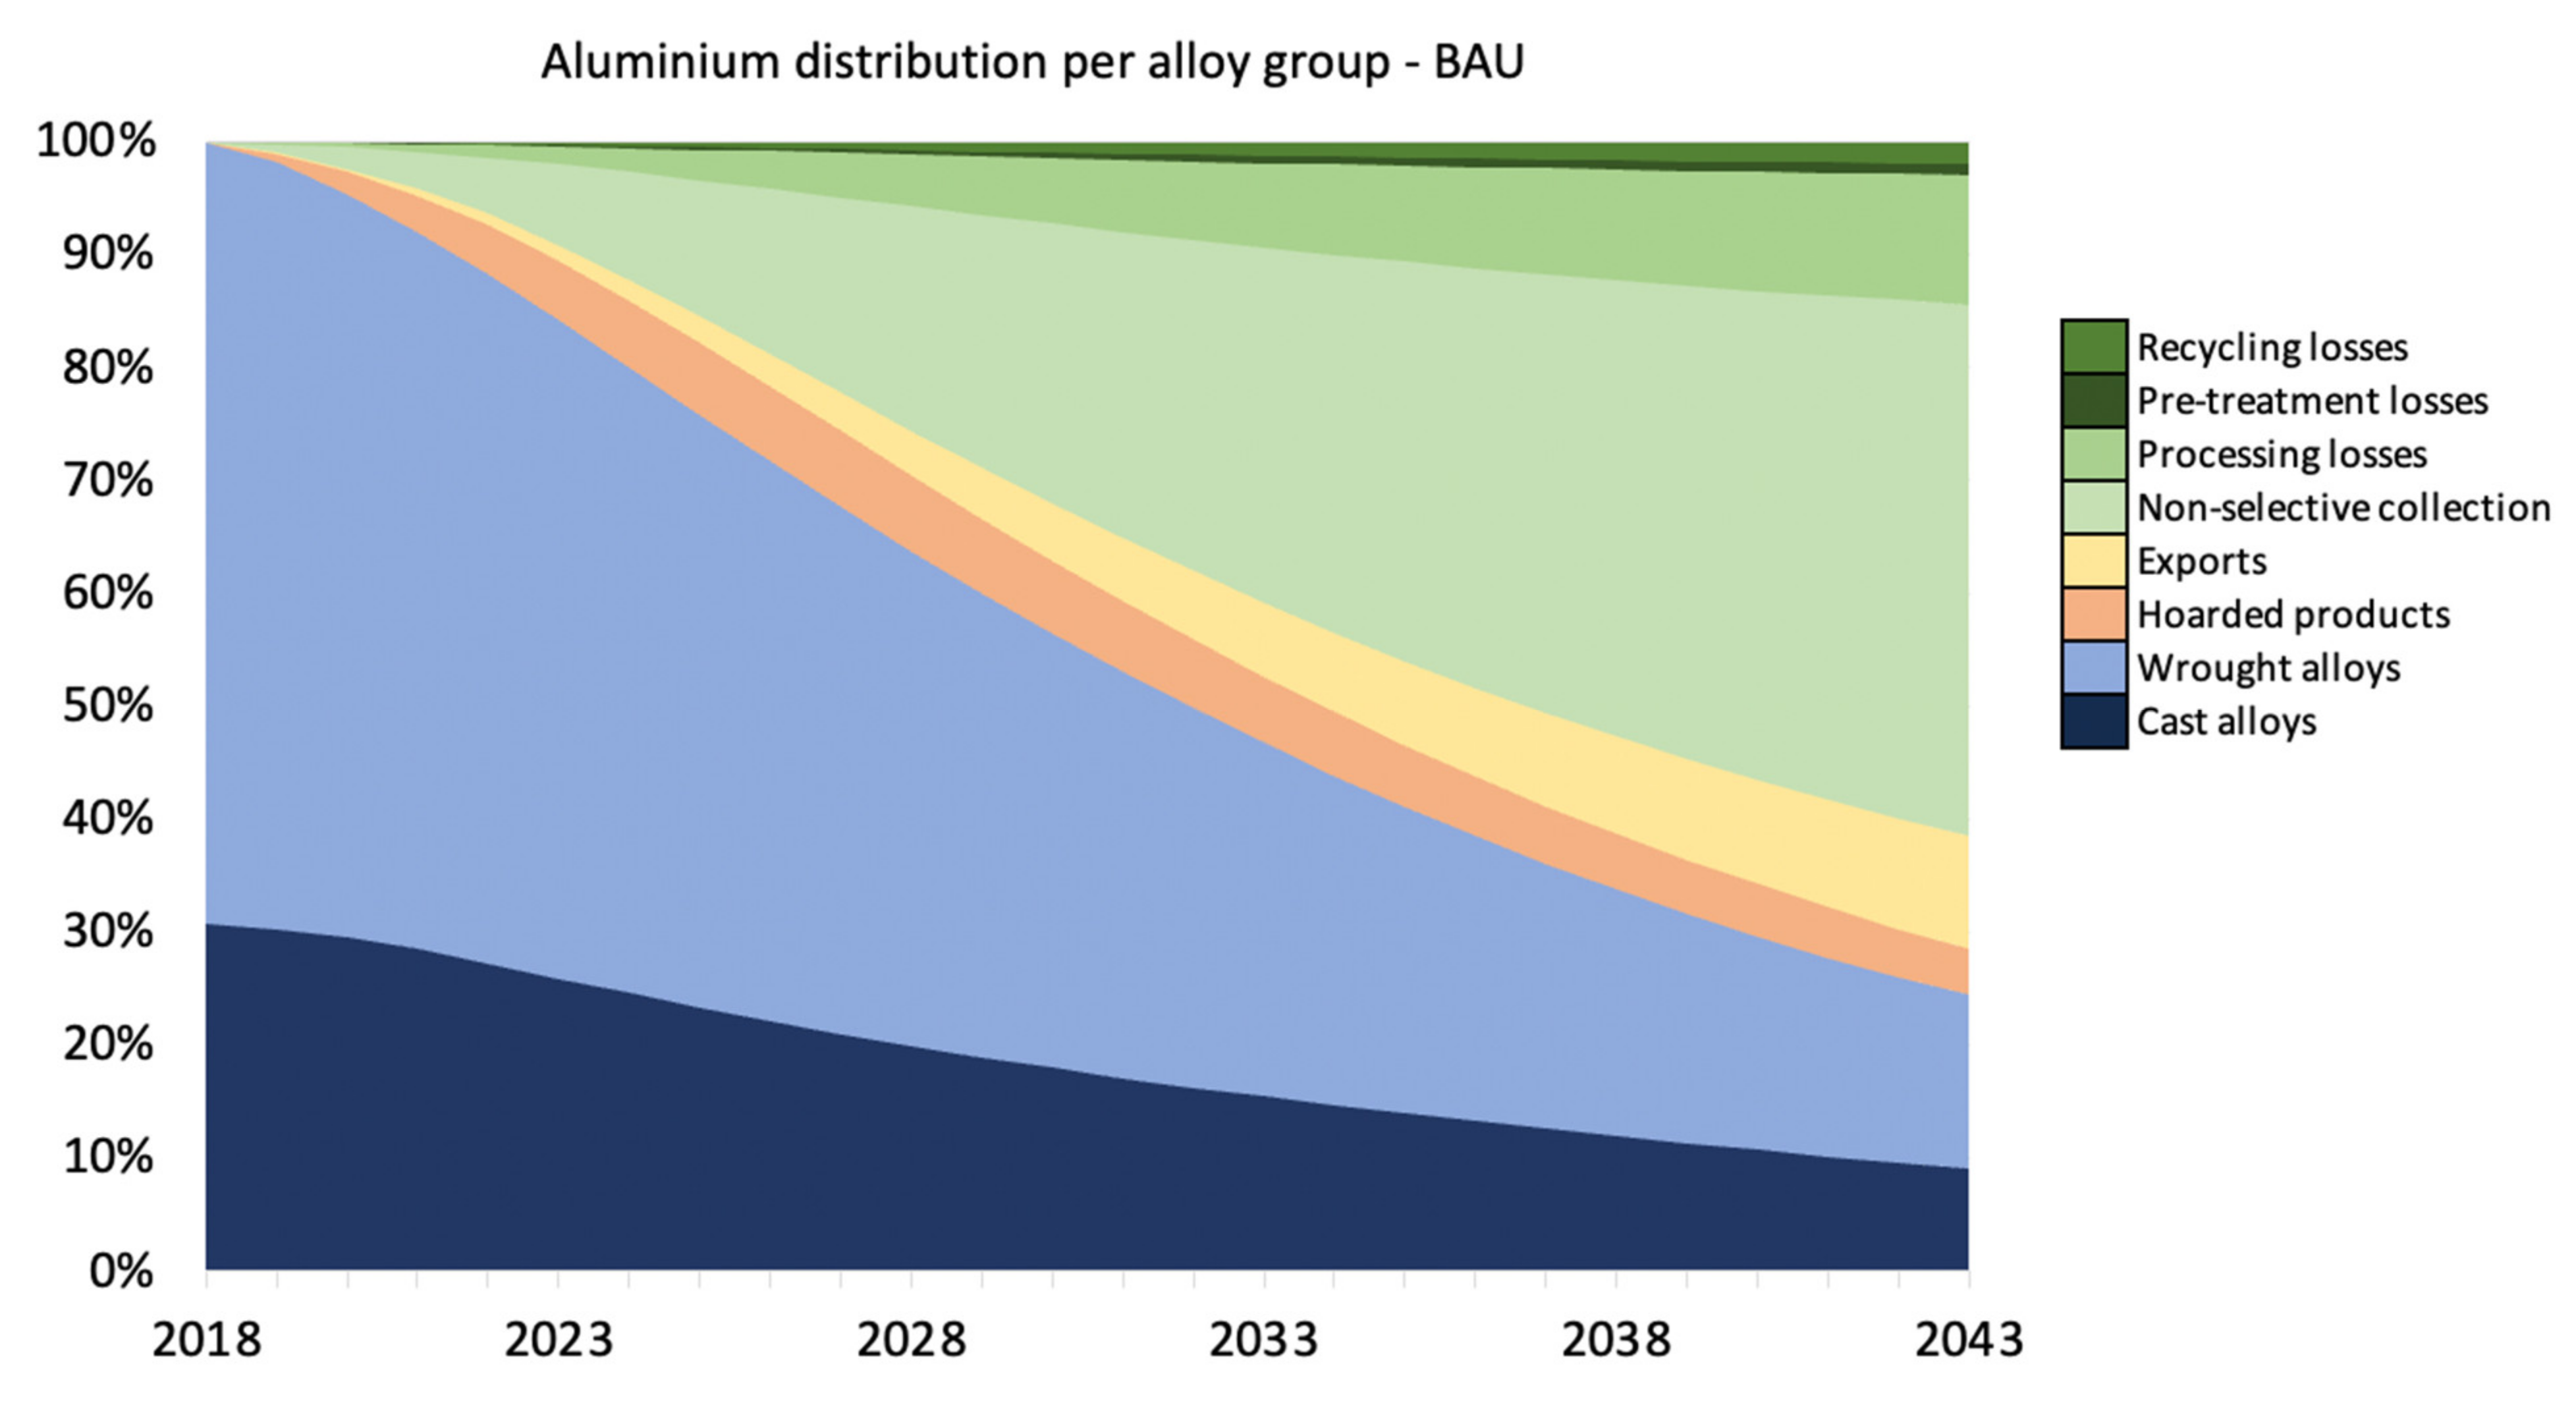
In order to visualize the aforementioned, the BAU scenario was analysed per alloy group, as shown in Figure 3. It can be seen that in 2018, nearly 70% of the alloys used in the product categories are wrought alloys. After 25 years, the amount of wrought alloys decreased by almost 80%, in contrast to the cast alloys, which only decreased by around 67% of the initial amount.
3.2. Alternative Scenario Analysis
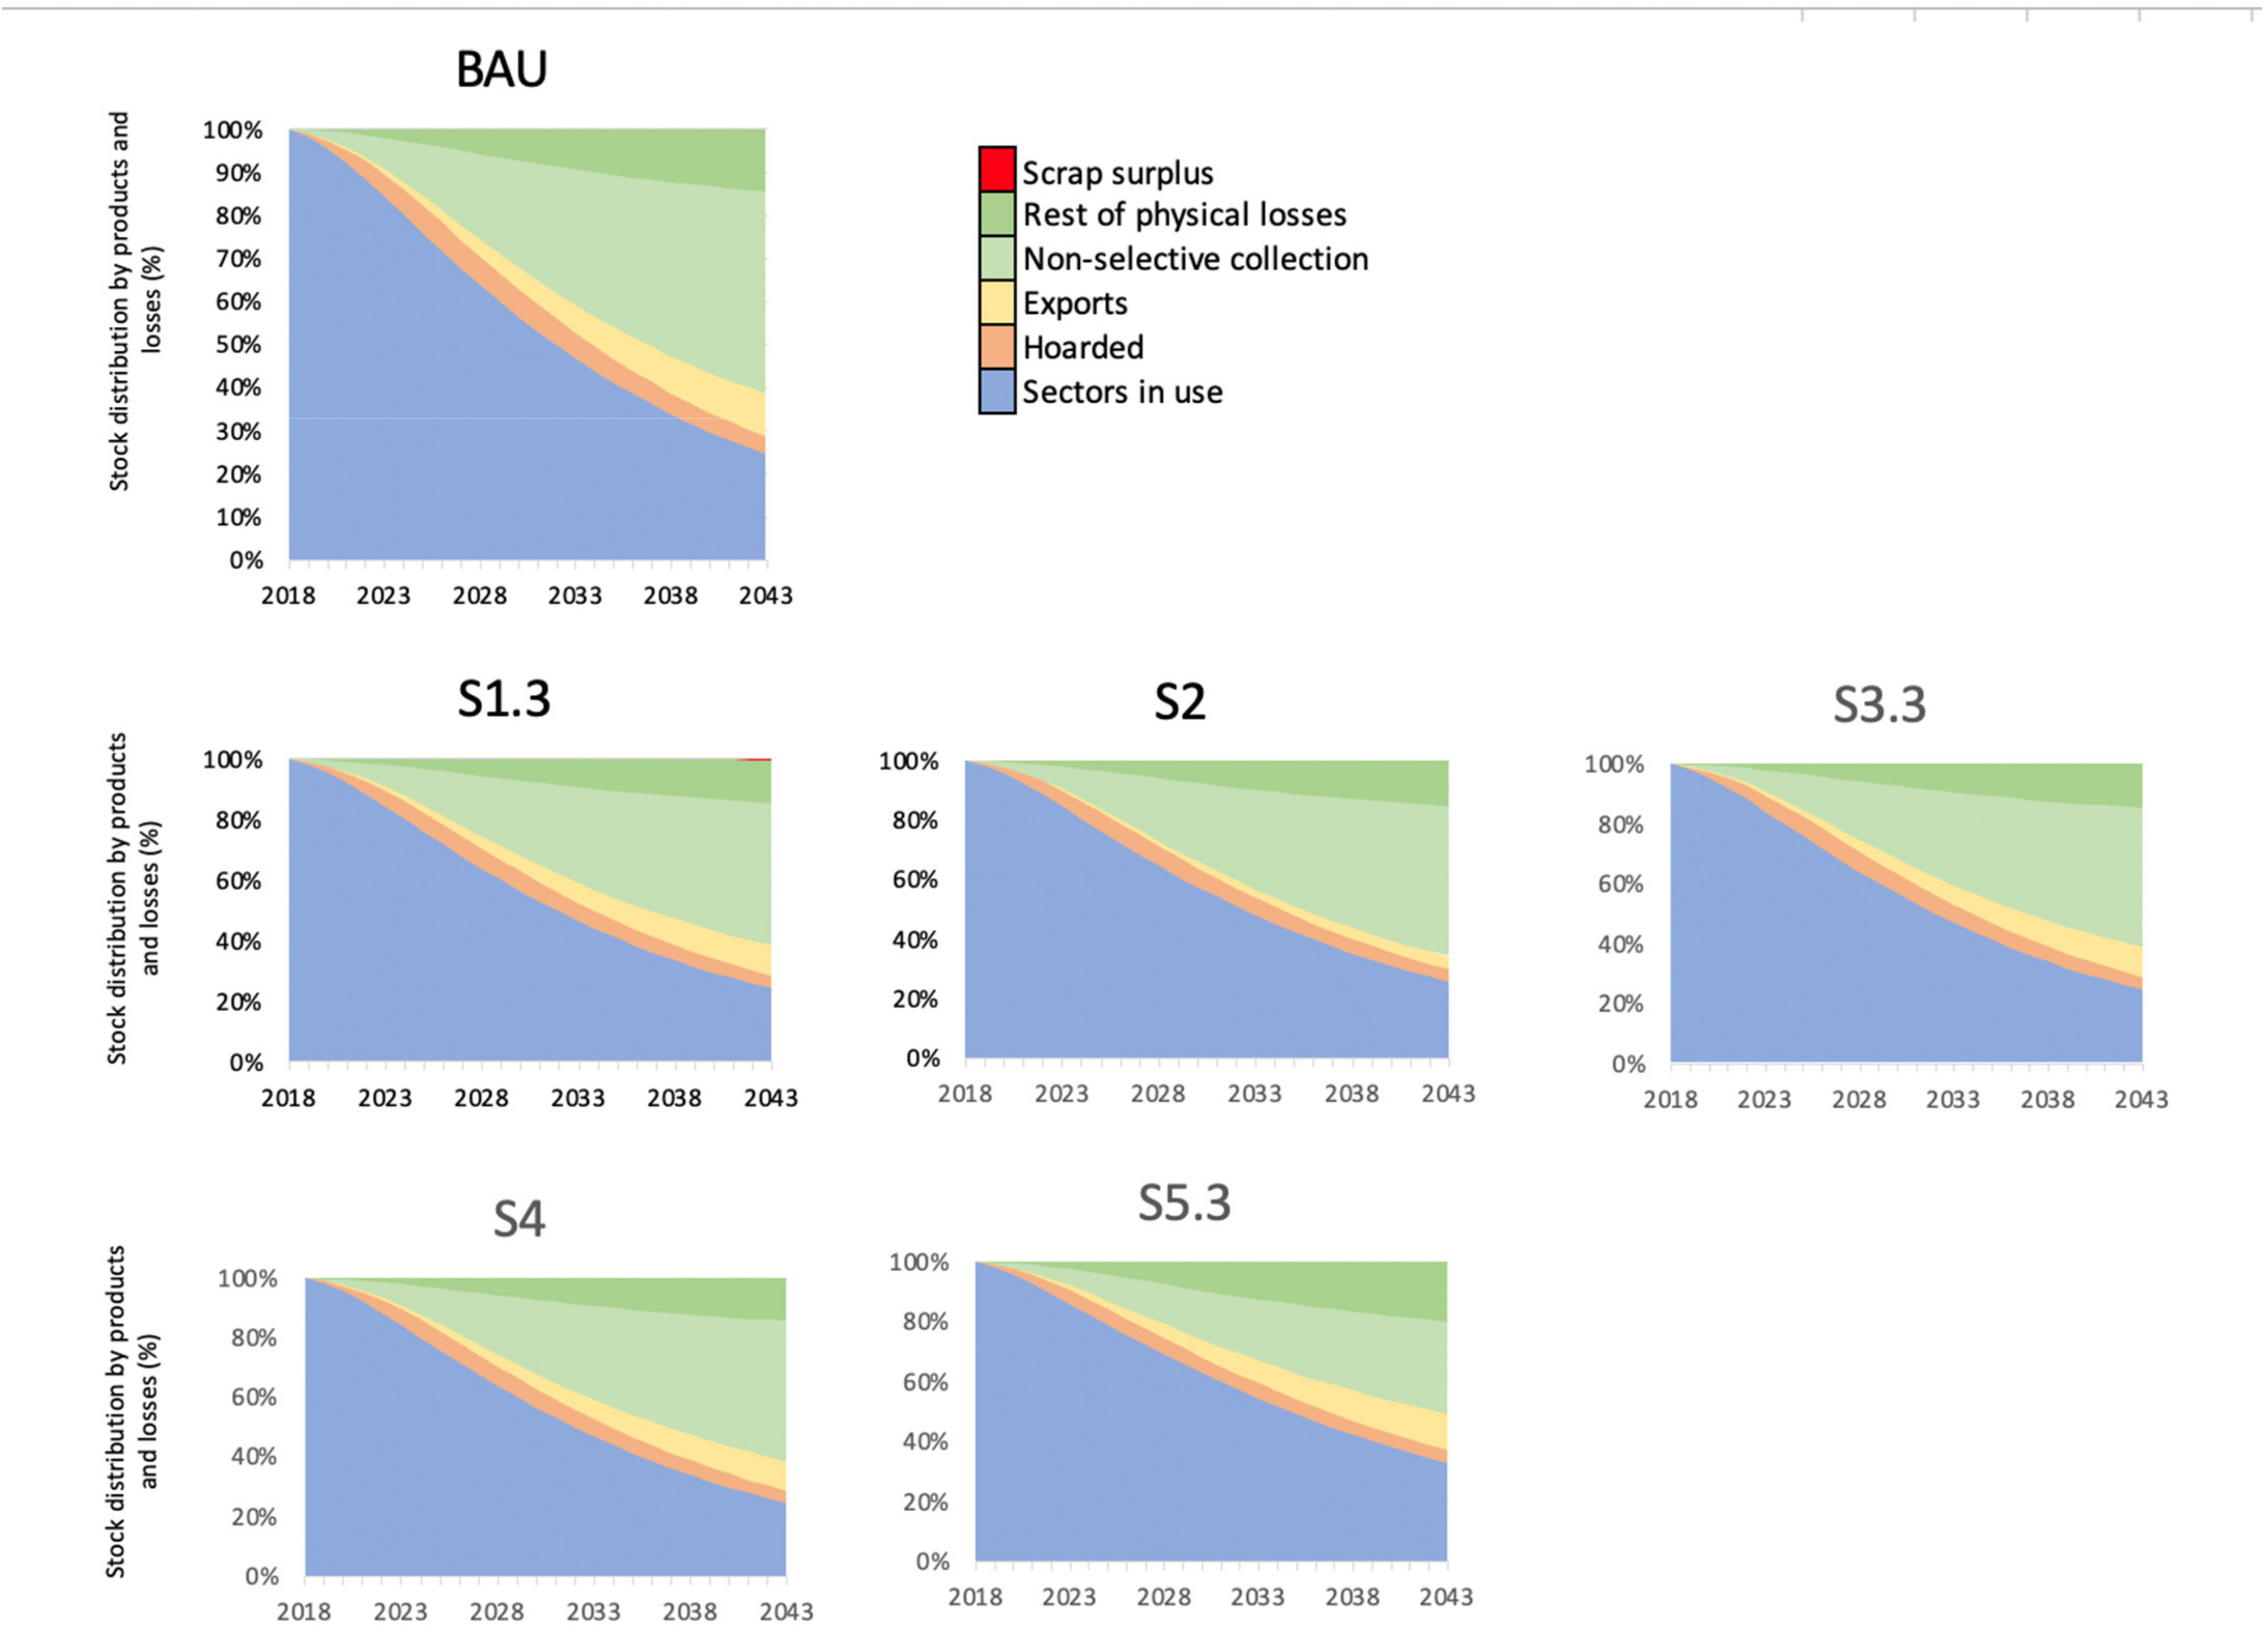
In addition to the BAU scenario, five additional scenarios were analysed. Changes in policy, demand and technology were applied in order to determine their impact on the flows and availability of aluminium. Three of these scenarios were divided into sub-scenarios. In total, 11 sub-scenarios were analysed. Figure 4 shows the comparison between the BAU scenario and the different scenarios analysed. For scenarios S1, S3 and S5 only the third sub-scenario is depicted since these showed the most significant changes. Below there is a description of each.
S1 is based on the report developed by Dokker [27]. The authors indicated that wrought alloys have increased by 8% in the last four years for the transportation sector. According to Løvik et al. (2014) [26], an increment in this alloy category for transportation could result in a scrap surplus. This is understood as the scrap that can no longer be allocated in a product category due to its poor quality [25,26]. Based on this, three sub-scenarios were developed, where wrought alloys increase yearly: S1.1: +5%, S1.2: +8% and S1.3: +16%.
With this modification, the amount of aluminium in use does not present significant changes in comparison with the BAU scenario. However, it has a tendency to decrease. S1.1 and S1.2 show a decrease of 0.11% whereas for S1.3 the decrease is 0.20%. The losses by non-selective collection do not present significant changes either. However, contrary to the in-use stock, it shows a tendency to increase: 0.16% for S1.1 and S1.2 and 0.17% for S1.3. The other possible destination of aluminium does not present substantial changes if compared with the BAU scenario, since as more scrap is discarded due to its poor quality, more is lost.
The three sub-scenarios present a scrap surplus. Nevertheless, the most significant amount is for S1.3 (0.05%, after year 2). These values do not seem representative, especially if compared with the ones reported by Løvik & Müller (2014) [26]. Nevertheless, it is important to mention that the authors considered only the transportation sector at a global scale, with a studied period of 40 years; in addition, other variables such as population growth and increment of vehicle ownership were analysed. With this consideration, the amount of surplus scrap could increase.
In S2, the assumption of no exports of EoL material clearly affects the transition of the material over time. According to Liu & Muller (2013) [9], the international trade of aluminium influence substantially the anthropogenic cycle of this metal. In this work, the export of EoL scrap is considered a loss since this material could be domestically exploited to become secondary material. The results show that the percentage of losses due to export decrease by more than half and the aluminium in use increases up to 26%. Nevertheless, the amount of non-selectively collected aluminium also increases. The reason for this is that if there is no export of EoL scrap, more material is available to be collected and potentially recycled into secondary material. However, the existence of more material available to be collected does not necessarily mean that it will all be recycled. It can be lost due to non-selective collection and the inefficiencies associated with the different processes.
S3 presents three sub-scenarios in order to assess the gradual increase of the collection-to-recycling rates of packaging product categories, according to the EU’s Packaging and Packaging Waste Directive EU 2018/852/ [28]. Packaging represents the third largest sector that uses aluminium in the EU, and unlike other sectors, its short lifetime makes it a readily available source for secondary material [31]. The results show that for sub-scenarios S3.1 and S3.2, there are no significant changes when compared with the BAU. On the contrary, S3.3 shows a total aluminium in use increment of 1% and the overall losses decrease by 1%. A reason for this small change is that the current collection-to-recycling rate is high (65%) with respect to the target proposed by the Directive (70%). Besides, the rates of other product categories remained the same. The other possible destinations of the metal do not present significant changes under this scenario.
Factor such as the collection schemes used in the region and the composition of the different packaging categories [1,31] also influences these numbers. Non-effective collection systems are the major sources of losses and, in a way diminish the advantage these products have regarding their short lifetime. According to the EAA [34], Europeans consume around 50 billion cans in a year. Assuming that all European countries have a similar reality to that of countries with good recycling streams, for example, Austria, only 13 billion cans would be effectively recycled [31], and a considerable amount of material is lost due to non-selective collection.
S4 assesses the demand for aluminium in automobiles. According to the EAA [29], the current content of aluminium in a car is 150 kg, however, it will increase up to 200 kg by 2025 (33% increase). Based on this trend, the demand for aluminium for automobiles was forecasted between 2018 and 2025. It can be seen that despite the demand for the metal increasing in the first seven years, it does not affect the stock distribution of the material in the studied period since no significant differences are found between scenario S4 and the BAU scenario. This behaviour is due to several reasons. The first has to do with the increase of material per year in the period 2018–2025. The overall increment of material is 33%. However, this is translated to a yearly increase of only 0.04%. Even though the share of automobiles is high in comparison with other products (10.3%), the small growth rate of the demand does not affect the stock of material. Moreover, the penetration of hybrid electric vehicles (HEVs), electric vehicles (EVs) and hydrogen fuel cell vehicles into the market is not considered. According to Hatamaya et al. (2012) [13] and the International Energy Agency (2018), stronger market penetration is expected after 2020. Since the model does not take into account the new material that enters the economy after the initial year, that is, 2018, HEVs and EVs were not considered in the study.
However, it is expected that by the introduction of these products, the demand for the metal will increase considerably, affecting the amount of usable aluminium and the amount of discarded cast alloys [13].
Finally, in S5, a perfect collection-to-recycling rate (100%) for all the product categories was assessed. Since these increments happen gradually, three sub-scenarios were developed, with a steady increase per year (5, 10 and 15%, respectively). S5 shows a considerable increase in the aluminium that stays in use, in comparison with the BAU scenario. Under S5.1 it increases up to 31.5%, under S5.2 up to 32.6% and under S5.3 up to 32.8%. Since the collection-to-recycling rate increases, they present a clear decrease of the non-selective collection losses. This is compensated by an increase in the export and the rest of the physical losses, 2 and 6% respectively for S5.3. The reason for this is that when the collection-to-recycling rates increase, the hoarding and disposal rates decrease proportionally. This trade means that more material is available to be collected after its end-of-life, and in consequence, more material is available to be exported as well.
The increment in the physical losses is also related to the amount of material available. After 25 years, the material lost due to production losses represents around 16% (33% more than in the BAU scenario) and the recycling losses around 3% (50% more than in the BAU scenario). The increment in production and recycling losses is because higher collection-to-recycling rates mean more secondary aluminium available for production.
To finalize this section, some words should be said about the evaluated parameters and their impact on the availability of secondary material. According to Rombach (2013) [5], by increasing the efficiency of the scrap collection the availability of secondary material increases, but its impact is significantly smaller than the impact caused by the growth in future demand for aluminium. In that sense, the author indicates that the increasing demand for long-life products such as vehicles or building and construction materials determine the availability of secondary material to be used in the future. According to the author, periods where the demand of the product type is high, together with incomplete collection and production losses, can lead to a shortage of secondary material. Only an ideal scenario of no losses during the collection (as depicted in this scenario), plus an efficient production (i.e., no losses in these processes) and saturation of the market could potentially increase the availability of secondary material and cover the demand [5].
4. Conclusions and Recommendations
The aim of this study was to perform a dMFA of the secondary production of aluminium in the EU based on the methodology of the model MaTrace, in order to assess the transition of the metal and trace its fate and losses in the region in a 25-year period.
Eight sectors and 12 product categories economically relevant for the EU were studied. A baseline scenario was first modelled. The results showed that after 25 years, 24% of the initial aluminium stays in use, 4% is hoarded, 10% has been exported and 61% has been physically lost. The main losses are due to non-selective collection (47%).
Some parameters were modified in order to assess the effect of these in the transition of the metal in the EU. Eleven additional (sub)scenarios were developed considering changes in the collection-to-recycling rates, export of EoL products, demand of aluminium and the increase of wrought alloys. The most significant impacts come from the scenarios where the collection-to-recycling rates increase gradually to 100% and where there are no exports. In these, the amount of aluminium that remains in use increases between 8 and 38%, depending on the case. Remarkably, for all the scenarios analysed, non-selective collection is the major contributor to losses.
From the analysis, it is clear that in order to extend the amount of aluminium that stays in use in the EU, higher collection-to-recycling rates and a lower rate of exports are required. Nevertheless, other factors such as the lifespan of the product types should be considered since this could influence the results.
This study serves as an important base for recommendations to different stakeholders. First, policymakers and aluminium stakeholders can make use of these results to implement measures to increase the availability of aluminium that remains in use. Moreover, the study also highlights to policymakers the importance of transparency and accessibility of the data of the metal, which may allow similar studies to be more accurate in the future. Finally, this work can be a base for future research by the scientific community regarding the flows of the secondary production of aluminium in the EU. Further research may consider the development of a sensitivity analysis focusing on parameters such as the lifetime. In addition, a combination of MFA and life cycle assessment could be done, considering primary and secondary production of aluminium (or other metals) in order to assess the accessibility and quality losses related to the recycling schemes. This research could determine potential sinks and sources of scrap and establish strategies that allow its maximum use. Besides, it would consider the cascading recycling that takes place in aluminium, in which the material ends up in low-quality alloys (cast alloys), addressing in a better way the increasing problem concerning the reduction in the demand for cast alloys.
The model MaTrace allows the identification of critical points that can be used as scientific support to improve existing policy as well as to implement or optimize the processes taking place in the aluminium industry. Nevertheless, the model has some limitations. For instance, it does not consider the aluminium that enters the economy after year 0. Moreover, it is not possible to track the final fate of the lost material. A flow of losses particularly interesting for this investigation corresponds to the non-selective collection losses. This material represents after 25 years, between 30 and 47% of the initial stock of aluminium depending on the case.
Some European countries use incineration as a waste treatment for the residue that was not selectively collected and, currently, a portion of aluminium is recovered from the bottom ashes of the incinerated waste in order to re-integrate it into the recycling process. By tracking these flows of recovered aluminium, the amount of material that stays in use in the region could be influenced.
Furthermore, the model depends on a high number of parameters, which makes the data collection a critical process. The data uncertainties of the required parameters represent another limitation of the model.
Supplementary Materials
The following are available online at https://0-www-mdpi-com.brum.beds.ac.uk/article/10.3390/resources10070072/s1, File SM: Supplementary Material—Tracking the fate of aluminium in the EU using the MaTrace Model.
Author Contributions
Conceptualization, G.J.J.; methodology, G.J.J.; validation, M.F.G.L., R.A.F.A., J.D.; investigation, G.J.J.; resources, G.J.J.; data curation, G.J.J.; writing—original draft preparation, G.J.J.; writing—review and editing, M.F.G.L. and R.A.F.A.; supervision, M.F.G.L., R.A.F.A., J.D.; funding acquisition, J.D. All authors have read and agreed to the published version of the manuscript.
Funding
This research was funded by Erasmus Mundus Association, grant number 586659-EPP-1-2017-1-BE-EPPKA1-JMD-MOB. The APC was funded by the Research Group of Sustainable Systems Engineering (STEN) of Ghent University.
Institutional Review Board Statement
Not applicable.
Informed Consent Statement
Not applicable.
Data Availability Statement
Not applicable.
Conflicts of Interest
The authors declare no conflict of interest. The funders had no role in the design of the study; in the collection, analyses, or interpretation of data; in the writing of the manuscript, or in the decision to publish the results.
References
- Niero, M.; Olsen, S. Circular Economy: To be or not to be in a closed product loop? A Life Cycle Assessment of aluminium cans with inclusion of alloying elements. Resour. Conserv. Recycl. 2016, 114, 18–31. [Google Scholar] [CrossRef] [Green Version]
- EMF. What is Circular Economy? A Framework for an Economy that Is Restorative and Regenerative by Desing. 2017. Available online: https://www.ellenmacarthurfoundation.org/circular-economy/concep (accessed on 8 October 2019).
- EC. Circular Economy Action Plan. The European Green Deal; European Commision: Brussels, Belgium, 2020. [Google Scholar]
- EC. Study on the EU’s list of Critical Raw Materials; European Commision: Brussels, Belgium, 2020. [Google Scholar]
- Rombach, G. Raw material supply by aluminum recycling—Efficiency evaluation and long-term availability. Acta Mater. 2013, 61, 1012–1020. [Google Scholar] [CrossRef]
- Boin, U.; Bertram, M. Melting standardized aluminium scrap: A mass balance model for Europe. JOM 2005, 57, 26–33. [Google Scholar] [CrossRef]
- Bertram, M.; Martcheck, K.; Rombach, G. Material Flow Analysis in the Aluminium Industry. J. Ind. Ecol. 2009, 13, 650–654. [Google Scholar] [CrossRef]
- Capuzzi, S.; Timelli, G. Preparation and melting of scrap in aluminium recycling: A review. Metals 2018, 8, 1–24. [Google Scholar]
- Liu, G.; Müller, D. Mapping the global journe of anthropogenic aluminium: A trade-linked multilevel material flow analysis. Environ. Sci. Technol. 2013, 47, 11873–11881. [Google Scholar] [CrossRef] [PubMed]
- EAA. Environmental Profile Report; European Aluminium: Brussels, Belgium, 2018. [Google Scholar]
- Davis, J. Aluminium and Aluminium Alloys; ASM International: Novelty, OH, USA, 2001. [Google Scholar]
- Paraskevas, D.; Kellens, K.; Dewulf, W.; Duflou, J. Environmental modelling of aluminium recycling: A Life Cycle Assessment tool for sustainable metal management. J. Clean. Prod. 2015, 105, 357–370. [Google Scholar] [CrossRef]
- Hatayama, H.; Daigo, I.; Matsuno, Y.; Adachi, Y. Evolution of aluminum recycling initiated by the introduction of next-generation vehicles and scrap sorting technology. Resour. Conserv. Recycl. 2012. [Google Scholar] [CrossRef]
- Bertram, M.; Ramkumar, S.; Rechberg, H.; Rombach, G.; Bayliss, C.; Martcheck, K.; Liu, G. A regionally-linked, dynamic material flow modelling tool for rolled, extruded and cast aluminium products. Resour. Conserv. Recycl. 2017, 125, 48–69. [Google Scholar] [CrossRef]
- Nakamura, S.; Kondo, Y.; Kagawa, S.; Matsubae, K.; Nakajima, K.; Nagasaka, T. MaTrace: Tracing the Fate of Materials over Time and Across Products in Open-Loop Recycling. Environ. Sci. Technol. 2014. [Google Scholar] [CrossRef]
- Nakamura, S.; Kondo, Y.; Nakajima, K.; Ohno, H.; Pauliuk, S. Quantifying Recycling and Losses of Cr and Ni in Steel Throughout Multiple Life Cycles Using MaTrace-Alloy. Environ. Sci. Technol. 2017. [Google Scholar] [CrossRef] [Green Version]
- Pauliuk, S.; Kondo, Y.; Nakamura, S.; Nakajima, K. Regional Distribution and losses of end-of-life steel throughout multiple product life cycles—Insights form the global multiregional MaTrace model. Resour. Conserv. Recycl. 2017, 116, 84–93. [Google Scholar] [CrossRef] [PubMed] [Green Version]
- Godoy León, M.; Blengini, G.; Dewulf, J. Cobalt in End-of-Life Products in Europe, Where does it End Up?—The MaTrace Approach. Resour. Conserv. Recycl. 2020, 158. [Google Scholar] [CrossRef] [PubMed]
- Wilson, G.; Smalley, G.; Suckling, J.; Lilley, D.; Lee, J.; Mawle, R. The hibernating mobile phone. Dead storage as a barrier to efficient electronic waste recovery. Waste Manag. 2017, 60, 521–533. [Google Scholar] [CrossRef] [PubMed] [Green Version]
- Passarini, F.; Ciacci, L.; Nuss, P.; Manfredi, S. Material Flow Analysis of Aluminium, Copper, and Iron in the EU–28; Joint Research Center—European Commission: Brussels, Belgium, 2018. [Google Scholar]
- National Institute for Environmental Studies. Lifespan Definition. 2020. Available online: http://www.nies.go.jp/lifespan/e_01.html (accessed on 10 April 2018).
- UNEP. Recycling Rates of Metals: A Status Report; UNEP—International Resource Panel: Paris, France, 2011. [Google Scholar]
- Godoy Leon, M.; Dewulf, J. Data quality assessment framework for critical raw materials. The case of cobalt. Resour. Conserv. Recycl. 2020, 157. [Google Scholar] [CrossRef]
- Hatayama, H.; Yamada, H.; Daigo, I.; Matsuno, Y.; Adachi, Y. Dynamic Substance Flow Analysis of Aluminum and Its Alloying Elements. Mater. Trans. 2007, 48, 2518–2524. [Google Scholar] [CrossRef] [Green Version]
- Modaresi, R.; Müller, D. The Role of Automobiles for the Future of Aluminum Recycling. Environ. Sci. Technol. 2012, 46, 8587–8594. [Google Scholar] [CrossRef]
- Løvik, A.; Modaresi, R.; Müller, D. Long-Term Strategies for Increased Recycling of Automotive Aluminum and Its Alloying Elements. Environ. Sci. Technol. 2014, 48, 4257–4265. [Google Scholar] [CrossRef]
- Dokker. Aluminium Content in Cars; European Aluminium Association: Brussels, Belgium, 2016. [Google Scholar]
- EC. Directive (EU) 2018/852 of the European Parliament and of the Council of 30 May 2018 Amending Directive 94/62/EC on Packaging and Packaging Waste. 2018. Available online: https://eur-lex.europa.eu/legal-content/EN/TXT/PDF/?uri=CELEX:32018L0852&from=EN (accessed on 24 February 2020).
- EAA. Lightweighting: A Solution to Low Carbon Mobility; EAA: Brussels, Belgium, 2018. [Google Scholar]
- EAA. Circular Aluminium Action Plan; EAA: Brussels, Belgium, 2020. [Google Scholar]
- Warrings, R.; Fellner, J. Current status of circularity for aluminum from householdwaste in Austria. Waste Manag. 2018, 76, 217–224. [Google Scholar] [CrossRef]
- Cui, J.; Roven, H. Recycling of automotive aluminium. Trans. Non-Ferr. Met. Soc. China 2010, 20, 2057–2063. [Google Scholar] [CrossRef] [Green Version]
- Ciacci, L.; Nassar, N.; Harper, E.; Reck, B. Metal Dissipation and Inefficient Recycling Intensify Climate Forcing. Environ. Sci. Technol. 2016, 50. [Google Scholar] [CrossRef] [PubMed]
- EAA. Aluminum in Packaging; European Aluminium: Brussels, Belgium, 2016. [Google Scholar]
Figure 1.
Representation of the studied system. The life cycle phases and their correspondent parameters are depicted in the colour dashed rectangles and purple rectangles, respectively. Ovals represent the materials, products or waste, and solid rectangles represent processes or sub-processes. The black dashed rectangle represents the system boundaries. EoL: End-of-life, EoS: End-of-Service, WA: wrought alloys, CA: cast alloys. (a) New scrap, (b) Physical losses through inefficiencies of the processes (), (c) Physical losses through post-consumer disposal (V), (d) Economic losses through export. The nomenclature is available in the Supplementary Material.

Figure 2.
Transition of the initial stock of aluminium in final use sectors, hoarded products, exports and losses. *Others include consumer durables, industrial machinery and equipment and others.
Figure 2.
Transition of the initial stock of aluminium in final use sectors, hoarded products, exports and losses. *Others include consumer durables, industrial machinery and equipment and others.

Figure 3.
Transition of the initial stock of aluminium in alloy groups, hoarded products, exports and losses.
Figure 3.
Transition of the initial stock of aluminium in alloy groups, hoarded products, exports and losses.

Figure 4.
Transition of the initial stock of aluminium in use sectors (aggregated), hoarded products, exports and losses. BAU: baseline scenario. S1.3, increase of 16% wrought alloy in the transportation sector. S.2, no export of EoL products. S3.3, increase of collection-to-recycling rate of packaging products by 5% per year. S4, increase of automobile demand by 33% in seven years. S5.3, increase of collection-to-recycling rates of all products by 15% per year.


Table 1.
Previous applications of the MaTrace model.
| Metal | Geographic Boundaries | Author | Year |
|---|---|---|---|
| Steel | Japan | Nakamura et al. [15] | 2014 |
| Cobalt | EU | Godoy León et al. [18] | 2020 |
| Chromium, Nickel and Steel | Japan | Nakamura et al. [16] | 2017 |
| Steel | Global | Pauliuk et al. [17] | 2017 |
Table 2.
Sectors and product categories analysed. The sector “dissipative uses” was merged with the sector “others” due to the lack of information and its low shared percentage.
Table 2.
Sectors and product categories analysed. The sector “dissipative uses” was merged with the sector “others” due to the lack of information and its low shared percentage.
| Sector | Product category |
|---|---|
| Transportation | Automobiles |
| Aerospace | |
| Other transport | |
| Building and construction | Residential building |
| Non-residential building | |
| Packaging and cans | Used beverage cans |
| Mixed packaging | |
| Industrial machinery and equipment | Industrial machinery and equipment |
| Electrical engineering | Cables |
| Other engineering | |
| Consumer durables | Consumer durables |
| Others | Others |
| Dissipative uses |
Table 3.
Modifications applied per scenario. Eleven (sub) scenarios were analysed: three scenarios for S1 where wrought alloys increase 5, 8, 16% respectively. Collection-to-recycling rates (0.2, 1, 5) increases per year only for packaging products a. Increase aluminium demand for 7 years. Afterwards, the demand remained constant b. The collection-to-recycling rates increase to 100% for all product categories c.
| Scenario Number | Scenario Name | Modified Parameter | Modification |
|---|---|---|---|
| S1 | Allocation of secondary material for transportation sector | Allocation of secondary material (matrix D) | Increase of wrought alloy content: 5, 8 or 16% every five years |
| S2 | No EoL products export | Export of EoL products | No export of EoL products |
| S3 | Collection-to-recycling rate packaging directive a | Collection-to-recycling rate | Increase of 0.2, 1 or 5% per year |
| S4 | Aluminium content in automobiles b | Demand | Increase 0.04% per year between 2018–2025 |
| S5 | Maximum collection to recycling rate c | Collection-to-recycling rate | Increase 5, 10 or 15% per year |
Publisher’s Note: MDPI stays neutral with regard to jurisdictional claims in published maps and institutional affiliations. |
© 2021 by the authors. Licensee MDPI, Basel, Switzerland. This article is an open access article distributed under the terms and conditions of the Creative Commons Attribution (CC BY) license (https://creativecommons.org/licenses/by/4.0/).
Share and Cite
MDPI and ACS Style
Jarrín Jácome, G.; Godoy León, M.F.; Alvarenga, R.A.F.; Dewulf, J. Tracking the Fate of Aluminium in the EU Using the MaTrace Model. Resources 2021, 10, 72. https://0-doi-org.brum.beds.ac.uk/10.3390/resources10070072
AMA Style
Jarrín Jácome G, Godoy León MF, Alvarenga RAF, Dewulf J. Tracking the Fate of Aluminium in the EU Using the MaTrace Model. Resources. 2021; 10(7):72. https://0-doi-org.brum.beds.ac.uk/10.3390/resources10070072
Chicago/Turabian StyleJarrín Jácome, Gabriela, María Fernanda Godoy León, Rodrigo A. F. Alvarenga, and Jo Dewulf. 2021. "Tracking the Fate of Aluminium in the EU Using the MaTrace Model" Resources 10, no. 7: 72. https://0-doi-org.brum.beds.ac.uk/10.3390/resources10070072
Note that from the first issue of 2016, this journal uses article numbers instead of page numbers. See further details here.