1. Introduction
The building sector accounts for about 38% of the annual greenhouse gas emissions and around 40% of the global energy demand [
1,
2]. About 70 to 90% of the energy consumption corresponds to the operation of buildings, while the embodied energy accounts for 10 to 30% [
3]. New policies and strategies such as net-zero buildings try to reduce the energy consumption of the service life of buildings, although they exclude the embodied carbon of the construction materials, which can account for up to 11% of the global GHG emissions [
4].
In addition to the energy needs of the building sector, it consumes large amounts of resources. In 2018, resource use dedicated to housing and infrastructure accounted for 40% of the total global material use [
5]. The construction industry is among the primary water users [
6], while construction and demolition waste is the most significant waste stream in the EU [
7]. With a rising world population, from 7.7 billion in 2019 to a projected 8.5 billion in 2030 [
8], housing needs will further stress an already strained resource situation. In summary, the construction sector faces risks related to climate change, such as rising carbon taxes, and has great potential to contribute to decarbonising the economy, reducing resource use, and reducing construction and demolition waste [
9].
Bio-based materials can contribute to CO
2 reduction during the service-life of buildings through better thermal insulation, while materials themselves can act as a temporary carbon sink and the manufacturing process of the materials can be even more energy-efficient than conventional building materials [
10,
11]. Since first-generation bio-based materials can strongly contribute to direct and indirect land-use changes and thus to high environmental impacts, second-generation bio-based materials such as lignocellulose residues, in particular, are seen as having great potential to replace conventional products with significantly lower environmental impacts [
12,
13,
14]. The challenges in the material and energy use of lignocellulose relate to the resistance in breaking down into individual components including lignin, cellulose, hemicellulose, and tannin; the large variability of the different structures and chemical compositions due to genetic and other environmental influences; and the large number of different sugars released from the breakdown of cellulose and hemicellulose [
15]. While much research in recent years has focused on the use of agricultural residues [
16,
17], less attention has been paid to the use of bark in high-value applications. Bark could also be a valuable raw material for producing high-quality products such as adhesives, resins, plastics, or bioethanol [
18,
19]. Lacoste et al. [
20], for example, showed that spruce bark-based insulation foam from condensed tannins has excellent mechanical resistance at low thermal conductivity and low density. Arias et al. [
21] compared the environmental impacts of different wood panel adhesives and found the lowest impacts for a residual bark-based solution. Santos et al. [
22] performed a life cycle analysis on a cross-insulated timber panel with a conventional PU foam as an inner insulation layer. Sinka et al. [
23] presented different magnesium-hemp multi-layer construction panel types and compared their GHG emissions to conventional references. While many approaches in the field of bio-based construction materials adequately address the environmental and economic dimension [
11,
14,
24], Ingrao and colleagues [
25] observed a shortcoming in the assessment of the social dimension, mainly due to a lack of data for modelling the social dimension. To avoid a shift of burden, the transition to a post-fossil society, which uses bio-based residues to substitute conventional materials, must be evaluated from the perspective of the three dimensions of sustainability [
26].
This paper’s main goal is to describe the development of a novel and bio-based multi-layer construction panel and to present both a comparative life cycle sustainability assessment and a mechanical property assessment. The forestry residue coniferous bark serves as the main feedstock and delivers all chemically essential components for producing the plywood board based on bio-resins, the insulation foam based on bioesterpolyol, and the bioesterpolyol-based adhesives for the final panel bonding. The production of all components is based on processing methods that were upscaled by different companies and research facilities throughout the REHAP project from 2016 to 2021 [
27]. This work contributes through a description of the whole production process of a bio-based multi-layer panel, starting with the resource provision, the value-adding steps for the production of the functional components, and up to the production of the final product.
Since bark is the focal feedstock, this work also provides insight into how the full utilisation of the individual bark components can take place in a bark-based biorefinery. In order to compare the technical, economic, and environmental characteristics of the developed multi-layer panel with conventional benchmark panels, a life cycle sustainability assessment (LCSA) and a measurement of the technical characteristics are carried out. Regarding the social perspective, no benchmarking is carried out due to the difficulty of adequately assessing the benchmark products’ social aspects. The LCSA is performed by standard methodologies to highlight potential benefits and burdens of the novel product compared to two selected conventional benchmarks. This work is a comprehensive and multidimensional assessment of a future-oriented construction material based on the raw material bark, and attempts to answer the following research question:
RQ: How does a novel bio-based multi-layer panel perform technically, economically, and environmentally compared to conventional, fossil resource-based benchmark panels?
The introduction is followed by an explanation of our methodology that describes the study’s goal and scope, the system boundaries and the considered value chain steps, the life cycle sustainability assessment, and the measurement of the technical properties. The results follows this section. The article ends with a discussion and conclusion that situates the findings within the existing literature and places them in a larger scope.
2. Materials and Methods
The research question is answered by a description of the production process, a comparative Life Cycle Sustainability Assessment (LCSA) with selected benchmark systems, and an analysis of the technical properties. The LCSA is carried out by a Life Cycle Assessment (LCA), a Life Cycle Costing (LCC), and a Social Life Cycle Assessment (S-LCA), which are methodologies that follow the Life Cycle Assessment framework defined in the ISO 14040 and ISO 14044 standards. LCA frameworks consist of four steps: Goal and Scope Definition, Life Cycle Inventory, Impact Assessment, and Interpretation of the Results. LCA is a standard method for studying the environmental impacts of construction products, with the first studies dating back to the 1980s [
28]. LCC studies for the construction sector have also been conducted, with the first definitions of this methodology dating back to the 1960s [
29]. Social impact evaluations are a more incipient methodology and there are still discussions on the most suitable methodology [
30]. However, several studies already exist in which different methodologies or frameworks have been developed to evaluate social impacts in the construction sector [
31,
32]. More recently, the integrated LCSA has been used in the construction sector. In [
33], for example, the authors applied a holistic LCSA to the production and recycling of concrete and timber production. The methodology has also been used to assess bio-based products across different sectors [
34,
35,
36].
2.1. Goal and Scope
The goal of this study is the evaluation of the sustainability performance of a bio-based, multi-layer building panel compared to benchmarks primarily based on fossil resources. The system boundaries of the presented layer and the benchmark systems follow a cradle-to-gate approach and include both the raw materials extraction and the production process. The environmental and economic features of the developed multi-layer panel are compared to two different benchmarks with similar characteristics by LCA, and LCC Benchmark 1 is a conventional sandwich panel (i.e., SIP panel) composed of plywood (density of 450 kg/m3), XPS foam, and a fossil-based PU adhesive. Benchmark 2 is a multi-layer panel similar to the bio-based one but is based on fossil-based components. Indeed, in the latter case, PU components (foam and adhesive), including fossil-based esterpolyols and plywood boards with phenol-formaldehyde resins as binders, are considered. In particular, a different formulation for fossil-based esterpolyols is taken into account, depending on their target application, i.e., foams or adhesives. While fossil-based esterpolyols for foams include diethylene glycol and phthalic anhydride as monomers, benchmark esterpolyols for adhesives include fossil-based 1,4-BDO and adipic acid. For the social LCA, the assessment of the social impacts linked to the bio-based panel was performed. The results of the social assessment are only given qualitatively as comparable social assessments were not available for the conventional benchmark panels.
An appropriate functional unit is the key to providing a consistent comparison between different product systems. In the case of the presented multi-layer insulation panel, it is vital to consider the properties and functionality of the panel. Consequently, the functional unit selected for this study is the production of 1 m
2 of multi-layer panels with technical properties that exceed the Compressive and Tensile Strength UNE EN Standards. The selection of this functional unit is in line with similar LCA studies on composite structural panels [
23,
37] and is the common functional unit in the EPD program for construction products.
Primary data was provided first-hand by the industrial companies involved in the different stages of the production chain. For the LCA, background data was mainly sourced from LCI databases such as the Ecoinvent databases version3.6 [
38] or GaBi databases, scientific papers, and industry-average and government statistics sources (e.g., Eurostat). The geographical scope of the project is the EU but was not limited to EU countries. For places where no geographical information was available, relevant European databases were used (e.g., Eurostat). Regarding the temporal representativeness, primary data used in this study represents current production technologies and standard operations for the biorefining sector, whereas secondary data retrieved from the GaBi database is representative for the years from 2010 to the present. The different scenarios were modelled and evaluated using the software GaBi, version 9 [
39]. The production of co-products was handled using subdivision or system expansion when possible (ILCD). When these alternatives were not available, economic allocation was used to allocate the impact to the different co-products in the process. For the LCC, the use of economic allocation was convenient due to the intrinsic economic nature of the assessment [
40]. Finally, for the SLCA, allocation was deemed irrelevant due to the nature and scope of social data [
41]. The target audience includes researchers from academia, industry representatives of the biorefining and construction sector, environmental and socio-economic analysts, and other potential stakeholders interested in both the circular economy and the sustainability of new materials.
2.2. System Boundaries and Description of the Production System
Figure 1 shows the value chain of the multi-layer panel production with focus on the foreground processes, namely the refining of bark. The primary refining process extracts tannins, lignin, and sugars from spruce bark [
42]. After a preliminary shredding step, the ground sawmill spruce bark is processed through hot water extraction. A water-bark mixture is heated up to 90 °C, thus separating tannin-rich fractions and a bark residue containing mainly lignin, residual tannins, and sugars. Tannins-rich fractions are clarified by centrifugation and tannins are then concentrated through a falling film evaporator to obtain a purified tannins extract.
The bark residue undergoes a soda cooking step, where it is fed together with NaOH solution (50% w/w) and water, and the mixture is heated up to 160 °C by direct steam injection (6–7 bar). The resulting soda slurry is fed into a decanter to separate the lignin-rich black liquor from cellulose fibres. While the black liquor is sent for lignin separation steps, the cellulose fibres are firstly washed and then sent to a saccharification process with a specific enzyme cocktail to obtain a sugars-rich solution from which sugars are extracted and concentrated (sugar stream: 78.2% w/w dry matter; 321.7 g/L glucose; 49.65 g/L xylose). The resulting carbohydrates fraction is then converted through fermentation processes into the diols 1,4-BDO and 2,3-BDO to be used as bio-based intermediates and bio-based dicarboxylic acids for the production of bioesterpolyols for BioPU foams and bioPU adhesives, respectively. The phenolic fraction derived from bark (Lignin I) is used in the production process of biophenolic resins, during which this bio-based component is mixed and reacts with phenol and formaldehyde; in particular, a 50% substitution of the phenol mass with biophenolic fraction is applied, compared to a benchmark product, i.e., phenol-formaldehyde resin.
The biophenolic resins are used as glue in the production process of plywood boards. In the latter process, pine logs are debarked and chipped to obtain wooden chips with the required dimensions to undergo the subsequent steps, i.e., chip digestion with water and defibration. After these steps, biophenolic resins are blended with the fibres before the pressing phases, during which preliminary plywood boards are obtained. The final plywood boards are the result of the following stabilisation, sanding, and cutting stages. A dedicated boiler is used to burn several wood-based residual streams and thus provide steam, hot thermal oil, and hot gases to the main processes.
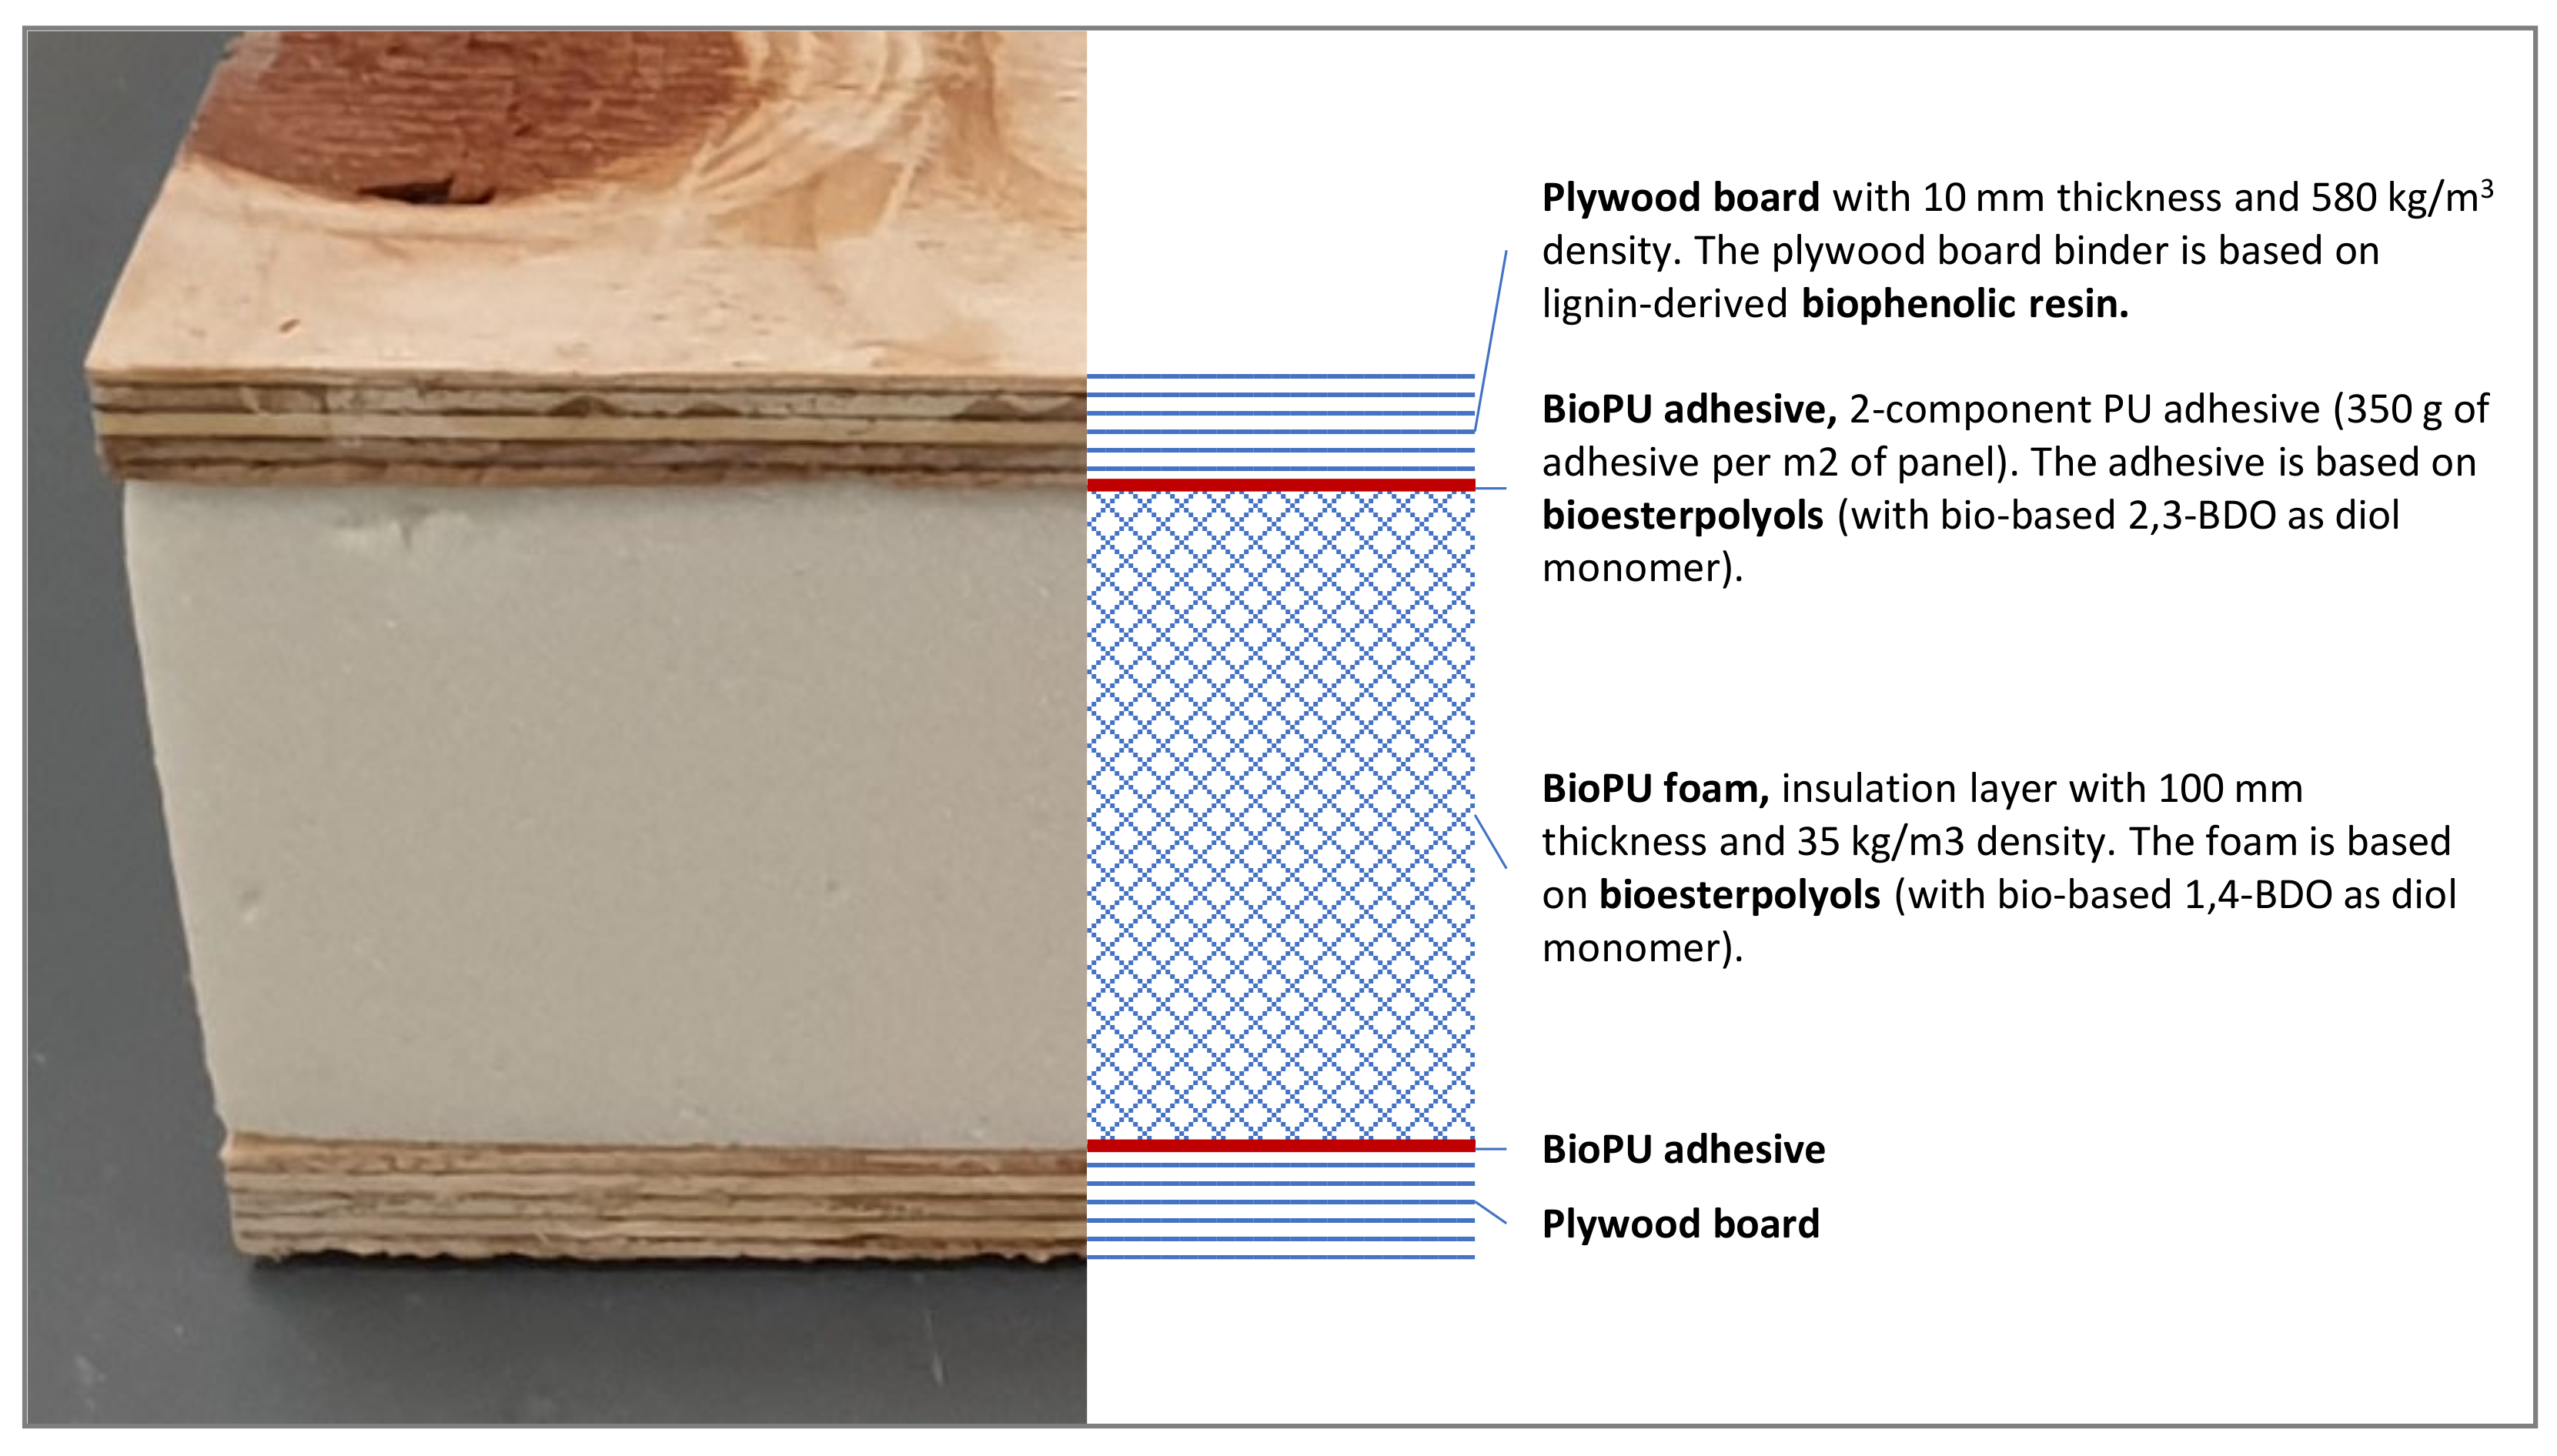
Figure 2 shows the bio-based multi-layer panel prototype with a detailed description of the functional components. The multi-layer is composed of three bark-based components, namely the plywood board based on lignin-derived biophenolic resin, the bioPU foam based on bioesterpolyols, and the bioPU adhesive based on bioesterpolyols, which bond the plywood board and foam. For the final production of the multi-layer panel, the whole system undergoes a hydraulic press for 4 h at a pressure of 3 kg/cm
2. The process is similar to a SIP panel production based on plywood (with a different density compared to the one used in the bio-based multi-layer panel) and an XPS foam.
The system boundaries include the phases of the product’s life cycle from the raw material extraction to the factory gate (“cradle-to-gate” approach). The system is divided into two subsystems: a foreground system and a background system, as schematised in
Figure 1. The foreground system consists of processes under the control of the decision-maker for which the study is carried out on, i.e., bioPU adhesive, plywood board, bioPU foam value chains, and panel manufacturing. The background system represents all up and downstream processes connected to the foreground system, namely the raw material and energy production, transportation, and waste treatment and disposal.
2.3. Feedstock Availability
Coniferous bark is the focal feedstock for producing the functional components of the multi-layer panel, the plywood board, the bioPU foam, and the bioPU adhesive. Coniferous bark typically consists of about 25% cellulose, around 10% hemicellulose, about 30% lignin, and around 10% tannin. Bark as feedstock for biorefineries has several advantages. These include the mainly low-value use as combustion for energy recovery or surface mulching, its low price, and its high availability and accumulation in large volumes at discrete locations (sawmills and both pulp and paper mills), which facilitates the feedstock collection. Since spruce and pine, in particular, are used in large quantities among softwoods, the residual bark stream can furthermore be described as relatively homogeneous, which is beneficial for its valorisation in biorefineries [
43]. The average annual bioeconomic potential of coniferous bark in the EU28 from 2015 to 2018 is supposed to be around 14.6 Mt dry matter, of which 7.6 Mt is supposed to be spruce bark and 7 Mt is supposed to be pine bark (calculation based on [
43,
44]). In the bioeconomic bark potential, all wood industry residues (excluding firewood) are considered, hence bark residues of sawmills, pulp and paper mills, and other wood industries.
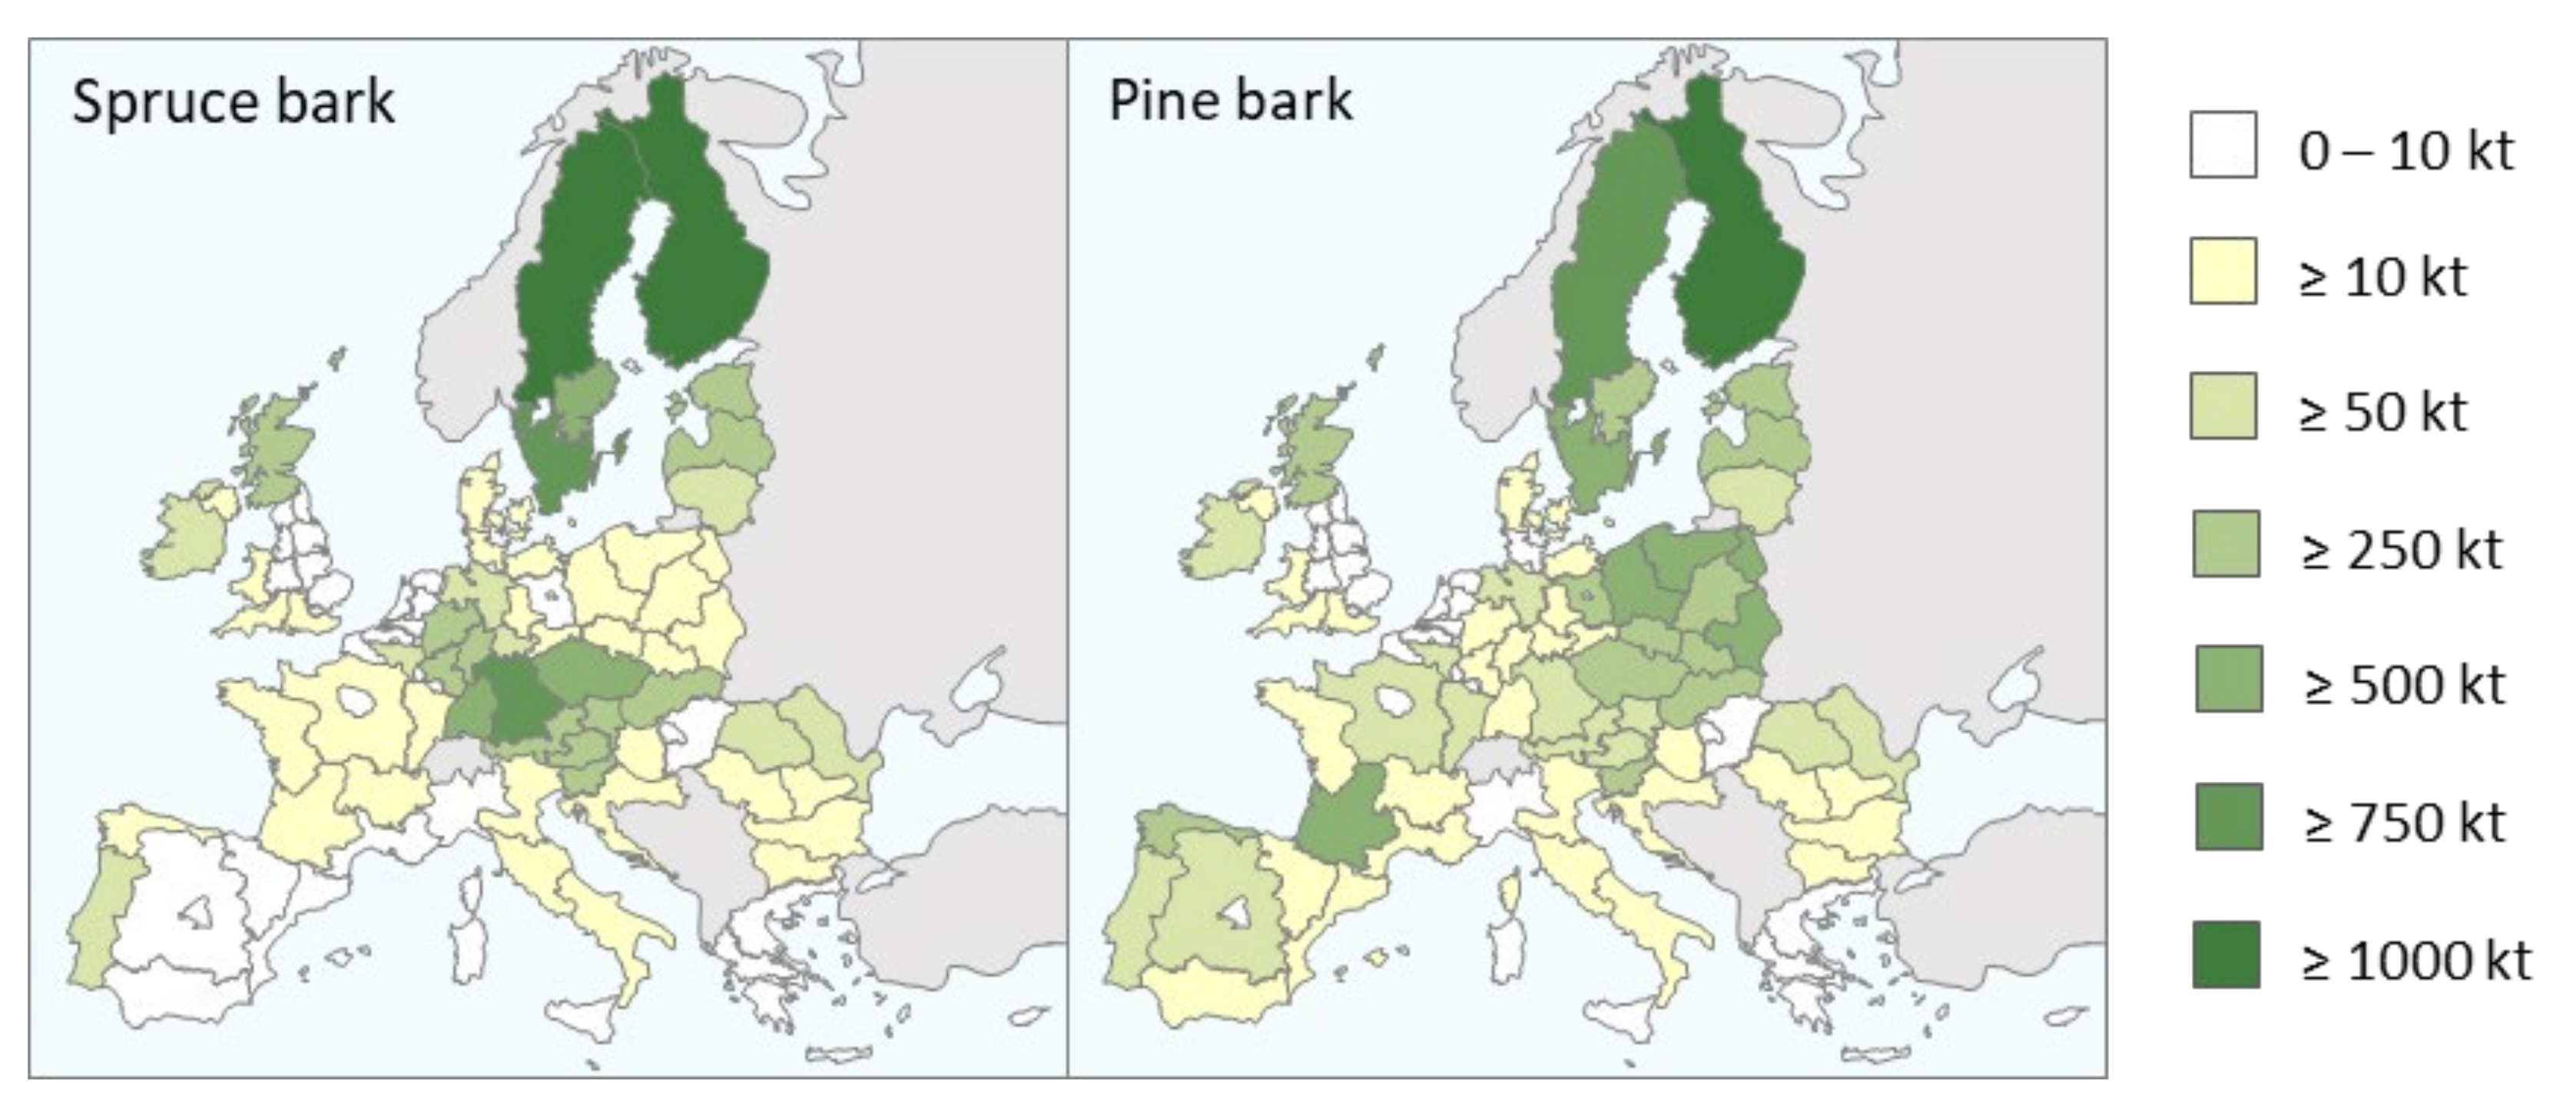
Figure 3 shows the regional distribution in the EU28. The main spruce bark potentials can be found in Sweden (2.2 Mt), Germany (1.5 Mt), and Finland (1.3 Mt), and the main pine bark potentials are in Poland (1.4 Mt), Sweden (1.3 Mt), and Finland (1.2 Mt). The tannin and lignin for producing the biophenolic resins, and the sugar for the production of 1,4 and 2,3-BDO of the underlying research work are obtained in a primary refining step from Scandinavian sawmill spruce bark. Pinewood is used for the production of the plywood board.
2.4. Technical/Physical Properties
For a meaningful comparison of the bio-based panel with the two benchmarks, comparable technical and physical properties with regard to the functional unit are necessary. Therefore, this study includes the evaluation of the technical properties of the multi-layer panel. In this study, the performance tests focused on the two properties tensile strength and compression strength. The sandwich panel samples consist of plywood covers on both sides and the bio-based polyurethane core bonded with the bio-based adhesive. To determine the tensile strength, the test performed was the tensile test perpendicular to the panel faces according to the test procedure described in UNE-EN 14509:2014 (amended version, 2016). The self-aligning plates were bonded to the surfaces of each specimen using two-component epoxy adhesive. The tensile test was carried out at room temperature and the tensile strength perpendicular to the panel sides evaluated the tensile modulus. Breaking modes of the sample can be cohesive (core breaking or higher adhesive line bonding) or adhesive (detachment between different components).
To determine the compressive strength, the compression resistance and modulus test were performed according to the test procedure described in UNE-EN 14509:2014 (amended version, 2016). The compression test was carried out, calculating the compression strength and compression modulus at 10% of deformation. When breaking occured before that 10%, the values given were the ones that correspond to that point. For both tests, ambient conditions were kept constant at a temperature of 23 °C and 50% relative to the humidity. The mechanical testing was performed on six different samples which varied in terms of the adhesive quantity, the bonding pressure, and the formulation of the BioPU foam (PU 1 with ρ = 30.53 ± 0.53 kg/m
3 and PU 2 with ρ = 26.35 ± 0.98 kg/m
3). The selection of the different test samples was based on achieving the best configuration of materials (foam/adhesive/plywood board) and the optimum conditions of application, curing, and pressing, considering the physical and chemical properties of the different elements. Sample preparation started with cutting the PU foams and plywood boards to the desired size to manufacture the specimens according to the size required by the standards. This step was followed by sanding the plywood surfaces to improve adhesion in the next stage, i.e., applying the adhesive. Finally, the multi-layer panel was assembled using a pressing process.
Table 1 shows the different test samples and the different pressures that were tested to determine the optimum application pressure.
2.5. Life Cycle Sustainability Assessment
In the following sections, the three pillars, namely the Life Cycle Assessment, Life Cycle Costing, and Social Life Cycle Assessment of the integrated assessment methodology, are described and reported separately. Each section includes a Life Cycle Inventory (LCI), a section on the assumptions and limitations, and a description of the applied Life Cycle Impact Assessment (LCIA) method. The central part of the data associated with this work was collected throughout the REHAP project.
2.5.1. LCA
Life Cycle Assessment (LCA) is a structured, comprehensive, and internationally recognised technique for assessing the environmental aspects of a process or a product (i.e., good or service) and the potential environmental impacts throughout the product’s life cycle. The goal of this study’s LCA was to evaluate the environmental performance of a bio-based, multi-layer building panel compared to specific benchmarks from a cradle-to-gate perspective. Primary data was collected through questionnaires, while secondary data was gathered through LCI databases (GaBi database (ts) and Ecoinvent database v3.6), as well as through literature research.
Table 2 contains all the data used for the assessment of both the bio-based and benchmark solutions, but not referring to the functional units and net of recycled streams and recovered energy.
In the framework of environmental assessment through LCA, several assumptions were introduced at different stages of the assessment. In particular, bark was considered as a secondary material with no environmental impacts/benefits (e.g., due to carbon storage) associated with it (“zero burden approach”) [
45]. Moreover, the calculation of the biogenic carbon uptake and release linked to the raw materials production followed the Product Environmental Footprint (PEF) approach, as described in [
46] (i.e., only biogenic methane emissions are modelled). Considering the need to properly integrate several processing steps implemented at different scales along the value chains, some assumptions regarding the scale-up and optimisation of the targeted processes were introduced, in particular regarding the treatment and recirculation of liquid residual streams, as well as the incineration of solid residual streams left after wastewater treatments. Moreover, solid residual streams originated from within the primary refining (e.g., after solid–liquid separation steps) were assumed to be sent to an “internal” boiler for energy recovery (efficiency 0.9) and their calorific values were estimated according to [
47]. Bio-based adipic acid (data retrieved from [
48]) was considered as a monomer for bioesterpolyols production instead of as bio-based azelaic acid, for which no data or datasets were available. Regarding multifunctional processes (e.g., primary refining and 1,4-BDO production), economic allocation among the main and co or by-products was applied.
Among the impact categories recommended by the PEF Guide 2013 [
46], the eight impact categories acidification, climate change, aquatic freshwater eutrophication, aquatic marine eutrophication, terrestrial eutrophication, ozone depletion, photochemical ozone formation, and resource-use energy carriers were selected for this study based on their relevance for the assessed processes. These are related to resource use and emissions of environmentally damaging substances (e.g., greenhouse gases and toxic chemicals), which may affect human health. Impact assessment methods use models for quantifying the causal relationships between the material/energy inputs and the emissions associated with the product life cycle for each impact category considered. Each category hence referred to a particular stand-alone impact assessment model. The two optional steps of the Impact Assessment phase, namely normalisation and weighting, were not considered in this analysis.
2.5.2. LCC
Similar to LCA, Life Cycle Costing (LCC) is a method that summarises all the costs associated with the life cycle of a product (or service) that are directly covered by one or more of the actors involved in the product life cycle (e.g., supplier, producer, user/consumer, and end-of-life actor). Life Cycle Costing can be used as a stand-alone tool or can be used in the broader context of the sustainable development of a product, together with environmental LCA and social LCA. As for LCA, primary data for LCC were gathered from REHAP partners through questionnaires, while secondary data were mainly retrieved through the literature research.
Table 3 contains all of the data and information that were used for the assessment of both the bio-based and benchmark solutions, addressing the raw material and energy costs, as well as the personnel and equipment costs.
The assumptions and estimations introduced for LCA were also valid for the LCC. Specific hypotheses have also been considered in the framework of the economic assessment through LCC, particularly related to the annual maintenance costs. Those were assumed to be 1% of the overall CAPEX for bio phenolic resin production and multi-layer panel assembly (value based on primary data provided by REHAP project partners [
27]), and 3% for all other processes upstream from the value chain (literature-based average value for different biorefinery concepts [
49,
50]).
2.5.3. S-LCA
The Social Life Cycle Assessment (S-LCA) is a social impact assessment technique that aims to assess the social and socio-economic aspects of products and their potential positive and negative impacts along their life cycle. The S-LCA of this study is based on UNEP/SETAC guidelines. The guidelines provide impact indicators that are differentiated in stakeholder categories, which are supposed to be the main groups possibly impacted by a product’s life cycle [
51]. The relevant stakeholder categories were identified according to the current study’s research objectives, system boundaries, and data availability. Due to selecting a “cradle-to-gate” approach, the stakeholder category “Consumers” was not included in the system boundary and therefore not considered.
Table 4 reports the considered stakeholders, the subcategories, and the inventory indicators that have been applied in this study. For each of the identified social indicators, tailored questions were prepared for the industrial partners involved in the bio-based multi-layer panel value chain (related, for example, to the presence of specific policies or procedures within the company, focused on some social aspects such as local employment or supplier relationships). Based on the selected S-LCA subcategories, a questionnaire was developed and answered by the industrial partners involved in panel manufacturing. Due to the accessibility of questionnaire recipients, the S-LCA of the multi-layer panel was limited to the manufacturing process of the functional components and the end product.
3. Results
The following chapter shows the absolute results for the LCA, LCC, and S-LCA, and for the technical/physical properties of both the bio-based panel and the two benchmark panels, as well as visualizes the relative comparison of the different systems. Due to confidentiality, S-LCA results are presented in aggregate and qualitative form.
3.1. LCA
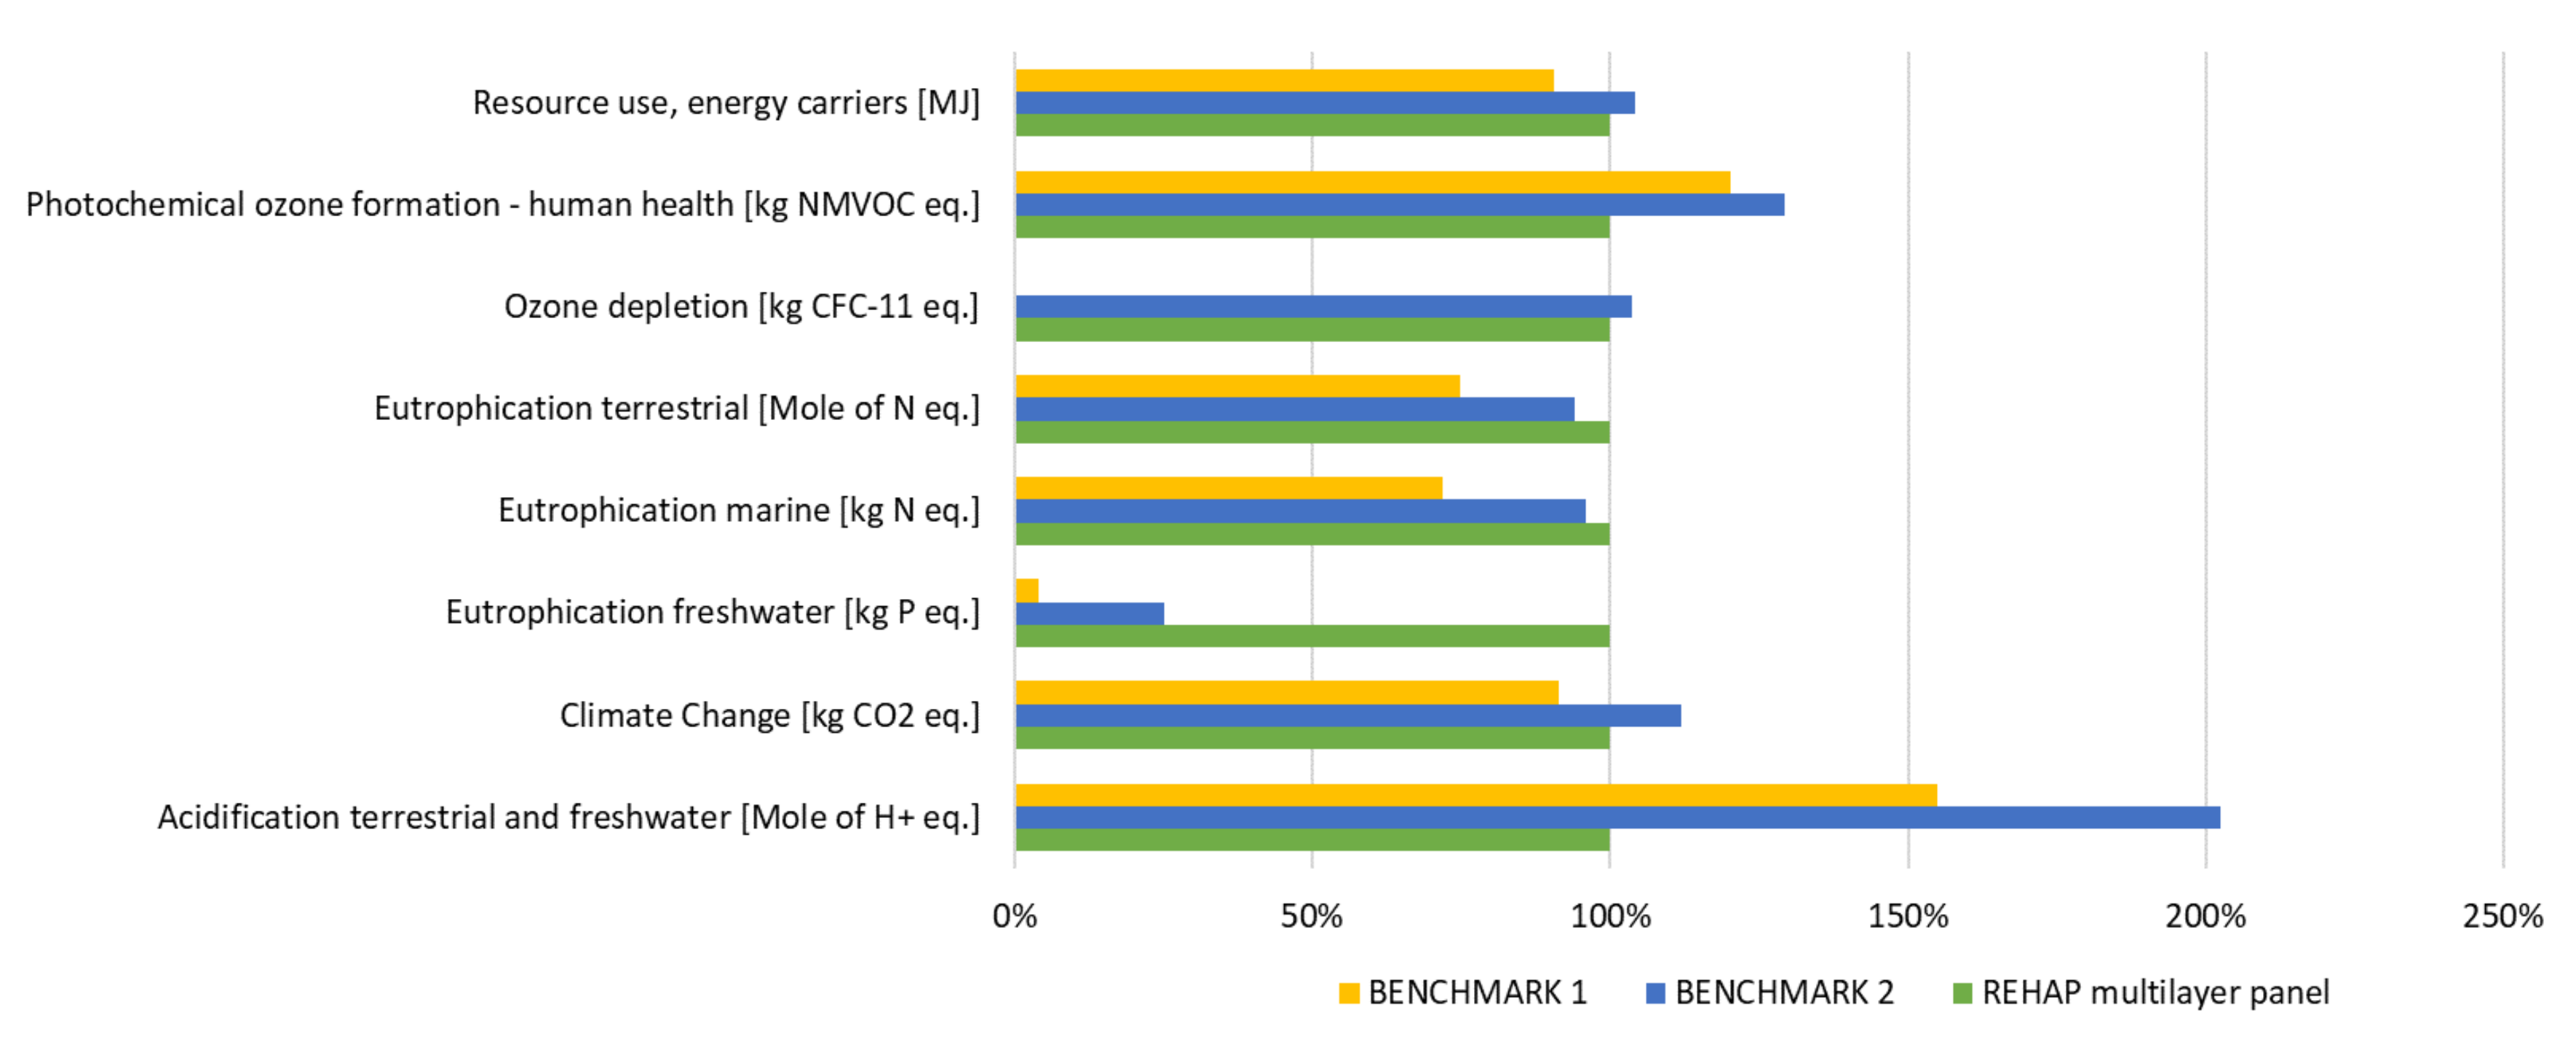
Table 5 and
Figure 4 report the environmental impacts of the production of the bio-based multi-layer panel compared with the benchmark solutions, where conventional components (including fossil-based ones) were used. For this comparison, impacts related to the transportation routes in the bio-based case were not considered.
The bio-based multi-layer panel, which consists of the assembly of the bio-based products (i.e., BioPU foam, plywood board, and bioPU adhesive), presented quite similar results compared with the “benchmark 2” panel, i.e., a panel including the same components as the bio-based case but with a “fossil-based” origin (PU foam and PU adhesive with fossil-based esterpolyols, and plywood board with phenol-formaldehyde resin). Differences between 4% and 6% are shown for the following impact categories: resource use, ozone depletion, eutrophication terrestrial, and eutrophication marine. Concerning the other impact categories, the bio-based panel entailed lower impacts in terms of climate change (−12%), photochemical ozone formation (−29%), and acidification (−102%, mainly associated with the primary refining processes within bio-based value chains), and presented a considerable increase for the eutrophication freshwater category. This was mainly due to the PU-based components, i.e., the PU foam and PU adhesive, and the bio-based monomers (1,4-BDO and 2,3-BDO) used in bioesterpolyols formulation. While 2,3-BDO impacts on eutrophication freshwater are to be associated with the activated carbon and solvents (e.g., ethyl acetate) employed in the process, impacts on such categories linked to 1,4-BDO production can be mainly related to the glucose used, as additional sugars’ sources along with second-generation sugars were derived from bark.
The “benchmark 1” panel (SIP with plywood and XPS foam) entailed slightly better environmental performances in almost all impact categories if compared with the other solutions (especially for the categories ozone depletion and eutrophication freshwater). However, the bio-based panel showed lower impacts in photochemical ozone formation and acidification potential.
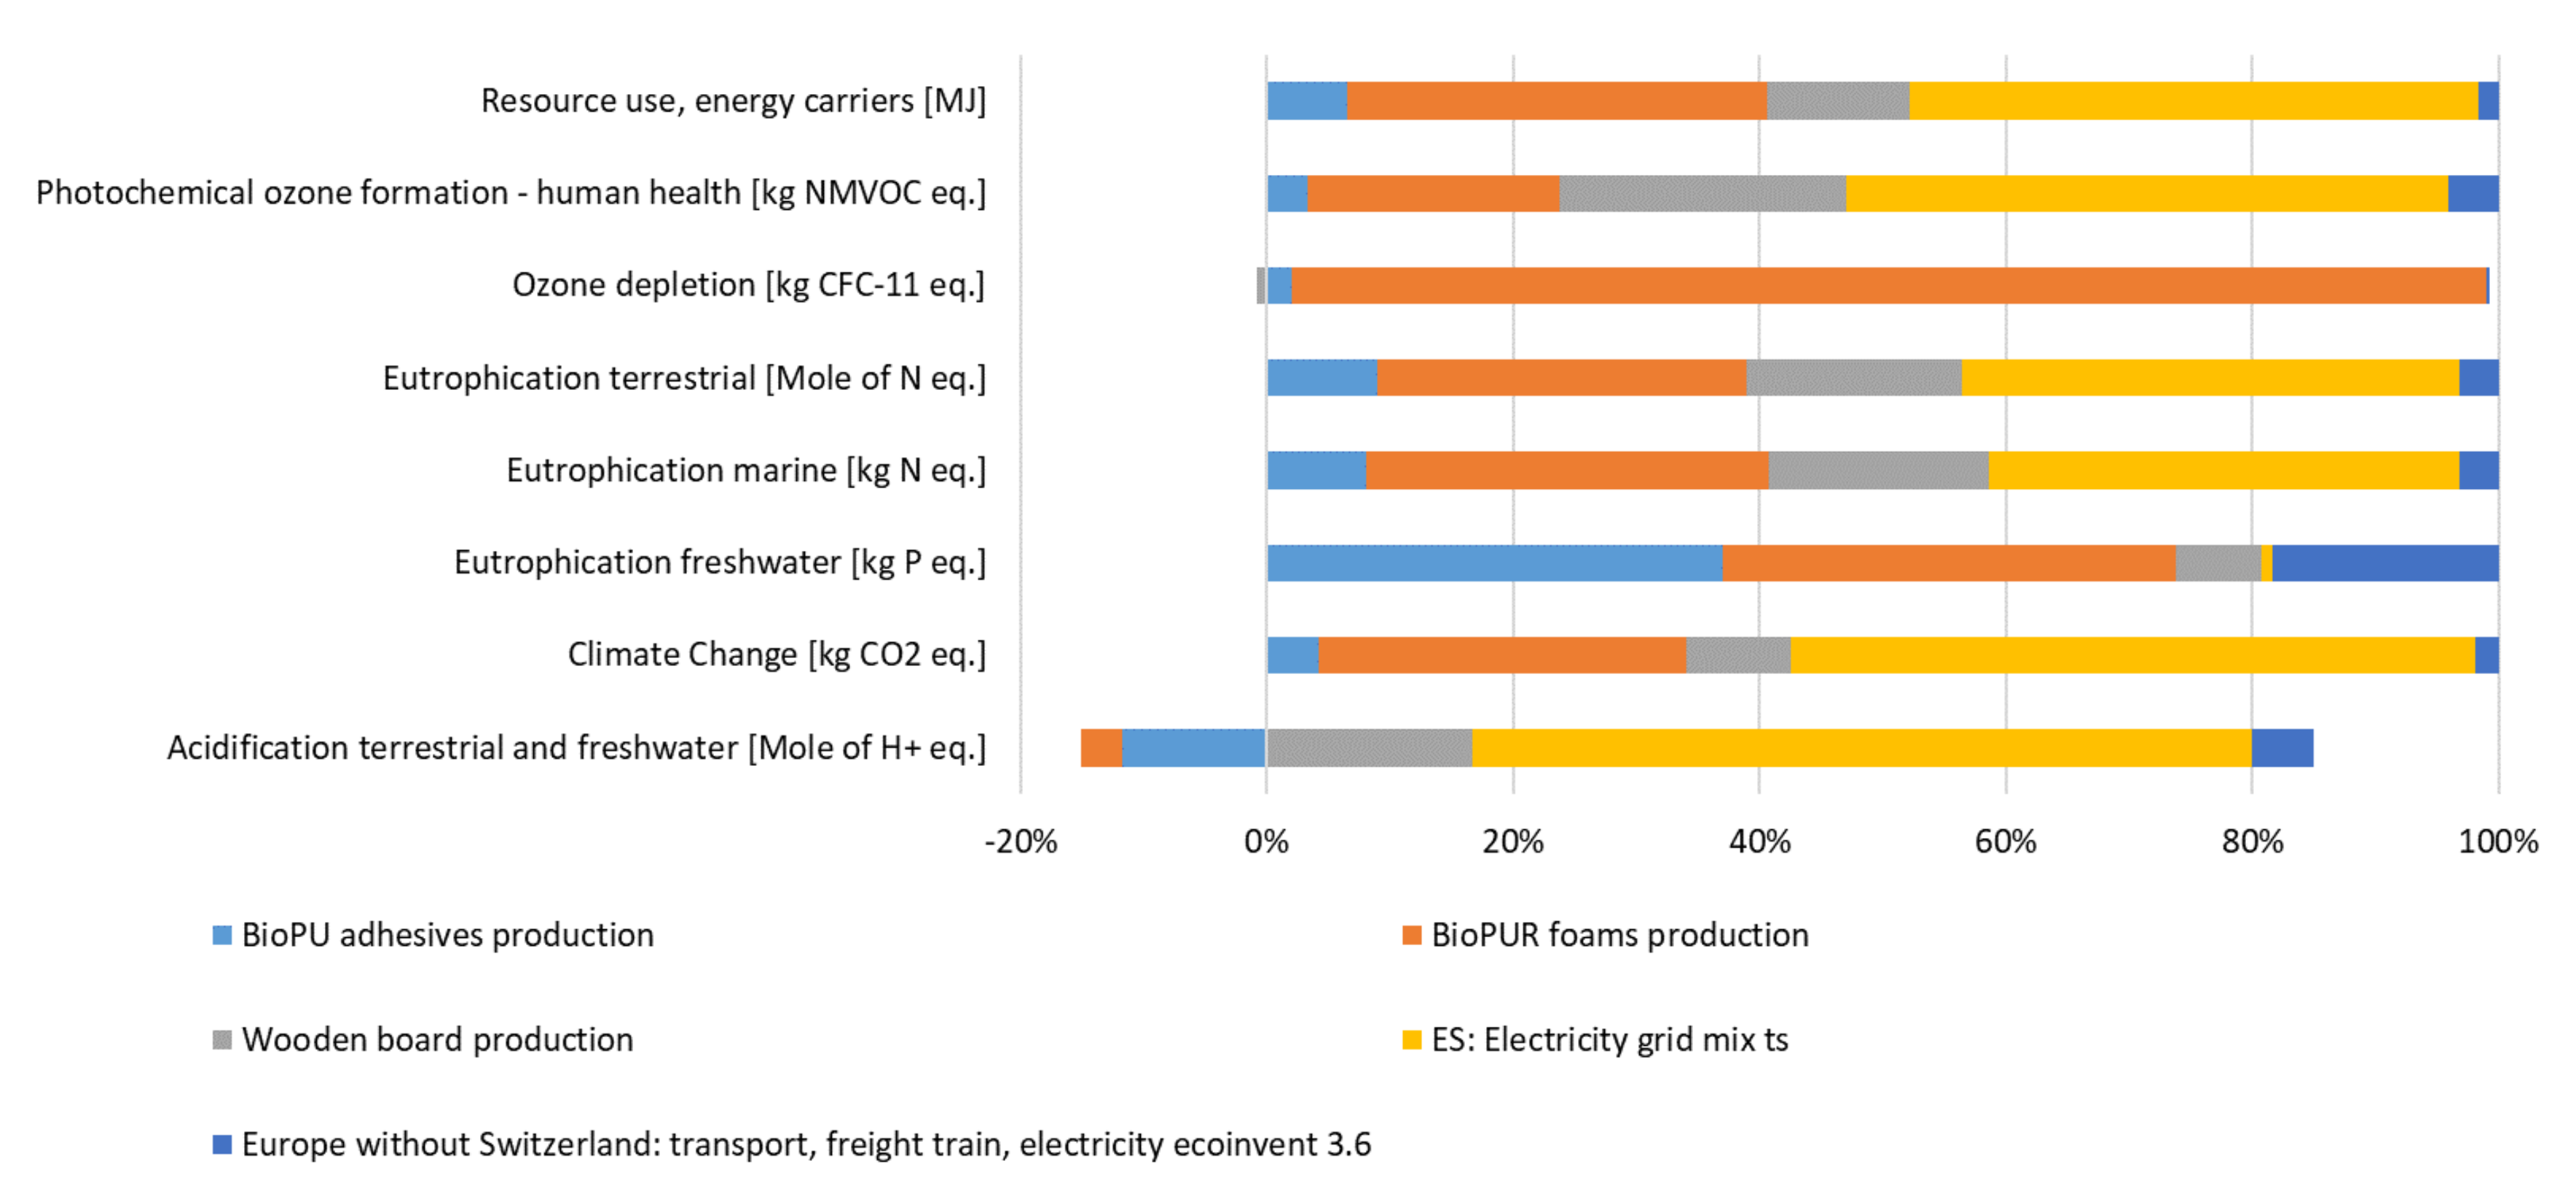
In the framework of the bio-based multi-layer panel production, most of the impacts were related to the electricity used in the process, followed by the BioPU foam production. In the latter, the MDI used in BioPU foam formulation entailed relevant environmental impacts in almost all impact categories, except for eutrophication freshwater, for which the glucose used in 1,4-BDO production entailed a high share of the impacts.
Figure 5 shows that most of the impacts for “benchmark 1” were attributed to the electric energy demand, followed by XPS foam and plywood manufacturing. For “benchmark 2”, most of the impacts were allocated to PU foam production (due to its MDI content), followed by electricity and plywood board. In both benchmark solutions, impacts associated with the PU adhesive were very low compared with the other components.
3.2. LCC
The resulting production cost of the bio-based multi-layer panel was equal to 58.59 €/m2 when the assessment outcomes of the pilot-scale processes within bio-based value chains were included. Indeed, the results obtained from the LCC of the bio-based components (i.e., BioPU foam, bioPU adhesive, and plywood board) showed that the highest costs were related to the processes for which pilot-scale implementation is carried out: primary refining and 2,3-BDO production. Indeed, further improvements and optimisation actions are still needed to lower the production costs of sugars, lignin, and 2,3-BDO in order to make such intermediates competitive on the market.
For this reason, a competitive price of 1 €/kg for sugars and 0.5 €/kg for lignin, along with a market price for 2,3-BDO (to be used in the formulation of bioesterpolyols for PU adhesives) was considered to estimate the prices of bio-based components for the multi-layer panel production (value based on primary data provided by REHAP project partners [
27]). In the latter case, the results became more promising, as shown in
Table 6, which shows the LCC results of the bio-based multi-layer panel compared with the selected benchmark solutions, i.e., the SIP panel (benchmark 1) and panel with fossil-based components (benchmark 2). For this comparison, impacts related to the transportation routes in the bio-based case were not considered.
Even though the differences among the assessed cases were not relevant, the best results in terms of economic impacts were associated with the “benchmark 2” case, while the bio-based panel presented higher economic impacts, with a slight increase if compared with the SIP panel production costs. Focusing on the bio-based case, the cost breakdown of the multi-layer panel production is shown in
Figure 6. Considering also the transportation cost, the total economic impacts increased to 53.61 €/m
2. The highest contribution was associated with the personnel (46%), followed by the raw materials (41%) and energy (8%). Other contributions were covered by equipment and transportation, which accounted for 2% and 3% respectively. BioPU foams entailed 63% of the economic impacts among the raw materials, while plywood board and bioPU adhesives accounted for 31% and 6%, respectively. If compared with the benchmark cases, the economic impact of BioPU foam is higher than both XPS foam (benchmark 1) and fossil-based PU foam (benchmark 2). This depends on the higher production cost of bioesterpolyols compared with the fossil-based counterparts, which in turn is linked to the higher price of bio-based monomers. Additionally, the plywood board entailing biophenolic resins showed economic benefits compared with the plywood used in SIP panel (benchmark 1) and with the fossil-based plywood board (benchmark 2), while the adhesive contribution was similar in all of the cases.
3.3. S-LCA
The results of the social assessment of the bio-based multi-layer panel were based on the associated companies’ responses to the questionnaire. The answers were evaluated qualitatively and suggestions for improvement were made to the companies based on their specific S-LCA results. According to the outcomes of the S-LCA of each bio-based component, good results in terms of social impacts were shown for all the processes related to the production of intermediates and bio-based components.
In particular, some companies achieved good impacts for the stakeholder category “Local Community” mainly because of their strong relationship of collaboration and open dialogue with the local community. Some companies were indeed committed to the sustainable growth of the areas near their factories and considered the people living there, for example, by favouring the hiring of local people and local suppliers. In particular, the smaller companies assessed within the REHAP project would need to increase their engagement in initiatives for the community (e.g., education initiatives) and commit clearly to local employment. Some companies paid great attention to technology development and sustainability issues by publishing environmental reports on the implementation of the company’s environmental policy and on the consistency between the goals proposed. Specific documents aimed to enhance ethical principles such as transparency, fairness, equality, social responsibility, and sustainability were also encountered, thus driving and supervising the relationships with suppliers, employees, and customers. Examples of such documents include the Ethical Code, Code of Conduct, Supplier Code of Conduct, Code of Ethics, and Annual Sustainability Report. Concerning the stakeholder group “Society”, the development of public documents regarding commitments, agreements, or codes of conduct on sustainability issues and anti-corruption measures may increase the positive effects on the society.
3.4. Technical/Physical Properties
The results for the tensile and compression strength tests for the different samples evaluated in the study are shown in
Table 7 (the detailed list of results for each test sample is included in
Appendix A). Initial estimates considered 120–150 kPa for the stress limit of the PU core of the panel, based on the UNE-EN 14509:2014 standard. The compressive tests for the core (test samples 5 and 6) showed that the stress limit ranged between 150 and 225 kPa. This proves that the initial estimate of the properties was too conservative and shows that the properties of the material exceeded the original expectations. The tensile strength tests performed over the different samples resulted in stress limits between 205 to 209 kPa for samples with sufficient adhesives. The initial estimates considered 100–120 kPa as the limit of the PU core of the panel (based on the UNE-EN 14509:2014 standard), which also showed that the material’s tensile strength exceeded the initial expectations. The compressive and tensile strength of the plywood was far higher than expected, which shows that the plywood is not the limiting material in the performed tests. Based on the bio-based panel’s technical/physical properties testing, the panel is technically competitive with the two benchmark systems. This result emphasizes that the comparative LCC and LCA study between the developed and benchmark panels with the selected functional unit is valid. The best sample is the plywood with 250 g/m2 of bioPU adhesive based on the results obtained. A pressure of 0.4 bar is sufficient to achieve good adhesion between the faces and the core without causing breaking.
4. Discussion
The LCA results show that the bio-based and “benchmark 2” panel have quite similar environmental impacts, even though the bio-based solution entailed better environmental performances in terms of climate change (−12%), acidification potential (−102%), and photochemical ozone formation (−29%), but higher impacts in the eutrophication freshwater potential (+75%). The acidification benefits of the bio-based panel are to be attributed to the primary refining step within the value chains towards bio-based components (in particular, due to the incineration of residual solid streams after wastewater treatment), while the lower impacts in the other impact categories are mainly due to the substitution of fossil-based raw materials (i.e., phenol in resins used in the plywood board, fossil-based esterpolyols for the PU foam and adhesive) with bio-based materials. The higher impacts for the category eutrophication freshwater can be allocated to the raw materials employed in producing bio-based monomers for bio-based esterpolyols, i.e., 2,3-BDO and 1,4-BDO. The SIP panel showed slightly better environmental impacts than the bio-based and “benchmark 2” panel, except for the photochemical ozone formation and acidification categories. The results from LCC have shown that the bio-based solution entails slightly higher costs compared with both benchmark cases. This discrepancy mainly depends on the BioPU foam, which entails an economic impact significantly higher than for the XPS foam (benchmark 1) and fossil-based PU foam (benchmark 2). The higher cost for BioPU foam is mainly due to the bioesterpolyols whose increased production cost, compared with fossil-based counterparts, is mainly related to the higher price of bio-based monomers.
While the presented bio-based panel performs only economically marginally weaker than the conventional panels, the result is more heterogeneous for the environmental dimension. The findings that bio-based products often outperform conventional fossil-based products in categories such as climate change and tend to underperform in categories such as eutrophication are consistent with other research findings [
14]. Regarding the economic and environmental results, it is essential to underline that the processes used for the production of the novel panels have so far been implemented on a pilot scale and not yet on a large industrial scale. Furthermore, the processes are novel and have not yet been subjected to optimisation cycles. With an upscaling and further optimisation of the processes, an improvement of the LCA and LCC results can be expected. This is in line with the conclusions of similar existing works, highlighting that the differences in scale and technology readiness are a constraint in this type of study [
21]. This limits the validity of the direct comparison with conventional products, which are based on processes that have, in some cases, been optimised for decades.
The environmental and economic competitiveness of the bio-based solution versus the fossil-based benchmarks are influenced by several factors along the entire value chain, from the primary refining of biomass to the downstream processes, which have the potential to be further optimised. Efficient recycling and energy recovery from residual and waste materials can increase both environmental and economic benefits. This is particularly interesting in primary refining, where many liquid and solid residues are generated. Regarding the production of bio-based intermediates, particularly 2,3-BDO production (intermediate in the bioPU adhesive value chain) urgently needs reduced raw material requirements (including solvents), while maintaining the same product output. This increase in efficiency should take place when scaling up from the pilot to the industrial scale. Although costs related to the bio-based panel are already at the level of the benchmarks and the cost calculations are based on the laboratory or pilot scale, further improvements should be targeted. In particular, the total raw materials costs could be reduced by investigating alternative processes or substances. For example, the price of bio-based azelaic acid used in the bioesterpolyols formulation mainly contributes to the overall production costs for bio-esterpolyols. In addition, it should be emphasised that the bio-based materials have other advantages which were not subject to the underlying research. The produced bio-polyesterpolyols showed better fire performance than the fossil benchmarks, which implies a reduction in the use of flame retardants for specific applications and would significantly reduce the overall cost of the final product (polyurethane foam in this case).
From the S-LCA analysis, it can be concluded that although all companies involved in the REHAP project respect and apply social principles, further improvements can be implemented in some cases to explicitly indicate the company’s engagements. Further commitments could improve topics such as promoting social responsibility along the supply chain and the ensuring the involvement of local communities. In particular, the small companies involved in the production process have the potential to further develop their social benefits for different stakeholders. In particular, the adoption of explicit and written procedures and measures may significantly raise social benefits linked to the company’s activities and could enhance the engagement of local communities and value chain actors including suppliers, workers, and society in bio-based operations, thus fostering a wider diffusion of bio-based value chains across Europe. A comparison of the social performance of the bio-based panel with conventional panels was not performed in this study but would have been desirable. The lack of recognised methods and standards for evaluating the social dimension do not yet allow for such a comparison. It was also found that the participating companies only provided data on social aspects under the assurance of confidentiality. The fear of bad social responsibility ratings seems to be very high among the companies, which considerably limits transparency. Even with more recognised and standardised S-LCA models, the accessibility of sensitive social data will be a limiting factor. Ingrao et al. (2021) drew the same conclusion from the results of a recent Special Issue [
25]. In order to make small steps towards more transparency, the S-LCA results are presented qualitatively. Furthermore, the conclusion of the S-LCA was internally fed back directly to the participating companies in the form of recommendations for improvement. In order to increase the transparency of social aspects, the disclosure of specific data on social aspects could be a condition for companies in publicly financed projects.
In conclusion, this work presents an already marketable and economically competitive product with a technical performance comparable to the benchmark panels and is within both the stress limit and tensile strength standards. From a technical point of view, the bio-based panel has the properties to substitute conventional insulation panels and thereby can reduce the demand for fossil resources. The 14.6 Mt coniferous bark (spruce plus pine bark) would serve enough feedstock to produce 0.926 Mil t PU foam or 2.327 Mil t PU adhesives (both products are based on esterpolyol derived from coniferous bark-based carbohydrates) and additionally 145.504 Mil t biophenolic resin (based on lignin and tannin). The coniferous bark-derived carbohydrates needed for PU foam and PU adhesive production are the limiting feedstock. The EU’s bioeconomic coniferous bark potentials would allow for a total multi-layer production volume of about 250 Mil m2. Although the panel presented in this study was produced on a laboratory and pilot scale, it exceeds conventional benchmarks in many environmental categories and has a competitive price. With additional research and development to implement the proposed process improvements, the bio-based panel can further increase its sustainability significantly.


 ,
, 


