A Database for the Extraction, Trade, and Use of Sand and Gravel


1
Department of Earth Science and Engineering, Imperial College London, London SW7 2AZ, UK
2
Department of Civil and Environmental Engineering, Imperial College London, London SW7 2AZ, UK
*
Author to whom correspondence should be addressed.
Resources 2022, 11(4), 38; https://0-doi-org.brum.beds.ac.uk/10.3390/resources11040038
Submission received: 11 October 2021
/
Revised: 6 April 2022
/
Accepted: 11 April 2022
/
Published: 13 April 2022
/
Retracted: 20 May 2022
Abstract
:Increasing demand for sand and gravel globally is leading to social, environmental, and political issues that are becoming more widely recognised. Lack of data and poor accessibility of the few available data contribute to exacerbating these issues and impair evidence-based management efforts. This article presents a database framework designed to describe stocks and flows data for sand and gravel from different sources. The classification system underlying the database builds on the Universal Materials Information System (UMIS) nomenclature, which is used to construct hierarchical order in the data. The common classification system is used to structure sand and gravel data records into a database formatted in the same manner as the Yale Stocks and Flow Database (YSTAFDB), a common data format. To illustrate how the database is built and used, a case study using UK data is presented. The UK is chosen owing to its relatively better access to data compared to other locations. Quantitative analyses of the UK data highlight possible risks in the supply chain of these materials for the UK. Results show that indigenous extraction only contributes 11% to UK sand and gravel production, with trade accounting for the rest of the inputs, of which 50% is reliant on only one nation.
1. Introduction
Aggregate deposits (crushed rock, sand, and gravel) are the second largest resource extracted and traded globally [1]. Sand and gravel accounted for 71.9% of nonmetallic mineral extraction in 2010 [2]. Natural sand and gravel are described as loose non-cohesive granular particles of geological origin, with sand being 0.05–2 mm [3] and gravel 2–63 mm in size [4]. The main use for sand and gravel is in the construction industry to make cement, concrete, bricks, and mortar [5]. The trade and consumption of sand have become the focus of research in recent years, unlike other aggregates such as gravel and crushed rock, due to the increased reporting of worsening issues [1]. These issues vary widely, from social concerns, such as job loss and occupational hazards, to environmental degradation and rising political tensions between nations. These issues have perpetuated in part due to a lack of monitoring of the material stocks and flows of sand from the local to the global scale.
Improvements in data accessibility and coherency in data storage are important factors for determining the flows of sand and gravel. The construction of a structured database constitutes an initial step towards the characterisation of issues surrounding these raw materials. The sand and gravel database assembled in this work provides a repository to collect, store, and exchange stocks and flow data for these materials from different sources. Sand and gravel data are currently classified using different terminology, hindering data reconciliation. Development of a universal structure and format improves ease of use and consistency in the collection of data for any region. The main issues due to the consumption and trade of sand and gravel, described in Section 2, provide context for the classification system presented in Section 3. The UK is used as an example of how the database can be populated from various sources of stocks and flow data and how it can be used as a basis for quantitative analysis in Section 4. The analysis and discussion in Section 5 focus on sand, but data on gravel have also been included in the database given that gravel data tend to be available alongside sand data.
2. Background and Wider Context
Social, environmental, and political issues associated to the material stocks and flows of sand are becoming more widely recognised. A major gap in data collection exists for the material stocks and flows of sand and gravel [6] due to a chronic lack of monitoring and data reporting. The data gap hampers quantitative analyses of these material stocks and flows, allowing mismanagement issues to perpetuate. The development of a structured database able to collect and archive sand and gravel data at all magnitudes and scales is a crucial step towards characterising the issues surrounding sand and gravel. Collection and monitoring of stocks and flows data for sand and gravel across scales would allow critical issues surrounding these materials, such as sources of illegally mined sand at the local scale and the monitoring of global patterns and supply risks at the international scale, to be recognised, quantified, and dealt with appropriately. To further motivate why collecting and monitoring sand and gravel data is required, a brief outline of the current global situation around sand and gravel extraction, trade, and use is presented alongside their associated issues followed by potential solutions.
2.1. Global Patterns
2.1.1. Increasing Demand for Sand
Demand for sand has increased rapidly to 18 kg of sand per person per day, three times greater than the level of demand 20 years ago [1]. In 2009, sand and gravel accounted for 43% of global material extraction [7] of which 87% was mined from terrestrial sources, such as quarries and pits [8]. Lake Poyang in China is the largest known area of sand mining activity globally, where extraction rates were estimated, using remote sensing techniques, at 488 Mt during 2005–2006 [9]. Growing wealth, consumption, and accelerating trade are the main drivers of this increase [10]. Buildings and infrastructure have seen the largest growth in demand with a 4.5% annual increase and now account for 75% of global sand use [2]. Since 1990, the consumption of sand in the developing Asia-Pacific region has had an average annual growth rate of 6.5%, and it plateaued in Europe and North America [2]. From 2011 to 2013, China used more sand for concrete than the USA used during the entire 20th century [11]. Modern rapid industrialisation and urbanisation are the main drivers of this increase in the Asia-Pacific region with two thirds of the predicted $94 trillion investment in infrastructure globally from 2015 to 2030 to be spent in emerging economies such as China and India [3]. Increasing demand for sand is predicted to continue, with India’s demand for sand predicted to quadruple within the coming decades if it follows the same development trajectory as China [12]. If concerted efforts are made to reach carbon neutrality by 2100, sand usage is expected to peak at 30.8 times greater in the decade of 2090 compared to the decade of 2020, [13] as investment in large scale infrastructure such as hydropower facilities requires vast quantities of sand for concrete [3].
2.1.2. Global Sand Trade
International sand trade is predominantly regional, due to sand having a relatively low price per unit mass but relatively high transport cost [1]. Many regions and nations are dependent on imports, despite sand being widely available at beaches and riverbanks globally due to the uneven distribution of particular types and grades of sand required for different industries [11]. Desert sand is not traded as it is too fine grained and smooth to be used in construction [5], reducing the compressive strength of concrete by up to 16% [14]. Technical advances such as sintering [14] and grinding [15] desert sand can produce concrete with no reduction in strength at low sand–cement ratios (<1.41 compared to the more commonly used higher ratios of >2) [16] not typically used in mortar and concrete.
Depletion of local sand and gravel deposits, in part due to increasing demand outstripping natural replenishment [17], has also led to longer trade routes. For example, a major trade route now exists between Belgium and China [3]. Trade in sand is dominated by a small group of nations. The top four exporters of sand are the USA, Germany, Australia, and the Netherlands [5]. Between 2010 and 2014, 8 out of the top 10 exporting nations remained the same [5]. The top four importers of sand are Singapore (11% market share), the Netherlands, Belgium, and Japan [5]. These nations undertake extensive land reclamation projects, which require vast quantities of sand and gravel as well as coarser aggregates such as crushed rock and armourstone.
2.2. Impacts
2.2.1. Social
The lack of adherence to safety standards during illegal sand mining increases health risks. Lower back pain and respiratory issues are common amongst illegal sand miners due to a lack of breaks and inhalation of fine particles while shovelling in small scale mines [18,19]. Local mining of black sand at Induk beach in Indonesia, taken for its superior quality in producing ornaments, has led to increased beach erosion which reduces fishing capabilities, severely impacting the subsistence lifestyle of the local population [20]. The activities of so-called ‘sand mafias’ have increased due to the lack of monitoring of sand extraction. Deaths of officials, protesting locals, and competing ‘sand mafia’ gang members have been reported in India; however, criminal convictions are rare [21,22]. In Morocco ‘sand mafias’ have been reported to account for 50% of sand extracted [1].
2.2.2. Environmental
Increased demand for sand has driven illegal mining, leading to increased environmental degradation such as river pollution, accelerated beach erosion, and lowering of water tables [1]. Extraction rates of sand were double the discharge rate of aggregates from rivers in 2014 [12], creating a damaging imbalance within the global natural sediment system. Unregulated dredging of sand damages marine beds releasing nutrients from disturbed sediments that can induce eutrophication [23]. At Lake Hongze in China, mining of sand has led to a 99.5% reduction in the biomass of benthic fauna, severely disrupting the local ecosystem [23]. Sand mining also negatively impacts carbon sequestration of soils near rivers. Destruction of surface soils exposes soil organic carbon at the surface, contributing to rising levels of carbon dioxide in the atmosphere. Mining of sand from the Lijiang River in China released 934 t of carbon, equivalent to 3420 t CO2 [24].
2.2.3. Political
Many nations do not adequately monitor sand extraction or trade, as mining is illegal or involves small companies that do not report figures [2]. The sector is predominantly informal with few significant commercial supply chains, as sand is mostly mined for local use by artisanal miners [1]. At the local scale, conflicts between artisanal miners have become more common [11]. At the international scale, increased taxes and trade bans on sand to protect national assets such as beaches for tourism and storm protection have led to increased political tensions between nations [11,25].
2.3. Potential Solutions
2.3.1. Technical Solutions
Recycling and substitution are being used to decrease the extraction of sand and its impacts by reducing sand consumption. The EU categorises recycling and substitution as risk reducing filters for material supply risk [26]. Many materials are being assessed as substitutes for sand in construction materials, such as crushed granite, barite powder, and quarry dust [5]. These substitutes offer benefits over sand-based concrete: crushed granite improves chemical resistance to chlorides and sulphates [27], and crushed stone improves compressive strength by 10% [28]. Supply chain risk and manufactured product performance must be considered when choosing a material to sustainably substitute for sand and gravel in the construction industry. Recycling of the 900 Mt of Construction, Demolition, and Excavation Waste (CDEW) produced annually into manufactured sand via crushing will reduce demand for primary aggregates [28]. Currently, only one-third of CDEW is recycled [29] due to the high cost and energy consumption associated with the crushing process [30], variability of supply, lack of recycling infrastructure, and underdeveloped markets for recycled products [6]. Japan achieves a 95% recycling rate of these materials, but such high rates are rare [2].
2.3.2. Transition to a Circular Economy
A circular economy is an economic system where materials and manufactured products are continuously reprocessed to extract maximum value from them [31]. Circular flows of materials can improve resource efficiency, increasing sustainable material usage. Environmental impacts can vary; the recycling of glass to glass sand can increase the negative environmental impact of the material [32].
A transition to a circular economy for natural aggregates will become more favourable as CDEW generation increases in more developed nations, due to ageing infrastructure and tougher constraints on the primary extraction of natural aggregates [6]. Circular economy ideals are becoming more widely recognised by companies throughout the construction value chain [33] and international groups within their economic policies [34,35]. Discussions between the Nordic Council of Ministers and major construction stakeholders in 2018 highlighted five main barriers to reaching a circular construction industry: lack of value chain cooperation, lack of economy of scale, lack of quality assurance, hazardous substances within CDEW, and the focus on weight and not the material of CDEW [36]. Technical issues, such as recycling efficiency, and industrial planning issues, such as designing value chains to be circular, must be overcome for a circular aggregates industry to be realised [31].
2.3.3. Governance and Monitoring
The United Nations Environment Program (UNEP) published a report on sand and sustainability in 2019, focused on regulation, monitoring, and stronger governance as solutions to the issues surrounding the consumption and trade of sand [1]. Previous studies have used optical and Synthetic Aperture Radar (SAR) satellite images to monitor and detect illegal sand mining. A project carried out on Luzon island, the Philippines, revealed nine illegal mining sites which contributed to measured subsidence of 5.7–15 cm/yr from 2007 to 2011 [37].
Many nations have well developed legal frameworks for the industrial mining of sand, such as mining licences, but lack legal frameworks for the artisanal mining of sand [38]. In less economically developed nations these systems are mostly inefficient [39]. Vietnam, for example, has strict government policies including a Deposit of Environmental Reclamation that is paid to secure restoration after the closure of a mine [39] but fails to fulfil them due to a lack of enforcement. Taxes on the extraction and trade of sand and gravel, such as the GBP 2/t aggregate levy in the UK [40] can promote recycling, but globally, this is difficult to implement due to the lack of monitoring of the mining and trade of sand. Strong governance regarding mining should follow core principles such as clearly defined policies, transparency, engagement with all stakeholders, and strong administration to enforce the policies [39].
3. Structure and Format of the Database
3.1. Hierarchical System
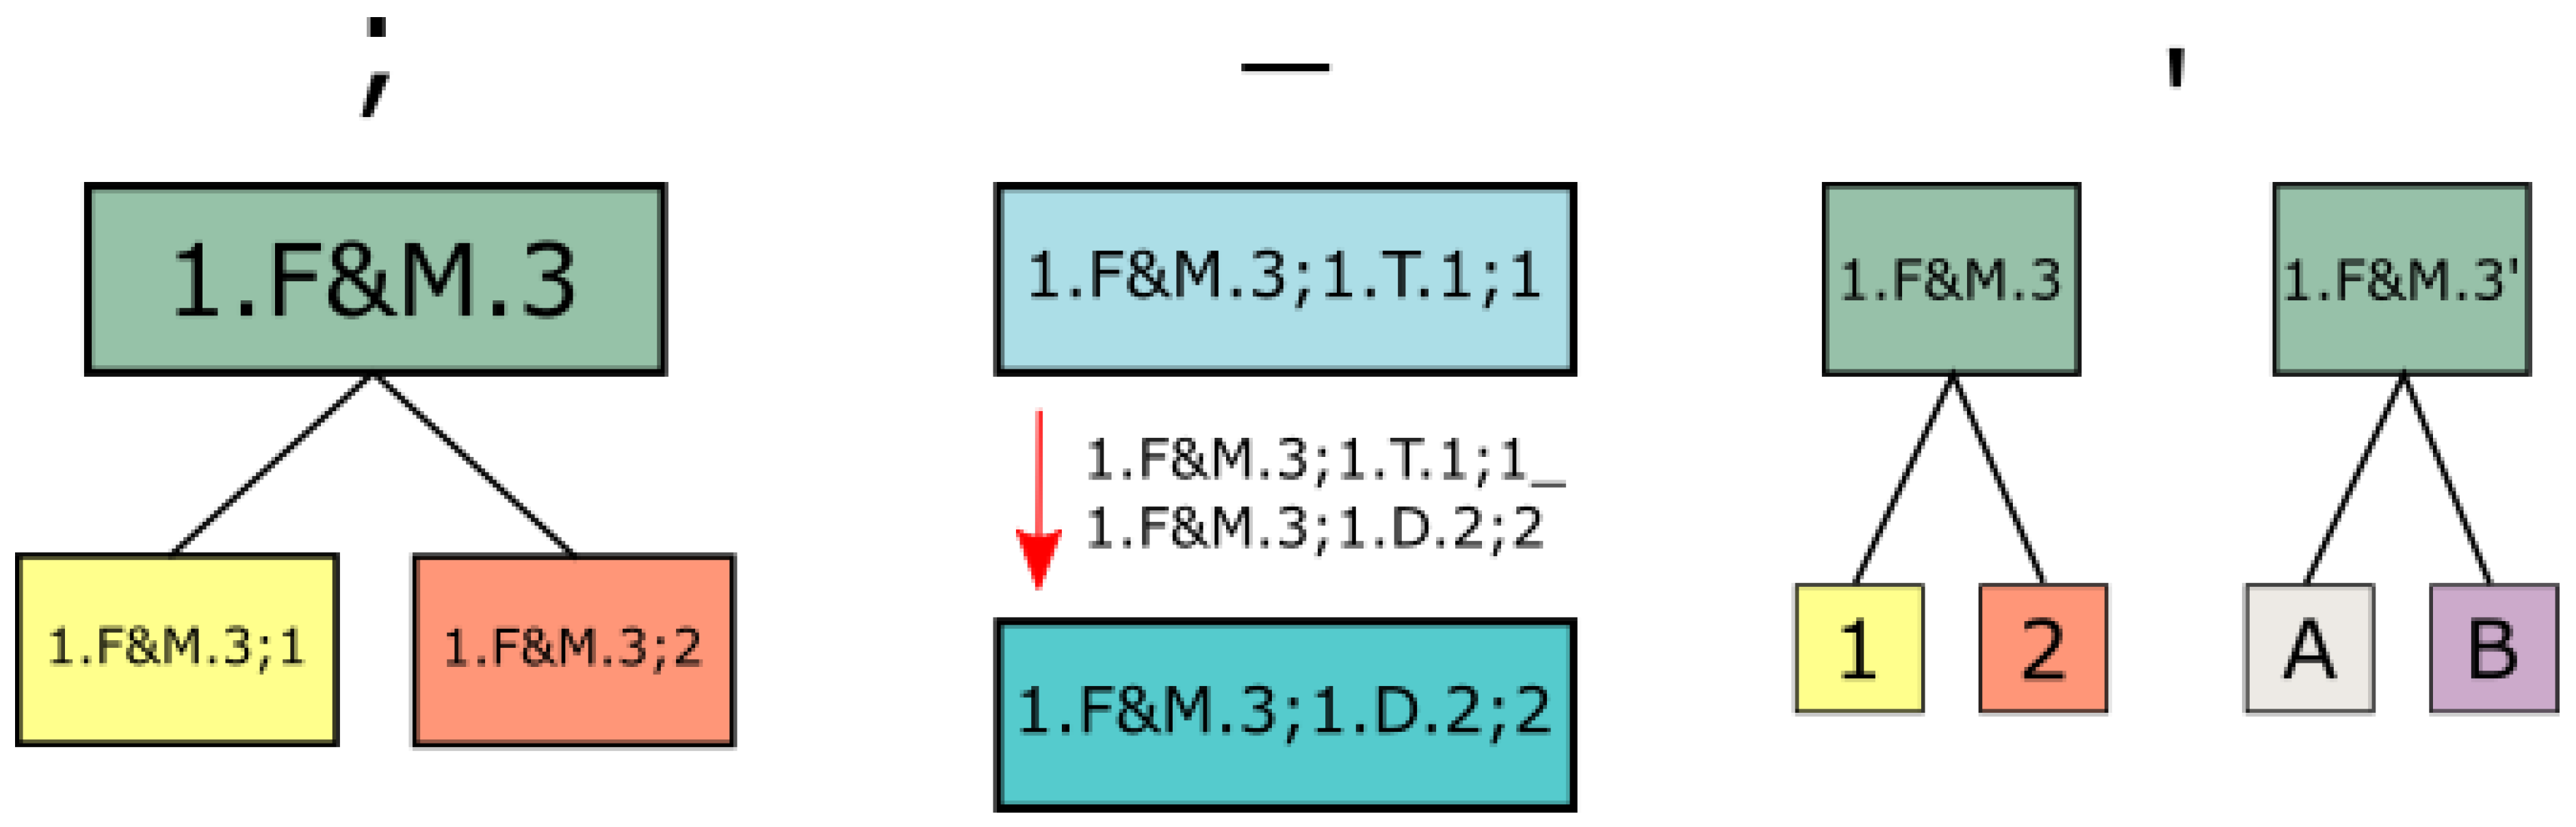
As stated above and motivated by the previous section, a database for sand and gravel is required. A hierarchical system of parent and child processes in a tree-like structure is used to classify material stocks and flows data. Each process represents an individual activity in a life cycle of a material with a stock. An example is mining, the initial stage of a material life cycle for many resources extracted from the environment for primary use. Material flows are allowed to occur between all processes. A process can either be transformative, turning an input into an output, or distributive, turning an output into an input. The data are disaggregated from the whole system into parent and child processes; each child process is more specific than its parent process. Therefore, each parent process has a non-zero even number of child processes, as every transformative process has a corresponding distributive process. UMIS [41] is implemented to provide a consistent and comprehensive way of labelling the hierarchical system. This allows for greater ease of manipulation of data within the database. Following UMIS nomenclature, each process is given an a.b.c.d.e label: ‘a’ is the reference material, ‘b’ is the root process, ‘c’ is the parent process, ‘d’ is the process type, and ‘e’ is the child process. Semi-colons ‘;’ are used for disaggregating parent processes, underscores ‘_’ to represent flows between two processes, and apostrophes ‘ ’ ’ for divergent parent process disaggregation. Figure 1 shows how this notation works.
3.2. Database Format: YSTAFDB
The YSTAFDB stores material cycle, criticality, and recycling data for 62 reference materials: individual materials, such as elements, compounds, or composites for which material stocks and flows data are collected [42]. The YSTAFDB format is followed to facilitate the integration of the new sand and gravel data with this formatting system already used in the scientific community. Each data entry in the YSTAFDB has a reference material, time frame, and space. The YSTAFDB has 15 core tables that are softly related to each other. These tables include processes, flows, cross-boundary flows, and citations, providing a common system for storing all data and metadata collected. Each reference material has its own hierarchy table to present how the data for that reference material is disaggregated. Sand and gravel data, classified using the novel hierarchical system, are input into data tables with the same format as the YSTAFDB, allowing the sand and gravel database to be compatible with the YSTAFDB format generally.
3.3. Classification System
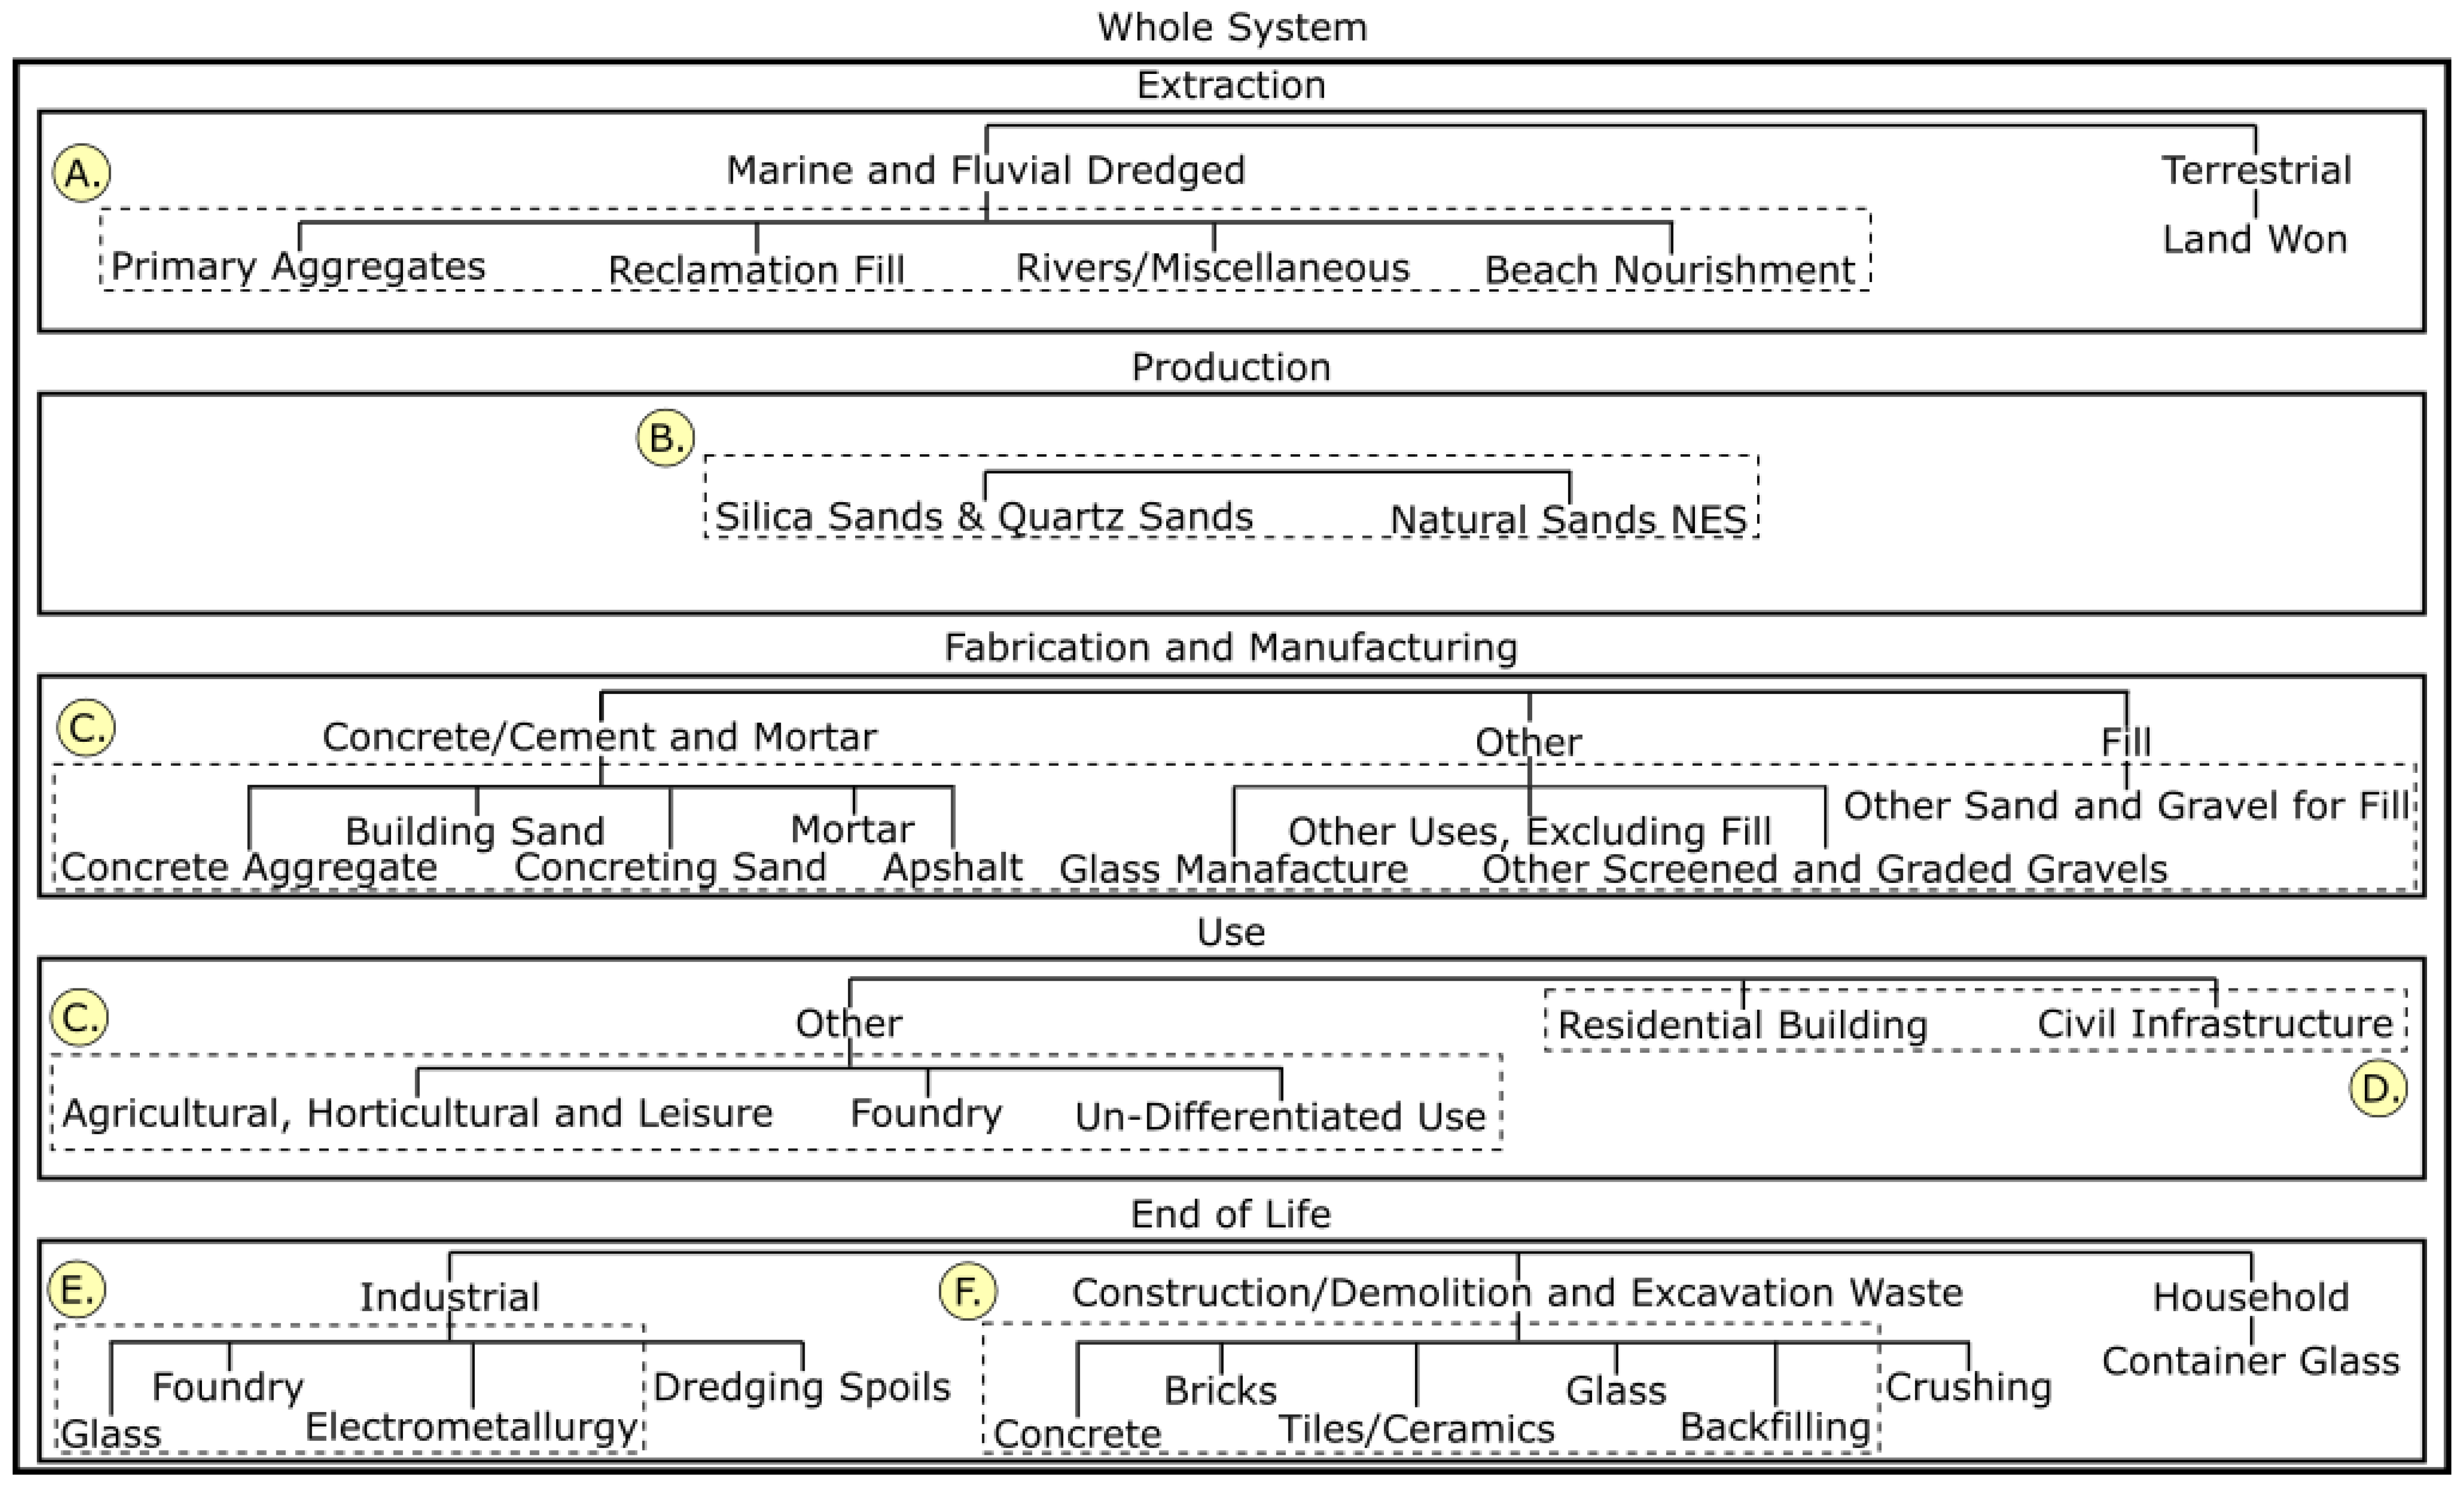
Figure 2 shows the classification structure of the sand and gravel database, labelled using the UMIS [41] compiled into data tables from the YSTAFDB [42]. The whole system is defined by three boundaries: the reference material, time frame, and space. The reference material is the material of interest for which data is collected. The reference time frame and space are determined by the time ranges and spatial regions corresponding to the properties of the data collected. International trade is classed as cross boundary flows between different system boundaries (here defined as nations).
Our classification system for disaggregation of sand and gravel data features elements from reports and data sets on stocks and flows for sand and gravel and commodity hierarchies made by the EU, the USA, and the UN (NACE—Nomenclature des Activités Économiques dans la Communauté Européenne, NAIC-North American Industry Classification, HS—Harmonized Commodity Description and Coding Systems). The common classification system provides a comprehensive repository for sand and gravel data from different data sources to be stored, accessed, and analysed.
Five root processes are often used in Material Flow Analysis (MFA) studies of material cycles: extraction, production, fabrication and manufacturing, use, and end of life. These processes represent some of the most important processes within the material life cycle of sand and gravel concerning the social, environmental, and political issues outlined in Section 2.
3.3.1. Extraction
The extraction root process contains data on the source of sand mined. It is disaggregated into terrestrial and marine and fluvial dredged parent processes, as government data sources commonly provide data in this format. Terrestrial sand mining accounts for sand and gravel mined from the land from glacial deposits and river flood plains in open pits [43] or beaches and riverbanks in lesser developed nations. The marine and fluvial dredged parent process accounts for sand and gravel that is gathered from the base of a marine or fluvial environment, such as a river or nearshore area. The parent process is disaggregated into four child processes, as shown in Figure 2 box A, using the same disaggregation used by the Crown Estate [44] as the four child processes account for the main marine and fluvial sources of sand and gravel. These child processes are disaggregated based on their use, either directly without landing for beach nourishment, reclamation fill, or river/miscellaneous use such as forming levees or landed and sorted for other uses such as primary aggregates for construction.
3.3.2. Production
The production root process contains data on the types of sand, based on sorting after mining. This root process is mostly used for trade data as it accounts for the movement of sand from the time it is mined to when it is manufactured into a product. Divergent disaggregation is common as different data sources disaggregate trade data differently. The UMIS apostrophe notation is used to prevent possible double counting of data as it is unknown whether trade data from different sources are mutually exclusive or consistent unless stated. The disaggregation of data, shown in Figure 2 box B, took inspiration from trade data sources such as Chatham House [45], Eurostat [46], and the UN HS, disaggregating the production root process by type, size, and quality of sand and gravel. The child processes of the production root process, in Figure 2, are defined by Chatham House trade data [45].
3.3.3. Fabrication and Manufacturing
The fabrication and manufacturing root process contains data on products made from sand. Fabrication and manufacturing are in the same root process as many products of sand, such as mortar, are produced in situ. Disaggregation of the fabrication and manufacturing root process is predominantly based on construction, as 75% of sand and gravel is used in concrete for construction purposes [2]. The parent process of concrete/cement and mortar and fill represent sand and gravel in the construction industry. The concrete/cement and mortar parent process is disaggregated into five child processes. The five child processes are based on the three main uses of sand and gravel in construction seen in the NACE, NAIC, and UN HS, which are asphalt, concrete, and mortar. In our database, sand and gravel used for concrete is separated using size and coarseness into concreting sand, building sand and concrete aggregate. The C boxes in Figure 2 represent where the same disaggregation as the mineral surveys from the Office for National Statistics (ONS, [47]) are used. The other parent process is used for processes not related to construction. An ‘other’ parent process is not seen in other classification systems, as the focus of other classification systems is on the product or use and not the material as in this database. Therefore, the child processes within the other parent process are wide ranging. These child processes contribute a very small amount to the fabrication and manufacturing root process compared to construction related processes.
3.3.4. Use
The use root process contains data on the sectors that sand is used in. The parent process residential building and civil infrastructure, shown in Figure 2 box D, took inspiration from the NAIC commodity hierarchy and represent sand and gravel in the construction industry. They are included despite data allowing further disaggregation into child processes, used in the NAIC commodity hierarchy, not being directly available, as they are known to contain large amounts of sand. An ’other’ parent process is included for the same reason as the fabrication and manufacturing root process.
3.3.5. End of life
The end of life root process contains data on recycling, reuse, refurbishment, and waste [48] of sand and gravel. The end of life root process has been included, despite data not being directly available, as large amounts of sand and gravel are known to go to waste or be recycled. A bottom up approach [49] would be required to add waste and recycling data to the database, as waste products commonly contain crushed rock, cement, and other materials as well as sand and gravel. A bottom up approach requires estimates of the percentage of sand and gravel in recycled and waste items, which was outside the scope of this article.
The end of life root process is disaggregated into three parent processes based on the source of waste for sand and gravel. The CDEW, household, and industrial parent processes use the same classification system as used for waste by the UK government [50]. The CDEW parent process disaggregation, shown in Figure 2 box F, took inspiration from Mineral Products Association reports on CDEW and aggregate recycling [26,29]. An additional crushing process, in Figure 2, is included to account for manufactured sand and gravel from crushed CDEW that the Mineral Products Association reports did not include. The industrial parent process disaggregation took inspiration from a report on recycling rates in Europe by the Industrial Minerals Association (IMA) [51]. Figure 2 box E shows where the same disaggregation was used in the database as the IMA report. The IMA includes a construction and soil process; however, this has not been included since the classification system used for the database accounts for construction waste in the CDEW parent process. A dredging spoils child process is included in the industrial parent process. Dredging spoils is a waste product from the extraction of sand and gravel via marine dredging. This was not included in the IMA report as the IMA report focused on the recycling of silica from products and not from waste.
4. Populating and Using the Database: An Example for the UK
Data were collected and analysed for the UK to show how the database can be built and utilised (database provided in Supplementary Material). UK data on sand extraction, trade, and use was used as it is relatively accessible, comprehensive, and reliable. Monitoring of sand extraction, trade, and use is made simple due to only a small number of companies accounting for 80% of sand extraction in the UK and reliable due to strict enforcement of annual data reporting by the UK government [1]. The collection of data is challenging due to variable definitions used in the literature, constant amendments and updates of the data sources, contradicting values, and lack of information about data uncertainty.
4.1. UK System
The database for material stocks and flows data for sand and gravel, provided in the Supplementary Material, contains data for the UK from 1955 to 2021 and extraction and trade data for all nations from 2000 to 2019. The majority of extraction and use data are provided by the UK government and Office for National Statistics (ONS, [47]). Trade and extraction data for other nations came from EuroStat [46], Chatham House [45], and the European Aggregate Association (UEPG, [52]). References for all data sources are provided in the Supplementary Materials. Data for marine and fluvial dredged aggregates were sourced from the Crown Estate [44]: a UK government owned company.
Recycling and waste data for sand and gravel in the UK could not be found. Recycling and waste data for sand and gravel are rarely reported as they are bound constituents within products, such as concrete and glass, whose amounts of sand and gravel can vary considerably due to different desired characteristics of final products and variable manufacturer specifications. Data for the amount of recycled aggregates used in construction is available. In 2018, 25% of aggregates used in construction were from recycled CDEW [26]. A report by the Waste and Resources Action Program in 2008 stated that 43.5 Mt of recycled CDEW was used as aggregate [53]. A bottom up approach would be required to estimate the amount of sand and gravel in recycled aggregates, which is beyond the scope of this article The main analysis of the UK data, therefore, focused on the security of supply and not on identifying potential illicit activity, as it was not possible to differentiate between illicit activity and lack of data at this point, such as missing waste and recycling data.
4.2. UK Extraction
Figure 3 shows a time series of sand and gravel extraction in the UK. Figure 3 shows sand and gravel extraction dropping substantially, by 29.7%, between the years 2007 and 2010, due to the global financial crisis of 2007–2008 which led to a decrease in construction, reducing demand and extraction for sand and gravel. Since 2012, sand and gravel extraction has steadily increased but it remained below extraction rates from the 1990s to the early 2000s. This type of analysis can be used to determine future trends of extraction, which is important if the UK wants to become more self-sufficient regarding sand and gravel. Guaranteeing supplies of sand and gravel is crucial for future and ongoing large scale critical infrastructure projects in the UK. The High Speed 2 railway line, vital for transportation within the UK, requires 6,768,600 tonnes of concrete, an equivalent of 2,100,000 tonnes of sand, and 3,150,000 tonnes of gravel assuming a 31% weight percentage of sand and 46.5% weight percentage of gravel in concrete [30] for its second phase [54]. Continual annual decreases in the extraction of sand could make the UK reliant on imports of sand and gravel, leading to increasing supply chain risks leading to possible delays in large scale infrastructure projects. A wide range of strategies and technologies could be employed to mitigate these risks. Strategies could include increasing the annual extraction of sand by dredging [55], as only 8.27% of the licensed seabed in the UK is currently dredged [56], increasing the recycling rate of sand and gravel excavation waste [57] from its current value of 57%(recycling rate of CDEW is currently high at 90%) [29] or using new technologies outlined in Section 2.3.1. A holistic approach, considering social and environmental impacts, must be used when reviewing these and other strategies to prevent new issues arising linked to the material stocks and flows of sand and gravel in the UK [58].
4.3. Input–Output Analysis for 2014 UK Data
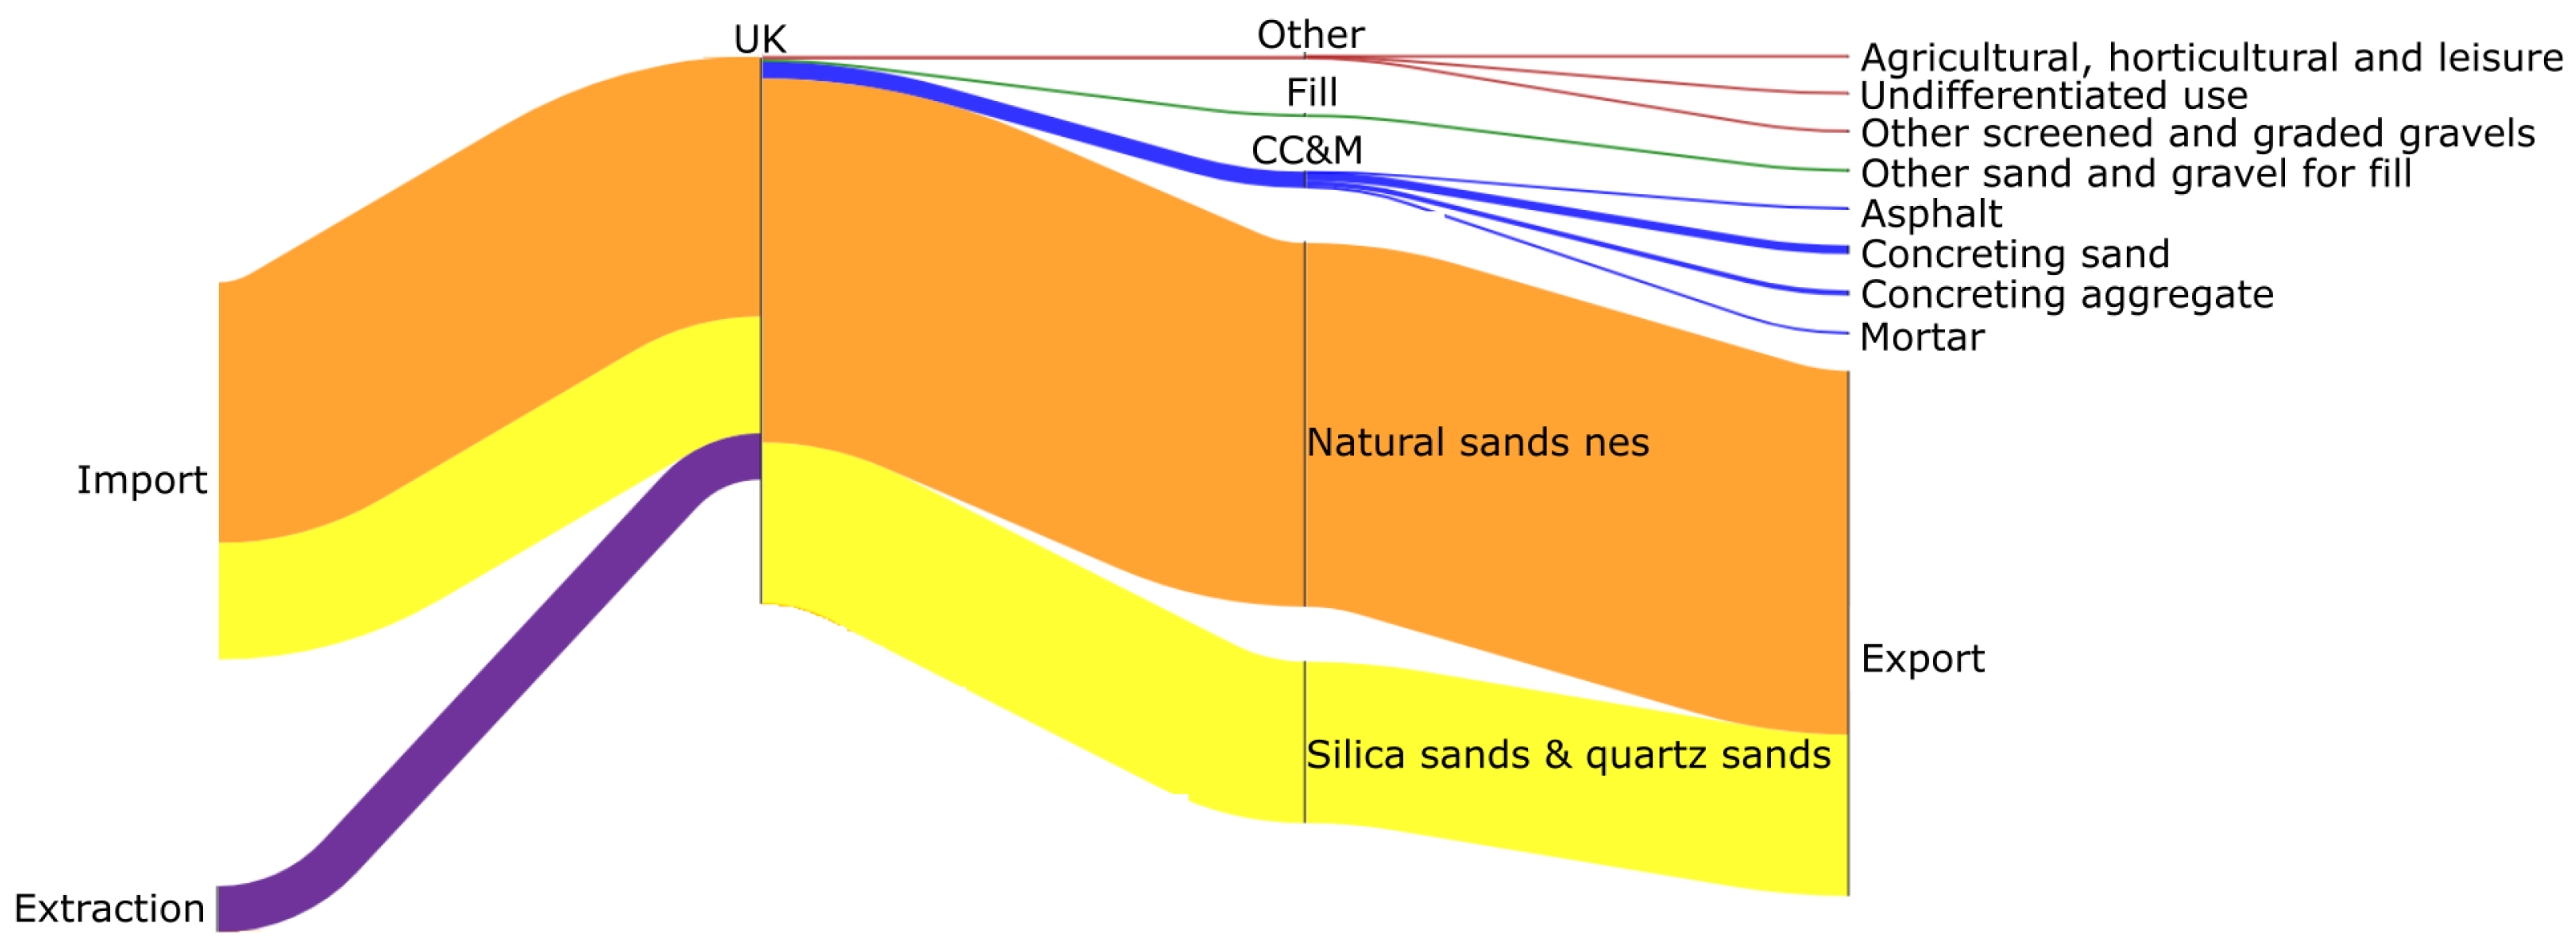
Inputs and outputs for sand and gravel data collected for the UK in 2014 are shown in Figure 4, as a Sankey diagram. The year 2014 was chosen despite many of the processes in Figure 2 not being represented in Figure 4 as it had the most comprehensive set of data for any of the years data was collected.
Figure 4 displays a mass imbalance: the inputs are 27.4% less than the outputs for the UK [49]. The mass deficit observed in Figure 4 could be due to the absence of stocks and changes in stocks data in the analysis, as mass can be conserved if the deficit between all inputs and outputs is equal to the change in stock of the whole system or other missing data. One should note that the data set built here remains incomplete as some uses of sand are still not quantified and the magnitude of recycling stocks and flows still needs to be estimated. In the UK, the difference observed in Figure 4 is unlikely to stem from illegal mining, given the operating and sustainability standards in the UK aggregate industry [1,59].
The mass balance deficit of 27.4% is comparable to the 30% recycling rate of aggregates in the UK [59]. Despite the similarity in magnitude between these values, a direct comparison cannot be made as recycled aggregates contain materials other than sand and gravel, and sand and gravel have additional uses other than as aggregates for construction.
Uncertainties in the data have not been accounted for but these uncertainties are likely to be at least within the order of 500 tonnes, inferring from the fact that certain reports round data values to the nearest 1000 tonnes. The UK exports sand to 99 nations while only importing sand from 54 nations. Assuming a maximum absolute uncertainty of 500 tonnes per nation per flow, the absolute maximum uncertainty for trade is 76.5 kt, which accounts for only 23.9% of the mass deficit between the input and outputs. The mass balance deficit is likely predominantly due to the data set being still incomplete as data regarding all the stocks, flows, and changes in stock of sand and gravel are seemingly not reported (and are therefore still missing from the database).
Figure 4 shows extraction being relatively small compared to imports for the UK. Only 11.0% of the inputs are accounted for by indigenous extraction. This shows that the UK relies extensively on other nations for its sand supply. The data available suggest that if there were future trade restrictions (e.g., COVID-19 or Brexit), the UK could risk not having enough sand and gravel, as well as other aggregates, for construction purposes.
Figure 4.
Sankey diagram showing the inputs and outputs of sand and gravel for the UK in 2014. The acronym CC&M stands for concrete/cement and mortar. The year 2014 was chosen as it had the most complete data set. The software Floweaver [60] was used to generate the figure.
Figure 4.
Sankey diagram showing the inputs and outputs of sand and gravel for the UK in 2014. The acronym CC&M stands for concrete/cement and mortar. The year 2014 was chosen as it had the most complete data set. The software Floweaver [60] was used to generate the figure.

4.4. UK Trade
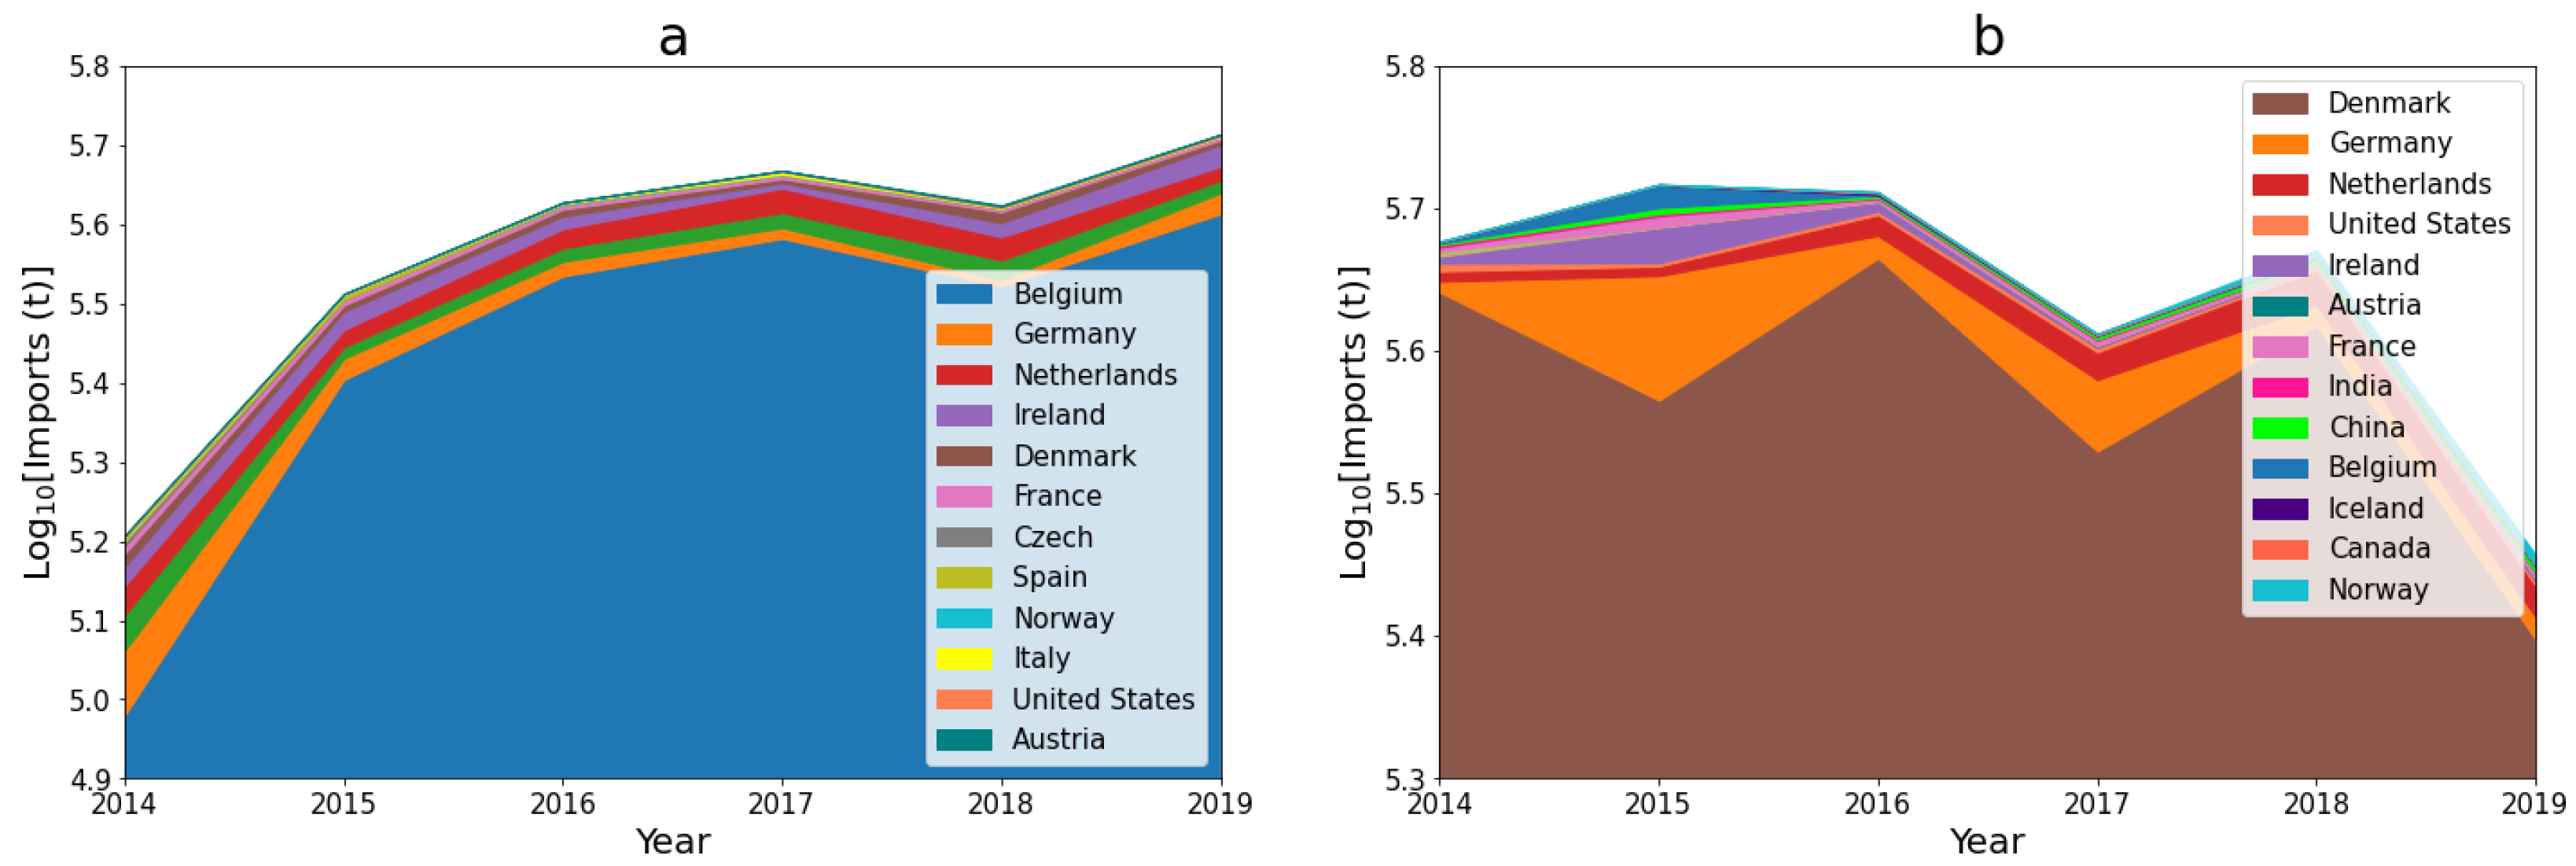
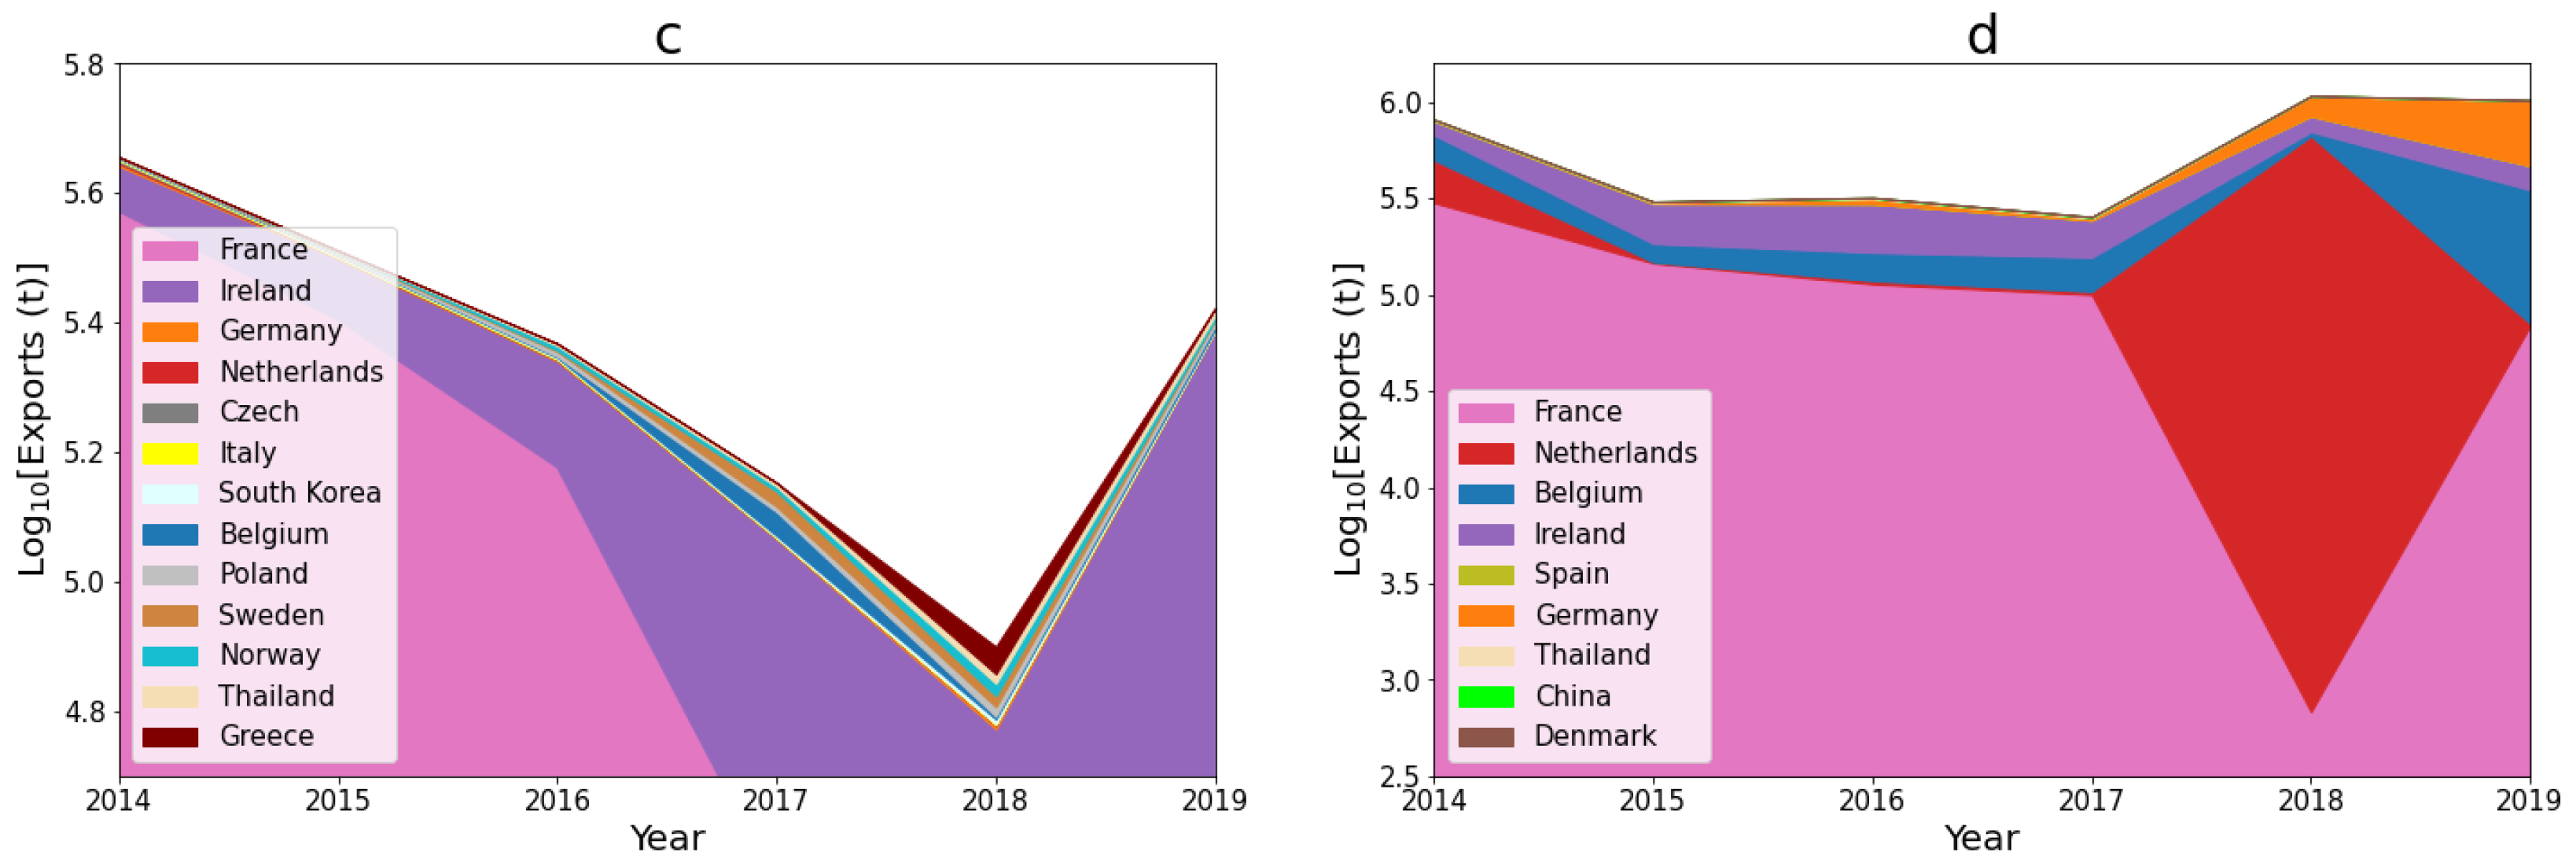
Figure 5 shows the main nations the UK trades sand with. All four graphs in Figure 5 show UK sand trade to be highly regional as most trade occurs with nearby European nations including Belgium, Denmark, Germany, France, and the Netherlands. There are only small trade flows with the United States, Canada, Australia, India, China, South Korea, and Thailand. Dips in trade have occurred, such as during 2019 in Figure 5b and during 2018 in Figure 5c followed by a rebound in 2019, illustrating relative volatility in the sand trade in the UK. The UK mainly imports and exports sand with 10 nations or less. In 2019, 99.5% of trade in both sand types occurred with only 10 nations. The UK is likely over-reliant on some nations for sand. The dominance of individual nations can be seen in Figure 5, as over 50% of trade in both sand types for the UK occurred with one nation during 2019, with Ireland accounting for 91.2% of all silica sands and quartz sands exports. Exports to France show sudden drops for silica sands and quartz sands in 2017 (77.5%) and natural sands NES (not elsewhere specified) in 2018 (99.3%) followed by an increase in total exports in either the same or following year, from nearby European nations. This shows that the UK may be able to mitigate the risks of sudden changes in export patterns, by exporting more to other nations.
5. Discussion
5.1. Consequences for the UK
Analysis of data for the UK shows how the database framework presented here can be used to compile data for the stocks and flows of sand and gravel from different sources with variable classification systems. Data collected for the UK provide insights into the volatility and sensitivity of sand and gravel supply in the UK despite the data sets being incomplete. These insights can be used to consider the impact of certain scenarios on the UK supply chain of sand and gravel, including regional disruptions, such as sudden changes in trade patterns with nearby Western European neighbours due to Brexit, or global disruptions, such as the COVID-19 pandemic or global banking crisis of 2007–2008. In terms of magnitude, the data show that if sand and gravel imports from Belgium and Denmark (the top two sources of imported sand and for the UK, Figure 5) would be halved, the UK would be left without enough sand and gravel for construction and large infrastructure projects. To compensate for this the UK would have to quickly adapt which could include: doubling indigenous extraction rates, decreasing consumption, increasing recycling rates, increasing national stocks of sand and gravel as a buffer, and decreasing exports or importing more from other nations. Increasing national stocks of sand and gravel would require increased inputs of sand and gravel to the UK in the form of increased imports and extractions rates, which are problematic and would require substantial storage. A sudden increase in extraction or recycling rates would require new infrastructure such as mines or recycling plants to be built, which could not be developed quickly enough to meet the sudden annual changes in trade patterns seen in Figure 5. Importing sand and gravel from other nations may also lead to an increased likelihood of illegally mined sand being imported to the UK perpetuating the global issues surrounding sand. Steps the UK could take to minimise supply chain risk include diversifying the nations it trades sand and gravel with and increasing the capacity for sand and gravel to be extracted within the UK. However, these both require time and investments.
5.2. Data Availability and Collection
The depth of analysis that can be completed using the database is a function of the breadth and quality of the data available. If data could be collected for the entire material life cycle of sand and gravel, for a particular nation or region, a comprehensive MFA and/or Life Cycle Assessment (LCA) study could be complete, adding further insight to the analyses of the data collected. Unfortunately, even in the relatively well-documented case of the UK, data could only be found for 68% of child processes, with the end-of-life root process devoid of any data at all. The dominance of cross boundary flows (trade data) accounting for 98.5% of all data values collected and the lack of data for key parts of the sand and gravel material life cycle imposes serious limits on the types of analyses that can be currently pursued, but the data gaps are now at least known.
Measures of uncertainty are also generally lacking. Only ONS and UK government sources provided limited measures of uncertainty with data values being stated as being rounded to the nearest one thousand tonnes. Absence of quantified uncertainties limits the reliability of the analyses made from available data. Contradictory data values were common across the various data sources considered for the UK case study. In some cases, differences up to 250% exist between reported values that aim to characterise the same quantities. Large contradictions in data values reported, differences in definitions, and routine revisions and updates of data sources can all introduce strong biases in interpretation. The database presented here can help mitigate these data collection problems, as the proposed classification system removes the ambiguity in definitions and can be updated easily.
5.3. Future Opportunities
The sand and gravel database presented here provides a common classification system for sand and gravel data to be collected from multiple data sources for further analysis. Building on this, data processing techniques such as Bayesian inference [61] or bottom up MFA procedures could be used to fill in the data gaps where data are missing and account for uncertainties in a consistent manner. Construction and assembly of consistent databases, such as the sand and gravel database presented, can aid the effective implementation of circular economy ideals to increase sustainability within the material life cycle of sand and grave.
Suitable sand and gravel data could be used to detect and monitor illegal sand mining and its subsequent trade between nations where it is reported or suspected to exist. Discrepancies in the reporting of trade data from different nations and irreconcilable gaps in the material life cycle could be used to identify areas of possible illicit activity. Singapore is an example of a nation in which illegal trade in sand is allegedly conducted [25,62]. Over the last 20 years, Singapore has imported 517 Mt of sand from neighbouring nations such as Indonesia and Cambodia for land reclamation projects to increase its land area by 23% [1]. Since March 2009, companies importing sand to Singapore have not been required to provide environmental assessments or export permits, allowing illegally mined sand from neighbouring nations to be imported into Singapore [62]. This has led to environmental degradation in source nations, with evidence suggesting that 24 Indonesian islands have been lost due to illegal sand mining from 2005 to 2014 [12]. The sand and gravel database proposed provides a broad understanding of the mining and trade of sand for a nation, such as that given above for Singapore. Systematic collection of data, analyses of these data, and possibly additional checks using Earth observations can be made to better constrain the role of illicit activities or missing data in the material life cycle of sand and gravel for a given region.
6. Conclusions
A database for the stocks and flows of sand and gravel was created, using the UMIS to develop the hierarchical system and the YSTAFDB to format the data tables. The database provides a common classification system for all stocks and flows of these materials that can readily accommodate additional data as they become available. The common classification system for the database facilitates greater convergence in the available data for sand and gravel, allowing more succinct analyses to be made, assisting policymakers in making more informed decisions on the sustainable extraction, trade, and use of sand and gravel. Improved reporting of material stocks and flows data for sand and gravel in the future should become a priority, and it should become systematic, as this will greatly enhance the value of the database presented and improve informed management of sand and gravel sourcing and use.
A case study is presented for the UK. Analysis of UK data identifies risks and informative trends, despite the data not being comprehensive. Large volumes of imports compared to indigenous extraction within the UK coupled with diminishing amounts of sand extracted annually since 1990 shows an increased reliance on sand imports in the UK. The UK is over-reliant on particular nations, especially Western European neighbours, for trade. Any trade restrictions in sand and gravel between the UK and the EU could negatively impact the construction industry and large infrastructure projects in the UK. These risks can be mitigated by diversifying the nations the UK trades sand with and employing new strategies and technologies to increase national sand extraction and decrease national demand for sand and gravel.
Incomplete data such as data for the use of sand in residential buildings and civil infrastructure and recycling and waste of sand constitutes the main source of uncertainty in the database currently. Further analysis using bottom up MFA procedures can be used to fill in these gaps within material cycles for sand and gravel. MFA models could then be used to monitor supply chains in nations where illegal sand mining is a major concern and lead to a more complete understanding of circular economy ideals for sand and gravel.
Supplementary Materials
The following supporting information can be downloaded at: https://0-www-mdpi-com.brum.beds.ac.uk/article/10.3390/resources11040038/s1, Spreadsheet S1: citations. Spreadsheet S2: cross_boundary_flows. Spreadsheet S3: cross_boundary_flow_citations. Spreadsheet S4: flows. Spreadsheet S5: flows_citations. Spreadsheet S6: hierarchy_table. Spreadsheet S7: processes. Spreadsheet S8: processes_citations. Spreadsheet S9: publications. Spreadsheet S10: trade_codes.
Author Contributions
Conceptualization, J.D.M., R.J.M., Y.P. and P.R.B.-P.; methodology, J.D.M., R.J.M. and P.R.B.-P.; formal analysis, J.D.M.; investigation, J.D.M.; data curation, J.D.M.; writing—original draft preparation, J.D.M.; writing—review and editing, J.D.M., R.J.M., Y.P. and P.R.B.-P.; visualization, J.D.M.; supervision, R.J.M., Y.P. and P.R.B.-P.; project administration, P.R.B.-P. All authors have read and agreed to the published version of the manuscript.
Funding
This research received no external funding.
Institutional Review Board Statement
Not applicable.
Informed Consent Statement
Not applicable.
Data Availability Statement
The data used in this article can be found in the Supplementary Materials.
Acknowledgments
We are grateful to Zhenxia Shen for his help checking the database and Ugo Legendre for his valuable comments.
Conflicts of Interest
The authors declare no conflict of interest.
References
- United Nations Environment Programme. Sand and Sustainability: Finding New Solutions for Environmental Governance of Global Sand Resources; Technical Report; United Nations Environment Programme: Nairobi, Kenya, 2019. [Google Scholar]
- Miatto, A.; Schandl, H.; Fishman, T.; Tanikawa, H. Global Patterns and Trends for Non-Metallic Minerals used for Construction. J. Ind. Ecol. 2017, 21, 924–937. [Google Scholar] [CrossRef]
- Ioannidou, D.; Sonnemann, G.; Suh, S. Do we have enough natural sand for low-carbon infrastructure? J. Ind. Ecol. 2020, 24, 1004–1015. [Google Scholar] [CrossRef]
- International Organization for Standardization. Geotechnical Investigation and Testing-Identification and Classification of Soil-Part 1: Identification and Description; Technical Report; International Organization for Standardization: Geneva, Switzerland, 2017. [Google Scholar]
- Gavriletea, M. Environmental impacts of sand exploitation. Analysis of sand market. Sustainability 2017, 9, 1118. [Google Scholar] [CrossRef]
- Torres, A.; Simoni, M.U.; Keiding, J.K.; Müller, D.B.; zu Ermgassen, S.O.; Liu, J.; Jaeger, J.A.; Winter, M.; Lambin, E.F. Sustainability of the global sand system in the Anthropocene. One Earth 2021, 4, 639–650. [Google Scholar] [CrossRef]
- Giljum, S.; Dittrich, M.; Lieber, M.; Lutter, S. Global patterns of material flows and their socio-economic and environmental implications: A MFA study on all Countries world-wide from 1980 to 2009. Resources 2014, 3, 319–339. [Google Scholar] [CrossRef]
- Hámor, T.; Kovács, G. Riverbed aggregates dredging. Eur. Geol. 2018, 45, 15–16. [Google Scholar]
- De Leeuw, J.; Shankman, D.; Wu, G.; de Boer, W.F.; Burnham, J.; He, Q.; Yesou, H.; Xiao, J. Strategic assessment of the magnitude and impacts of sand mining in Poyang Lake, China. Reg. Environ. Chang. 2010, 10, 95–102. [Google Scholar] [CrossRef]
- Schandl, H.; Fischer-Kowalski, M.; West, J.; Giljum, S.; Dittrich, M.; Eisenmenger, N.; Geschke, A.; Lieber, M.; Wieland, H.; Schaffartzik, A.; et al. Global material flows and resource productivity forty years of evidence. J. Ind. Ecol. 2018, 22, 827–838. [Google Scholar] [CrossRef]
- Filho, W.L.; Hunt, J.; Lingos, A.; Platje, J.; Vieira, L.W.; Will, M.; Gavriletea, M.D. The unsustainable use of sand: Reporting on a global problem. Sustainability 2021, 13, 3356. [Google Scholar] [CrossRef]
- Bisht, A. Conceptualizing sand extractivism: Deconstructing an emerging resource frontier. Extr. Ind. Soc. 2021, 8, 100904. [Google Scholar] [CrossRef]
- Boubault, A.; Maïzi, N. Devising mineral resource supply pathways to a low-carbon electricity generation by 2100. Resources 2019, 8, 33. [Google Scholar] [CrossRef]
- Zhang, G.; Song, J.; Yang, J.; Liu, X. Performance of mortar and concrete made with a fine aggregate of desert sand. Build. Environ. 2006, 41, 1478–1481. [Google Scholar] [CrossRef]
- Zaitri, R.; Bederina, M.; Bouziani, T.; Makhloufi, Z.; Hadjoudja, M. Development of high performances concrete based on the addition of grinded dune sand and limestone rock using the mixture design modelling approach. Constr. Build. Mater. 2014, 60, 8–16. [Google Scholar] [CrossRef]
- Neumann, F.; Curbach, M. Thermal treatment of desert sand to produce construction material. MATEC Web Conf. 2018, 149, 01030. [Google Scholar] [CrossRef]
- Hackney, C.R.; Vasilopoulos, G.; Heng, S.; Darbari, V.; Walker, S.; Parsons, D.R. Sand mining far outpaces natural supply in a large alluvial river. Earth Surf. Dyn. Discuss. 2021, 9, 1232–1334. [Google Scholar] [CrossRef]
- Balogun, A.O.; Smith, T.D. Musculoskeletal symptoms among stone, sand and gravel mine workers and associations with sociodemographic and job-related factors. Int. J. Environ. Res. Public Health 2020, 17, 3512. [Google Scholar] [CrossRef]
- Adeyemi, H.O.; David, A.O.; Akinyemi, O.O.; Opafola, O.T.; Babalola, A.A. Sand shovelling and related injuries among sand mine workers in Nigeria. Sci. Afr. 2020, 8, e00313. [Google Scholar] [CrossRef]
- Rochayati, N.; Mahsup; Ibrahim; Herianto, A.; Johari, H.I. Community understanding and attitude levels on the implementation of illegal sand mining on the Induk Beach, West Lombok. In Proceedings of the IOP Conference Series: Earth and Environmental Science, The 2019 International Conference on Mining and Environmental Technology, Lombok, Indonesia, 15–17 July 2019; Volume 413. [Google Scholar] [CrossRef]
- Mahadevan, P. Sand Mafias in India: Disorganized Crime in a Growing Economy; Technical Report; Global Initiative against Transnational Organized Crime: Geneva, Switzerland, 2019. [Google Scholar]
- Rege, A. Not biting the dust: Using a tripartite model of organized crime to examine India’s Sand Mafia. Int. J. Comp. Appl. Crim. Justice 2016, 40, 101–121. [Google Scholar] [CrossRef]
- Zou, W.; Tolonen, K.T.; Zhu, G.; Qin, B.; Zhang, Y.; Cao, Z.; Kai, P.; Cai, Y.; Gong, Z. Catastrophic effects of sand mining on macroinvertebrates in a large shallow lake with implications for management. Sci. Total. Environ. 2019, 695, 133706. [Google Scholar] [CrossRef]
- Qin, Y.; Chen, Z.; Ding, B.; Li, Z. Impact of sand mining on the carbon sequestration and nitrogen removal ability of soil in the riparian area of Lijiang River, China. Environ. Pollut. 2020, 261, 114220. [Google Scholar] [CrossRef]
- United Nations Environment Programme. Sand, rarer than one thinks. Environ. Dev. 2014, 11, 208–218. [Google Scholar] [CrossRef]
- Mineral Product Association. The Contribution of Recycled and Secondary Materials to Total Aggregates Supply in Great Britain in 2018; Technical Report; Mineral Products Association: London, UK, 2020. [Google Scholar]
- Binici, H.; Shah, T.; Aksogan, O.; Kaplan, H. Durability of concrete made with granite and marble as recycle aggregates. J. Mater. Process. Technol. 2008, 208, 299–308. [Google Scholar] [CrossRef]
- Nassar, R.U.D. Characteristics of Recycled Aggregate Concrete Produced with Crushed Stone Sand as Fine Aggregate. Civ. Eng. Archit. 2020, 8, 632–640. [Google Scholar] [CrossRef]
- Mineral Products Association. From Waste to Resource a UK Mineral Products Industry Success Story; Technical Report; Mineral Products Association: London, UK, 2019. [Google Scholar]
- Sverdrup, H.U.; Koca, D.; Schlyter, P. A Simple System Dynamics Model for the Global Production Rate of Sand, Gravel, Crushed Rock and Stone, Market Prices and Long-Term Supply Embedded into the WORLD6 Model. Biophys. Econ. Resour. Qual. 2017, 2, 1–20. [Google Scholar] [CrossRef]
- Stahel, W.R. Circular economy. Nature 2016, 531, 435–438. [Google Scholar] [CrossRef]
- Haupt, M.; Hellweg, S. Measuring the environmental sustainability of a circular economy. Environ. Sustain. Indic. 2019, 1–2, 100005. [Google Scholar] [CrossRef]
- World Economic Forum. Shaping the Future of Construction A Breakthrough in Mindset and Technology; Technical Report; World Economic Forum Headquarters: Cologny, Switzerland, 2016. [Google Scholar]
- United Nations Industrial Development Organisation (UNIDO). Circular Economy; Technical Report; United Nations Industrial Development Organisation Headquarters: Vienna, Austria, 2021. [Google Scholar]
- European Commission. A New Circular Economy Action Plan For a Cleaner and more Competitive Europe; Technical Report; European Commission: Brussels, Belgium, 2020. [Google Scholar]
- Høibye, L.; Sand, H. Circular Economy in the Nordic Construction Sector; Technical Report; Nordic Council of Ministers: Copenhagen, Denmark, 2018. [Google Scholar] [CrossRef]
- Chaussard, E.; Kerosky, S. Characterization of black sand mining activities and their environmental impacts in the philippines using remote sensing. Remote. Sens. 2016, 8, 100. [Google Scholar] [CrossRef]
- Schwartz, F.W.; Lee, S.; Darrah, T.H. A Review of the Scope of Artisanal and Small-Scale Mining Worldwide, Poverty, and the Associated Health Impacts. GeoHealth 2021, 5, e2020GH000325. [Google Scholar] [CrossRef]
- Schiappacasse, P.; Müller, B.; Linh, L.T. Towards responsible aggregate mining in Vietnam. Resources 2019, 8, 138. [Google Scholar] [CrossRef]
- UK Government. Environmental Taxes, Reliefs and Schemes for Businesses. 2018. Available online: https://www.gov.uk/green-taxes-and-reliefs/aggregates-levy (accessed on 27 July 2021).
- Myers, R.J.; Fishman, T.; Reck, B.K.; Graedel, T.E. Unified Materials Information System (UMIS): An Integrated Material Stocks and Flows Data Structure. J. Ind. Ecol. 2019, 23, 222–240. [Google Scholar] [CrossRef]
- Myers, R.J.; Reck, B.K.; Graedel, T.E. YSTAFDB, a unified database of material stocks and flows for sustainability science. Sci. Data 2019, 6, 1–13. [Google Scholar] [CrossRef] [PubMed]
- Willet, J.C. Construction Sand and Gravel Data Sheet; Technical Report; United States Geological Society: Reston, VA, USA, 2020.
- The Crown Estate. Marine Aggregates The Crown Estate Liscences Summary of Statistics. 2019. Available online: https://www.thecrownestate.co.uk/en-gb/what-we-do/on-the-seabed/minerals-dredging/ (accessed on 6 June 2020).
- Chatham House. Resourcetrade.Earth. 2018. Available online: http://resourcetrade.earth/ (accessed on 6 June 2020).
- European Commission. Eurostat International Trade Data Set. 2020. Available online: https://ec.europa.eu/eurostat/web/euro-indicators/international-trade (accessed on 6 June 2020).
- Office for National Statistics. Mineral Surveys. 2015. Available online: https://www.gov.uk/government/collections/minerals (accessed on 6 June 2020).
- Mangold, J.; Cristobal, K.; Mars, C.; Dornfeld, D. Assessment framework and material flow analysis of material recovery facilities within the U.S. To track consumer electronics by product category. Procedia CIRP 2015, 29, 556–561. [Google Scholar] [CrossRef]
- Müller, E.; Hilty, L.M.; Widmer, R.; Schluep, M.; Faulstich, M. Modeling metal stocks and flows: A review of dynamic material flow analysis methods. Environ. Sci. Technol. 2014, 48, 2102–2113. [Google Scholar] [CrossRef]
- Government Statistical Service. UK Statistics on Waste; Technical Report; Department for Environment, Food & Rural Affairs: London, UK, 2020.
- Industrial Minerals Association. Recycling Industrial Minerals; Technical Report; Industrial Minerals Association: Washington, DC, USA, 2018. [Google Scholar]
- European Aggregate Association. Estimates of Production Data. 2017. Available online: https://uepg.eu/pages/figures (accessed on 27 July 2021).
- Knapman, D. Construction, Demolition and Excavation Waste Arisings, Use and Disposal for England 2008; Technical Report; Waste and Resources Action Programme: Banbury, UK, 2010. [Google Scholar]
- Temple-ERM. High Speed Rail: Consultation on the Route from the West Midlands to Manchester, Leeds and beyond Sustainability Statement Appendix E11-Material Use A Report by Temple-ERM for HS2 Ltd; Technical Report; Temple-ERM: Philadelphia, PA, USA, 2013. [Google Scholar]
- Bide, T.; Balson, P.; Mankelow, J.; Selby, I. A New Sand and Gravel Map for the UK Continental Shelf to Support Sustainable Planning. Resour. Policy 2016, 48, 1–12. [Google Scholar] [CrossRef]
- British Marine Aggregate Producers Association. Key Facts. 2010. Available online: https://bmapa.org/about/key_facts.php (accessed on 6 December 2020).
- Magnusson, S.; Lundberg, K.; Svedberg, B.; Knutsson, S. Sustainable management of excavated soil and rock in urban areas—A literature review. J. Clean. Prod. 2015, 93, 18–25. [Google Scholar] [CrossRef]
- Bendixen, M.; Iversen, L.L.; Best, J.; Franks, D.M.; Hackney, C.R.; Latrubesse, E.M.; Tusting, L.S. Sand, gravel, and UN Sustainable Development Goals: Conflicts, synergies, and pathways forward. One Earth 2021, 4, 1095–1111. [Google Scholar] [CrossRef]
- Mineral Products Association. Sand Supply—A UK Perspective on a Global Issue; Technical Report; Mineral Products Association: London, UK, 2019. [Google Scholar]
- Lupton, R.C.; Allwood, J.M. Hybrid Sankey diagrams: Visual analysis of multidimensional data for understanding resource use. Resour. Conserv. Recycl. 2017, 124, 141–151. [Google Scholar] [CrossRef]
- Lupton, R.C.; Allwood, J.M. Incremental Material Flow Analysis with Bayesian Inference. J. Ind. Ecol. 2018, 22, 1352–1364. [Google Scholar] [CrossRef]
- Global Witness. Shifting Sands: How Singapore’s Demand for Cambodian Sand Threatens Ecosystems and Undermines Good Governance; Technical Report; Global Witness: London, UK, 2010. [Google Scholar]
Figure 1.
Graphical representation of common UMIS notation. The image on the left shows the semi-colon notation. This is used to disaggregate a parent process into a child process. The central image shows the use of the underscore notation. This is used to show a flow of material between two processes. The image on the right shows the use of the apostrophe notation, used for divergent disaggregation. Divergent disaggregation occurs when a parent process can be disaggregated in more than one way based on the different characteristics of the child processes. This shows how a parent process can be copied (’ is the copied version) to allow for divergent disaggregation of parent processes. This prevents double counting of data if the data are disaggregated in more than one way (e.g., 1/2 and A/B shown in the figure).

Figure 2.
Classification structure of the sand and gravel database. The outer black outlined box represents the whole system. Each black outlined box within the whole system represents a root process of the database. Within each root process box is a tree diagram showing the disaggregation of processes within the root process. The lettered dashed boxes highlight parts of the database that use the same system of disaggregation as other reports, data sets, and commodity hierarchies. NES in Natural Sands NES stands for Not Elsewhere Specified.

Figure 3.
Time series of the mass of sand and gravel extracted from the UK from 1992 to 2019.

Figure 5.
Composite line graphs to show the imports and exports of the two types of sand for the UK. Data provided are from Chatham House [45]. The y-axis is the log of each value. (a) imports of silica sands and quartz sands; (b) imports of natural sands NES (not elsewhere specified); (c) exports of silica sands and quartz sands; (d) exports of natural sands NES. Only nations where the import or export was greater than 1 kt have been shown.


Publisher’s Note: MDPI stays neutral with regard to jurisdictional claims in published maps and institutional affiliations. |
© 2022 by the authors. Licensee MDPI, Basel, Switzerland. This article is an open access article distributed under the terms and conditions of the Creative Commons Attribution (CC BY) license (https://creativecommons.org/licenses/by/4.0/).
Share and Cite
MDPI and ACS Style
Morley, J.D.; Myers, R.J.; Plancherel, Y.; Brito-Parada, P.R. A Database for the Extraction, Trade, and Use of Sand and Gravel. Resources 2022, 11, 38. https://0-doi-org.brum.beds.ac.uk/10.3390/resources11040038
AMA Style
Morley JD, Myers RJ, Plancherel Y, Brito-Parada PR. A Database for the Extraction, Trade, and Use of Sand and Gravel. Resources. 2022; 11(4):38. https://0-doi-org.brum.beds.ac.uk/10.3390/resources11040038
Chicago/Turabian StyleMorley, John D., Rupert J. Myers, Yves Plancherel, and Pablo R. Brito-Parada. 2022. "A Database for the Extraction, Trade, and Use of Sand and Gravel" Resources 11, no. 4: 38. https://0-doi-org.brum.beds.ac.uk/10.3390/resources11040038
Note that from the first issue of 2016, this journal uses article numbers instead of page numbers. See further details here.