Article

Critical Minerals and Energy–Impacts and Limitations of Moving to Unconventional Resources

1
Graduate School of Energy Science, Kyoto University, Yoshida honmachi, Sakyo-ku, Kyoto 606-8501, Japan
2
Sustainable Minerals Institute, The University of Queensland, St Lucia, Queensland 4072, Australia
3
Faculty of Science and Technology, Ritsumeikan University, Nojihigashi 1-1-1, Kusatsu City, Shiga 525-8577, Japan
4
Institute for Sustainable Futures, University of Technology, Sydney, Ultimo, New South Wales 2007, Australia
*
Author to whom correspondence should be addressed.
Submission received: 7 August 2015 / Revised: 28 April 2016 / Accepted: 3 May 2016 / Published: 13 May 2016
(This article belongs to the Special Issue Resource Productivity and Innovations)

Abstract

:
The nexus of minerals and energy becomes ever more important as the economic growth and development of countries in the global South accelerates and the needs of new energy technologies expand, while at the same time various important minerals are declining in grade and available reserves from conventional mining. Unconventional resources in the form of deep ocean deposits and urban ores are being widely examined, although exploitation is still limited. This paper examines some of the implications of the transition towards cleaner energy futures in parallel with the shifts through conventional ore decline and the uptake of unconventional mineral resources. Three energy scenarios, each with three levels of uptake of renewable energy, are assessed for the potential of critical minerals to restrict growth under 12 alternative mineral supply patterns. Under steady material intensities per unit of capacity, the study indicates that selenium, indium and tellurium could be barriers in the expansion of thin-film photovoltaics, while neodymium and dysprosium may delay the propagation of wind power. For fuel cells, no restrictions are observed.

1. Introduction

As global growth in economies and population places greater pressure on the finite resources of the planet and environmental issues at all scales become increasingly urgent, important conjunctions of issues are seen to require simultaneous consideration. One of these areas is the minerals-energy nexus [1]. This nexus may have significant implications for the future, in issues such as fuel mineral depletion implications for conventional energy system expansion or continuation; declining ore grade and increasing depth of mining impacting on the energy requirement for extraction of minerals; and the available reserves of functional minerals required for energy efficient devices and clean energy technologies. These issues must also be viewed within the broader global trends of development and associated environmental, social, political, supply security and economic challenges.
This paper has two main aims: firstly to provide an overview of background issues and contexts of importance to the minerals-energy nexus, and secondly to undertake an initial assessment of a variety of supply scenarios for critical minerals associated with clean energy to provide for the needs of alternative energy demand scenarios.
The paper is structured as follows: Firstly, the nexus is considered from the perspective of supply and demand, and the key drivers in and between each category are discussed. The current state of affairs and recent historical context are briefly examined with regards to energy and minerals separately. The focus of this paper is then to selectively examine how the nexus of these issues may constrain or enhance future sustainable development. Next, the paper considers the nexus implications for critical minerals—which have attracted significant attention in recent years—and in the unconventional and secondary sources of minerals that may supplement or substitute for conventional reserves as depletion progresses. The paper presents three scenarios for energy consumption growth, based on data from the International Energy Agency (IEA) [2,3] extrapolated using recent growth trends and assumptions of future progress in demand reduction (with developed and developing countries considered concurrently). Each of these scenarios then further contains three levels of energy generation limits from solar, wind and fuel cells (10%–30% of total primary energy), which is used to provide the material demand for critical minerals in each scenario. Production trends for key critical minerals are then compared with the demand for clean energy expansion in these energy scenarios, with 12 different supply estimates used to identify potential shortfalls (including four base scenarios, with two recycling scenarios applied to each). The results are then discussed, in conjunction with important considerations on the viability of deep ocean and energy-urban ore deposits.

2. Current Overview of Global Energy and Minerals

2.1. Energy

Despite energy demand now falling in developed countries such as the United Kingdom (UK), [4] global demand for energy is still rising, due to both increasing population and concurrent economic development; at the same time, concerns about global warming are driving the use of more energy-efficient and clean energy generation technologies. The overall demand trends can be seen from Figure 1, in which the OECD (Organization for Economic Cooperation and Development) is effectively the group of highest-income, developed, or North, countries, while the non-OECD are generally the lower-income, less-developed global South. (Using the OECD/non-OECD partition is due to the groupings applied in International Energy Agency (IEA) statistics [2].) Some important points to note are that the growth of energy demand in developed countries has been at nearly the same rate as the population growth, while in developing countries growth in demand has grown at approximately double the population growth. Moreover, the GDP growth of developing countries has been at double the energy demand growth—or close to five times the growth of population—while growth in developed countries’ GDP has been at a similar ratio (around five times the population growth). However, if it is assumed that the “ideal” sustainable future would bring the ratios of OECD to non-OECD figures for GDP, population and energy consumption close to equal (in order to have equitable consumption of all resources), then there is still a significant gap between the two groups. Bridging this gap will require a significant increase in energy usage by the developing world, hopefully combined with a concurrent reduction in energy usage by the developed world.
On the supply side of the balance, it is important to consider the source of the energy being supplied, as this is critical to the impacts of supplying that energy. Figure 2 shows this for (a) the non-OECD and (b) the OECD. It is apparent that, until 2012, coal was the major supporting fuel for non-OECD energy growth while the OECD had developed more capacity in renewables, and nuclear and natural gas. In this period the OECD has increased its reliance on natural gas, renewable energy and nuclear power, while the non-OECD has decreased renewable energy as a percentage of its energy mix (see Table 1 for the relevant percentages of the Total Primary Energy Supply (TPES) mix). The falling costs of solar may result in future changes to the historical mixes shown.
To understand more clearly the change in renewable energy technologies, Table 2 shows the renewable energy mix and average annualized growth rate (year on year) for the two groups. It is apparent that in the OECD the mix has shown a shift away from hydropower to other forms, including an increase in the usage of biofuels and waste, while in the non-OECD hydropower has been widely and rapidly expanded to take a significant share from biomass. It should also be noted that (as shown in Figure 2) the total renewable energy supply in the developing world is more than twice that of the OECD.

2.2. Minerals

Minerals production, as with energy, has been growing rapidly in response to economic growth and social development in the global South. Mineral commodities vary widely in their rates of production, based both on demand (as shown in Figure 3, the bulk commodities dwarf other minerals), and also on the availability, accessibility and affordability of extraction. Prices, likewise, are highly variable between commodities, as well as seeing significant fluctuations over time, with value not necessarily linked to usefulness or scarcity of a material. Unlike energy commodities, non-fuel minerals have wider varieties of end-uses, and in some cases are not utilized by the purchaser in the short term; stockpiling and the market for precious metals as financial instruments are examples of this. The wide variation in mineral commodity end-uses has implications for the competition between alternative social preferences as well as a need to treat individual commodities differently in their assessment. Moreover, the minerals supply chain is often globally distributed—with extraction, processing, refining, manufacturing and end-use often occurring in different regions or countries—with many of the environmental, economic and social implications differing from stage to stage. One of the very important overarching factors regarding accessible minerals is that they are a finite resource and it can take 10–20 years to bring new terrestrial discoveries into production. This has implications for individual mines and producing countries, but also has a significant constraining potential for technologies and activities that utilize them as end products. Production models for many commodities have been developed using the “peak minerals” theory based on currently known resources (e.g., [5,6]), but it can be argued that there is insufficient consideration of such peaks when social development is considered—particularly when rapid growth is being experienced and other, more immediate priorities are apparent.
With the increase in minerals demand, there is a corresponding (though not necessarily linear) increase in the requirement for energy to process such minerals (see Figure 4). Importantly, the different processing routes required for production of different minerals products, and the variability of initial feedstock properties (ore grade, hardness, composition, etc.), means that the energy requirements are variable across and within mineral types. Globally, the production of iron and steel uses the most energy, followed by non-metallic minerals (largely cement), then non-ferrous metals, if the total mineral production is considered [9]; however, the energy intensity (on a per ton basis) of non-ferrous metals is greater than that of iron and steel, which is in turn greater than that of non-metallic minerals. The use of energy also varies greatly across the supply chain, with much more energy being used per ton of final product in the latter stages (smelting and refining) than in the extraction of ore. Moreover, the specific type of energy use—electric, thermal or chemical non-energy usage—is important to the overall impacts and potential expansion of minerals supply. These differences must be kept in mind when considering the broader global trends in mineral utilization.
The renewable energy usage in minerals production globally, shown in Figure 5, has remained relatively static until 2012 as a percentage of the total, after a peak in the late 1980s through the early 1990s (with the exception of non-ferrous metals). These rates of renewable energy usage are also significantly below the rates for the total energy consumption across all sectors of the economy. While it has been shown elsewhere that there are significant barriers as well as significant potential to renewable energy uptake in the minerals industry, it is apparent that the current level of utilization is far below the ultimate potential [9].
Energy consumption in the minerals industry has grown significantly, but it is interesting to note that the non-OECD has outstripped the OECD in every subsector (Figure 6). In the case of the OECD, energy usage for iron and steel production has decreased below 1971 levels, while the non-metallic minerals subsector has increased at lower than the rate of population growth overall (see Figure 1, Table 3 and Figure 6). Only mining and quarrying energy consumption have expanded faster than GDP growth in the OECD. In the non-OECD, energy consumption in the minerals sectors has grown faster than overall energy consumption and much faster than population growth. Energy growth in non-metallic minerals and iron and steel (the major construction materials) has been relatively consistent with GDP growth, while mining and quarrying energy has grown much more than all of the other indicators (Table 3). There are likely to be a number of factors involved in this energy increase, not just an increase in mining activity itself. Changes from non-mechanized to mechanized mining techniques, shifts in mining or processing locations from OECD to non-OECD to make use of better ores or better financial conditions (particularly labor costs), and the shift from higher grade to lower grade ores and shallower to deeper mines may be some of the important contributing factors.
Mining development activity has been demonstrated as moving from countries that both produce and consume metals to countries that produce metals, which are then exported to metal-consuming countries [10]. This previous study showed that from 1960 to 2010 the copper supply that was mined in the country in which it was ultimately consumed dropped from 55% to 25%, with similar changes for bauxite, iron ore and nickel [10]. A key consequence of this shift is that governments of producing countries have become more focused on how to maximize the benefit of metal extraction for their economies, while the main aim of countries that are both metal producers and consumers is how to supply cheap raw materials. There is subsequently now greater attention on how projects in the metal-producing regions can be made to serve the broader interests of national and regional economic development [10]. The importance of development that derives lasting benefit and diversification of the economy from extractive industries is an important perspective in avoiding the “resource curse” [11]. From the perspective of large, multi-national mining companies, the shift towards developing country deposits has opened up risks associated with political stability and identified crucial needs to provide local skills development [12].

2.3. Critical Minerals and Unconventional Resources

As can be seen in Figure 3, the bulk minerals—coal, steel and cement—dwarf the other commodities with regards to production tonnage rates. While being very important to the basic infrastructure requirements of modern societies and to the overall climate change impact of the minerals industry [13], these commodities are not considered “critical” by most countries [14], and thus are not the main focus of this paper. Critical minerals have recently been of growing interest due to the demand growth and the limits on supply, some of these being physical limits, others being economic limits, and yet others being the vulnerability associated with the centrality of supply (the rare earths case being a typical example [15]). Various countries and regions have different criteria and methods for determining the criticality of minerals, and the economic structure and domestic availability of minerals make the specific listings of critical minerals vary by nation and by year (e.g., [16,17,18,19,20]).
In this paper we will primarily consider the use of minerals in energy systems as the driver, but will also examine particular minerals that are considered critical and are sought from unconventional resources. Table 4 presents data on some of the more relevant minerals for the sake of this study, while Figure 7 shows the changes in production and prices of these minerals. These sources emphasize the fact that it is not just the price or rate of global production or even the centrality of supply that makes a mineral critical, but is more likely to be a combination of these plus the additional demand-supply balance and political concerns.
There have been a number of studies examining the potential constraints that individual metals may place on future energy technologies. Important examples have been: neodymium and dysprosium for permanent magnets used in wind turbines and electric vehicles [22,23,24,25]; platinum group metals (PGMs) with particular reference to fuel cell technology [23,26,27,28,29,30,31]; photo-active materials for thin-film solar cells (cadmium, tellurium, selenium, gallium, indium) [32,33,34,35,36,37,38]; lithium for batteries in electric vehicles [39,40,41,42,43]; rare earth elements (REE) (rare earth elements typically include 17 elements, scandium, yttrium, and the lanthanide series. In the case of this study, the REE of interest are neodymium, dysprosium and yttrium. Mine production of REE is typically reported as total oxide–REO. In some technologies an oxide form is utilized (e.g., yttria in solid oxide fuel cells), in other cases the elemental metal is utilized (e.g., neodymium and dysprosium in magnets), and this will be specified as required.) for various high-efficiency devices and fuel cells [44]. Additionally, broader studies considering “energy-critical” minerals have been conducted on multiple technologies [45,46]. These studies have in general identified that there could be high increases in demand, but that the limitations on supply are likely to be short-term constraints. With regard to the specific metals, PGM studies have had mixed conclusions with some arguing that supply issues are unlikely to be problematic [27,30], while others have indicated that demand will outstrip supply [28,31], and that in the short term, some challenges with electricity shortages in South Africa have the potential for disruption to supply [31]. In the case of lithium, most studies have indicated that the resources are sufficient for potential future scenarios [39,43]; however, there were some concerns about the physical potential for industry to expand at the required rate [41]. Thin-film solar cells were considered under threat of serious materials supply shortages early on [36], but subsequent analyses have indicated that the likelihood of constrained supply of materials is lowered by the potential for reducing film thicknesses, increasing efficiency, and increasing recycling rates and potential price-induced supply supplementation [35,37,38].
The major unconventional resources considered here are deep ocean ore deposits. There has been some investigation of the potential to source key energy-critical minerals from deep ocean deposits in the literature [49,50]. More recently, there have been attempts to compare the life cycle impacts of such resources with on-shore equivalents [51,52] which, while in the preliminary phases of the research, indicate that the expected impacts of mining itself (on the indicators of energy intensity and global warming potential) will be much higher than average terrestrial mines, and equivalent to some of the deepest mines onshore. The broader environmental impacts of such mineral deposits is still unclear, but it is apparent that social acceptance is likely to be a significant barrier even if the environmental impacts are shown to be low [53]. An important issue still to be understood is when or under what conditions these resources may become both economically feasible and environmentally beneficial in relation to conventional resources and secondary resources such as recycling.

2.4. Recycling

Although there are still significant available reserves of conventional primary metals and minerals, sourcing metals and minerals from secondary sources such as end-of-life products or mine and industrial waste has been of increasing interest in recent years, particularly in countries that have no or few operating mines such as Japan and EU countries. From a metals and minerals perspective, there can be distinct energy and greenhouse gas benefits from sourcing metals from secondary sources. Aluminum is a prime example: primary production of aluminum is hugely energy-intensive, while recycling only requires approximately 5% of the energy required for primary production and in some cases may save nearly 10 tons of CO2-eq per ton of aluminum content [54].
The property of repeated recycling across multiple cycles is, in theory, applicable to all metals as long as sufficient energy is available. Naturally, there is a range of factors, both technical (e.g., technologies for separating contaminants) and non-technical (e.g., economics), that affect the recyclability of individual metals. Aluminum, gold and lead are good examples of metals that can be recycled relatively easily, while copper and zinc are more challenging due to dispersion and intermingling with other materials in their end-usage in society, making them more difficult to recover.
Recycling is seen to have a number of alternative benefits for conventional and unconventional resources, including: growing reserves, proximity to urban centers for recycling, grade [55,56]. Recycling also provides the benefit of reducing ultimate waste disposal requirements. This paper will examine the benefits and challenges of sourcing critical minerals from recycling as an alternative to conventional and unconventional primary resources.

3. Methodology

In order to achieve the aims of the paper, the following research steps were undertaken:
  • Statistical data on energy development trends was collated to examine alternative future energy scenarios as demand for critical minerals (particularly focusing on the expansion rates of wind and solar energy) increases.
  • Materials usage data for the production of specific clean energy technologies was obtained or estimated using available information in order to determine the specific materials requirement for critical minerals in chosen clean energy technologies.
  • Minerals production data was collated in order to estimate potential future minerals production and potential for both secondary (recycling) and primary production expansion.
  • Scenarios for energy and minerals production were analyzed to consider the potential constraints on expanding clean energy technology.
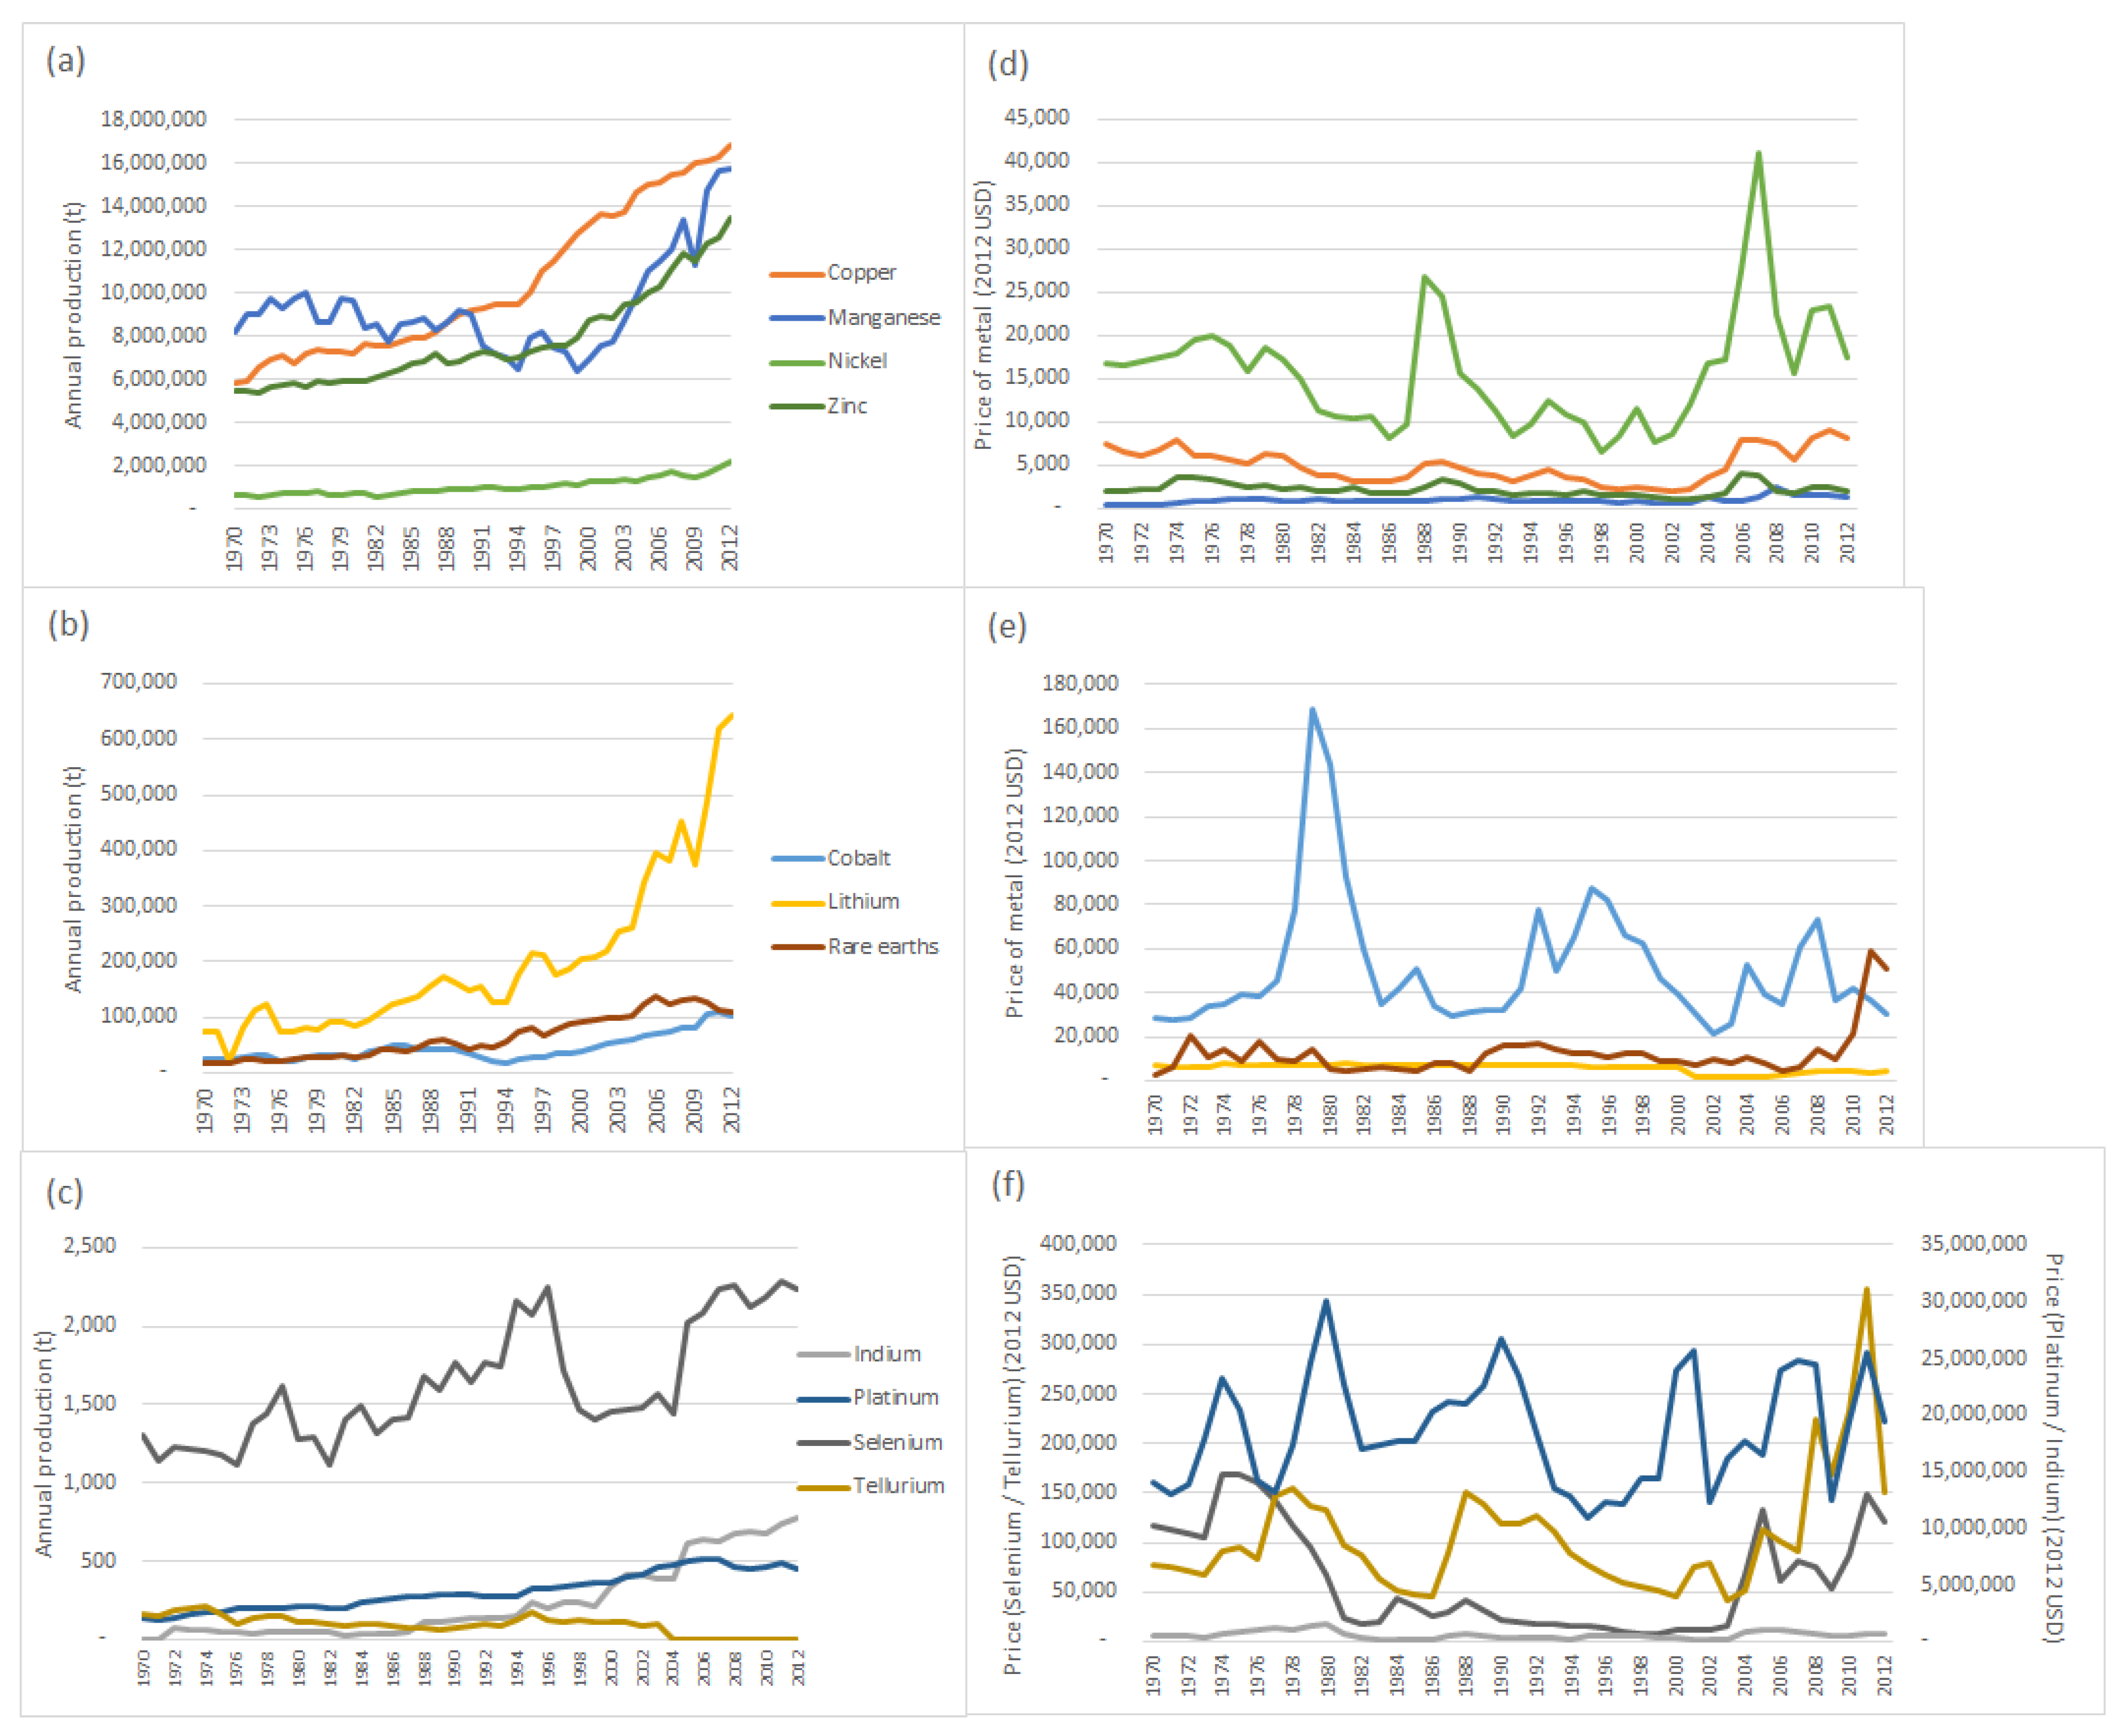
Three key clean energy technologies are examined—solar photovoltaics (PV) (focusing on thin-film cells using critical minerals tellurium, selenium and indium), wind power (with rare earth elements neodymium and dysprosium in magnets) and fuel cells (using, alternatively, platinum or yttrium oxide as key elements). These are not the full suite of available technologies, and they are not considered in concert but rather as individual demand drivers. Importantly, due to the wide coverage of technologies, efforts were made to utilize consistent, publically available data; hence, the minerals production figures from the United States Geological Survey (USGS) are utilized for all minerals, although this may produce some error in estimates where reporting is incomplete.
Following analysis of the scenarios, the discussion includes a consideration of key constraints in making energy urban ores or deep ocean resources feasible for exploitation.

3.1. Energy Scenarios

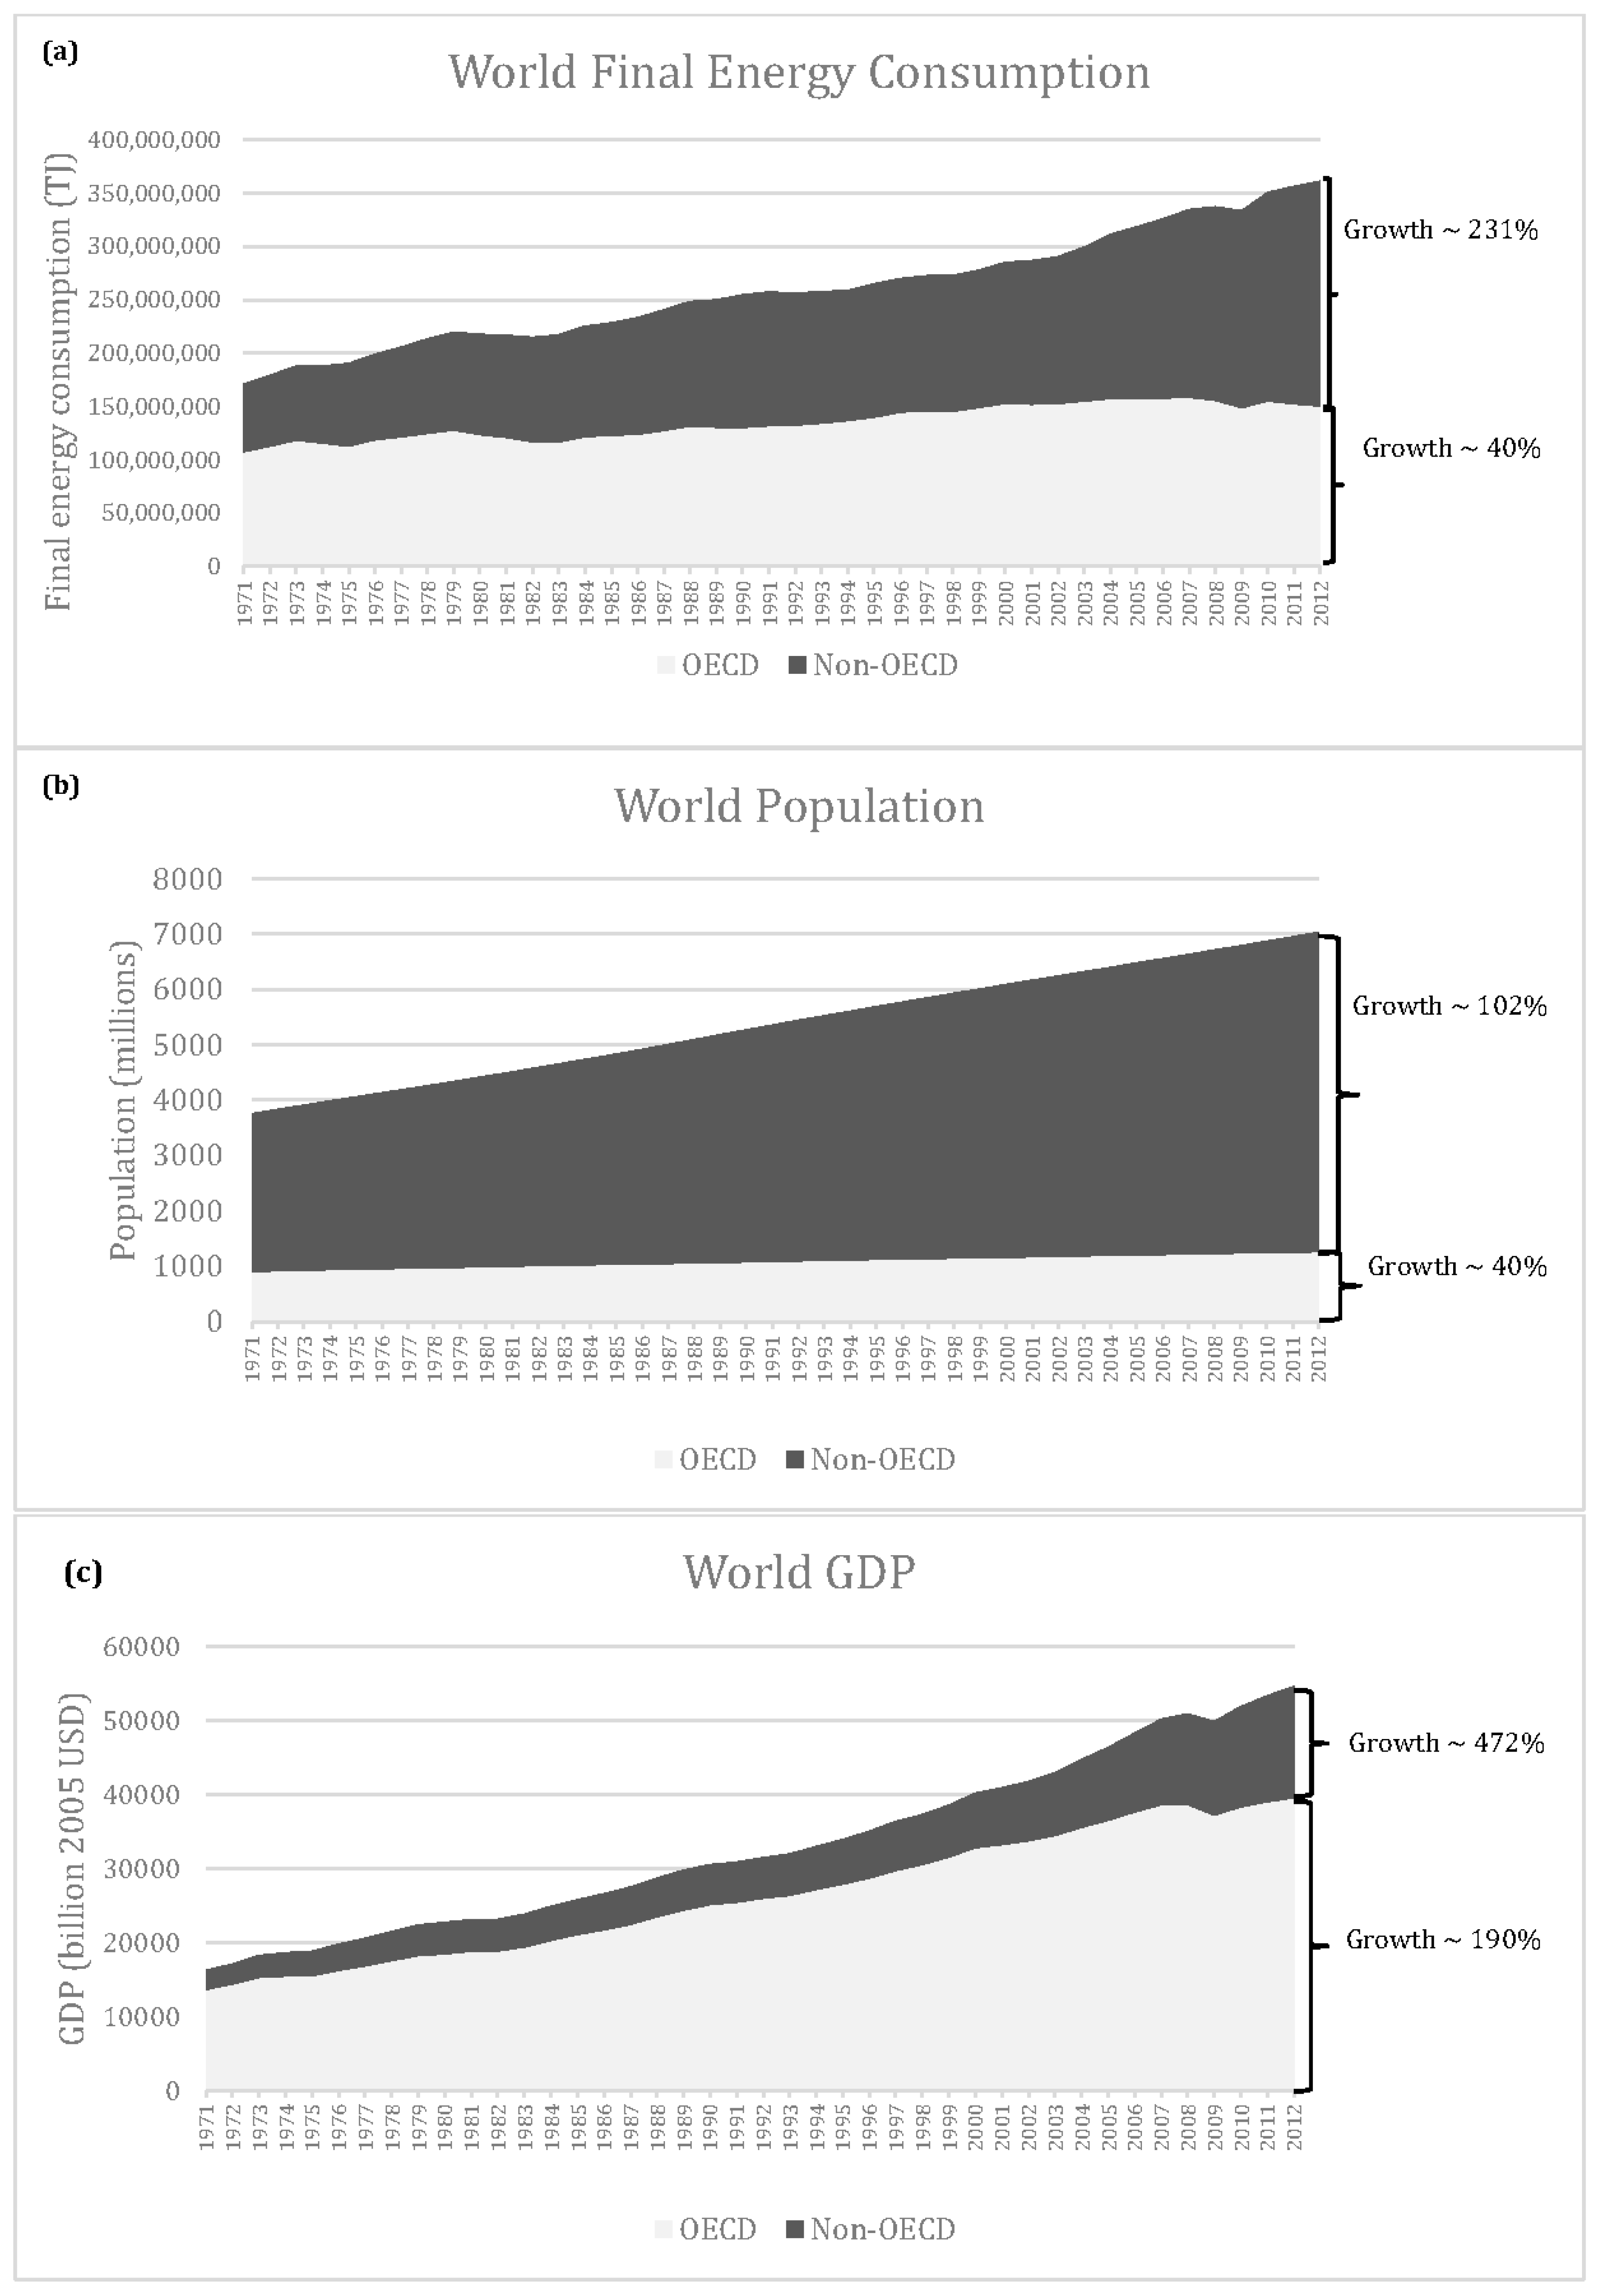
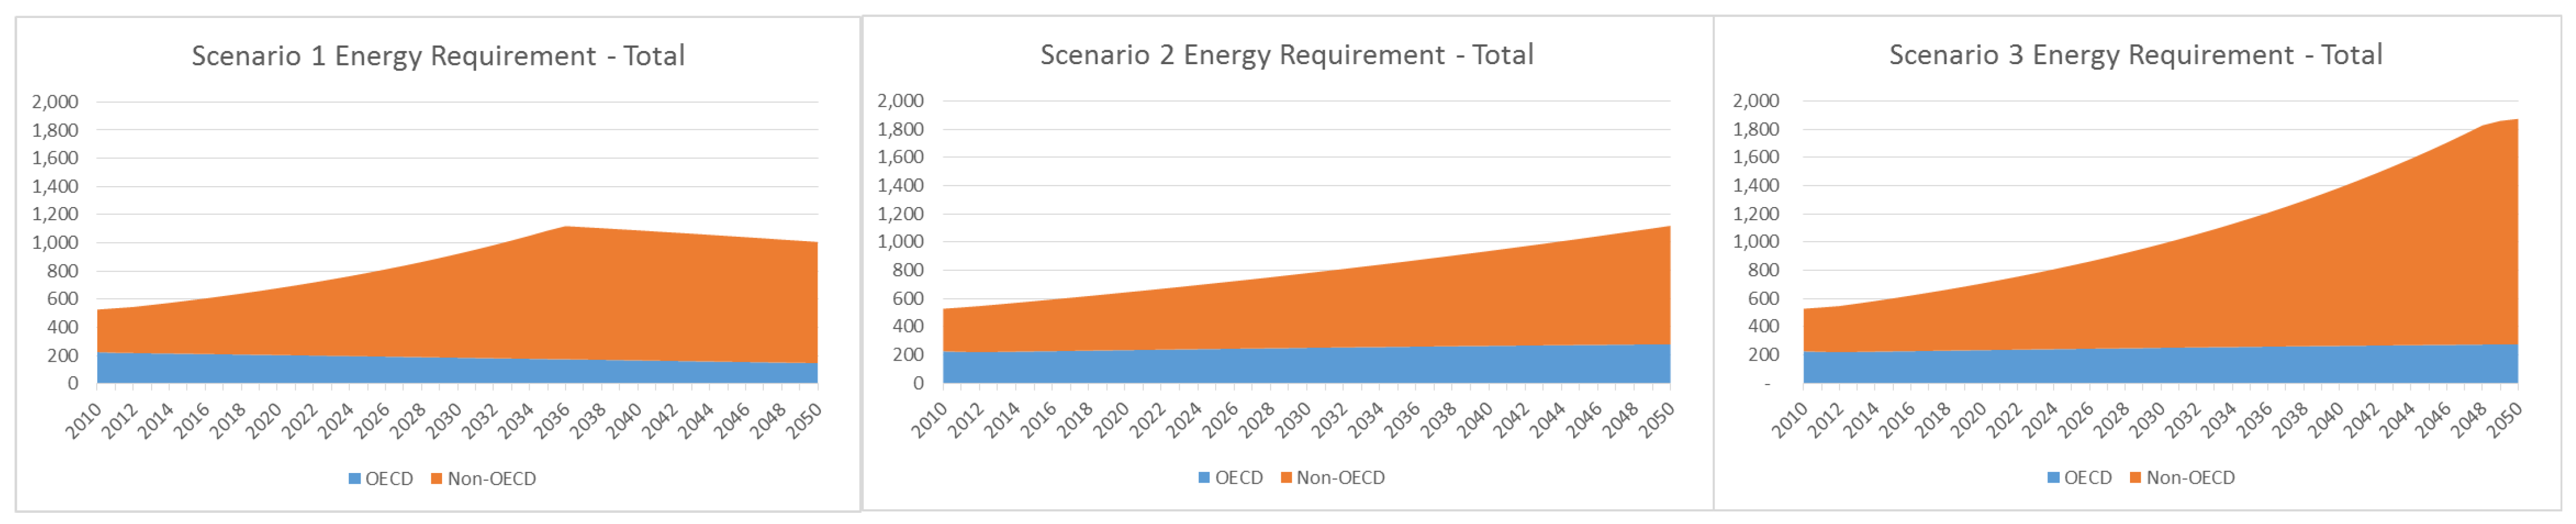
In order to develop a variety of potential future scenarios for critical minerals demand from energy technologies, IEA data was analyzed, and potential trends were extrapolated from 2010 to 2050. With regards to the overall energy demand, the calculations used the per capita energy intensity and projected population trends from the OECD statistics to calculate the total energy requirement, shown in Figure 8. All scenarios assumed the same population trends, and in all scenarios it was assumed that the non-OECD per capita energy usage would eventually equal that of the OECD. In scenario 1, the recent trend of OECD countries of reducing energy intensity is considered to continue at a trend (year on year) decline, while non-OECD countries are assumed to rise to the recent peak of OECD energy intensity before starting to decline. In scenario 2, the longer-term trends of growth are assumed to continue, rather than the recent decline in the OECD. Scenario 3 uses the more recent rapid expansion of the non-OECD and the long-term expansion trends of the OECD in combination.
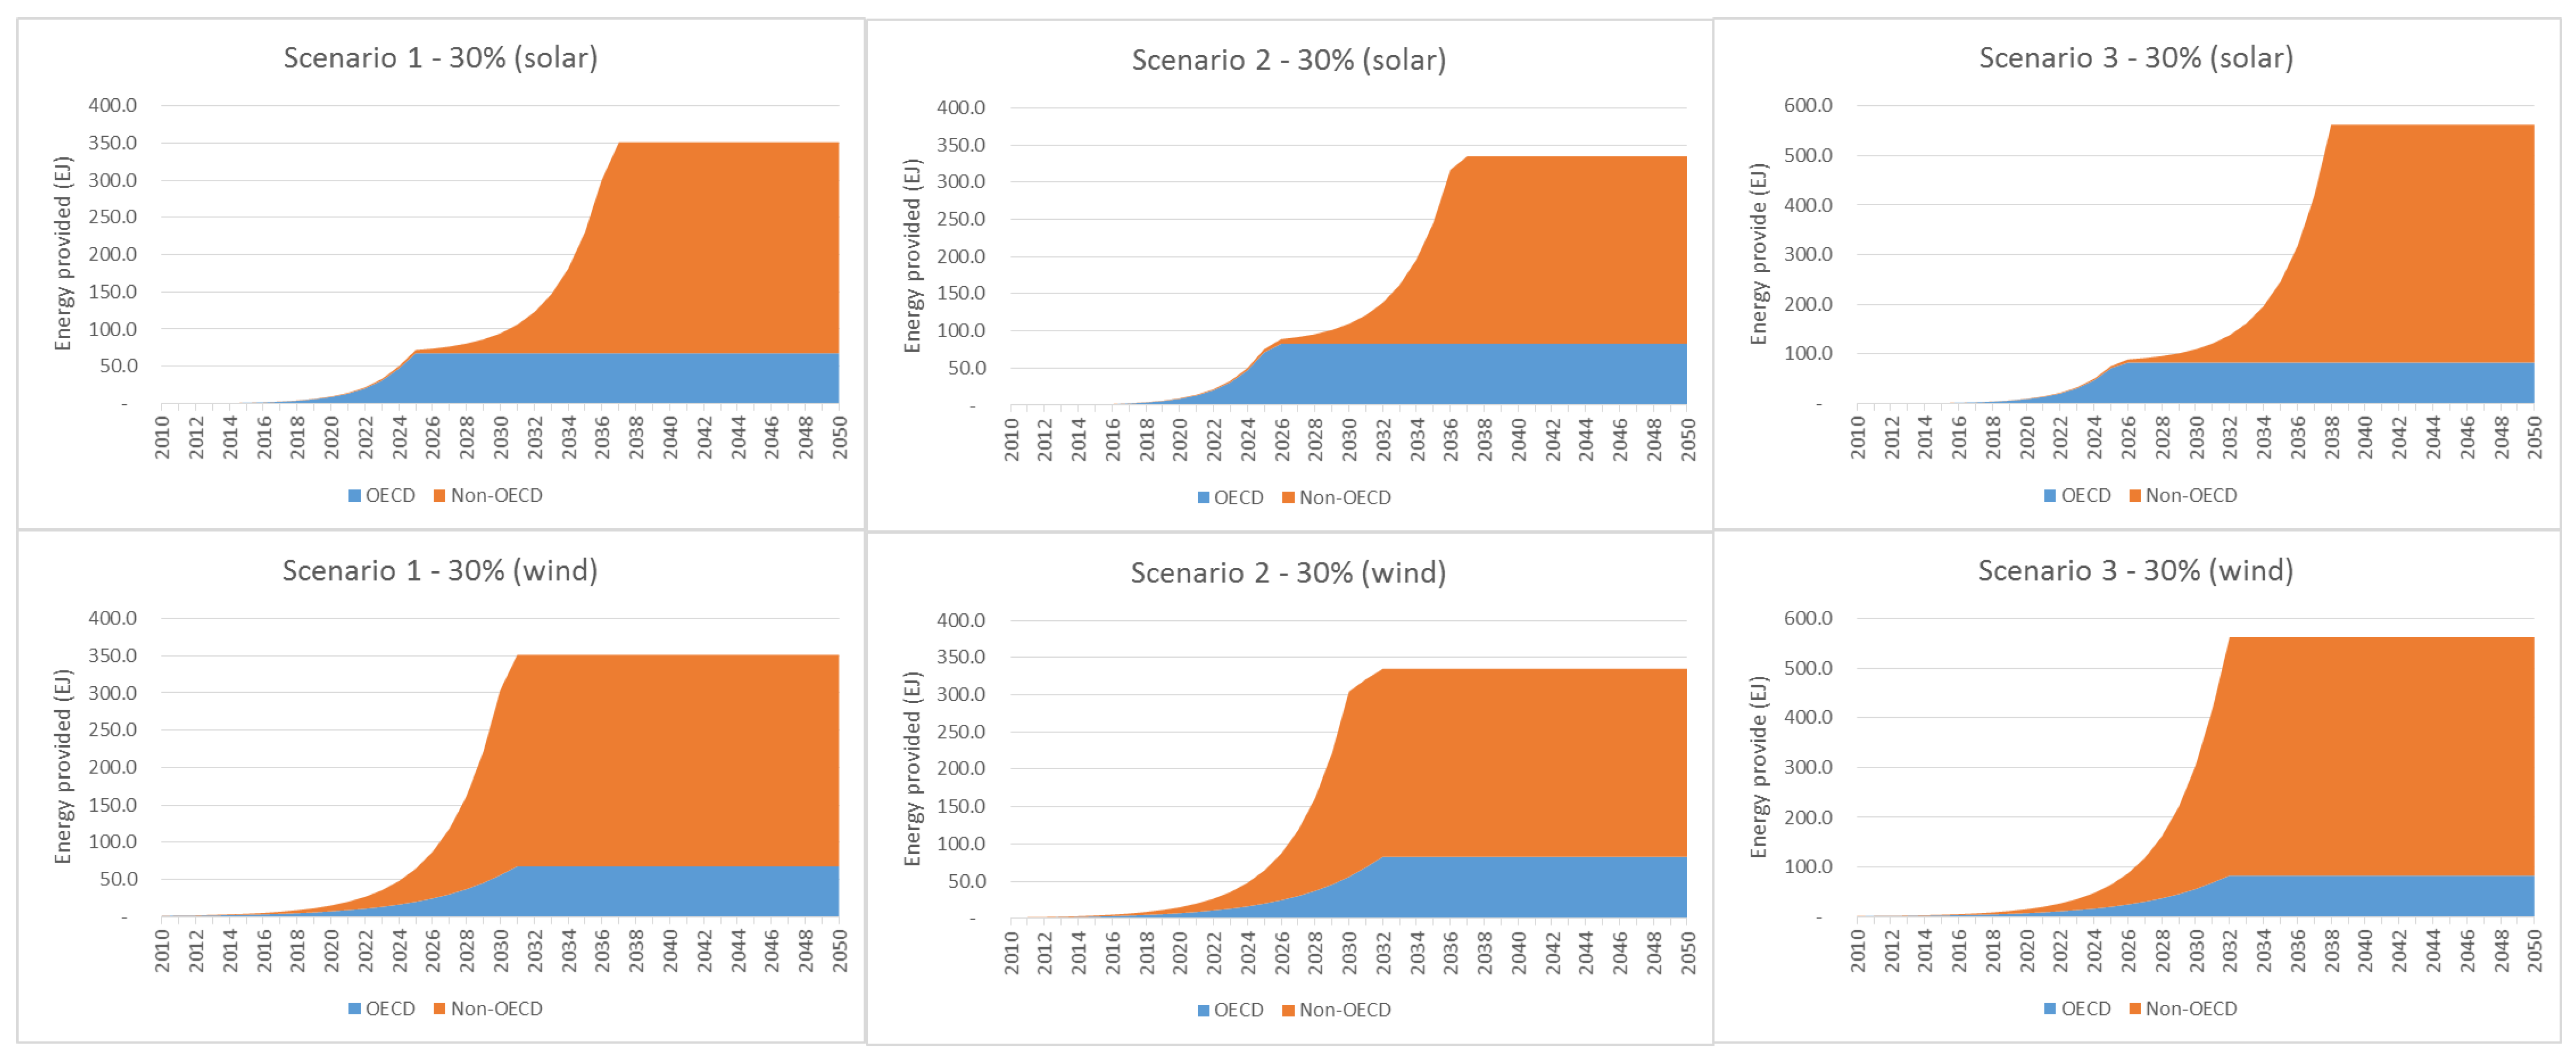
In addition to the scenarios for total energy demand, a number of scenarios were examined for the roll-out of solar photovoltaics, wind power and fuel cells. In the case of fuel cells, a simple percentage of total energy demand was attributed to fuel cell power systems, at levels of 10%, 20% and 30%. In the case of wind power and solar power, historical trends were used to extrapolate future take-up. In all cases, a limit was set on the maximum uptake of wind and solar power, set at 10%, 20% or 30% of the peak annual energy demand for the period out to 2050; once this was attained, it was assumed that this level would be maintained throughout the remainder of the period. The resulting energy demand from solar and wind in the three scenarios is shown in Figure 9.
It should be noted that these levels of clean energy uptake are extremely high when compared with most conventional scenarios, but are based on the historic rates of expansion. Moreover, the uptake of solar power (for example) does not differentiate on the basis of technology, so the thin-film technologies considered here (which do not provide more than 10% of the current solar markets) are considered with respect to their potential to provide for the entire solar expansion, whereas they are realistically only one segment of the overall sector.

3.2. Materials Requirement and Recycling Scenarios

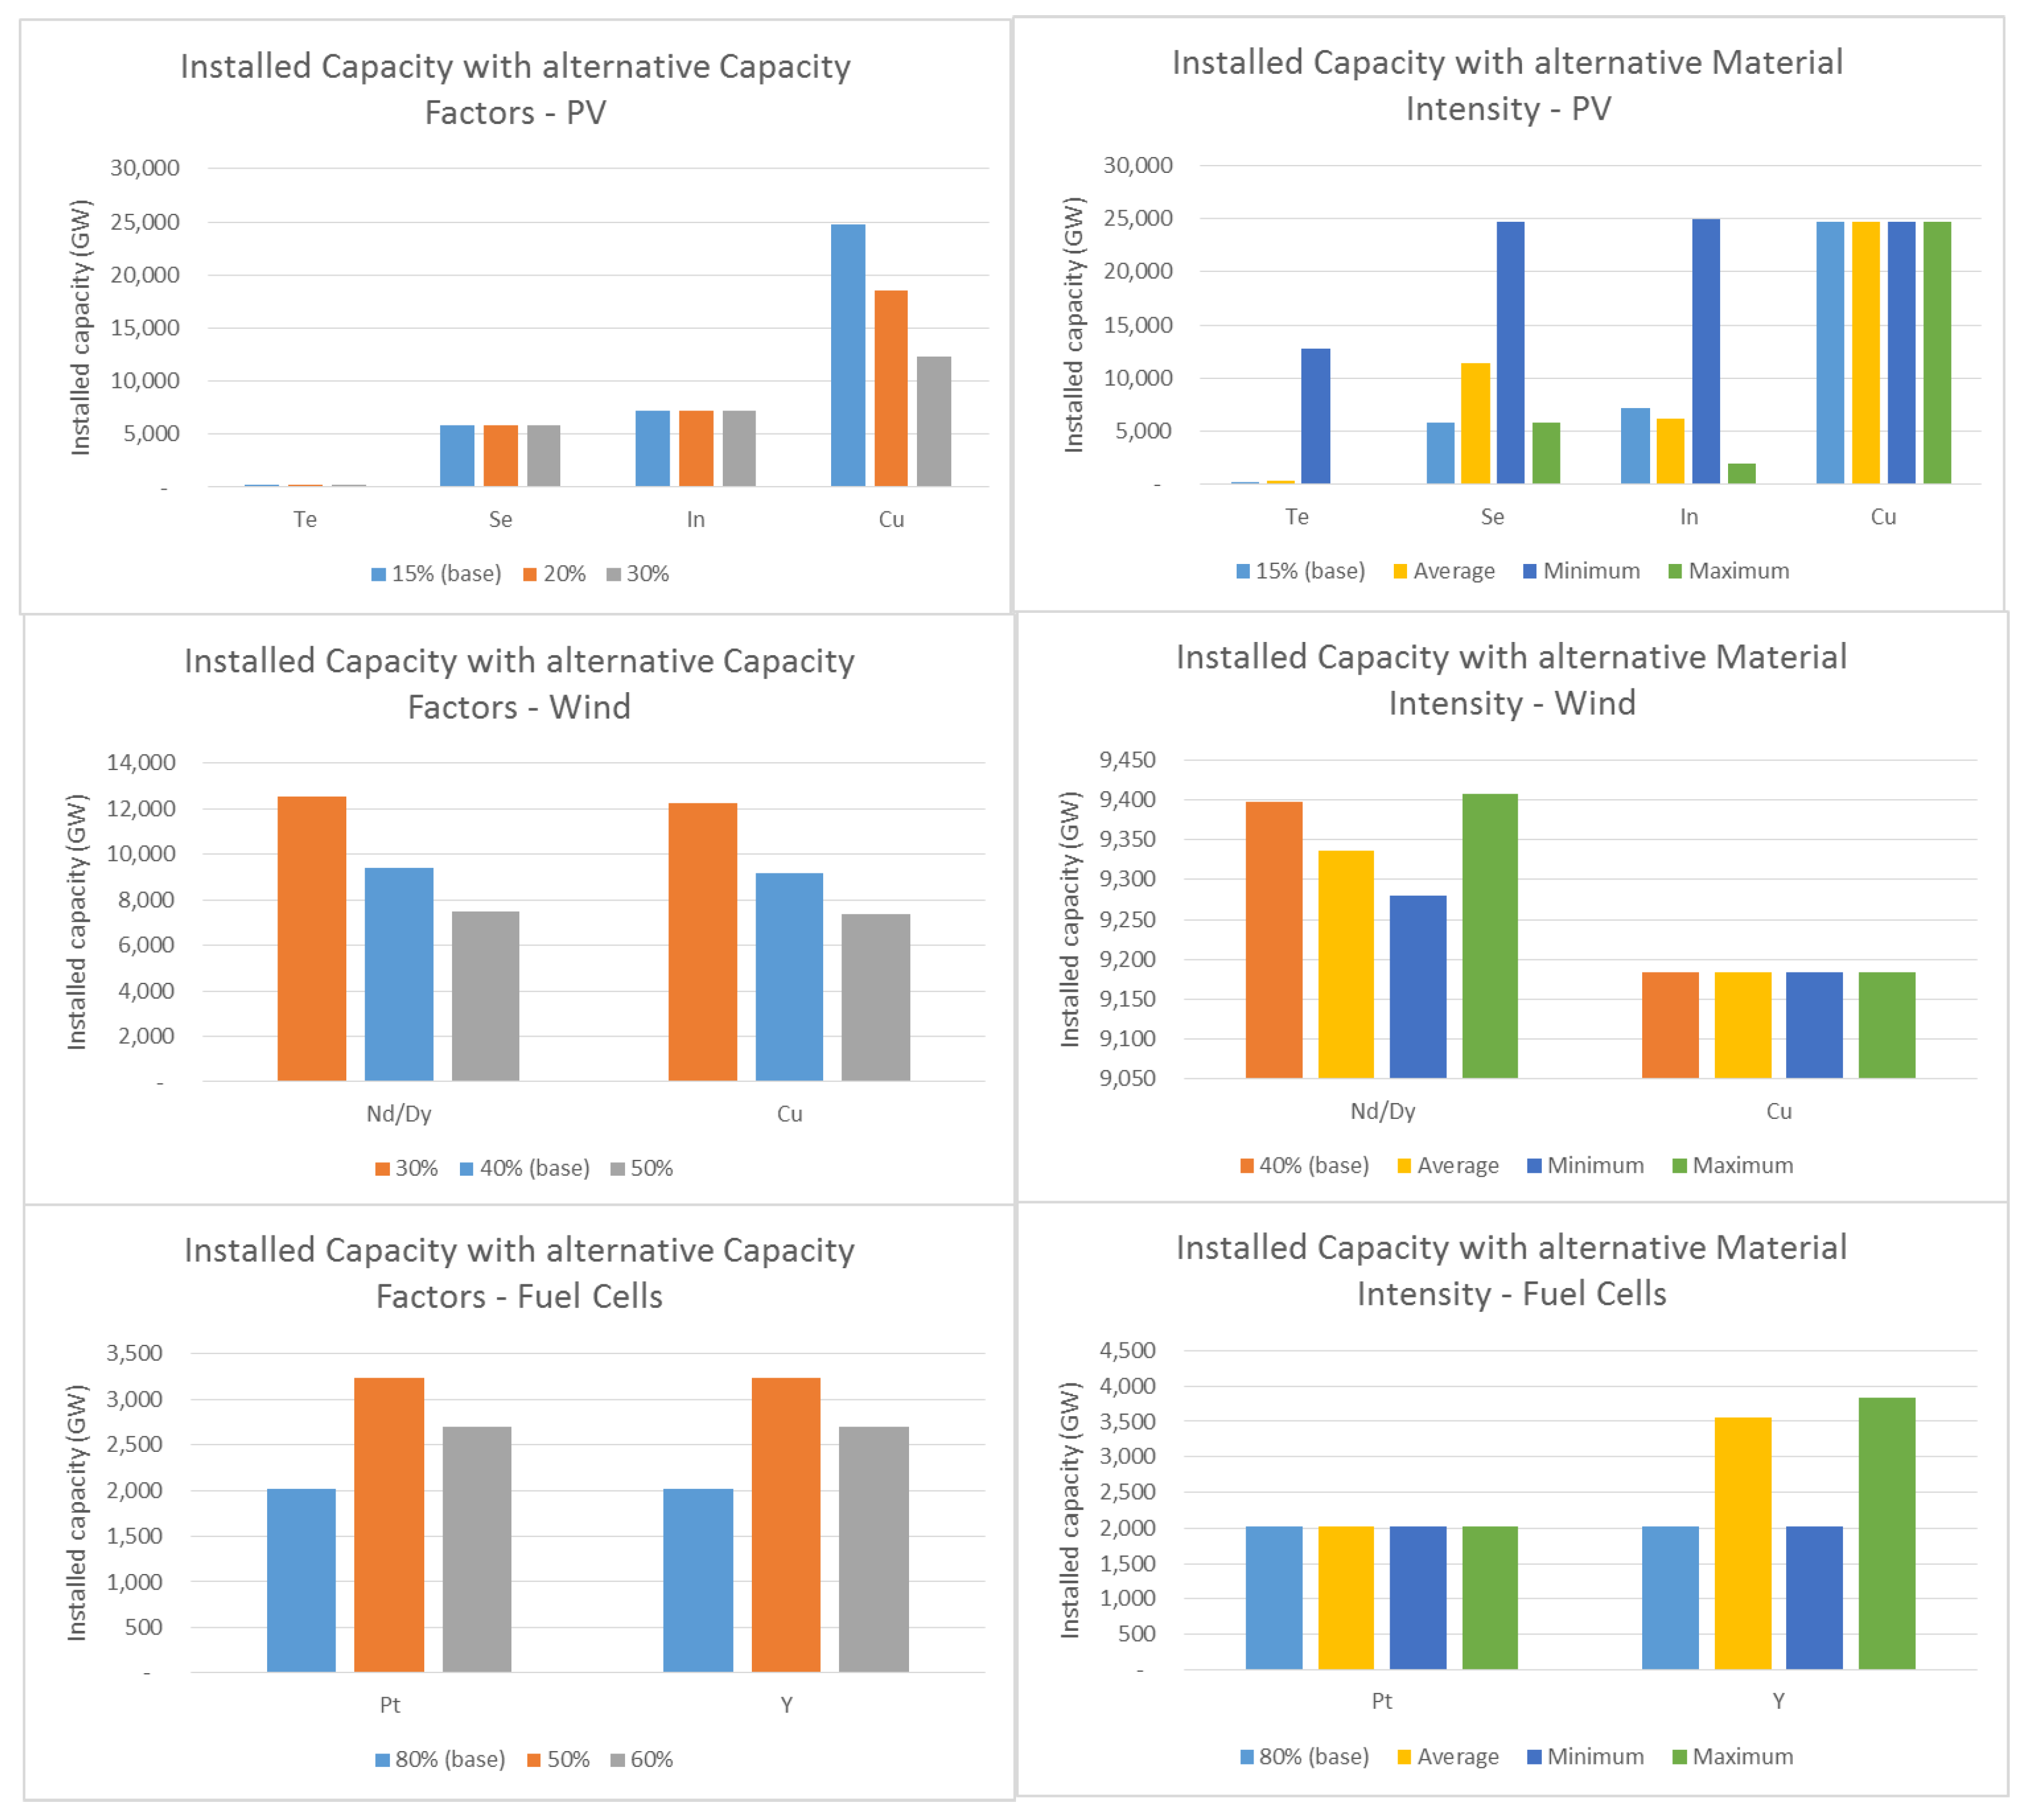
In order to estimate the demand for materials, the specific material requirement (kg/kW) was utilized from [
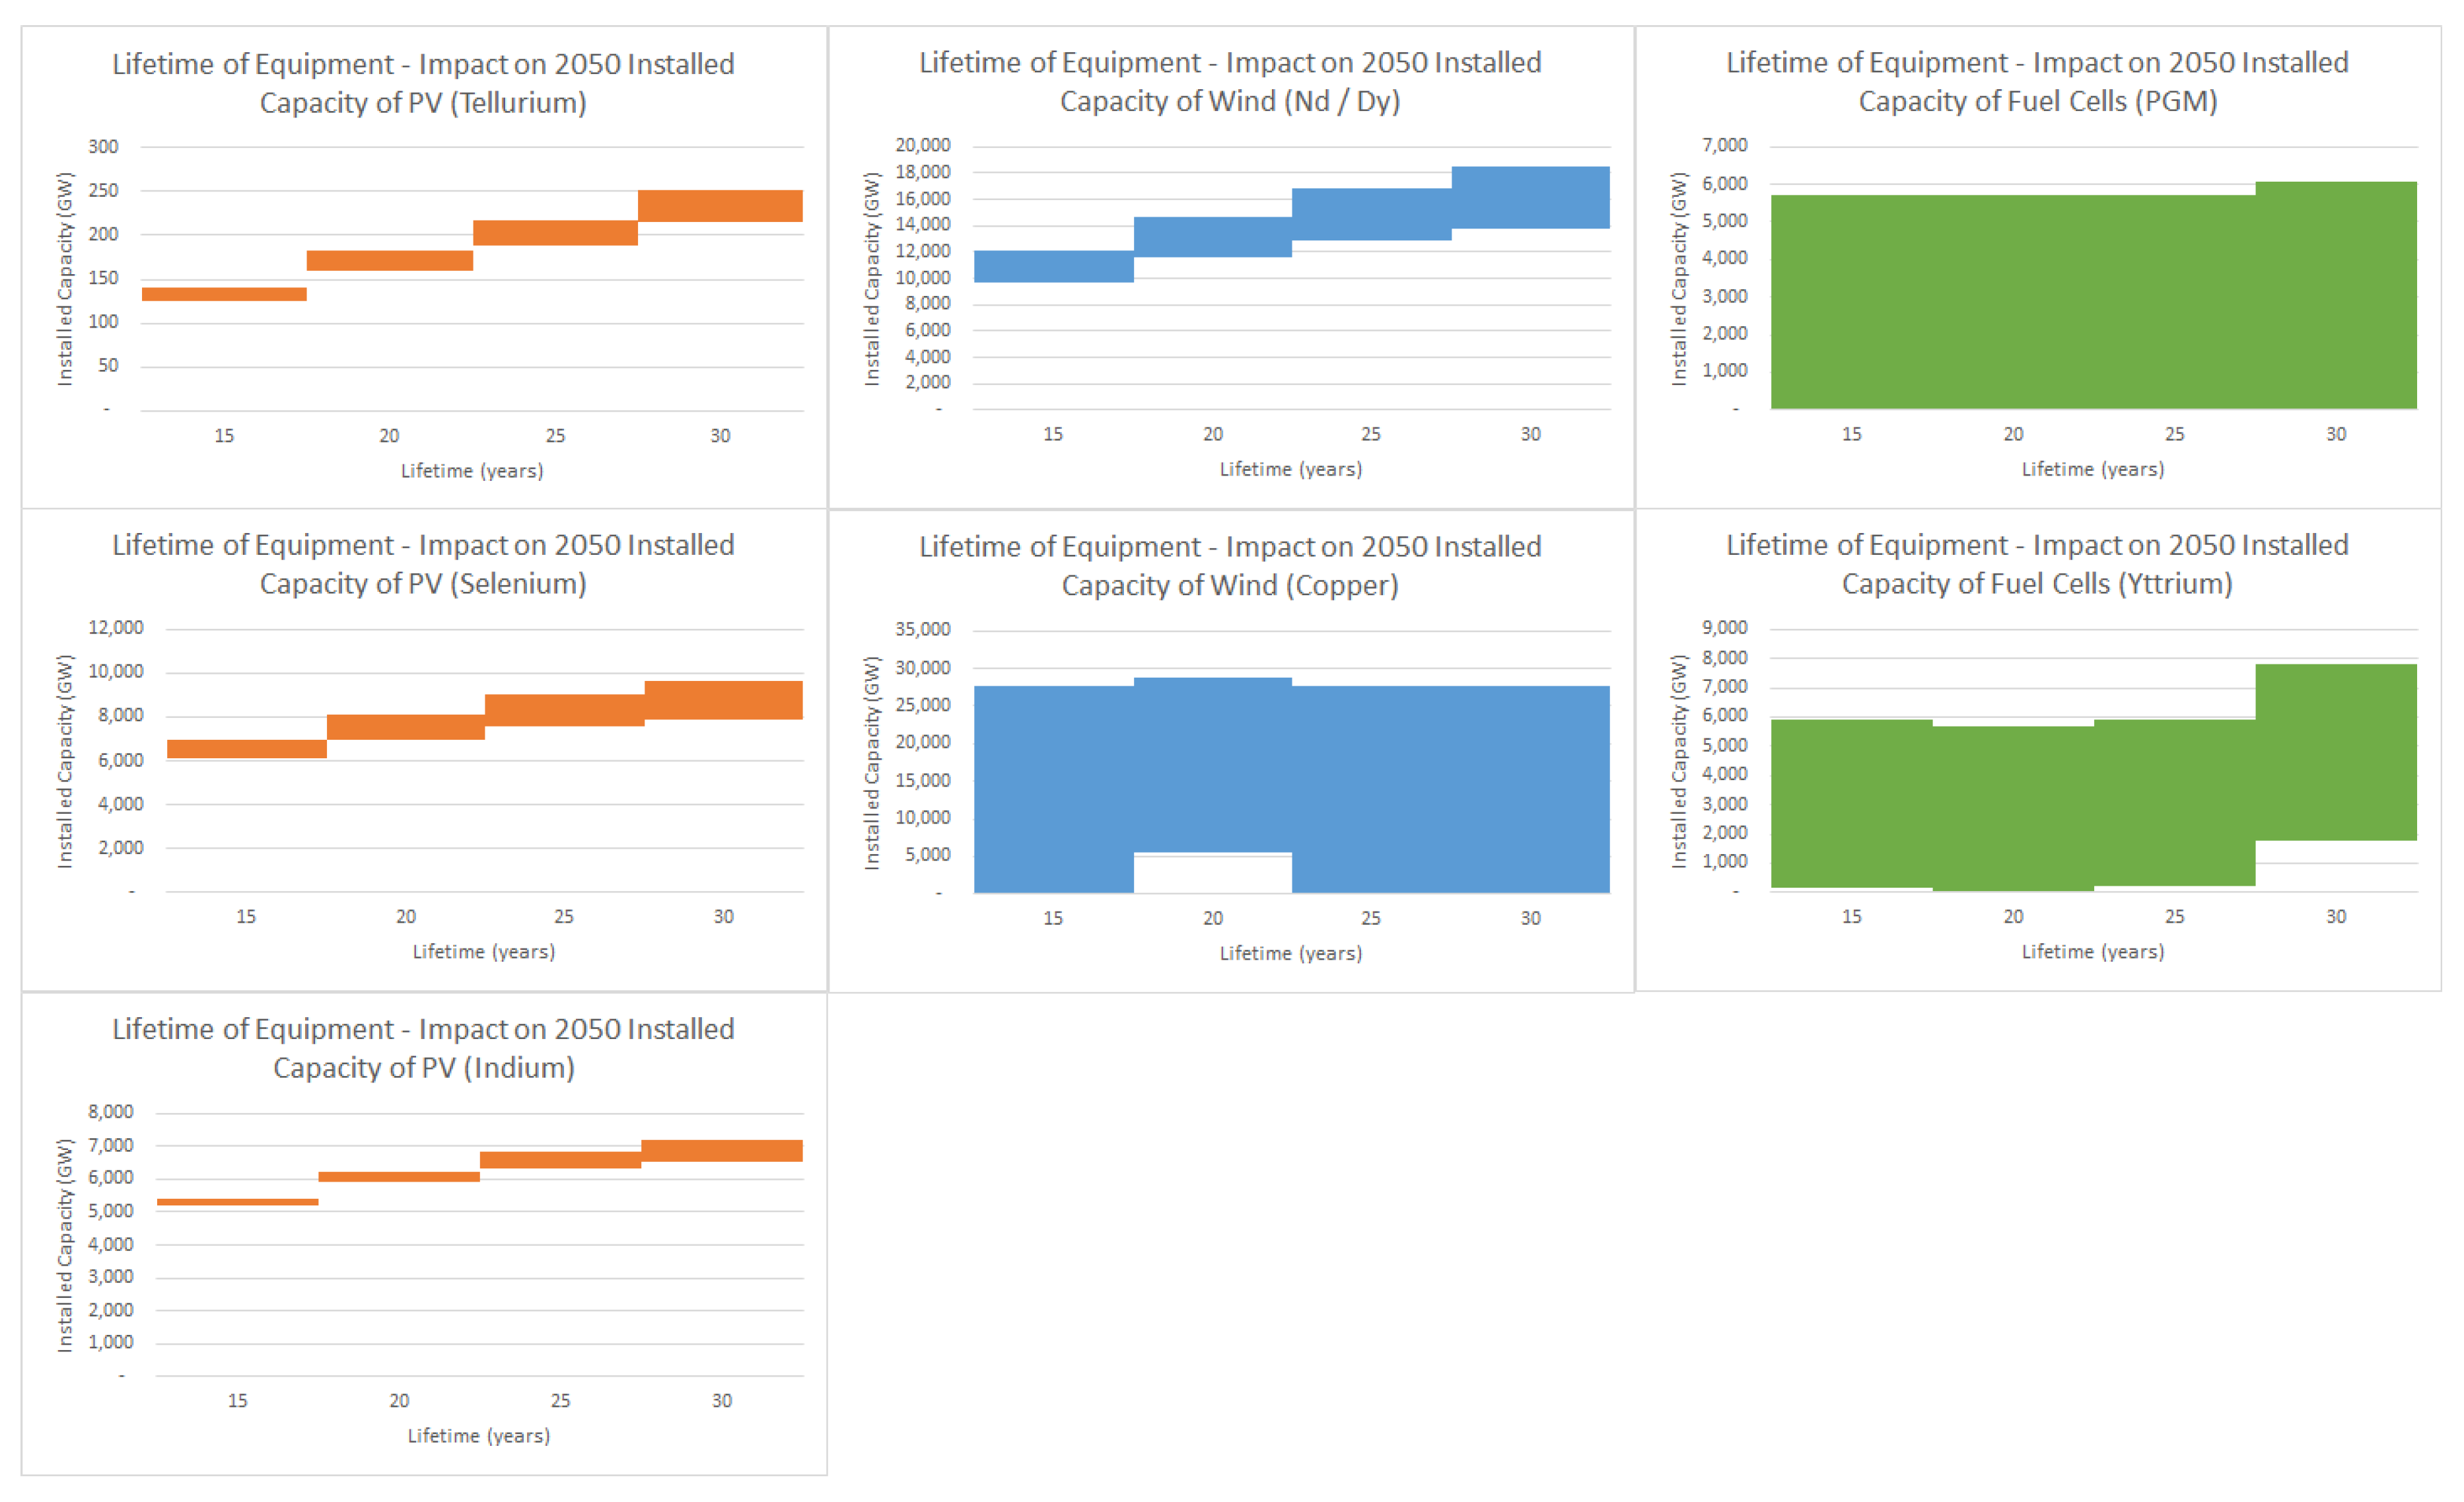
55]. The specific materials of interest were: indium, tellurium, selenium, copper, dysprosium/neodymium, yttrium and platinum. The specific material requirement was applied to each of the technologies, with an assumption of a capacity factor of 15% for solar and 40% for wind in order to obtain the energy output of each unit of installed capacity. In the initial assessment, no consideration was made for technology improvements to reduce materials usage. A lifetime of 20 years is applied to all of the technologies, requiring a replacement of an entire year’s added generation capacity in the 20th year following, in addition to any new capacity growth. While some applications may have longer lives than 20 years, this figure is considered to be reasonable in covering the three technology types considered here. These data were compared with materials supply scenarios to identify whether any shortages might be expected.
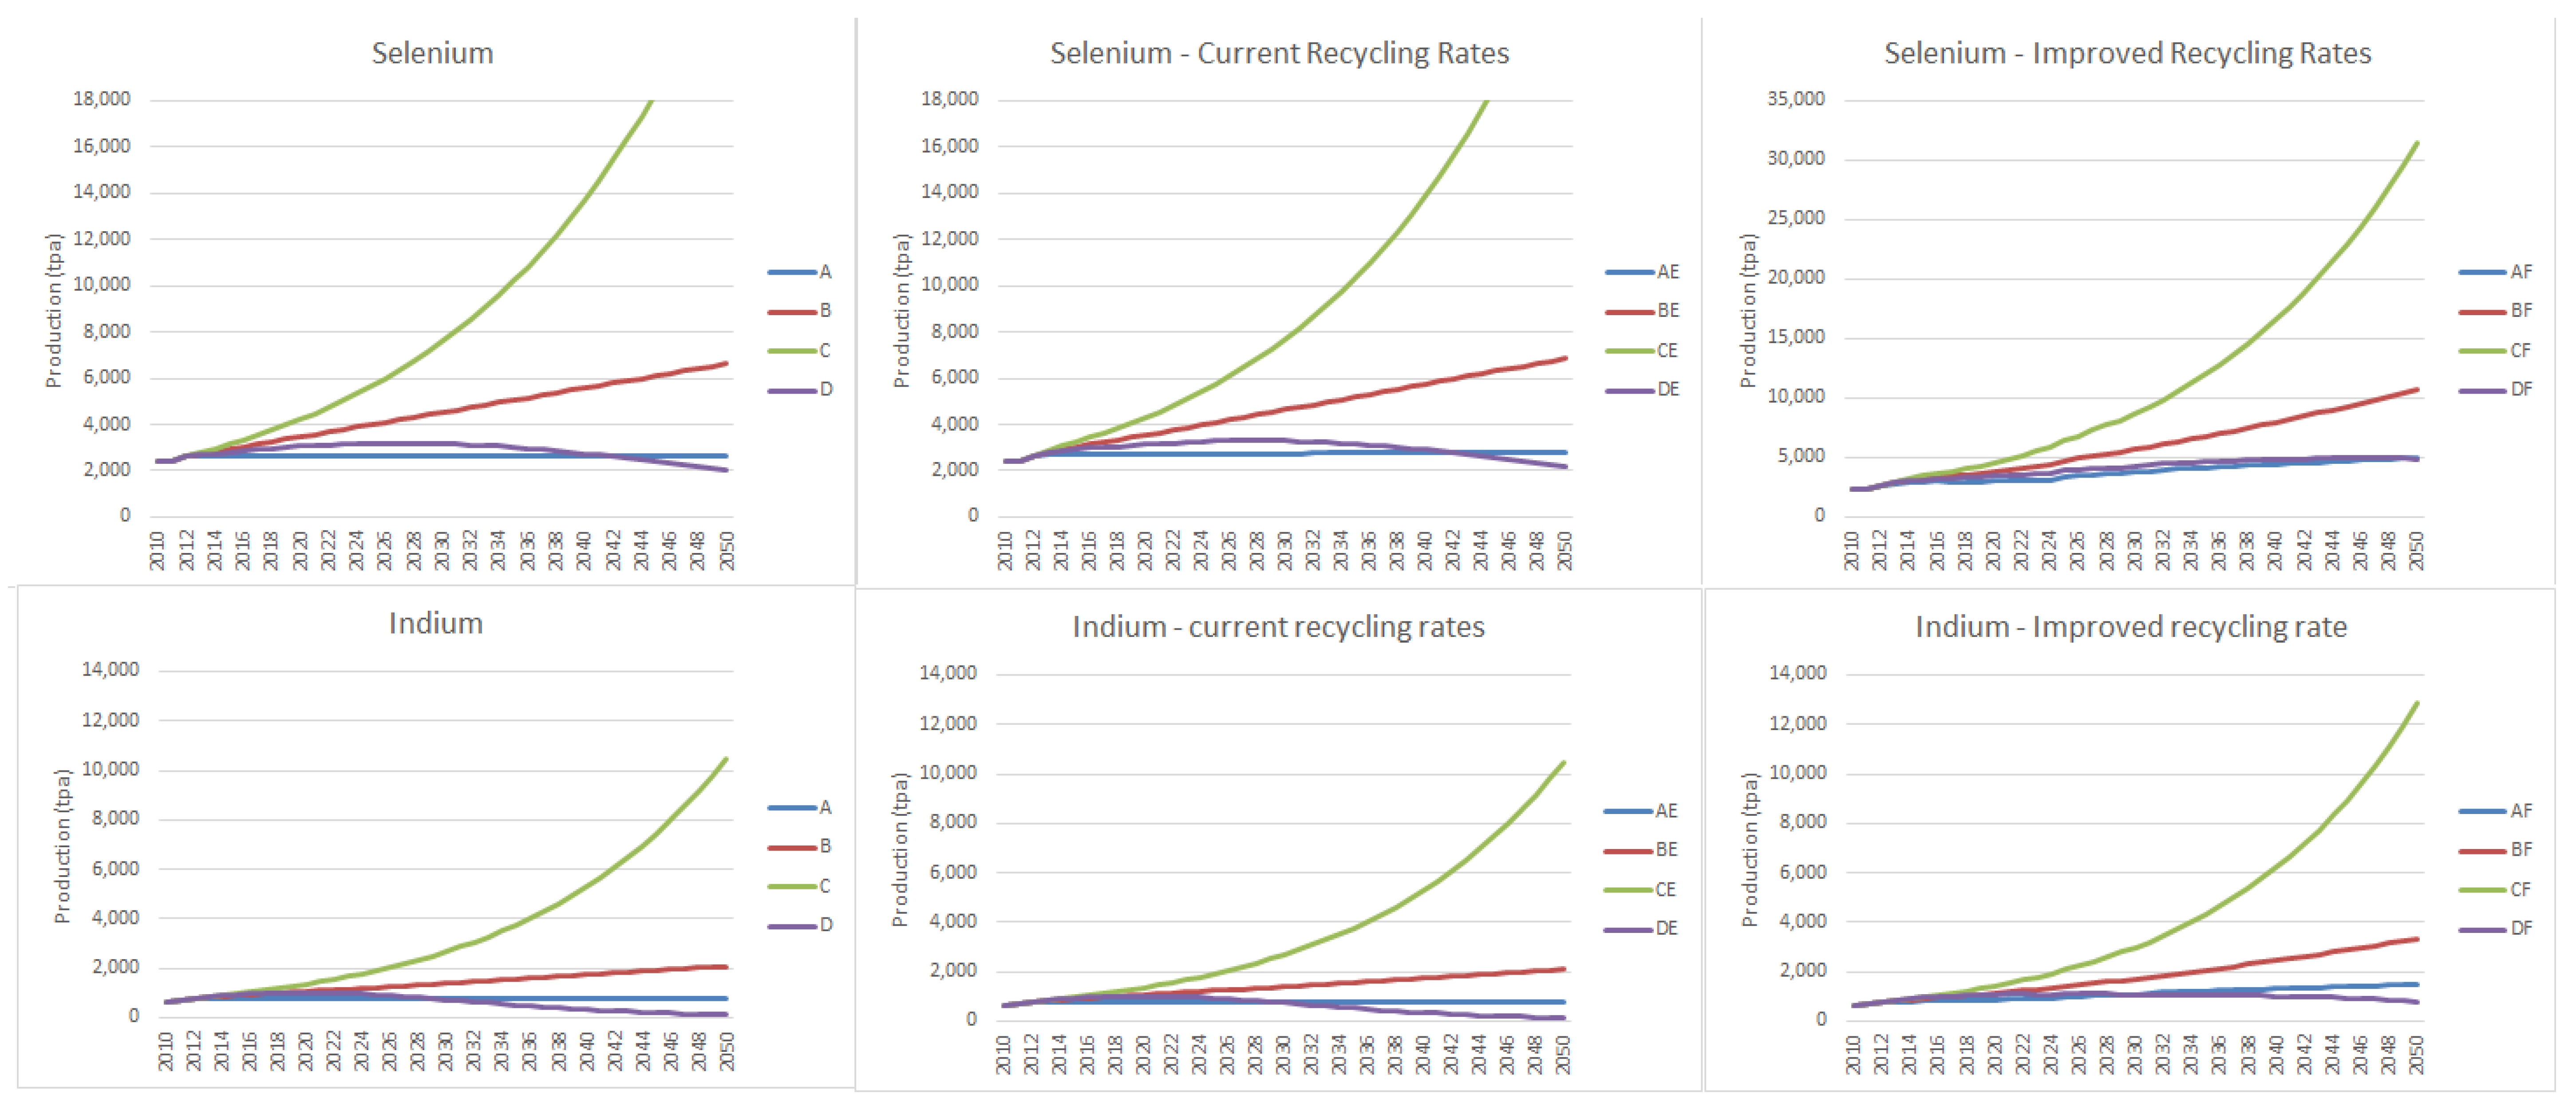
Historical data for supply were obtained from the USGS (various) [48], and four alternative scenarios were developed for future supply. Recycling supplementation was then added to these four alternative scenarios so that there were ultimately 12 scenarios tested for each mineral. The characteristics of each of these material supply scenarios are given briefly in Table 5.
The key criteria important to modeling and interpreting these supply trends are given in Table 6. The estimation of future supply trends was based on existing historical data trends, not accounting for changes in ore grades or potential improvements in recovery. The recycling in the supply case is for all of the material supplied across all sectors, not just for the material supplied to the energy system (in contrast to the demand, which includes a lifetime of equipment that requires supplemented supply to meet with the redundancy rate of equipment).
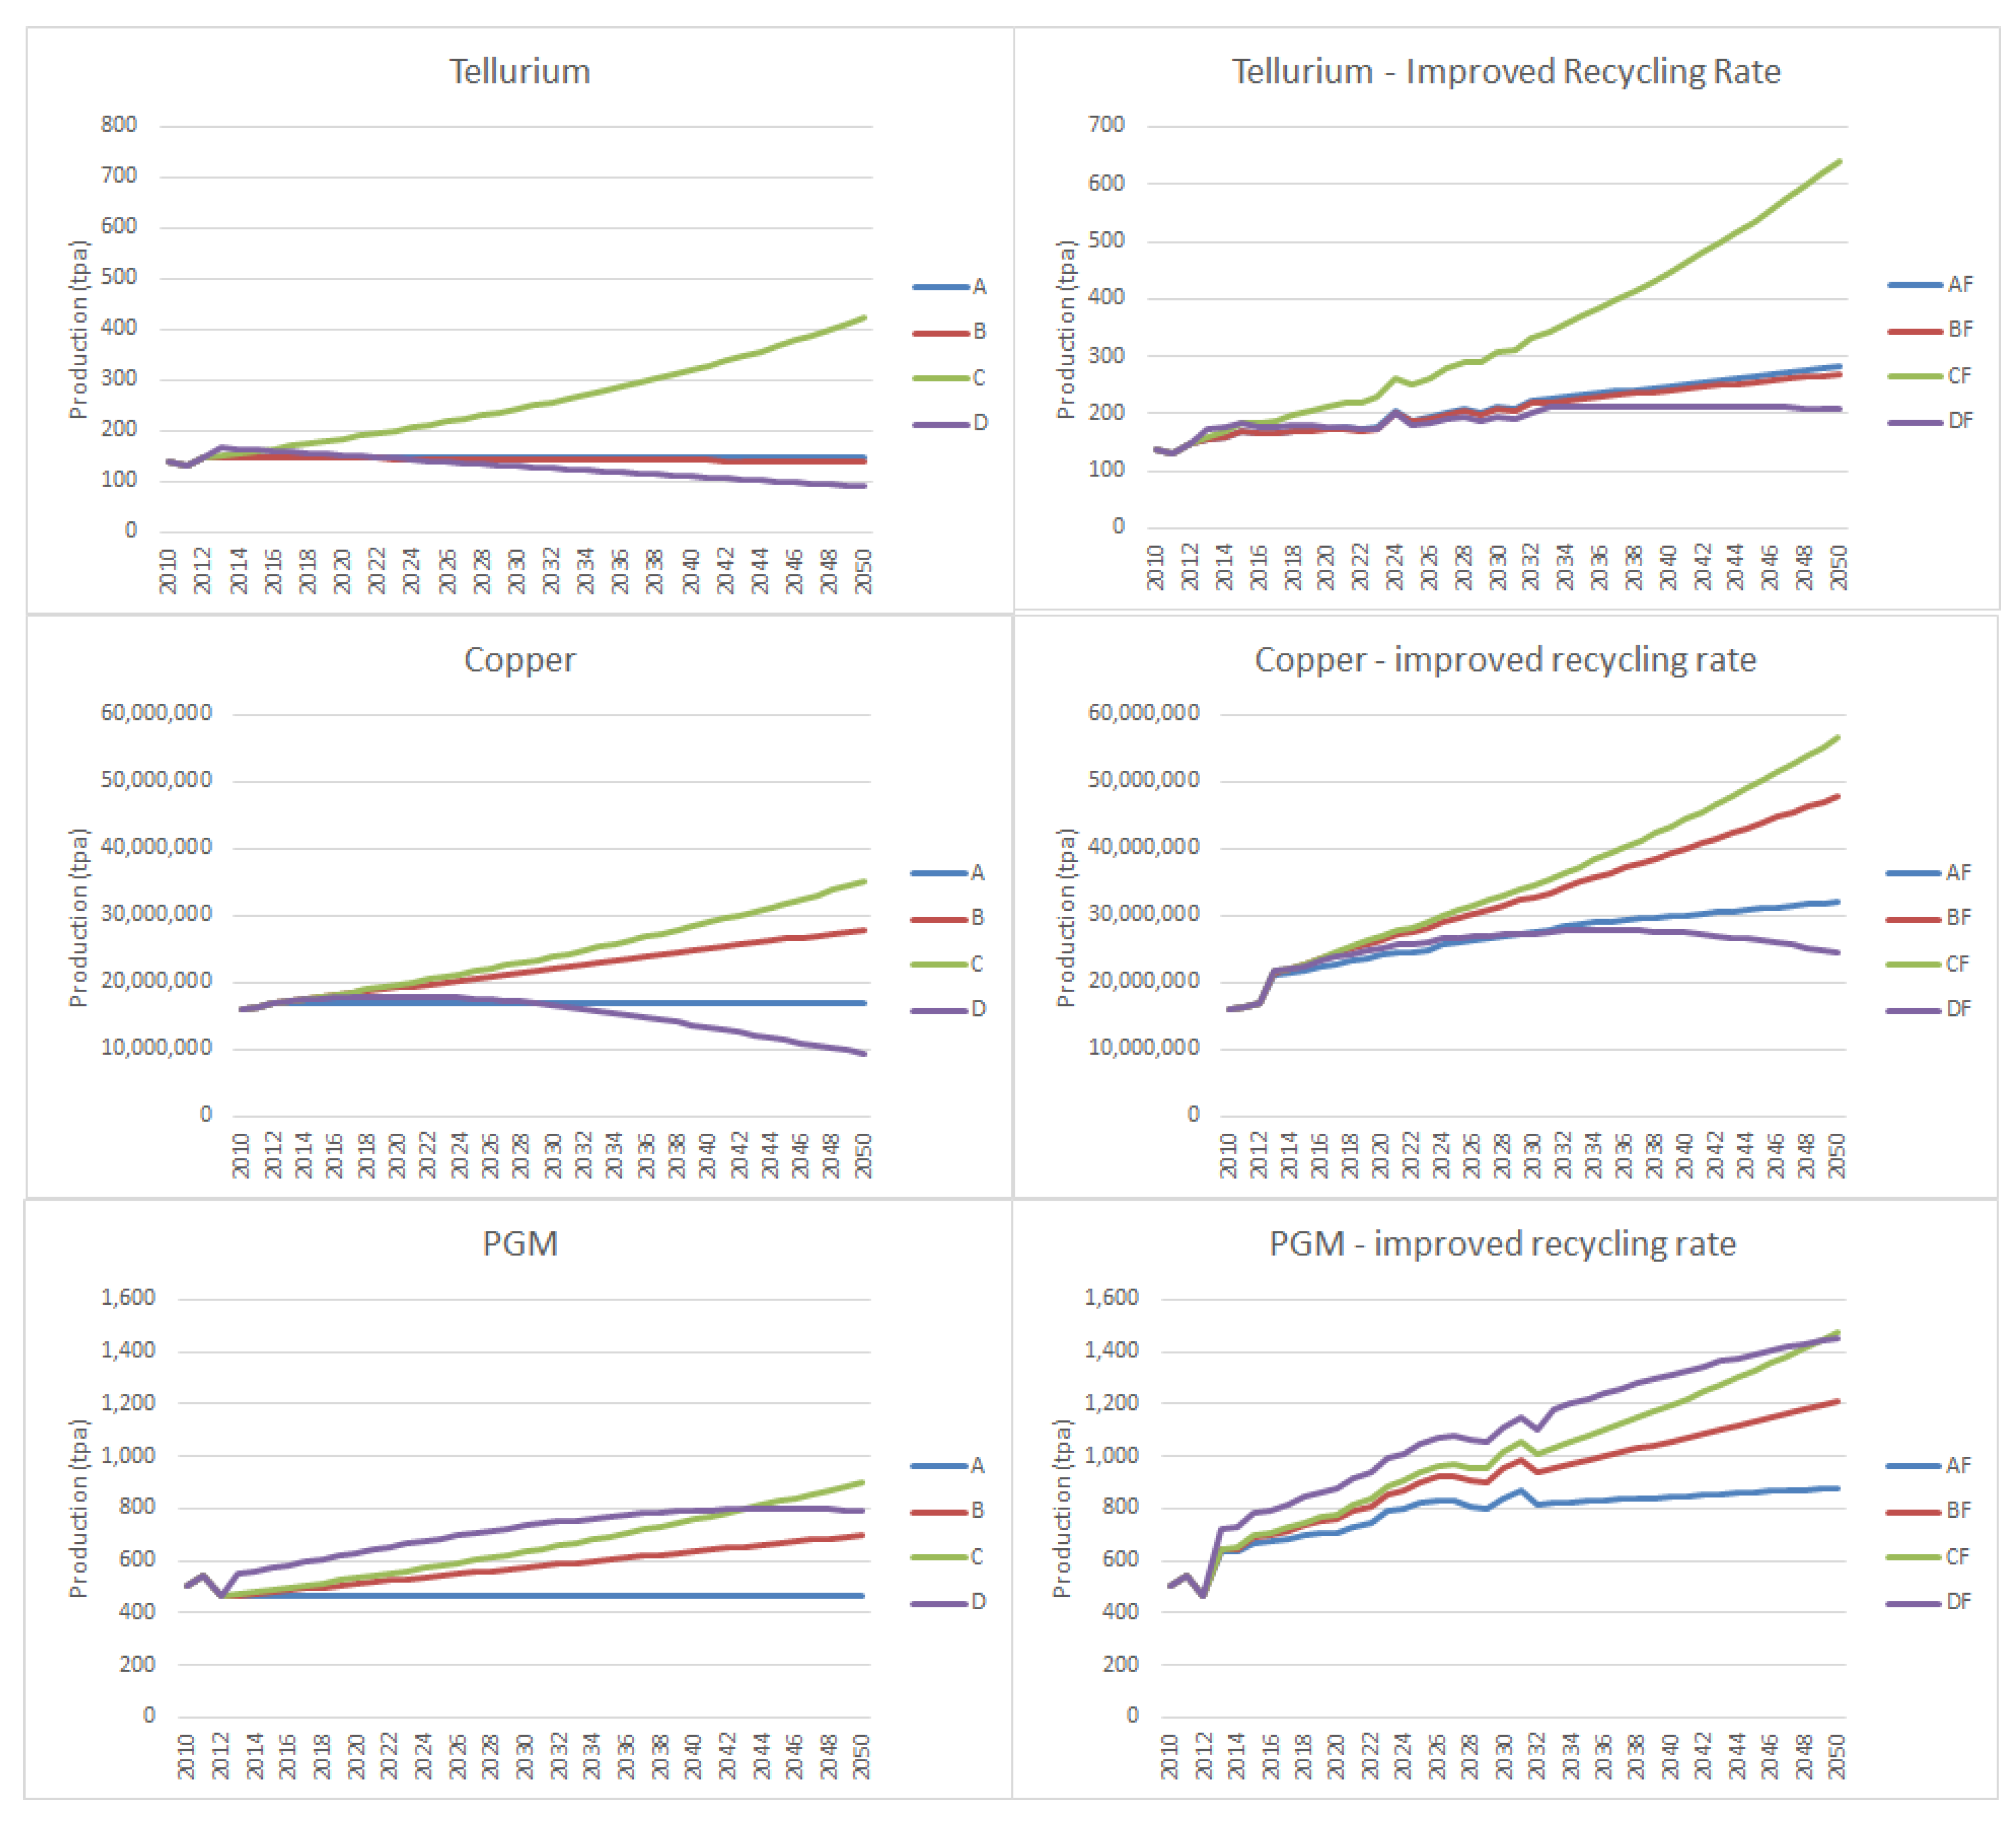
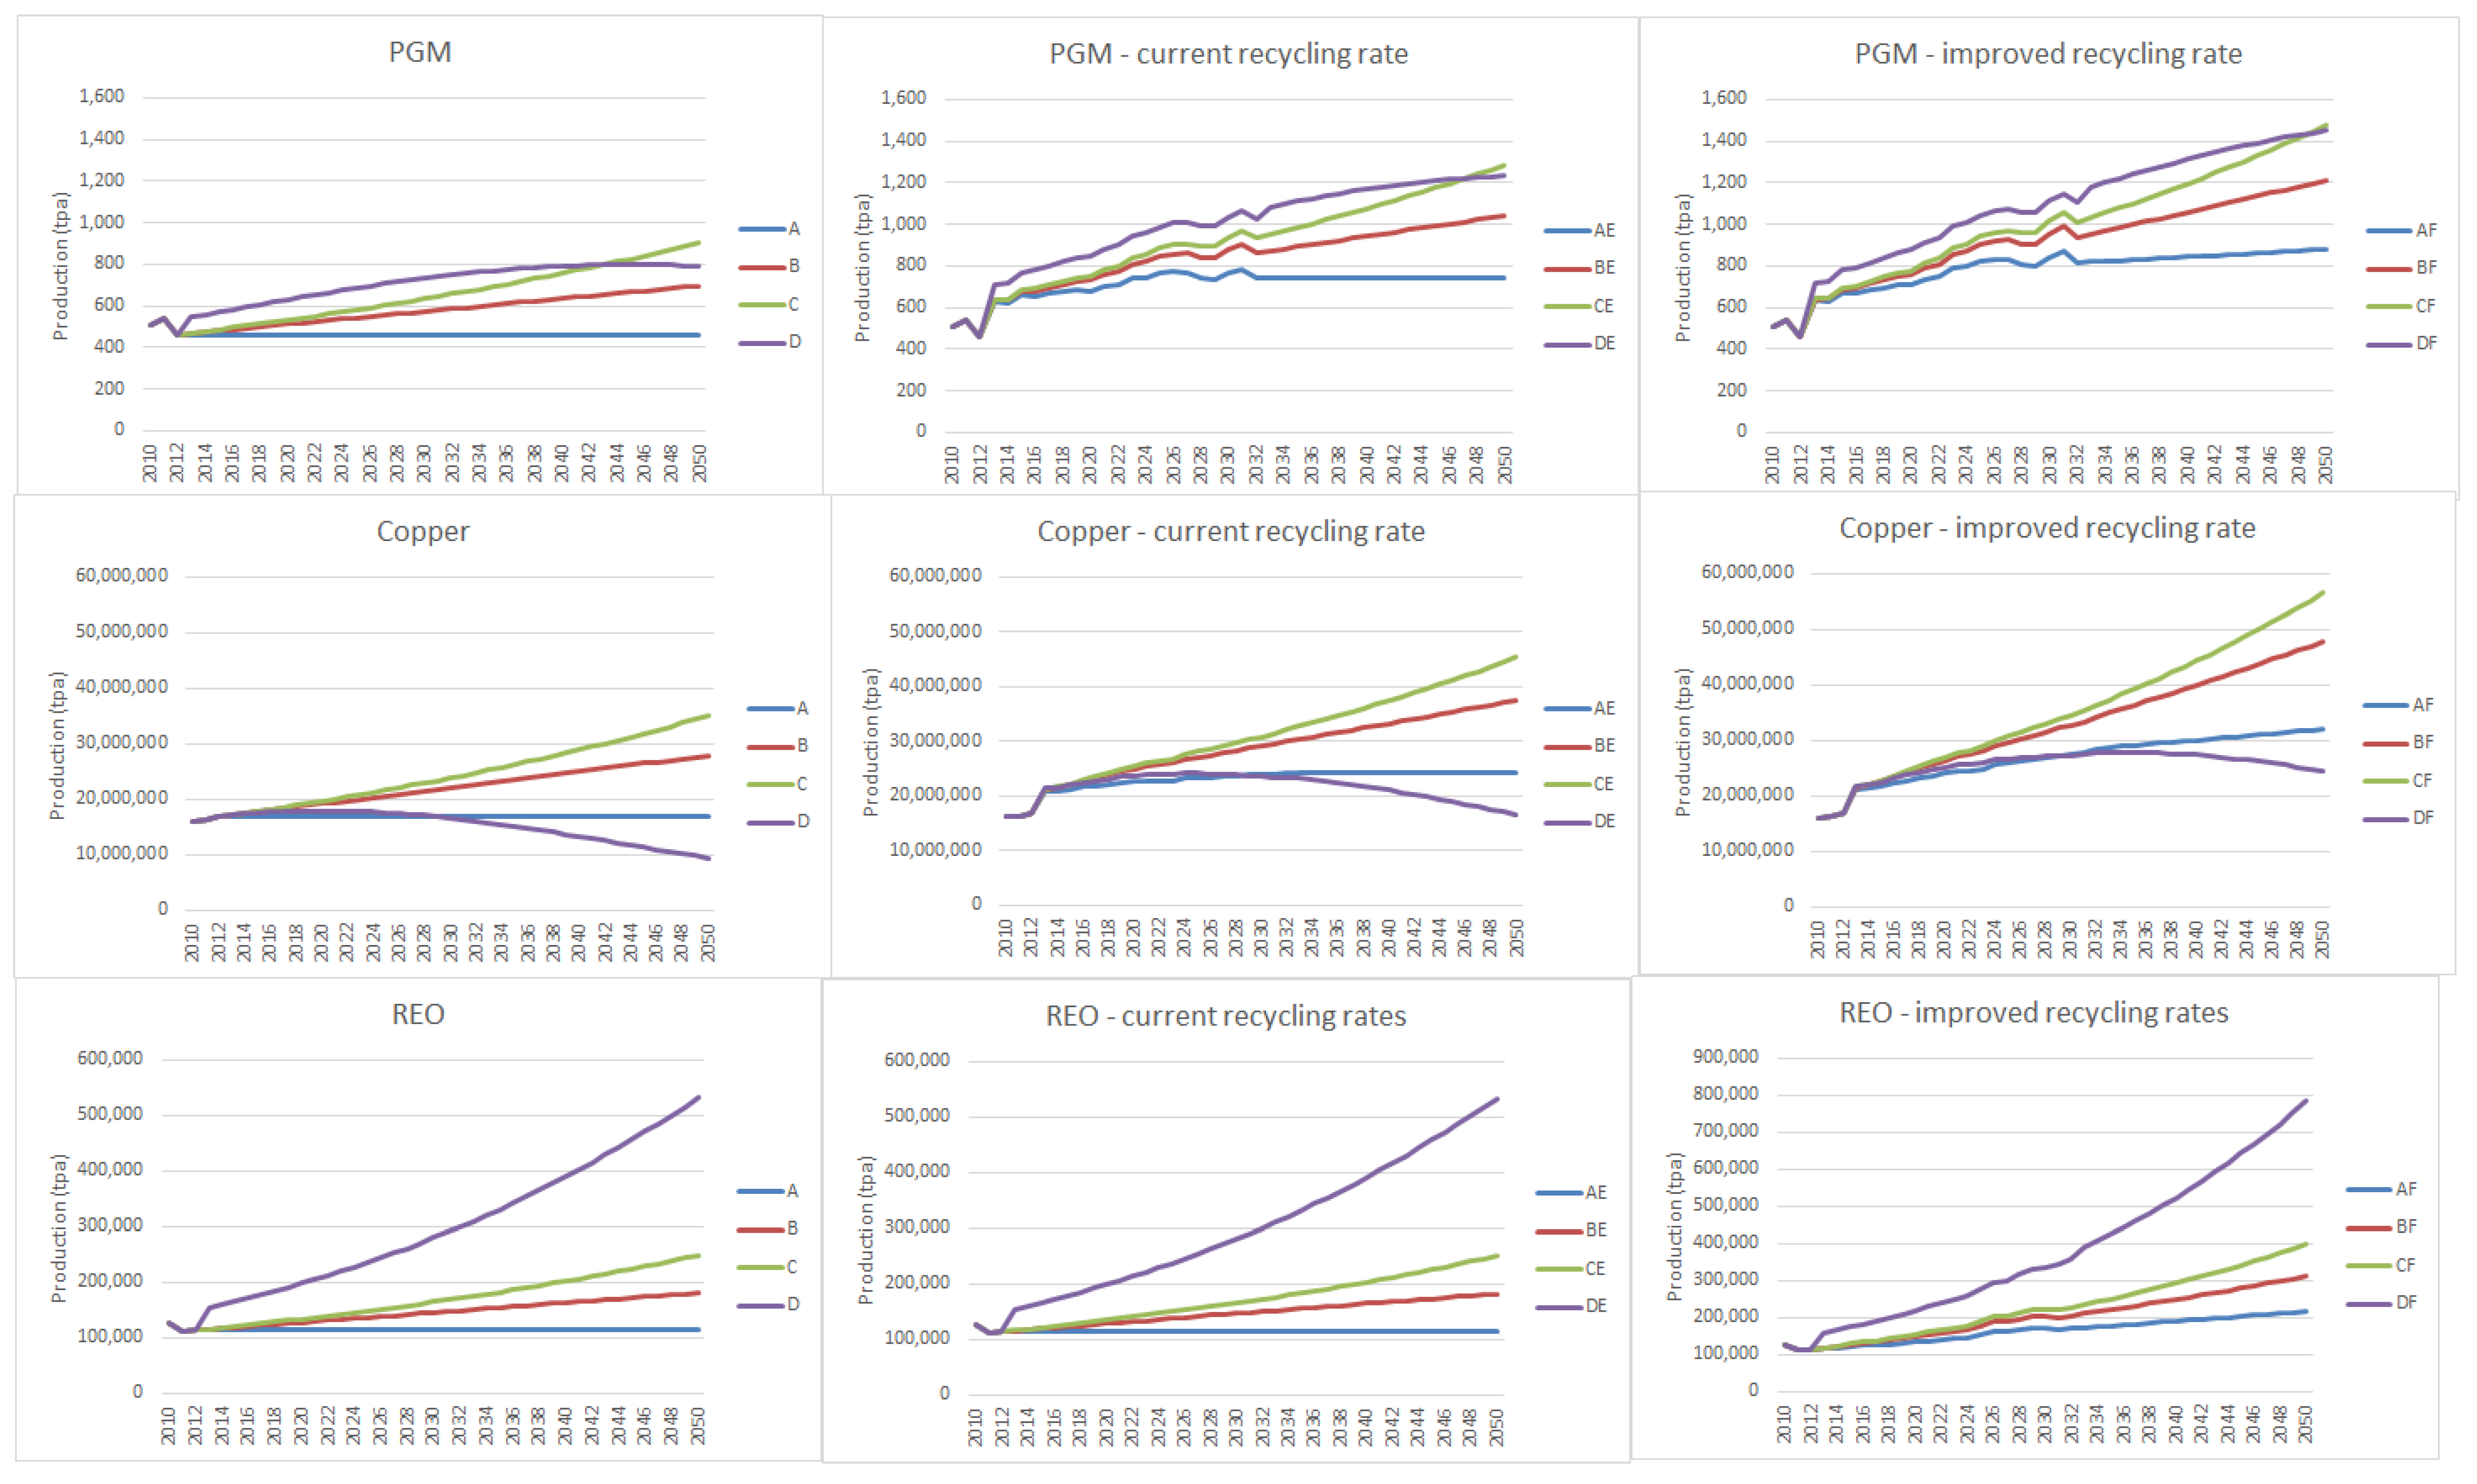
Selected material supply scenarios for the no-recycling and improved recycling conditions are shown in Figure 10 (a full set is shown in the appendix as Figure A1 and 
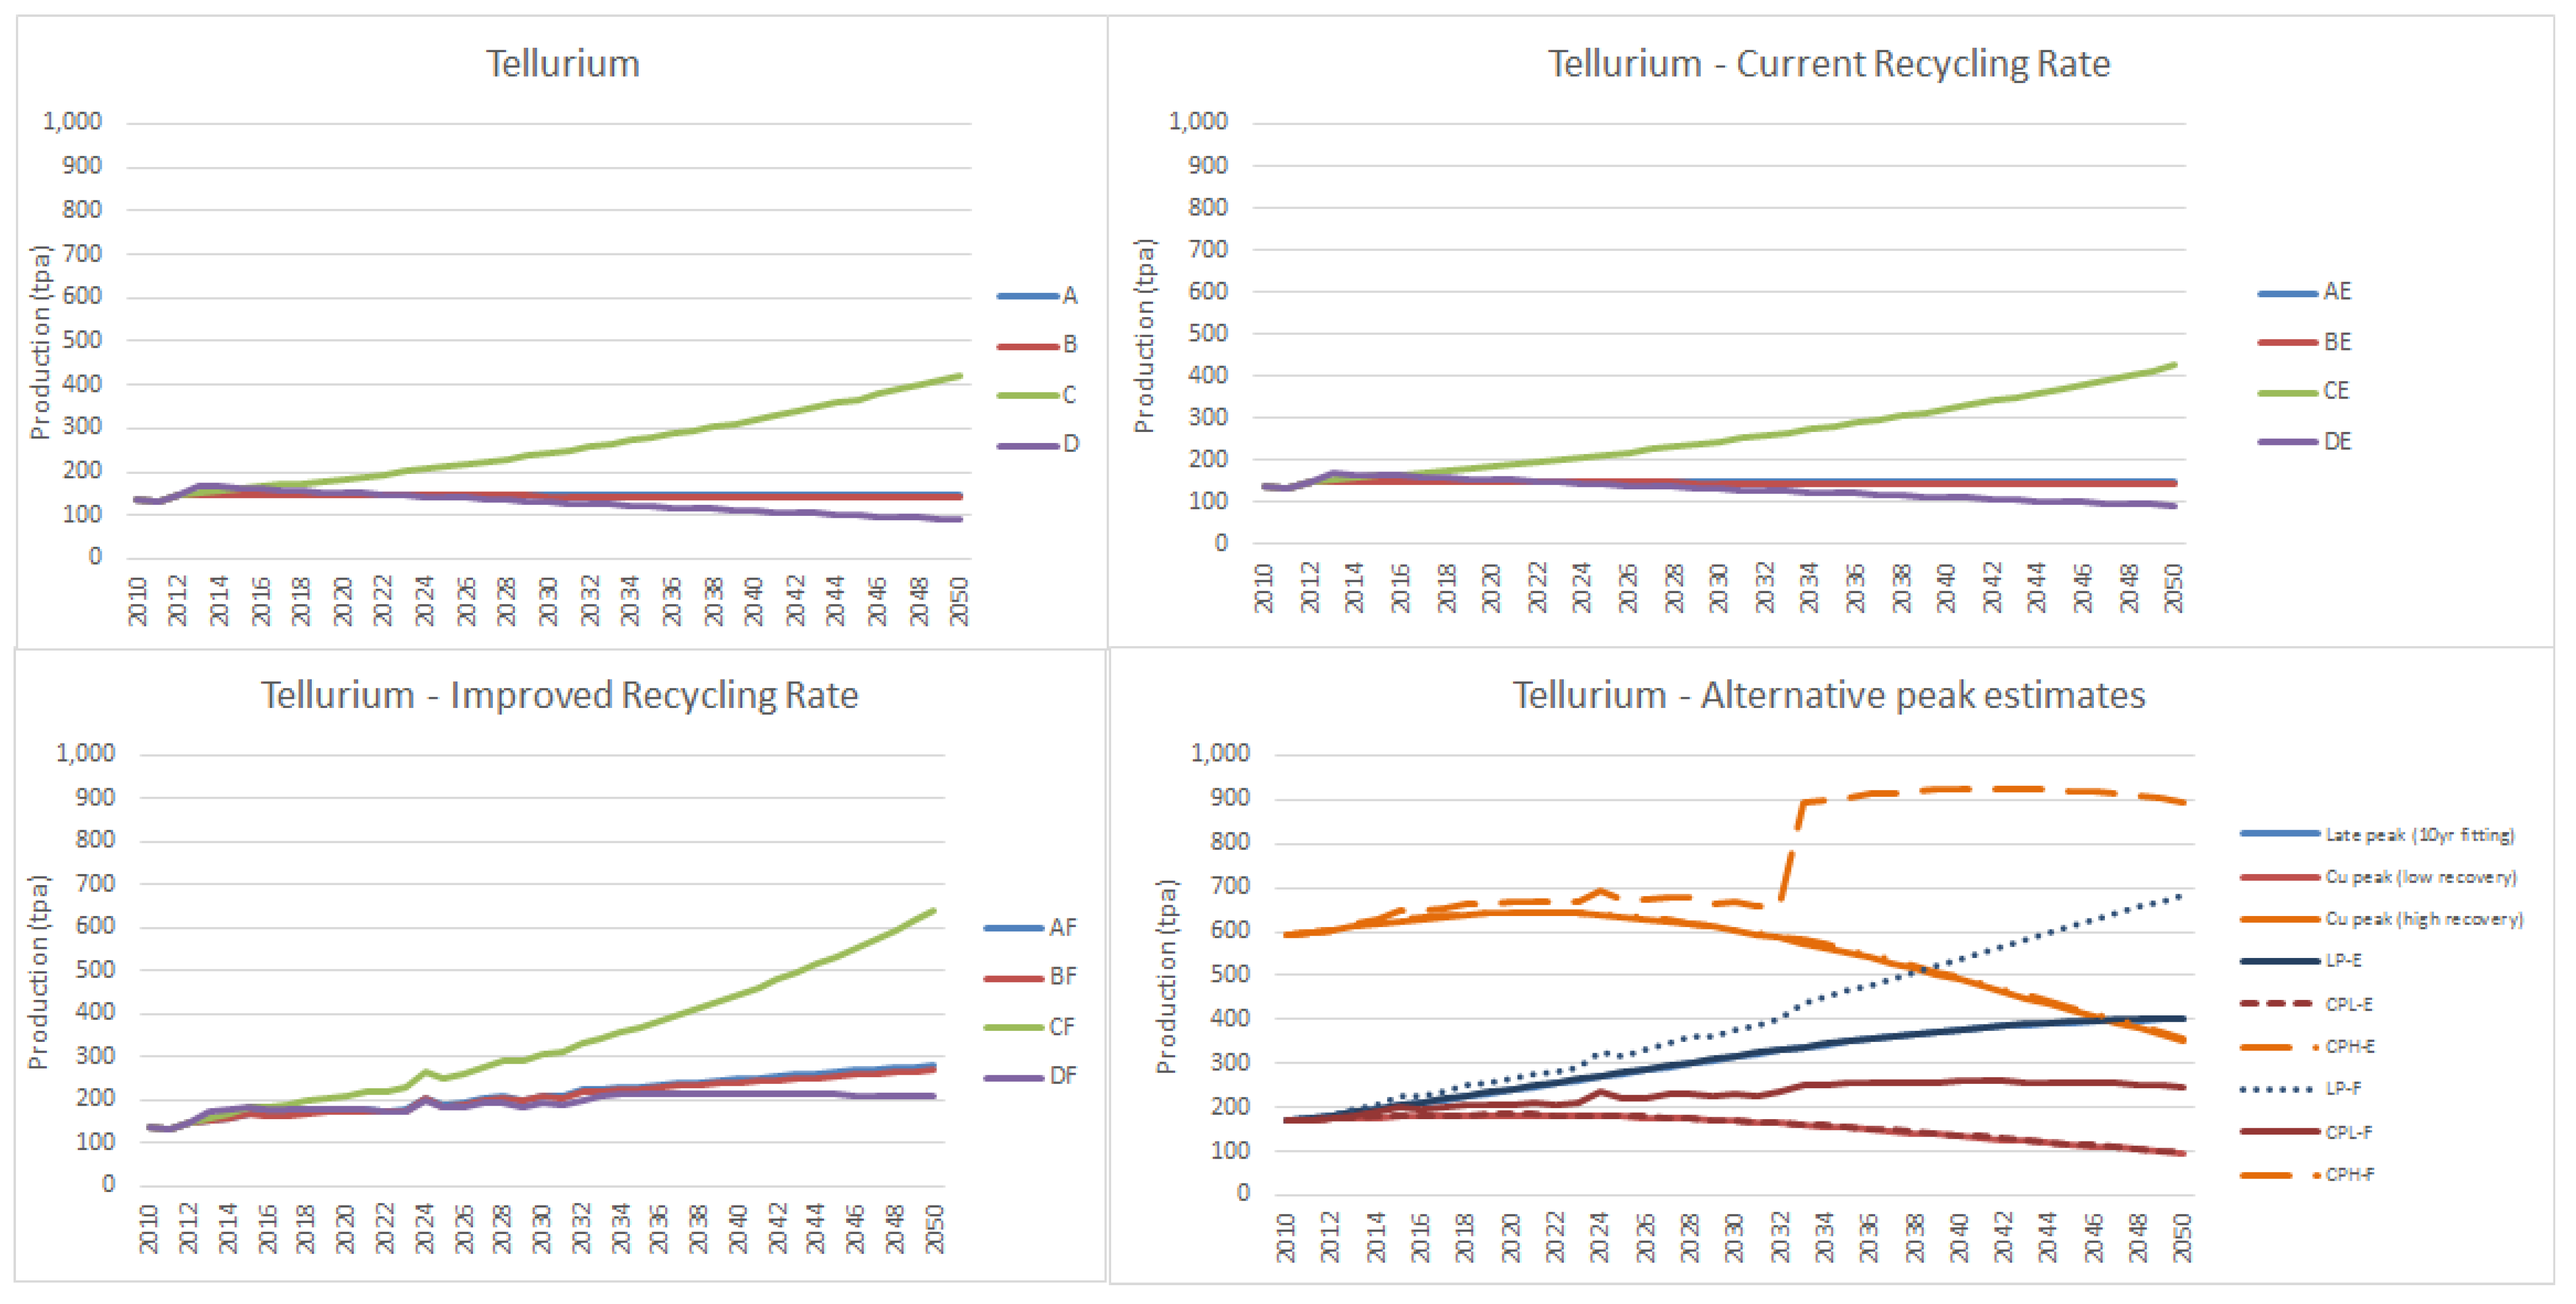
Figure A2). It is important to note that in the exponential and linear growth scenarios, no limitations were put on the growth of production, which is an unlikely reality in the long term, but is perhaps achievable in the short term. In the recycling scenarios, it is noted that the “bumpiness” of the production is attributable largely to the use of actual production data (with a 20-year lag that is the assumed infrastructure lifetime) to determine recycling quantities. The recycling rates used here were obtained from a United Nations Environment Programme (UNEP) report [57], and there has been no differentiation made here between the end-uses of materials, which may or may not enable the higher rate of recycling (90%) proposed in the improvement scenarios. It may be of interest that, although the D scenarios involve a peak curve estimate, these are largely unpronounced in many of the scenarios; some due to the peak having already arrived, and some are due to it being beyond the 2050 time scale of the scenarios, although the assumed peak is apparent in Figure 10 for PGM and copper.
Table 7 shows the change in annual production of each mineral from the beginning to the end of the period of interest for each of the scenarios. It is apparent that recycling is important in increasing the rate of production (or reducing the amount of the decrease). The effectiveness of recycling in increasing supply is highly influenced by three factors: the basis rate of recycling, the assumed rate of increase of the recycling rate to the final 90% (scenarios F) and the rate of change of production in the base case. Those metals starting from a low basis recycling rate do not see as great an increase in production as metals with a higher recycling rate, due to the compounding effects of recycling of materials after 20 years, which accumulate faster under the higher recycling rate.
Table 8 shows the cumulative production of metal across the period 2031–2050 (the final 20 years). This does not differentiate between primary and secondary resources, so taking the final 20 years should remove some of the effects of double-counting, as the period under consideration is equal to the assumed lifetime of the product or rate of recirculation.
Table 9 presents the assumptions or estimates of available reserves or resources used in previous studies compared with the URR (reserves plus historical cumulative production used here) of the present study, in order to contextualize some of the alternative estimates. Most studies utilize the data of the USGS for reserves and production, and this has also been used in this case. It is apparent that a few cases express much larger figures; specifically these are associated with the resource data, which has higher geological uncertainty and no guarantee of economic viability. In the present study, we have specifically utilized the reserves data, which provides greater certainty of economic and physical availability; however, this may be seen as a conservative estimate. Still, some of the extreme resource data, and unconventional resources, must be treated carefully in order to not provide over-optimistic estimates.
Some specific metals should be treated with particular care. The metals tellurium, selenium and indium are predominately produced as byproducts of copper, lead and zinc. Taking tellurium as an example, a wide variety of future production rates have been given by various authors, and are well reviewed by other authors [37,58]. Reviewed estimates of indium availability are 290–26,143 tpa annual production and 625–6000 t cumulative production (to 2020), while tellurium availability is 128–2000 tpa annual production and 5250–47,000 t cumulative production (to 2020) [37]. These are not directly comparable with the current study (cumulative production shown in Table 7) but indicate the wide variation of estimates based on different assumptions. As is pointed out very clearly by others [59], it is also very important to consider the effects of changes in the ore and production techniques for various metals, particularly these byproduct materials. In the case of tellurium, the annual availability is based on the amount of electrolytic copper production, from whose anode slimes the majority of tellurium is currently extracted [59]. The life of currently mined ore bodies which are processed using this technique is a key limitation on tellurium availability, which may call into question the higher estimates of some studies [58]. It has been argued elsewhere that the market dynamics of increasing demand should drive price incentives and therefore the better supply-side recovery of such metals [38]; however, the current study does not consider improved recovery or market forces explicitly, but uses the alternative supply-side models based on trend growth and peak estimations to provide the mineral supply curves. Tellurium is taken here as an example case for byproduct metals and the uncertainty of supply projections. Figure A2 shows alternative supply curves for tellurium, with consideration that in the base case, the mineral peak is the best fit from the available data, showing a decline from 1975, whereas by fitting to the copper production curve (the mother ore for tellurium) the peak comes later (around 2020 in the current study). Additionally, byproduct recovery rates must be considered as key factors in the availability of these metals. In the extended analysis examining tellurium, we have considered two rates: one with the recent (10 years average) rate of recovery as defined by the ratio of copper to tellurium production, and one with a higher recovery of twice the current rate. Finally, we have included an alternative scenario that fits a peak curve to the most recent data (rather than the full set of data, which presents a dual peak), and this gives a peak primary mineral production of 400 tpa in 2050.
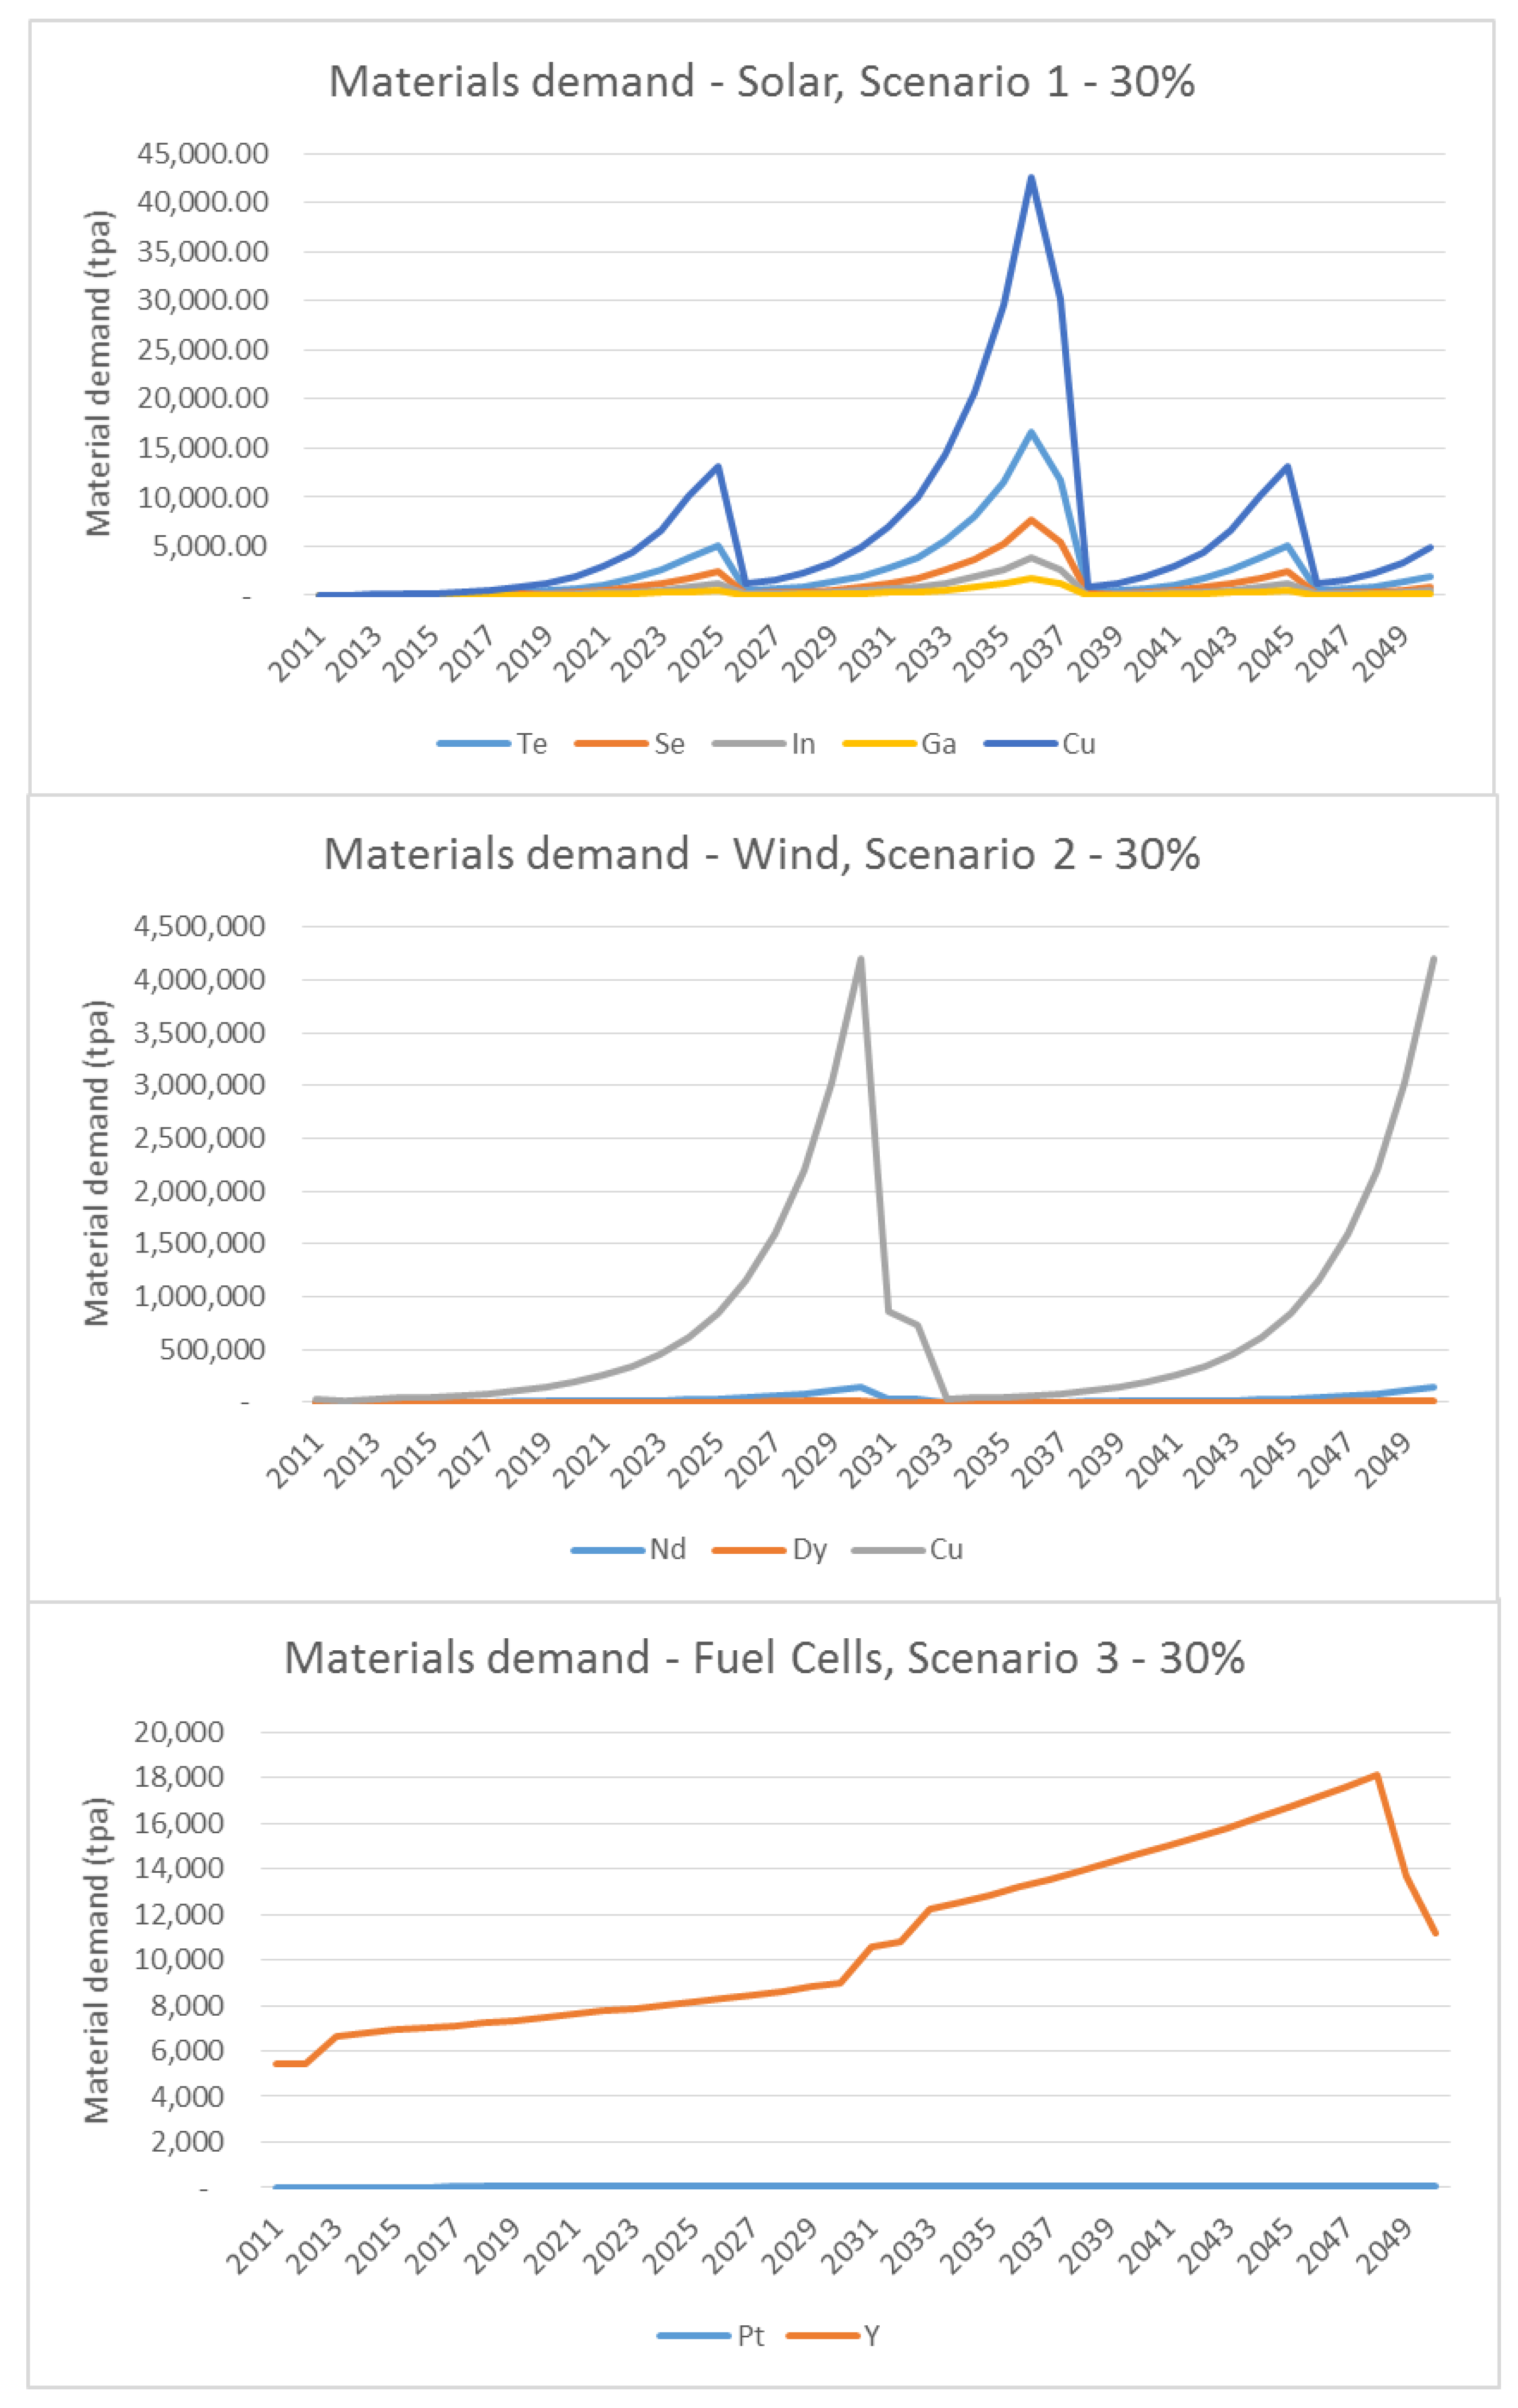
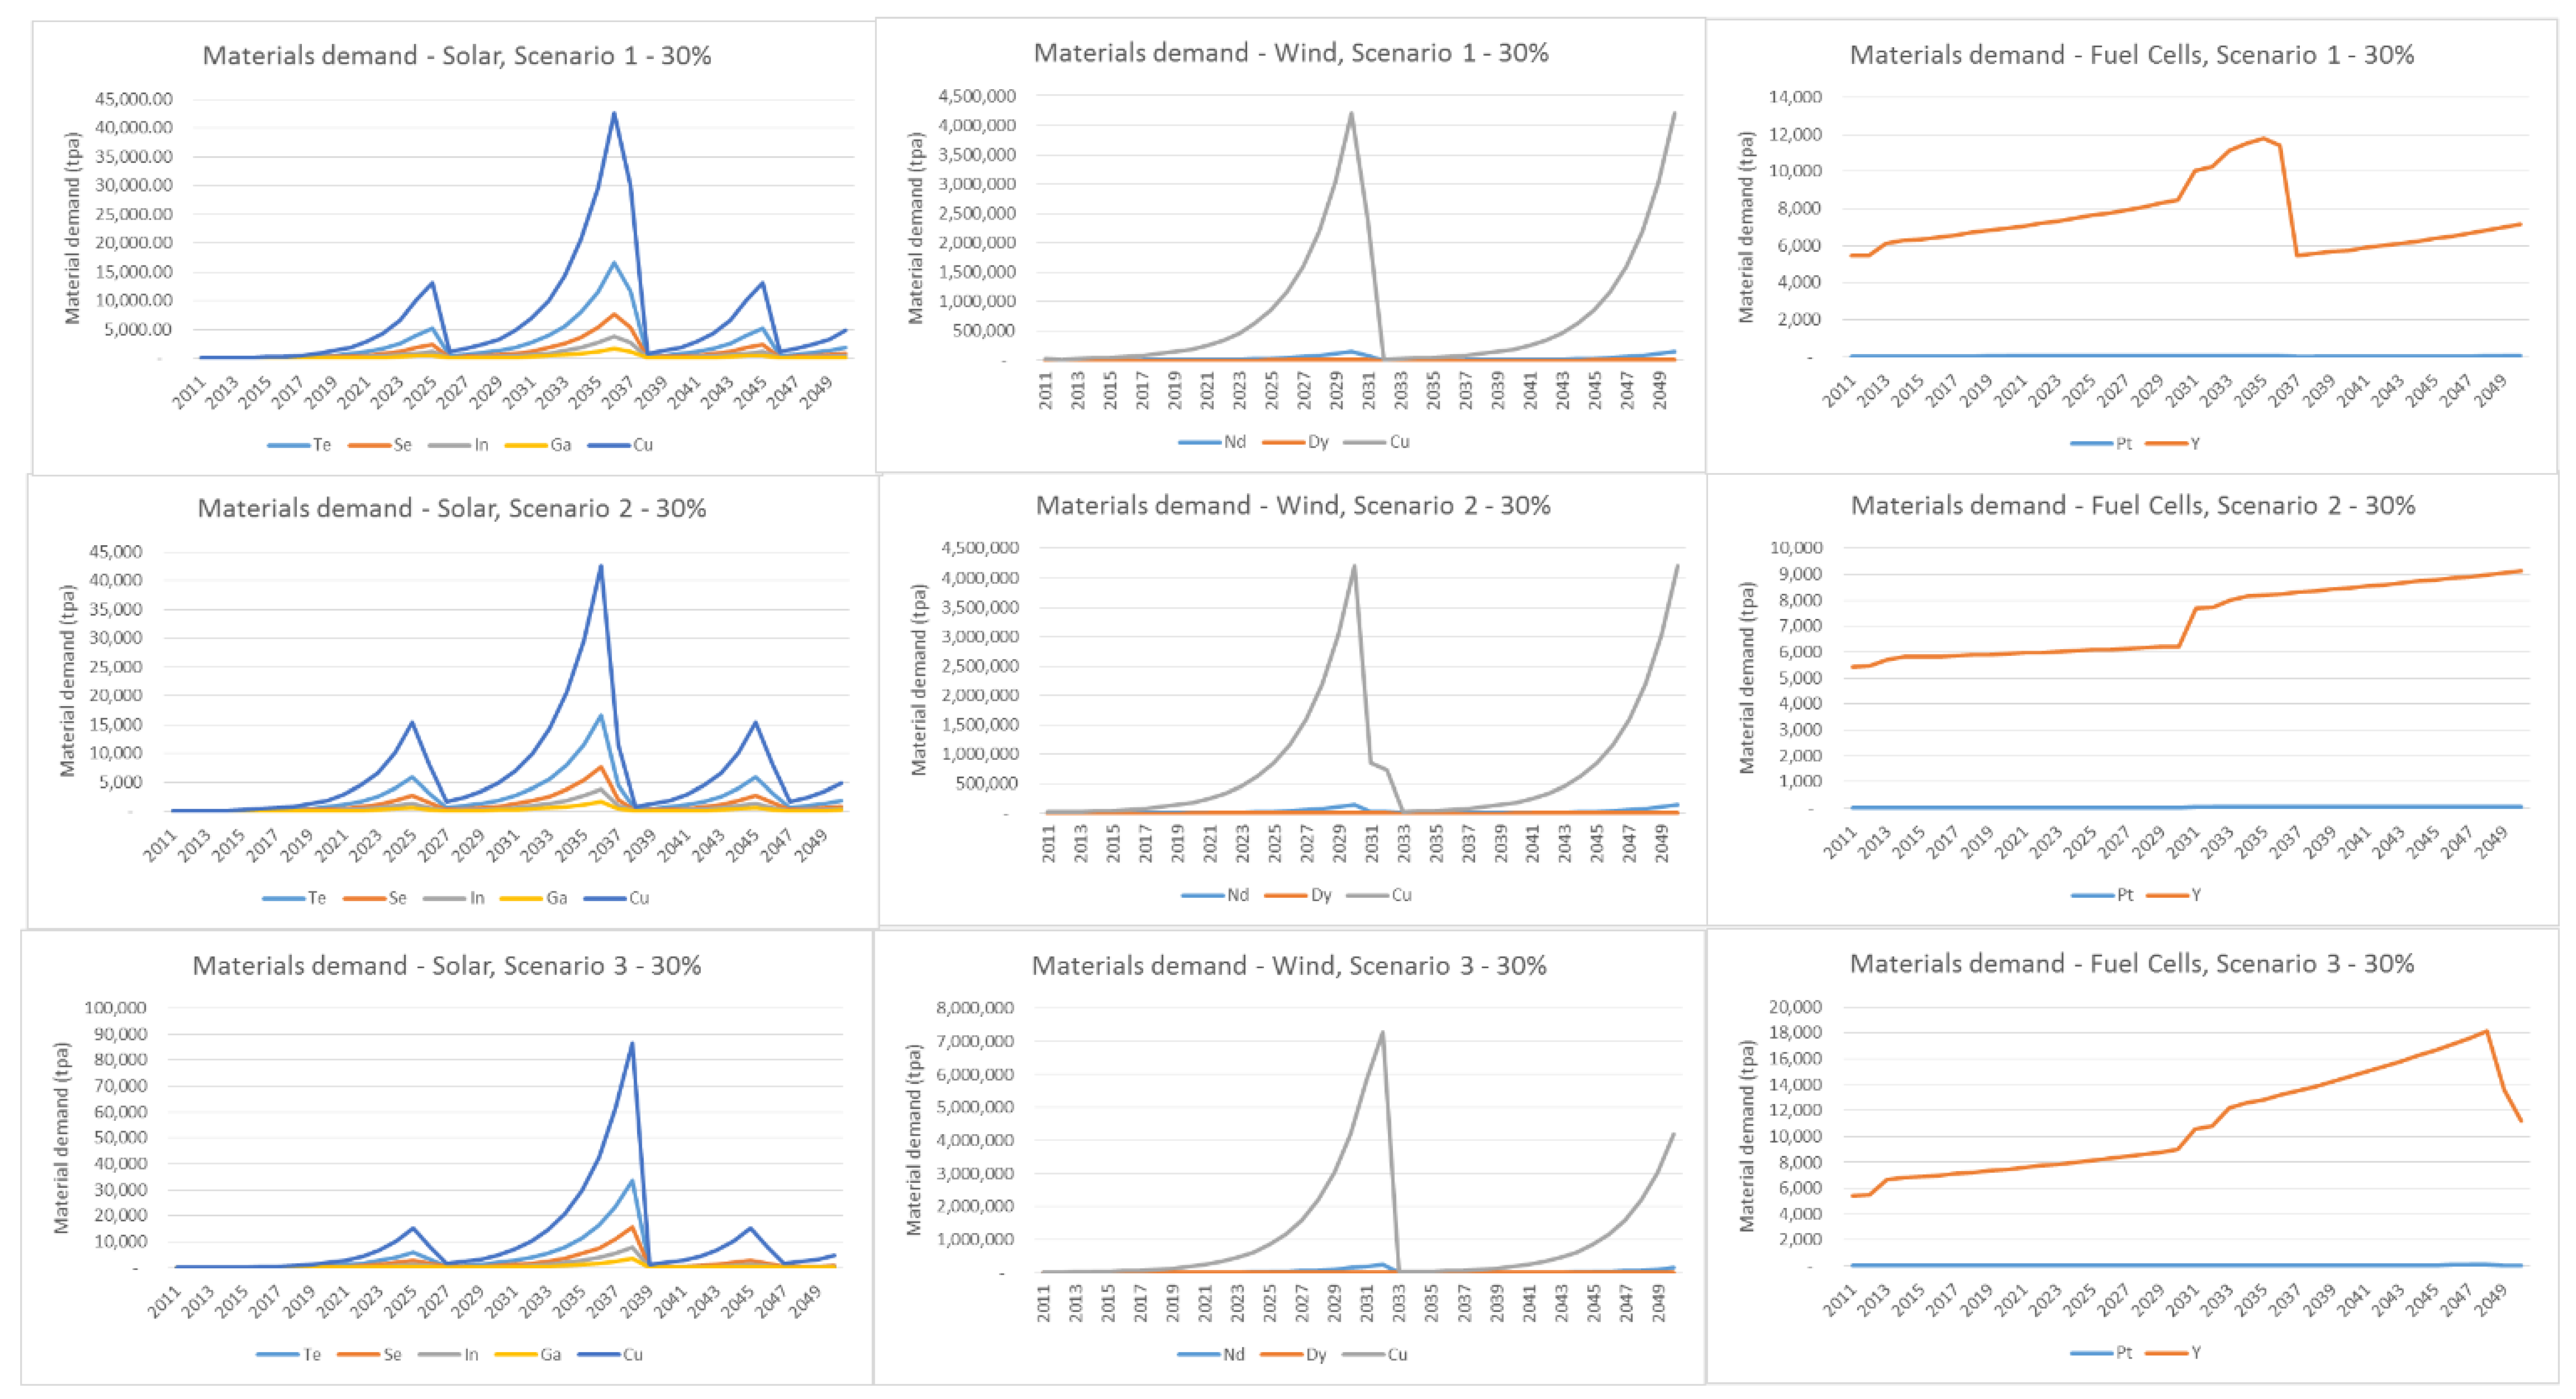
The material demand scenarios, shown in Figure 11 (full set in appendix Figure A3), have a series of alternative shapes according to the energy demand scenarios, with waves of demand according to the rate of growth of energy demand and the upper limitation accorded to the technologies in the scenario. In this study, no improvement in the material intensity has been considered, so the estimates are likely to be conservative. Table 10 presents some of the major reviewed studies’ material intensities for various critical minerals in the selected technologies. As noted earlier, the figures for the current study were obtained during previous work that undertook an extensive review of lifecycle assessment (LCA) studies and other technical and academic literature regarding these technologies [55]. It may be noted that the current study uses figures that are within the range of other studies, although differences arise in the kg/kW figure due to assumptions of efficiency as well as material per area or unit.
The energy technologies are all allocated a lifetime of 20 years and the need for replacement of existing infrastructure from the beginning of the period, as well as infrastructure installed from 2010–2050, is considered, with the existing infrastructure replacement averaged out over the first 20 years of the scenarios. The total material supply (not just for energy applications) is assumed to become available for potential recycling after 20 years, and is recycled according to the estimated rate (either the current rate or the improved rate, depending on the scenario).
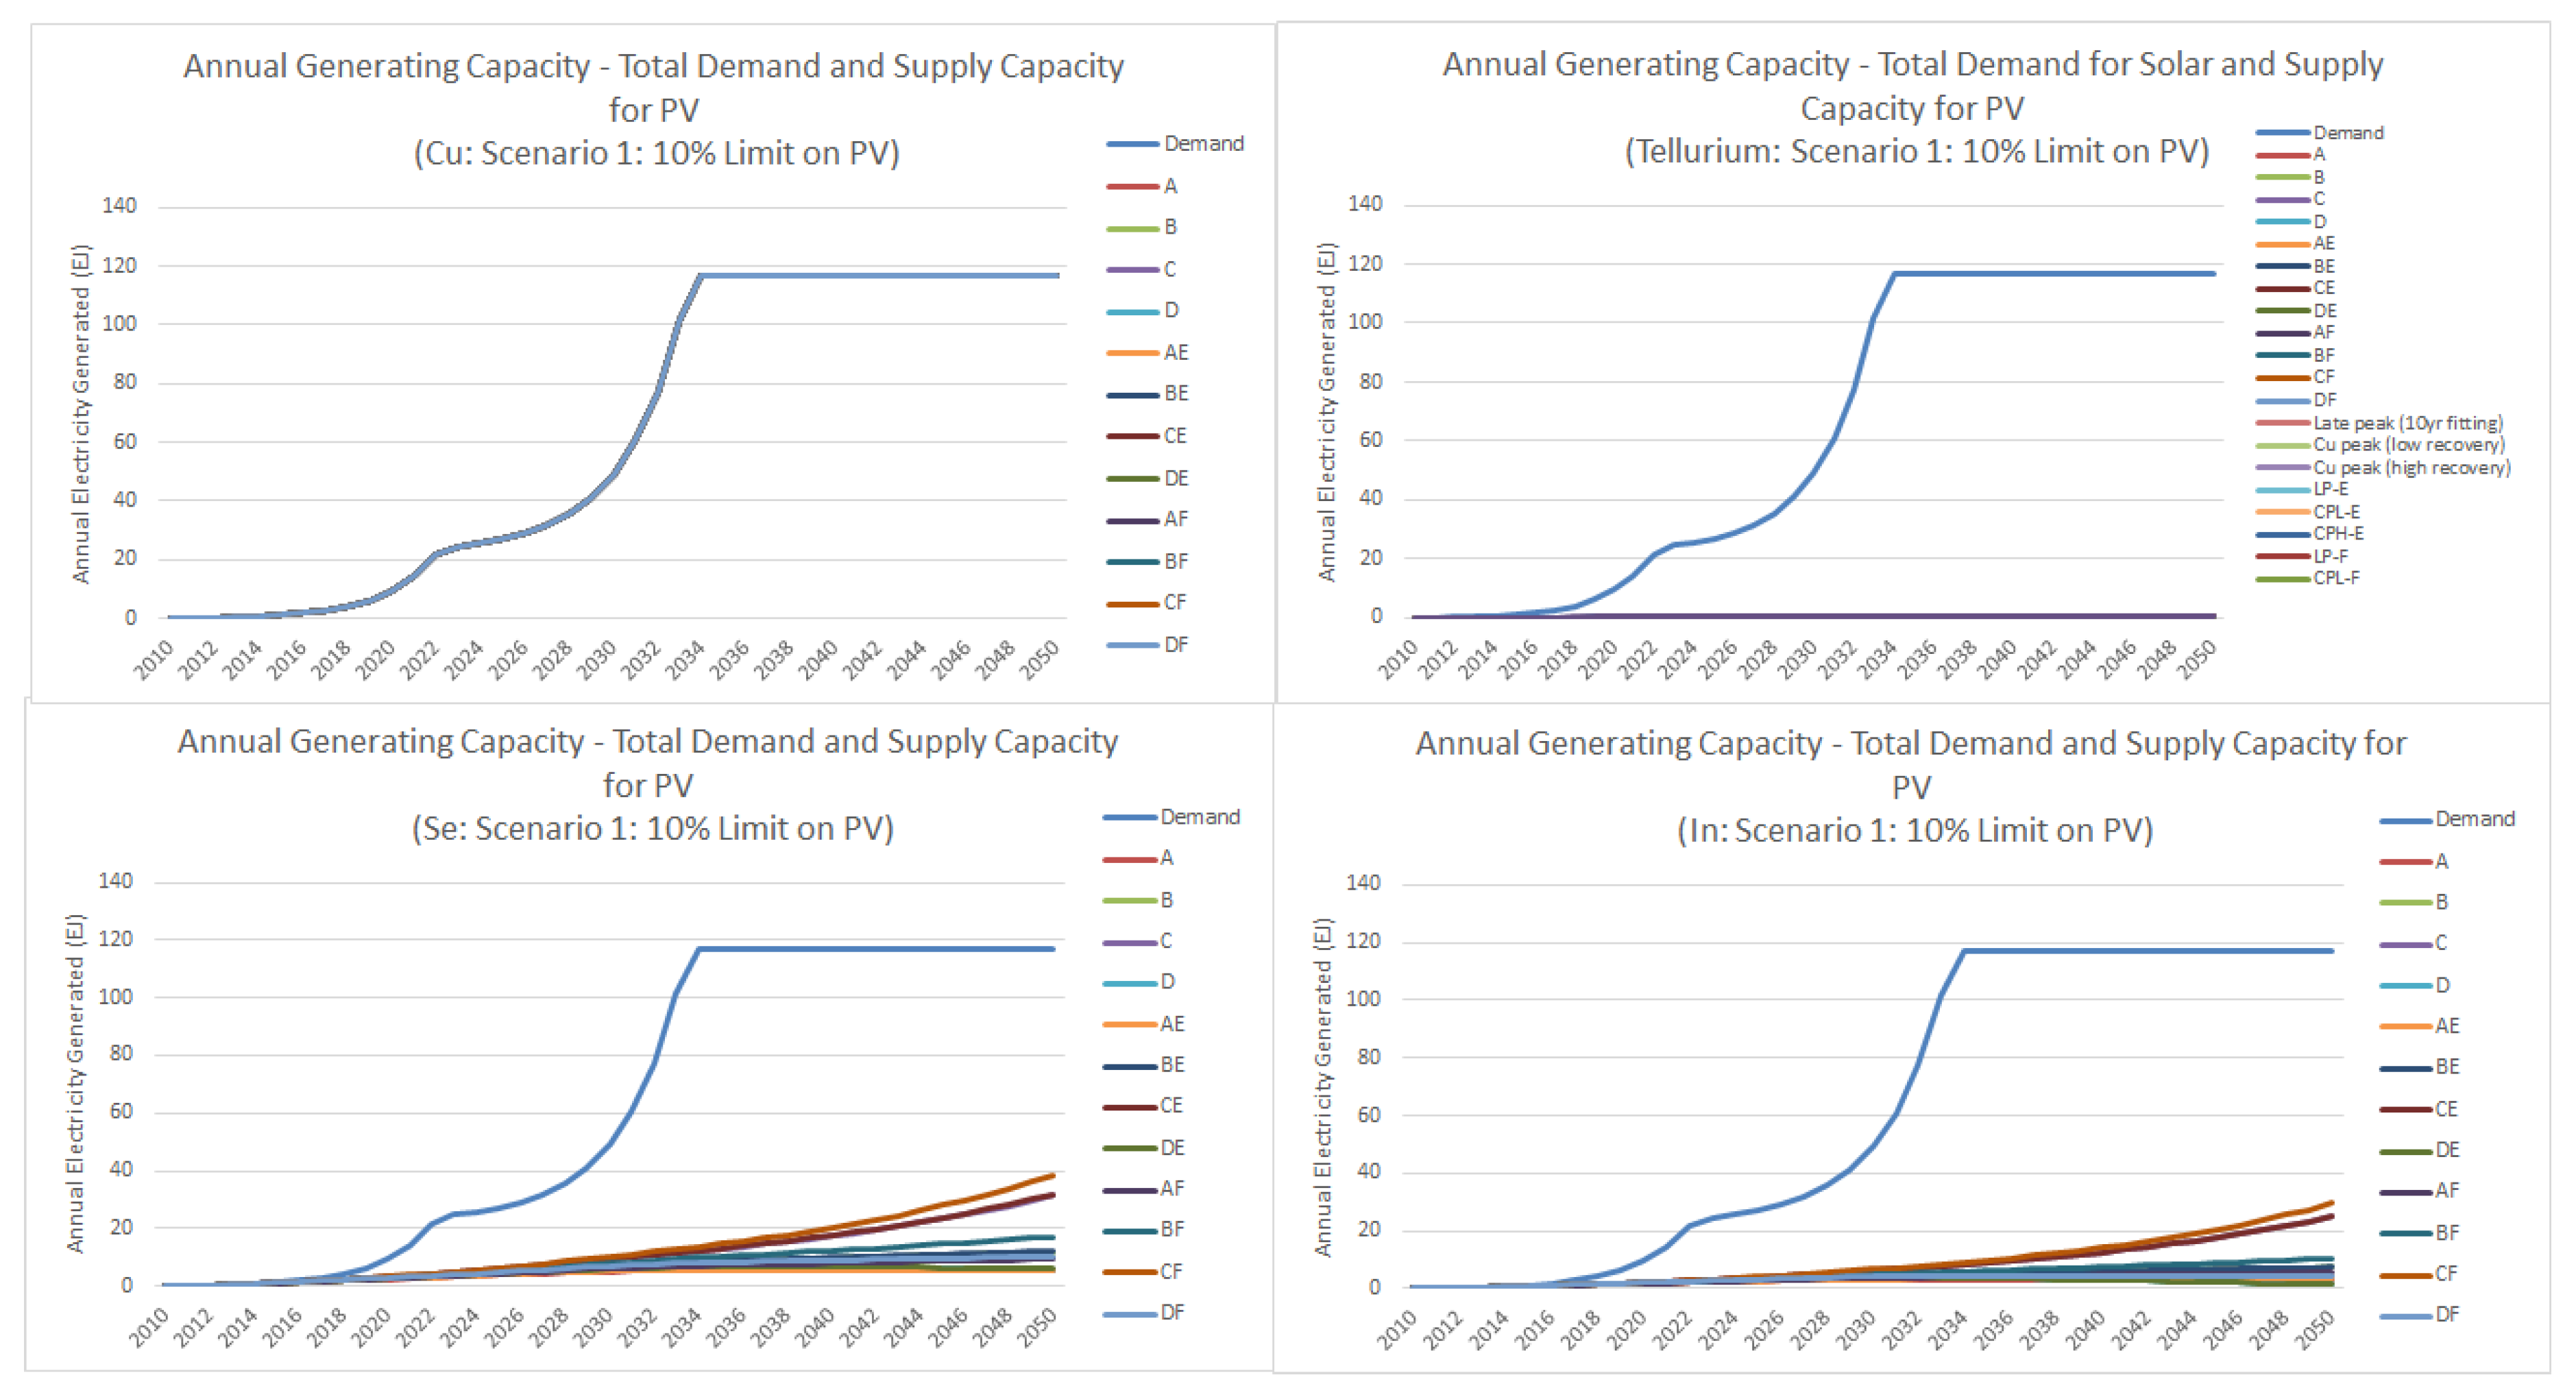
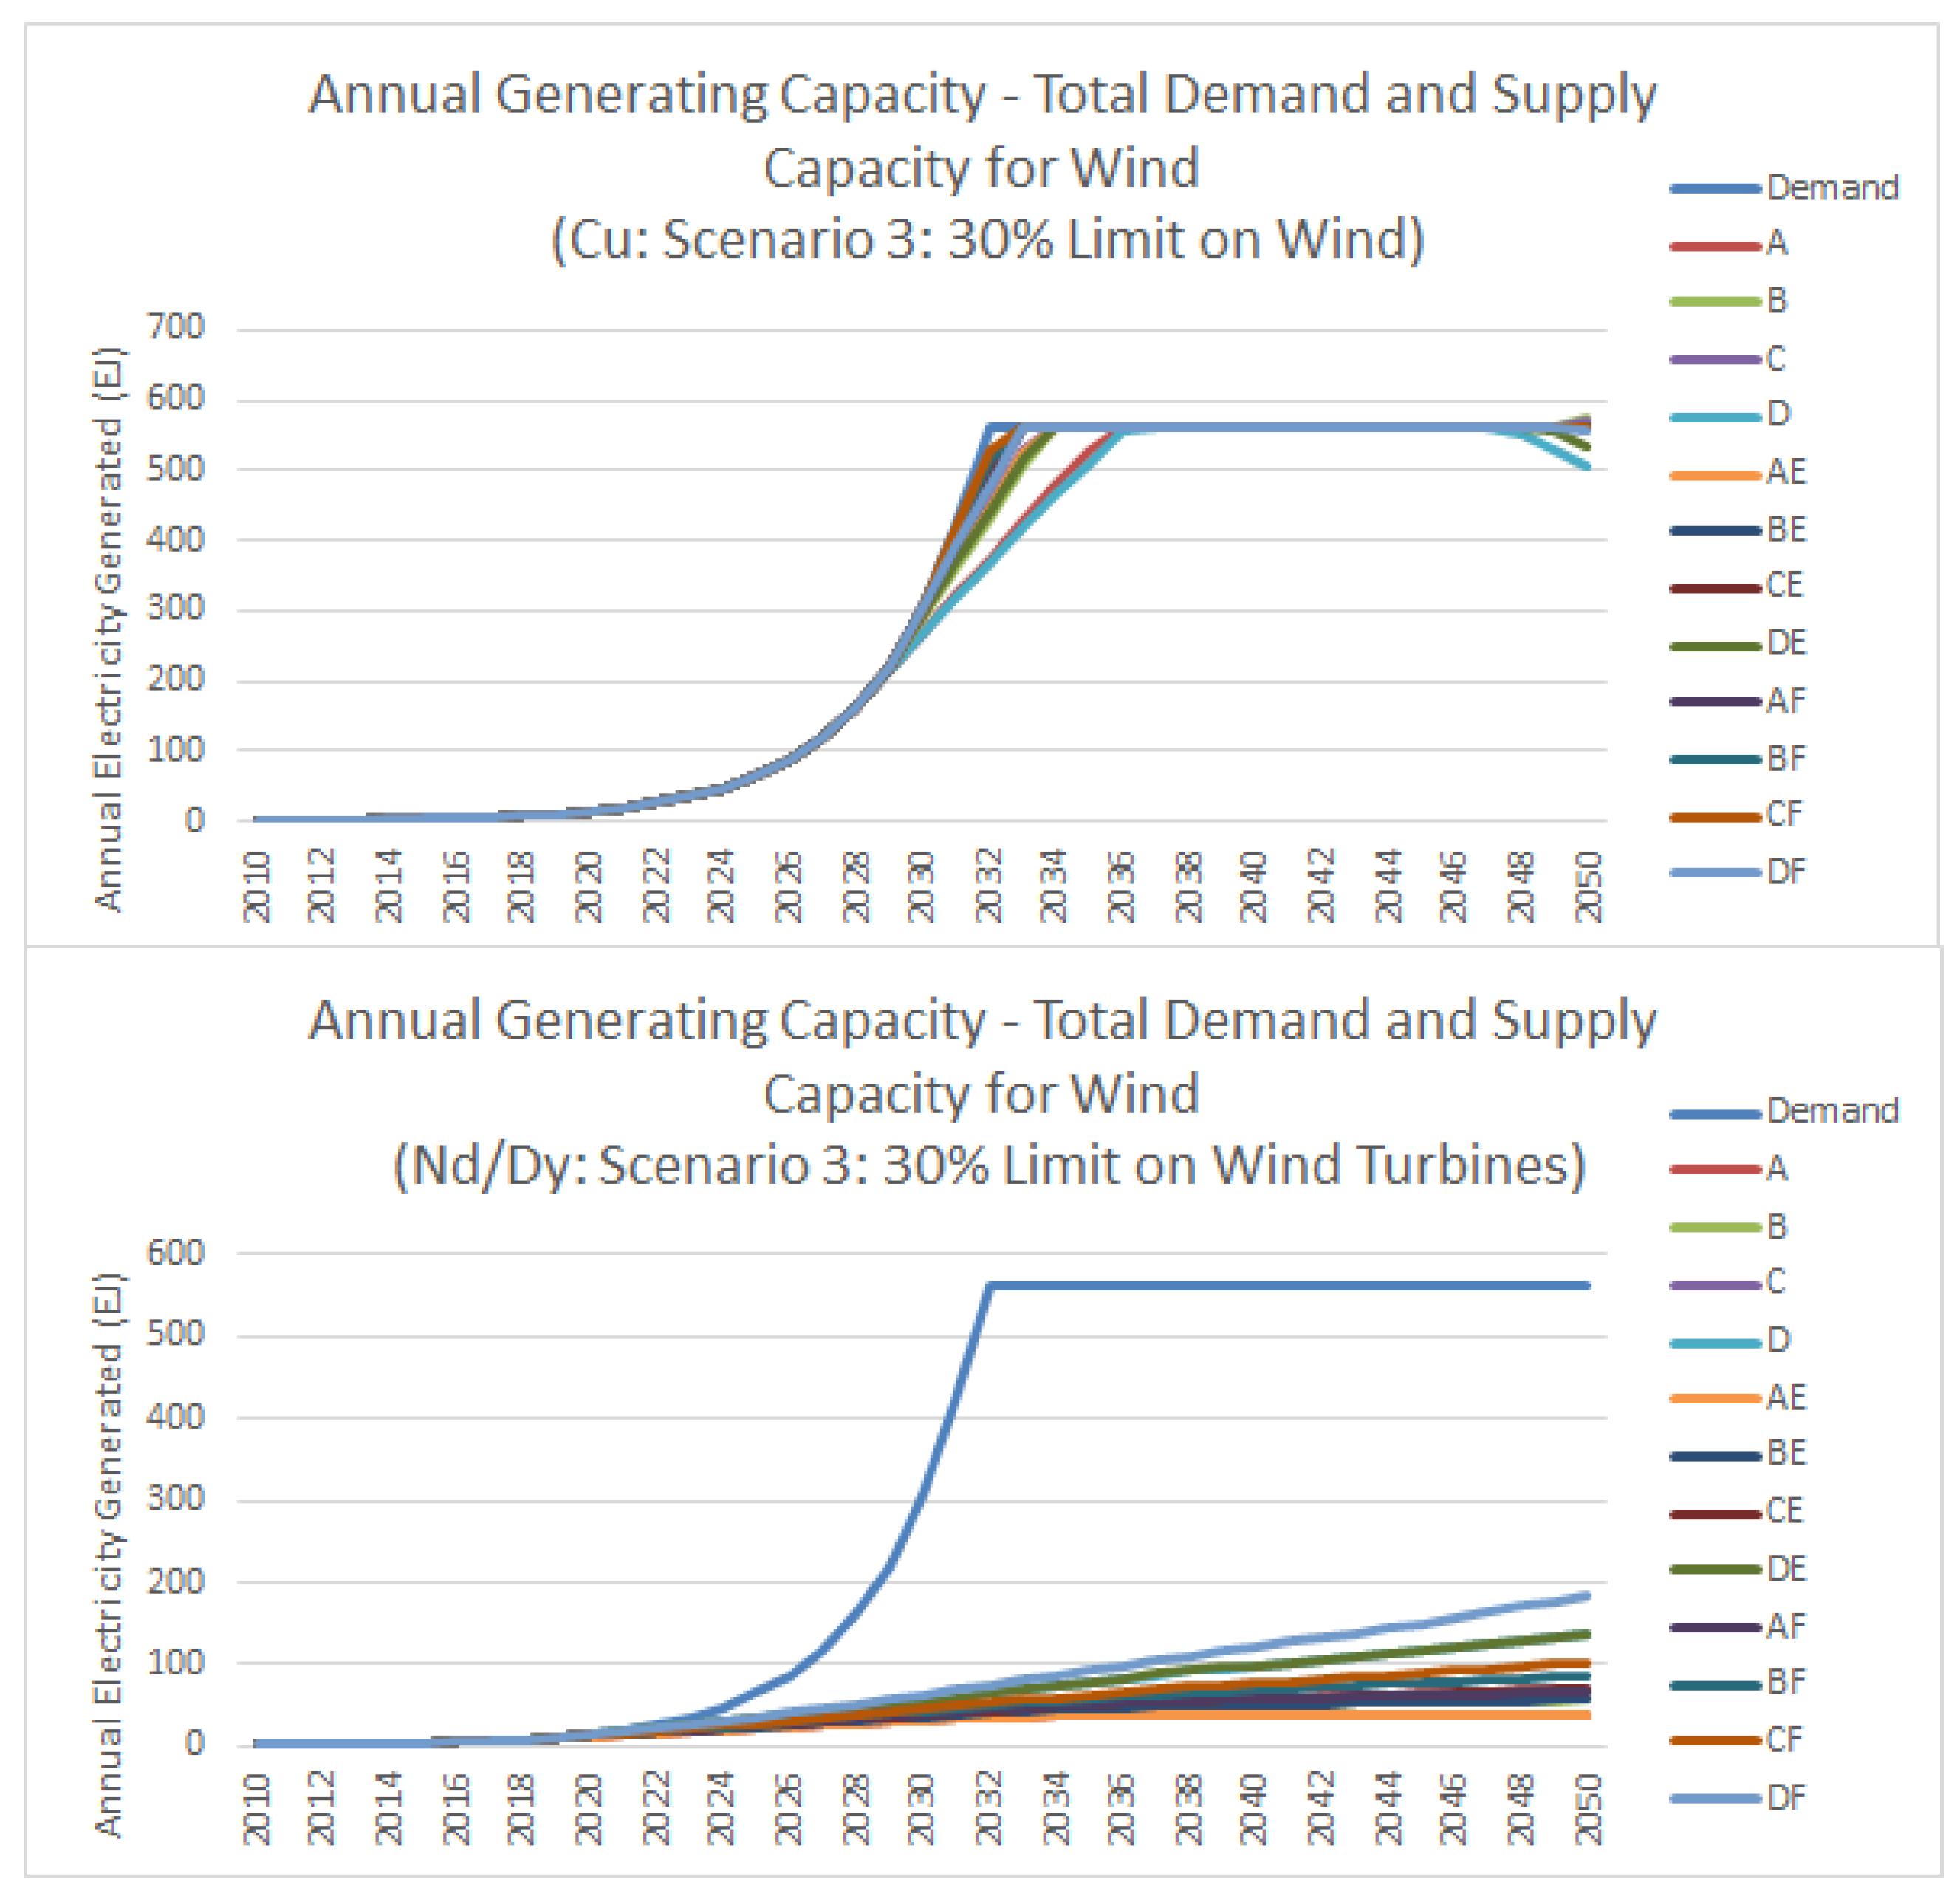
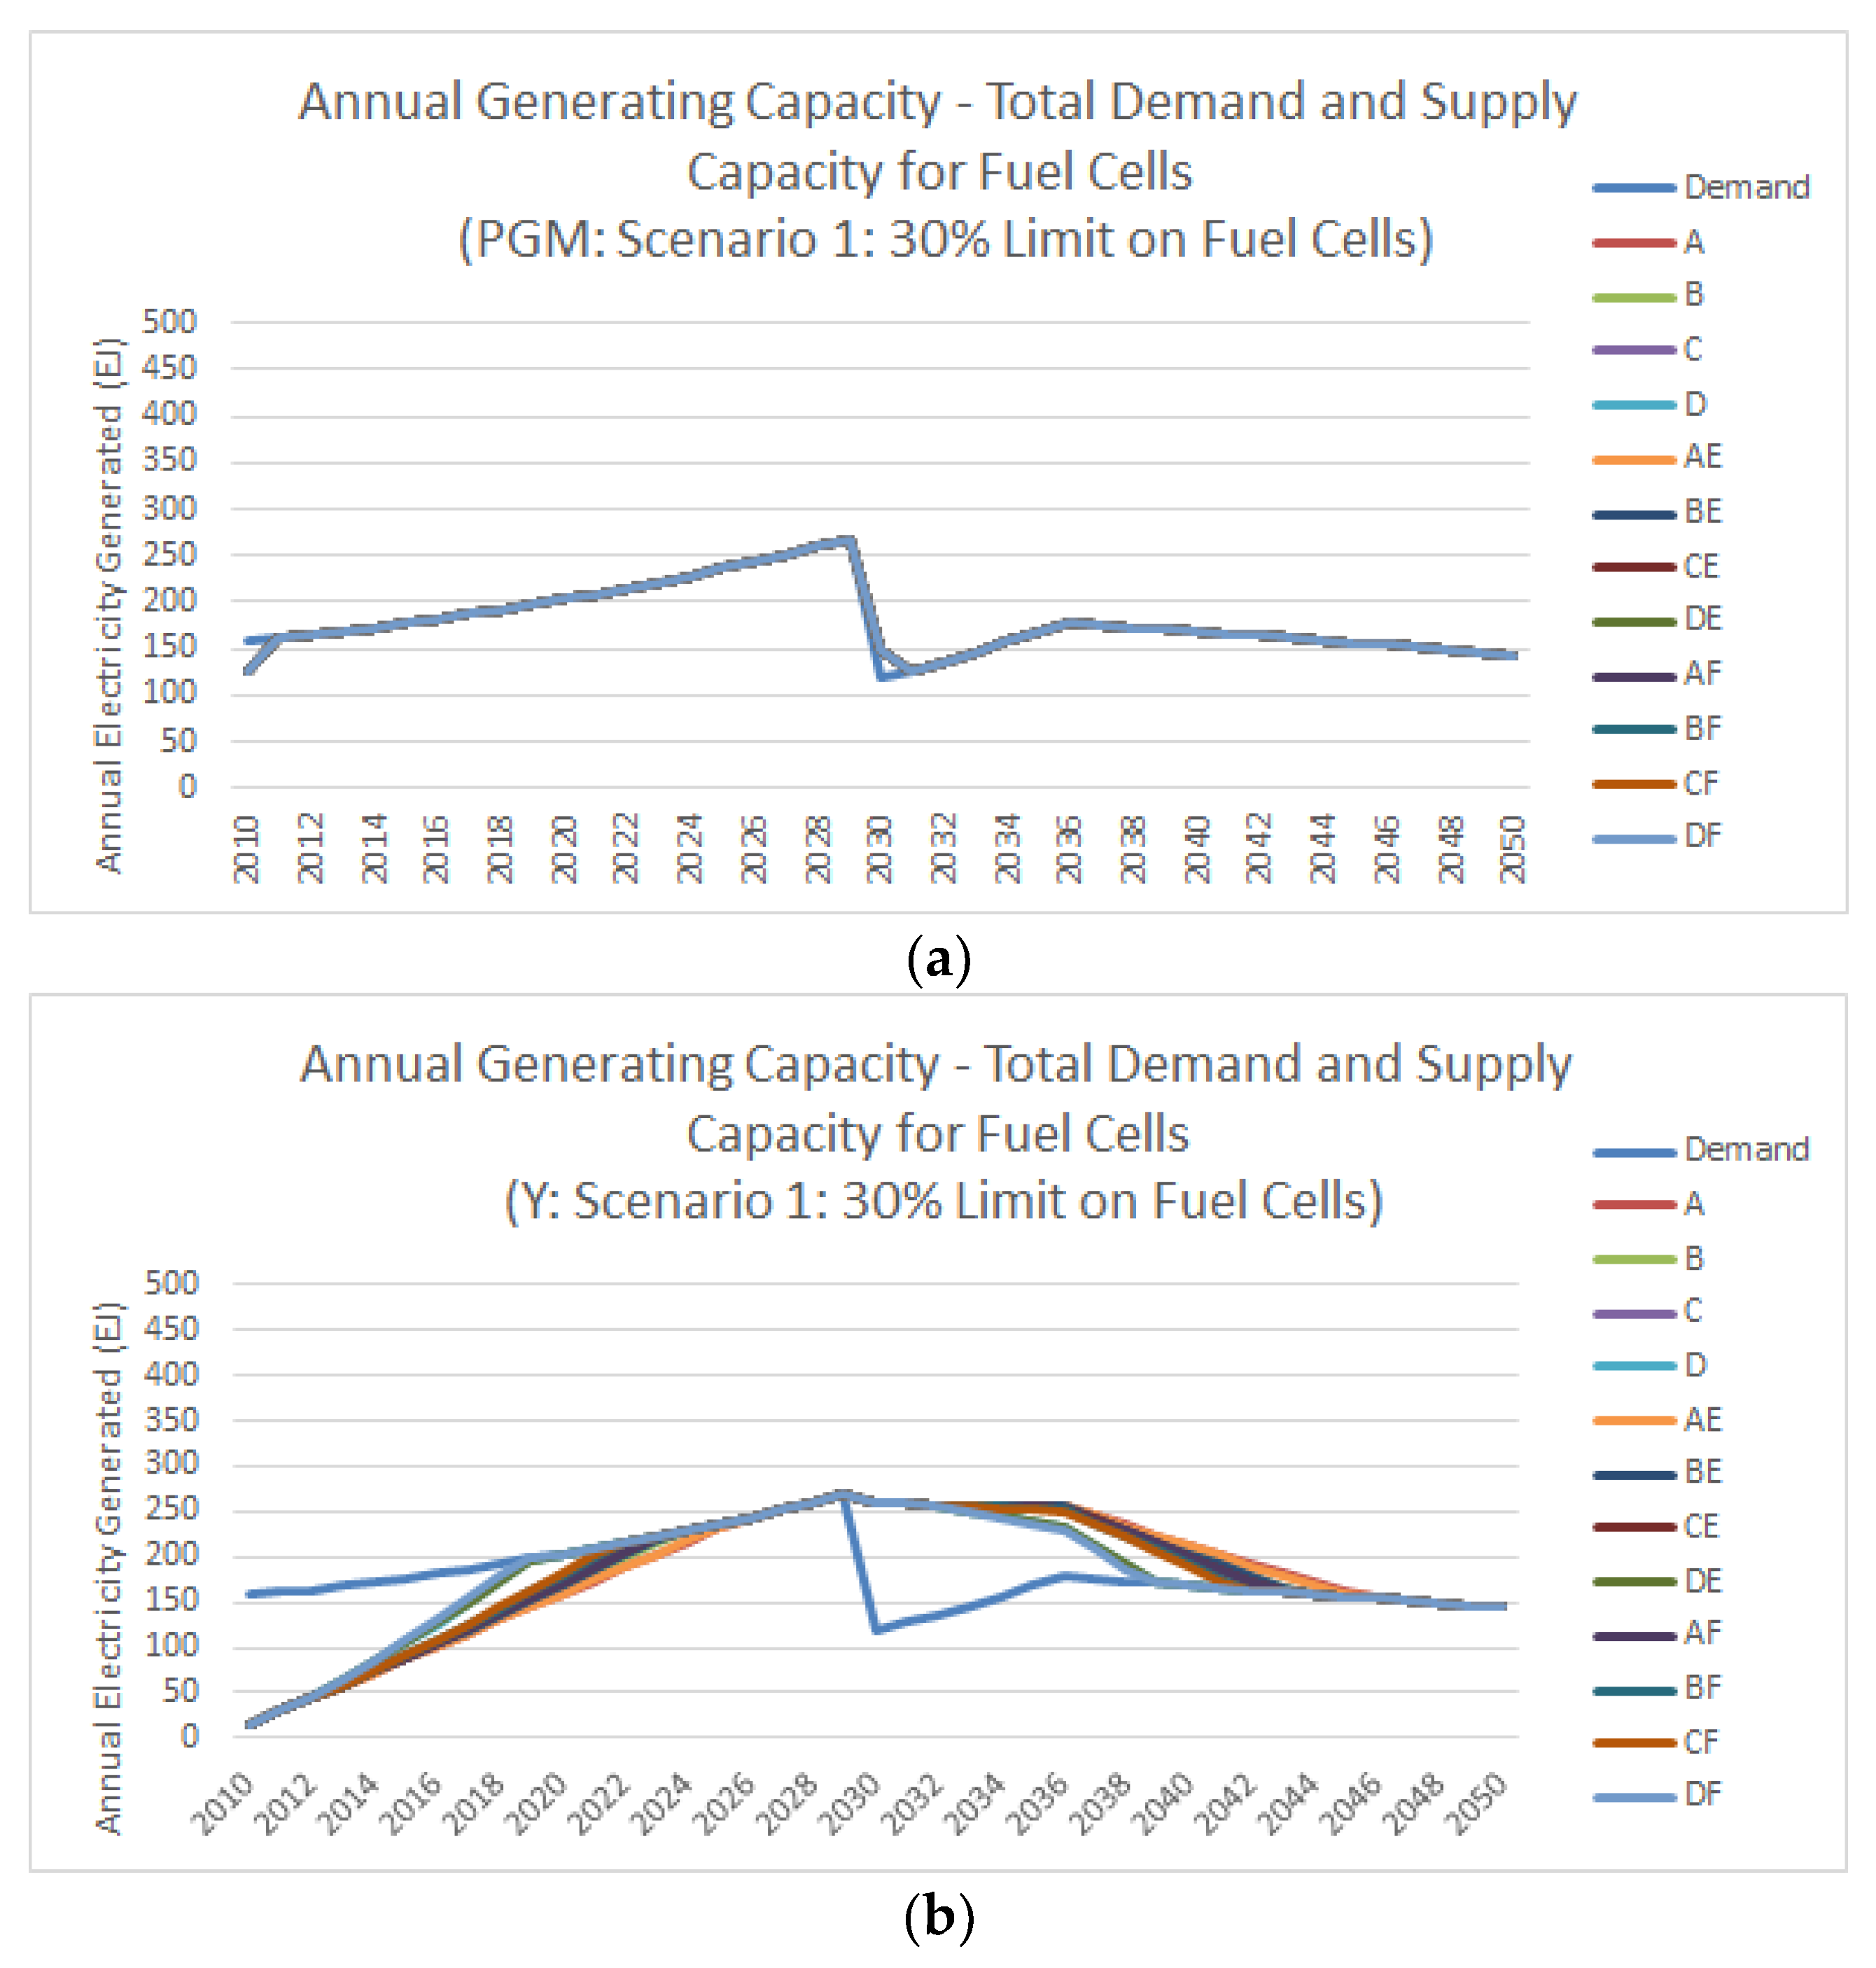
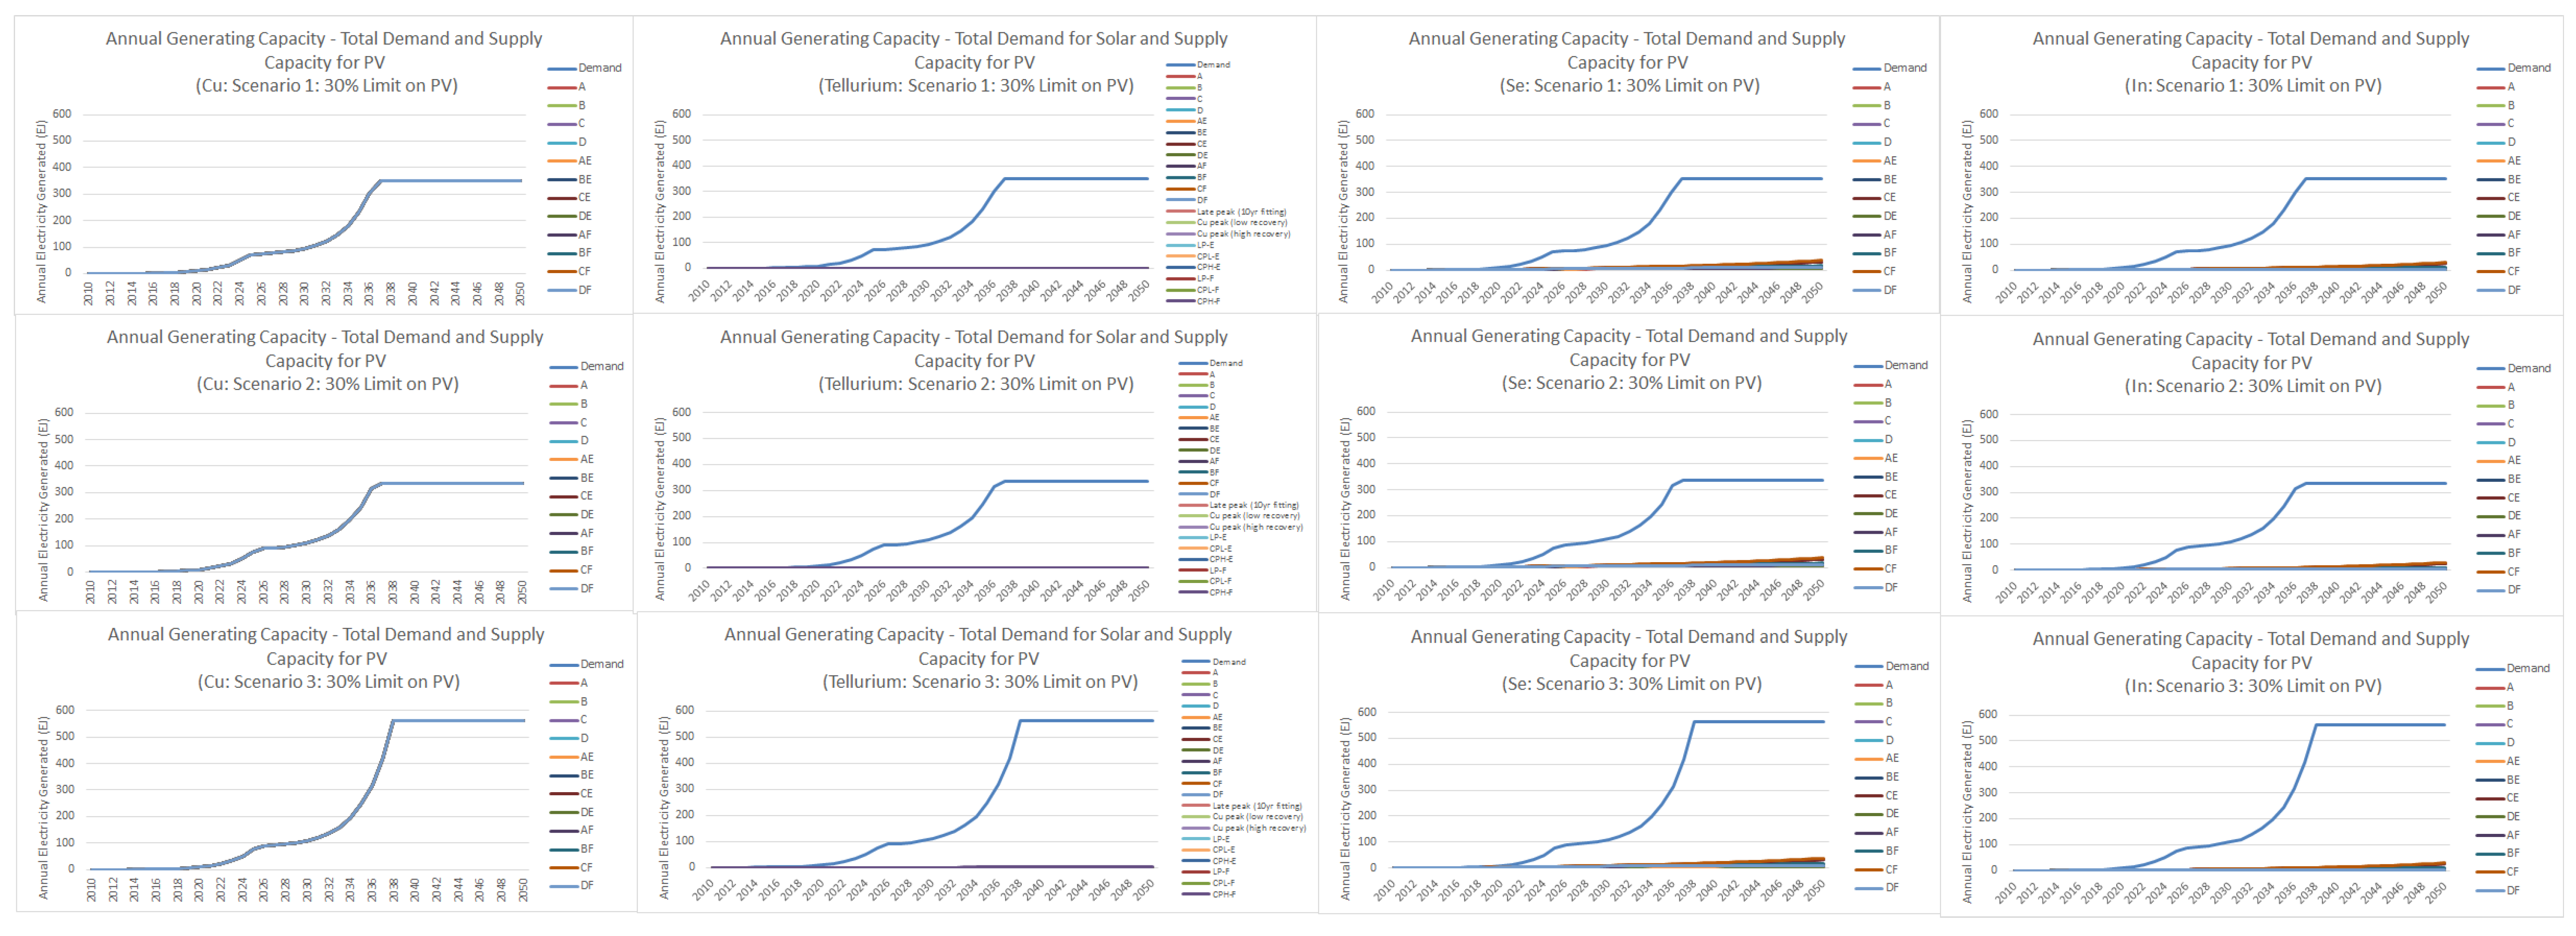
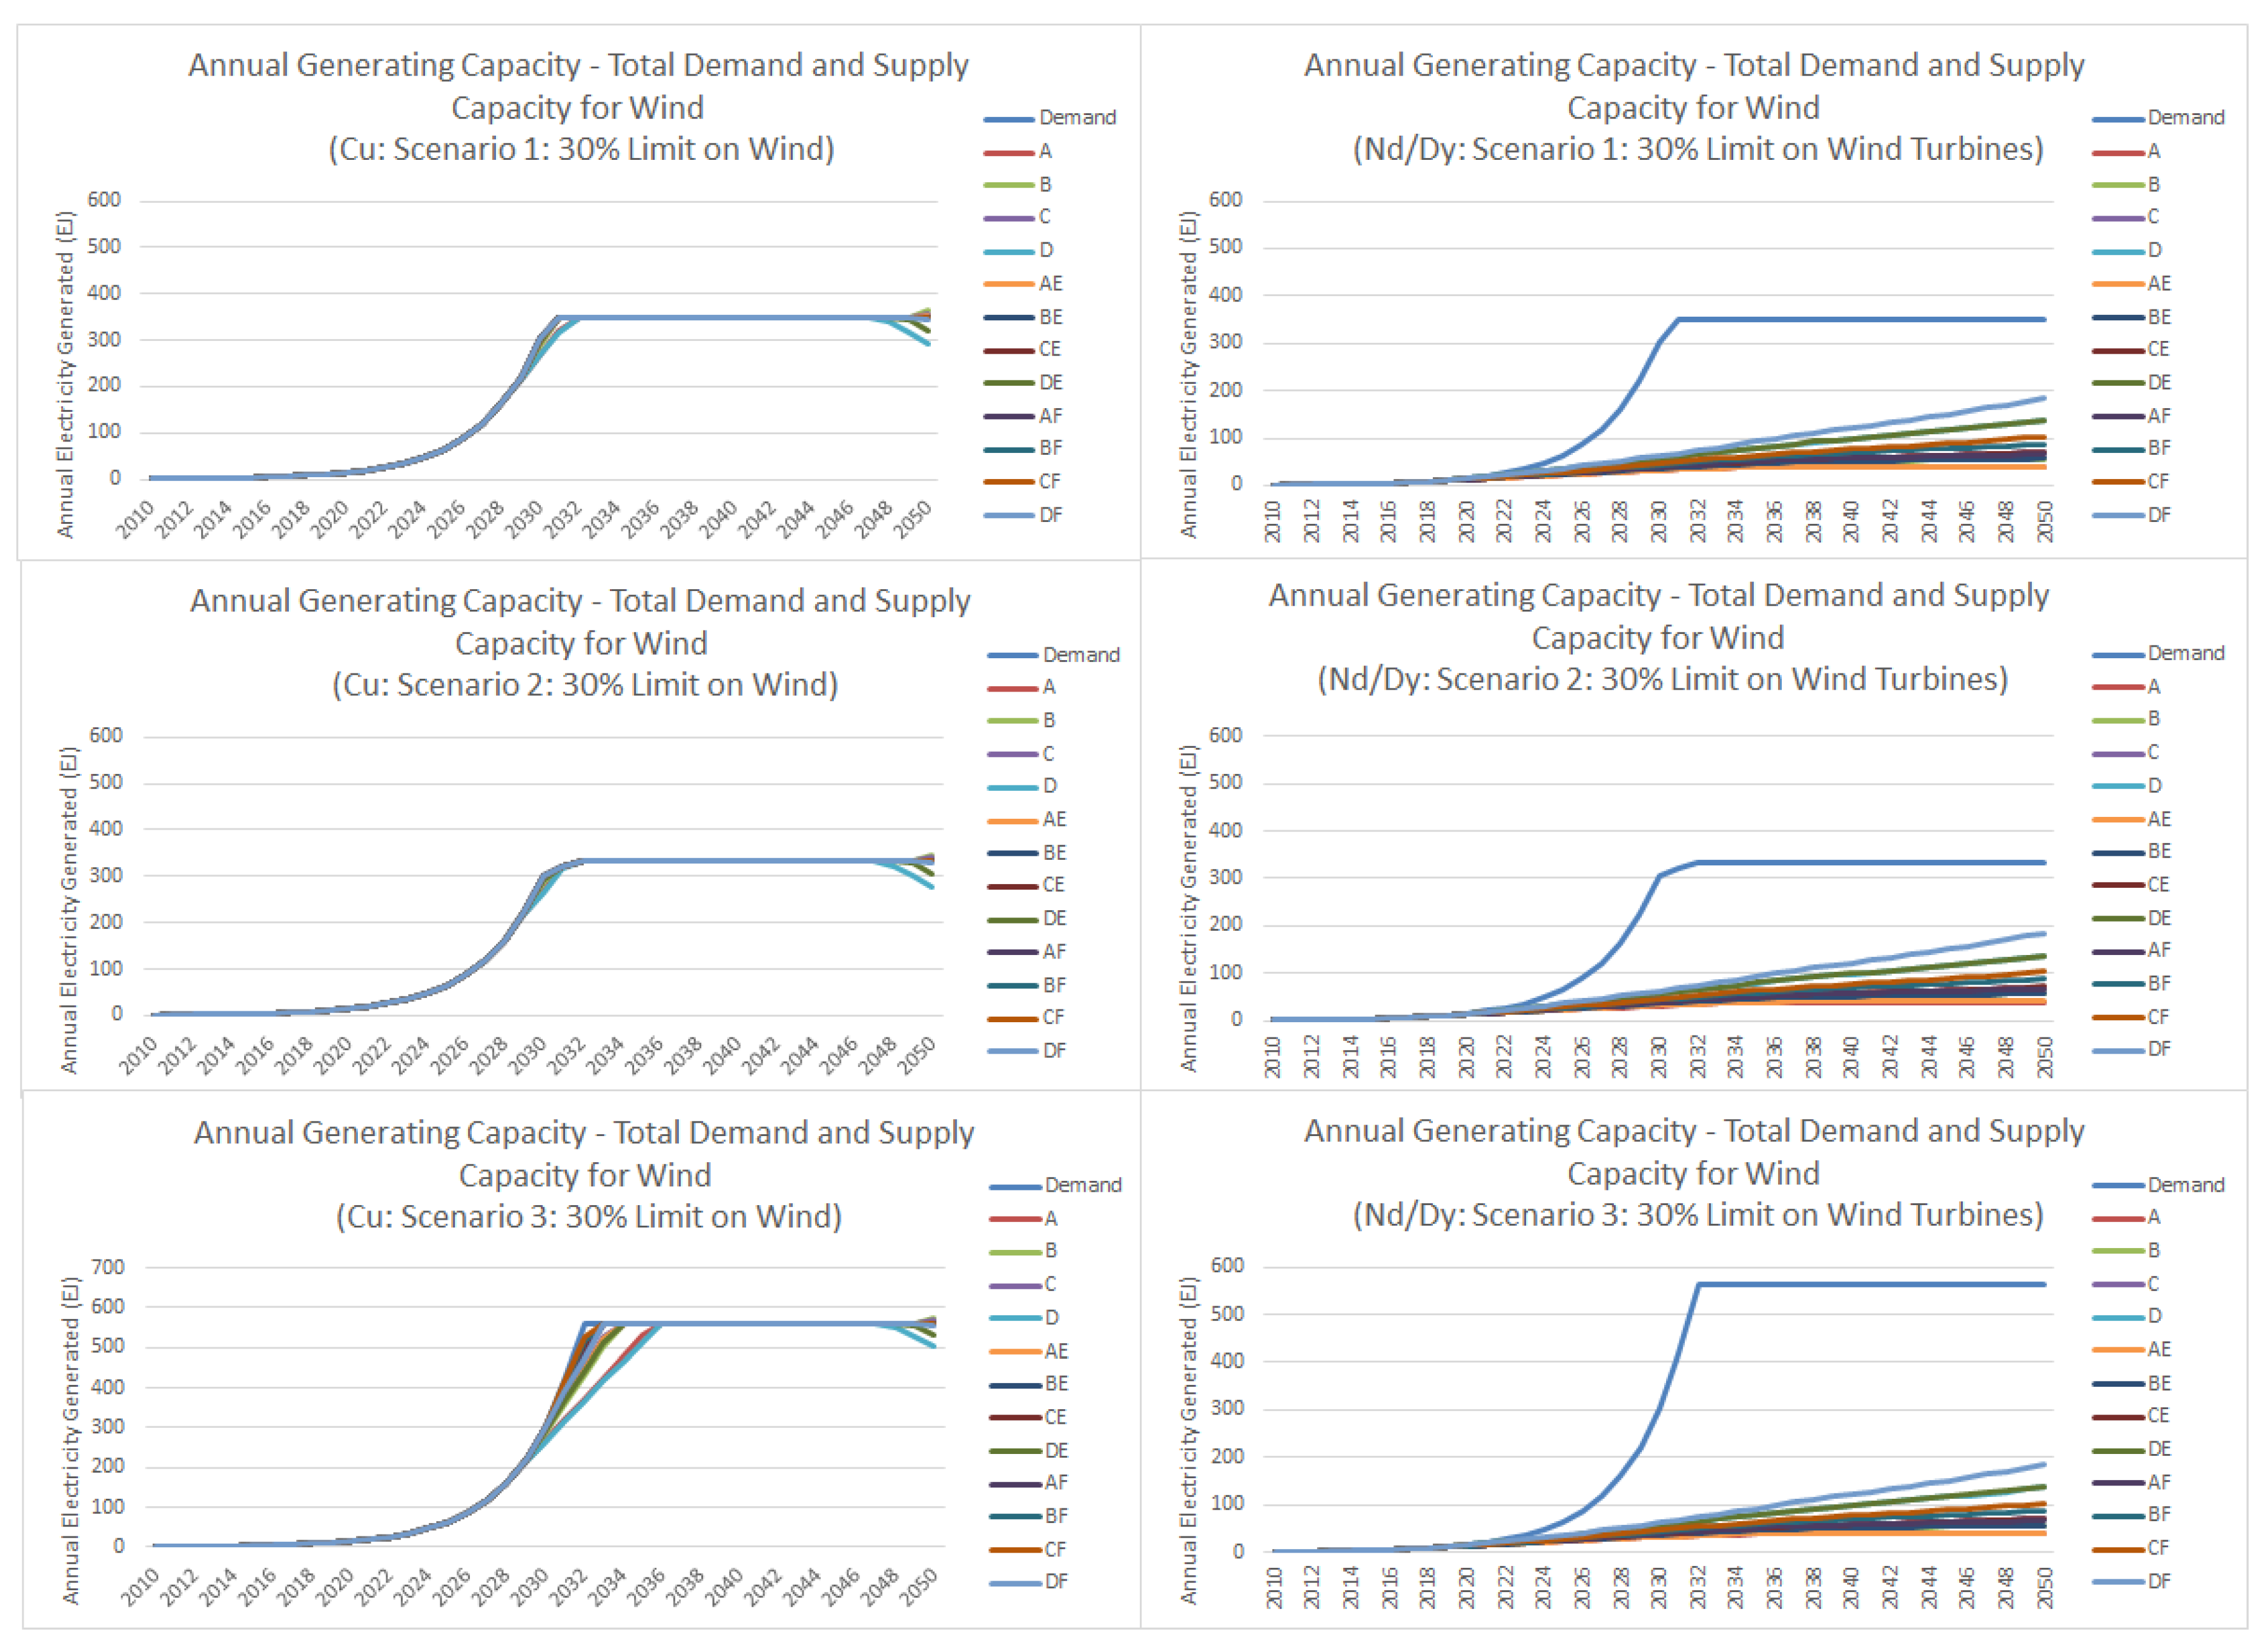
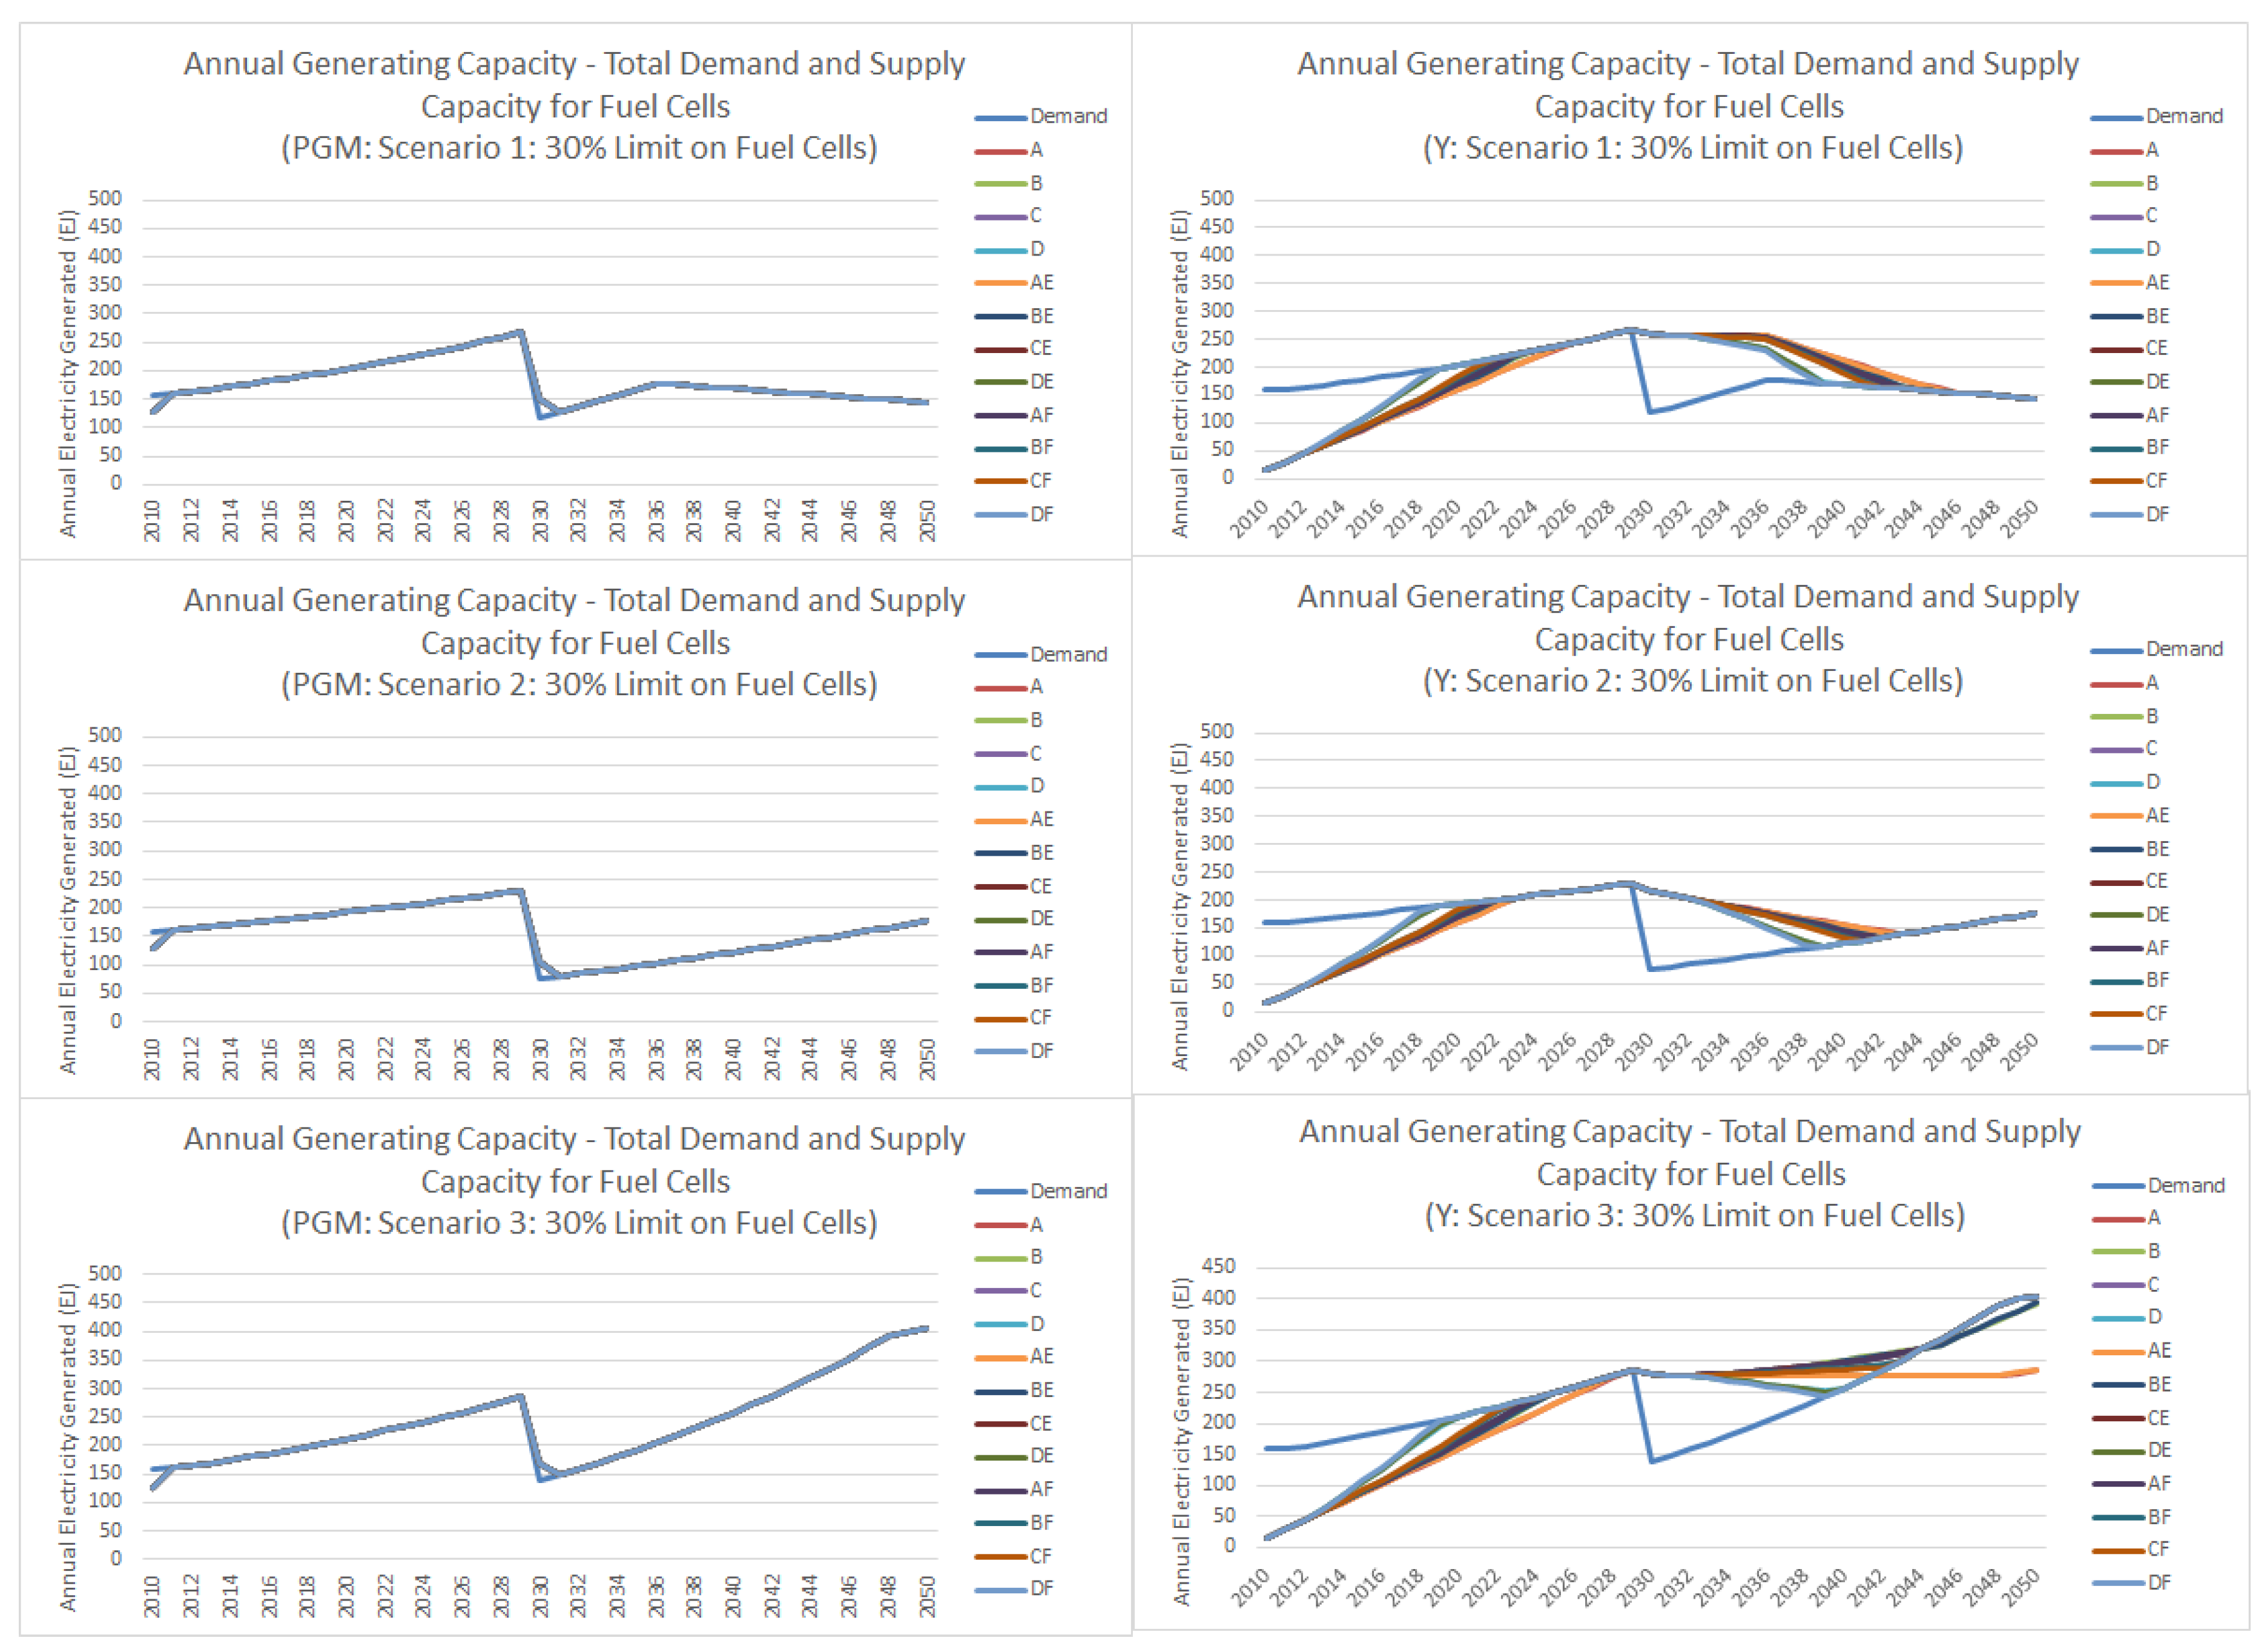
The results of the two scenario processes, supply and demand, were combined in order to determine whether shortfalls in critical minerals could be expected in the future. The combination of the supply and demand scenarios is used to provide a series of potential energy supply paths for each technology. In the case of no limitations, these supply paths under each mineral supply scenario will mirror the theoretical demand. In the case where demand exceeds supply, all of the supply of the mineral for the year will be used to produce the energy technology, and the limit in added capacity will become the real added capacity under that mineral supply scenario. Supply cannot exceed demand, except in cases where the theoretical energy demand declines over time, and the dynamics of the model mean that the decommissioning process will occur only at the end of the technology lifetime (20 years).

4. Results and Discussion

The combination of the resulting scenarios is presented as energy supply graphs for the most illustrative scenarios for each technology in Figure 12 (solar), Figure 13 (wind) and Figure 14 (fuel cells) (all scenarios are shown in appendix Figure A4, Figure A5 and Figure A6, respectively). These graphs do not take account of any market competition for the minerals in question, which is one limitation on the practicality of the resulting scenarios. It is important to note that the benefit of recycling is apparent, but that the impact of recycling is far less pronounced than the impact of alternative primary resource production assumptions, i.e., linear and exponential growth tend to provide larger surpluses (as per expectation). It is also important to note that, in the model applied, there is no limitation to the utilization of a resource beyond its physical availability.
In the case of solar power, it is apparent that the thin-film technologies that rely on these materials are unable to provide sufficiently rapid expansion of supply to meet with demand. Copper is not a constraint to PV, whereas the indium, selenium and tellurium provide increasingly stringent limitations on the expansion of thin-film technologies. Table 11 shows the final installed capacity of each technology under the base case conditions (described earlier). These conditions are later compared with previous studies and a sensitivity analysis is undertaken. Under the base case conditions, indium can provide up to 41% of demand being produced by thin-film solar cells, whereas selenium and tellurium can only provide 33% and 1.4% at best. Thus, the remainder of solar demand would need to be taken up by silicon or other photovoltaics, or by solar thermal technologies.
In the case of wind, the extremely rapid and constant increase in demand is not able to be continued on the supply side, with Nd-Dy becoming constraining materials in the early-to mid-2020s. Copper for generator windings and cabling within wind farms also provides a constraint in the late 2020s to early 2030s. The ultimate demand (if a peak limitation of 30% of electricity generation is assumed) may be able to be met, but the rate of increase is limited. This is important also because it means that there would most likely be a pinch on other technologies, such as electric vehicles, using the materials in question.
Fuel cells present no supply constraints in the period for PGMs, with supply largely mirroring demand, although there is an initial period where supply lags behind demand, and a later period where the decrease in demand for fuel cells leads the decommissioning, and therefore the decline in the energy supplied is delayed, although in reality this could be shifted through a reduction in the capacity factor. A similar situation occurs for yttrium, although the lead-in time to reach demand and the reduction time are longer.
In these scenarios, the consideration of a mixed portfolio of technologies has not been explicitly addressed. Thus, no optimization has been undertaken to examine the competitive effects of alternative technologies in the energy mix. With full recognition of the limitations of the scenarios, it is suggested that the results presented here offer some new insights into potential limitations at the mineral-energy nexus, but to better contextualize this, some other studies are compared below.

4.1. Sensitivity Analysis

There are a variety of important parameters to be considered in each scenario which affect the potential installed capacity and overall provision of energy. In the sensitivity analysis, the considered parameters were material intensity, capacity factor and lifetime, which may affect the outcomes of the scenarios. The material intensity for the base case was extracted on the basis of a wide review of academic and technical literature, and was considered as reasonably representative. In the sensitivity analysis, the base case was compared with three alternative scenarios (Table 12) representing the average of the surveyed literature shown in Table 10. Likewise, the capacity factors were considered the most representative from the literature examined, but the sensitivity was assessed based on the alternatives in Table 13. Finally, a comparison of the final installed capacity under alternative lifetime assumptions for the technology was undertaken using 15-, 20-, 25- and 30-year lifetimes.
The outcomes of the sensitivity analysis for a single scenario—scenario 1 (10%)—are shown in Figure 15. The behavior of the scenarios is interesting to examine, as the limitations of material demand or supply create different outcomes. In the case of installed capacity, for highly resource-limited technologies such as PV (Te, Se, In), the installed capacity does not change with the capacity factor; the maximum possible installations are already being installed, and the gap between demand and supply is still very high. In the case of the other technologies and copper for PV, there is a reduction in installed capacity with an increase in the capacity factor, because supply exceeds demand. In the case of material intensity, in supply-limited cases this can dramatically affect the installed capacity, for example for PV (apart from copper). In the case of neodymium/dysprosium and yttrium, it is observed that the 2050 installed capacity increases with the maximum intensity—this is due to the lag between supply and demand on the energy supply side (and subsequent decommissioning).
The results of a sensitivity analysis for the lifetime of the technology are shown in Figure 16, in this case comparing the 1 (30%) scenario. It is apparent that there is potential for greater installed capacity generally when the lifetime is assumed to be longer. In the case of copper for wind or PV power and PGM for fuel cells, the requirement for installation is not restricted. Where there is a slight variation at 20 years for copper for wind and yttrium for fuel cells, this is due to transient behavior in the material balance, which occurs earlier in a 15-year cycle, and therefore is not shown in this snapshot of the final state.
It was apparent from the sensitivity analysis that there was potential to improve the performance of the technologies in this assessment by changing the parameters, and this is most important for the PV technologies which fall far below the demand in every scenario. In order to identify whether any of the PV technologies that are seemingly limited by the current scenarios could be achieved under adjusted, highly optimistic, but technically possible, variations of the existing base case, a series of combined scenarios were undertaken. To maximize the possibilities of each technology achieving the required installed capacity, a capacity factor of 25% and a lifetime of 40 years were assumed. The material intensity was then reduced gradually by a factor in order to gauge whether, and under what conditions, the required capacity in 2050 could be achieved. The results indicated that the required improvement in material intensity (reduction from the base case) to meet the highest capacity requirements was around 90% for selenium and indium. For tellurium, a 99% improvement in intensity would achieve the 10% energy scenarios, or a 99.7% improvement would achieve the 30% energy scenarios.

4.2. Comparison with Previous Studies

It is important to consider how the results of this study compare with the conclusions of others, and how the varying assumptions lead to changes in the outcomes. There have been a number of studies specifically examining the Dy/Nd and Te/In scenarios for clean energy, and these will be compared here, whereas the PGM scenario has only partial parallels with a number of studies on the requirement of PGM for fuel cell vehicles, but these are considered comparable due to the current study considering total primary energy supply (not just electricity), and therefore inclusive of transportation energy.
Considering the case of tellurium, the current study indicates a final (2050) installed capacity of 250 GW for the base case, 360 GW for a slightly lower average material intensity, or 12,000 GW for a highly optimistic (probably infeasible level of minimum material intensity) case. This compares to a “conservative case” of approximately 1000 GW in 2050 by Fthenakis [38], a 300 GW limit by Andersson [35], and 120 GW by Feltrin and Freundlich [62]. There is significant differentiation depending on the material intensity assumed, as well as the recovery rates and supply of tellurium from copper. In this sense, the current case study falls well within the limits of other studies.
In the case of PGM, the current study does not forecast any shortfall in supply, but it does not assume sectoral competition. Likewise, the studies examined [26,27,28,30] concluded that (except in exceptionally aggressive roll-out scenarios) there would be no shortfall, and that overall the reserves should be sufficient (for the targets used).
In contrast with PGM, the byproduct metals such as Te/In have shown widely varying assumptions of the amount of total material available, the peak value of annual production and whether or not this will limit expansion of the sector. It is important to note that some estimates of annual production assume that all by-product material is available to the industry [38], which is theoretically true, but not yet economically or technically practicable. Other studies insist on the importance of ore body consideration [59] and find limitations to metal availability, while some do not consider this explicitly, rather looking at trends in changes of processing methods over time [58] and in this case did not find limitations.
With regards to Dy/Nd, most studies anticipate that there is a significant risk that supply will be insufficient to meet demand under current conditions, with greater recycling and material substitution being key methods to alleviate supply risk significantly, although not entirely [24,25,45,63]. Although the timing varies, these studies anticipate a deficit of supply at some stage [24,25,63]. As with the present study, this leads to a delay in the roll-out of technology, which may eventually catch up to the original expected demand.

4.3. Viability of Deposits

The interest in developing unconventional resources is driven by several factors, including concerns for the lack and/or exhaustion of primary geological resources, security of supply for critical metals vital to modern technologies and military applications, and technological advances allowing us to overcome some general economic and environmental burdens. In this section, the differences and potentials of the deep ocean and recycling from energy technology urban ores are examined briefly with respect to their viability as sources of critical minerals.
Primary mining and processing of critical metals usually result in significant environmental impacts. For example, the processing of rare earths is characterized by high levels of water consumption, energy inputs, chemicals use, as well as separate treatment and disposal of radioactive waste materials [64]. The low grade of many deposits of these materials is one factor in this, as is the difficulty of separating chemically and physically similar components, particularly in the case of REEs and PGMs [65]. The high environmental impacts of sourcing rare earths from conventional mining and processing [66] provide an incentive to seek unconventional sources. However, current recycling techniques do not always improve the environmental impacts of production, and the system of waste collection, separation and disassembly requires infrastructural, institutional and behavioral adjustments. While recycling could enhance the security of the supply, the ecological and economic costs can be significant.
The growing application of critical metals in the modern hi-tech products also leads to a larger “resource base” of critical metals in the end-of-life products. In contrast to below-ground deposits, urban mines are growing reserves to be exploited, although the combination of different materials, miniaturization and the improvement of technologies in the production phase can lead to a decreasing “grade” within these reserves. Importantly, such resources can be more suitably likened to crop-growing resources that accumulate on land and come to maturity or fruition only at the end of life of the product.
In the case of deep ocean mining, the uncertainties of the operating environment translate into contention and widely varying opinions of the potential sustainability. From the perspective of mining, deep ocean deposits have a number of advantages: they are typically near the surface of the ocean floor requiring minimal overburden removal, explosives are not required, and they often contain high ore grades, including many critical minerals such as cobalt, zinc, copper, PGMs and REEs [67,68]. However, some of the deposits (particularly active hydrothermal vents) are considered to have highly unique, specialized ecosystems, and while it is likely that such sites will be preserved and “mined-around”, there is still some concern raised [69]. Moreover, the lack of oxygen and light and the high pressure of the deep ocean environment mean that much of the benthic fauna is largely immobile, which implies that rehabilitation can be complex and disturbance is likely to induce irreversible although localized change [70].
Early estimations indicate that the mining stage requires significantly more energy than average on-land deposits to extract (due to the pumping of materials from a depth and the requirement to keep the production vessel in a relatively fixed location); this would be at least twice the average energy, and certainly comparable to deep land-based mines [51]. Exacerbating the impact of this energy use is the fact that deep ocean mining operations utilize ship-board power, generated by the use of fuel oil or diesel. Technologies to offset this must be considered in order to improve the overall sustainability of such resources. The advantages of high grades and low wastes may help the lifecycle impacts in some cases [52].
Similar to deep ocean resources, the recycling of urban ores has the advantage of being mostly explosive-free and having minimal (if any) overburden. While not requiring significant vertical transportation of the ore, the distribution of ore across a wide landscape may be an important factor in determining the environmental implications of extraction. Table 14 shows some spatial densities for clean energy technology urban ores. It is apparent that residential or highly distributed use of these technologies will significantly diminish the density, but in this case the power plant scale will be examined in more detail.
Potential for the recycling of critical minerals is related to a variety of factors. Table 14 and Table 15 present some relevant data for consideration of the potential of recycling-based urban ores from clean energy technologies and unconventional deep ocean deposits. It is important to note that deep ocean deposits currently under consideration are typically much smaller than terrestrial deposits (e.g., Solwara I is 1 Mt deposit [71] compared with, as an example of a deep onshore mine, Kidd Creek, which is 19 Mt [72]), although they can, in some cases, be very high-grade. Energy system ores have three important characteristics in this sense:
  • Low deposit size (orders of magnitude);
  • Low deposit geographical density (material spread out across a wide area, particularly if residential usage is anticipated);
  • Variable deposit grades (not always higher than conventional resources).
The first two of these characteristics are important for the economic feasibility of mining/recovery of the materials at their end of life; these are also affected by the fact that failure of the system is unlikely to occur at the same time, thus implying an irregular period of “harvesting” of these ores. However, it is important to consider the third point a little further. As shown in Table 15, the grade of the critical materials is very high in the components of the technologies, but significantly lower considering the system as a whole. This is an important consideration for the design and end-of-life processing of such technologies. In some cases it is possible to disassemble the unit before recycling, particularly removing parts such as the magnets from generators in wind turbines, in which case the selective separation can enable higher-efficiency recycling and a high incoming grade. If it is infeasible to remove components, then there is often a significant grade degradation, e.g., if the glass is effectively separated from PV panels, then the grade rises by almost a factor of 30 for the thin-film components. This is an important consideration to be incorporated in the design for sustainability of such technologies.
As illustrated above, the value proposition for the mining industry is changing. Developing new mining projects is bringing a complex array of issues well beyond the traditional technical and financial challenges. The magnitude of these broader sustainability issues related to social/community and environmental impacts has been highlighted in recent studies. In addition, a recent annual mining survey [73] found 36% of the respondents indicated that public opposition to mining affected the permitting and/or approval process for any projects with which their company was directly involved. From a survey by Goldman Sachs of 190 delayed projects, sustainability issues (e.g., stakeholder-, community-, environment-related) were the number one cause (73%) of project delays, followed by commercial (63%), with technical causes (21%) a distant third. [74]. Finally, the most recent annual Ernest and Young report ”Business risks facing mining and metals” [75] has ”social license to operate” and ”resource nationalism” ranked at the third- and fourth-highest risk to the industry behind ”productivity improvement” and ”capital dilemmas”. The above recent analysis suggests that it may be becoming more attractive to source metals and minerals from non-traditional and unconventional resources under suitable economic conditions. Further enhancement in metal recycling as shown earlier is still limited by product design, urban waste collection systems, and feasible recycling technologies, while the development of new unconventional resources such as deep ocean deposits may raise significant environmental and social concerns.

5. Conclusions

This paper has highlighted that there are likely to be deficits of critical minerals under a variety of energy and materials development scenarios. While recycling can certainly add some proportion of the newly required material, it is clear that under the assumptions used here, the impact of new primary production rates is likely to be more important. This is particularly strongly affected by the rapid rate of growth in energy demand from non-OECD countries and the assumed lack of improvement in the rate of material use per energy unit. The scenarios were based (on the demand side) on recent historical trends in production and in the expansion of total energy and, specifically, clean energy technologies. On the supply side, mineral production rates were estimated using four basic methods for primary production, and then all of these were augmented with two recycling scenarios. This gave a wide range of production scenarios that was integrated with the demand to identify potential limitations in the future of clean energy.
All of the examined byproduct metals for photovoltaics, selenium, indium and tellurium, were found to be limiting to varying degrees, with tellurium being the metal of highest concern. Studies by others have identified potential for much higher production rates of tellurium by increasing recovery from copper anode slimes and through the acceptance of much higher estimates of economically extractable tellurium. Moreover, the parameters for the capacity factor and the use of a static (non-improving) material intensity for such technologies will affect the expected material requirement, making this study potentially conservative. With longer than presently expected lifetimes (40 years instead of 20 years) and high capacity factors (25%), it would be possible to provide even the highest energy requirement (30% scenarios) in the case of a 90% improvement in material intensity for selenium and indium, and a 99.7% improvement for tellurium.
With regards to PGM and yttrium for fuel cells, only one scenario found yttrium to be a potential bottleneck material. In the case of neodymium and dysprosium, these were found to delay the roll-out of wind power, but the supply eventually catches up to initial anticipated demand.
These scenarios have many areas in need of further improvement, particularly understanding the mixed portfolio of technologies and the effect of price as a limiting factor. The importance of social and environmental factors affecting the available supply needed to deliver a clean energy transition in response to climate change needs much greater attention, such as is being proposed by the Resourcing Future Generations initiative of the International Union of Geological Sciences. Further research aims to also examine the extent to which the utilization of deep ocean reserves could provide more material for such technologies, and the environmental impact associated with this.

Acknowledgments

The lead author’s contribution to this work is part of an ongoing research project funded by the Japan Society for the Promotion of Sciences, Grant in Aid No. 26701014.

Author Contributions

The lead author undertook the structuring, much of the background research and integration of text. G.C. and D.G. provided useful text contributions as well as commentary on the main documentation. A.G., E.Y. and T.T. have provided comment and feedback through ongoing discussions during the research and the final paper.

Conflicts of Interest

The authors declare no conflict of interest.

Appendix

Figure A1. Complete material supply scenarios for the materials of interest (except tellurium).
Resources 05 00019 g017aResources 05 00019 g017b
Figure A2. Complete material supply scenarios for tellurium.
Resources 05 00019 g018
Figure A3. Complete material demand scenarios (30% upper limit of energy consumption) for the materials of interest.
Resources 05 00019 g019
Figure A4. Complete thin-film solar cell electricity generation and demand under alternative scenarios for critical minerals.
Resources 05 00019 g020
Figure A5. Complete wind electricity generation and demand under alternative scenarios for critical minerals.
Resources 05 00019 g021
Figure A6. Complete fuel cell scenarios for yttrium and platinum.
Resources 05 00019 g022

References

  1. Giurco, D.; McLellan, B.; Franks, D.M.; Nansai, K.; Prior, T. Responsible mineral and energy futures: Views at the nexus. J. Clean. Product. 2014, 84, 322–338. [Google Scholar] [CrossRef] [Green Version]
  2. IEA. Energy Balances of Non-Oecd Countries; International Energy Agency: Paris, France, 2013. [Google Scholar]
  3. IEA. Energy Balances of Oecd Countries; International Energy Agency: Paris, France, 2013. [Google Scholar]
  4. DECC. Energy Consumption in the UK (2015): Domestic Energy Consumption in the UK between 1970 and 2014. Available online: https://www.gov.uk/government/uploads/system/uploads/attachment_data/file/449134/ECUK_Chapter_3_-_Domestic_factsheet.pdf (accessed on 6 May 2016).
  5. Cordell, D.; White, S. Peak phosphorus: Clarifying the key issues of a vigorous debate about long-term phosphorus security. Sustainability 2011, 3, 2027–2049. [Google Scholar] [CrossRef]
  6. May, D.; Prior, T.; Cordell, D.; Giurco, D. Peak minerals: Theoretical foundations and practical application. Nat. Resour. Res. 2012, 21, 43–60. [Google Scholar] [CrossRef]
  7. USGS. Mineral Commodity Summaries 2013; United States Geological Survey: Washington, DC, USA, January 2013.
  8. BP. Bp Statistical Review of World Energy 2013. Available online: http://www.bp.com/statisticalreview (accessed on 24 September 2014).
  9. McLellan, B.C.; Corder, G.D.; Giurco, D.P.; Ishihara, K.N. Renewable energy in the minerals industry: A review of global potential. J. Clean. Product. 2012, 32, 32–44. [Google Scholar] [CrossRef]
  10. Humphreys, D. New mercantilism: A perspective on how politics is shaping world metal supply. Resour. Policy 2013, 38, 341–349. [Google Scholar] [CrossRef]
  11. de Medeiros Costa, H.K.; dos Santos, E.M. Institutional analysis and the “resource curse” in developing countries. Energy Policy 2013, 63, 788–795. [Google Scholar] [CrossRef]
  12. McLellan, B.C.; Corder, G.D. Risk reduction through early assessment and integration of sustainability in design in the minerals industry. J. Clean. Product. 2013, 53, 37–46. [Google Scholar] [CrossRef] [Green Version]
  13. Norgate, T.; Jahanshahi, S. Reducing the greenhouse gas footprint of primary metal production: Where should the focus be? Miner. Eng. 2011, 24, 1563–1570. [Google Scholar] [CrossRef]
  14. McLellan, B.C.; Corder, G.D.; Ali, S.H.; Golev, A. Rare metals, unconventional resources and sustainability. In Geoscience for the Public Good and Global Development: Toward a Sustainable Future; Wessel, G., Ed.; The Geological Society of America: Boulder, CO, USA, 2016. [Google Scholar]
  15. McLellan, B.; Corder, G.; Ali, S. Sustainability of rare earths—An overview of the state of knowledge. Minerals 2013, 3, 304–317. [Google Scholar] [CrossRef]
  16. American Physical Society; The Materials Research Society. Energy Critical Elements: Securing Materials for Emerging Technologies; APS Panel on Public Affairs & the Materials Research Society: Warrendale, PA, USA, 2011. [Google Scholar]
  17. Bauer, D.; Diamond, D.; Li, J.; Sandalow, D.; Telleen, P.; Wanner, B. Critical Materials Strategy; US Department of Energy: Washington, DC, USA, 2010.
  18. European Commission. Critical Raw Materials for the EU; European Commission: Brussels, Belgium, 30 July 2010. [Google Scholar]
  19. National Research Council. Minerals, Critical Minerals, and the US Economy; National Academies Press: Washington, DC, USA, 2008. [Google Scholar]
  20. Skirrow, R.; Huston, D.; Mernagh, T.; Thorne, J.; Dulfer, H.; Senior, A. Critical Commodities for a High-Tech World: Australi’s Potential to Supply Global Demand; Geoscience Australia: Canberra, Australia, 2013.
  21. BGS. World Mineral Production 2010–2014; British Geological Survey: Keyworth, Nottingham, UK, January 2015.
  22. Kim, J.; Guillaume, B.; Chung, J.; Hwang, Y. Critical and precious materials consumption and requirement in wind energy system in the EU 27. Appl. Energy 2015, 139, 327–334. [Google Scholar] [CrossRef]
  23. Nansai, K.; Nakajima, K.; Kagawa, S.; Kondo, Y.; Suh, S.; Shigetomi, Y.; Oshita, Y. Global flows of critical metals necessary for low-carbon technologies: The case of neodymium, cobalt, and platinum. Environ. Sci. Technol. 2014, 48, 1391–1400. [Google Scholar] [CrossRef] [PubMed]
  24. Hoenderdaal, S.; Tercero Espinoza, L.; Marscheider-Weidemann, F.; Graus, W. Can a dysprosium shortage threaten green energy technologies? Energy 2013, 49, 344–355. [Google Scholar] [CrossRef]
  25. Roelich, K.; Dawson, D.A.; Purnell, P.; Knoeri, C.; Revell, R.; Busch, J.; Steinberger, J.K. Assessing the dynamic material criticality of infrastructure transitions: A case of low carbon electricity. Appl. Energy 2014, 123, 378–386. [Google Scholar] [CrossRef]
  26. Glaister, B.J.; Mudd, G.M. The environmental costs of platinum-pgm mining and sustainability: Is the glass half-full or half-empty? Miner. Eng. 2010, 23, 438–450. [Google Scholar] [CrossRef]
  27. Alonso, E.; Field, F.R.; Kirchain, R.E. Platinum availability for future automotive technologies. Environ. Sci. Technol. 2012, 46, 12986–12993. [Google Scholar] [CrossRef] [PubMed]
  28. Borgwardt, R.H. Platinum, fuel cells, and future US road transport. Transp. Res. Part D Transp. Environ. 2001, 6, 199–207. [Google Scholar] [CrossRef]
  29. Kromer, M.A.; Joseck, F.; Rhodes, T.; Guernsey, M.; Marcinkoski, J. Evaluation of a platinum leasing program for fuel cell vehicles. Int. J. Hydrog. Energy 2009, 34, 8276–8288. [Google Scholar] [CrossRef]
  30. Spiegel, R.J. Platinum and fuel cells. Transp. Res. Part D Transp. Environ. 2004, 9, 357–371. [Google Scholar] [CrossRef]
  31. Yang, C.-J. An impending platinum crisis and its implications for the future of the automobile. Energy Policy 2009, 37, 1805–1808. [Google Scholar] [CrossRef]
  32. Goe, M.; Gaustad, G. Identifying critical materials for photovoltaics in the US: A multi-metric approach. Appl. Energy 2014, 123, 387–396. [Google Scholar] [CrossRef]
  33. Weiser, A.; Lang, D.J.; Schomerus, T.; Stamp, A. Understanding the modes of use and availability of critical metals—An expert-based scenario analysis for the case of indium. J. Clean. Product. 2015, 94, 376–393. [Google Scholar] [CrossRef]
  34. Woodhouse, M.; Goodrich, A.; Margolis, R.; James, T.L.; Lokanc, M.; Eggert, R. Supply-chain dynamics of tellurium, indium, and gallium within the context of PV manufacturing costs. IEEE J. Photovolt. 2013, 3, 833–837. [Google Scholar] [CrossRef]
  35. Andersson, B.A. Materials availability for large-scale thin-film photovoltaics. Prog. Photovolt. Res. Appl. 2000, 8, 61–76. [Google Scholar] [CrossRef]
  36. Andersson, B.A.; Azar, C.; Holmberg, J.; Karlsson, S. Material constraints for thin-film solar cells. Energy 1998, 23, 407–411. [Google Scholar] [CrossRef]
  37. Candelise, C.; Speirs, J.F.; Gross, R.J.K. Materials availability for thin film (tf) PV technologies development: A real concern? Renew. Sustain. Energy Rev. 2011, 15, 4972–4981. [Google Scholar] [CrossRef]
  38. Fthenakis, V. Sustainability metrics for extending thin-film photovoltaics to terawatt levels. MRS Bull. 2012, 37, 425–430. [Google Scholar] [CrossRef]
  39. Mohr, S.H.; Mudd, G.; Giurco, D. Lithium resources and production: Critical assessment and global projections. Minerals 2012, 2, 65–84. [Google Scholar] [CrossRef]
  40. Grosjean, C.; Miranda, P.H.; Perrin, M.; Poggi, P. Assessment of world lithium resources and consequences of their geographic distribution on the expected development of the electric vehicle industry. Renew. Sustain. Energy Rev. 2012, 16, 1735–1744. [Google Scholar] [CrossRef]
  41. Kushnir, D.; Sandén, B.A. The time dimension and lithium resource constraints for electric vehicles. Resour. Policy 2012, 37, 93–103. [Google Scholar] [CrossRef]
  42. Prior, T.; Wäger, P.A.; Stamp, A.; Widmer, R.; Giurco, D. Sustainable governance of scarce metals: The case of lithium. Sci. Total Environ. 2013, 461–462, 785–791. [Google Scholar] [CrossRef] [PubMed]
  43. Speirs, J.; Contestabile, M.; Houari, Y.; Gross, R. The future of lithium availability for electric vehicle batteries. Renew. Sustain. Energy Rev. 2014, 35, 183–193. [Google Scholar] [CrossRef]
  44. Nassar, N.T.; Du, X.; Graedel, T.E. Criticality of the rare earth elements. J. Ind. Ecology 2015, 19, 1044–1054. [Google Scholar] [CrossRef]
  45. Moss, R.L.; Tzimas, E.; Kara, H.; Willis, P.; Kooroshy, J. The potential risks from metals bottlenecks to the deployment of strategic energy technologies. Energy Policy 2013, 55, 556–564. [Google Scholar] [CrossRef]
  46. Graedel, T. On the future availability of the energy metals. Annu. Rev. Mater. Res. 2011, 41, 323–335. [Google Scholar] [CrossRef]
  47. USGS. Metal prices in the united states through 2010: U.S. In Geological Survey Scientific Investigations Report 2012–5188; United States Geological Survey: Reston, VA, USA, 2013; p. 204. [Google Scholar]
  48. USGS. Mineral Commodity Summaries 2015; United States Geological Survey: Washington, DC, USA, February 2015.
  49. Hein, J.R.; Mizell, K.; Koschinsky, A.; Conrad, T.A. Deep-ocean mineral deposits as a source of critical metals for high- and green-technology applications: Comparison with land-based resources. Ore Geol. Rev. 2013, 51, 1–14. [Google Scholar] [CrossRef]
  50. Bradshaw, A.M.; Hamacher, T. Nonregenerative natural resources in a sustainable system of energy supply. ChemSusChem 2012, 5, 550–562. [Google Scholar] [CrossRef] [PubMed]
  51. McLellan, B.C. Sustainability of deep ocean resources. In Proceedings of the 5th International Conference on a Sustainable Future for Human Security, Bali, Indonesia, 19–20 November 2014.
  52. McLellan, B.C.; Motoori, R.; Tezuka, T. Comparison of lifecycle impacts of seafloor mining with onshore equivalents. In Proceedings on the ISOPE 2015, Kailua, HI, USA, 21–26 June 2015; Chung, J.S., Ed.; International Society of Ocean and Polar Engineers: Kona, HI, USA, 2015. [Google Scholar]
  53. Mason, C.; Paxton, G.; Parr, J.; Boughen, N. Charting the territory: Exploring stakeholder reactions to the prospect of seafloor exploration and mining in Australia. Mar. Policy 2010, 34, 1374–1380. [Google Scholar] [CrossRef]
  54. EEA. Aluminium Recycling in Europe: The Road to High Quality Products; European Aluminium Association: Brussels, Belgium, 2006; p. 52. [Google Scholar]
  55. Giurco, D.P.; McLellan, B.C.; Kishita, Y.; Corder, G.D.; Florin, N.; Sharpe, S. Mineral-water-energy nexus: Implications of localized production and consumption for industrial ecology. In Proceedings of the International Sustainable Development Research Society (ISDRS) 21st Annual Conference-The Tipping Point: Vulnerability and Adaptive Capacity, Geelong, Australia, 10–12 July 2015; Brau, Y.N.a.L., Ed.; ISDRS: Geelong, Australia, 2015. [Google Scholar]
  56. McLellan, B.C. Sustainability and design considerations for critical minerals in clean energy technologies. In Proceedings of the 13th Japan/Korea International Symposium on Resources Recycling and Materials Science, Kyoto, Japan, 13–15 May 2015; Shibata, J., Ahn, J.-W., Eds.; The Resource Processing Society of Japan and Korea Institute of Geoscience and Mineral Resources: Kyoto, Japan, 2015. [Google Scholar]
  57. Graedel, T.; Allwood, J.; Birat, J.-P.; Buchert, M.; Hagelüken, C.; Reck, B.K.; Sibley, S.F.; Sonnemann, G. Recycling Rates of Metals: A Status Report; United Nations Environment Programme: Nairobi, Kenya, 2011. [Google Scholar]
  58. Houari, Y.; Speirs, J.; Candelise, C.; Gross, R. A system dynamics model of tellurium availability for CdTe PV. Prog. Photovolt. Res. Appl. 2014, 22, 129–146. [Google Scholar] [CrossRef]
  59. Bustamante, M.L.; Gaustad, G. Challenges in assessment of clean energy supply-chains based on byproduct minerals: A case study of tellurium use in thin film photovoltaics. Appl. Energy 2014, 123, 397–414. [Google Scholar] [CrossRef]
  60. Habib, K.; Wenzel, H. Reviewing resource criticality assessment from a dynamic and technology specific perspective—Using the case of direct-drive wind turbines. J. Clean. Product. 2016, 112, 3852–3863. [Google Scholar] [CrossRef]
  61. Marwede, M.; Reller, A. Future recycling flows of tellurium from cadmium telluride photovoltaic waste. Resour. Conserv. Recycl. 2012, 69, 35–49. [Google Scholar] [CrossRef]
  62. Feltrin, A.; Freundlich, A. Material considerations for terawatt level deployment of photovoltaics. Renew. Energy 2008, 33, 180–185. [Google Scholar] [CrossRef]
  63. Alonso, E.; Sherman, A.M.; Wallington, T.J.; Everson, M.P.; Field, F.R.; Roth, R.; Kirchain, R.E. Evaluating rare earth element availability: A case with revolutionary demand from clean technologies. Environ. Sci. Technol. 2012, 46, 3406–3414. [Google Scholar] [CrossRef] [PubMed]
  64. EPA. Rare Earth Elements: A Review of Production, Processing, Recycling, and Associated Environmental Issues; US Environmental Protection Agency: Cincinnati, OH, USA, 2012.
  65. Gupta, C.K.; Krishnamurthy, N. Extractive Metallurgy of Rare Earths; CRC Press: Boca Raton, FL, USA, 2005. [Google Scholar]
  66. Tharumarajah, R.; Koltun, P. Cradle to gate assessment of environmental impact of rare earth metals. In Proceedings of the ALCAS Conference, Melbourne, Australia, 9–10 March 2011; Australian Life Cycle Assessment Society: Melbourne, Australia, 2011. [Google Scholar]
  67. Siddiquie, H.N.; Gujar, A.R.; Hashimi, N.H.; Valsangkar, A.B. Superficial mineral resources of the Indian Ocean. Deep Sea Res. Part A Oceanogr. Res. Pap. 1984, 31, 763–812. [Google Scholar] [CrossRef]
  68. Kato, Y.; Fujinaga, K.; Nakamura, K.; Takaya, Y.; Kitamura, K.; Ohta, J.; Toda, R.; Nakashima, T.; Iwamori, H. Deep-sea mud in the Pacific Ocean as a potential resource for rare-earth elements. Nat. Geosci. 2011, 4, 535–539. [Google Scholar] [CrossRef]
  69. Ellis, D.V.; Macdonald, V.I. Rapid preliminary assessment of seabed biodiversity for the marine and coastal mining industries. Mar. Georesour. Geotechnol. 1998, 16, 307–319. [Google Scholar] [CrossRef]
  70. Sharma, R.; Nagendernath, B.; Valsangkar, A.B.; Parthiban, G.; Sivakolundu, K.M.; Walker, G. Benthic disturbance and impact experiments in the central Indian Ocean basin. Mar. Georesour. Geotechnol. 2000, 18, 209–221. [Google Scholar] [CrossRef]
  71. Nautilus Minerals. Nautilus minerals Inc.-Solwara I Project. Available online: http://www.nautilusminerals.com/s/Projects-Solwara.asp (accessed on 8 April 2015).
  72. Xstrata Copper Canada. Xstrata Copper Canada Sustainability Report 2012; Available through the Global Reporting Initiative Disclosure Database; Xstrata Copper Canada: Toronto, ON, Canada, 2013. [Google Scholar]
  73. Fraser Institute. Survey of Mining Companies 2013; The Fraser Institute: Vancouver, BC, Canada, 13 January 2015. [Google Scholar]
  74. Xstrata. The Changing Face of Supply, Presentation to Bank of America Merrill Lynch 2012 Global Metals, Mining and Steel Conference. Available online: http://www.glencorexstrata.com/assets/Uploads/x-speech-201205151.en.pdf (accessed on 6 May 2016).
  75. Ernst and Young. Business Risks Facing Mining and Metals 2014–2015; Ernst & Young: London, UK, 2014. [Google Scholar]
Figure 1. (a) World final energy consumption (1971–2012); (b) World population (1971–2012); (c) World GDP in 2005 USD (1971–2012). (Data source: International Energy Agency [2]).
Resources 05 00019 g001
Figure 2. (a) Non-OECD Total Primary Energy Supply (1971–2012); (b) OECD Total Primary Energy Supply (1971–2012). (Data source: International Energy Agency [2]).
Resources 05 00019 g002
Figure 3. World minerals production estimates. (Data sources: USGS [7], BP [8]).
Resources 05 00019 g003
Figure 4. Energy usage in world minerals production by subsector.
Resources 05 00019 g004
Figure 5. Renewable energy usage in world minerals production by subsector. (Includes direct usage and electricity).
Resources 05 00019 g005
Figure 6. Energy consumption of global minerals production by development status. (a) Iron and steel subsector; (b) Non-ferrous metals subsector; (c) Non-metallic minerals subsector; (d) Mining and quarrying subsector. (Data source: IEA [2]).
Resources 05 00019 g006
Figure 7. Production (ac) and prices in 2012 US dollars (df) of selected critical minerals (1970–2012) (Data: various [47,48]).
Resources 05 00019 g007
Figure 8. Energy requirement in the three alternative scenarios (Units: EJ).
Resources 05 00019 g008
Figure 9. Scenarios for renewable energy (Units: EJ).
Resources 05 00019 g009
Figure 10. Material supply scenarios for selected materials of interest: Left column, without recycling; right column, with a recycling rate improved to 90% by 2050.
Resources 05 00019 g010
Figure 11. Material demand scenarios (30% upper limit of energy consumption) for selected scenarios and materials of interest.
Resources 05 00019 g011
Figure 12. Thin-film solar cell electricity generation and demand under alternative scenarios for critical minerals.
Resources 05 00019 g012
Figure 13. Wind electricity generation and demand under alternative scenarios for critical minerals.
Resources 05 00019 g013
Figure 14. Fuel cell scenarios for (a) platinum group metals (PGM) and (b) yttrium (Y).
Resources 05 00019 g014
Figure 15. Installed capacity in 2050 based on sensitivity analysis applied to scenario 1 (10% limit) for capacity factor and material intensity changes.
Resources 05 00019 g015
Figure 16. Impact of lifetime on the potential final installed capacity for each technology (base case capacity factors and intensities).
Resources 05 00019 g016
Table 1. Total primary energy supply change of energy mix.
TPESNon-OECDOECD
1971201219712012
Coal and coal products31%37%24%19%
Oil, natural gas liquids and oil products28%25%51%36%
Natural gas12%19%19%26%
Renewables28%17%5%9%
Nuclear0%2%1%10%
Table 2. Change in renewable energy mix.
Renewable Energy SupplyAnnualized Growth Rate (% Year on Year)Mix of Renewables (%)
OECDNon-OECD
OECDNon-OECD1971201219712012
Hydropower1.1%4.9%46%25%5%15%
Geothermal5.1%8.1%3%7%0%3%
Solar/wind/other18.6%53.4%0%10%0%2%
Biofuels and waste3.0%1.7%51%58%95%81%
Note: Solar/wind/other and geothermal were only reported in the non-OECD after 1981, rates of growth are considered from 1981 to 2012 in these cases.
Table 3. Growth in energy usage by minerals industry subsector and development status (1971–2012).
Sub-SectorGrowth (%)
OECDNon-OECD
Iron and steel−35%572%
Non-ferrous metals45%263%
Non-metallic minerals23%453%
Mining and quarrying253%1123%
Table 4. Relevant data on selected critical minerals (Data: [7,21]).
MineralGlobal Mine Production (P) 1 2012 (t)Single Largest SupplierGlobal Reserves (R)R/P (Years) 2
Total (t)Largest% of Total
Cobalt102,00049%Congo7,200,000Congo47%65
Copper16,900,00032%Chile690,000,000Chile28%43
Gallium 347474%China
Indium 478352%China
Lithium 5652,00070%Australia13,000,000Chile57%21
Manganese15,500,00023%South Africa570,000,000South Africa26%36
Nickel2,361,00030%Indonesia74,000,000Australia24%38
PGMs66,000South Africa95%136
Platinum18171%South Africa
Palladium21641%Russia
Other PGMS6677%South Africa
Rare Earths 6114,00088%China140,000,000China39%1273
Selenium 4263029%Japan120,000China22%53
Tellurium 414834%USA24,000Peru15%289
Zinc13,300,00037%China250,000,000Australia26%20
Notes: 1 Mine production refers to metric tons of contained metal content unless otherwise specified; Data is sourced from the USGS, cross-checked with the BGS, with data discrepancies addressed individually; 2 R/P is the reserves: Production ratio in years; 3 Gallium expressed as capacity for production as it is a by-product mineral; 4 Selenium, tellurium, indium figures are the refinery production rate; 5 Li tonnage of ores and brines, USA production for 2013 included; 6 Rare Earths are expressed as Rare Earth Oxides (REO).
Table 5. Materials supply and recycling scenarios.
ScenarioCharacteristics
AConstant 2012 production
BLinear trend growth extrapolated from 2002 to 2012 onwards
CYear-on-year trend growth extrapolated from 2002 to 2012 onwards
DHubbert peak curve estimate
Two Recycling Scenarios Applied to A–D
ECurrent recycling rate (20 years lifetime/lag for materials to be recycled)
FImprovement in recycling rate growing to 90% by 2050 (20 years lifetime/lag)
Table 6. Key parameters for the materials supply scenarios.
ScenarioParametersMaterial
TelluriumSeleniumIndiumCopperPGMREO
AProduction rate (tpa)148263078316,900,000463114,000
BGrowth rate (tpa)−0.27034291,00051410
CGrowth rate (% year on year)2.84.57.01.91.41.8
DPeak year197520202020202020452105
URR 1 (kt)31211351,300,00081143,000
ECurrent recycling rate (%)15143601
Service lifetime (years)202020202020
FImprovement rate of recycling rate (%/year)2.22.12.21.20.82.2
Note: 1 URR–Ultimately recoverable resources, here assumed to be reserves plus cumulative production.
Table 7. Change in annual production of each mineral across the period.
MineralIncrease of Annual Production (%) from 2012 to 2050 in Each Scenario
AAEAFBBEBFCCECFDDEDF
Selenium0%5%92%122%130%267%449%461%654%−31%−26%63%
Tellurium0%1%88%−5%−4%81%181%182%325%−45%−45%23%
Indium0%1%104%190%192%375%1408%1412%1761%−97%−96%0%
PGM0%58%87%41%111%146%66%141%178%73%167%214%
Copper0%45%94%69%128%192%113%177%247%−46%−1%47%
REO0%1%79%42%44%139%82%83%190%335%337%535%
Table 8. Cumulative production (2031–2050) in each supply scenario and change with recycling.
MineralCumulative Production (t)Additional with Recycling (%)Cumulative Production (t)Additional with Recycling (%)Cumulative Production (t)Additional with Recycling (%)Cumulative Production (t)Additional with Recycling (%)
AAEAFBBEBFCCECFDDEDF
Selenium45,0005%45%85,0003%35%163,0002%25%39,0006%49%
Tellurium30001%41%30001%42%70001%30%20001%48%
Indium16,0001%41%35,0001%31%117,0000%17%70003%57%
PGM900060%68%12,00050%60%13,00046%56%16,00048%54%
Copper338,000,00043%58%503,818,00033%49%588,588,00029%45%261,419,00058%66%
REO2,200,0001%45%3,003,0001%40%3,634,0001%37%8,033,0001%28%
Table 9. Comparison of the reserves and resources estimates from the current study with previous studies.
MaterialReserves/ResourcesCurrent Study (URR)
CopperURR 3100 Mt (Hoauri, 2014)1300 Mt
Reserves 690 Mt (Hein, 2013)
Resources > 1000 Mt (Hein, 2013)
Major Deep Ocean Areas 233 Mt (Hein, 2013)
IndiumReserves 2.6 kt (Andersson, 2000)35 kt
Total in deposits 310 kt (Andersson, 2000)
PGMReserves 70 kt (Hein, 2013)81 kt
Resources 80 kt (Hein, 2013)
Major Deep Ocean Areas 7 kt (Hein 2013)
Resources 100 kt (Alonso, 2012)
REOReserves 110 Mt (Hein, 2013)143 Mt
Resources 150 Mt (Hein, 2013)
Major Deep Ocean Areas 31 Mt (Hein, 2013)
Reserves 114 Mt (Hoenderdaal, 2013)
Nd/DyReserves Dy 1.3 Mt (Hoenderdaal, 2013)URR and production 20% of REO (~28.6 Mt)
YttriumReserves 500 kt (Hein, 2013)URR and production 10% of REO (~14.3 Mt)
Resources 500 kt (Hein, 2013)
Major Deep Ocean Areas 3700 kt (Hein 2013)
Selenium211 kt
Tellurium24 kt (USGS, 2015)31 kt
URR from copper reserves (Hoauri, 2014)
Reserves 20 kt (Hein, 2013)
Resources 50 kt (Hein, 2013)
Major Deep Ocean Areas 530 kt (Hein, 2013)
Reserves 20 kt (Andersson, 2000)
Reserves as co-product 80 kt (Andersson, 2000)
Total in deposits 1400 kt (Andersson, 2000)
Table 10. Material intensity comparison: current study and previous studies.
MaterialDemandReferenceCurrent Study
Copper27.8 g/m2 (BOP *)[32]40 g/m2 (PV); 250 kg/MW (PV); 4000 kg/MW (wind in onshore windfarms)
0.7 g/m2 (CdTe)
2.2 g/m2 (CIGS)
2194 kg/MW (PV)[45]
1143 kg/MW (Wind)
Indium0.4 g/m2 (a-Si)[32]3.6 g/m2; 22.5 t/GW
7.7 g/m2 (CIGS)
2.9 g/m2 (CIGS)[35,36]
83 t/GW (2010)[38]
11–20 t/GW (2020)
4.5 t/GW[45]
23 t/GW[34]
PGM0.17–0.43 kg/MW[30]0.1–1 kg/MW
0.50 kg/MW[28]
0.1 kg/MW[27]
Nd/Dy10 Dy + 203.33 Nd (kg/MW)[60]150–200 kg/MW (total Dy/Nd); Dy:Nd ratio 2:29; (10–13 kg/MW Dy); (140–187 kg/MW Nd)
13.33 Dy + 200 Nd (kg/MW)
24 Dy + 180 Nd (kg/MW)[24]
2.8 Dy + 40.6 Nd (kg/MW)[45]
Yttrium20–200 kg/MW
Selenium2.7 g/m2 (CIGS)[32]7.2 g/m2; 45 t/GW
0.5 t/GW[45]
4.8 g/m2 (CIGS)[35,36]
Tellurium81.9–187.2 t/GW (2010)[61]15.6 g/m2; 97.5 t/GW
1.9–69.7 t/GW (2040)
(0.1–3 µm layers)
10.9 g/m2 (2–4 µm layers)[32]
106 t/GW (2010)[38]
38–74 t/GW (2020)
4.7 t/GW[45]
4.7 g/m2[36]
6.5 g/m2[35]
69 t/GW[34]
Note: * BOP = Balance of Plant.
Table 11. Base case scenarios: 2050 installed capacity limitation by technology and mineral.
TechnologyCapacity FactorInstalled Capacity (GW)Demand Scenarios (upper limit of total primary energy supply %)
1 (10%)1 (20%)1 (30%)2 (10%)2 (20%)2 (30%)3 (10%)3 (20%)3 (30%)
PV15%TeMax182182182182182182182182182
Min222222222222222222
SeMax814481448144814481448144814481448144
Min116911691169116911691169116911691169
InMax623762376237623762376237623762376237
Min315315315315315315315315315
CuMax24,72449,47274,22123,57647,17570,77539,60379,230118,858
Min24,72449,47274,22123,57647,17570,77539,60379,230118,858
Wind40%NdMax13,58514,68214,68212,72414,68214,68214,68214,68214,682
Min313731373137313731373137313731373137
DyMax13,58514,68214,68212,72414,68214,68214,68214,68214,682
Min313731373137313731373137313731373137
CuMax918318,46428,7708,75317,60327,47814,76330,59445,509
Min918316,71123,334875316,71122,04214,76325,21240,072
Fuel Cells80%PtMax190138025704233446677001533910,67716,016
Min190138025704233446677001533910,67716,016
YMax190138025704233446677001533910,67716,016
Min190138025704233446677001533910,67711,304
Table 12. Material intensities compared for sensitivity analysis.
MineralMaterial Intensity (t/GW Installed Capacity)
Base CaseAverageMinMax
Tellurium98672187
Selenium45230.545
Indium2326383
Neodymium20015841203
Dysprosium1312324
PGM0.10.440.11
Yttrium2011020200
Table 13. Capacity factors considered in the sensitivity analysis.
TechnologyCapacity Factor
Base CaseAlternative 1Alternative 2
PV15%20%30%
Wind40%30%50%
Fuel cells80%50%60%
Table 14. Estimated range of potential material density and “deposit” size.
TechnologyCritical MaterialsSpatial Mass Density of Contained Metals (t/km2)Size of Deposit (t)
Residential ScalePower Plant ScalePower Plant Scale
Wind turbinesDy, Nd0.246170
Cu1.8117 (onshore)3500
300 (offshore)9000
PhotovoltaicsIn, Ga, Se, Te2.383930
Cu0.3412140
Fuel cellsPt0.00120.2
Y0.1530940
Note: mass and size of deposit refer to tons of contained target metal.
Table 15. Example grades of conventional and unconventional deposits (various references).
Critical MaterialsGrade (wt%)
Energy System Urban OreDeep OceanTerrestrial Deposits
ComponentSystem
Dy, Nd30% (magnet); (28% Nd/2% Dy)0.03%>0.0023% Nd/>0.0004% Dy (Pacific muds)0.05% Nd/0.002% Dy ~0.8% Nd/0.05% Dy
Cu~100% (wire/windings)0.8% (Wind); 0.1% (PV)6.8% (Solwara I) 0.5% (Izena Cauldron)>0.5% (typical cut-off grade)
In, Ga, Se, Te0.5% (panel) 14.5% (panel without glass)0.3%In (<0.01%) in Zn ores Se (~8%) in Cu slimes Se (<0.00001%) in Cu ores Te (~1%) in Cu slimes

