Adsorptive Findings on Selected Biomasses for Removal of Phenol from Aqueous Solutions


Department of Chemical Engineering, Sant Longowal Institute of Engineering & Technology, Longowal, Sangrur 148106, India
Resources 2019, 8(4), 180; https://0-doi-org.brum.beds.ac.uk/10.3390/resources8040180
Submission received: 15 October 2019
/
Revised: 22 November 2019
/
Accepted: 25 November 2019
/
Published: 29 November 2019
(This article belongs to the Collection Management, Environment, Energy and Sustainability under a Circular Economy)
Abstract
:India produces an enormous number of biomasses in the form of agricultural and forestry residues. To handle their disposal, they need to be explored as adsorbents, as one of the alternatives for their utilizations. Biomasses, having a high content of carbon, can be used as low-cost adsorptive materials for the removal of phenol from aqueous streams. Ten biomasses, abundantly available in the Sangrur area of Punjab (India), were characterized. Based on their determined characteristics and availability, Acacia nilotica branches (ANB), Lantana camera (LC), and rice husk (RH) were selected for the study. As these biomasses removed low percentages of phenol, they were activated using thermochemical treatment. Their properties as adsorbents improved significantly. When they were subjected to phenol sequestration, the percentage removal of adsorbate was at 97%, 90%, and 83% by activated ANB (ANBC), activated LC (LCC), and activated RH (RHC), respectively. The equilibrium and kinetics of the process of adsorption on these activated biomasses were analyzed mathematically. It was possible to regenerate the spent ANBC, LCC, and RHC in a single step, with 1 M NaOH solution.
1. Introduction
India generates more than 565 million tons of agricultural and forestry residues annually [1,2]. It has been noticed that in the absence of any available robust technologies, farmers/owners of farms try to burn them as a solution to clearing the fields for the next crop. The burning of these solid wastes generates greenhouse gases. The technologies available may not be applicable for the utilization of biomasses from a location, because their properties vary with sites [3]. So, there is a great need to investigate various possible ways in which they may be utilized as valuable products. It has been reported that agricultural wastes and forestry residues suffer from two drawbacks: (i) They have a high moisture content and (ii) low bulk density [3]. As a result of these constraints, it is desired that they may be utilized at the site of their availability.
Investigators have reported the applications of biomasses as low-cost adsorbents for various pollutants, namely phenol, dyes, acids, and heavy metals in industrial effluents [4,5,6,7,8]. The present work focuses on the removal of phenol using biomasses in the forms of agricultural wastes and forestry residues as sources of adsorbents. Phenol is colorless and soluble in water and is characterized by its unique odor. If it comes into contact with the skin, it causes irritation and necrosis. If ingested, even a small amount damages kidneys, liver, and muscles [9]. Effluents with an appreciable amount of phenol, when discharged in water bodies, are highly toxic to all types of aquatic life. The significant sources of phenol in the aquatic environment are wastewaters from paint, pesticide, coal conversion, polymeric resin, petroleum, and petrochemicals industries [10]. Phenols are listed in the United States Environment Protection Agency (USEPA) and the European Union (EU) as pollutants of priority concern [11].
Many findings are reported related to the removal of phenol from aqueous solutions using agricultural wastes and forestry residues. Ahmaruzzaman and Sharma reported rice husk and rice-husk char as adsorbents with adsorption capacities of 4.7 and 7.9 mg/g [12]. Mohd Din et al. have reported the adsorption capacity of coconut shell as 205.8 mg/g. The adsorption isotherms fit Langmuir and Freundlich equations. The kinetics of adsorption is followed by the pseudo-second-order equation [13]. Stasinakis et al. studied olive pomace. Different forms of adsorbents have been obtained by physical and chemical treatment. The removal efficiency is also improved by decreasing the particle size [14]. Alhamed studied the use of date stones as carbonaceous adsorbent and its use for the removal of phenol from wastewaters. He used different particle sizes for packed bed studies and estimated the adsorption capacity of activated date stone as 90.4 mg/g [15]. Tseng and Tseng reported corn cob as an adsorbent for phenol removal. Activation of the residue was done using KOH [16]. Jadhav and Vanjara studied sawdust as a promising adsorbent [17]. Sarker and Fakhruddin studied rice straw. They treated the residue, with a particle size less than 1 mm, by physical and thermal methods, which could remove 84% of phenol from aqueous solutions [18].
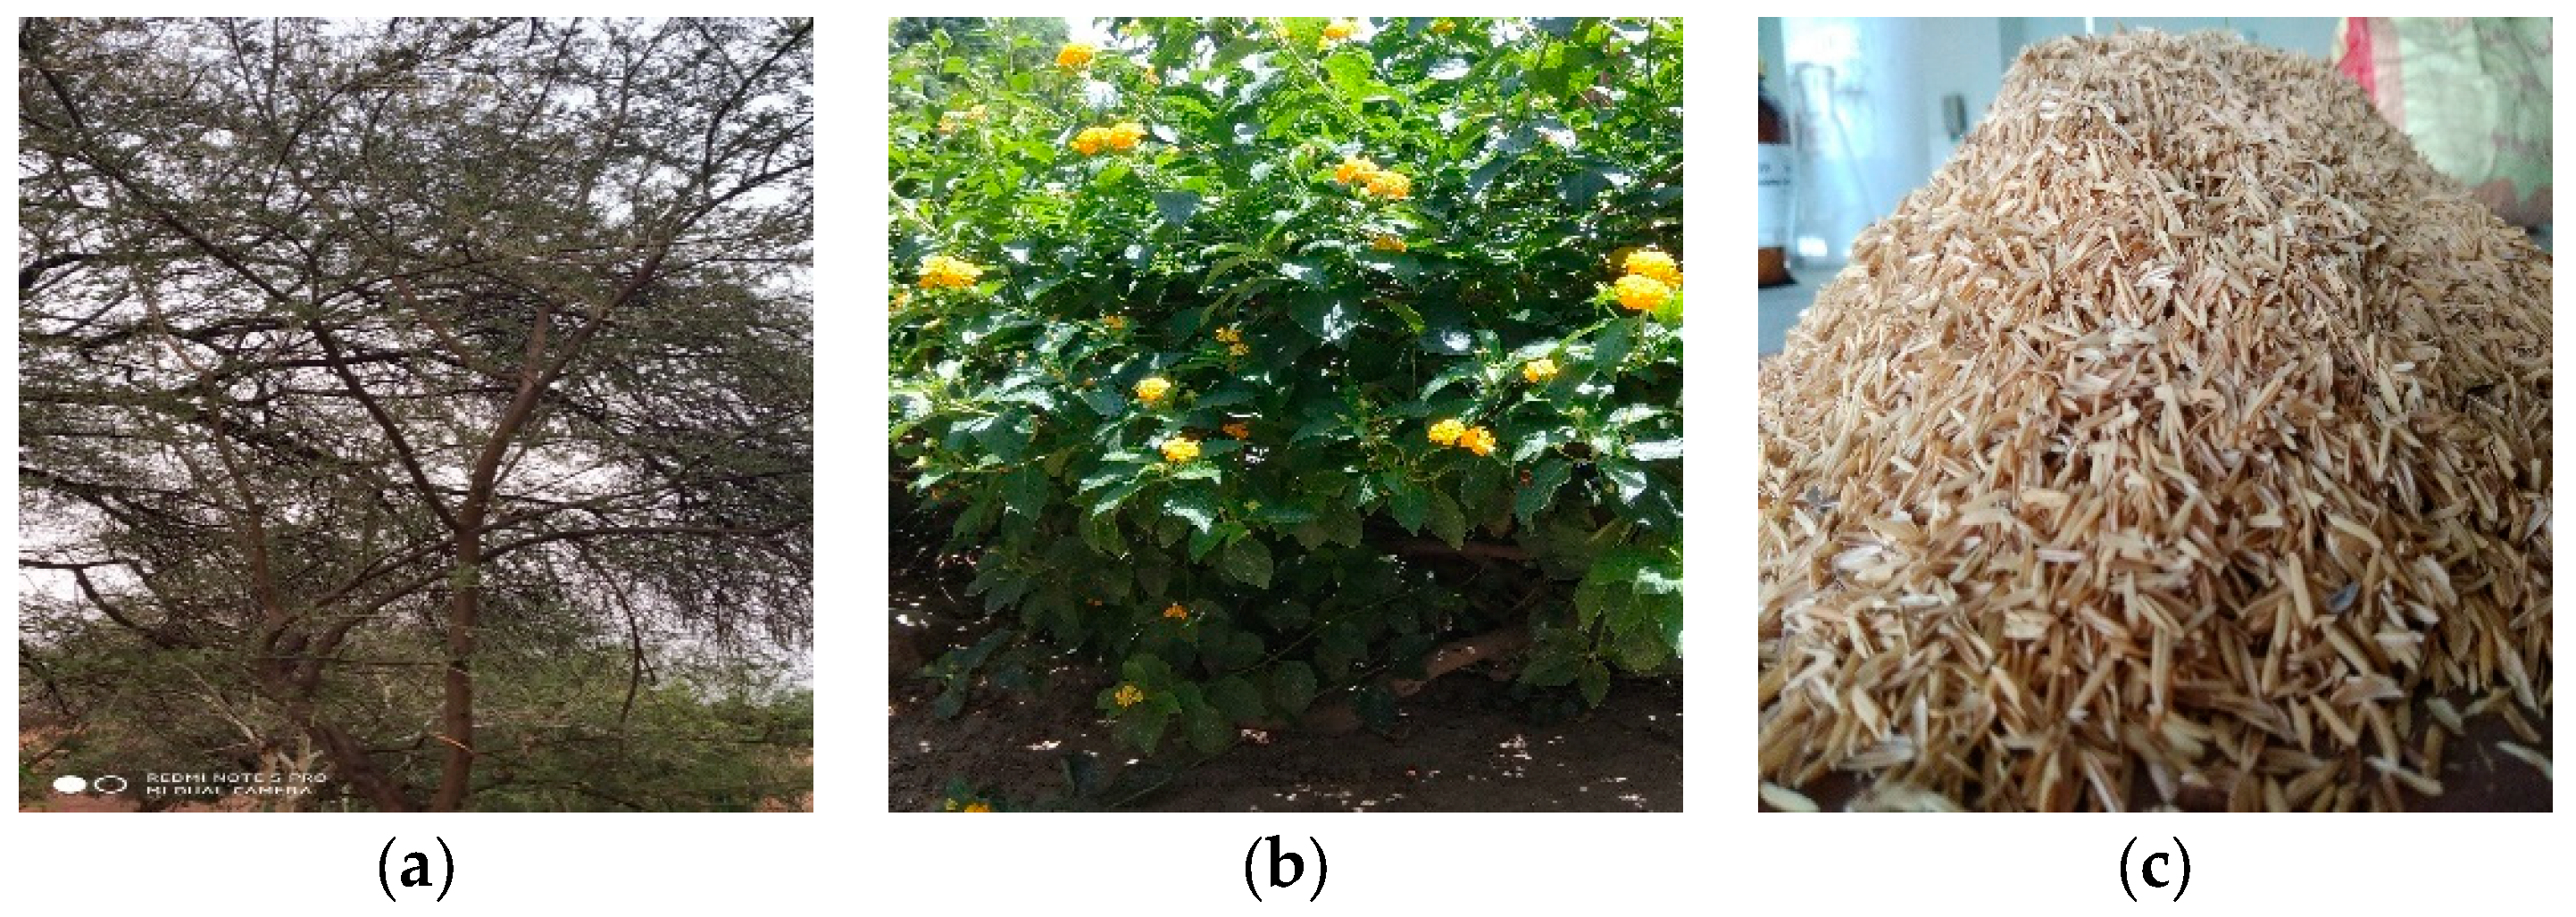
In this work, 10 biomasses, namely Acacia nilotica branches (ANB), bagasse, corn cob, cotton stalk, ground nutshell (GNS), Lantana camera (LC), rice husk (RH), rice straw, sawdust, and wheat straw, were dried and ground. They were characterized in terms of proximate analysis (ash, fixed carbon (FC), and volatile matter (VM)) and bulk density as per ASTM standards. Based on the characterization and availability of biomasses, ANB, LC, and RH were selected for further studies as adsorbents for the removal of phenol from aqueous streams. Figure 1 indicates the pictures of the selected biomasses.
The percentage removals of phenol from 1 g/L of aqueous solution on ANB, LC, and RH were very low. The maximum removal of 35% was observed with the adsorbent ANB. The characterization results of these adsorbents showed lower Brunauer Emmett Teller (BET) surface areas and FCs and higher VM contents compared to that of commercial-grade carbons used for phenol adsorption. The total surface area of any commercial-grade carbon ranges from 450 to 1500 m2/g. The actual surface area available for adsorption is dependent on the nature of the adsorbate, which could be considerably less than the total [19].
The methods available for activation are physical methods [20], steam activation [21], carbon dioxide activation [22], air activation [23], and chemical activation [24,25]. There are reports of thermo-chemical treatment (a combination of physical and chemical methods) of biomasses to make the activated carbon comparable to that of commercial-grade carbon for appreciable removal of phenol from aqueous solutions [26,27]. Therefore, the selected biomasses were treated thermo-chemically for the desired changes in their characteristics. The treatment reduced VM and ash, thereby increasing the FC percentages. These procedures also helped to increase the BET surface areas and methylene blue adsorption values of the resulting adsorbents. The thermo-chemical treated forms of ANB, LC, and RH were activated ANB (ANBC), activated LC (LCC), and activated RH (RHC), respectively.
To optimize the operating parameters to generate adsorption isotherms for ANBC, LCC, and RHC, the effects of dosage, pH, time of contact, initial phenol concentration, and agitation speed were studied, individually on these adsorbents. At the optimized conditions, the generated adsorption curves were fit into Langmuir, Freundlich, and Temkin isotherms. Based on the percentage removal of phenol with time, the kinetic analysis was done using pseudo-first-order and pseudo-second-order kinetics. It was possible to recover a high percentage of phenol in a single-step regeneration of these adsorbents.
This paper explains the conversion of ordinary biomasses, ANB, LC, and RH, to its activated forms as ANBC, LCC, and RHC, respectively. They were comparable to commercial-grade carbons in terms of their properties for the removal of phenol from aqueous streams. It was possible to study the adsorption of phenol in the entire supernatant concentration range of 100 to 975 mg/L at equilibrium, using all three activated biomasses.
2. Materials and Methods
2.1. Analysis of Biomass
2.1.1. Bulk Density
The bulk densities of 10 biomasses, including ANB, LC, and RH, were determined by standard procedures for the storage and preparation of raw materials [19].
2.1.2. Proximate Analysis
The analysis determined the contents of moisture, VM, FC, and ash of 10 biomasses as per ASTM standards: D3173-75.
2.2. Preparation of Adsorbents
2.2.1. Preparation of Powdered Adsorbent from Raw Biomasses
Washed and dried samples of ANB, LC, and RH were taken separately and ground in the powder form. They were passed through a 300-microns screen. The samples were stored for study of their physical characteristics, adsorption (equilibrium and kinetic) peculiarities, and regeneration (desorption) studies.
2.2.2. Preparation of Activated Adsorbent Using Raw Biomasses
The powder forms of ANB, LC, and RH were subjected to activation. The sample of each of the biomasses was soaked in 30% H3PO4 for 3 h and stirred at a temperature of 37 °C. The resultant slurry was filtered and washed thoroughly until a neutral pH of 7 was obtained. The residue collected was oven-dried and kept for charring at 500 °C in the muffle furnace for 4 h. The resulting material was digested with 12% NaOH solution for 5 h at 68 °C. The remaining solid particles were filtered out, washed thoroughly, and dried. The samples thus obtained from all three biomasses were powdered and stored for further studies.
2.3. Characterization of Adsorbents
The powder form of ANB, LC, RH, ANBC, LCC, and RHC, as adsorbents, were characterized based on the phenol number (amount of phenol required by adsorbent for 90% phenol removal), pH of their slurries in water, iodine number, and methylene blue number. The surface areas of the adsorbents were determined by the nitrogen adsorption method (Quanta chrome BET surface area analyzer). The particle size of the adsorbents was determined using a Laser Diffraction Particle Size Analyzer.
2.4. Batch Experiments
For the adsorption study, batch experiments were carried out in 100 mL of phenol solution (1 g/L), in conical flasks. The biomasses understudies as adsorbents are mentioned in Section 2.3. The temperature of the adsorption was fixed at 25 °C. The effects of dosage, pH, contact time, initial phenol concentration, and agitation speed on the process of adsorption (onto ANBC, LCC, and RHC), were studied. The phenol concentrations in aqueous solutions were determined using a double beam spectrophotometer. To study the effects of dosage on adsorption, the activated adsorbents with different amounts were equilibrated with phenol solution for 24 h at 200 rpm at 25 °C. Solutions of phenol were adjusted to the entire range of pH, from 2.0 to 12.0, with the help of 0.1 NaOH and 0.1 H2SO4 and keeping the other parameters as constant. In each study, other than the effect of dosage, fixed optimized amounts of adsorbents were equilibrated with phenol (adsorbate) solution of 1 g/L. To study the effect of time on the percentage removal of phenol at 25 °C, the optimized dosage of adsorbents, pH, initial phenol concentration, and rpm of shaker were taken with the solution of phenol (1 g/L). The extent of adsorption was recorded for different periods, until constancy in the phenol removal was observed. The amount of phenol adsorbed was calculated as per the following equation:
where qe (mg/g) is the amount of phenol adsorbed per unit mass of adsorbent, C0 is the initial concentration of phenol, Ce is the concentration of phenol at equilibrium, V is the volume of solution, and m is the mass of the adsorbent added for each test.
qe = (C0 − Ce) × V/m,
2.5. Mathematical Models for Adsorption Isotherms
In a liquid–solid mass transfer operation, the adsorption equilibrium indicates the relationship of the adsorbate in a liquid solution and that adsorbed onto the solid. The data obtained in the study of adsorption isotherms are unique for a particular adsorbate–adsorbent system. In this work, mathematical models for the adsorptions studied were Langmuir, Freundlich, and Temkin [28,29,30]. They are explained as follows:
2.5.1. Langmuir Isotherm Model
Based on the theory of Langmuir, the equation describing adsorption is given as:
qe = (Q0 b Ce)/(1 + b Ce).
The equation mentioned in Equation (2) is simplified as:
where qe is the amount of adsorbate adsorbed per unit mass of adsorbent, Ce (mg/L) represents the equilibrium concentrations of a supernatant solution, Q0 is the monolayer capacity (mg/g) of adsorbent, and b is the surface energy (L/mg) corresponding to the process of adsorption. The Langmuir adsorption isotherm also defines a unique value of the separation factor, RL, which is expressed as:
where the value of RL is the indication of the process of adsorption [29] as explained in Table 1 and C0 is the initial phenol concentration.
1/qe = 1/(Q0 b Ce) + 1/Q0,
RL = 1/(1 + b C0),
2.5.2. Freundlich Isotherm
The Freundlich equilibrium isotherm is an empirical equation used for the description of multilayer adsorption with the interaction between adsorbed molecules:
where k [(mg/g) (L/g)1/n] is the Freundlich isotherm constant, and n represents the adsorption intensity. The linear form of the Equation (5) is as follows:
qe = k Ce1/n,
lnqe = lnk + 1/n lnCe.
2.5.3. Temkin Isotherm
The Temkin isotherm is based on the assumption that the decline of the heat of adsorption as a function of temperature is linear rather than logarithmic, as implied in the Freundlich equation [31]. The following equation gives the model:
where A (L/mg) and B (RT/b1) are the Temkin’s constants. Also, R is the universal gas constant (8.314 J/mol K), T is the temperature (K), and b1 is the constant related to the heat of adsorption (J/mol). The simplified form of Equation (7) is:
qe = B [ln(A Ce)],
qe = B lnA + B lnCe.
2.6. Mathematical Models for Adsorption Kinetics
The kinetics of any adsorption gives information about the progress of the process with time. Adsorption’s kinetics were explained by pseudo-first-order and pseudo-second-order models [16,32] as explained below.
2.6.1. Pseudo-First-Order Kinetic Model
The model, given by Langergren and Svenska, is defined as:
where qe and qt (mg/g) are the amount of adsorbate, adsorbed at the equilibrium condition and at any time, t (min.), respectively, and k1 (min−1) is the adsorption rate constant.
ln(qe − qt) = lnqe − k1t,
2.6.2. Pseudo-Second-Order Kinetic Model
The pseudo-second-order equation based on equilibrium adsorption, is expressed as:
where k2 (g/mg min) and h (mg/g. min) are constants of the second-order kinetics.
t/qt = 1/(k2qe2) + t/qe,
t/qt = 1/(h) + t/qe,
2.7. Regeneration of Adsorbents
All three adsorbents were subjected to the process of regeneration using 100 mL of 1 M NaOH solution. For this process, 1.2, 1.0, and 1.1 g of ANBC, LCC, and RHC, respectively, were added to the conical flasks separately at 25 °C and stirred with a rotation of 200 rpm. The pH of slurries with NaOH was maintained at 6.5 for 5 h for ANBC, at 7.5 for 6 h for LCC, and, at 6.8 for 4.5 h for RHC. After the completion of desorption, the amounts of phenol transferred from the adsorbents to the solutions were determined by measuring the concentrations of supernatant solutions using a spectrophotometer, as mentioned in Section 2.4. The regenerated adsorbents were filtered out, washed thoroughly, dried, and stored.
3. Results
3.1. Analysis of Biomasses
Ten biomasses were subjected to bulk density and proximate analysis, as mentioned in Section 2.1.1 and Section 2.1.2.
The bulk densities in g/cc of ANB, LC, and sawdust were above 200 (Table 2), which were reasonably high so they can be transported with ease from one place to another for their utilization. The bulk density of all other biomasses, which were lower than 200 g/cc, need briquetting to increase their density. Briquetted biomasses are economical to transport from one location to another for their utilization.
ANB, LC, and RH indicated reasonably high percentages of FC, with values of 25, 23, and 20, respectively (Table 2). FC content is the most desirable quality of any biomass to be selected as adsorbents for the removal of phenol. These biomasses were abundantly available in the region of Sangrur. Hence, they were considered for the adsorptive investigations for the removal of phenol from aqueous solutions. It was also observed that these biomasses had reasonably high percentages of VM and ash, making them all the more desirable for their consideration as adsorbents.
3.2. Characterization and Adsorption Study of Selected Biomasses as Adsorbents
The selected biomasses, ANB, LC, and RH, were ground, as explained in Section 2.2.1. The resulting samples were subjected to determinations of ash, FC, VM, iodine number, surface area, particle size, and methylene blue values. The results of the characterization indicated the reasonably higher iodine number of 485 for ANB compared to that of LC and RH (Table 3). BET surface areas of the selected biomasses were low, whereas the particle sizes of the biomasses were comparable to that of commercial-grade carbons [26]. The methylene blue adsorption of ANB was the highest at 40 mg/g whereas the same for LC and RH was 5.8 and 0.45, respectively.
Therefore, based on the characterization, the selected biomasses had a shallow adsorption capacity. A meagre percentage of removal of phenol was confirmed for ANB at 35%, LC at 17%, and RH at 1% (Figure 2). Characterization of the selected biomasses, as shown in Table 3, suggested that there was a need to activate them to obtain adsorbents with better FC, BET surface area, iodine numbers, and methylene blue adsorption.
3.3. Characterization of Selected Biomasses after Activation
The selected biomasses without activation had a feeble adsorption capacity for phenol, as discussed in Section 3.2. As per the literature, commercial-grade carbon, an excellent adsorbent for phenol, should have high contents of FC, BET surface area, iodine number, and methylene blue adsorption and low values of ash and VM [33]. Consequently, it was considered worthwhile to activate them to bring the above-stated values near to that of commercial-grade carbon. Therefore, the treatment methods, as discussed in Section 2.2.2, were followed, and the results are shown in Table 4. After a comparison based on the values of ash, FC, VM, phenol number, iodine number, surface area, particle size, and methylene blue adsorption, ANBC proved to be the best-activated adsorbent.
3.4. Adsorption Studies on Activated Biomasses
The activated biomasses showed improved properties (Table 4) compared to that of the biomasses without activation (Table 3). It was considered appropriate to consider ANBC, LCC, and RHC for further studies as discussed in the following sub-sections.
3.4.1. Effects of Operating Parameters on the Adsorption
To select one set of the best parameters for the adsorption of phenol on activated biomasses, the author felt the need to study the effects of dosage, initial phenol concentration, agitation speed, contact time, and pH of the adsorbate solution on the process of adsorption. They are explained as follows.
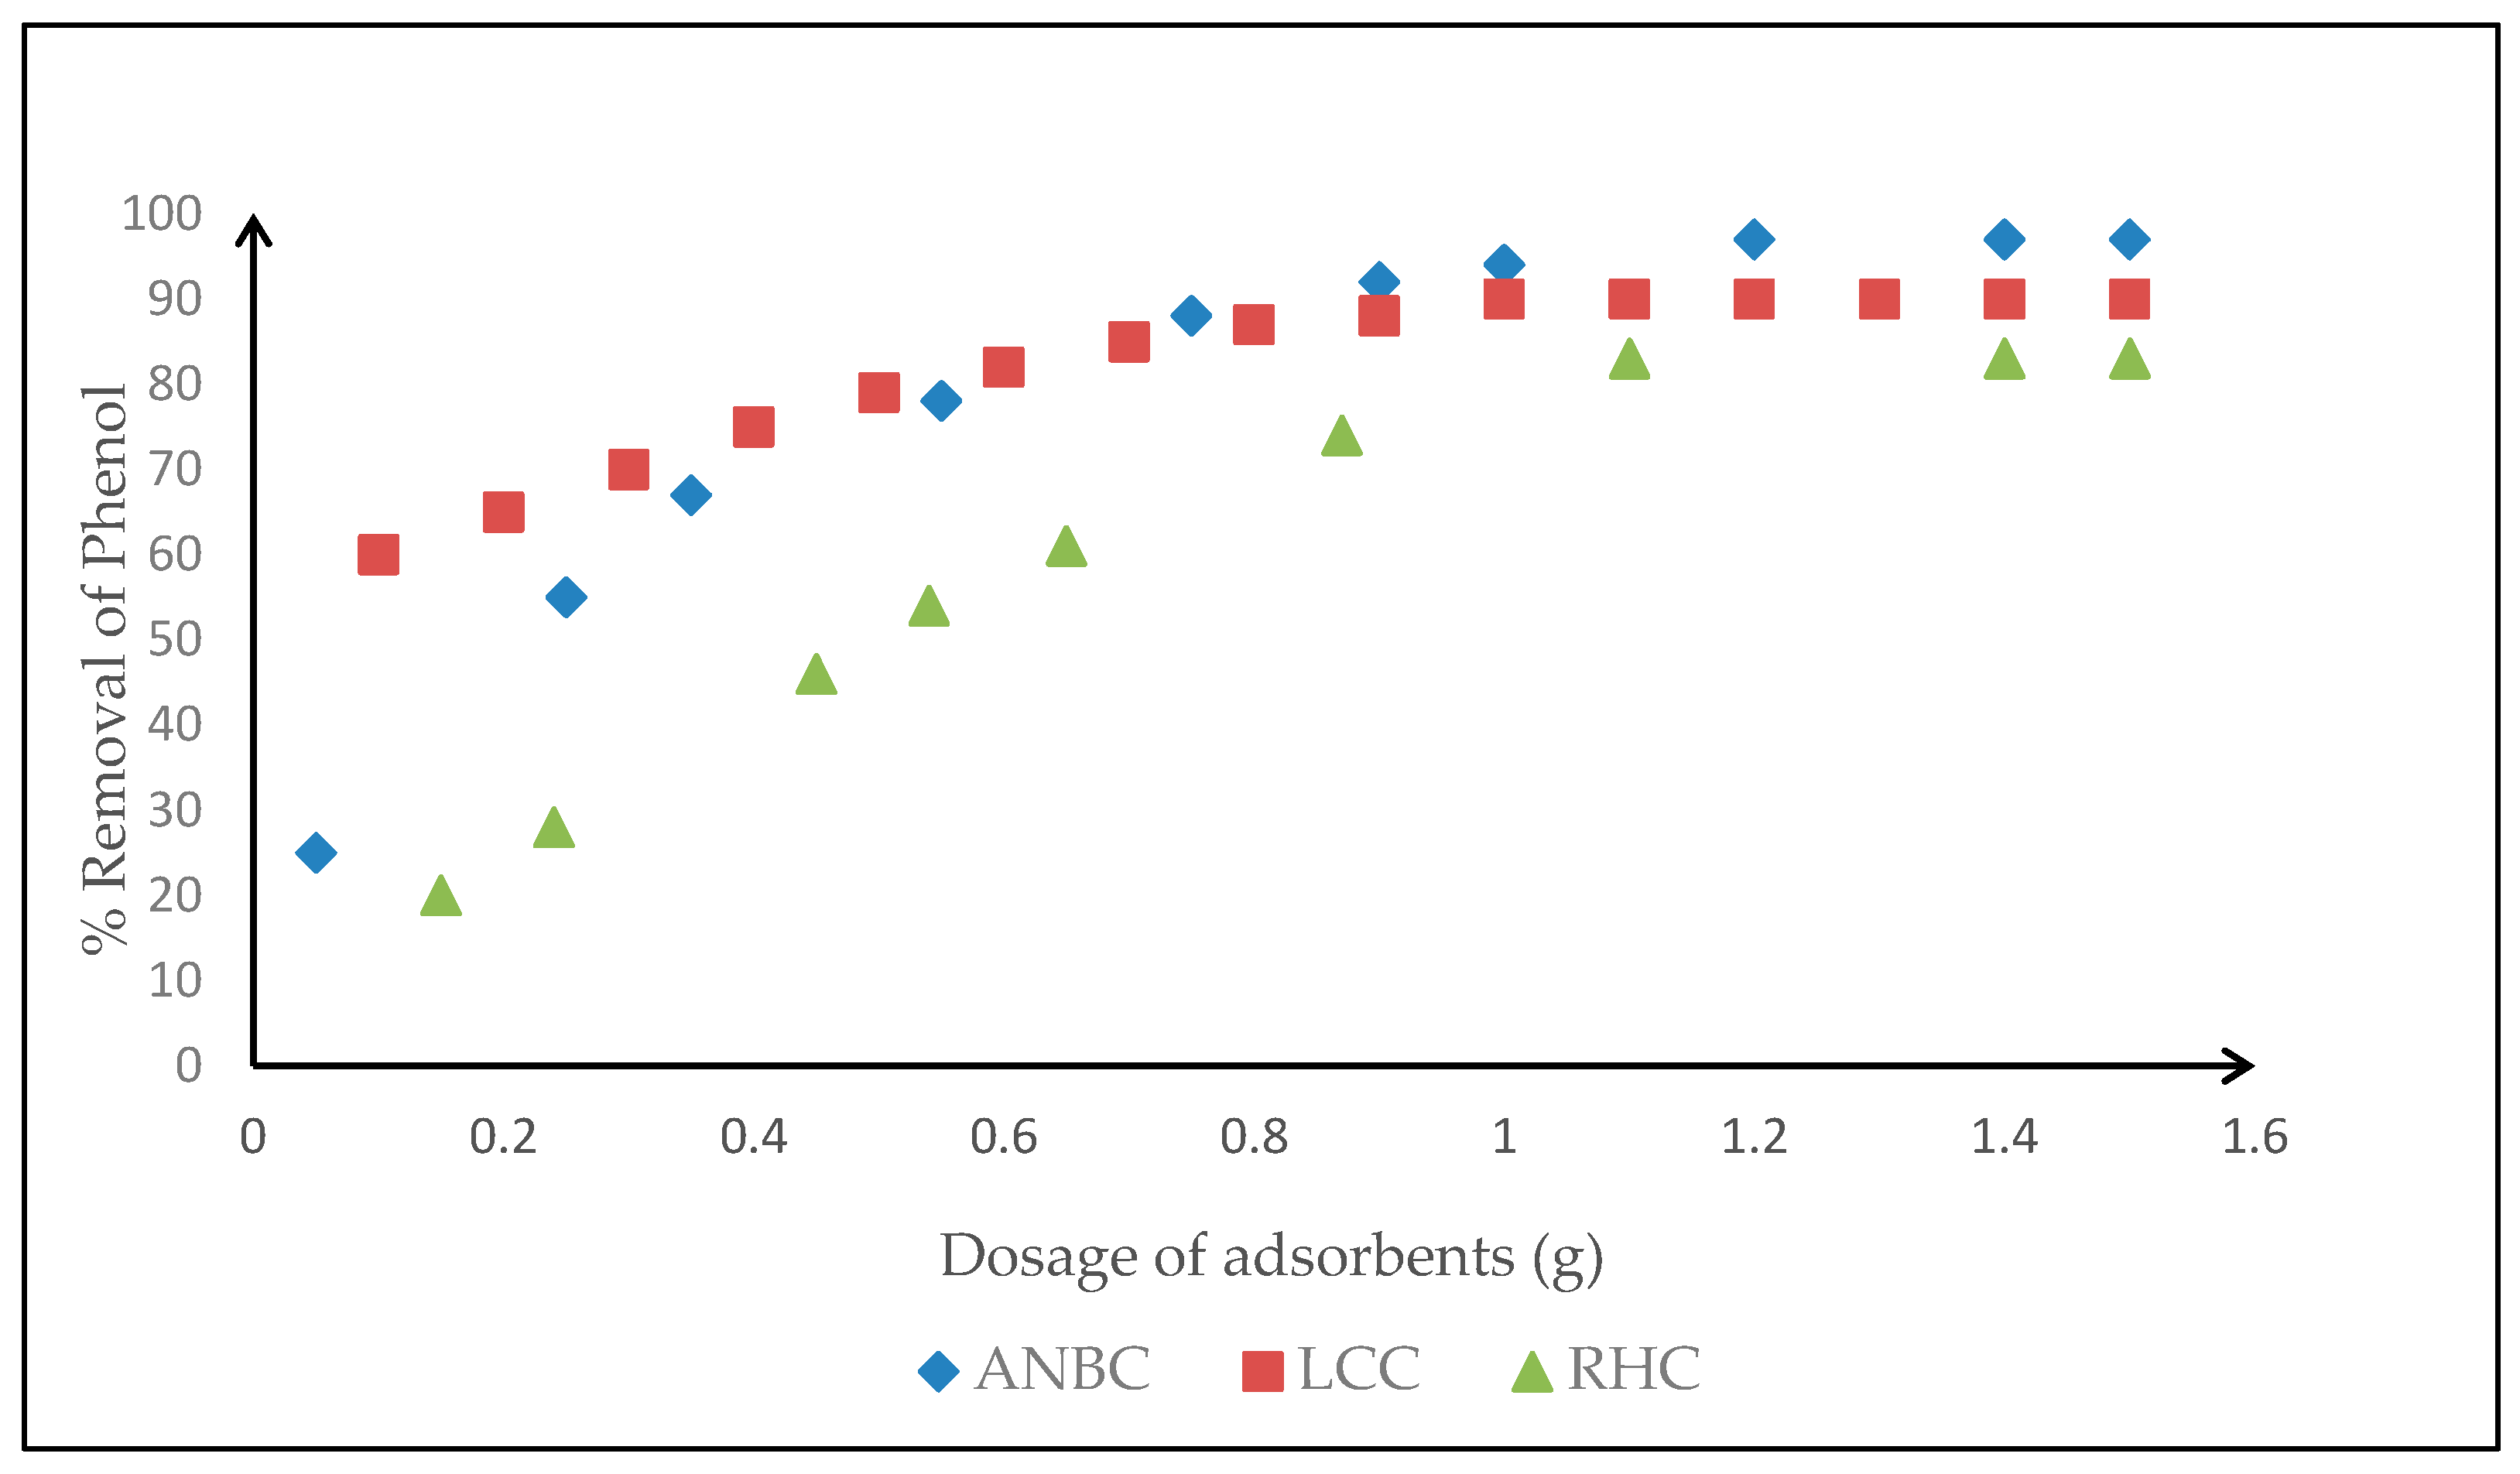
The effect of dosage on the adsorption of phenol on activated biomasses: The study was conducted on ANBC, LCC, and RHC, as explained in Section 2.4. Figure 3 indicates that in all cases of activated biomasses, the percentage removals of phenol increased with the increase in the amount of dosage. The amount of ANBC required is constant at 97% removal of phenol with an adsorbent dosage of 1.2 g for 100 mL of 1 g/L of phenol solution. For LCC, the amount of dosage required is 1 g for maximum removal of phenol at 90% with the same solution concentration of 100 mL. RHC removed 83% of phenol with a maximum dosage of 1.1 g with the same strength of phenol solution of 100 mL.
The effect of pH on the adsorption of phenol on activated biomasses: The effect of pH on the removal of phenol by activated biomasses was investigated as explained in Section 2.4. The maximum adsorption of phenol by ANBC, LCC, and RHC was at the pH of 6.5, 7.5, and 6.8, respectively.
The effect of the initial concentration on the adsorption of phenol on activated biomasses: The effect of the initial concentration of adsorbate on the adsorption of phenol on activated biomasses was studied as explained in Section 2.4. It was observed that the initial concentration of phenol did not affect the process of adsorption. The maximum removals of phenols by ANBC, LCC, and RHC, were at 97%, 90%, and 83%, respectively, irrespective of the initial adsorbate concentrations.
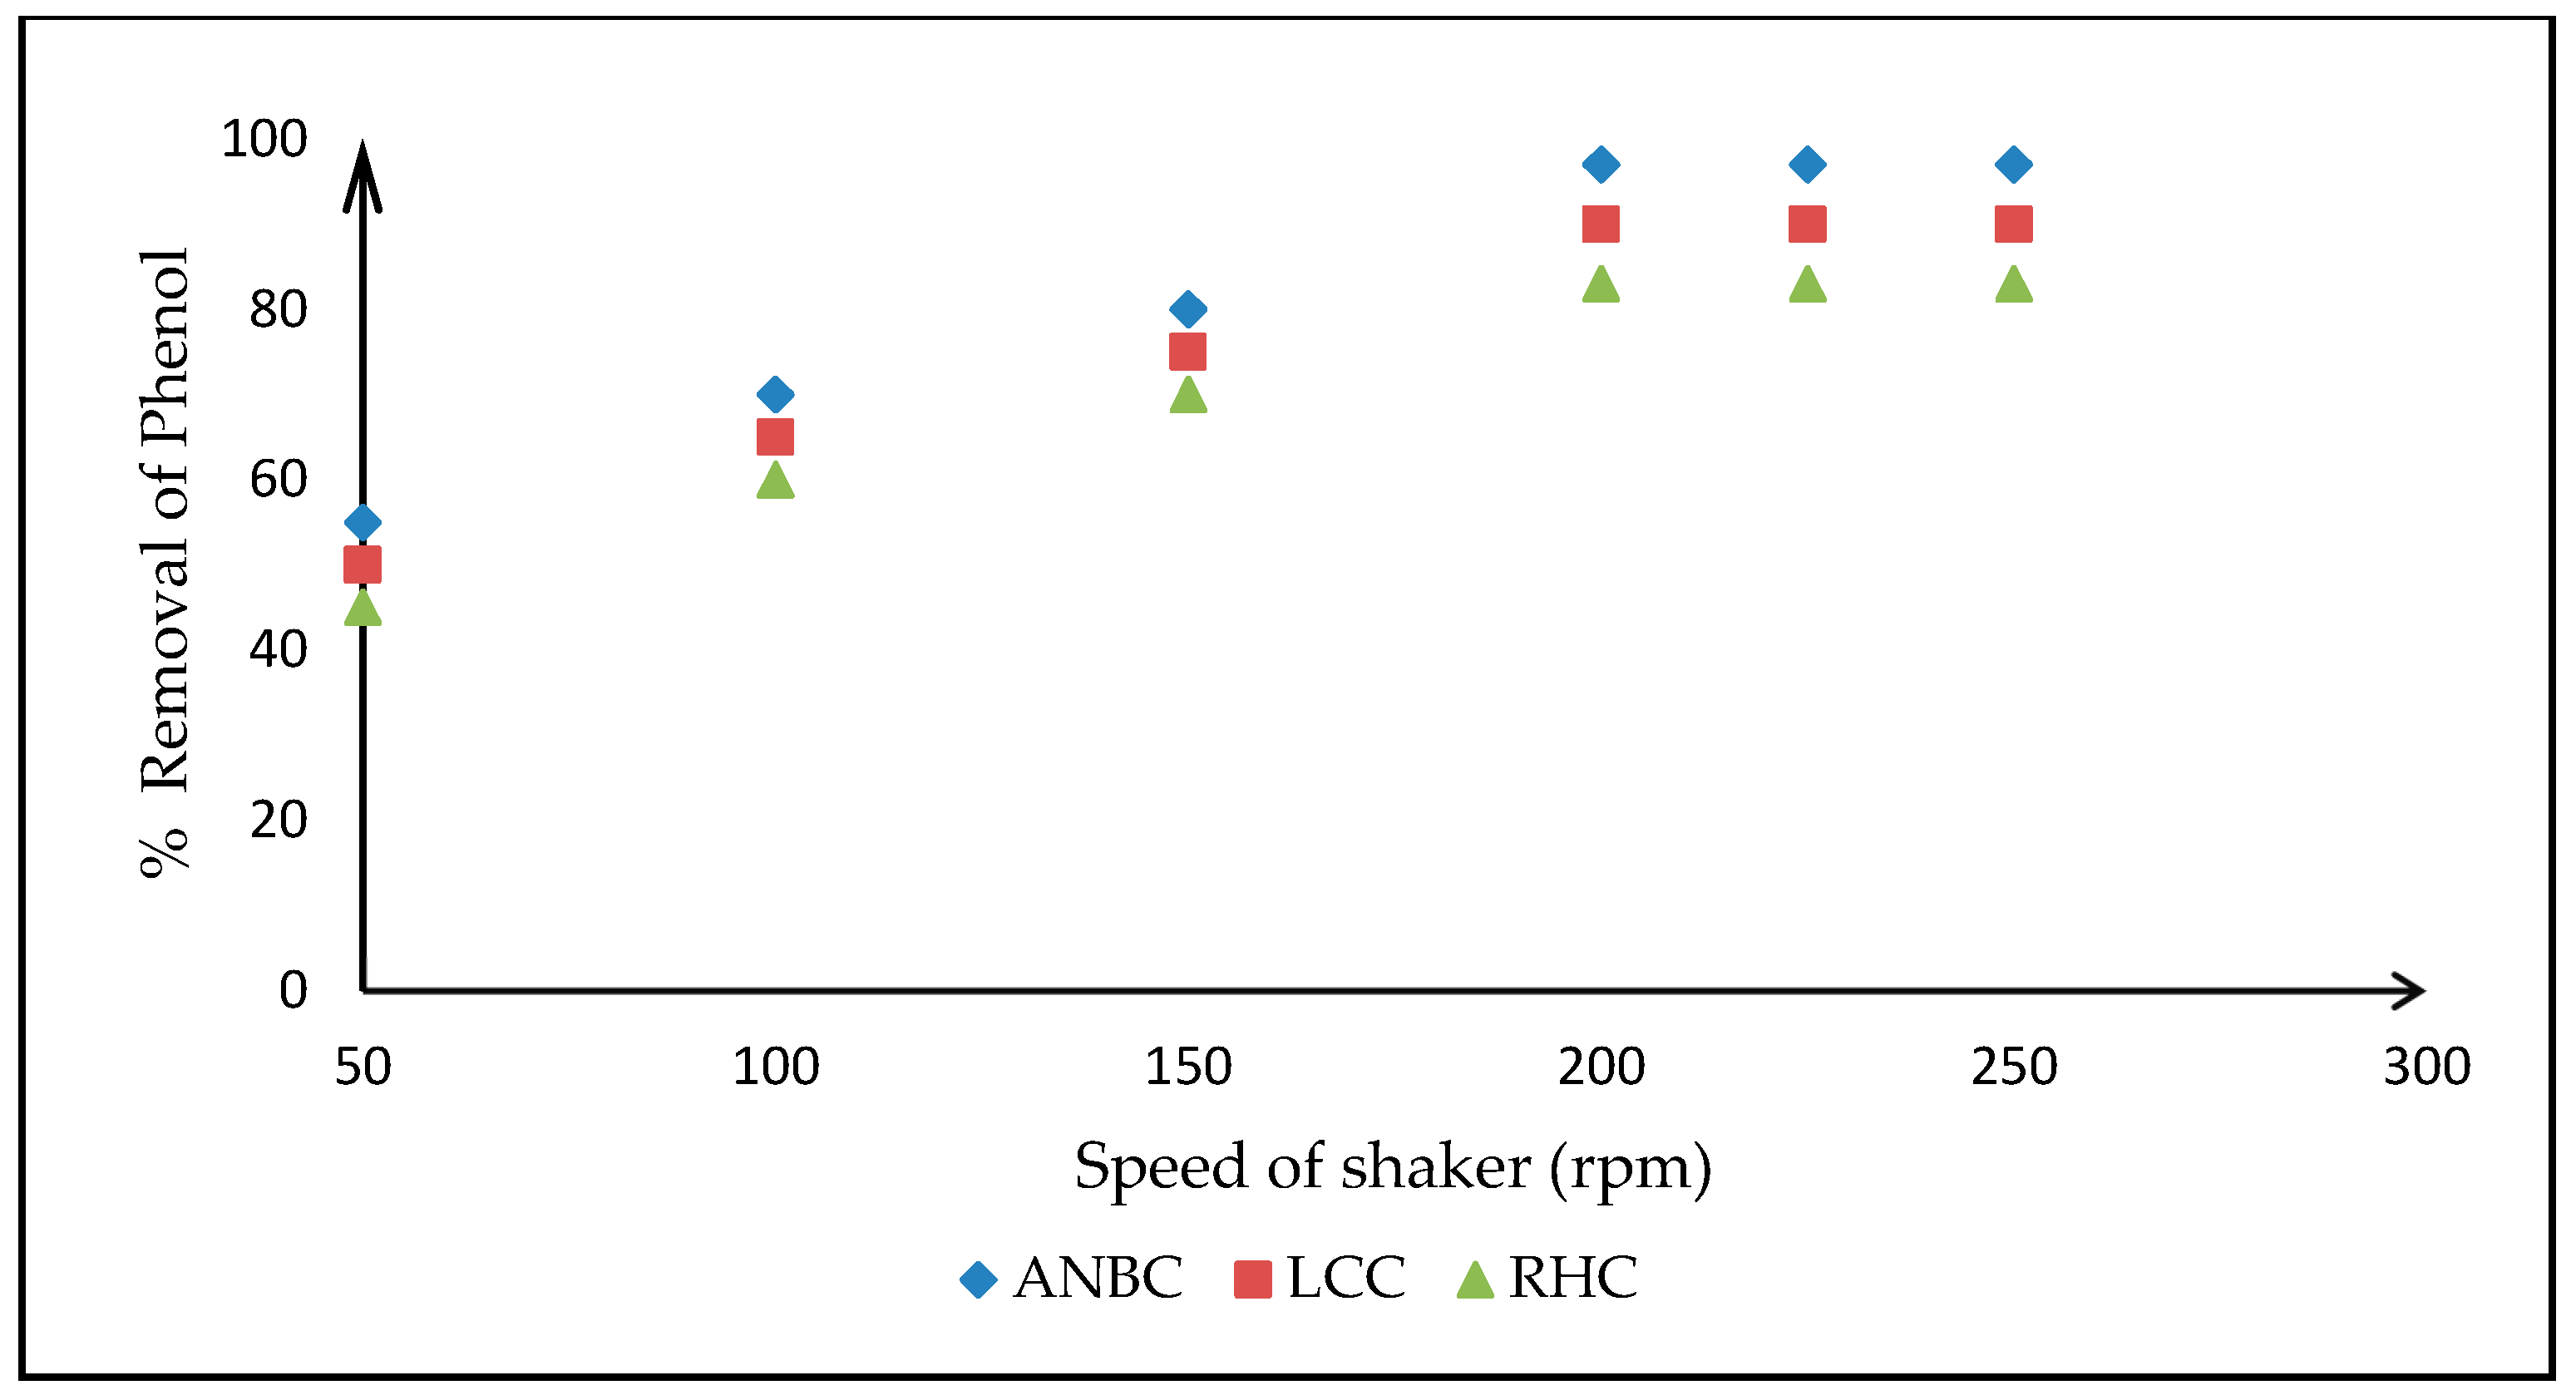
The effect of the agitation speed on the adsorption of phenol on activated biomasses: The effect of the agitation on the adsorption was studied at 50, 100, 150, 200, 225, and 250 rpm for the activated biomasses as explained in Section 2.4. When the contact time of 4 h was kept at a pH of 6.5, ANBC could remove a maximum of 97% of phenol at an agitation speed of 200 rpm (Figure 4). LCC removed a maximum of 90% of phenol when contacted for 5 h at a pH of 7.5 at the same agitation speed. RHC indicated the removal of 83% of phenol at 200 rpm with an adsorbate–adsorbent contact time of 3.5 h with pH at 6.8. It was found that with an increase in the agitation speed, the percentage removal of phenol increased and was maximum at 200 rpm and remained constant till 250 rpm for all systems of phenol and activated biomasses.
The effect of time on adsorption: The effect of time on phenol removal by activated adsorbents was observed, as explained in Section 2.4. The time taken for the maximum removal of phenol was 4, 5, and 3.5 h by ANBC, LCC, and RCH, respectively (Figure 5). The experiment fixed the optimized time for adsorption study for each of the adsorbate–adsorbent systems.
3.4.2. Adsorption Isotherms of Phenol on Activated Biomasses
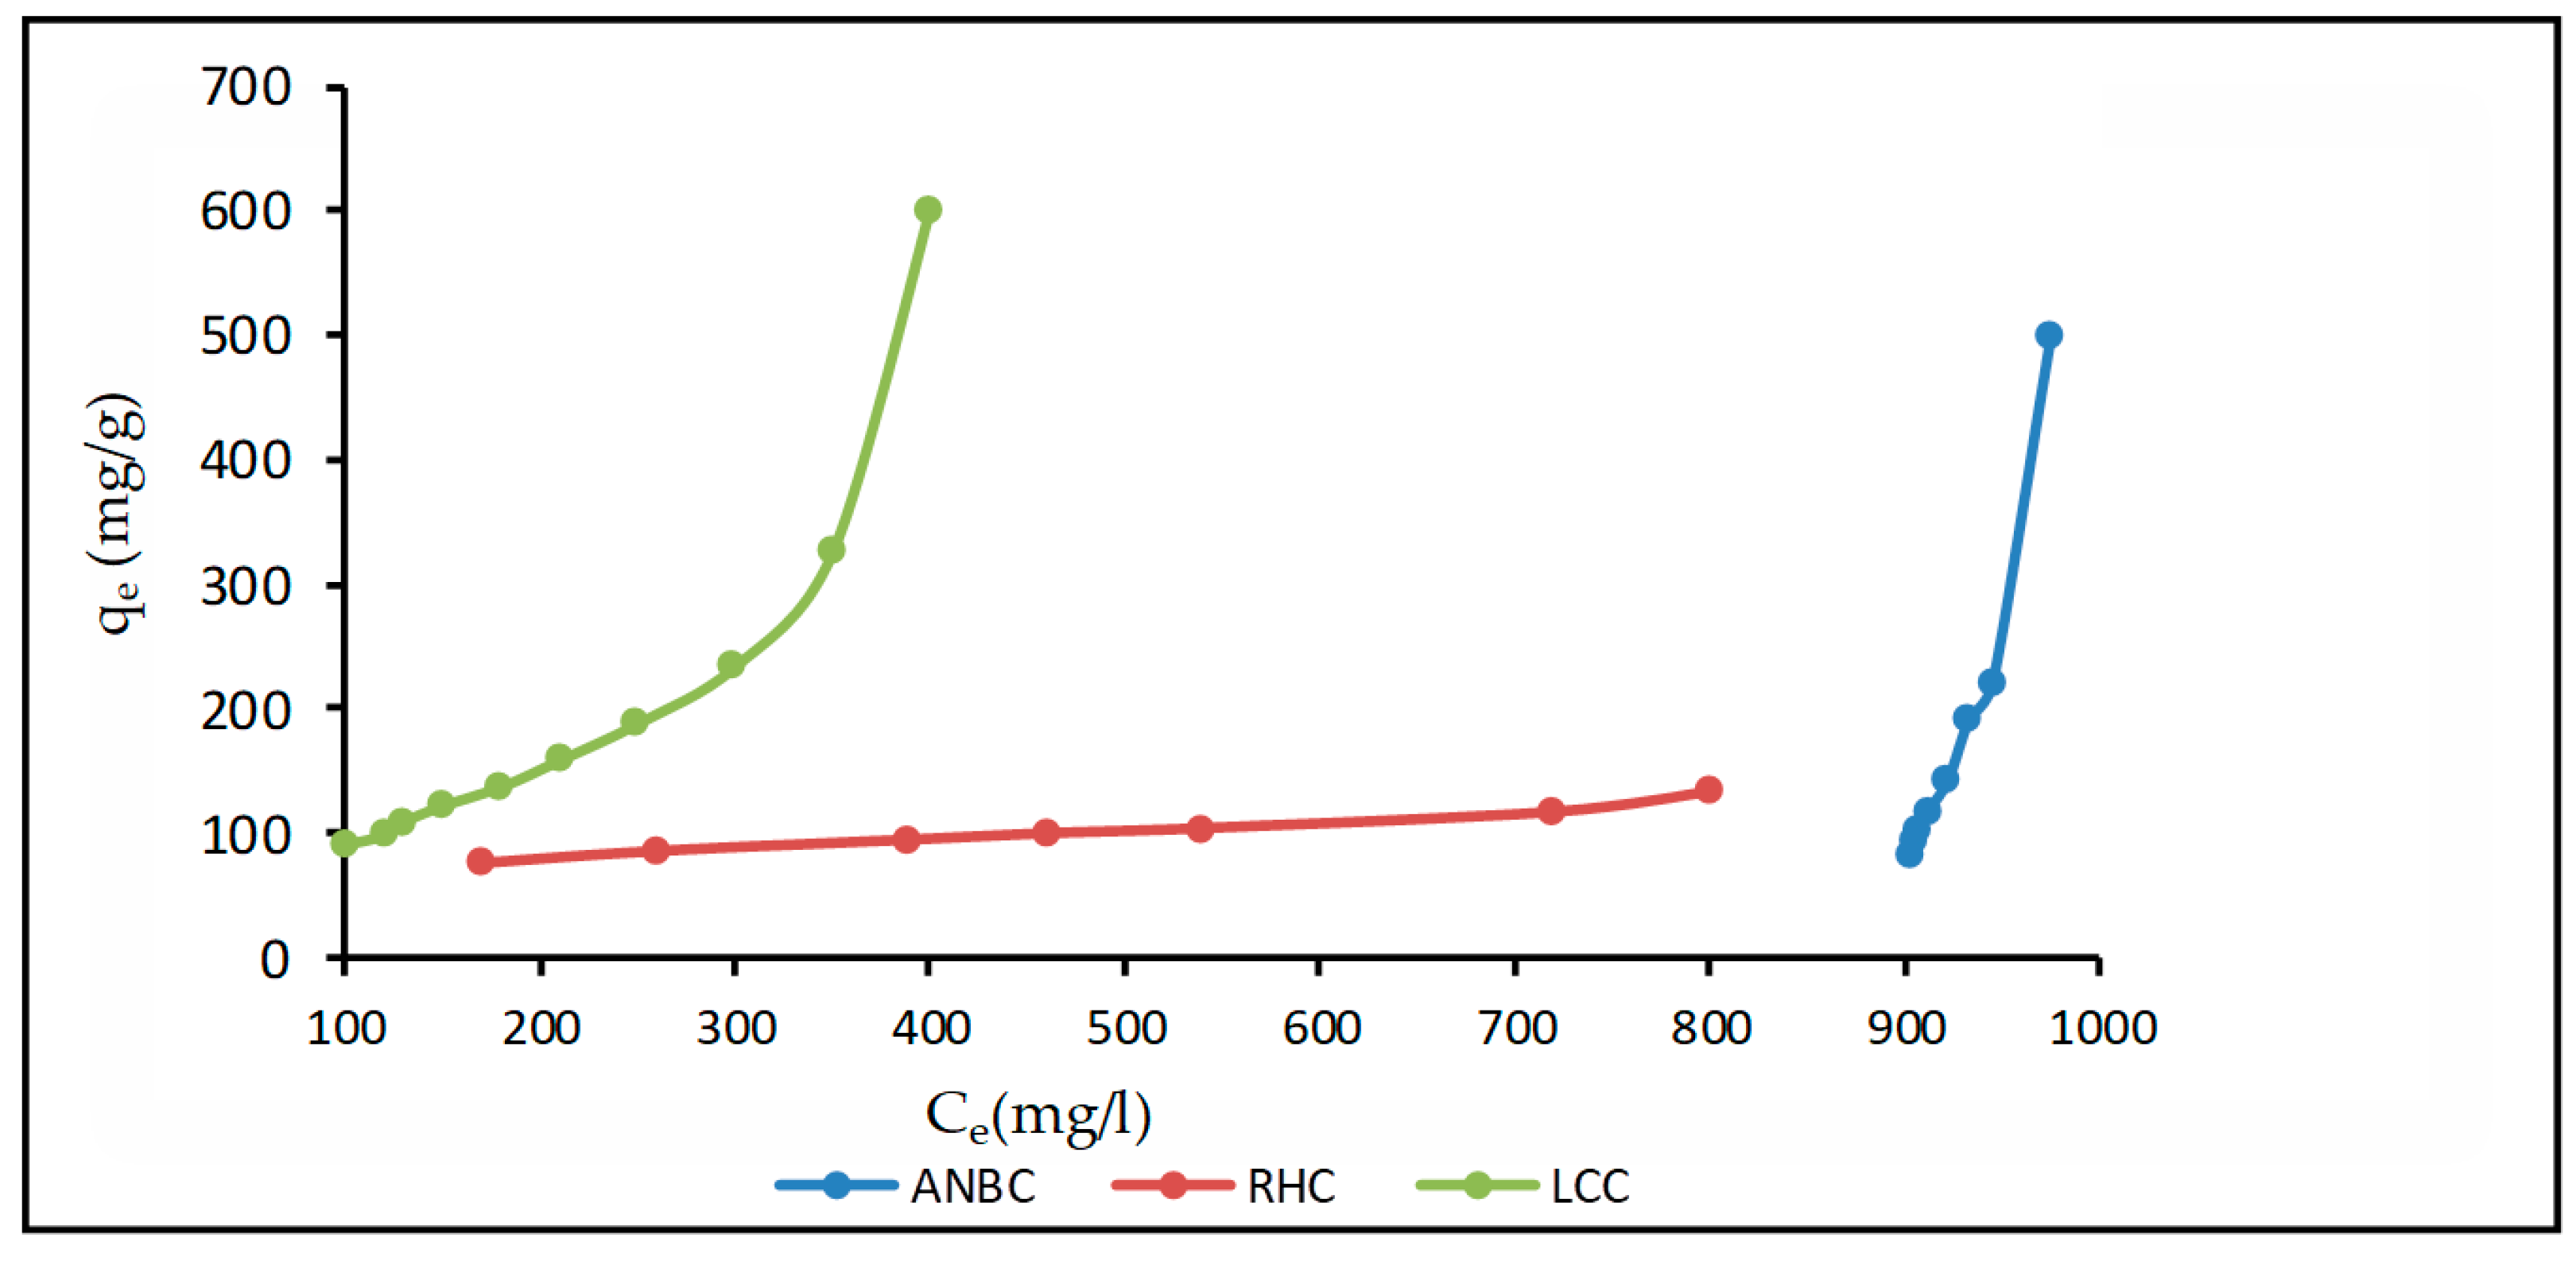
Based on the detailed study of the effect of various parameters on adsorption, optimized conditions for adsorption study on activated biomasses were fixed. For ANBC, the adsorption study was confirmed at a pH of 6.5 and a time of contact of 4 h. For LCC, the same was conducted at a pH of 7.5 and a time of contact of 5 h. For RHC, the investigation was performed at a pH of 6.8 and the time of contact was 3.5 h. In each case, the agitation speed of 200 rpm was fixed with the phenol concentration at 1 g/L. The temperature and amount of phenol solution taken each time were at 25 °C and 100 mL, respectively. The adsorption curves were obtained, as shown in Figure 6.
The adsorption study for LCC is in the range of 100 to 400 mg/L of the supernatant concentration (Ce). The maximum phenol adsorbed by LCC is 600 mg/g. Adsorption data for RHC could be recorded in the concentration range of 170 to 800 mg/L of the phenol solution (Ce). The maximum phenol adsorbed by RHC was 132 mg/g. It was possible to get an adsorption isotherm for ANBC from 903 to 975 mg/L of the phenol solution (Ce). The maximum phenol adsorbed by ANBC was 500 mg/g of the adsorbent.
4. Discussion
4.1. Mathematical Analysis of Adsorption Isotherms
The adsorption data were analyzed mathematically using Langmuir, Freundlich, and Temkin models, as explained in Section 2.5.
The Langmuir isotherm is based on the assumption that the adsorption process takes place on a homogeneous surface with a monolayer of adsorbent [34]. Table 5 indicates that LCC follows the Langmuir isotherm for the entire concentration range of 100 to 400 mg/L. Equations (2)–(4) enabled the author to identify the various constants. The value of R2 is 0.95, the monolayer adsorption constant, Q0, is 16.49 mg/g, and the separation factor, RL, is 0.067, As per the conditions mentioned in Table 1, the process of adsorption is favorable. The magnitude of b, an indication of surface energy, is 13.98 L/mg and is a moderate value [35].
The Freundlich isotherm assumes that there is a possibility of multilayer adsorption. The adsorption isotherm of RHC indicates it best fits into this adsorption model, for a concentration range of 170 to 800 mg/L with an R2 value of 0.95. Constants, k and n, were calculated from Equations (5) and (6). These values show that phenol has an excellent affinity towards RHC. The value of n is 3.06, which satisfies the conditions of heterogeneity [30], i.e., 1 < n < 10 as well as 0 < 1/n < 1.
ANBC follows the Temkin isotherm in the concentration range of 903 to 945 mg/L. The Temkin constants were determined using Equations (7) and (8). The least square fit value for the adsorbent is 0.99.
4.2. Mathematical Analysis of Adsorption Kinetics
Adsorption kinetics were applied to know the effectiveness of adsorption. The kinetic equations followed for the adsorption of phenol on activated biomasses are Equations (9)–(11). Data from Figure 5 were used to identify the kinetic constants from these equations. It is observed that the kinetic data of all activated biomasses fit into first-order kinetics (Table 6). However, ANBC and LCC follow second-order kinetics more closely, with R2 values of 0.99 and 0.98, respectively (Table 6).
4.3. Regeneration of Adsorbents
Activated biomasses as adsorbents were subjected to a regeneration test in a single step, as mentioned in Section 2.7. It was possible to recover 90%, 87%, and 80% of phenol from the spent ANBC, LCC, and RHC, respectively. The process helps to regenerate the adsorbents, to a great extent, in a single step, thereby reducing its required amount [36]. The recovered phenol by ANBC, LCC, and RHC can be separated from water using solvent extraction, distillation, freeze-drying, and membrane-separation techniques [37]. However, the fate of the adsorbents after regeneration was not considered in this work.
5. Conclusions
Based on the characterization and availability of biomasses, ANB, LC, and RH were selected for the adsorption study of phenol. As the percentage removal of phenol from aqueous solutions was low, they were thermochemically treated to obtain activated forms of adsorbents as ANBC, LCC, and RHC with BET surface areas of 450, 151, and 301 m2/g, respectively. Adsorbents helped the removal of phenol by 97%, 90%, and 83%, from aqueous solutions. The adsorption conditions for phenol removal were optimized. Based on the optimum condition selected, the adsorption isotherm of ANBC fit into the Temkin model in the concentration range of 903 to 945 mg/L of the supernatant solution. The adsorption process with LCC followed the Langmuir model in the concentration range of 100 to 400 mg/L. LCC had a monolayer adsorption capacity (Q0) of 16.49 mg/g. The separation factor, RL, was 0.067, indicating that the adsorption of phenol on LCC was favorable. Kinetic data of ANBC and LCC fit into the second-order model whereas RHC indicated its fit was first-order kinetics. Activated biomasses were subjected to single-step regeneration using 1 M NaOH. It was possible to recover 90%, 87%, and 80% of phenol using ANBC, LCC, and RHC, respectively. Thus, selected biomasses, Acacia nilotica branches, Lantana camera, and rice husk, yielded value-added products in the forms of activated adsorbents with the appreciable capacity of phenol removal from aqueous solutions. Biomasses, ANB, LC, and RH, causing threats to the environment, can be used effectively for the removal and recycling of phenol from aqueous solutions under the concept of a circular economy [38].
In the future, ANB, LC, and RH should be considered as adsorbents for the removal of other toxic chemicals in the form of dyes, organic acids, heavy metals, and oil spills from aqueous streams, located in India and other parts of the world.
Funding
This research received no external funding and the APC was partly funded by SLIET.
Acknowledgments
The author acknowledges the help of Technicians and U.G./P.G. students of Chemical Engineering Department of SLIET, in conducting various experiments required for this work.
Conflicts of Interest
The author declares no conflict of interest.
References
- Bhuvaneshwari, S.; Hettiarachchi, H.; Meegoda, J.N. Crop Residue Burning in India: Policy Challenges and Potential Solutions. Int. J. Environ. Res. Public Health 2019, 16, 832. [Google Scholar] [CrossRef] [PubMed]
- Bnapurmath, N.R.; Yaliwal, V.S.; Adaganti, S.Y.; Halewadimath, S.S. Power Generation from Renewable Energy Sources Derived from Biodiesel and Low Energy Content Producer Gas for Rural Electrification. In Energy from Toxic Organic Waste for Heat and Power Generation; Debabreta, B., Ed.; Woodhead Publishing: Cambridge, UK, 2019; pp. 151–194. [Google Scholar]
- Iyer, P.V.R.; Rao, T.R.; Grover, P.D. Biomass Thermo-Chemical Characterisation, 3rd ed.; Chemical Engineering Department, IIT Delhi: Delhi, India, 2002; p. 1. [Google Scholar]
- Demirbas, A. Heavy metal adsorption onto agro-based waste materials: A review. J. Hazard. Mater. 2008, 157, 220–229. [Google Scholar] [CrossRef] [PubMed]
- Kilic, M.; Apaydin-Varol, E.; Putin, A.E. Adsorptive removal of phenol from aqueous solutions on activated carbon prepared from tobacco residues: Equilibrium, kinetics and thermodynamics. J. Hazard Mater. 2011, 189, 397–403. [Google Scholar] [CrossRef] [PubMed]
- Ali, A. Removal of Mn (II) from water using chemically modified banana peels as an efficient adsorbent. Environ. Nanotechnol. Monit. Manag. 2017, 7, 57–63. [Google Scholar] [CrossRef]
- Aljeboree, A.M.; Radi, N.; Ahmed, Z.; Aklaim, A.F. The use of sawdust as a by-product adsorbent of an organic pollutant from wastewater: Adsorption of maximum blue dye. Int. J. Chem. Sci. 2014, 12, 1239–1252. [Google Scholar]
- Namasivayam, C.; Sangeetha, D. Recycling of agricultural solid waste, coir pith: Removal of anions, heavy metals, organics and dyes from water by adsorption onto ZnCl2 activated coir pith carbon. J. Hazard. Mater. 2006, 135, 449–452. [Google Scholar] [CrossRef]
- Clayton, G.D.; Clayton, F.E. Patty’s Industrial Hygiene and Toxicology, 4th ed.; John Wiley & Sons Inc.: New York, NY, USA, 1994; p. 132. [Google Scholar]
- Dursun, G.; Cicek, H.; Dursun, A.Y. Adsorption of aqueous phenol solution by using carbonized beet pulp. J. Hazard Mater. 2005, 125, 175–182. [Google Scholar] [CrossRef]
- Anku, W.W.; Mamo, M.A.; Govender, P.P. Phenolic Compounds in Water: Sources, Reactivity, Toxicity and Treatment Methods. In Phenolic Compounds; Hernadez, M.S., Tenango, M.P., Mateos, R.G., Eds.; Intech Open: London, UK, 2017; pp. 420–443. [Google Scholar]
- Ahmaruzzaman, M.; Sharma, D.K. Adsorption of phenol from wastewater. J. Colloid Interface Sci. 2005, 287, 14–24. [Google Scholar] [CrossRef]
- Mohd Din, A.T.; Hameed, B.H.; Ahmad, A.L. Batch adsorption of phenol onto physiochemical-activated coconut shell. J. Hazard Mater. 2009, 161, 1522–1529. [Google Scholar] [CrossRef]
- Stasinakis, A.S.; Elia, L.; Halvadakis, C.P. Removal of total phenols from olive- mill wastewater using an agricultural by-product, olive pomace. J. Hazard Mater. 2008, 160, 408–413. [Google Scholar] [CrossRef]
- Alhamed, Y.A. Adsorption kinetics and performance of packed bed adsorber for phenol removal using activated carbon from date’s stones. J. Hazard Mater. 2009, 170, 763–770. [Google Scholar] [CrossRef]
- Tseng, R.L.; Wu, K.T.; Juang, R.S. Kinetic studies on the adsorption of phenol, 4-chlorophenol, and 2, 4-dichlorophenol from water using activated carbons. J. Environ. Manag. 2010, 91, 2208–2214. [Google Scholar] [CrossRef]
- Jadhav, D.N.; Vanjara, A.K. Removal of phenol from wastewater using sawdust, polymerized sawdust and sawdust carbon. Int. J. Chem. Technol. 2004, 11, 5–41. [Google Scholar]
- Sarker, N.; Fakhruddin, A.N.M. Removal of phenol from aqueous solutions using rice-straw as an adsorbent. Appl. Water Sci. 2017, 7, 1459–1465. [Google Scholar] [CrossRef]
- Das, B. Characterisation of Biomass/Agro Residues and Application of Selected Biomass for Sorption of Phenol from Aqueous Solutions. Ph.D. Thesis, SLIET, Longowal, India, 2016. [Google Scholar]
- Gottipati, R. Preparation and Characterisation of Microporous Activated Carbon from Biomass and its Application in the Removal of Chromium (VI) from Aqueous Phase. Ph.D. Thesis, NIT, Rourkela, India, 2012. [Google Scholar]
- Zhang, J.; Fu, H.; Lu, X.; Tang, J.; Xu, X. Removal of Cu (II) from aqueous solution using the rice husk carbons prepared by the physical activation process. Biomass Bioenergy 2011, 35, 464–472. [Google Scholar] [CrossRef]
- Zhu, Y.; Gao, J.; Li, Y.; Sun, F.; Gao, J.; Wu, S.; Qin, Y. Preparation of activated carbons for SO2 adsorption by CO2 and steam activation. J. Taiwan Inst. Chem. Eng. 2012, 43, 112–119. [Google Scholar] [CrossRef]
- Ould-Idriss, A.; Stitou, M.; Cuerda-Correa, E.M.; Fernandez-Gonzalez, C.; Marcias-Garcia, A.; Alexandre-Franco, M.F.; Gomez-Serrano, V. Preparation of activated carbons from olive-tree wood revisited. II. Physical activation with air. Fuel Process. Technol. 2011, 92, 266–270. [Google Scholar] [CrossRef]
- Zuo, S.; Yang, J.; Liu, J.; Cai, X. Significance of the carbonization of volatile pyrolytic products on the properties of activated carbons from phosphoric acid activation of lignocellulosic material. Fuel Process. Technol. 2009, 90, 994–1001. [Google Scholar] [CrossRef]
- Wu, F.C.; Wu, P.H.; Tseng, R.L.; Juang, R.S. Preparation of activated carbons from unburnt coal in bottom ash with KOH activation for liquid-phase adsorption. J. Environ. Manag. 2010, 91, 1097–1102. [Google Scholar] [CrossRef]
- Jha, P. Biomass Characterisation and the Application of Biomass Char for Sorption of Phenol from Aqueous Solutions. Ph.D. Thesis, IIT, Delhi, India, 1996. [Google Scholar]
- Jha, P. Rice husk as an adsorbent for phenol removal. J. Sci. Nat. 2011, 2, 593–596. [Google Scholar]
- Chilton, N.; Jack, N.; Losso, N.; Wayne, E.; Marshall, R. Freundlich adsorption isotherm of agricultural by-product based powdered activated carbon in the geosmin water system. Bioresour. Technol. 2002, 85, 131–135. [Google Scholar]
- Weber, T.W.; Chakravorti, R.K. Pore and Solid diffusion models for the fixed-bed adsorbent. Aiche J. 1974, 2, 228–238. [Google Scholar] [CrossRef]
- Khalid, N.; Ahmad, S.; Toheed, A.; Ahmad, J. A Potential of Rice- Husks for Antimony Removal. Appl. Radiat. Isot. 2000, 52, 30–38. [Google Scholar] [CrossRef]
- Basha, S.; Murthy, Z.V.P.; Jha, B.K. Biosorption of hexavalent chromium by chemically modified seaweed. Cryptomeria indica. Chem. Eng. J. 2008, 137, 480–488. [Google Scholar] [CrossRef]
- Chiou, M.S.; Li, H.Y. Adsorption Behavior of Reactive Dye in Aqueous Solution on Chemical Cross-Linked Chitosan Beads. Chemosphere 2003, 50, 1095–1105. [Google Scholar] [CrossRef]
- Jha, P. Application of agro-residues based activated carbon as adsorbents for phenol sequestration from aqueous streams: A Review. In Re-Use and Recycling of Materials: Solid Waste Management and Water Treatment; Nzihou, A., Thomas, S., Kalarikkal, N., Jibin, K.P., Eds.; Rivers Publishers: Lange Geer, Denmark, 2019; pp. 189–213. [Google Scholar]
- Dass, B.; Jha, P. Batch adsorption of phenol by improved acacia nilotica branches char: Equilibrium, Kinetic and Thermodynamic studies. Int. J. ChemTech Res. 2015, 8, 269–279. [Google Scholar]
- Mahvi, A.H.; Maleki, A.; Eslami, A. Potential of Rice Husk and Rice Husk Ash for Phenol Removal in Aqueous Systems. Am. J. Appl. Sci. 2004, 1, 321–326. [Google Scholar] [CrossRef]
- Lorenzen, L.; Deventer, J.S.J.V.; Landi, W.M. Factors affecting the mechanism of the adsorption of arsenic species on activated carbon. Miner. Eng. 1995, 8, 557–569. [Google Scholar] [CrossRef]
- Kujawski, W.; Warszawski, A.; Ratajczak, W.; Porebski, T.; Capala, W.; Ostrowska, I. Removal of phenol from wastewater by different separation techniques. Desalination 2014, 163, 287–296. [Google Scholar] [CrossRef]
- Kiselev, A.; Magaril, E.; Magaril, R.; Panepinto, D.; Ravina, M.; Zanetti, M.R. Towards Circular Economy: Evaluation of Sewage Sludge Biogas Solutions. Resources 2019, 8, 91. [Google Scholar] [CrossRef] [Green Version]
Figure 1.
Selected biomasses for the adsorptive study: (a) ANB; (b) LC; and (c) RH.

Figure 2.
The percentage removal of phenol with the dosage of the selected biomasses.

Figure 3.
The effect of the dosage on the adsorption of phenol on activated biomasses.

Figure 4.
The effect of the agitation speed on the adsorption of phenol on selected biomasses.

Figure 5.
The effect of the contact time on the adsorption of phenol on activated biomasses.

Figure 6.
Adsorption isotherms of phenol on activated biomasses at 25 °C.


Table 1.
Values of the separation factor, RL.
| RL Value | Type of Process |
|---|---|
| RL = 0 | Irreversible |
| 0 < RL < 1 | Favorable |
| RL = 1 | Linear |
| RL > 1 | Unfavorable |
Table 2.
Analysis of biomasses.
| Biomass | FC (%) | Ash (%) | VM (%) | Bulk Density |
|---|---|---|---|---|
| ANB | 25.00 | 2.50 | 72.50 | 210.0 |
| Bagasse | 15.10 | 4.90 | 80.00 | 65.0 |
| Corn Cob | 19.01 | 2.00 | 78.99 | 170.0 |
| Cotton Stalk | 20.55 | 4.45 | 75.00 | 100.0 |
| GNS | 22.01 | 6.75 | 71.24 | 95.0 |
| LC | 23.50 | 12.30 | 64.20 | 250.0 |
| RH | 20.00 | 18.00 | 62.00 | 110.0 |
| Rice Straw | 15.33 | 20.66 | 64.01 | 60.0 |
| Saw Dust | 19.44 | 3.00 | 77.56 | 275.0 |
| Wheat Straw | 18.00 | 9.88 | 72.12 | 50.0 |
Table 3.
Characterization of selected biomasses as adsorbents.
| Properties | ANB | LC | RH |
|---|---|---|---|
| Ash Content on dry basis (%) | 2.50 | 12.30 | 18 |
| Fixed Carbon on dry basis (%) | 25.00 | 23.50 | 20 |
| Volatile Matter on dry basis (%) | 72.50 | 64.20 | 62 |
| Iodine Number | 485 | 70.0 | 10.1 |
| BET Surface Area (m2g−1) | 50 | 46.4 | 35.5 |
| Particle Size (µm) | 300 | 180 | 300 |
| Methylene Blue Adsorption (mg/g) | 40 | 5.8 | 0.45 |
Table 4.
Characterization of the selected biomasses after activation as adsorbents.
| Properties | ANBC | LCC | RHC |
|---|---|---|---|
| Ash Content on a dry basis (%) | 1.0 | 5.0 | 4.80 |
| Fixed Carbon on a dry basis (%) | 87.0 | 85.0 | 84.20 |
| Volatile Matter on a dry basis (%) | 12.0 | 10.0 | 11.00 |
| pH of slurry | 6.5 (1.2%) | 7.5 (1.0%) | 6.8 (1.1%) |
| Phenol Number (g) | 0.8 | 1.0 | - |
| Iodine Number | 870 | 325 | 750 |
| BET Surface Area (m2g−1) | 450 | 151 | 301 |
| Particle Size (µm) | 45 | 42.3 | 25.3 |
| Methylene Blue Adsorption (mg/g) | 155 | 50.1 | 55.5 |
Table 5.
Isotherm constants of activated biomasses as adsorbents for phenol.
| Equilibrium Constants | ANBC | LCC | RHC |
|---|---|---|---|
| Langmuir | |||
| Q0 (mg/g) | - | 16.49 | 135.13 |
| b (L/mg) | - | 13.95 | 0.007 |
| RL | 0.067 | 1.0 | - |
| R2 | - | 0.95 | 0.88 |
| Freundlich | |||
| k | - | 0.31 | 13.52 |
| n | - | 0.84 | 3.06 |
| R2 | - | 0.90 | 0.95 |
| Temkin | |||
| A (L/g) | 0.001 | - | 0.05 |
| b 1(J mol−1) | 0.82 | - | 76 |
| R2 | 0.99 | - | 0.90 |
Table 6.
Kinetic constants of activated biomasses as adsorbents for phenol.
| Kinetic Constants | ANBC | LCC | RHC |
|---|---|---|---|
| First order kinetics | |||
| qe (mg/g) | 68.93 | 85.43 | 78.72 |
| k1 | 0.015 | 0.012 | 0.009 |
| R2 | 0.93 | 0.94 | 0.96 |
| Second order kinetics | |||
| qe (mg/g) | 90.91 | 103.09 | - |
| h (mg/g min) | 2.50 | 1.84 | - |
| R2 | 0.98 | 0.99 | - |
© 2019 by the author. Licensee MDPI, Basel, Switzerland. This article is an open access article distributed under the terms and conditions of the Creative Commons Attribution (CC BY) license (http://creativecommons.org/licenses/by/4.0/).
Share and Cite
MDPI and ACS Style
Jha, P. Adsorptive Findings on Selected Biomasses for Removal of Phenol from Aqueous Solutions. Resources 2019, 8, 180. https://0-doi-org.brum.beds.ac.uk/10.3390/resources8040180
AMA Style
Jha P. Adsorptive Findings on Selected Biomasses for Removal of Phenol from Aqueous Solutions. Resources. 2019; 8(4):180. https://0-doi-org.brum.beds.ac.uk/10.3390/resources8040180
Chicago/Turabian StyleJha, Pushpa. 2019. "Adsorptive Findings on Selected Biomasses for Removal of Phenol from Aqueous Solutions" Resources 8, no. 4: 180. https://0-doi-org.brum.beds.ac.uk/10.3390/resources8040180
Note that from the first issue of 2016, this journal uses article numbers instead of page numbers. See further details here.