Article

Pension Fund Management, Investment Performance, and Herding in the Context of Regulatory Changes: New Evidence from the Polish Pension System

by
Łukasz Dopierała
* and
Magdalena Mosionek-Schweda
Department of International Business, Faculty of Economics, University of Gdansk, Armii Krajowej 119/121, 81-824 Sopot, Poland
*
Author to whom correspondence should be addressed.
Submission received: 21 November 2020 / Revised: 6 December 2020 / Accepted: 11 December 2020 / Published: 29 December 2020

Abstract

:
The aim of this paper is to assess the impact of reforms introduced in the operation of Polish open pension funds on management style, risk exposure and related investment performance. The article analyzes the impact of the reformed regulations on the herd behavior of fund managers. In particular, we examined whether the elimination of the internal benchmark for fund evaluation impacts the elimination or reduction of herd behavior. We proposed a multi-factor market model to evaluate the performance of funds investing in various types of instruments. Moreover, we used panel estimation to directly take into account the impact of the internal benchmark on herd behavior. Our results indicate that highly regulated funds may slightly outperform passive benchmarks and their unregulated competitors. In the case of Polish open pension funds, limiting investments in Treasury debt instruments clearly resulted in increased risk and volatility of returns. However, it also raised competition between funds and decreased the herd behavior. Additionally, the withdrawal of the mechanism evaluating funds based on the internal benchmark was also important in reducing herd behavior.

1. Introduction

Population ageing, which is progressing in most developed countries, has made the issue of securing future income in old age a highly topical issue for research. The Polish pension system was transformed in 1999, in accordance with a concept proposed by the World Bank, into a three-pillar system that, in addition to the pay-as-you-go pillar, also introduced two capital pillars—one mandatory and one voluntary. Similar changes in the construction of pension systems have been introduced in most CEE countries. However, the 2007/2008 Global Financial Crisis revealed problems related to the operation of the capital part of pension systems in most countries. These problems were primarily related to the high cost of the mandatory second pillar, from the perspective of both government budgets and pensioners. Consequently, a majority of countries decided to introduce changes in the regulation of pension systems (Bielawska et al. 2017).
In the case of Poland, particularly important transformations affected open pension funds (OPFs), which were an essential part of the capital pillar of the pension system. Based on the solutions implemented in the pension systems of South American countries, the Polish second pillar was initially intended not only to accumulate pension savings but also to stimulate the development of the domestic capital market. Thus, the first regulations reforming the pension system in Poland and introducing a capital pillar were to encourage financial institutions to establish OPFs, which in turn were to invest the accumulated pension contributions in the domestic financial market. In the course of the OPFs’ operation, the existing regulations have had a negative impact not only on the costs of system operation but also on the behavior of fund managers. These were mainly the lack of competition between funds and strong herd behavior.
Fundamental changes in the operation of OPFs were introduced in 2014. They included, inter alia, the reduction of assets accumulated in pension funds by transferring some to the pay-as-you-go system (operated by ZUS, the Social Insurance Institution). Additionally, the amount of the pension contribution transferred to the pension funds was reduced, and the possibility of withdrawing from the second pillar was introduced. From the perspective of the management of OPF assets, the key changes were those concerning investment limits, which consisted, among other things, of the prohibition to invest in debt instruments issued by the Polish government. Additionally, the application of the internal benchmark in the form of the minimum required rate of return to assess the effectiveness of OPFs was abolished and replaced with external benchmarks (Rutecka 2014). A goal of the introduced changes was to mobilize OPF managers to a more active investment policy and minimize the negative effects of the oligopolistic market structure, such as herd behavior, which had been previously documented in the case of these funds (Chybalski 2012; Kominek 2012).
The aim of this paper is to assess the impact of reforms made in the operation of pension funds on the management style, risk exposure and related investment performance. It also analyzes the impact of the introduced regulations on the occurrence of herd behavior among fund managers.
The main scientific contribution of the paper is the use of multi-factor market models to assess the impact of regulatory changes on the construction of investment portfolios by fund managers and the investment results achieved by them. An added value of the research is a long-term comparison of the results of funds operating under the second and third pension pillars, and assessment of the impact of regulatory changes on the herd behavior of fund managers.
The article proposes a multi-factor market model used to evaluate the performance of funds investing in various types of instruments. Additionally, the model used by Kominek (2012) to assess the impact of regulation on herd behavior was developed.
This paper is organized as follows. The next section provides a background on Polish pension fund operations and regulatory changes in the Polish pension system affecting the operation of pension funds. The following section presents an overview of the empirical literature on pension fund management and performance, with a particular focus on OPFs. The section after describes the research methodology in detail, including data collection, the construction of variables and the estimation technique. The results and discussion are presented last, as well as some conclusions.

2. Background on Polish Pension Funds and Regulatory Changes

The pension system operating in Poland until the end of 1998 were commonly criticized as costly, non-transparent and unfair. This was a pay-as-you-go system operated by a state-owned institution, ZUS. ZUS was the sole entity responsible for providing Polish citizens with retirement income. The large and constantly growing expenditure on pension benefits was not accompanied by insured people’s belief that the benefit level was satisfactory. As a result of constantly changing rules to determine someone’s right to old-age pensions, the unclear criteria for granting them and the lack of a discernible relationship between the benefit received and the size of the contribution to the system, participants became convinced that the pension system was a product of arbitrary decisions by state bodies, often made under pressure from short-term economic necessities. Introducing further ad hoc changes did not bring the expected results, and a profound reform of the entire system became necessary (Superintendency of Pension Funds 2000). Its implementation began on 1 January 1999. The new system was based on three pillars, according to the World Bank classification (Holzmann and Hinz 2005). The first is the pay-as-you-go pillar, managed by ZUS, and obligatory for insured persons. The second pillar includes the Common Pension Societies (CPS) responsible for the creation and management of OPFs. Participation in this pillar was obligatory until the end of June 2014. The third voluntary pillar aims to supplement retirement income from the two compulsory pillars. In a narrow sense, it includes forms of voluntary saving sanctioned by law, such as individual retirement accounts (IRA), individual pension security accounts (IPSA) and employee pension schemes (EPS).
As a result of the reform, one of the key changes in the pay-as-you-go system was the admission of private institutions. New entities responsible for the capital pillars of the system appeared in the Polish financial market. Second, responsibility for pensions was partially transferred from the state to employees and employers, who have since become active participants in the system.
Over the two decades since the pension system reform in Poland, the rules of its operation have changed many times, which have affected key aspects of the operation of pension funds. A list of most important changes is presented in Table A1 (Appendix A). Among the changes, one of the most important changes for pension fund operation was the change in distribution of the pension contribution. In 2011, due to a lack of funds in the Social Insurance Fund (which is part of the pay-as-you-go pillar managed by ZUS) and growing public debt, the government decided to reduce the part of the contribution transferred to OPFs by five percentage points (from 7.3% to 2.3%). This level of contribution was to be maintained for 2 years (2011–2012) and then to gradually increase, and stabilize at 3.5% in 2017. However, the reform implemented in 2014 and the abolition of the obligatory payment of contributions to OPFs disrupted the planned changes in the distribution of contributions. Ultimately, for the insured who decided to stay in pension funds, 2.92% of remuneration was transferred to the fund (Adamska-Mieruszewska and Mosionek-Schweda 2015). One of the key changes to pension fund investment activity introduced in 2014 was the elimination of the minimum 36-month weight average rate of return, which the funds had to achieve, and the mechanism of compensating for the shortage by the pension fund society. Despite this change, the values of the units of account for each fund are still determined daily. The weighted average rates of return of OPFs are also still published by the Polish Financial Supervision Authority. However, instead of the minimum guaranteed rate of return, the so-called periodic and periodic comparative rate of return are calculated and published. One may assume that the elimination of the primary and mandatory internal benchmark for funds could have changed OPF investment strategies.
The only purpose of operation of pension funds is to collect and invest pension contributions from members for the purpose of paying out future retirement benefits. The legislator imposes restrictions on the investment directions of the OPF assets, sets limits on the concentration of a given type of investment in the portfolio, and limits for the concentration of pension fund assets in one economic entity or group of subsidiaries. Moreover, financial instruments that may be the subject of the fund’s investments are strictly defined. The percentage share of investments in individual categories is determined by the Council of Ministers in its regulations. In the period analyzed, key changes were also made to the OPFs’ investment policies (see Table 1). The regulations in force until the end of January 2014 did not impose any restrictions on investments in debt instruments issued or guaranteed by the State Treasury and the National Bank of Poland (NBP). Other types of instruments were subject to restrictions. On 1 February 2014, there was a radical change in the provisions regulating the investment policy of pension funds in the field of investment limits. There was a ban on investing OPF assets in Treasury instruments and a minimum limit of the share of shares in assets was set at 75%, the latter of which was in force until 31 December 2014, and reduced in subsequent years.
Significant changes also concerned the limits of OPF investments in foreign instruments. Until the end of 2013, there was a limit of 5% of the fund’s assets for this type of investment. In 2014, this limit was raised to 10% and increased by 10 percentage points in subsequent years, reaching 30% in 2016.
Investment activity is the most important task entrusted by the legislator to pension funds, because the success of the reformed system depends on its results, as well as the financial security of future pensioners. The investment decisions of persons managing the assets of OPFs are determined mainly by the above-mentioned legal restrictions, but also by the condition of the Polish financial market, where bonds and Treasury bills dominate. From the beginning of the OPFs’ operation, these instruments have been the basic and dominant category of investments in the investment portfolios of funds. In the years 1999–2013, Treasury debt instruments accounted for 60% to 70% of pension fund portfolios (Figure 1). The greatest involvement of OPFs in these instruments was observed in 2000–2002 and 2008–2009. In the first period, this resulted from high interest rates and a large supply of these securities, as well as the bear market on the Warsaw Stock Exchange since the first half of 2000. In turn, the record share of Treasury securities in OPFs portfolios recorded in 2008 resulted from the global financial crisis, which also affected the Polish capital market. On 3 February 2014, OPFs radically changed their risk profile. So far, when compared with stable growth investment funds, OPFs have become equity–profile funds, associated with a significant increase in exposure to market risk. The transfer of assets to the Social Insurance Institution and the de facto reduction of the debt part of the portfolio to corporate and local government bonds resulted in a complete reversal of the proportion in OPF portfolios (Urząd Komisji Nadzoru Finansowego 2014). Since then, the dominant category of instruments in OPF portfolios have been shares listed on the regulated market (Figure 1). The legislator, implementing the changes, provided for a period for adjusting OPF portfolios to the new investment limits. Until 4 February 2016, pension funds could have Treasury securities in their assets purchased before this day (Urząd Komisji Nadzoru Finansowego 2017).
The remaining categories of permitted investments constituted a marginal part of the funds’ portfolios throughout the analyzed period; therefore, their impact on the results was minimal. The presence of these elements in OPF portfolios has a variety of purposes and causes. OPFs use bank securities and deposits mainly to maintain the necessary liquidity. The appearance of investment certificates, mortgage bonds or non-Treasury debt instruments in the portfolios of funds can be read as OPFs’ readiness for greater financial involvement in this type of investments.
In the analyzed period, the Polish pension system also includes employee pension funds (EPFs). EPFs are a form of EPS, and are managed by employee pension societies. This is a specific form of EPS because, in this case, the employer (or employers) creates both the fund and the pension society managing it. The rules of operation of EPFs are largely similar to the operation of OPFs, as their main activity is to collect contributions from program participants and allocate them for payment to fund members after they reach retirement age. The main difference between EPFs and OPFs is that the Employee Pension Society, which manages the employee fund, is a non-profit institution, while the Common Pension Society manages the open pension fund for a fee. A detailed description of employee pension programs and EPFs can be found in Sierocka (2010), Dybał (2018) and Szczepański and Brzęczek (2016).
In the analyzed period, the structure of EPF investment portfolios differs from the structure of the OPFs presented above. In the years 2002–2012, participation units of specialized investment funds dominated in EPF investments (included in ‘other investments’ in Figure 2). Since 2013, the main investment category of EPFs has been Treasury bonds (these funds are not prohibited from investing in this type of instrument), followed by shares of companies listed on the regulated market.
In Poland, there are also individual ways to collect pension savings under the third pillar. These are IRA and IPSA, which give a wide spectrum of investment possibilities. Participants can choose from a variety of instruments, depending on their risk tolerance, financial knowledge and available time for pension asset management. IRA and IPSA can be conducted by five types of institution: mutual funds, brokerage firms, insurance companies, banks, and voluntary pension funds. An important aspect of IRA and IPSA are tax privileges. The largest parts of pension assets at IRA and IPSA are managed by mutual funds and insurance companies. Although the aforementioned legal regulations related to the investment activities of pension funds do not apply to mutual funds operating under IRA and IPSA, we compared the effectiveness of these forms of pension security. We examine whether pension funds that operate under strict investment limits can be as effective as mutual funds investing without such limitations.

3. Literature Review

The literature devoted to the performance of pension funds is very extensive as the topic is of extreme social and economic importance. The numerous studies analyze the investment results and efficiency of pension funds operating all over the world, cover various research periods, and use various research methods. It is not possible to cover all directions of research on the operation and performance of pension funds here, and neither is it necessary. We present the most important works that focus on the effectiveness of Polish pension funds.
Regarding the performance of capital parts of the pension system, most publications focus on pension funds belonging to the second pillar. Bohl et al. (2011) compare the performance of Polish and Hungarian pension funds, taking into consideration investment limits and performance regulations. The authors use performance measures such as the Sharpe ratio, Treynor ratio, and Jensen’s alpha. According to their findings, there are differences in the performance of pension funds in the analyzed countries; for example, the Hungarian funds showed strong underperformance. Witkowska and Kompa (2015) examine the performance of Polish OPFs using measures of risk and investment efficiency (Sharpe ratio, Treynor ratio and Sortino ratio). The authors reveal that from pensioners’ perspectives, pension funds obtained better results than the indexation of ZUS (responsible for pension benefits under the first pillar). Similar analyses using the same performance measures can be found in the works of Mikulec (2004) and Ważna (2017). Karpio and Żebrowska-Suchodolska (2014) conducted a comparative analysis of OPFs and open-end stable growth mutual funds; they conclude that the investments of those entities are quite similar. In their later research, Karpio and Żebrowska-Suchodolska (2017) confirm previously obtained results using different performance measures (Information ratio and Sharpe–Israelsen ratio).
Witkowska (2017) examines how changes in pension fund regulations affected investment performance. Her findings prove that all considered changes resulted in an increased risk to pension fund investment portfolios, which was not reflected in the increase in the rates of return on these portfolios. One newer study (Kurach 2019) employs the Performance Change Measurement approach to the question of OPF investment outcomes. The author does not find any convincing proof of superior portfolio performance under the new regulatory framework. However, the relatively short period of analysis is a significant limitation to this research. In turn, preliminary research conducted by Dopierała et al. (2019) suggests that OPFs achieved higher investment efficiency (measured by the Sharpe ratio) than mixed assets and equity mutual funds available under the IRA and IPSA, especially after 2013.
The results of studies on the performance of Polish pension funds are often inconsistent. These differences may result mostly from the methodology used and the period of analysis. Our research contributes to the existing literature by analyzing the phenomena of Polish pension funds’ performance and risk exposure by using the multi-factor market model that, to the best of our knowledge, has received scant attention elsewhere.
We also focused on the phenomenon of ‘herd behavior’, which has been the subject of much research since the early 1990s. The most famous study describing the essence of herd behavior and the measurement of herding was conducted by Lakonishok et al. (1992). Herd behavior means that investors imitate each other in terms of their investment strategies. A result of this is that their investment portfolios have similar structures and achieve similar returns. Herd behavior in the case of institutional investors (such as mutual funds, pension funds, etc.) results in a lack of competition in terms of obtained investment results. According to the authors, there are several reasons why herd behavior is more common among institutional investors than individual investors, including that institutional investors have better access to information about competitors’ strategies and react to the same external market signals. Additionally, managers are evaluated against each other; to avoid falling behind a peer group by following a unique investment strategy, they are more likely to build an investment portfolio similar to that of their competitors (Lakonishok et al. 1992). The authors analyzed herd behavior among fund managers using the example of US 769 tax-exempt equity funds, including pension funds. They also proposed a herding measure that estimates herding as a degree of correlated trading among investors. Their findings, however, do not provide strong evidence that funds herd.
The Lakonishok–Shleifer–Vishny measure (LSV) is a widely used herding measure in the finance literature for analyzing the propensity of different types of investors from different countries to engage in herd behavior. Grinblatt et al. (1995) analyzed US mutual funds investing in stocks, while Lobão and Serra (2007) chose the same entities in the Portuguese market. Choe et al. (1999) focused on foreign investors on the Korea Stock Exchange, Kyrolainen and Perttunen (2003) inspected passive investors on the Helsinki Stock Exchange in Finland, and Zhu et al. (2020) examined the effect of institutional herding on the stock market in China. Frey et al. (2007) developed the LSV measure to analyze herd behavior in the German mutual fund market. The authors argued that using traditional herding statistics to measure herding may produce results that are difficult to interpret and therefore lead to false conclusions. Thus, based on a simple model of trading, they proposed a new, alternative model. The Frey–Herbst–Walter approach was, in turn, used by Mohamed et al. (2012) and Merli and Roger (2013) to analyze herding among French investors. However, the first authors used a sample of French mutual funds while the latter conducted research on a group of individual investors. The research mentioned is focused on institutional herding in stock markets. On the other hand, Oehler and Chao (2000) focused on herd behavior in the bond market. They analyzed the German bond market using data from 57 German mutual funds that invest mainly in bonds. The results revealed strong evidence of herding in the bond market; however, this is weaker than in stock markets.
Some studies also analyze the herd behavior of pension funds using the LSV measure. Blake et al. (2017) used monthly observations on 189 UK defined-benefit pension funds between January 1987 and December 2012. Their results revealed that pension funds show strong herding behavior and tend to herd in subgroups defined by fund size and sponsor type. Voronkova and Bohl (2005) analyzed pension funds in Poland (17 funds for the 4-year period from 1999 to 2002) and found strong evidence of herd behavior. Moreover, they stated that Polish pension funds tend towards herd behavior more than pension funds in other markets due to stringent legal regulations on investments and a relatively small number of OPFs, and thus high market concentration. The herd behavior of Polish pension funds was also analyzed by Marcinkiewicz (2015). The author’s motivation to conduct such an analysis was the legislative changes introduced in 2014 on the functioning of OPFs. The research method she uses is cluster analysis, which is one of the methods of multivariate statistical analysis. The results showed that after the period of changes in OPF legal regulations, OPF behavior became even more herd-like than before the changes. Chybalski (2007) also applied cluster analysis to assess the phenomenon of herd behavior among Polish pension funds. However, he analyzed similarities between OPF portfolios in the period 2003–2006. The main conclusion of his research was that OPFs are a very homogenous group. This may result from the funds avoiding the risk of non-compliance with the minimum rate of return condition. A similar conclusion—that regulations related to the performance of Polish OPFs may cause herding—was reached by Kominek (2012). The author analyzed pension funds between 2002 and 2005. His findings confirmed that the herd behavior of OPFs occurs despite the lack of an economically significant link between fund performance and the flow of new capital or members. The author states that the legal rules of the minimum required rate of return forces mutual imitation of OPF strategies. Gökçen and Yalçin (2015) developed a model proposed by Kominek (2012), considering that the pension fund manager pays a penalty for underperforming relative to the weighted average of all funds, and used it for Turkish pension funds. The results confirmed herding among these entities.

4. Material and Methods

In this article, we used three sources of data. To identify the structure of investment portfolios of OPFs, we collected information from the Polish Financial Supervision Authority website (Polish Financial Supervision Authority 2020), while other financial data were obtained from the Refinitiv database and the online data library of Adam Zaremba (Zaremba 2020).
In the analysis of investment performance and management of group portfolios, our sample covered 69 funds, which consisted of 15 OPFs, 5 EPFs, 30 open-end mixed asset funds available under IRA and IPSA, and 19 open-end equity funds available under IRA and IPSA. To conduct the financial analysis, we used monthly valuations of fund participation units (including management fees) from January 2007 to June 2018. Our data were not affected by survivorship bias as our sample includes funds that have ceased operating. Based on these data points, we constructed monthly continuously compounded returns for equal-weighted portfolios, to estimate group performance. The equal-weighted portfolio return is expressed in the following way (Hoepner and Schopohl 2018; Dopierała et al. 2020):
r e w , t = ln [ 1 k i = 1 k P i , t P i , t 1 ] ,
where r e w , t is the equal-weighted, continuously compounded portfolio return over month t, P i , t is the value of the participation unit of the fund i at the end of the month t, P i , t 1 is that fund’s participation unit value at the end of the month t 1 , and the total number of funds in the portfolio equals k.
In the next part of our research, we applied a market model to examine investment performance and portfolio management. We developed the six-factor model (Fama and French 2018) by adding factors that capture the portfolios’ exposure to fixed income markets and global stock markets. Our model is expressed in the following way:
r i , t r f , t = α i + β W I G , i ( W I G t r f , t ) +   β S M B , i S M B t + β H M L , i H M L t + β R M W , i R M W t + β C M A , i C M A t   + β U M D , i U M D t + β G L O B , i G L O B t + β B O N D , i ( B O N D t r f , t ) + β S P R E A D , i S P R E A D t + β C R P B , i C R P B t + e i , t
where r i , t is the return on the portfolio i over month t, r f , t represents the risk-free return over month t, W I G t is the return on the Polish stock market index WIG over month t, α i is the Jensens’s alpha representing the abnormal return of portfolio i, β W I G , i is the market beta of portfolio i capturing the systematic risk exposure of this portfolio, β S M B , i , β H M L , i , β R M W , i , β C M A , i , β U M D , i , β G L O B , i , β B O N D , i , β S P R E A D , i , β C R P B , i are the additional parameters estimated in the model. In this model S M B t (small minus big) represents the firm size factor, H M L t (high minus low) represents the firm value factor, R M W t (robust minus weak) represents the profitability factor, C M A t (conservative minus aggressive) represents the investment factor and U M D t (up minus down) expresses the momentum factor. The factor values for the Polish market were downloaded from Adam Zaremba’s website (Zaremba 2020), which also includes a detailed description of the calculation procedure of each. Further, in the above model G L O B t represents the exposure of the portfolio on global stock markets and was calculated as the difference between the rate of return of the WIG index and the rate of return of the MSCI ACWI index, B O N D t expresses the portfolio exposure on the Polish government bond market and was calculated as the monthly yield of Polish ten-year government bond, S P R E A D t represents the portfolio exposure on bond time spread and was calculated as difference between the monthly yield of Polish 2-year government bond and the monthly yield of Polish 10-year government bond, C R P B t captures the portfolio exposure on the Polish corporate bond market and was calculated as the difference between the rate of return of Morningstar Poland Corporate Bond Index and the rate of return of WIG index, finally e i , t is the independent disturbance term. We adopted the 3-month Warsaw Interbank Offered Rate (WIBOR) as a risk-free rate on the Polish market using the method proposed by Hoepner and Schopohl (2018). All returns and yields were calculated as continuously compounded.
For detailed analysis and robustness check, we also applied the above model to the individual assessment of portfolio management and investment performance of 12 OPFs that operated throughout the 2007–2018 period.
We also analyzed the impact of regulatory changes on OPF herd behavior. In particular, we checked whether the elimination of the internal benchmark from fund evaluation has an impact on the elimination or reduction of herd behavior. For this purpose, we used the model proposed by Kominek (2012), which we modified to directly take into account the impact of the internal benchmark. Our model took the following form:
w i , t w i , t 1 = α i + γ 1 ( w i , t 1 w a v g , t 1 ) +   γ 2 ( r 36 M , i , t 1 r 36 M , a v g , t 1 ) + k = 1 n φ k R k , t 1 + e i , t ,
where w i , t is the weight of a given asset class in OPF i’s portfolio in the end of month t, w a v g , t 1 is the average weight of the asset class among all OPFs in the end of month t − 1, r 36 M , i , t 1 express the 36-month return of OPF i in the end of month t − 1, r 36 M , a v g , t 1 represents the 36-month weight average return of all OPFs in the end of month t − 1, R k , t 1 is a vector of control benchmark returns over the month t − 1. In the above model the γ 1 is a general parameter capturing dependence of change of the asset allocation on lagged distance of the fund’s and the average portfolio weights. The γ 2 is a parameter capture dependence of change of the asset allocation on the deviation of the fund’s return from the internal benchmark at the end of month t − 1. If there is herd behavior between funds, negative and statistically significant values of the parameter γ 1 are expected. Moreover, if herd behavior depends on the deviation of the funds’ return from the internal benchmark, the parameter γ 2 will be negative and statistically significant. If the changes in the fund portfolios were influenced by the rate of return of the control benchmark k, the parameter φ k will be significantly different from zero.
Based on the data we had for the years 2007–2018, we created two panels. The first one included data for 11 OPFs between 2010 and 2013, and the second the data for OPFs between 2014 and 2018. For each asset class, we estimated fixed-effect models as well as random-effect models.

5. Results and Discussion

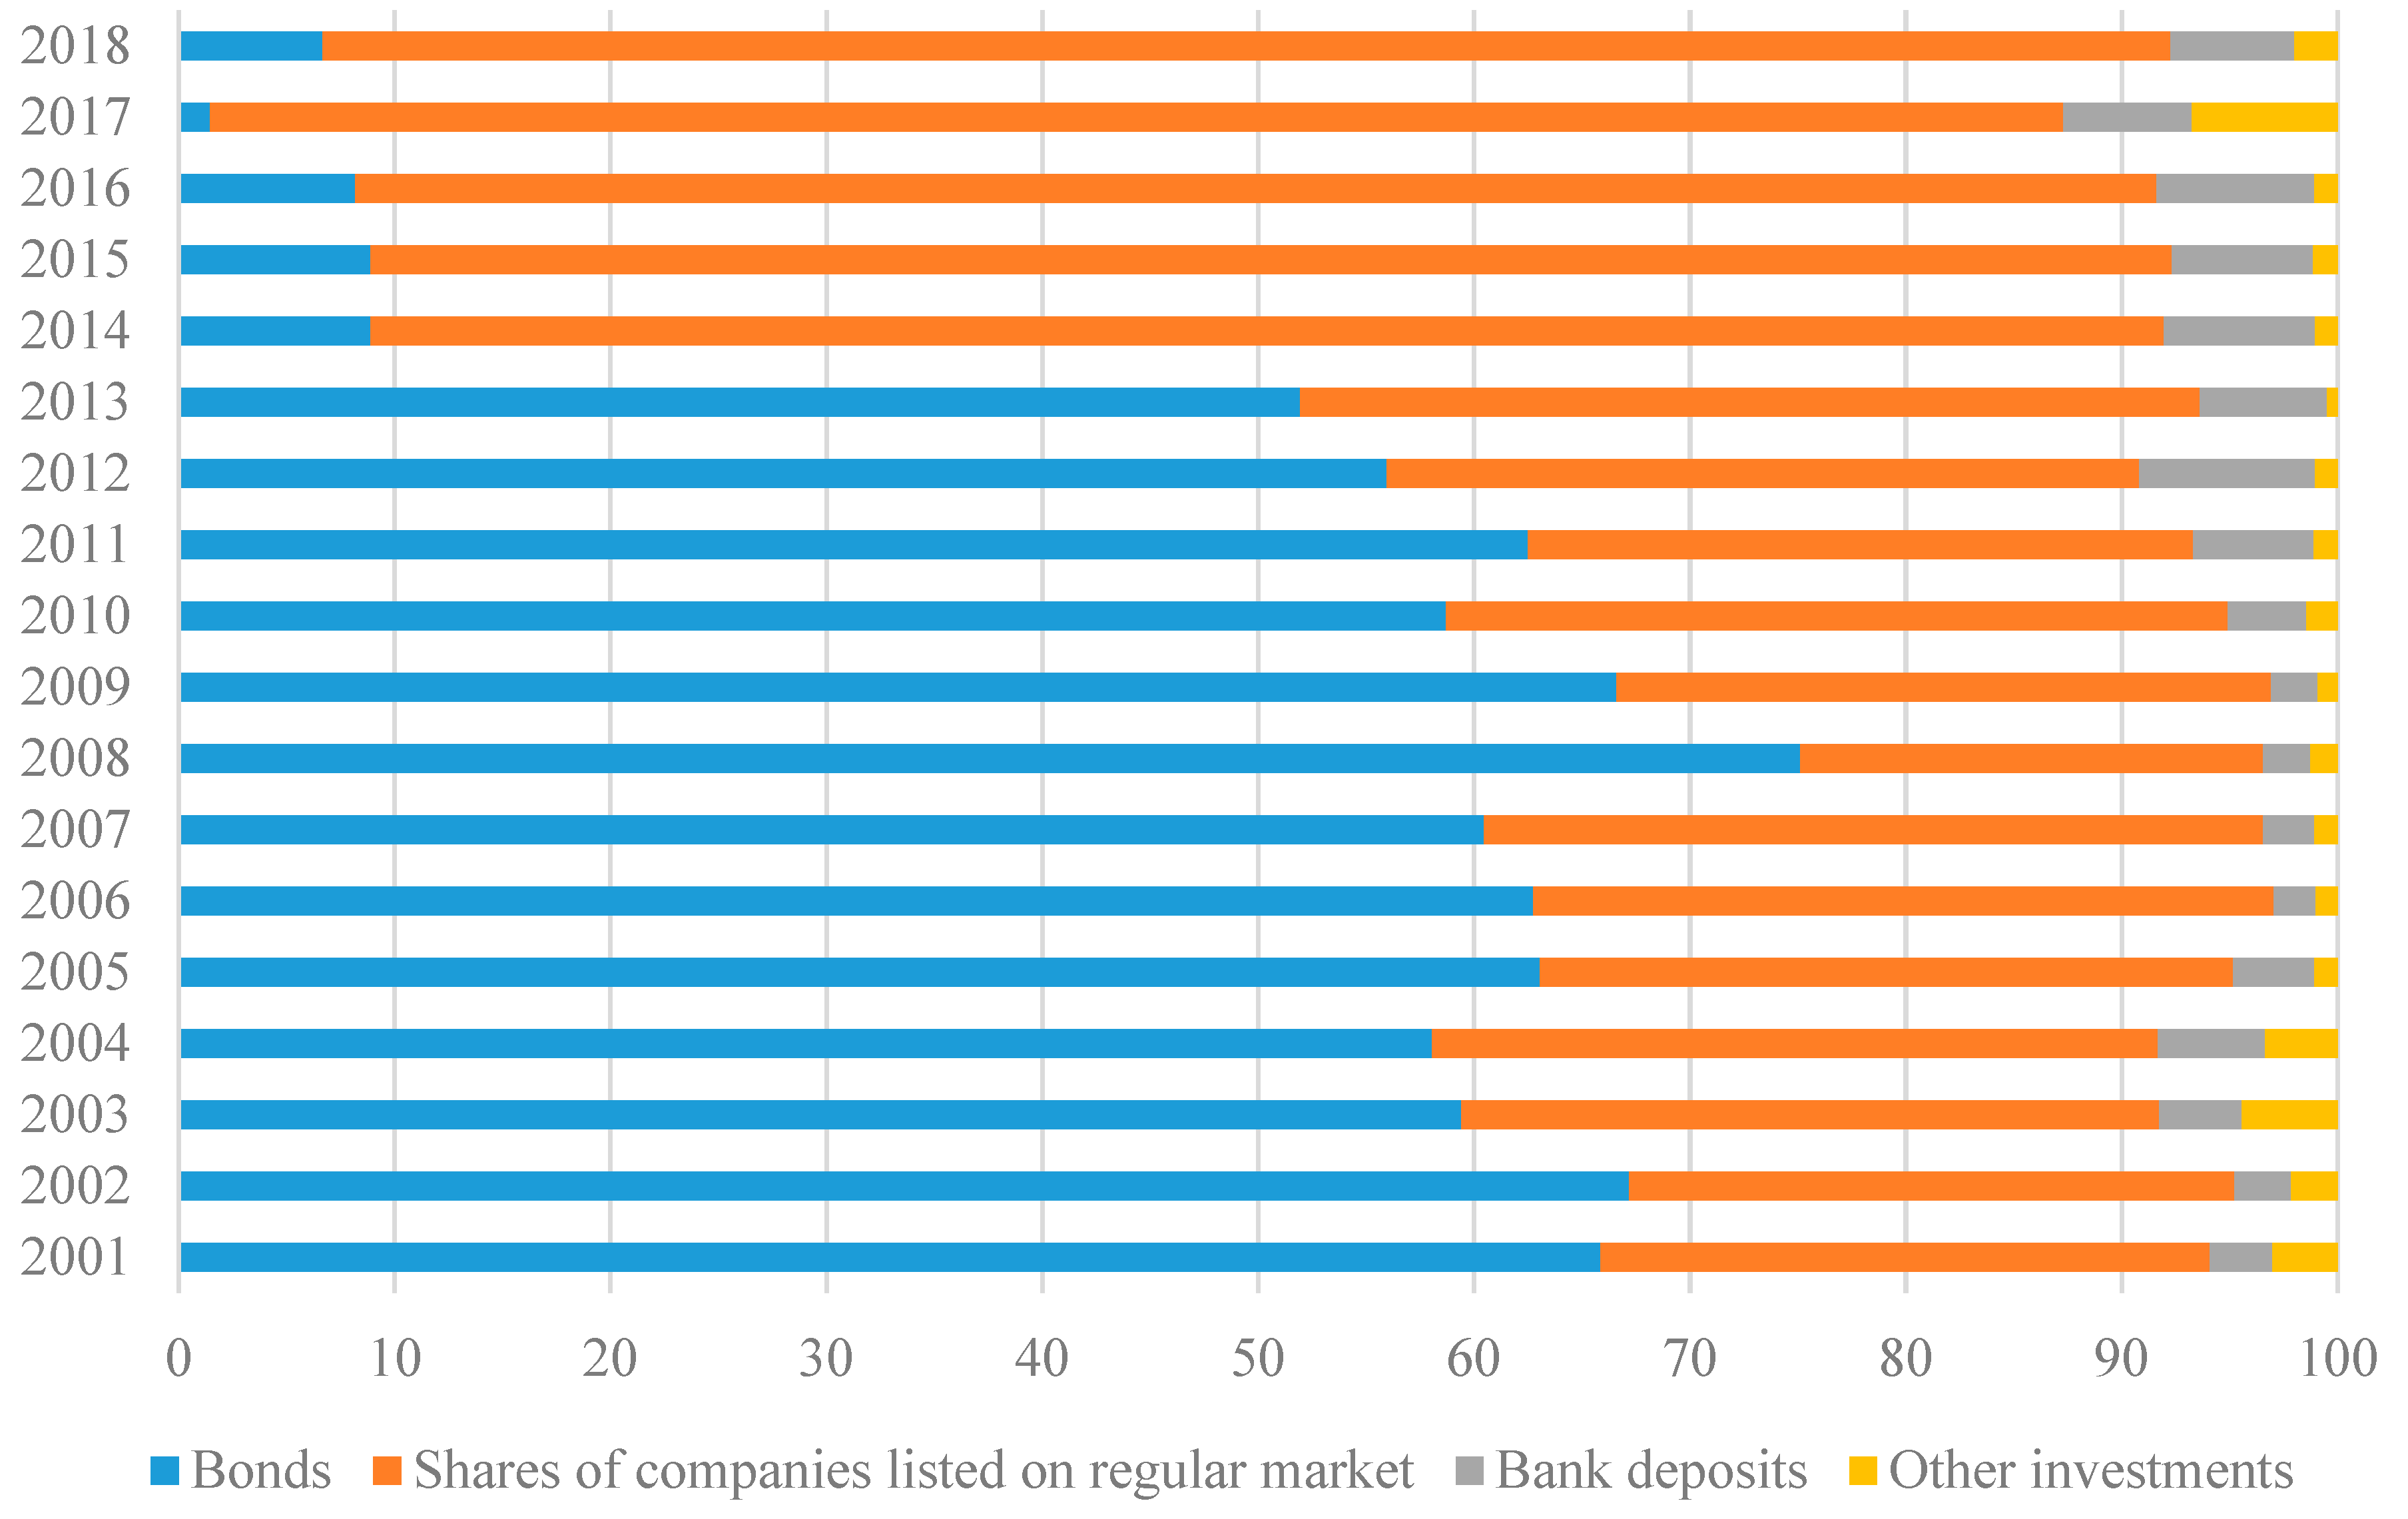
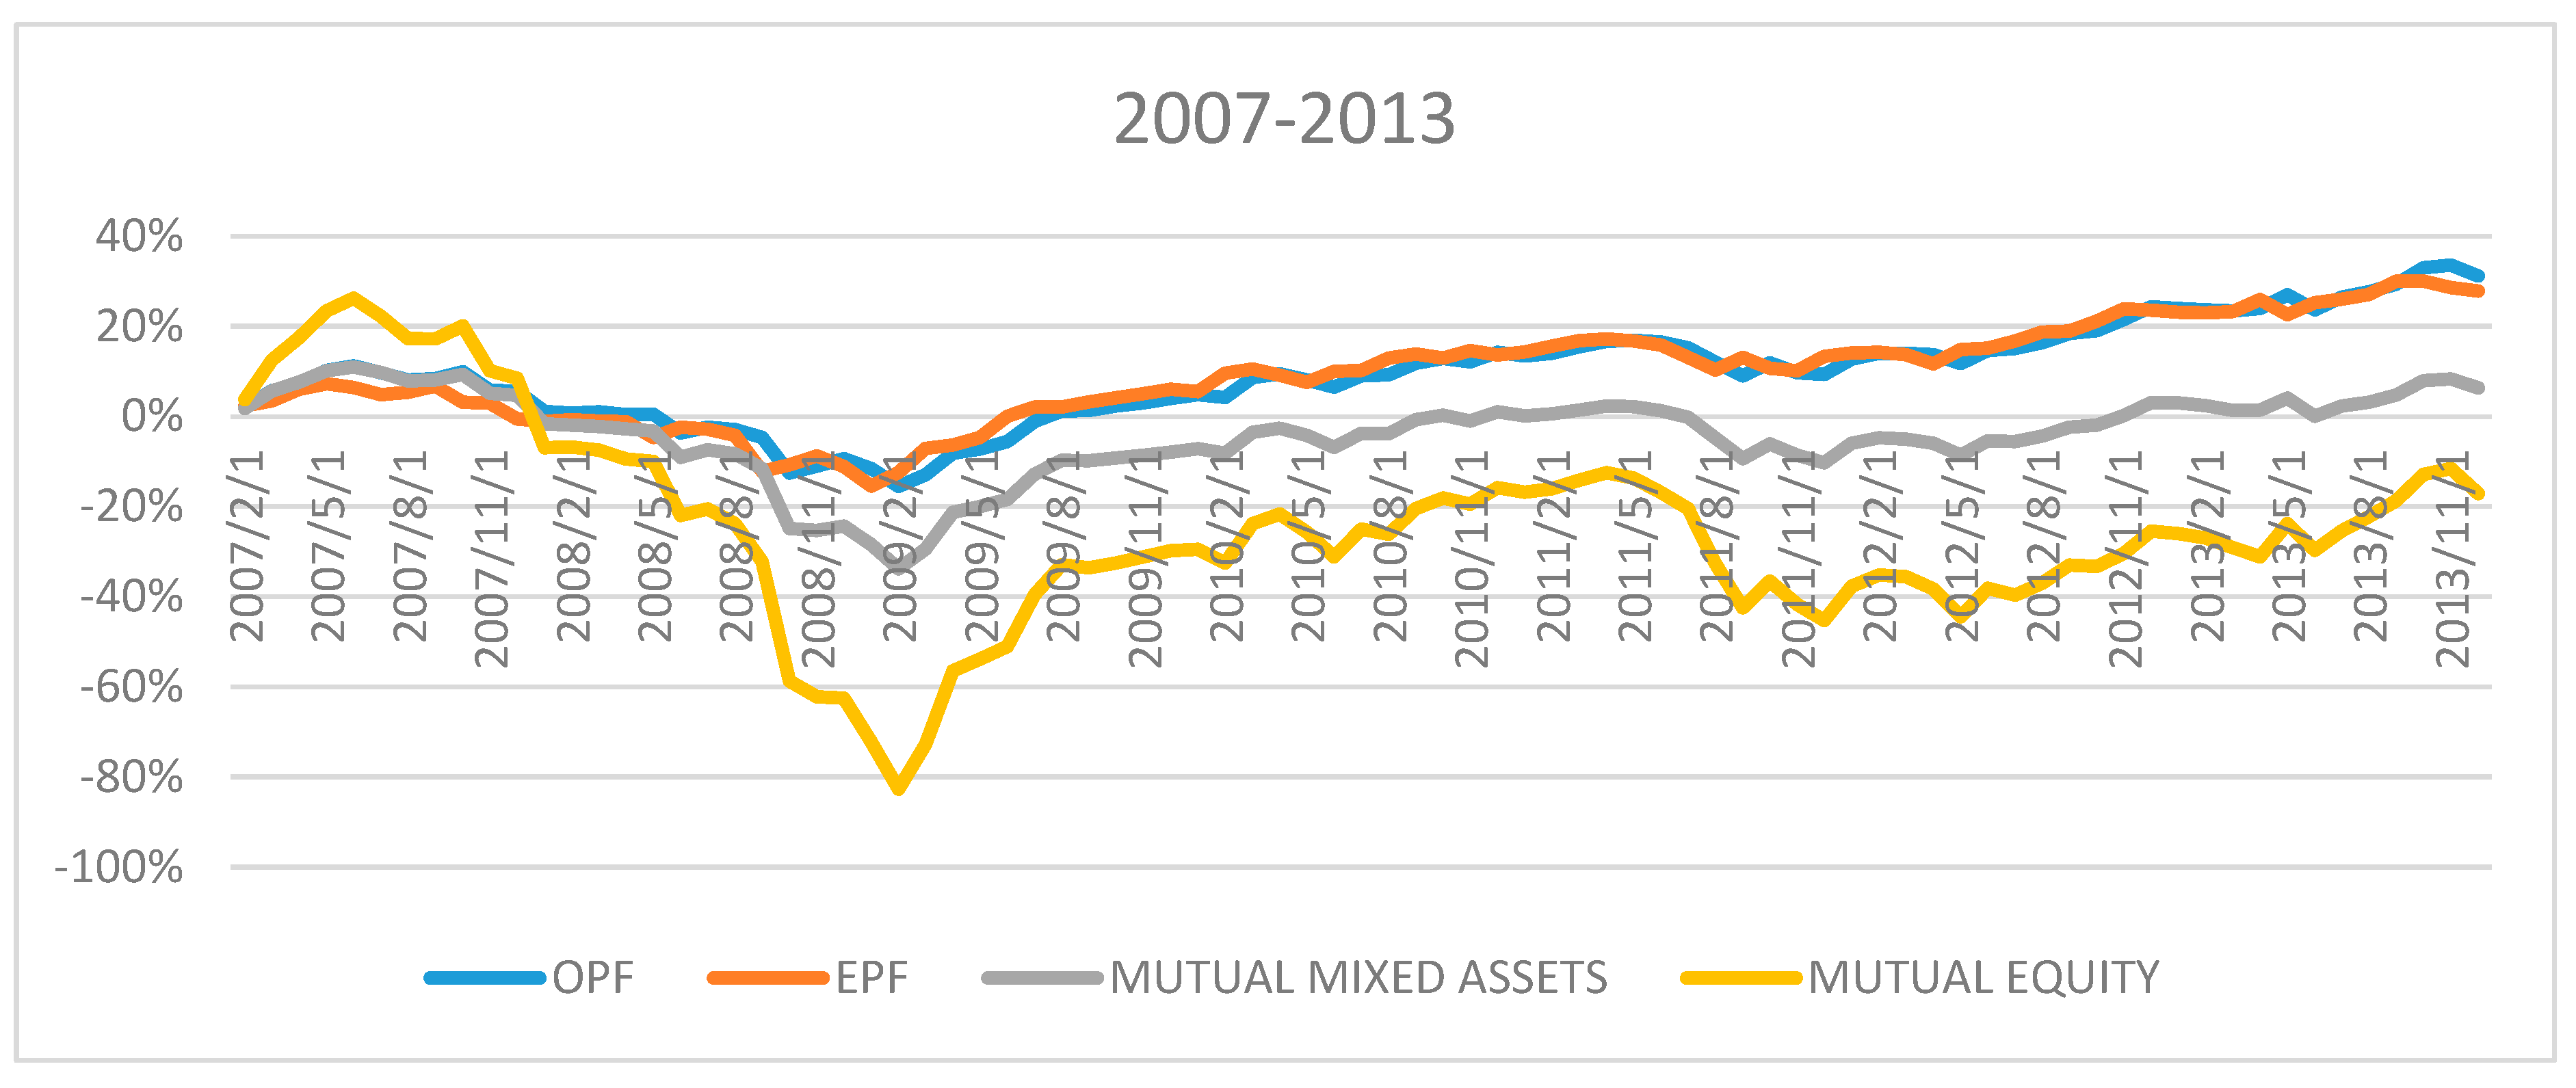
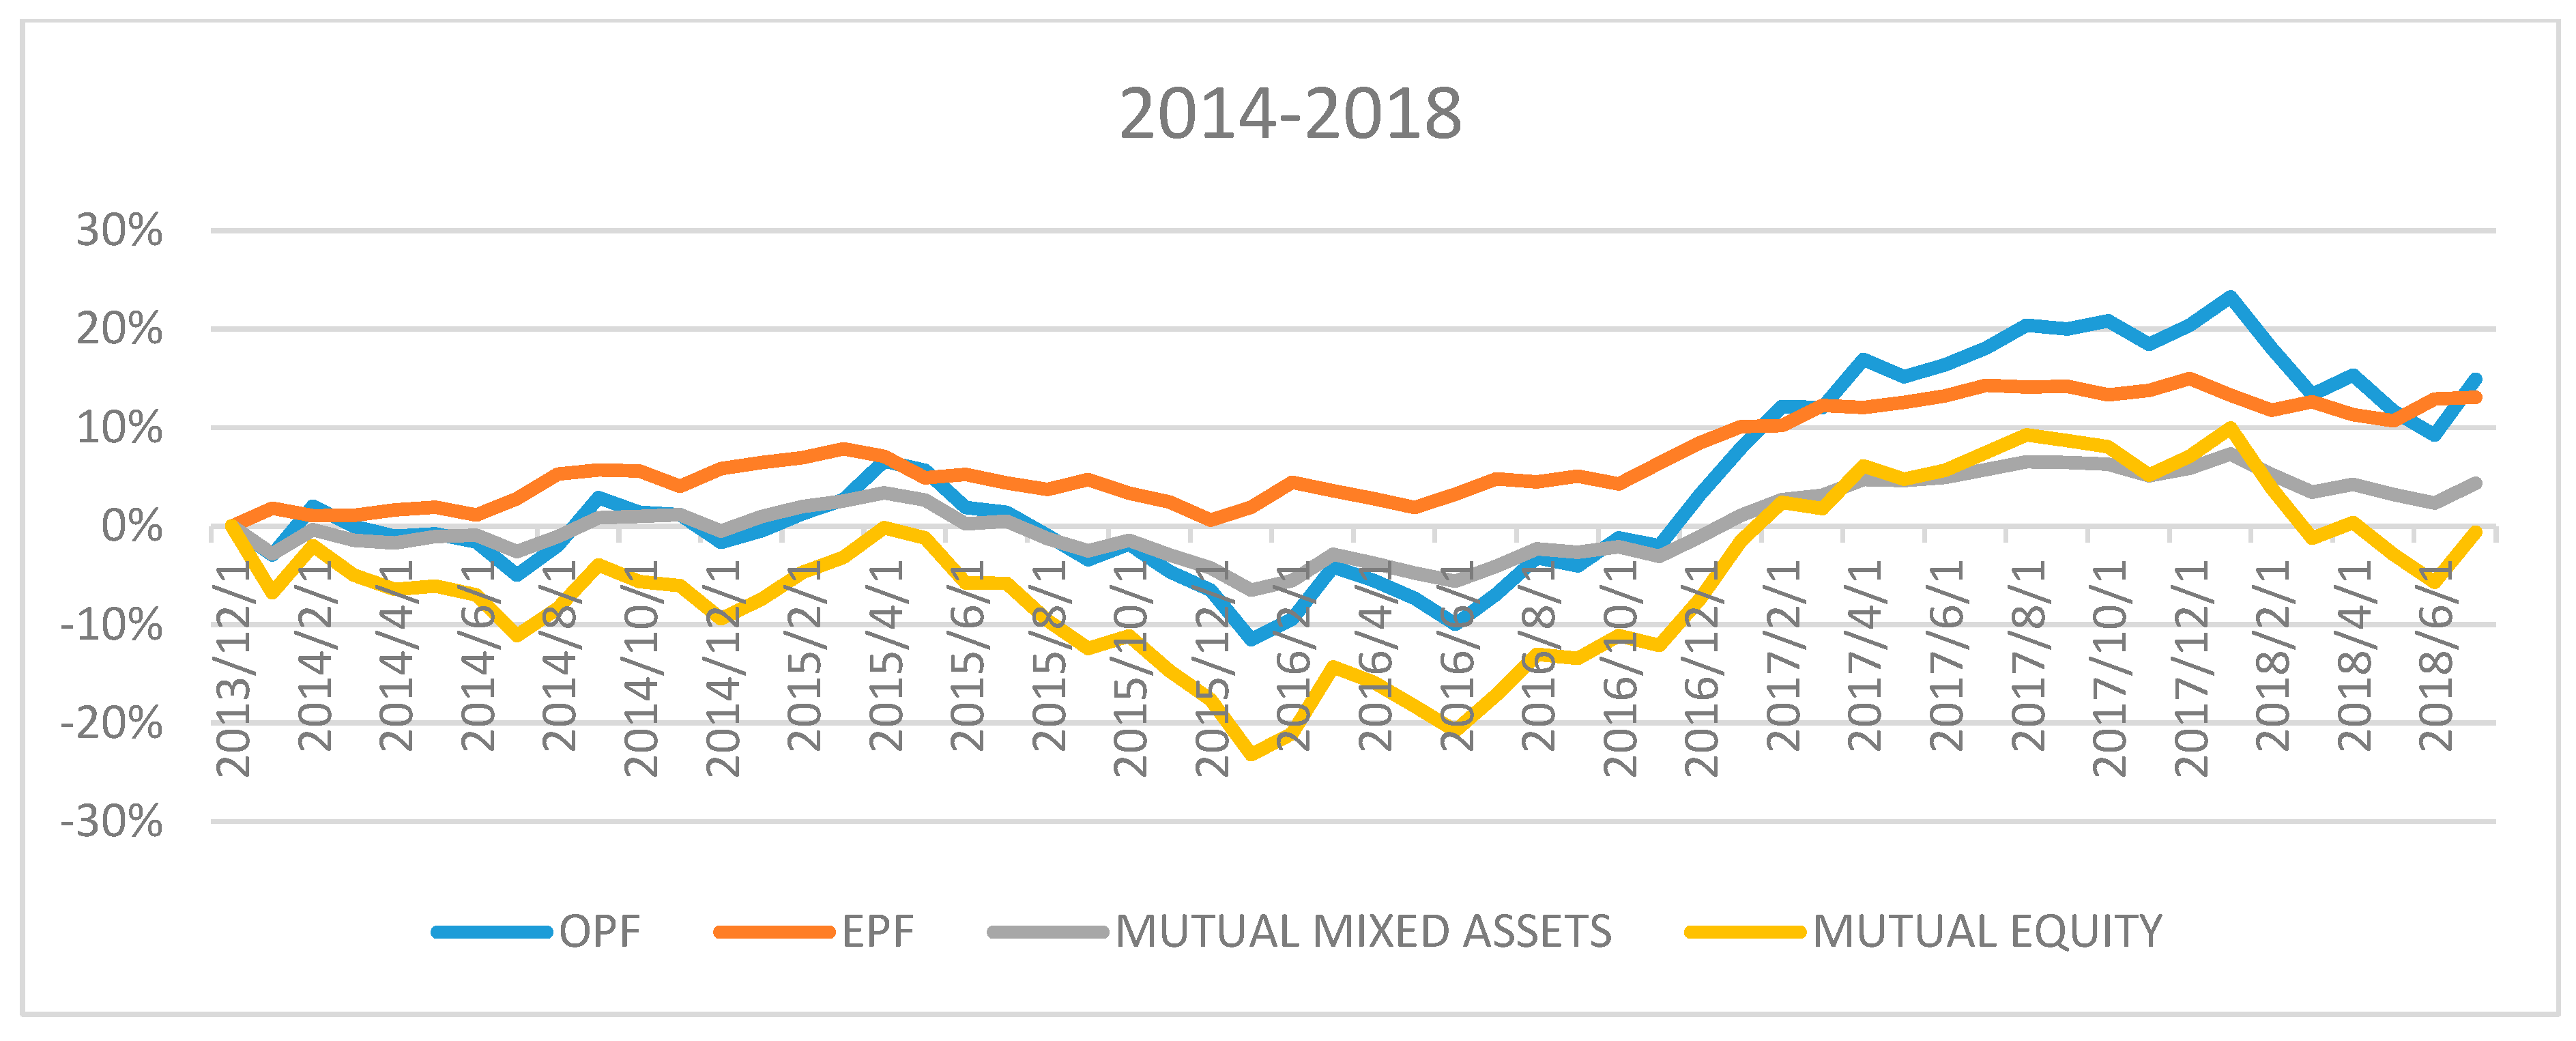
5.1. Management and Performance of Polish Pension Fund Group Portfolios

We started our analysis by examining the raw continuous returns of equal-weighted portfolios, to compare the profitability of OPFs, EPFs, and mutual funds available under the IRA and IPSA (Figure 3). We also paid attention to the level of risk related to regulatory changes concerning OPFs.
Between 2007 and 2013, the value of OPF and EPF returns were very similar. The cumulative value of the rates of return of these funds was higher than the mutual funds available under the IRA and IPSA. The shape of the curves representing the returns of the OPF and EPF portfolios was similar to the shape of mixed-assets mutual funds; however, the value of the cumulative returns of OPF and EPF portfolios were higher. Moreover, the equity mutual funds portfolio was the least profitable, even though it was characterized by higher volatility. The regulatory changes introduced, which forbid OPF investment in government debt instruments, led to a significant increase in the volatility of the results achieved. Between 2014 and 2018, the return of the OPF portfolio was not so strongly correlated with the return of the EPF portfolio. The shape of the curve of the cumulative returns of the OPF portfolio was, in this period, closest to the shape of the curve representing the mutual equity funds. However, the cumulative return of the OPF portfolio was still higher than the cumulative return of the mutual equity funds portfolio.
Table 2 presents the results of the model (2) estimation for the sub-period 2007–2013 (Panel A) and 2014–2018 (Panel B). The model fits well with the empirical data-Adj. R2 from 94% to 99% for the first sub-period and from 92% to 98% for the second sub-period. Between 2007–2013, OPFs and EPFs were more exposed to changes in the profitability of Treasury bonds than mutual funds operating under the IRA and IPSA. Concurrently, mutual funds available under the IRA and IPSA were more dependent on the domestic stock market (WIG). While this difference is obvious for equity funds, it is worth noting that unregulated mixed assets were more exposed to the domestic equity market. Moreover, mutual funds invested to a greater extent on global stock markets. OPFs and EPFs were also slightly involved in investments in the corporate bond market; however, for OPFs, the SPREAD variable had a significant impact on the results, which should be interpreted as having Treasury debt instruments with different maturities in the portfolio. Taking into account the elements of the six-factor model, the OPF was significantly exposed to the CMA factor, while in the case of mixed-assets mutual funds, the HML parameter was significant.
The analysis shows that in the years preceding the regulatory changes, OPFs were managed rather passively. Income depended mainly on the financial markets. Managers did not take into account the size or profitability of companies when constructing their portfolios, nor take advantage of the momentum effect. A similar situation applied to EPFs and mutual funds operating under IRA and IPSA. However, both OPFs and EPFs achieved statistically significant and positive Jensen alpha. In the case of mutual funds, this parameter was either statistically insignificant or reached negative values. Therefore, we assume that despite passive management, OPFs and EPFs performed better than mutual funds. This finding contradicts the results of Karpio and Żebrowska-Suchodolska (2014), who found that in the period 2000–2013, the investment efficiency of OPFs and Polish mutual funds was similar.
In the second of the analyzed sub-periods, there were significant changes in the market exposure of the analyzed portfolios. The biggest changes concerned OPFs, the return of which was no longer dependent on trends in the government securities market. Concurrently, the parameter related to the WIG index in the case of OPF came close to the analogous parameter for equity mutual funds. There was a complete change in the investment profile of OPFs, which in this sub-period were characterized by a risk level similar to equity funds. Therefore, our research partially confirmed the findings of Witkowska (2017), who also observed an increase in the investment risk of OPFs. Additionally, the situation in global markets had a greater influence on the returns achieved by OPFs. There was also a change in exposure to risk factors derived from the six-factor model. The size factor was much more important; however, the importance of this factor also increased in the case of other analyzed portfolios, which may be related to the overall market situation. In the case of OPFs, the UMD parameter was also important in the 2014–2018 sub-period, which means that managers used the momentum effect in this period, which was not observed in other portfolios. Regarding mutual funds available under the IRA and IPSA, the profitability factor was statistically significant. This suggests that, as far as the equity portfolio is concerned, the funds in these portfolios used different strategies to OPFs and EPFs.
Analysis of the alpha parameter shows the most effective portfolio was that composed of EPFs. The OPF portfolio was second in this ranking. In both cases, the alpha parameter was positive and statistically significant at the 5% significance level, which proves that OPFs and EPFs were able to slightly outperform the market. Therefore, the model we used gives the opposite results to Kurach (2019), who found that OPFs are failing to beat the market under the new regulatory environment. In the case of portfolios based on mutual funds, the alpha parameter was statistically insignificant. Therefore, our study indicates that the regulated OPFs and EPFs in both examined sub-periods were able to perform better than the unregulated funds operating under the IRA and IPSA. However, it could also have been affected by lower management fees, which are limited by Polish law in the case of OPFs and EPFs. The results are in-line with research by Dopierała et al. (2019), but in contradiction to Karpio and Żebrowska-Suchodolska (2014, 2017). A limitation of the earlier research is that the method used did not take into account the most important OPF assets classes. Our results appear to confirm the conclusions of Coggin et al. (1993), who claim that if one chooses a benchmark in-line with managers’ investment style, it is possible to detect some security selection ability.

5.2. Herd Behavior

In Table 3 we present the results of the model (3) estimation for the OPFs in the period 2010–2013. We estimated the values of individual parameters using both the fixed-effect model and the random-effect model. The adjustment of the model to empirical data is not high, but we do not consider it a limitation of the method because, in this study, the statistical significance of individual parameters is more important, and this research is explanatory, not predictive. The Hausman test shows that the studied phenomenon is better described by the fixed-effect model. A statistically significant value of the parameter of the lagged distance variable occurred in the analyzed period in the case of deposits, government bonds and Polish shares. Additionally, in the case of the Polish shares, the value of the lagged return distance parameter was statistically significant. This means that in the period preceding the asset management reform, herd behavior occurred in all significant asset classes. Moreover, in the case of Polish shares, herd behavior was influenced by the mechanism of penalizing funds for failure to achieve results determined based on the internal benchmark (measured as a 36-month weight average return). However, our model did not show any dependence relating to changes in the allocation of corporate bonds. The results confirm previous observations of strong herd behavior among OPFs (Voronkova and Bohl 2005; Kominek 2012).
Table 4 presents the results of the model (3) estimation for OPFs after the reforms that changed asset management. Herd behavior is still visible in all asset classes, with the strongest effect in deposits, which is in-line with the results of both Kominek (2012) and Gökçen and Yalçin (2015).
There is a lower absolute value of the lagged distance parameter for Polish shares in the second of the analyzed sub-periods. The change in the allocation of Polish shares ceased to be dependent on the deviation of the fund’s performance from the average OPFs performance. Although the 36-month weight average returns are still published for reference, managers have stopped taking them into account when creating a portfolio. The results indicate that the reforms led to a reduction in herd behavior in the case of Polish shares, although the phenomenon itself is still clear in the case of other asset classes. Our conclusions contradict the results of Marcinkiewicz (2015), who stated that after the reforms, herd behavior among OPFs became even stronger.

5.3. Management and Performance of OPFs’ Individual Portfolios—Robustness Tests

To assess the robustness of the results, we analyzed individual OPF portfolios in both analyzed sub-periods using the model (2). The results are presented in Table 5 and Table 6.
This analysis shows that in the period 2014–2018 the differentiation of the investment performance of individual OPFs was stronger than in the period 2007–2013. There was also a change in exposure to individual model factors. In 2007–2013, OPFs similarly constructed their investment portfolios and used similar effects on the stock market (statistically significant CMA factor). OPFs also achieved similar investment performance measured by the alpha parameter. After the changes, the exposure to risk factors (statistically significant parameters of SMB, CMA, and UMD) and investment efficiency diversified. Part of the fund also took advantage of the momentum effect. Additionally, restrictions on investing in government bonds prompted some managers to become involved in the global stock market and corporate bonds. As a result of the changes, OPFs were no longer a homogeneous group.

6. Conclusions

In this article, we have discussed the impact of regulations on management, investment performance and herd behavior of pension funds. This is not the first time that this topic has been examined, but our research stands out in several respects. Most significantly, we used a multi-factor, well-adjusted market model and a panel model directly assessing the impact of using the internal benchmark to evaluate pension funds.
Our results indicate that highly regulated funds may slightly outperform passive benchmarks and their unregulated competitors. However, this may largely be the result of a reduction in asset management fees in the case of regulated funds. Limiting investment in Treasury debt instruments, in the case of Polish OPFs, obviously resulted in increased risk and volatility of investment results. However, it also increased competition between funds and decreased herd behavior. An important element in reducing herd behavior was also the withdrawal of the mechanism evaluating funds based on the internal benchmark. The above conclusions are important for clients of funds, their managers and government bodies that regulate the pension market.
The main limitation of our research is the use of the unconditional model, which does not take into account changes in the behavior of managers and the performance achieved in a changing market situation. However, the use of a conditional model was not possible due to the lack of a sufficiently long time series, which is required with a large number of describing variables. The use of conditional models should be taken into account in future studies of the impact of regulatory changes on the management and investment performance of pension funds.

Author Contributions

Conceptualization, Ł.D.; methodology, Ł.D.; validation, Ł.D.; formal analysis, Ł.D.; investigation, Ł.D. and M.M.-S.; resources, Ł.D. and M.M.-S.; data curation, Ł.D. and M.M.-S.; writing—original draft preparation, Ł.D. and M.M.-S.; writing—review and editing Ł.D. and M.M.-S.; visualization, Ł.D. and M.M.-S.; funding acquisition, Ł.D. All authors have read and agreed to the published version of the manuscript.

Funding

This research was funded by the Faculty of Economics, University of Gdansk, Poland, project no. 539-E014-B443-20.

Institutional Review Board Statement

Not applicable.

Informed Consent Statement

Not applicable.

Data Availability Statement

Publicly available datasets were analyzed in this study. The structure of investment portfolios of OPFs can be found here: https://www.knf.gov.pl/en and the Fama-French factors data can be found here: http://adamzaremba.pl/downloadable-data/. Restrictions apply to the availability of financial market data. These data were obtained from the Refinitiv database and are available from the authors with the permission of Refinitiv.

Acknowledgments

The data used in this paper were collected from the Refinitiv database, according to a partnership agreement between the University of Gdansk, Poland, and Refinitiv.

Conflicts of Interest

The authors declare no conflict of interest.

Appendix A

Table A1. The most important statutory changes in the operation of OPFs in Poland.
Legal BasisScope of Introduced Changes
Act of 25 March 2011, amending certain acts related to the functioning of the social insurance system (Journal of Laws 2011, No. 75, item 398)Contribution to the open pension fund was limited to 2.3% of gross salary (instead of the initial 7.3%). The remaining part of the contribution (previously due to OPFs) was to be transferred to special sub-accounts at ZUS, covered by inheritance right and indexed by the gross domestic product growth rate of the previous five years.
Gradual increase of OPFs’ investment limits in shares, from the initial 40% to 90% in 2034.
Prohibition of acquisitions for OPFs; new agreements were to be concluded only by correspondence.
Act of 11 May 2012, amending the act on pensions and disability pensions from the Social Insurance Fund and certain other acts (Journal of Laws 2012, item 637, of 2017, item 38)Raising the minimum retirement age and making it equal for women and men at 67 years.
Act of 6 December 2013, amending certain acts in connection with the definition of rules for the payment of pensions from funds accumulated in OPFs (Journal of Laws 2013, item 1717)Redemption of all OPFs assets invested in State Treasury debt instruments.
Transfer of the OPFs’ assets as government bonds and other Treasury securities, or with government guarantees to ZUS in the form of entries on individual sub-accounts of future pensioners and their subsequent redemption (51.5% of OPF assets worth PLN 153.15 billion).
Introduction of voluntary membership in the OPF with the possibility of resignation from membership (during so-called transfer windows).
New amount of contribution to OPFs at 2.92% of gross salary.
Mandatory transfer of funds accumulated in OPFs to ZUS 10 years before retirement age (the so-called ‘safety slider’).
Change in the investment policy of OPFs (prohibition to buy bonds of the State Treasury or NBP, an order to invest at least 75% of assets in shares).
Elimination of the mechanism of the minimum required rate of return of OPFs and the mechanism of compensating for the shortage by CPS.
Prohibition to advertise OPFs under the penalty of a large fine (form PLN 1 M to 3 M).
Reduction of the fee from the contribution of OPF participants to the CPSs to a maximum of 1.75% of the contribution.
Act of 16 November 2016, amending the act on pensions and disability pensions from the Social Insurance Fund and certain other acts (Journal of Laws 2017, item 38)Lowering the retirement age to pre-reform levels (60 for women and 65 for men).
Source: own study based on presented legal acts.

References

  1. Adamska-Mieruszewska, Joanna, and Magdalena Mosionek-Schweda. 2015. Rozwój Indywidualnych Oszczędności Emerytalnych w Kontekście Skłonności Polaków Do Oszczędzania. Praca i Zabezpieczenie Społeczne 8: 3–19. [Google Scholar]
  2. Arellano, Manuel. 1987. Computing Robust Standard Errors for Within—Groups Estimators. Oxford Bulletin of Economics and Statistics 49: 431–34. [Google Scholar] [CrossRef]
  3. Bielawska, Kamila, Agnieszka Chłoń-Domińczak, and Dariusz Stańko. 2017. Retreat from Mandatory Pension Funds in Countries of the Eastern and Central Europe in Result of Financial and Fiscal Crisis. Causes, Effects and Recommendations for Fiscal Rules. Available online: https://mpra.ub.uni-muenchen.de/id/eprint/83345 (accessed on 5 November 2020).
  4. Blake, David, Lucio Sarno, and Gabriele Zinna. 2017. The Market for Lemmings: The Herding Behavior of Pension Funds. Journal of Financial Markets 36: 17–39. [Google Scholar] [CrossRef]
  5. Bohl, Martin T., Judith Lischewski, and Svitlana Voronkova. 2011. Pension Funds’ Performance in Strongly Regulated Industries in Central Europe: Evidence from Poland and Hungary. Emerging Markets Finance and Trade 47: 80–94. [Google Scholar] [CrossRef]
  6. Choe, Hyuk, Bong Chan Kho, and René M. Stulz. 1999. Do Foreign Investors Destabilize Stock Markets? The Korean Experience in 1997. Journal of Financial Economics 54: 227–64. [Google Scholar] [CrossRef]
  7. Chybalski, Filip. 2007. Analiza Podobieństwa Portfeli Inwestycyjnych OFE z Wykorzystaniem Metod Taksonomicznych. Prace Naukowe Akademii Ekonomicznej We Wrocławiu 1159: 56–68. [Google Scholar]
  8. Chybalski, Filip. 2012. Uwarunkowania Konkurencji Na Rynku Funduszy Ememrytalnch Na Przykładzie OFE. Studia Ekonomiczne Regionu Łódzkiego, 243–55. Available online: http://212.51.210.149/handle/11652/835 (accessed on 5 November 2020).
  9. Coggin, T. Daniel, Frank J. Fabozzi, and Shafiqur Rahman. 1993. The Investment Performance of U.S. Equity Pension Fund Managers: An Empirical Investigation. The Journal of Finance 48: 1039–55. [Google Scholar] [CrossRef]
  10. Dopierała, Łukasz, Magdalena Mosionek-Schweda, and Daria Ilczuk. 2019. Mutual Funds as Instruments for Pension Security-the Case of Poland. Zeszyty Naukowe Politechniki Poznańskiej. Organizacja i Zarządzanie 80: 19–34. [Google Scholar] [CrossRef]
  11. Dopierała, Łukasz, Magdalena Mosionek-Schweda, and Daria Ilczuk. 2020. Does the Asset Allocation Policy Affect the Performance of Climate-Themed Funds? Empirical Evidence from the Scandinavian Mutual Funds Market. Sustainability 12: 654. [Google Scholar] [CrossRef] [Green Version]
  12. Dybał, Mariusz. 2018. Pracownicze Programy Emerytalne w Polsce. Ekonomia-Wroclaw Economic Review 23: 91–106. [Google Scholar] [CrossRef] [Green Version]
  13. Fama, Eugene F., and Kenneth R. French. 2018. Choosing Factors. Journal of Financial Economics 128: 234–52. [Google Scholar] [CrossRef]
  14. Frey, Stefan, Patrick Herbst, and Andreas Walter. 2007. Measuring Mutual Fund Herding—A Structural Approach. SSRN Electronic Journal. [Google Scholar] [CrossRef] [Green Version]
  15. Gökçen, Umut, and Atakan Yalçin. 2015. The Case against Active Pension Funds: Evidence from the Turkish Private Pension System. Emerging Markets Review 23: 46–67. [Google Scholar] [CrossRef] [Green Version]
  16. Grinblatt, Mark, Sheridan Titman, and Russ Wermers. 1995. Momentum Investment Strategies, Portfolio Performance, and Herding: A Study of Mutual Fund Behavior. The American Economic Review 85: 1088–105. [Google Scholar]
  17. Hoepner, Andreas G. F., and Lisa Schopohl. 2018. On the Price of Morals in Markets: An Empirical Study of the Swedish AP-Funds and the Norwegian Government Pension Fund. Journal of Business Ethics 151: 665–92. [Google Scholar] [CrossRef] [Green Version]
  18. Holzmann, Robert, and Richard Hinz. 2005. Old-Age Income Support in the 21st Century. Old-Age Income Support in the 21st Century. Washington: The World Bank. [Google Scholar] [CrossRef]
  19. Karpio, Andrzej, and Dorota Żebrowska-Suchodolska. 2014. Efektywność Inwestycyjna Funduszy Emerytalnych Na Tle FIO Stabilnego Wzrostu. Zeszyty Naukowe Uniwersytetu Szczecińskiego: Finanse, Rynki Finansowe, Ubezpieczenia 75: 221–31. Available online: https://www.ceeol.com/search/article-detail?id=472627 (accessed on 10 November 2020).
  20. Karpio, Andrzej, and Dorota Żebrowska-Suchodolska. 2017. The Investment Effectiveness of Polish Pension Funds During the Changes of Market Benchmark. Annales Universitatis Mariae Curie-Skłodowska, Sectio H, Oeconomia 51: 149. [Google Scholar] [CrossRef] [Green Version]
  21. Kominek, Zbigniew. 2012. Regulatory Induced Herding? Evidence from Polish Pension Funds. Economic Change and Restructuring 45: 97–119. [Google Scholar] [CrossRef]
  22. Kurach, Radosław. 2019. Do They Beat the Market in the New Regulatory Environment—The Case of Polish Pension Funds. Economic Research-Ekonomska Istraživanja 32: 370–83. [Google Scholar] [CrossRef] [Green Version]
  23. Kyrolainen, Petri Juhani, and Jukka Perttunen. 2003. Investors’ Activity and Trading Behavior. SSRN Electronic Journal. [Google Scholar] [CrossRef]
  24. Lakonishok, Josef, Andrei Shleifer, and Robert W. Vishny. 1992. The Impact of Institutional Trading on Stock Prices. Journal of Financial Economics 32: 23–43. [Google Scholar] [CrossRef] [Green Version]
  25. Lobão, Júlio, and Ana Paula Serra. 2007. Herding Behavior: Evidence from Portuguese Mutual Funds. In Diversification and Portfolio Management of Mutual Funds. Edited by Greg N. Gregoriou. London: Palgrave Macmillan, pp. 167–97. [Google Scholar] [CrossRef]
  26. Marcinkiewicz, Edyta. 2015. Zachowania Stadne i Konkurencja Na Rynku OFE. Badanie Empiryczne z Wykorzystaniem Wielowymiarowej Analizy Statystycznej. Marketing i Rynek 5: 1067–80. [Google Scholar]
  27. Merli, Maxime, and Tristan Roger. 2013. What Drives the Herding Behavior of Individual Investors? Finance 34: 67. [Google Scholar] [CrossRef] [Green Version]
  28. Mikulec, Artur. 2004. Ocena Efektywności Inwestowania Otwartych Funduszy Emerytalnych. Wiadomości Statystyczne 9: 26–39. Available online: https://www.infona.pl/resource/bwmeta1.element.ekon-element-000000123369 (accessed on 10 November 2020).
  29. Mohamed, Arouri, Raphaëlle Bellando, Sébastien Ringuedé, and Anne-Gael Vaubourg. 2012. Institutional Herding in Stock Markets: Empirical Evidence from French Mutual Funds. SSRN Electronic Journal 1992: 1–42. [Google Scholar] [CrossRef]
  30. Newey, Whitney K., and Kenneth D. West. 1994. Automatic Lag Selection in Covariance Matrix Estimation. The Review of Economic Studies 61: 631–53. [Google Scholar] [CrossRef]
  31. Oehler, Andreas, and George Goeth-Chi Chao. 2000. Institutional Herding in Bond Markets. Diskussionsbeiträge-Bank-Und Finanzwirtschaftliche Forschung (BAFIFO), 13. Available online: https://www.econstor.eu/bitstream/10419/22491/1/bafifo13.pdf (accessed on 9 November 2020).
  32. Polish Financial Supervision Authority. 2020. Website of the Polish Financial Supervision Authority. Available online: https://www.knf.gov.pl/en/ (accessed on 5 June 2020).
  33. Rutecka, Joanna. 2014. System Emerytalny Po Zmianach Od 2014 Roku. Ubezpieczenia Społeczne. Teoria i Praktyka 1: 2–7. Available online: http://www.academia.edu/download/47475806/System_emerytalny_po_zmianach_od_2014_ro20160724-1677-15l6y0r.pdf (accessed on 4 November 2020).
  34. Sierocka, Iwona. 2010. Pracownicze Programy Emerytalne. Białystok: Temida 2. [Google Scholar]
  35. Superintendency of Pension Funds. 2000. Security Through Competition. Performance Analysis of the Second Pillar. Warsaw: Superintendency of Pension Funds. [Google Scholar]
  36. Szczepański, Marek, and Tomasz Brzęczek. 2016. Zarządzanie Ryzykiem w Pracowniczych Programach Emerytalnych. Poznań: Polskie Towarzystwo Ekonomiczne. [Google Scholar]
  37. Urząd Komisji Nadzoru Finansowego. 2014. Informacja o Działalności Inwestycyjnej Funduszy Emerytalnych w Okresie 31.03.2011-31.03.2014. Warszawa: Urząd Komisji Nadzoru Finansowego. [Google Scholar]
  38. Urząd Komisji Nadzoru Finansowego. 2017. Informacja o Działalności Inwestycyjnej Funduszy Emerytalnych w Okresie 31.03.2014-31.03.2017. Warszawa: Urząd Komisji Nadzoru Finansowego. [Google Scholar]
  39. Voronkova, Svitlana, and Martin T. Bohl. 2005. Institutional Traders’ Behavior in an Emerging Stock Market: Empirical Evidence on Polish Pension Fund Investors. Journal of Business Finance and Accounting 32: 1537–60. [Google Scholar] [CrossRef]
  40. Ważna, Elżbieta. 2017. Efektywność Inwestowania Otwartych Funduszy Inwestycyjnych w Polsce w Latach 2007–2014. Zeszyty Naukowe Uczelni Vistula 56: 64–83. Available online: http://yadda.icm.edu.pl/yadda/element/bwmeta1.element.desklight-4df279ea-97d2-4dcf-b1ae-87cf1be6a3f7 (accessed on 3 November 2020).
  41. Witkowska, Dorota, and Krzysztof Kompa. 2015. Ocena Efektywności Funduszy Emerytalnych z Wykorzystaniem Metod Porządkowania Liniowego. Metody Ilościowe w Badaniach Ekonomicznych/Szkoła Główna Gospodarstwa Wiejskiego 16: 191–200. [Google Scholar]
  42. Witkowska, Dorota. 2017. Zmiana Warunków Funkcjonowania a Efektywność Inwestycyjna Otwartych Funduszy Emerytalnych. Łódź: Wydawnictwo Uniwersytetu Łódzkiego. [Google Scholar]
  43. Zaremba, Adam. 2020. Fama-French Factors: Market (MKT), Size (SMB), Value (HML), Momentum (WML), Profitability (RMW), Investment (CMA). Available online: http://adamzaremba.pl/downloadable-data/ (accessed on 15 June 2020).
  44. Zhu, Lei, Huimin Li, and Dazhi Zheng. 2020. Institutional Industry Herding in China. Chinese Economy 53: 246–64. [Google Scholar] [CrossRef]
Figure 1. Structure of investment portfolio of OPFs in the Polish pension system, 2001–2018 (in %). Source: own study based on Komisja Nadzoru Finansowego, Publikacje i opracowania, Dane statystyczne, Rynek emerytalny, https://www.knf.gov.pl/publikacje_i_opracowania.
Risks 09 00006 g001
Figure 2. Structure of investment portfolio of employee pension funds (EPFs) in the Polish pension system, 2001–2018 (in %). Source: own study based on Komisja Nadzoru Finansowego, Publikacje i opracowania, Dane statystyczne, Rynek emerytalny, https://www.knf.gov.pl/publikacje_i_opracowania.
Risks 09 00006 g002
Figure 3. Cumulative continuous return of equal-weighted portfolios of pension funds and mutual funds in Polish pension system.
Risks 09 00006 g003aRisks 09 00006 g003b
Table 1. Changes to investment limits of Polish pension funds, 1998–2014: Selected instruments.
Type of Instrument12.5.199803.2.200426.4.201117.1.2014
Bonds, bills and other securities issued by the State Treasury or the Polish Central BankNo limits0%
Shares of companies listed on the regulated stock exchange, including subscription rights, rights to shares and bonds convertible to shares since 200440% regulated stock market;
10% parallel and free market;
5% free market
40%Planned 90%Min. 75% until 31.12.2014; min. 55% until 31.12.2015; 35% until 31.12.2016; 15% until 31.12.2017
Shares of companies listed on the OTC market10%
National Investment Funds10%40%--
Investment certificates and units of investment funds10% investment certificates; 15% participation units
Bonds and other debt securities issued by local government units15% (5% not admitted to public trading)40% (20% bonds other than dematerialized)
Fully secured bonds issued by entities other than local government units10% (5% not admitted to public trading)20% (10% not admitted to public trading)40% (10% bonds other than dematerialized)
Covered bonds30% since 200140%
Depositary Receipts-10%
Bank deposits and bank securities20%
Note: The dates in the table denote the enactment of the Ordinance of the Council of the Ministers regulating open pension fund (OPF) investment activity.
Table 2. Performance of equal-weighted portfolios of pension funds and mutual funds in the Polish pension system.
OPFEPFMUTUAL MIXED ASSETSMUTUAL EQUITY
Panel A: 2007–2013
Alpha0.0024 ***0.0023 ***−0.0006−0.0026 ***
WIG0.3453 ***0.3257 ***0.4615 ***0.9564 ***
SMB−0.0307−0.01720.00270.0531 *
HML−0.0549 *−0.0605 *−0.0548 **−0.0391
RMW−0.0064−0.0167−0.00230.0216
CMA0.0535 **0.04040.02170.0272
UMD0.0153−0.0099−0.0166 *0.0154
GLOB−0.00540.00790.0587 ***0.0718 **
BOND−3.4474 ***−3.5877 ***−2.1113 **−0.4699
SPREAD4.4712 **2.98321.5102−1.2760
CRPB−0.1812 *0.0131−0.0412−0.8058 **
Observations84848484
R20.9490.9490.9770.989
Adj. R20.9420.9420.9740.988
Panel B: 2014–2018
Alpha0.0033 **0.0054 ***0.0022−0.0001
WIG0.8695 ***0.3677 ***0.4396 ***1.0191 ***
SMB0.1325 ***0.0452 **0.0526 **0.1799 ***
HML−0.0392−0.0346−0.01770.0069
RMW−0.03710.01670.0453 **0.0737 ***
CMA−0.0742 ***−0.0274−0.0271−0.0199
UMD0.0497 ***−0.03390 **−0.01770.0428 *
GLOB0.0997 ***0.03420.0912 ***0.1201 ***
BOND−0.1355−4.9385 ***−3.1372−0.3179
SPREAD−3.1892−0.0101−0.4150−2.7651
CRPB0.3549 *0.0413−0.00510.0579
Observations53535353
R20.9850.9380.9560.987
Adj. R20.9820.9240.9450.984
Note: This table presents the results of the performance analysis of the equal-weighted portfolios, where alpha is the Jensens’s alpha, WIG index serves as the market factor, SMB represents the firm size factor, HML represents the firm value factor, RMW represents the profitability factor, CMA represents the investment factor, UMD represents the momentum factor, GLOB represents the exposure of the portfolio on global stock markets, BOND represents the portfolio exposure on the Polish government bond market, SPREAD represents the portfolio exposure on bond time spread, CRPB represents the portfolio exposure on the Polish corporate bond market. ***, **, and * indicate statistical significance at the 1%, 5%, and 10% levels, respectively. Standard errors are corrected for autocorrelation and heteroscedasticity (Newey and West 1994).
Table 3. Determinants of change in OPF asset allocations, 2010–2013.
Asset ClassesDepositsGovernment BondsCorporate BondsPolish Shares
Fixed effect model
Lagged distance−0.2927 ***−0.1820 ***0.0001−0.2153 ***
Lagged return distance0.08290.19950.0242−0.2998 **
WIBOR2.4301−3.4997−0.04470.4999
WIG−0.0031−0.01120.00310.0127
BOND2.7049−3.3870−0.15693.9392 ***
SPREAD16.3471 **−19.3926 ***1.3856−0.1748
CRPB−0.3214 ***0.2294 **0.00870.0894
CONSTANT−0.02210.0332 ***0.0005−0.0194 ***
LSDV R20.1340.0910.0290.076
Random effect model
Lagged distance−0.2246 ***−0.1027 ***0.0002−0.1516 ***
Lagged return distance0.07150.03440.0060−0.1015 *
WIBOR2.4520−4.9325 ***−0.16221.7763 *
WIG−0.0034−0.00960.00310.0115
BOND2.0691−2.0069−0.08623.2234 ***
SPREAD15.0285 ***−20.4087 ***1.19852.2199
CRPB−0.3345 ***0.2491 **0.00840.0816
CONSTANT−0.01910.0310 ***0.0006−0.0201 ***
R20.1120.0580.0170.052
Observations506506506506
Hausman test12.501816.98962.616913.0276
Note: ***, **, and * indicate statistical significance at the 1%, 5%, and 10% levels, respectively. Standard errors are corrected following Arellano (1987). The last row in every section represents the value of H-statistics of the Hausman test. Bold values in the last row indicate a rejection of the hypothesis about the random-effect model at 5% significance level.
Table 4. Determinants of change in OPF asset allocations, 2014–2018.
Asset ClassesDepositsCorporate BondsPolish SharesGlobal Shares
Fixed effect model
Lagged distance−0.2014 ***−0.1472 ***−0.0803 ***−0.0603 ***
Lagged return distance0.01160.0292−0.0529−0.0044
WIBOR−5.7654 ***−5.3346 ***2.35811.6993
WIG−0.0080−0.0265 **−0.0374 **0.0157
GLOB−0.0652 ***−0.0317 ***0.0581 ***0.0138
CRPB−0.1952 **−0.0870 *0.2697 ***0.0222
CONSTANT0.0095 ***0.0071 ***−0.0023−0.0032
LSDV R20.1140.1330.0660.027
Random effect model
Lagged distance−0.0639 ***−0.0557 **−0.0084−0.0308 **
Lagged return distance0.00670.00150.0019−0.0057
WIBOR−4.0722 ***−6.3287 ***2.3650 **1.1416
WIG−0.0008−0.0276 **−0.0366 **0.0139
GLOB−0.0571 ***−0.0360 ***0.0597 ***0.0110
CRPB−0.1495 **−0.0976 **0.2701 ***0.0103
CONSTANT0.0058 ***0.0086 ***−0.0020−0.0025
R20.0550.1080.0510.014
Observations550550550550
Hausman test35.307615.48417.22824.9271
Note: ***, **, and * indicate statistical significance at the 1%, 5%, and 10% levels, respectively. Standard errors are corrected following Arellano (1987). The last row in every section represents the value of H-statistics of the Hausman test. Bold values in the last row indicate a rejection of the hypothesis about the random-effect model at 5% significance level.
Table 5. Performance of individual OPF portfolios (part 1).
AEGONAllianzAvivaAXAGeneraliMetLife
Panel A: 2007–2013
Alpha0.0021 ***0.0027 ***0.0022 ***0.0022 ***0.0025 ***0.0029 ***
WIG0.3430 ***0.3321 ***0.3656 ***0.3271 ***0.3223 ***0.3477 ***
SMB−0.0415−0.0508 *−0.0556 *−0.0480 *0.0076−0.0358
HML−0.0550−0.0449−0.0657 **−0.0477−0.0251−0.0595 *
RMW−0.0047−0.01610.00120.0049−0.01940.0096
CMA0.0742 ***0.0561 **0.0646 ***0.0570 **0.03040.0494 *
UMD0.01450.0303 **0.01610.0195 *0.00380.0072
GLOB−0.0023−0.01480.0068−0.01880.01050.0039
BOND−3.3684 ***−3.9718 ***−2.8231 ***−3.2165 ***−4.2561 ***−3.4261 ***
SPREAD4.02154.8896 *3.9432 *4.0718 *5.0825 ***4.3206 **
CRPB−0.1933−0.2331−0.1658−0.1496−0.04400.1477
Observations848484848484
R20.9390.9330.9510.9480.9520.948
Adj. R20.9310.9240.9450.9410.9460.941
Panel B: 2014–2018
Alpha0.00110.0048 ***0.0028 *0.0051 ***0.0028 *0.0032
WIG0.7734 ***0.8086 ***0.8477 ***0.8150 ***0.8257 ***0.8840 ***
SMB0.05230.1601 ***0.1196 ***0.0886 **0.1093 ***0.1388 ***
HML−0.0226−0.0763 **−0.0406−0.03100.0496 *−0.0167
RMW−0.0496−0.0487−0.0052−0.0591 **−0.02520.0009
CMA−0.0850 ***−0.0824 **−0.0601 **−0.0582 *−0.0895 **−0.0556
UMD0.01740.0433 **0.0411 **0.0444 **0.0388 *0.0650 *
GLOB0.0743 *0.0934 ***0.0763 ***0.0744 ***0.0788 ***0.0934 ***
BOND−3.9412−2.01452.1470−1.44010.3951−0.1140
SPREAD3.7168−2.0158−5.1605−3.5094−4.0616−2.7850
CRPB0.18610.5762 **0.3962 *0.27280.5108 ***0.3255
Observations535353535353
R20.9660.9730.9800.9770.9820.9715
Adj. R20.9580.9670.9750.9710.9770.9647
Note: ***, **, and * indicate statistical significance at the 1%, 5%, and 10% levels, respectively. Standard errors are corrected for autocorrelation and heteroscedasticity (Newey and West 1994).
Table 6. Performance of individual OPF portfolios (part 2).
NNNordeaPeakaoPKO BPPocztylionPZU
Panel A: 2007–2013
Alpha0.0030 *** 0.0029 ***0.0023 ***0.0026 ***0.0020 **0.0025 ***
WIG0.3780 ***0.3425 ***0.3525 ***0.3364 ***0.3418 ***0.3647 ***
SMB−0.0485 *−0.0376−0.0050−0.0368−0.0355−0.0328
HML−0.0935 **−0.0648 *−0.0428−0.0603 *−0.0545−0.0750 *
RMW−0.00690.0011−0.0165−0.0121−0.0118−0.0163
CMA0.0889 ***0.0482 **0.04520.0580 **0.0679 **0.0458
UMD0.00290.0239 **0.0419 ***0.01070.01650.0223 *
GLOB0.0143−0.0005−0.0258−0.0046−0.0011−0.0024
BOND−3.0917 **−3.6558 ***−3.7743 ***−3.5185 ***−3.1979 ***−3.5111 ***
SPREAD4.7760 **4.6772 **4.5654 *5.4740 **3.9660 *3.6991
CRPB−0.1724−0.1495−0.2709 **−0.2070 *0.1963−0.1778
Observations848484848484
R20.9460.9450.9320.9400.9360.944
Adj. R20.9380.9380.9230.9310.9270.936
Panel B: 2014–2018
Alpha0.00170.00270.00160.0059 **0.0037 **0.0046 *
WIG0.9115 ***0.8658 ***0.9738 ***0.8628 ***0.9172 ***0.9404 ***
SMB0.1510 ***0.1243 ***0.1273 ***0.1190 **0.2134 ***0.1680 ***
HML−0.0210−0.0493−0.0229−0.0645−0.0677 *−0.0261
RMW−0.0405−0.0242−0.0261−0.075−0.0409−0.0473
CMA−0.0634 *−0.0978 ***−0.0465−0.077−0.0961 **−0.0717
UMD0.0645 ***0.0683 ***0.0645 ***0.02640.0595 ***0.0654 **
GLOB0.1246 ***0.0916 ***0.0980 ***0.1286 ***0.0856 ***0.1808 ***
BOND3.18430.77461.25310.0365−3.04563.0128
SPREAD−5.6159−1.6956−3.8552−5.50340.0202−8.0206
CRPB0.3764 **0.34510.2477−0.01260.4608 **0.5360 *
Observations535353535353
R20.9820.9790.9750.9530.9750.961
Adj. R20.9780.9730.9700.9420.9690.951
Note: ***, **, and * indicate statistical significance at the 1%, 5%, and 10% levels, respectively. Standard errors are corrected for autocorrelation and heteroscedasticity (Newey and West 1994).
Publisher’s Note: MDPI stays neutral with regard to jurisdictional claims in published maps and institutional affiliations.

