Role of El Niño Southern Oscillation (ENSO) Events on Temperature and Salinity Variability in the Agulhas Leakage Region


School of the Earth, Ocean, and Environment, University of South Carolina, 701 Sumter Street, Columbia, SC 29208, USA
*
Author to whom correspondence should be addressed.
Remote Sens. 2018, 10(1), 127; https://0-doi-org.brum.beds.ac.uk/10.3390/rs10010127
Submission received: 17 November 2017
/
Revised: 12 January 2018
/
Accepted: 16 January 2018
/
Published: 18 January 2018
(This article belongs to the Special Issue Sea Surface Temperature Retrievals from Remote Sensing)
Abstract
:This study explores the relationship between the Agulhas Current system and El Niño Southern Oscillation (ENSO) events. Specifically, it addresses monthly to yearly variations in Agulhas leakage where the Agulhas Current sheds waters into the Atlantic Ocean, in turn affecting meridional overturning circulation (MOC). Sea surface temperature (SST) data from the National Oceanic and Atmospheric Administration’s (NOAA) Advanced Very High Resolution Radiometer (AVHRR) combined with sea surface salinity (SSS) from Soil Moisture Ocean Salinity (SMOS) and Simple Ocean Data Assimilation (SODA) reanalysis are used to explore changes in Agulhas leakage dynamics. Agulhas leakage is anomalously warm in response to El Niño and anomalously cool in response to La Niña. The corresponding SSS signal shows both a primary and secondary signal response. At first, the SSS signal of Agulhas leakage is anomalously fresh in response to El Niño, but this primary signal is replaced by a secondary anomalously saline signal. In response to La Niña, the primary SSS signal of Agulhas leakage is anomalously saline, while the secondary SSS signal is anomalously fresh. The lag between the peak of ENSO and the response in SST and the corresponding primary SSS signal of Agulhas leakage is about 20 months, followed by the secondary SSS signal at a lag of about 26 months. In general, increasing ENSO strength increases the extremes of the resulting anomalous SST and SSS signal and impacts the Agulhas leakage region earlier during El Niño and slightly later during La Niña.
1. Introduction
The Agulhas Current, a western boundary current, is a limb of the wind-driven anti-cyclonic circulation of the South Indian Ocean. The current originates south of Madagascar forming a narrow flow stabilized by east Africa’s steep continental slope. Past the southern tip of Africa, the flow retroflects eastward as the Agulhas Return Current forming the southern arm of the Indian Ocean subtropical gyre which is a part of the Southern Hemisphere super gyre [1]. A phenomenon known as Agulhas leakage occurs at the area of retroflection and transports warm saline water into the Atlantic through the shedding of Agulhas rings, cyclones, and filaments. This system feeds the upper arm of the Atlantic meridional overturning circulation (AMOC). Variability in leakage may impact the strength of overturning sequentially altering climate patterns [2]. Fluctuations in the strength of Agulhas leakage are controlled by long-term and short-term fluctuations in the Agulhas Current and source current dynamics [3]. This paper uses sea surface temperature (SST) and sea surface salinity (SSS) to explore the influence of the El Niño-Southern Oscillation (ENSO) on the Agulhas Current system and, ultimately, Agulhas leakage. Previous work by Biastoch et al. [4] established a link between Agulhas leakage and changes in heat and salt transports into the Atlantic. Specifically, Agulhas rings are distinguishable from surrounding waters by their high salt content derived from strong evaporation occurring in the retroflection region which boosts the salinity within the rings [5]. In other words, a close relationship exists between SST, SSS, and circulation supporting our use of SST and SSS as a proxy for Agulhas leakage.
The aim of the study is to define the relationship between ENSO and Agulhas leakage in terms of SST and SSS response. This relationship cannot be fully understood without first connecting the influence of the ENSO signal across the three ocean basins involved: the Pacific Ocean, the Indian Ocean, and the Atlantic Ocean. In terms of global circulation, the Indian Ocean acts as the link between the Pacific and the Atlantic Ocean, contributing nearly 12.6 Sv to Agulhas leakage, of which, about 7.9 Sv originates from the Pacific moving into the Atlantic [6]. Nearly half of the Indian Ocean contribution to Agulhas leakage comes from the Indonesian Throughflow (ITF) with a smaller portion originating south of Australia by Tasman leakage [6]. The ITF has been found to increase during La Niña and decrease during El Niño [7]. An analysis by Le Bars et al. [8] suggests changes to ITF strength influences Agulhas leakage because the two currents are codependent. Within the Indian Ocean basin, the westward flowing South Equatorial Current (SEC) circulates water from the Indian Ocean subtropical gyre and ITF to the Madagascar coast. This westward transport of water between 60°E and 100°E is modeled at mean speeds of ~0.1 m·s−1, taking ~1.3 years for waters from the ITF to reach 77°E [6]. Upon reaching the Madagascar coast, the SEC splits at 17°S into a northern and southern branch. The southern branch feeds into the East Madagascar Current (EMC) while the northern branch bifurcates against the African coast into the Mozambique Channel (MC) [9]. A shift in the intensity and position of the tropical and subtropical gyre in response to positive (negative) SSH anomalies associated with ENSO wind anomalies (see next paragraph) changes the intensity of the SEC, thus altering flow through the MC and EMC [10]. The EMC sheds eddies near the tip of Madagascar [11], contributing ~25 Sv to the Agulhas Current [9]. The MC consists of a train of westward flowing eddies [11] which contribute ~5 Sv to the Agulhas Current [3].
Furthermore, the formation of eddies in the EMC and MC can be related to incoming Rossby waves crossing the Indian Ocean (see next paragraph) [12], and during El Niño years more eddies are released [11]. While the exact mechanics driving Agulhas leakage are still highly debated, a robust link has been identified between these eddies and the westward shift of the retroflection loop as well as the generation of a “Natal Pulse”, a large solitary meander in the current that progresses downstream to influence retroflection dynamics. Recent research suggests that although Agulhas Current meanders may not be the dominant mode of variance, they destabilize the flow, causing increased Agulhas leakage events [12,13]. It is important to note that De Ruijter et al. [11] traced the propagation of eddies from south of Madagascar at 5–10 cm·s−1. Therefore, it takes approximately 6 months after formation for eddies from the MC and EMC to influence Agulhas leakage.
A clear connection established by circulation patterns links the Pacific Ocean to the Indian Ocean into the Atlantic Ocean. We are interested in the processes that alter this system to explain why we are seeing the anomalous SST and SSS patterns highlighted in this paper. However, the mechanisms involved in ENSO signal propagation have yet to be deciphered. For this study, the work of Putrasahan et al. [10] is used to define the proposed process by which an ENSO signal originating in the Pacific Ocean propagates into the Indian Ocean basin and ultimately alters the properties of Agulhas leakage. During the mature season of El Niño (La Niña), fluctuations of Walker circulation cause anomalous easterly winds (strong westerly) winds to form over Indonesia, generating upwelling (downwelling) Kelvin waves. Anomalous easterly (westerly) winds actively suppress (enhance) convection, causing a basin-wide warming (cooling) trend [14]. The wind anomalies over Indonesia combined with Ekman pumping generate off-equatorial Rossby waves that travel westward. Note, this process explains the previously mentioned ENSO-associated SSH anomalies that Palastanga et al. [15] found to be influencing the SEC, further impacting the MC and EMC. The ENSO signal also enters the Indian Ocean along the western Australian coast by a pathway known as the subtropical North Pacific ray-path. North Pacific Rossby waves generated during ENSO events impinge on the western boundary and move equatorward along the “ray-path” of Kelvin–Munk waves to reflect as equatorial Kelvin waves. When the reflected Kelvin waves impinge upon the Australian continent they become coastally trapped and move poleward along the coast, where they radiate Rossby waves into the south Indian Ocean [16]. Ultimately, an ENSO event triggers two sets of westward-propagating Rossby waves at 12°S and 25°S from wind forcing and Kelvin waves, respectively. As previously mentioned, the eddy activity of the EMC and MC are influenced by Rossby-wave propagation at 25°S and 12°S, respectively [12].
Rossby waves alone cannot explain signal propagation. A second parameter, wind stress, also plays an important role. The previously described anomalous wind and SST conditions in the Indian Ocean basin that form in response to ENSO are correlated with a wind-stress anomaly along the equator [17]. This is further supported by the strong correlation present between weakened trade winds in the Pacific, a characteristic of an El Niño, and strengthened trade winds in the tropical Indian Ocean. Strengthened trade winds along the tropical Indian Ocean create a zonal band of positive wind stress curl over the tropics, forcing the continued propagation of the Rossby waves at 25°S and 12°S [10]. Using SSH, Putrasahan et al. [10] was able to correlate SST anomalies of Agulhas leakage to wind stress and found a lag of approximately 2 years. In other words, it takes approximately 2 years for tropical warm anomalies formed from El Niño-associated wind anomalies to reach the Agulhas leakage region. This is relatively consistent with the earlier mentioned time scales of ocean circulation, where it takes a little more than ~1.3 years for waters to cross the Indian Ocean basin [6] and then ~6 months for eddies from EMC and MC to interact with Agulhas leakage [11].
Our study aims to define the relationship between ENSO events and SST and SSS variability in the Agulhas leakage region. In other words, the results presented in this paper are intended to describe the observed effects of ENSO on Agulhas leakage, focusing on defining the relationship itself rather than determining the various driving mechanisms of signal propagation. The previous paragraphs highlight the potential mechanisms of signal propagation serving as evidence and support the notion that such a relationship between Agulhas leakage and ENSO exists. Our study is predominantly important with respect to SSS because the response of SSS in the Agulhas leakage region to ENSO is a novel topic yet to be understood. Newly launched satellite-derived salinity missions used in this study, such as the National Aeronautics and Space Administration’s (NASA) Soil Moisture Active Passive (SMAP) and the European Space Agency’s (ESA) Soil Moisture and Ocean Salinity (SMOS), are an innovative approach to studying SSS. In respect to SST, Putrasahan et al. [10] established a link between the interannual variability of SST of Agulhas leakage and ENSO, then determined the lag in response of Agulhas leakage to be about 2 years. However, the Putrasahan et al. [10] study does not specifically investigate the difference between El Niño and La Niña but rather relies on a correlation analysis to distinguish between the phases and the influence of ENSO strength. The results presented in this paper further the work done by Putrasahan et al. [10] by evaluating the SST signal propagation from a different perspective and distinguishing El Niño events from La Niña events. This paper uses spatial plots to illustrate the entire propagation of an ENSO signal, from where the SST and SSS signal originates to movement of the signal across the Indian Ocean basin to surround the source currents and ultimately signal interaction with the Agulhas current system, changing Agulhas leakage SST and SSS properties.
2. Materials and Methods
ENSO events were determined using the Oceanic Niño Index (ONI) obtained from the National Weather Service and Climate Prediction website. The SST anomalies used to calculate the ONI are from the Extended Reconstructed Sea Surface Temperature (ERSST) version 4 dataset derived from the International Comprehensive Ocean-Atmosphere Dataset (ICOADS). Threshold values were calculated from the anomalies in the Niño 3.4 region (5°N–5°S, 120°–170°W) with an applied 3-month running mean and are based on a centered 30-year base period updated every 5 years.
Satellite-derived measurements from the Advanced Very High Resolution Radiometer (AVHRR) by the National Oceanic and Atmospheric Administration (NOAA) were the sole source of SST data used to interpret temperature trends in the Indian Ocean and Agulhas leakage region. The data included in this study is entitled NOAA NCEI OISST (version 2) daily SST data and was obtained from http://iridl.ldeo.columbia.edu/SOURCES/.NOAA/.NCDC/.OISST/.version2/.AVHRR/.sst/. The data includes a combination of both AVHRR and in-situ data for optimal interpolation. The data set spans from October 1981 to December 2015 with daily intervals at 0.25° × 0.25° spatial resolution that we converted to monthly averages. AVHRR is appropriate for the purposes of this study because of this long time span of data coverage that allows the majority of previous ENSO events to be evaluated; 21 ENSO events occur between 1981 and 2015. Furthermore, the data set is bias-corrected to achieve a uniform performance throughout a wide range of atmospheric and oceanic conditions. Comparisons with in-situ buoys indicate that the global accuracy of current Pathfinder algorithm is 0.02° ± 0.5 °C [18]. Satellite-derived salinity measurements from Soil Moisture Ocean Salinity (SMOS) and model-based products from Simple Ocean Data Assimilation (SODA) reanalysis were used to evaluate SSS. SMOS version 2.0 level 3 monthly SSS data at a 0.25° × 0.25° spatial resolution was obtained from Barcelona Expert Centre (http://bec.icm.csic.es/). This data set spans from January 2010 to June 2016 and is still operational. SODA version 3.3.1 reanalysis is obtained from the Asia Pacific Data Research Center (APDRC) at a monthly temporal resolution and a 0.25° × 0.25° spatial resolution spanning from 1980–2015.
This study classifies all ENSO events between 1981 and 2015 as an El Niño if the ONI value was at or exceeding a +0.5° anomaly threshold for 3 consecutive months, and a La Niña if the ONI value was at or below a −0.5° anomaly for 3 consecutive months. Any remaining years are considered to be neutral. This classification process is consistent with that used by NOAA’s Climate Prediction Center (http://www.cpc.ncep.noaa.gov/). The threshold is further divided into weak events with a 0.5°–0.9° anomaly range, moderate events with 1.0°–1.4° anomaly range, and strong events with anomalous values greater or equal to 1.5° established by Jan Null at Golden Gate Weather Services (http://ggweather.com/enso/oni.htm). Table 1 represents the strong, weak, and moderate classifications of La Niña and El Niño. The months of January–March were selected to represent the relationship between ENSO and leakage dynamics because it is during the mature season of ENSO (December–March) [19].
The SST interannual anomalies used throughout the study were obtained by computing the average monthly SST from the full AVHRR data set (1981–2015) and subtracting them from the monthly average of a given year. The same process was used for SSS anomalies except using SODA reanalysis from 1980–2015 and SMOS data from 2010–2016. In other words, the mean seasonal cycle was removed.
We defined the Agulhas leakage region based on the location in which prevalent transport of warm saline waters is observed. This region spans from the tip of the African continental shelf to the oceanic subtropical front (37°–45°S) [5] and has a western limit established by the Good Hope transect [20] and an eastern limit at the point of retroflection (10°–20°E) [14]. The box-averaged SST and SSS of this region were obtained to create a time series of SST and SSS changes in the Agulhas leakage region to further represent possible changes in Agulhas leakage dynamics. Note that Dencausse et al. [21] defines the Agulhas retroflection loop as having an average position at 18°E meaning that the retroflection loop is present within our defined box for the Agulhas leakage region. However, the results of box-averaged time series are not observed as being largely skewed by the retroflection signal because the position of the retroflection loop is highly variable, and using the box-average mitigates the influence of extreme values that may come from retroflection interaction within the defined Agulhas leakage region.
A Pearson Product-Moment Correlation Coefficient analysis was performed to obtain Figure 11 representing the lag between the peak of ENSO signals and box-averaged SST and SSS at the point of Agulhas retroflection. The peak in ENSO signal was defined as the average ONI value during the peak (December–March) of defined El Niño or La Niña years. This was correlated with the 3-month running mean of box-averaged SST and SSS at monthly lag intervals from corresponding El Niño or La Niña years.
3. Results
3.1. Sea Surface Temperature (SST) and Sea Surface Salinity (SSS) Signal Response to El Niño and La Niña
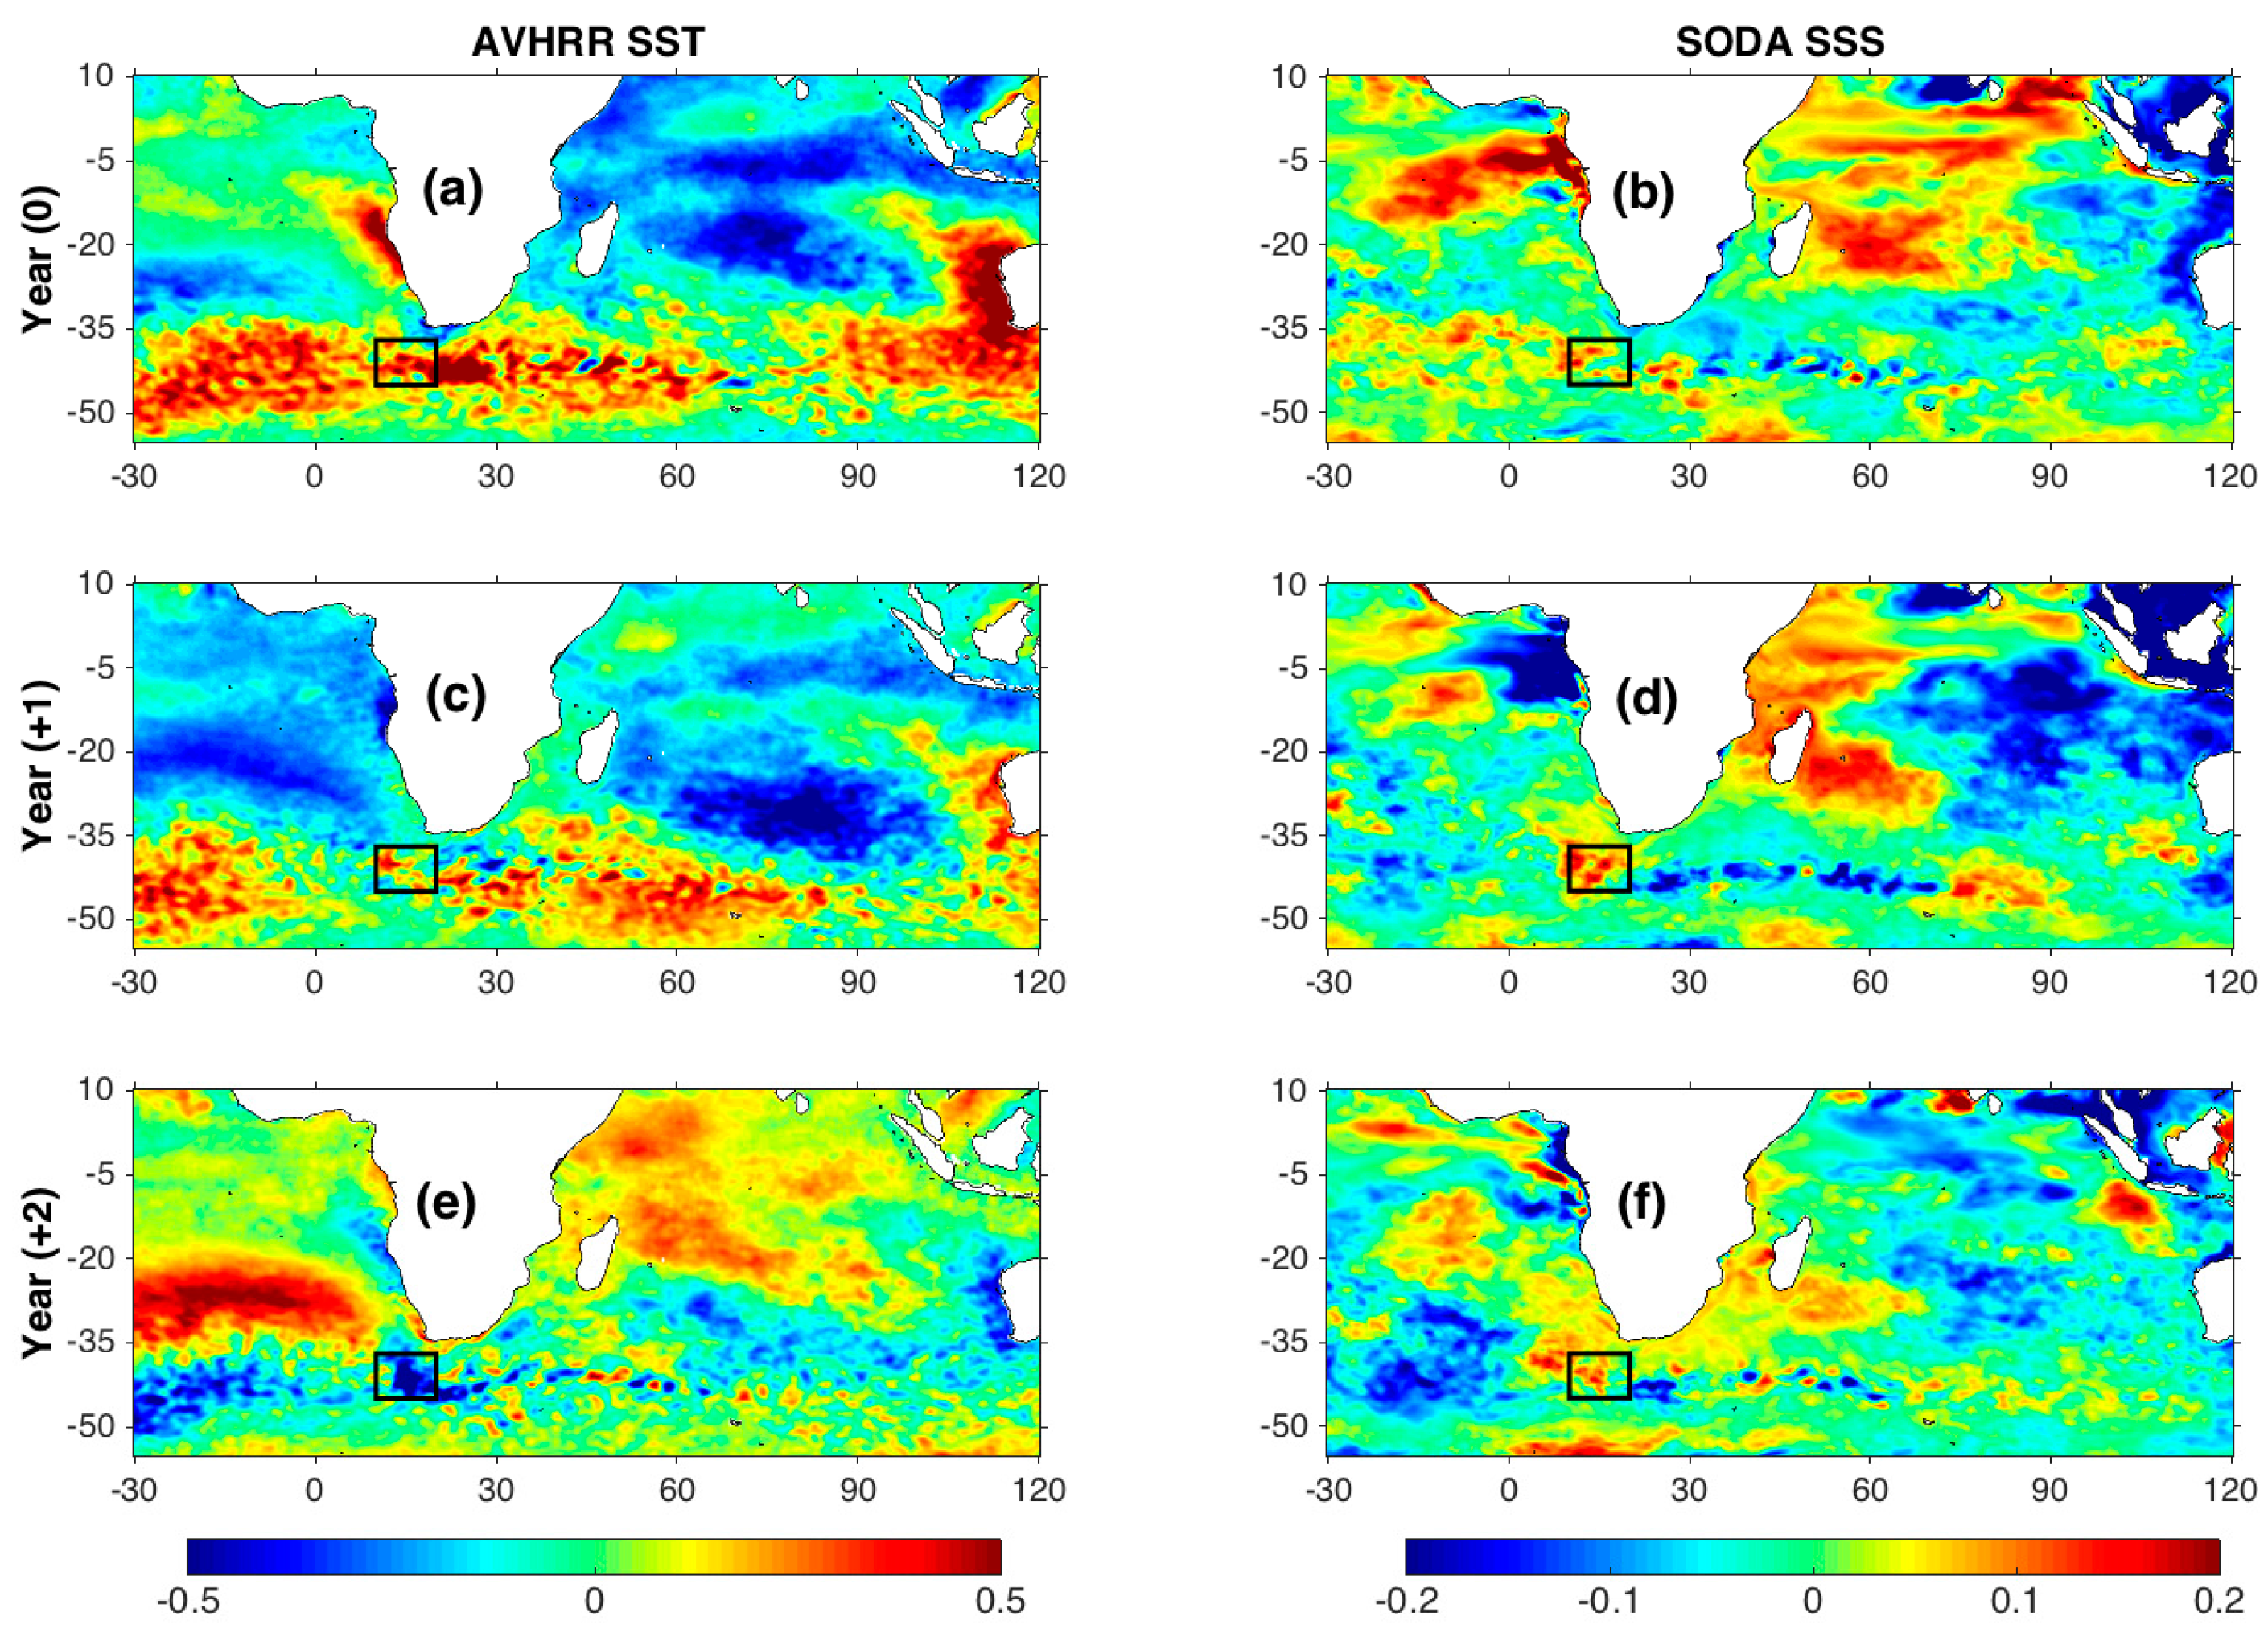
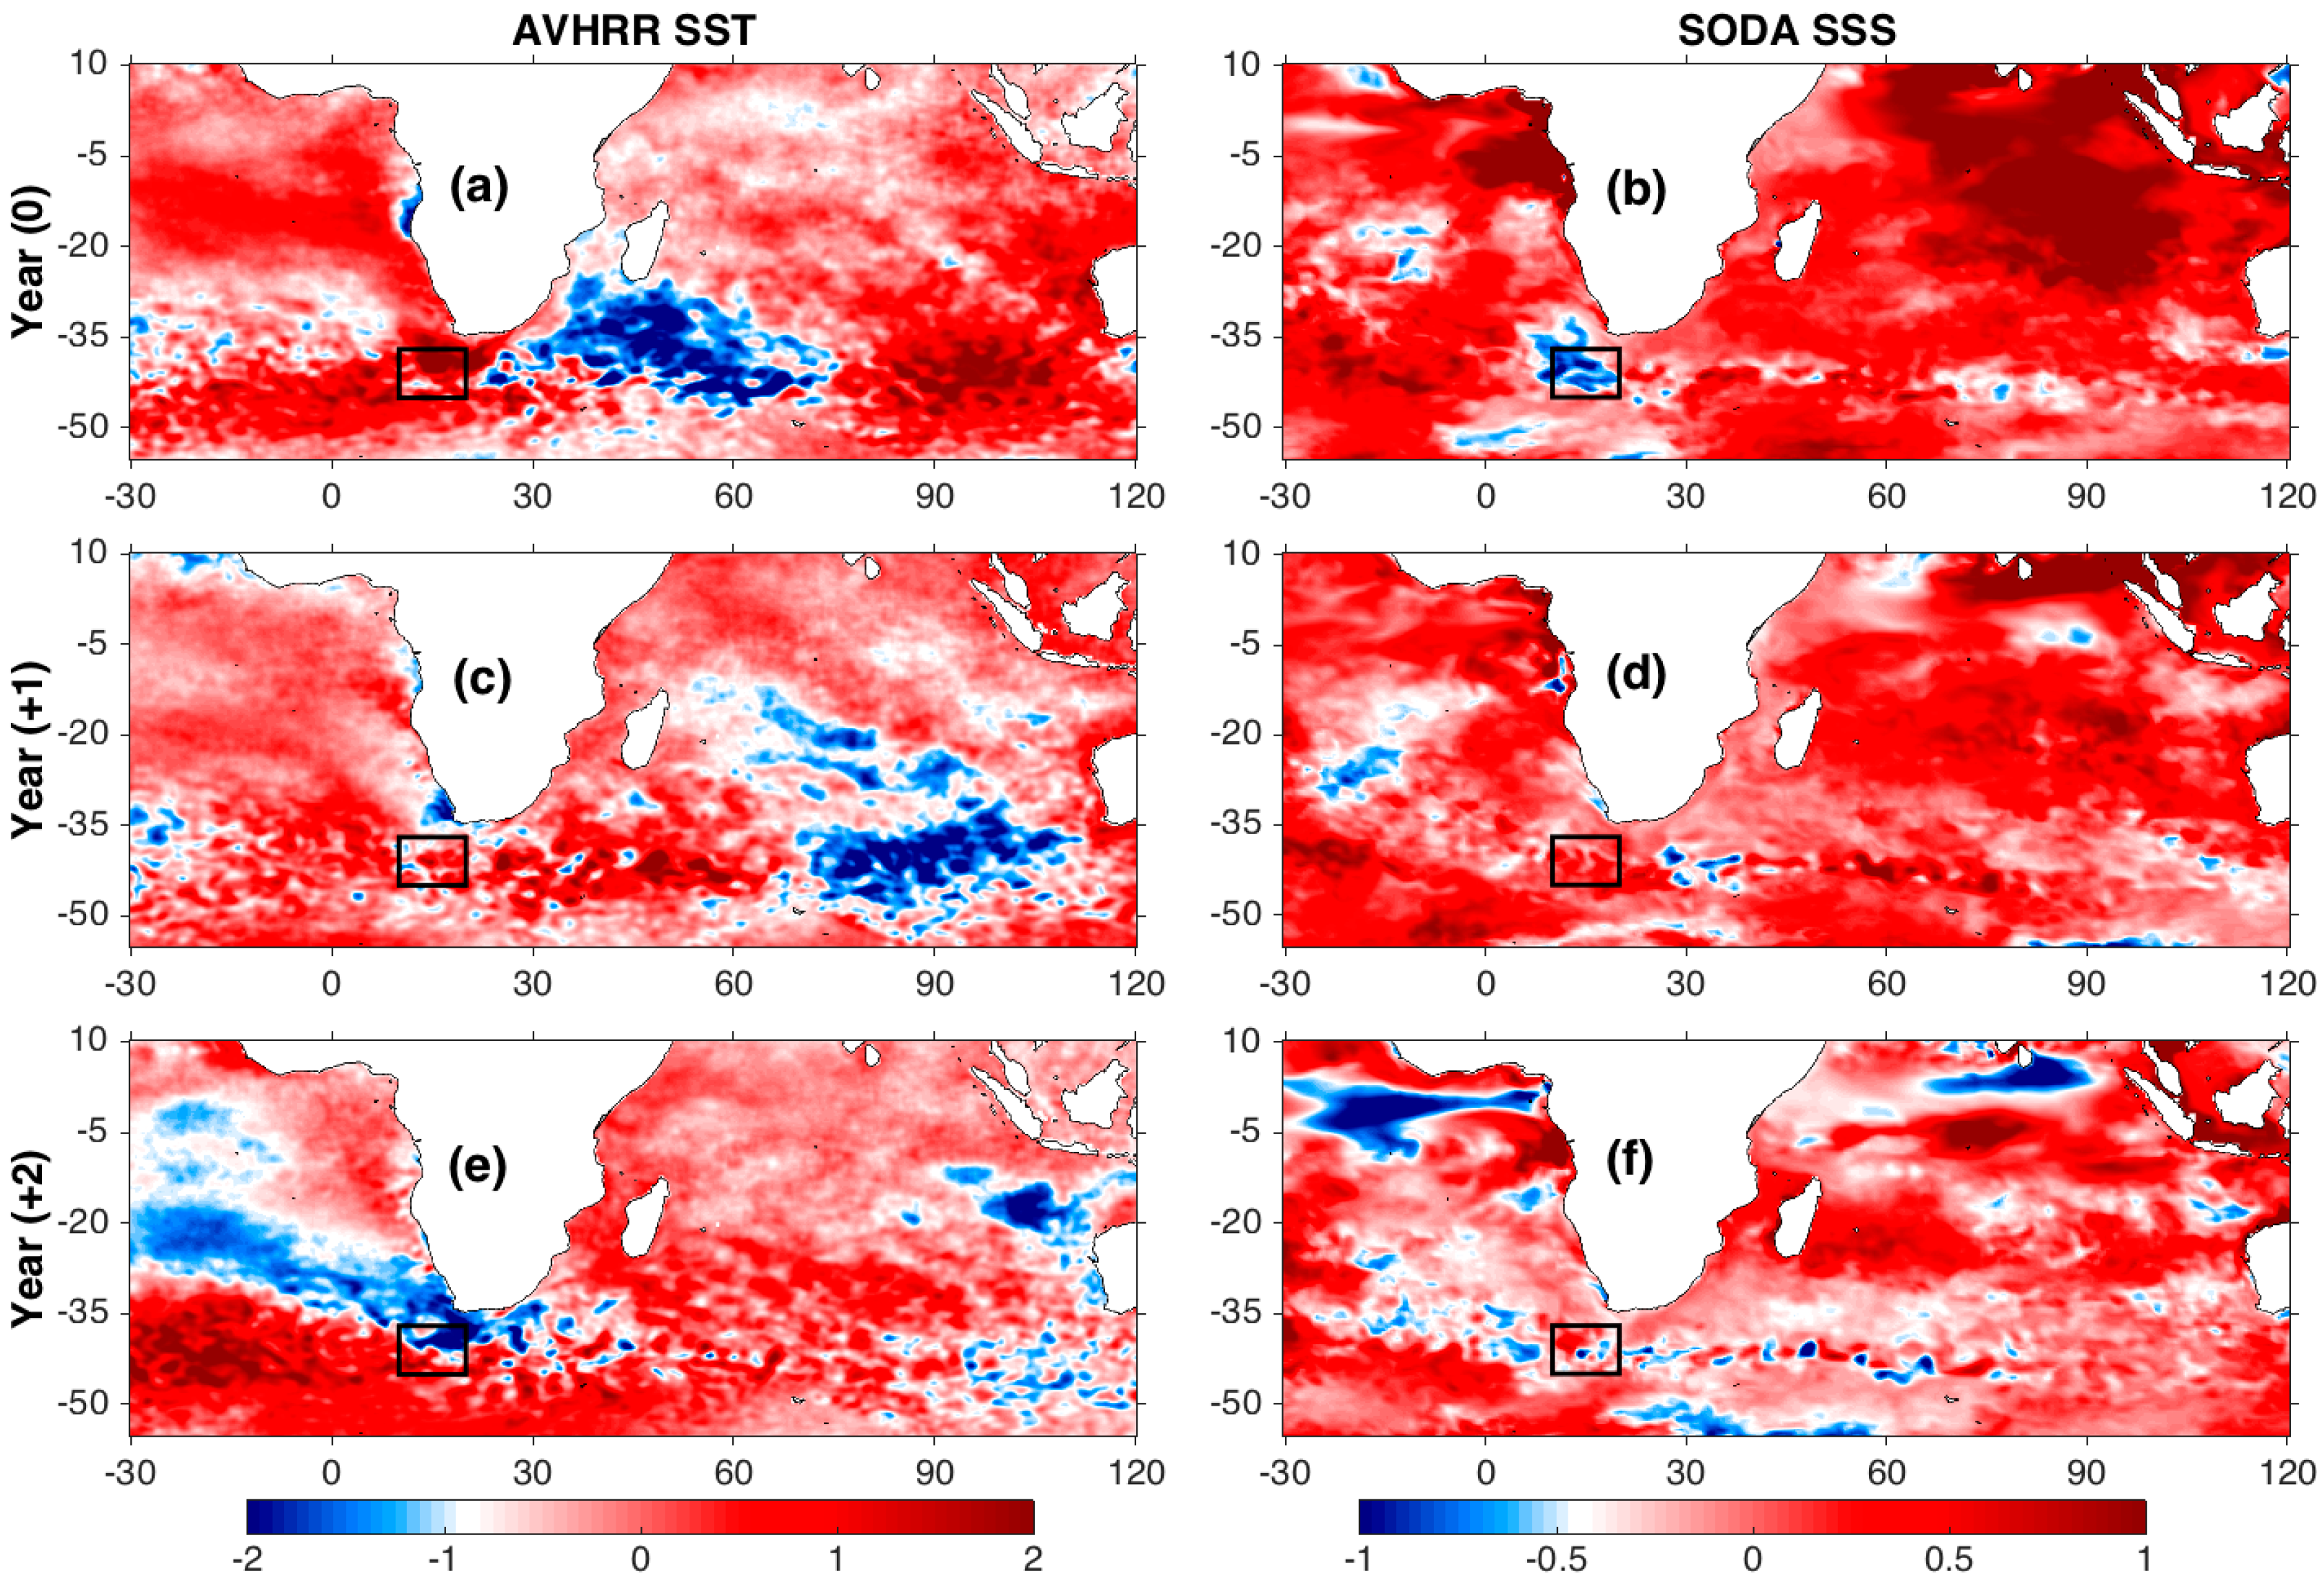
Figure 1 and Figure 2 illustrate the average AVHRR SST and SODA SSS anomalies during the peak, the following year, and two years after the peak (January to March) of all La Niña years and El Niño years, respectively (listed in Table 1). Figure 3 is an extension of Figure 1 and Figure 2 showing the continuation of the SSS signal in the Agulhas leakage region in the months beyond two years following the peak of ENSO to up to three years following the peak of ENSO.
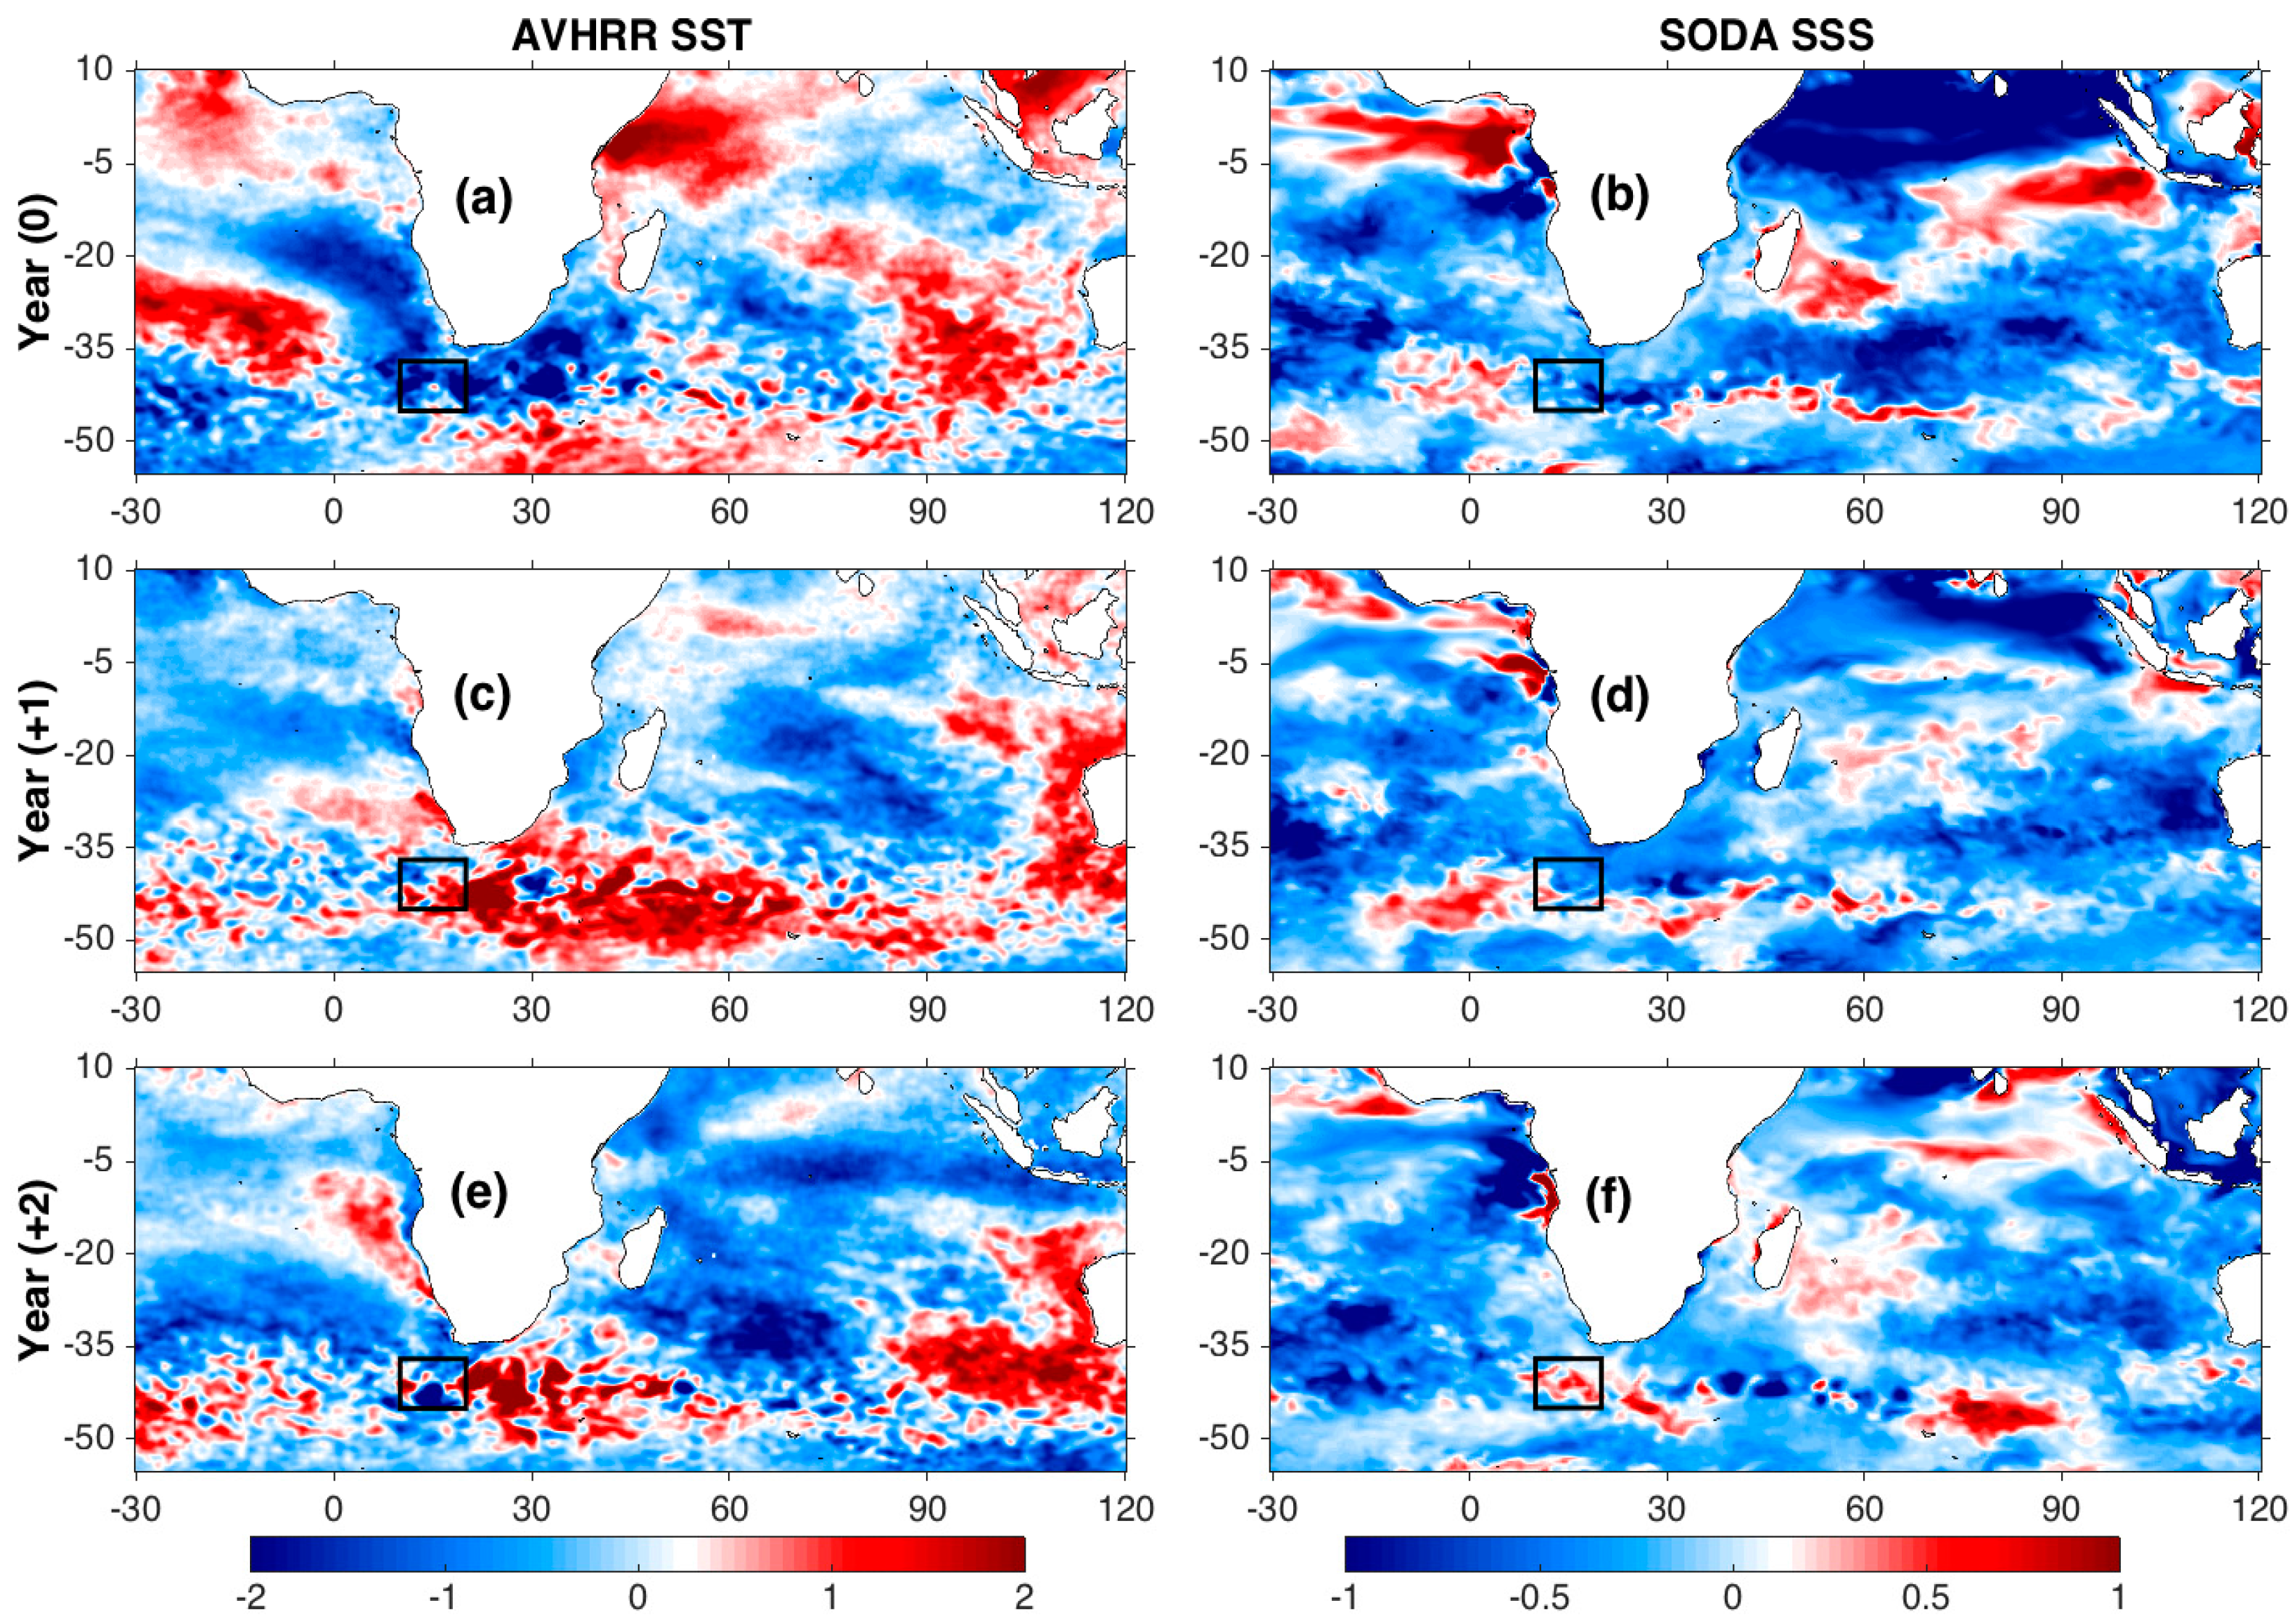
During the peak of La Niña, SST anomalies in the Indian Ocean basin are dominantly cool, excluding warming off the west coast of Australia (Figure 1a). This is opposite of El Niño where SST anomalies are dominantly warm excluding cooling off the coast of Australia (Figure 2a). In respect to SST, there is a single dominant warming (cooling) signal during El Niño (La Niña). The corresponding SSS is composed of two simultaneously occurring but contrasting signals each reflecting an area of either dominantly fresh or saline SSS. Furthermore, the original region of these anomalously fresh and saline signals switch during El Niño and La Niña. In other words, La Niña shows high salinity in the north-west in the Equatorial Indian Ocean with low salinity in the south-east near the coast of Sumatra (Figure 1b), and El Niño shows low salinity in the north-west with high salinity in the south-east (Figure 2b). Throughout the paper, this dual SSS signal is referred to as a primary signal and a secondary signal. The primary SSS signal is the region of anomalously low (high) SSS originating in the north-west Equatorial Indian Ocean during El Niño (La Niña). The secondary SSS signal refers to the anomalously high (low) SSS occurring simultaneously in the south-east Indian Ocean near the coast of Sumatra. If a zero-lag correlation were to exist between Agulhas leakage and ENSO, Figure 1a,b and Figure 2a,b would show that La Niña is related to warm saline leakage and El Niño is related to cool fresh leakage, respectively. However, the SST and SSS signal directly surrounding the African coast during the peak of ENSO does not correspond to the SST and SSS signal observed in the leakage region at this same time. Near the tip of the African coast, waters are warm and saline (cool and fresh) during the peak of El Niño (La Niña).
When evaluating the SST anomalies for one year following an ENSO event, the established warming (cooling) trend identified during the peak of El Niño (La Niña) is now isolated near the region east of Madagascar at ~15°–35°S (Figure 1c and Figure 2c). The spatial variation of SSS identified during a peak ENSO event remains consistent into the next year, but the secondary signal is pushed further west and the primary signal surrounds Madagascar (Figure 1d and Figure 2d). One year after the peak of El Niño (La Niña), the dominant positive (negative) SST and the primary fresh (saline) SSS signal surround Madagascar.
The initial impact on Agulhas leakage from the propagating dominant SST signal and primary SSS signal is not strongly observed until two years after the peak of ENSO (Figure 1e,f and Figure 2e,f). At this time, the SST and SSS signal of Agulhas leakage exhibits opposite temperature and salinity trends for El Niño compared to La Niña. Two years after the peak of El Niño, Agulhas leakage is anomalously warm and fresh (Figure 2e,f). In contrast, two years after the peak of La Niña Agulhas leakage is anomalously cool and saline (Figure 1e,f). Note, this is the same signal that surrounded Madagascar the year prior. The initial primary fresh (saline) SSS signal in the Agulhas leakage region is replaced by the secondary saline (fresh) SSS signal, but the SST signal of Agulhas leakage remains consistent. The secondary SSS signal did not reach the Madagascan coast until April–June of two years after La Niña (Figure 3a) and January–March of two years after El Niño (Figure 2f). Therefore, interaction with Agulhas leakage by the secondary saline (fresh) SSS signal occurs as late as the end of two years (start of three years) following El Niño (La Niña) (Figure 3d,f,g).
3.2. Variability of Agulhas Leakage in Response to Strength of El Niño Southern Oscillation (ENSO) Events
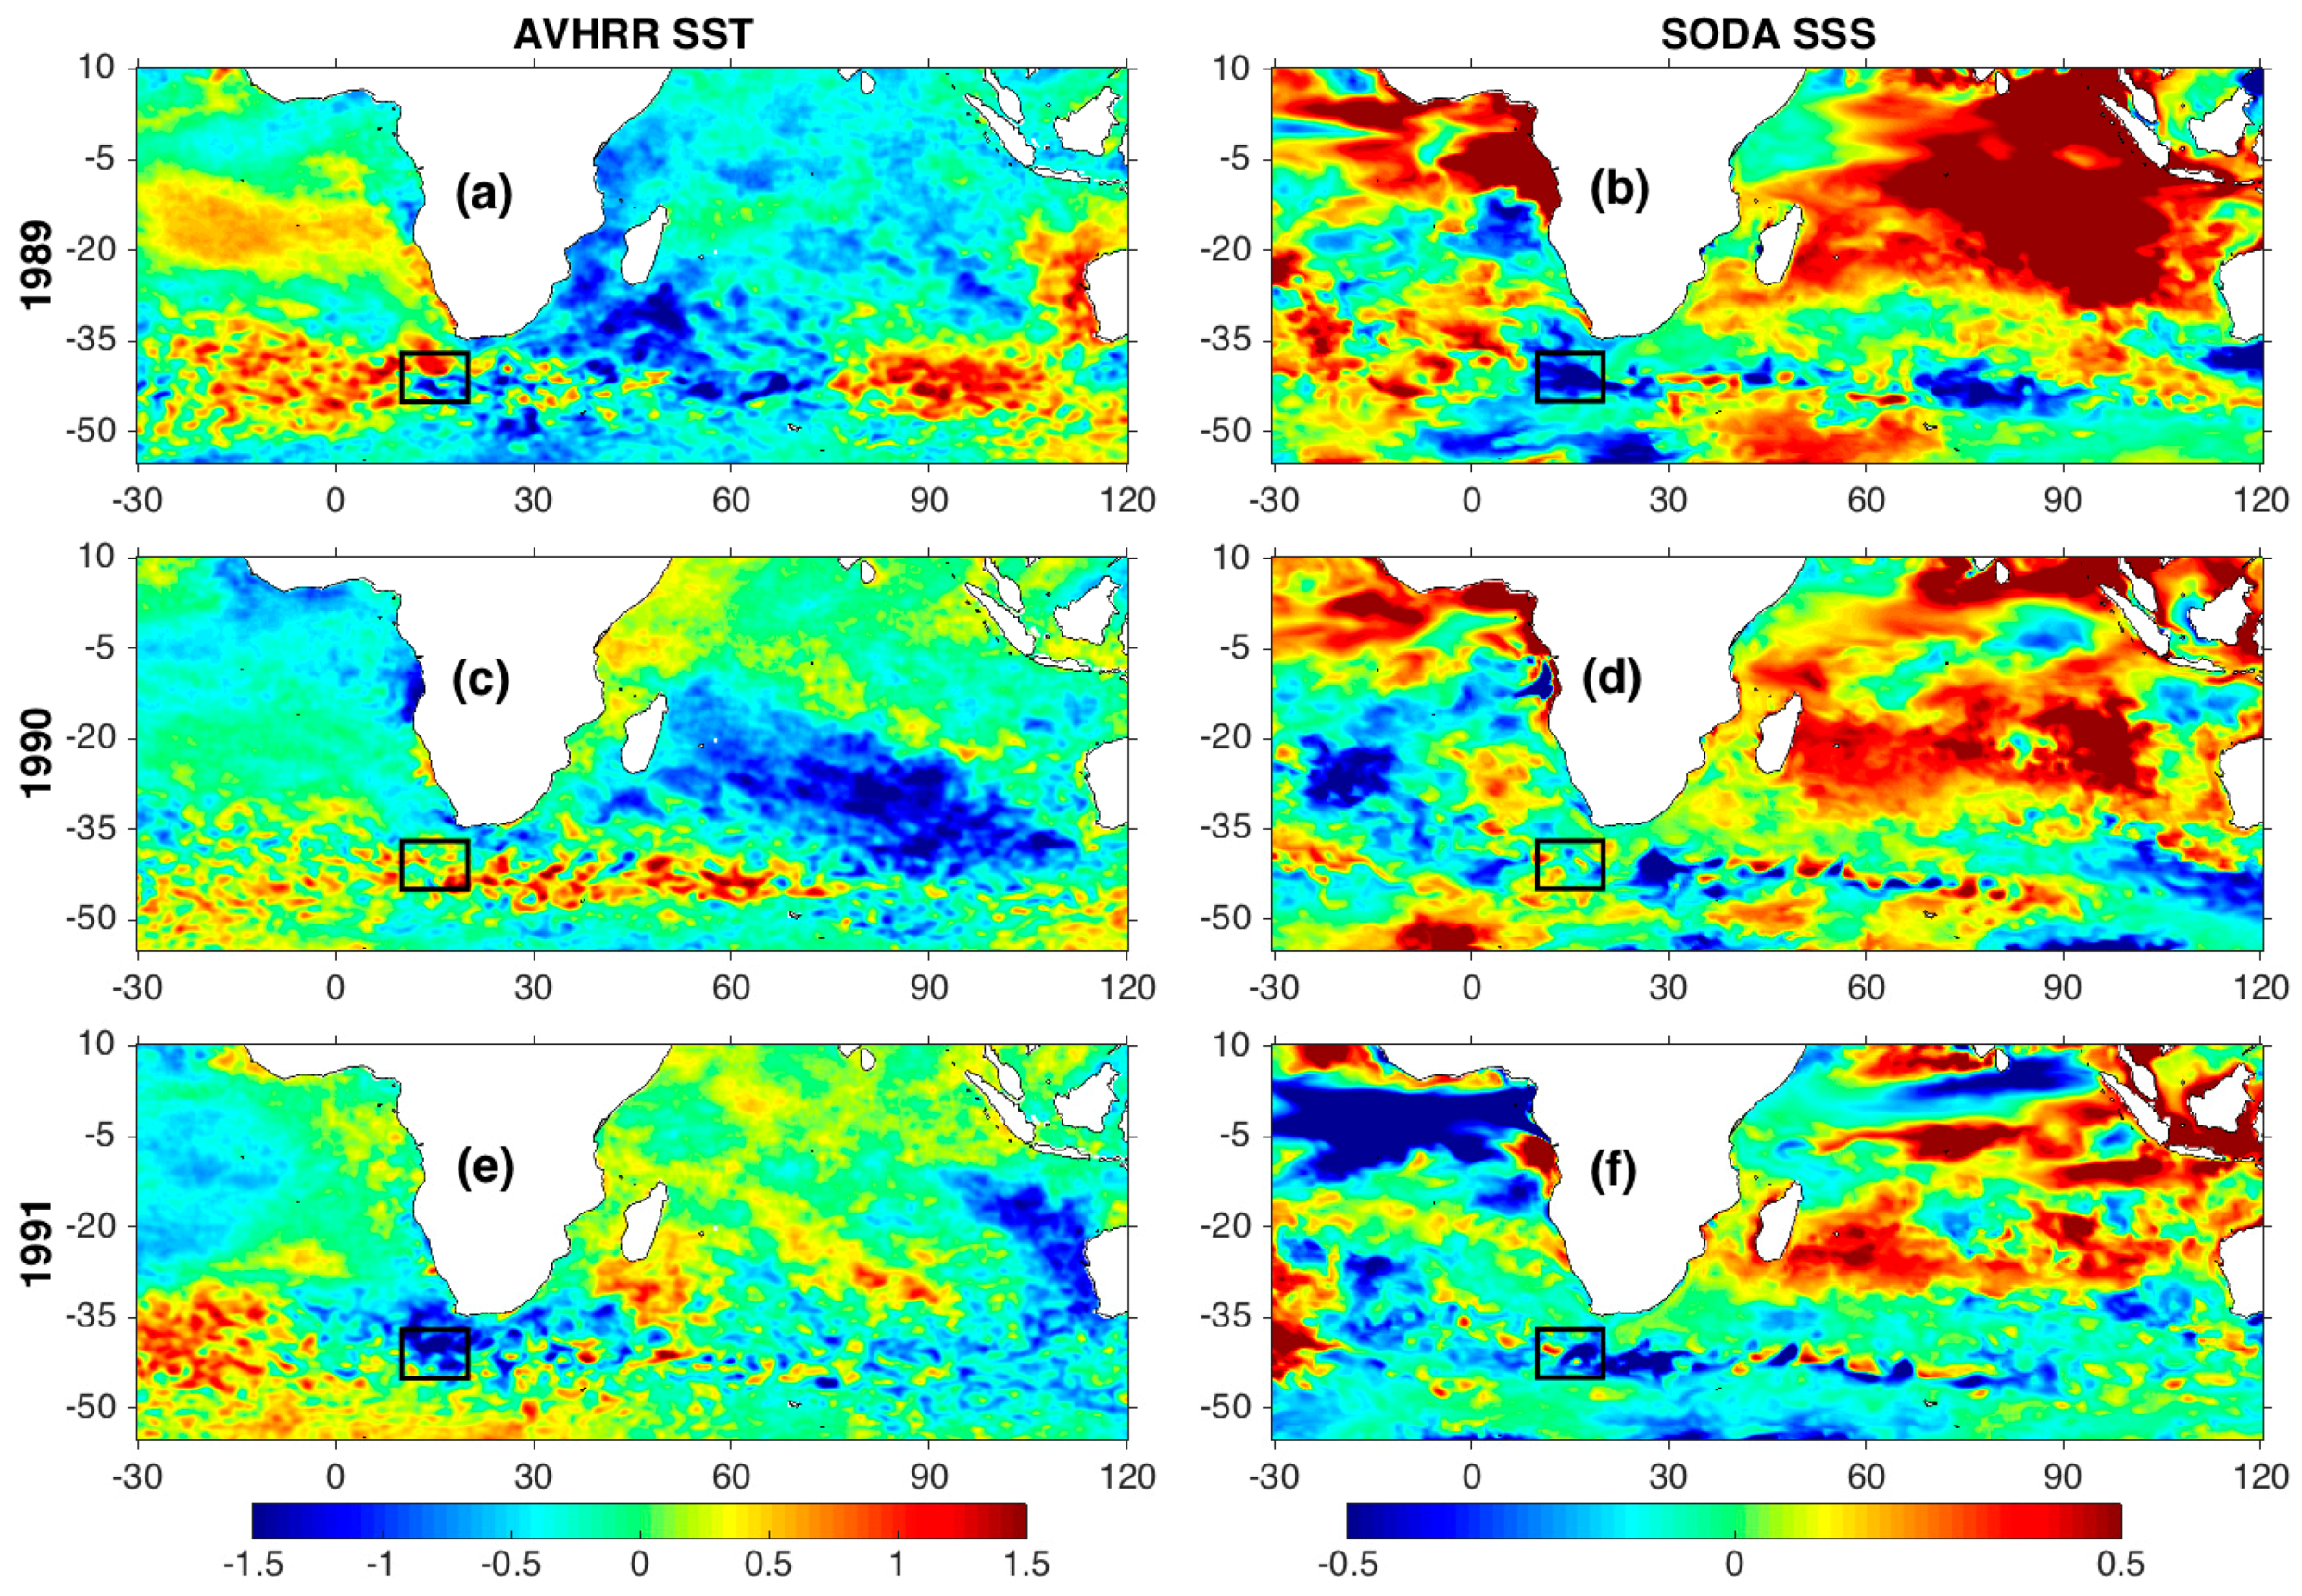
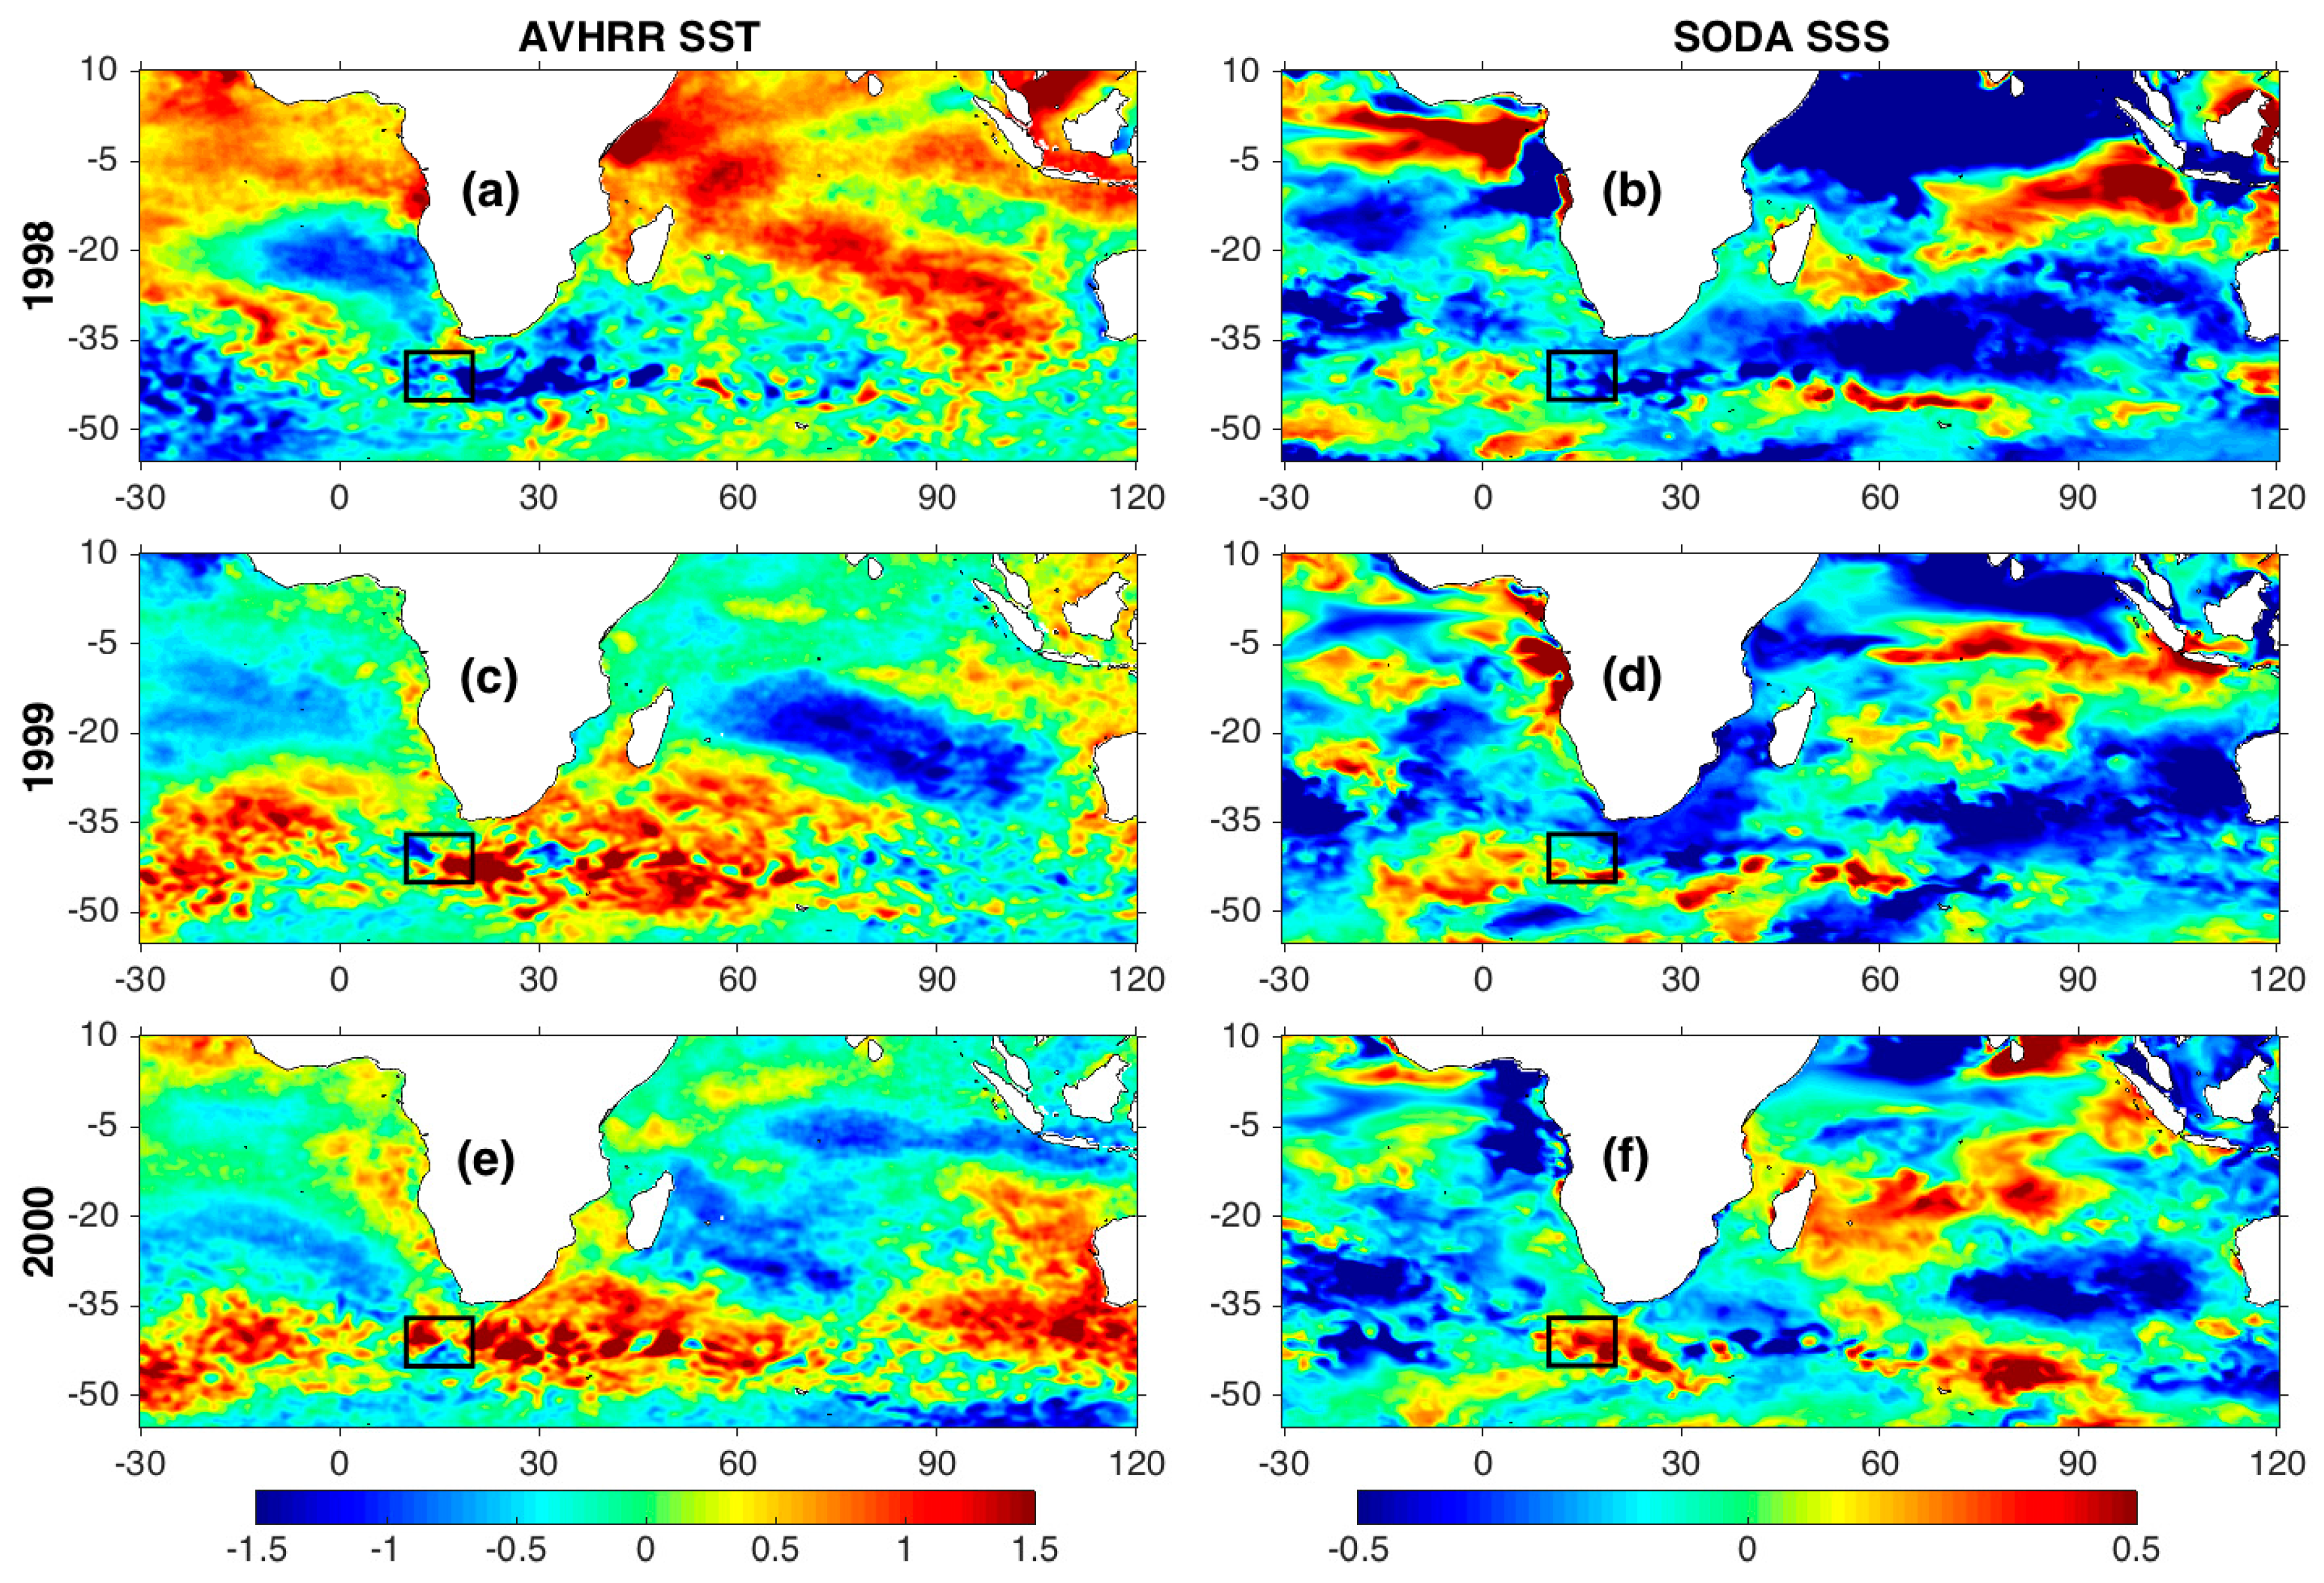
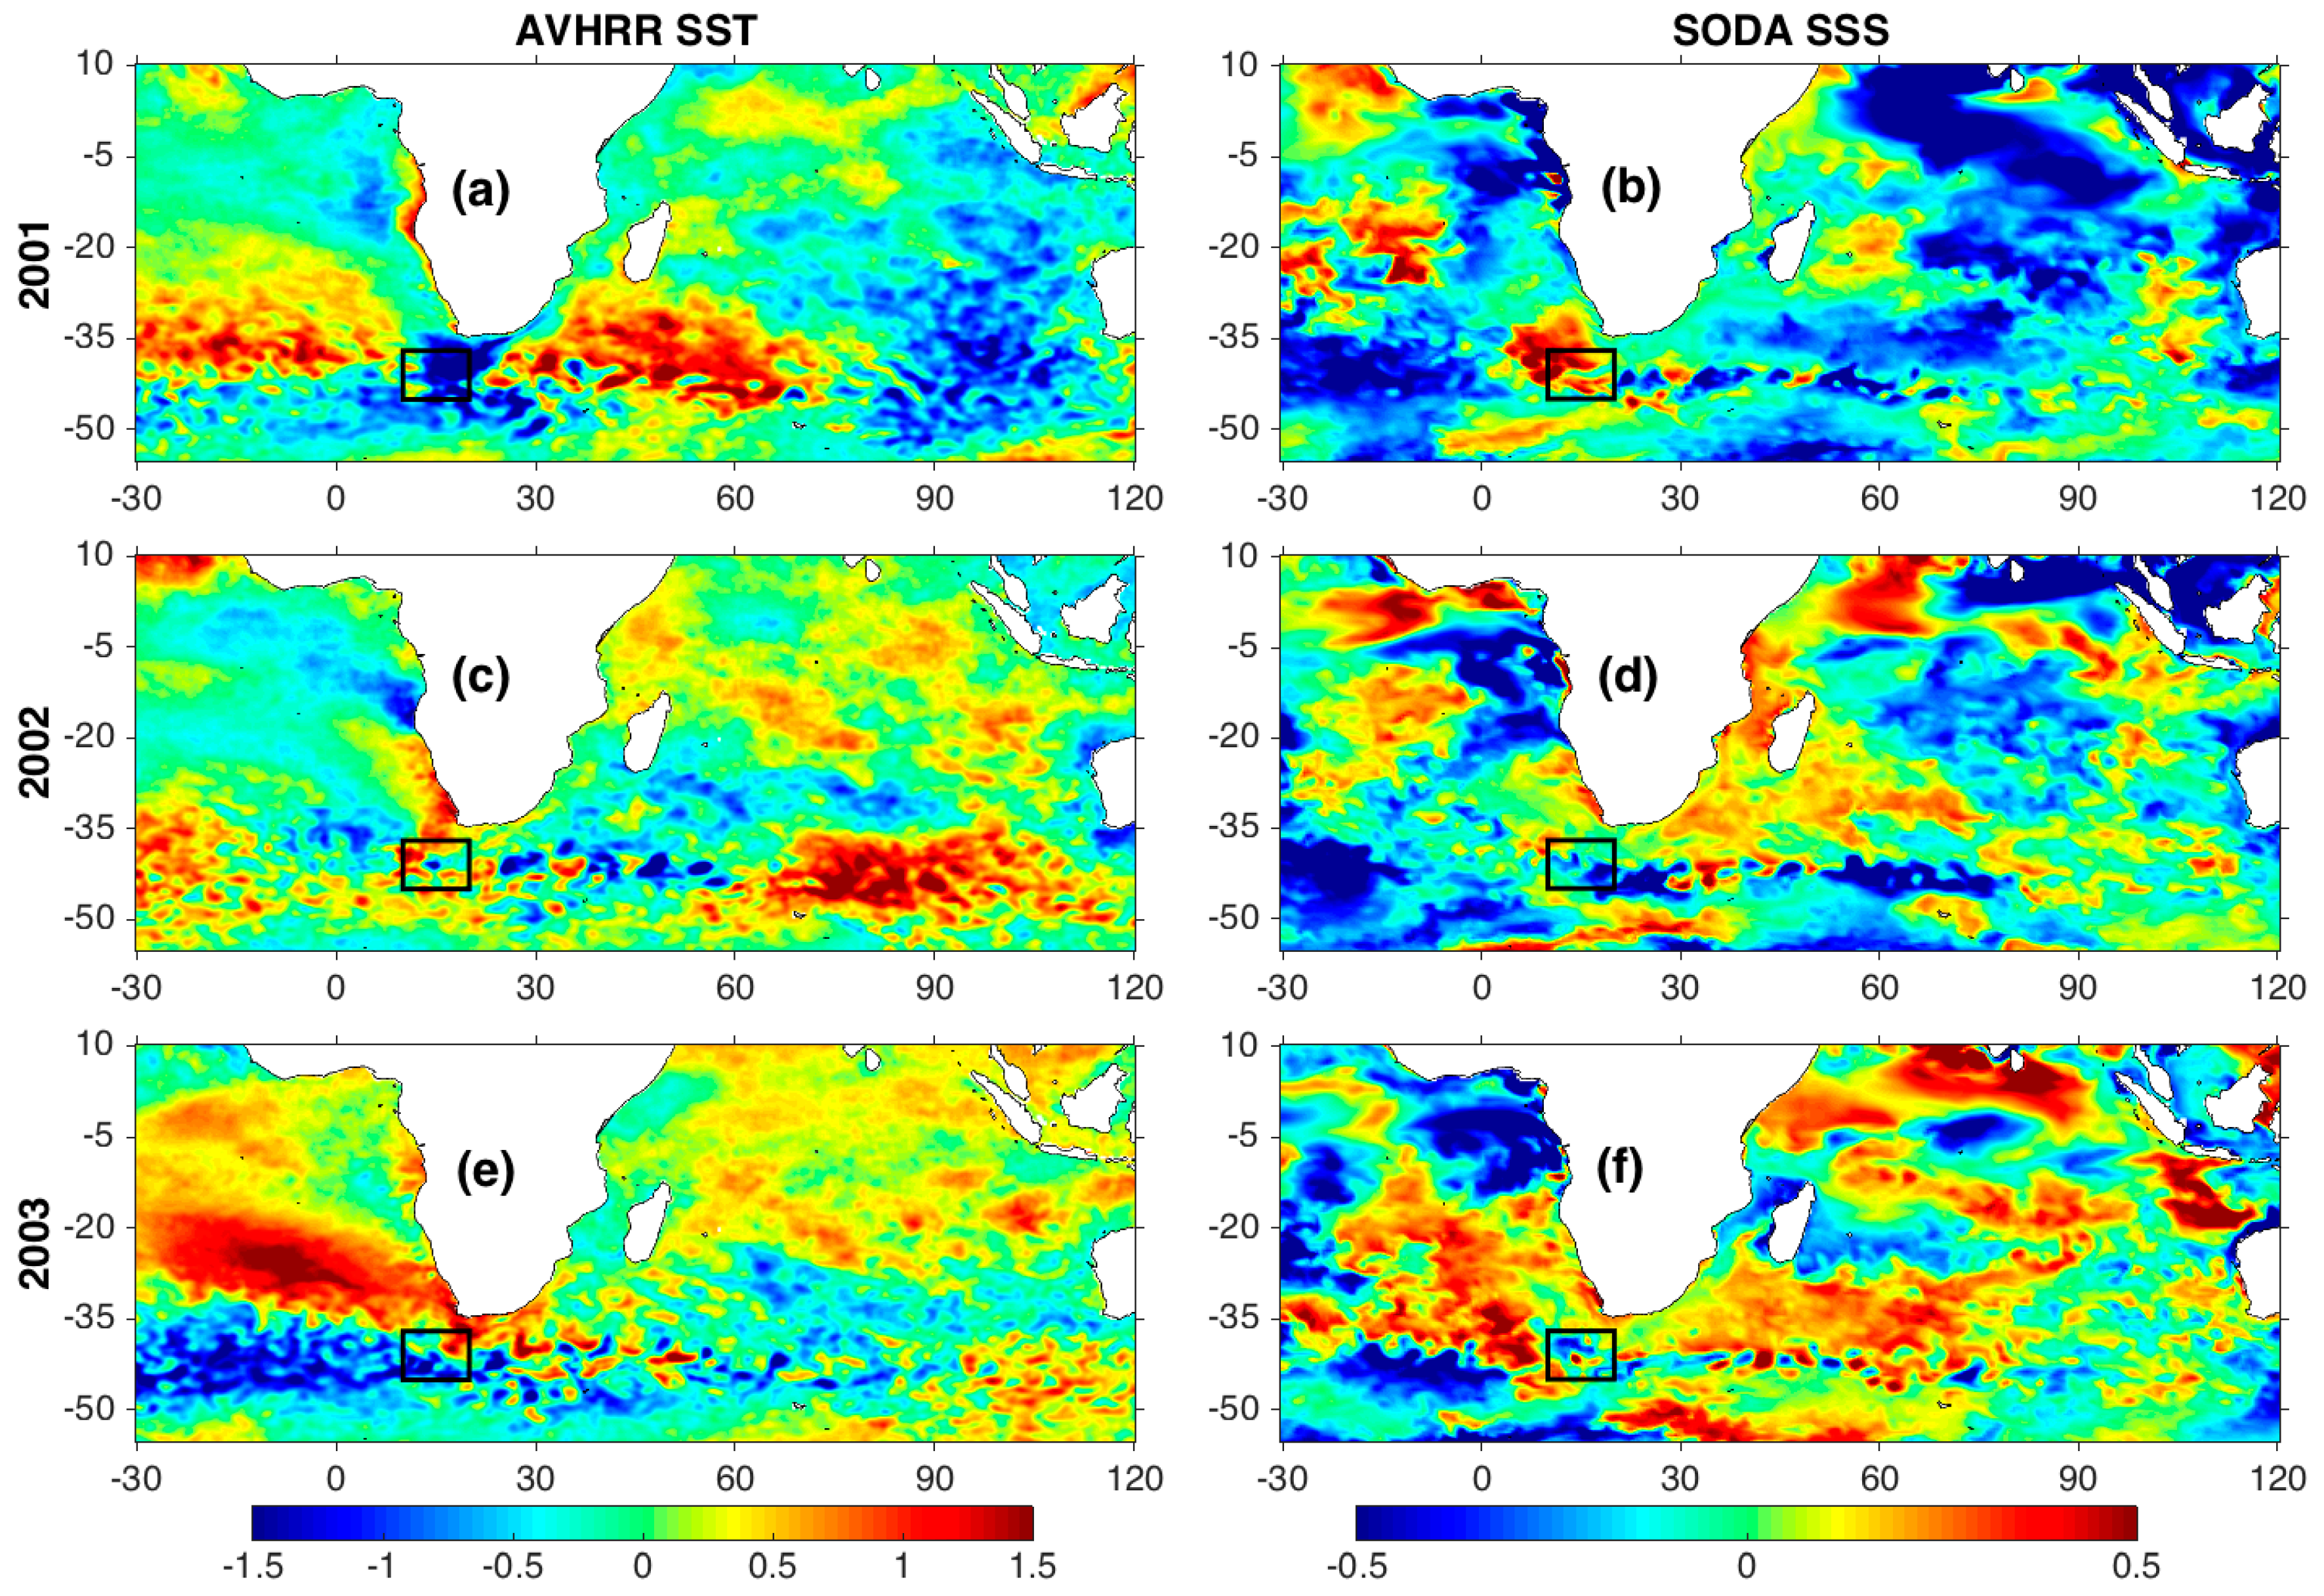
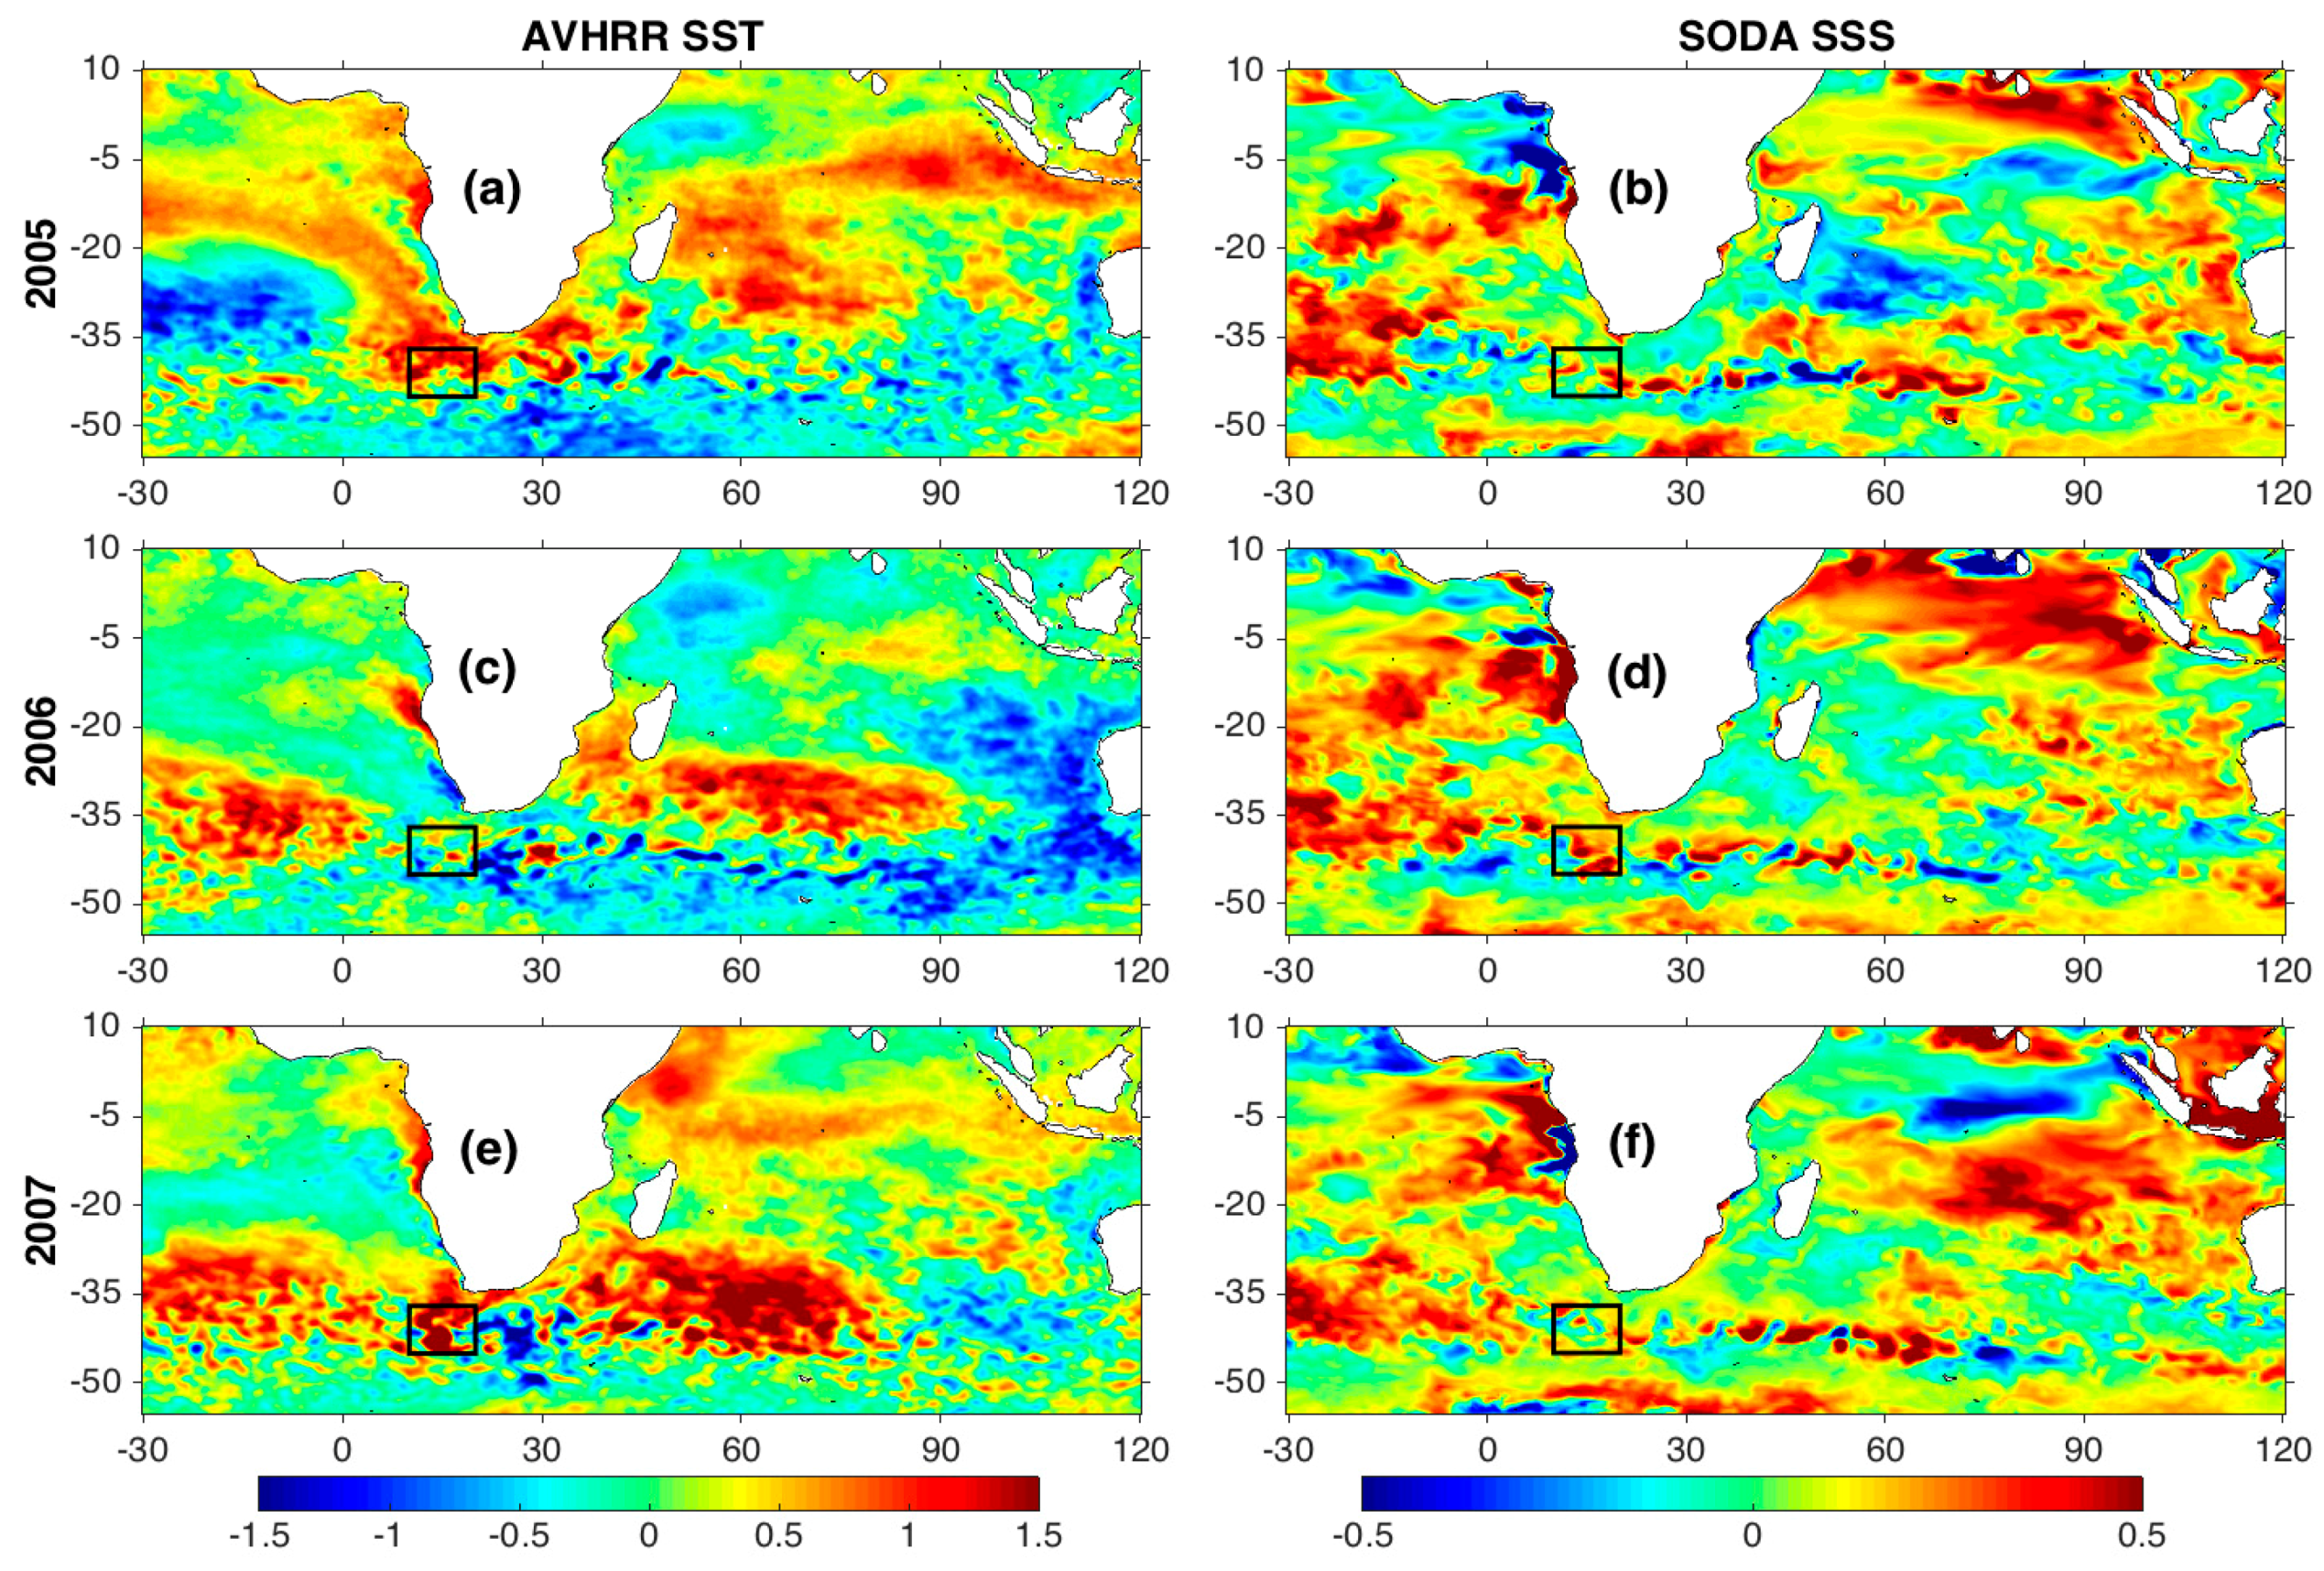
During the 36-year period between 1980–2016, a total of 11 El Niño and 10 La Niña events occurred (Table 1). The events varied in strength according to ONI values, with the strongest El Niño events occurring in 1982–1983, 1997–1998, 2015–2016 and the strongest La Niña event occurring in 1988–1989. Three El Niño years and five La Niña years are classified as weak events, while the majority of ENSO events are classified as moderate strength. Furthermore, the majority of El Niño events (6 events) directly transitioned to a La Niña episode the following year. However, between 2003–2007, three separate El Niño events occurred without a complete La Niña event in between. There were four occurrences in which a La Niña episode was directly followed by a second episode (Table 1). Both a strong and weak event for El Niño and La Niña was selected to explore the influence of ENSO strength on Agulhas leakage, as represented in Figure 4, Figure 5, Figure 6 and Figure 7. First and foremost, we analyze whether the individual ENSO events follow the same patterns of SST and SSS signal expression and propagation that was found in Section 3.1 for the average of all El Niño and La Niña events.
Beginning with the SST signal, we expect to see basin-wide warming (cooling) during the peak of El Niño (La Niña) that propagates westward the following year to surround Madagascar and east of Madagascar between 15°–35°S. Ultimately, two years after the peak of El Niño (La Niña) Agulhas leakage responds by releasing anomalously warm (cool) water. The SST signals of all four individual ENSO events during the peak year show the basin-wide temperature trend that can also be identified the following year near the coast of Madagascar (Figure 4a,c, Figure 5a,c, Figure 6a,c and Figure 7a,c). A response in Agulhas leakage two years after the peak of ENSO is evident in both strong events as well as the weak El Niño (Figure 4e, Figure 5e, and Figure 7e). Note, warm waters from the strong El Niño event are seen in the Agulhas leakage region as early as one year after the peak (Figure 5c). The weak La Niña, however, shows a mix of both warm and cool waters in 2003, two years after the peak of La Niña. The expected cool waters dominate the leakage box itself, but an evident warm pool has formed off the southern tip of Africa moving into the Atlantic (Figure 6e).
Moving on to the SSS signal, we expect that during the peak of an El Niño (La Niña) the Indian Ocean basin should be anomalously fresh (saline) in the north-west and saline (fresh) in the south-east i.e., express the primary and secondary SSS signal respectively. The following year, the dual pattern of primary and secondary SSS signals should persist, but shifted to the west so that the primary fresh (saline) waters surround Madagascar with the secondary saline (fresh) waters to the east moving westward. Finally, two years following the peak of El Niño (La Niña) the Agulhas leakage region should initially express the primary fresh (saline) waters and later transition to the secondary saline (fresh) waters. The dual SSS signals of the Indian Ocean basin is evident in the strong El Niño (Figure 5b) and to a lesser extent in the weak El Niño (Figure 7b) but the strong and weak La Niña express only a single saline or fresh signal respectively (Figure 4b and Figure 6b). Surrounding or approaching the Madagascar coast a year after the peak of ENSO, we see the expected primary saline signal for La Niña and primary fresh signal for El Niño for all events (Figure 4d, Figure 5d, Figure 6d, and Figure 7d). Finally, two years following the peak of ENSO, the strong La Niña shows anomalously fresh SSS because the expected primary saline signal is still near the Madagascan coast. It is important to note that this observed fresh signal is not indicative of the expected secondary signal due to the original dominant saline response in the Indian Ocean basin (Figure 4f). The weak La Niña, however, does show isolated areas of the expected primary saline leakage in 2003 with the secondary fresh signal observed surrounding Madagascar at the same time (Figure 6f). In comparison, the strong El Niño event expresses the expected primary fresh SSS signal as early as 1999 (Figure 5d). By the year 2000, the secondary saline signal is released in Agulhas leakage and continues to surround Madagascar (Figure 5f). The Agulhas leakage two years after the weak El Niño is a mix of the expected primary fresh SSS with some high-salinity waters. The expected high-saline secondary SSS signal is propagating toward Madagascar at this time (Figure 7f).
In addition, Figure 8 and Figure 9, showing the weak ENSO anomalies subtracted from the strong ENSO anomalies, support the observed differences between the strong and weak events and highlight other important variations. Positive (red) regions in these figures indicate that the stronger event expressed warmer SST or more saline SSS relative to the corresponding weak event. Negative (blue) values in these figures are indicative of cooler SST or fresher SSS anomalies during the strong event with respect to the corresponding weak event. The most noticeable difference between the strong and weak SST signal is the positive SST values in Figure 9c and negative SSS values in Figure 9d of the Agulhas leakage region. Furthermore, two years after the peak El Niño, the Agulhas leakage of a strong El Niño is warmer than that of the weak El Niño excluding a small region where an anomalously warm core eddy was present in leakage during the weak event (Figure 9d). The intensity of the SST anomalies of Agulhas leakage is also greater during a strong La Niña than the weak La Niña, as shown by the negative anomalies in Figure 8e. The same can be said for the primary saline SSS signal during La Niña (Figure 8f). In general, the SSS during the strong La Niña event is more saline across the entire Indian Ocean than the weak event (Figure 8b), and the strong El Niño more strongly expresses the dual SSS signal (saline in the south-east and fresh in the north-west) compared to the weak El Niño event (Figure 9b).
3.3. Temporal Variability of ENSO Signal
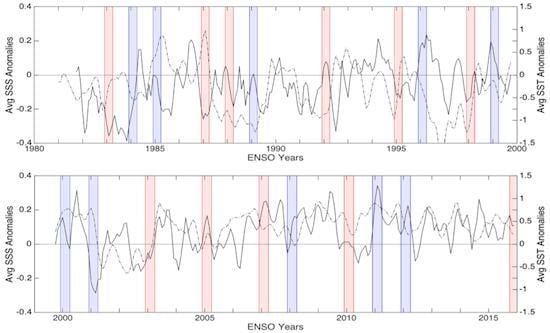
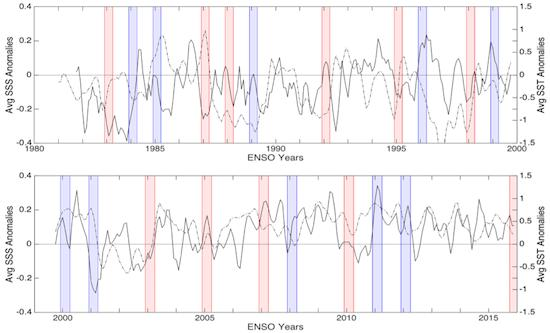
A time series of box-averaged SST and SSS anomalies in the Agulhas leakage region is shown in Figure 10. We used this time series to evaluate the changes in the SST and SSS of Agulhas leakage in response to all ENSO events that have occurred between 1981–2016. From the previous sections, we have defined the type of SST and SSS response observed for La Niña events compared to El Niño. In this section, we are primarily interested in further identifying the lag between the peak of an ENSO event and the SST and SSS response of Agulhas leakage. A lead-lag correlation analysis for both SST and SSS to the ONI index for ENSO was performed, and the results are presented in Figure 11. This figure serves as a quantitative analysis of the following trends from the time series.
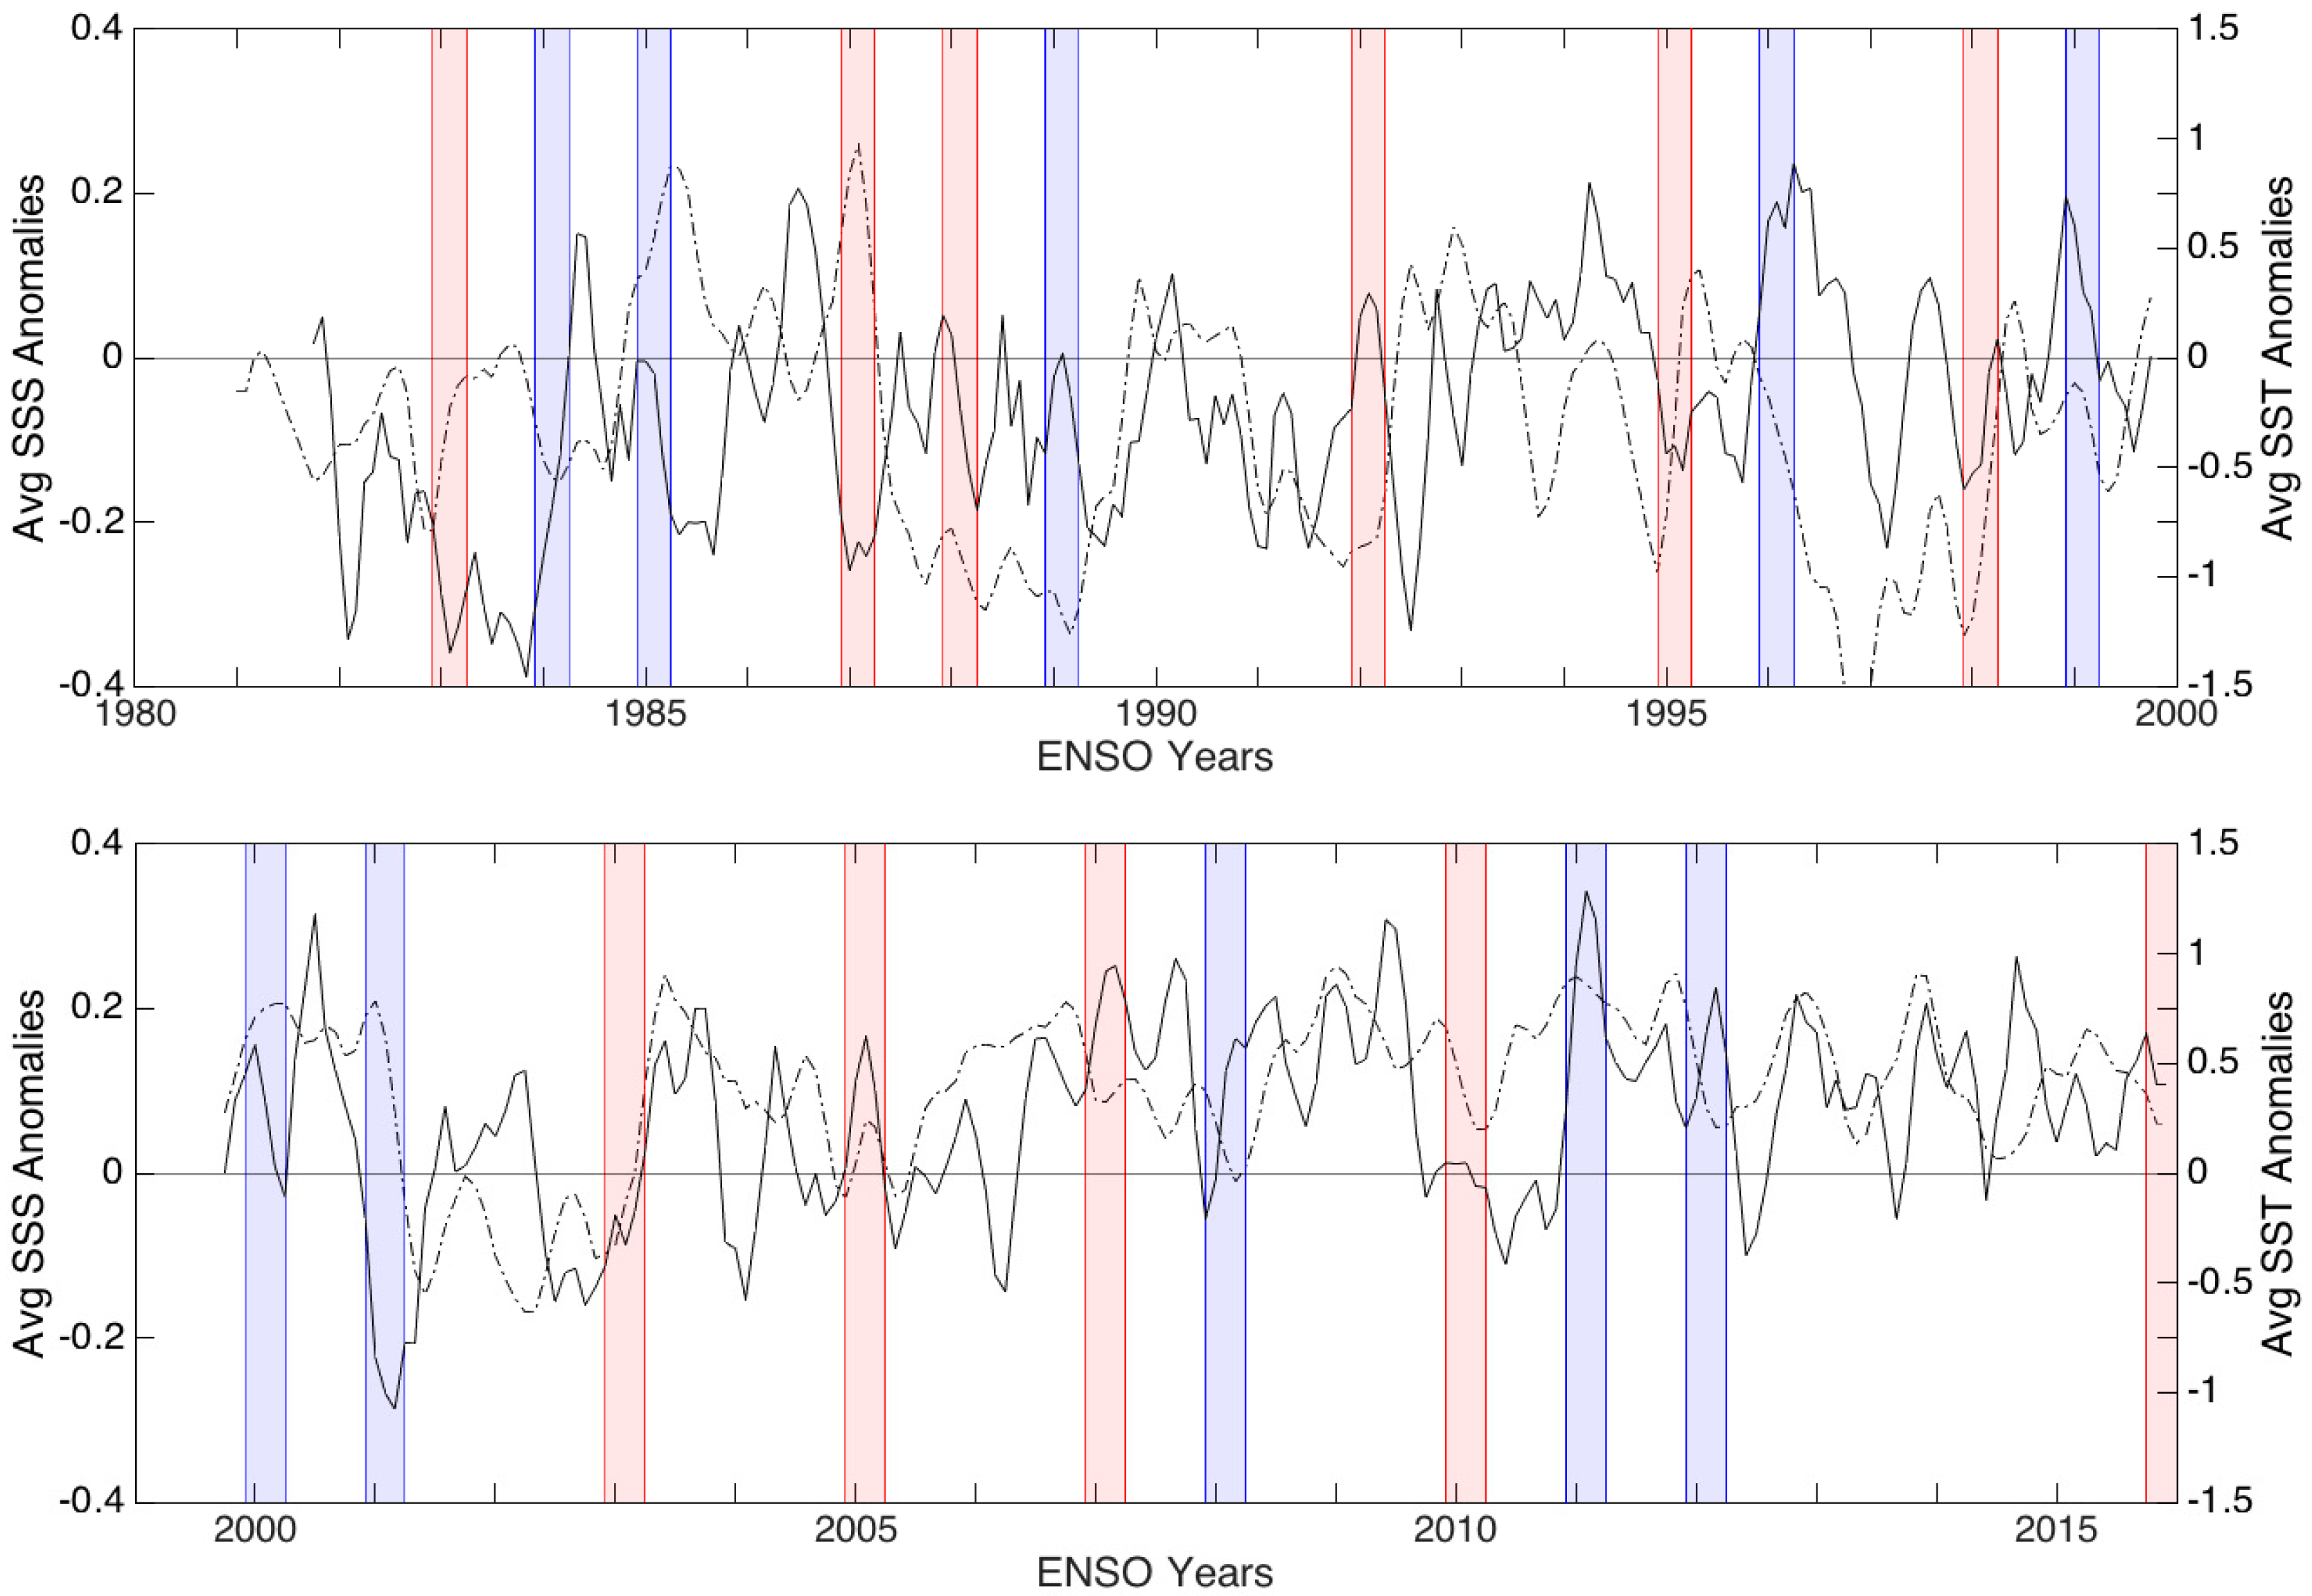
There are a few seasonal and decadal trends of Agulhas leakage that should be mentioned first. First and foremost, there is a natural yearly high to low fluctuation in SST and SSS. Additionally, after 2005 the SST and SSS show an increasing trend in which the anomalies rarely drop below zero. In general, the time series for SST and SSS closely mimic each other in shape, meaning that for observed peaks and dips in the SST time series there are corresponding peaks and dips in the SSS time series. A correlation analysis quantifies this association as having a correlation of 0.243. While this may seem low, it is important to notice that the SSS anomalies have a smaller range than SST anomalies, from −0.4 to 0.4 and −1.5 to 1.5, respectively. Also, the SSS trend line is shifted slightly right when compared to SST, thus explaining the low calculated correlation compared to what is observed in Figure 10. In the next paragraph, when we isolate trends with respect to ENSO events, it will become evident that SSS response shows the primary and secondary signal response, explaining why corresponding SSS response occurs later than that of SST.
When evaluating the time series with respect to ENSO events, we identify the anomalous SST and SSS values two years after the marked ENSO years. For all El Niño events, the SST trend line is strongly positive at this time and for all La Niña events, the SST trend line is strongly negative. Additionally, extreme values of SST are found to correspond to the strongest ENSO events. In particular in 2000, 2 years after a strong El Niño, the SST increases to nearly 1.2 °C. With respect to SSS, the same patterns emerge but, as previously noted, the corresponding positive (negative) peaks (dip) occur slightly after the two-year mark of El Niño (La Niña) because these are related to the secondary SSS signal. At the two-year mark itself, the opposite primary negative (positive) SSS signal is evident. Notably, more than two years after a strong El Niño event (1982–1983) an extreme SSS dip of nearly −0.2 is observed.
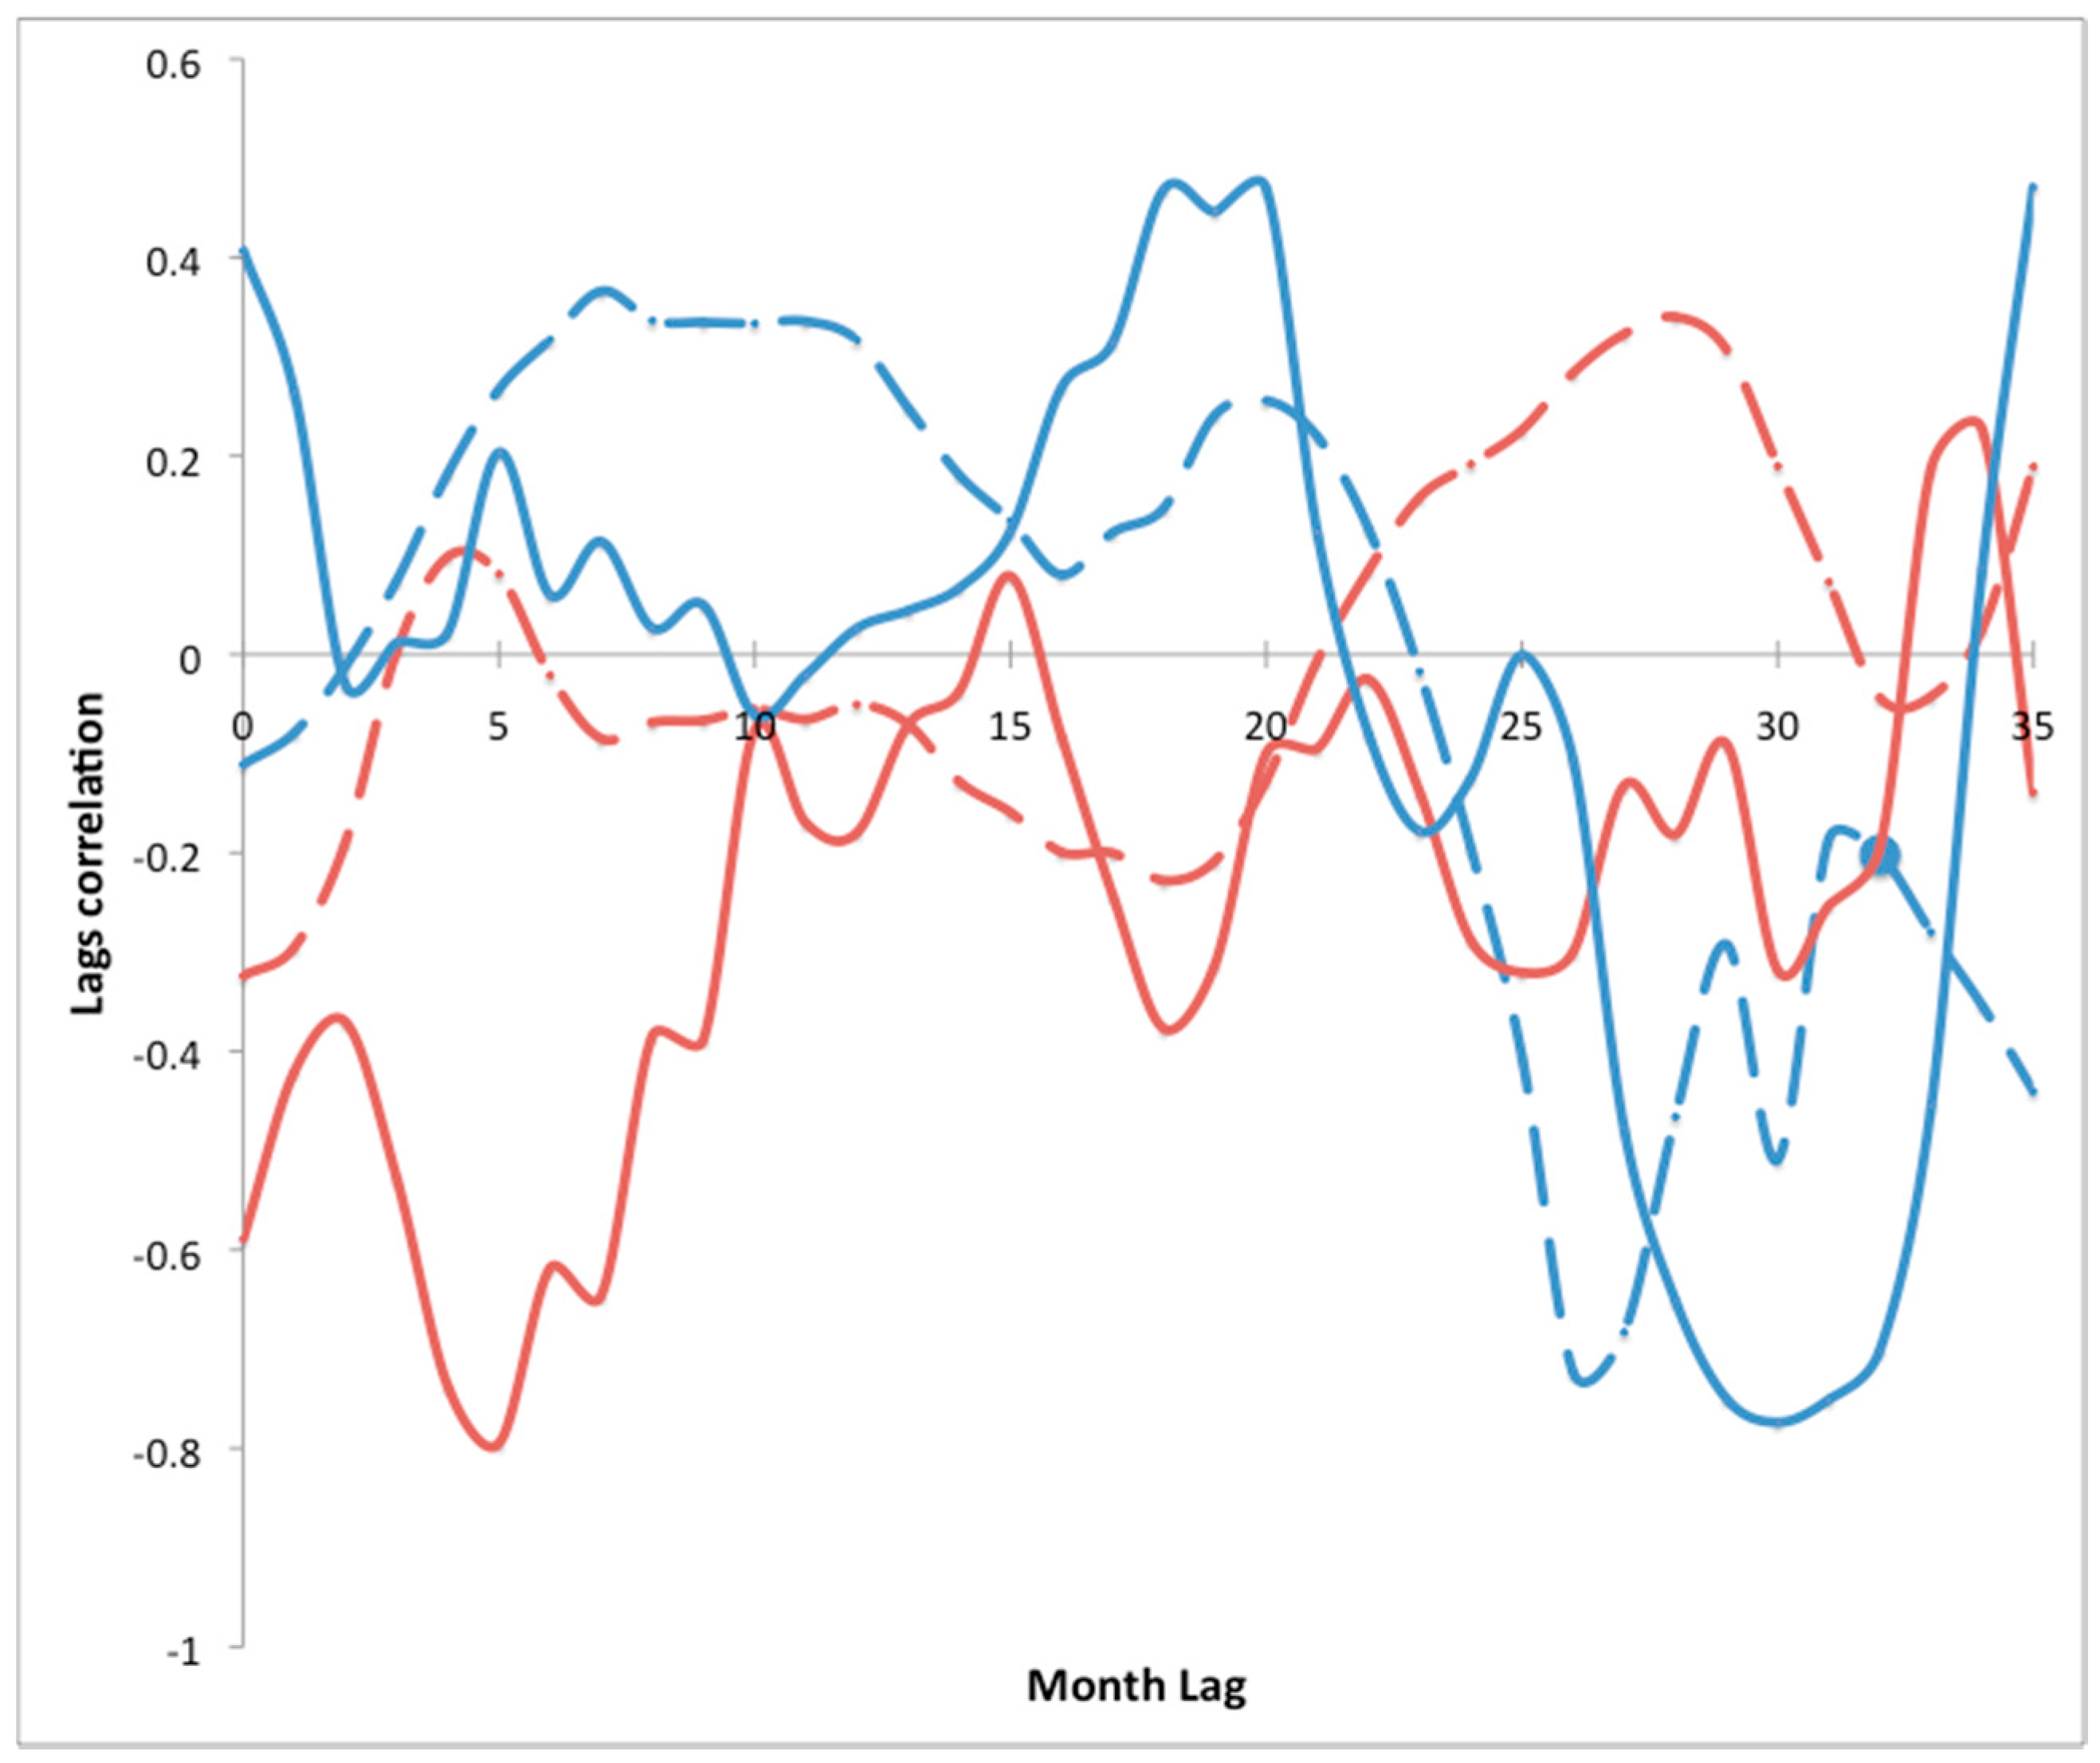
An additional lead-lag correlation analysis of the SST and SSS to the ONI ENSO index is included in order to analyze the time series with more precise quantitative measurement of the delay in response between the peak of ENSO and Agulhas leakage response. A positive correlation indicates that as the ENSO index strengthens, the anomalous SST and SSS is also increasing, meaning the Agulhas leakage is anomalously warm and saline. The opposite can be said for a negative correlation, as ENSO strength increases the SST and SSS are decreasing, meaning the Agulhas leakage is anomalously cool and fresh. During a La Niña event, it is expected that SST should have a negative correlation and the SSS should first show a positive correlation followed by a negative correlation, indicative of its primary and secondary SSS signal. Figure 11 indicates that the La Niña SST of Agulhas leakage has a positive correlation with the ONI index until 24 months after the peak of La Niña. A decrease in correlation begins as early as 20 months and continues on until the greatest negative correlation at 30 months after the peak of La Niña events. The corresponding SSS signal during La Niña is also dominantly positive, with the strongest positive correlation at a 20-month lag. After this peak, the correlation drastically decreases until the greatest negative correlation at a 26-month lag continuing to a 30-month lag. The same monthly lags apply to the El Niño SSS correlation but with the opposite sign: a negative correlation transitioning to a positive correlation. The SST correlation with El Niño is also opposite to that observed during La Niña. Most importantly, an increasing correlation is present at a 24-month lag for El Niño SST, which peaks with the strongest positive correlation at about a 34-month lag.
4. Discussion
4.1. SST and SSS Signal Response to El Niño and La Niña
According to Putrasahan et al. [10] and others, changes to circulation patterns coupled with Rossby wave propagation and wind-stress curl carry an ENSO signal from the Pacific, across the Indian Ocean, to alter Agulhas leakage. Putrasahan et al. [10] proved this connection by correlating warmer waters in the Agulhas leakage region to El Niño. We use this established connection to discuss the differences in the SST and SSS signal with respect to El Niño events compared to La Niña events, as presented in Section 3.1.
The observed SST signal of basin-wide warming (cooling) during El Niño (La Niña) from Figure 2a (Figure 1a) is consistent with the findings of Kug et al. [22] and Kilpatrick et al. [18] corresponding to fluctuations in Walker circulation and easterly (westerly) wind anomalies over Indonesia during the boreal winter/spring. The observed regions of positive and negative SSS in Figure 1b and Figure 2b can be attributed to the influence of anomalous ENSO conditions as well as coincident positive (negative) Indian Ocean Dipole (IOD) with El Niño (La Niña). Primarily, easterly (westerly) winds drive upwelling (downwelling) along the Sumatra coast, explaining the observed secondary signal of positive (negative) SSS anomalies further enhanced by reduced (increased) rainfall created from the atmospheric circulation patterns of El Niño (La Niña). The negative primary SSS signal observed in the equatorial Indian Ocean during El Niño is explained by horizontal advection of low salinity waters from the Bay of Bengal, while the primary positive SSS in the equatorial Indian Ocean during La Niña is produced by eastward-flowing Wyrtki jets [23].
A zero-lag SST and SSS response of waters near the tip of Africa is most likely related to changes in southern African rainfall associated with ENSO-driven SST patterns in the Pacific rather than ENSO SST and SSS signal transmission. Most of the severe droughts have happened during the mature phase of El Niño and the wettest summers during La Niña [24]. Decreased (increased) rainfall could explain the observed salinization (freshening) along the coast during El Niño (La Niña). Additionally, weaker (stronger) upwelling favorable winds are present during El Niño (La Niña), and this ultimately creates conditions in which SST is anomalously warm (cool) during El Niño (La Niña). This positive correlation between ENSO and SST and SSS properties applies only to the south coast of Africa, while a negative correlation exists with the Agulhas Current system south of 36°S [25]. In other words, it is highly unlikely that ENSO influences the SST or SSS signal of Agulhas leakage during the peak of the ENSO event. Instead, it is possible that atmospheric-related weather patterns associated with ENSO alter the SST and SSS conditions near the southern tip of Africa, explaining the observed changes to that region in Figure 1a,b and Figure 2a,b.
One year after the peak of ENSO, both the dominant SST signal and the dual SSS signal have shifted westward. The previous basin-wide trend in SST is isolated near the region east of Madagascar at ~15°–35°S. Note, this is the latitude where the SEC is found [15], supporting the idea that the SEC is involved in signal transmission. Grunseich et al. [23] attributes the westward movement of the SSS signal to Rossby waves associated with the westward flowing SEC. Most importantly, the SST signal and primary SSS signal surround Madagascar to interact with the source currents, which has the potential to influence eddy formation of the EMC and MC, thus continuing on to impact Agulhas leakage. This impact is initially seen two years after the peak of ENSO, as expected by the Putrasahan et al. [10] study. However, Putrasahan et al. [10] did not identify the continuation of this impact occurring for nearly 3 years after the peak of an El Niño (La Niña). During this time, the SST signal is consistently positive (negative) but the original primary fresh (saline) SSS signal is replaced by the secondary saline (fresh) SSS signal. Further evidence supporting the lag in response of Agulhas leakage is discussed in Section 4.3. From Figure 1, Figure 2 and Figure 3, representing the average response of SST and SSS to ENSO events, we have established that both the SST and SSS signal of Agulhas leakage have a contrasting response to an El Niño versus a La Niña event. A single opposite SST signal occurs two years after the peak of El Niño as compared to La Niña, warming and cooling respectively. The SSS response is composed of the initial primary signal followed by the opposite secondary signal. First, the SSS of Agulhas leakage is anomalously fresh (saline) two years after the peak of El Niño (La Niña). In the following months, this anomalously fresh (saline) signal is replaced by the secondary saline (fresh) SSS signal in Agulhas leakage. Furthermore, these figures provide a general understanding of the transmission of an ENSO signal. The signal originates in the Pacific Ocean and during the peak of an ENSO event (December–March) it moves into the Indian Ocean basin, changing SST and SSS properties. The following year, the SST and SSS signals propagate westward across the Indian Ocean basin to surround Madagascar and begin to influence the Agulhas Current. Strong changes to Agulhas leakage are observed two years following an ENSO event and continue for nearly three years after ENSO. This process is consistent with the circulation, Rossby wave, eddy process, and wind curl explained in the Introduction. The next section explores how the strength of an ENSO event alters this signal formation and transmission.
4.2. Variability of Agulhas Leakage in Response to Strength of ENSO Events
Figure 4, Figure 5, Figure 6 and Figure 7, showing individual ENSO events of either strong or weak strength, were analyzed in Section 3.2 for any deviations from the established SST and SSS trends identified in Section 3.1. Deviations from this established trend may be indicative of the interaction of ENSO strength on SST and SSS expression. With respect to the SST signal, the only deviation in signal propagation occurred near the Agulhas leakage region. During the strong El Niño episode, warm waters appeared a year earlier than expected and during the weak La Niña episode an evident warm pool formed off the southern tip of Africa contrasting the cool waters in the Agulhas leakage region. This warm pool occurred two years after the peak of the weak La Niña event in 2003. That year was also the peak of the 2002–2003 El Niño. In Section 4.1, we explained that atmospheric circulation associated with ENSO is known to cause warming near the tip of Africa, thus explaining this mixed signal during the weak La Niña.
There were several deviations from the established trend in the SSS signal. In particular, during the peak of La Niña for both the strong and weak event, there was only a saline or fresh signal, respectively, instead of the expected dual primary and secondary signals evident in both the El Niño episodes. The peak of the strong La Niña event, 1989, is also a negative IOD year that peaks in July [11], which may explain the strongly negative SSS signal. Furthermore, the clear dual SSS signal of the strong El Niño can partially be attributed to the positive IOD that peaked in November of 1998 [11]. The lack of any IOD influence may have inhibited the strong expression of an anomalous negative SSS in the north-western region during the weak La Niña. Regardless, the westward propagation of the SSS signal occurred as expected in all events. However, the influence of the primary SSS signal on Agulhas leakage, expected to occur two years following the peak ENSO event, was not consistent in all events. The primary signal was delayed in the strong La Niña event and appeared nearly a year early in the strong El Niño event. Interestingly, the primary signal was present in the Agulhas leakage two years after both the weak El Niño and La Niña. The mix of low salinity waters with the expected primary saline signal in Agulhas leakage two years after the weak El Niño may be the result of weak signal strength. While the primary fresh signal was present in the north-western Indian Ocean basin during the peak of this El Niño, it was not strong relative to the secondary saline signal, which may explain the corresponding weak expression in Agulhas leakage.
Trends identified in Figure 8 and Figure 9, highlight important differences between the strong and weak events and provide further support for the signal transmission discussed. The warm fresh Agulhas leakage signal was identified previously as occurring nearly a year earlier during a strong El Niño. This is further supported by the positive and negative SSS values identified in the Agulhas leakage region (Figure 9c,d). The stronger anomalies identified in the Agulhas leakage region with respect to strong ENSO events indicate that ENSO strength is proportional to signal strength. Lastly, the trends referring to the expression of SSS in the Indian Ocean are most likely attributed to the IOD influence previously mentioned rather than differences in ENSO strength.
In conclusion, the established SST and SSS signal response to El Niño and La Niña is consistent for all events of varying ENSO strength, but the strength appears to influence the intensity of the signal and the time of its transmission, thereby explaining any variations from the established trends. In general, increasing ENSO strength increases the extremes of the resulting anomalous signal and impacts the Agulhas leakage region earlier during El Niño and slightly later during La Niña. As previously discussed, weakened trade winds in the Pacific and resultant strengthened trade winds in the tropical Indian ocean create a zonal band of positive wind-stress curl over the tropics which Putrasahan et al. [10] correlated to the Agulhas leakage response. Knowing this, we can support this observed variation in time of signal propagation with ENSO phase and strength to a corresponding change in the strength of wind-stress curl [17]. As trade winds strengthen in the tropical Indian Ocean during stronger El Niño events, a corresponding increase in wind-stress curl would be expected across the tropical Indian Ocean, providing increased propagation of the SSS and SST signals. The opposite can be said for stronger La Nina events which correspond to further weakening of trade winds in the tropical Indian Ocean and a corresponding decrease in wind-stress curl slowing propagation of the SSS and SST signals. This temporal perspective is further explored in the next section.
4.3. Temporal Variability of ENSO Signal
In Section 3.3, we used the time series (Figure 10) to evaluate changes in the SST and SSS of Agulhas leakage for all ENSO events between 1981–2016. We also conducted a quantitative analysis of the trends from the time series using the lead–lag correlation analysis in Figure 11. Explaining the seasonal trends in the time series helps to better understand how the Agulhas leakage SST and SSS time series is changing with respect to ENSO. The naturally annual fluctuations in SST and SSS are likely attributed to a seasonal signal related to changes in current speed [26]. The increasing trend in the time series after 2005 could be indicative of a decadal warming trend observed in the Agulhas Current region [27] and an increase in leakage in response to shifting Southern Hemisphere westerlies [28].
When evaluating the time series with respect to ENSO events, we evaluated the anomalous SST and SSS values two years after the marked ENSO years, because the time series represents a box average of Agulhas leakage and in the previous sections the initial response of Agulhas leakage to the ENSO signal was found at this time. The trends in the time series at this time support the temporal perspective of both the primary and secondary SSS signal and the single dominant but lasting SST signal observed in the Agulhas leakage region.
The time series in Figure 10 only serves to provide a general qualitative analysis of the trends found in the previous sections and the time during which they are taking place. The lead–lag correlation analysis of the SST and SSS to the ONI ENSO index in Figure 11 supports this analysis with a more precise quantitative measure of the delay in response between the peak of ENSO and the Agulhas leakage response. The trends identified in Figure 11 support the existence of a single SST response of Agulhas leakage to ENSO, and this response has an average lag of ~20 months that persists and strengthens until a lag of nearly 30 months. Additionally, the dual primary and secondary signal response of the SSS of Agulhas leakage to ENSO is supported in Figure 11. The primary SSS signal has an average lag of ~20 months followed by the opposite secondary SSS signal at a lag of ~26 months.
5. Conclusions
Thus far, we have explored yearly fluctuations in Agulhas leakage using anomalous SST from AVHRR and SSS from SODA reanalysis. Figure 1 and Figure 2 show that the response of Agulhas leakage to an El Niño event is opposite to that of a La Niña event for both SST and SSS. The single dominant SST response of Agulhas leakage occurs around 20 months and continues for nearly 30 months after the peak of ENSO and is anomalously high for El Niño and anomalously low for La Niña. At the same time, the corresponding SSS signal is anomalously saline for La Niña and fresh for El Niño. However, the SSS signal is composed of this initial primary signal, which reaches the region first, followed by the secondary signal that reaches Agulhas leakage about 26 months after the peak of ENSO. The secondary signal is fresh for La Niña and saline for El Niño. Additionally, Figure 3, Figure 4, Figure 5, Figure 6, Figure 7, Figure 8, Figure 9 and Figure 10 suggest ENSO strength influences the intensity of both the signal and the time of its transmission. In general, increasing ENSO strength increases the extremes of the resulting anomalous signal and impacts the Agulhas leakage region earlier during El Niño and slightly later during La Niña. Correlation observations from Figure 11 support the Putrasahan et al. [10] proposed 2-year period for an ENSO signal to influence Agulhas leakage and also establishes the lags for the primary and secondary SSS signal response of Agulhas leakage.
The aim of this study was only to highlight that a relationship between ENSO and Agulhas leakage exists and define this relationship using SST and SSS, as well as to identify the time in which this response lags an ENSO event. We also explored the effect of ENSO strength on this relationship. Most notably, this study evaluates this process from start to finish to not only show that ENSO-generated SST and SSS signals influence Agulhas leakage, but also where these signals originate and how they propagate, providing a visual and qualitative representation of the connection between the Pacific, Atlantic, and Indian Ocean. Further investigation is required to understand the dynamics of the various systems involved in this relationship and signal propagation. Suggestions for future work include addressing how the eastern and central modes of El Niño may change this relationship. Furthermore, the depth signal of this described trend is another important parameter worth considering. This paper relied primarily on AVHRR SST and SODA SSS. Both data sets have been used in countless previous studies to explore the Indian Ocean basin or Agulhas current system and have been proven reliable for doing so [23,25]. However, it is important to note some issues with these data sets that may have influenced the results. Specifically, when conditions deviate from the mean atmosphere and ocean conditions, errors arise in AVHRR SST retrieval [18]. Therefore, AVHRR is unable to perform properly under cloudy conditions and direct sunlight, and we mentioned earlier that rainfall events are an expected response to La Niña events. The full intensity of SST readings may, therefore, be compromised due to interpolation to account for missed readings due to cloud or direct sunlight interactions. Future studies may benefit from using another data source for SST and compare the findings. Additionally, SSS from SODA is reanalysis-based. Observational comparisons would be beneficial to further support the findings in this paper.
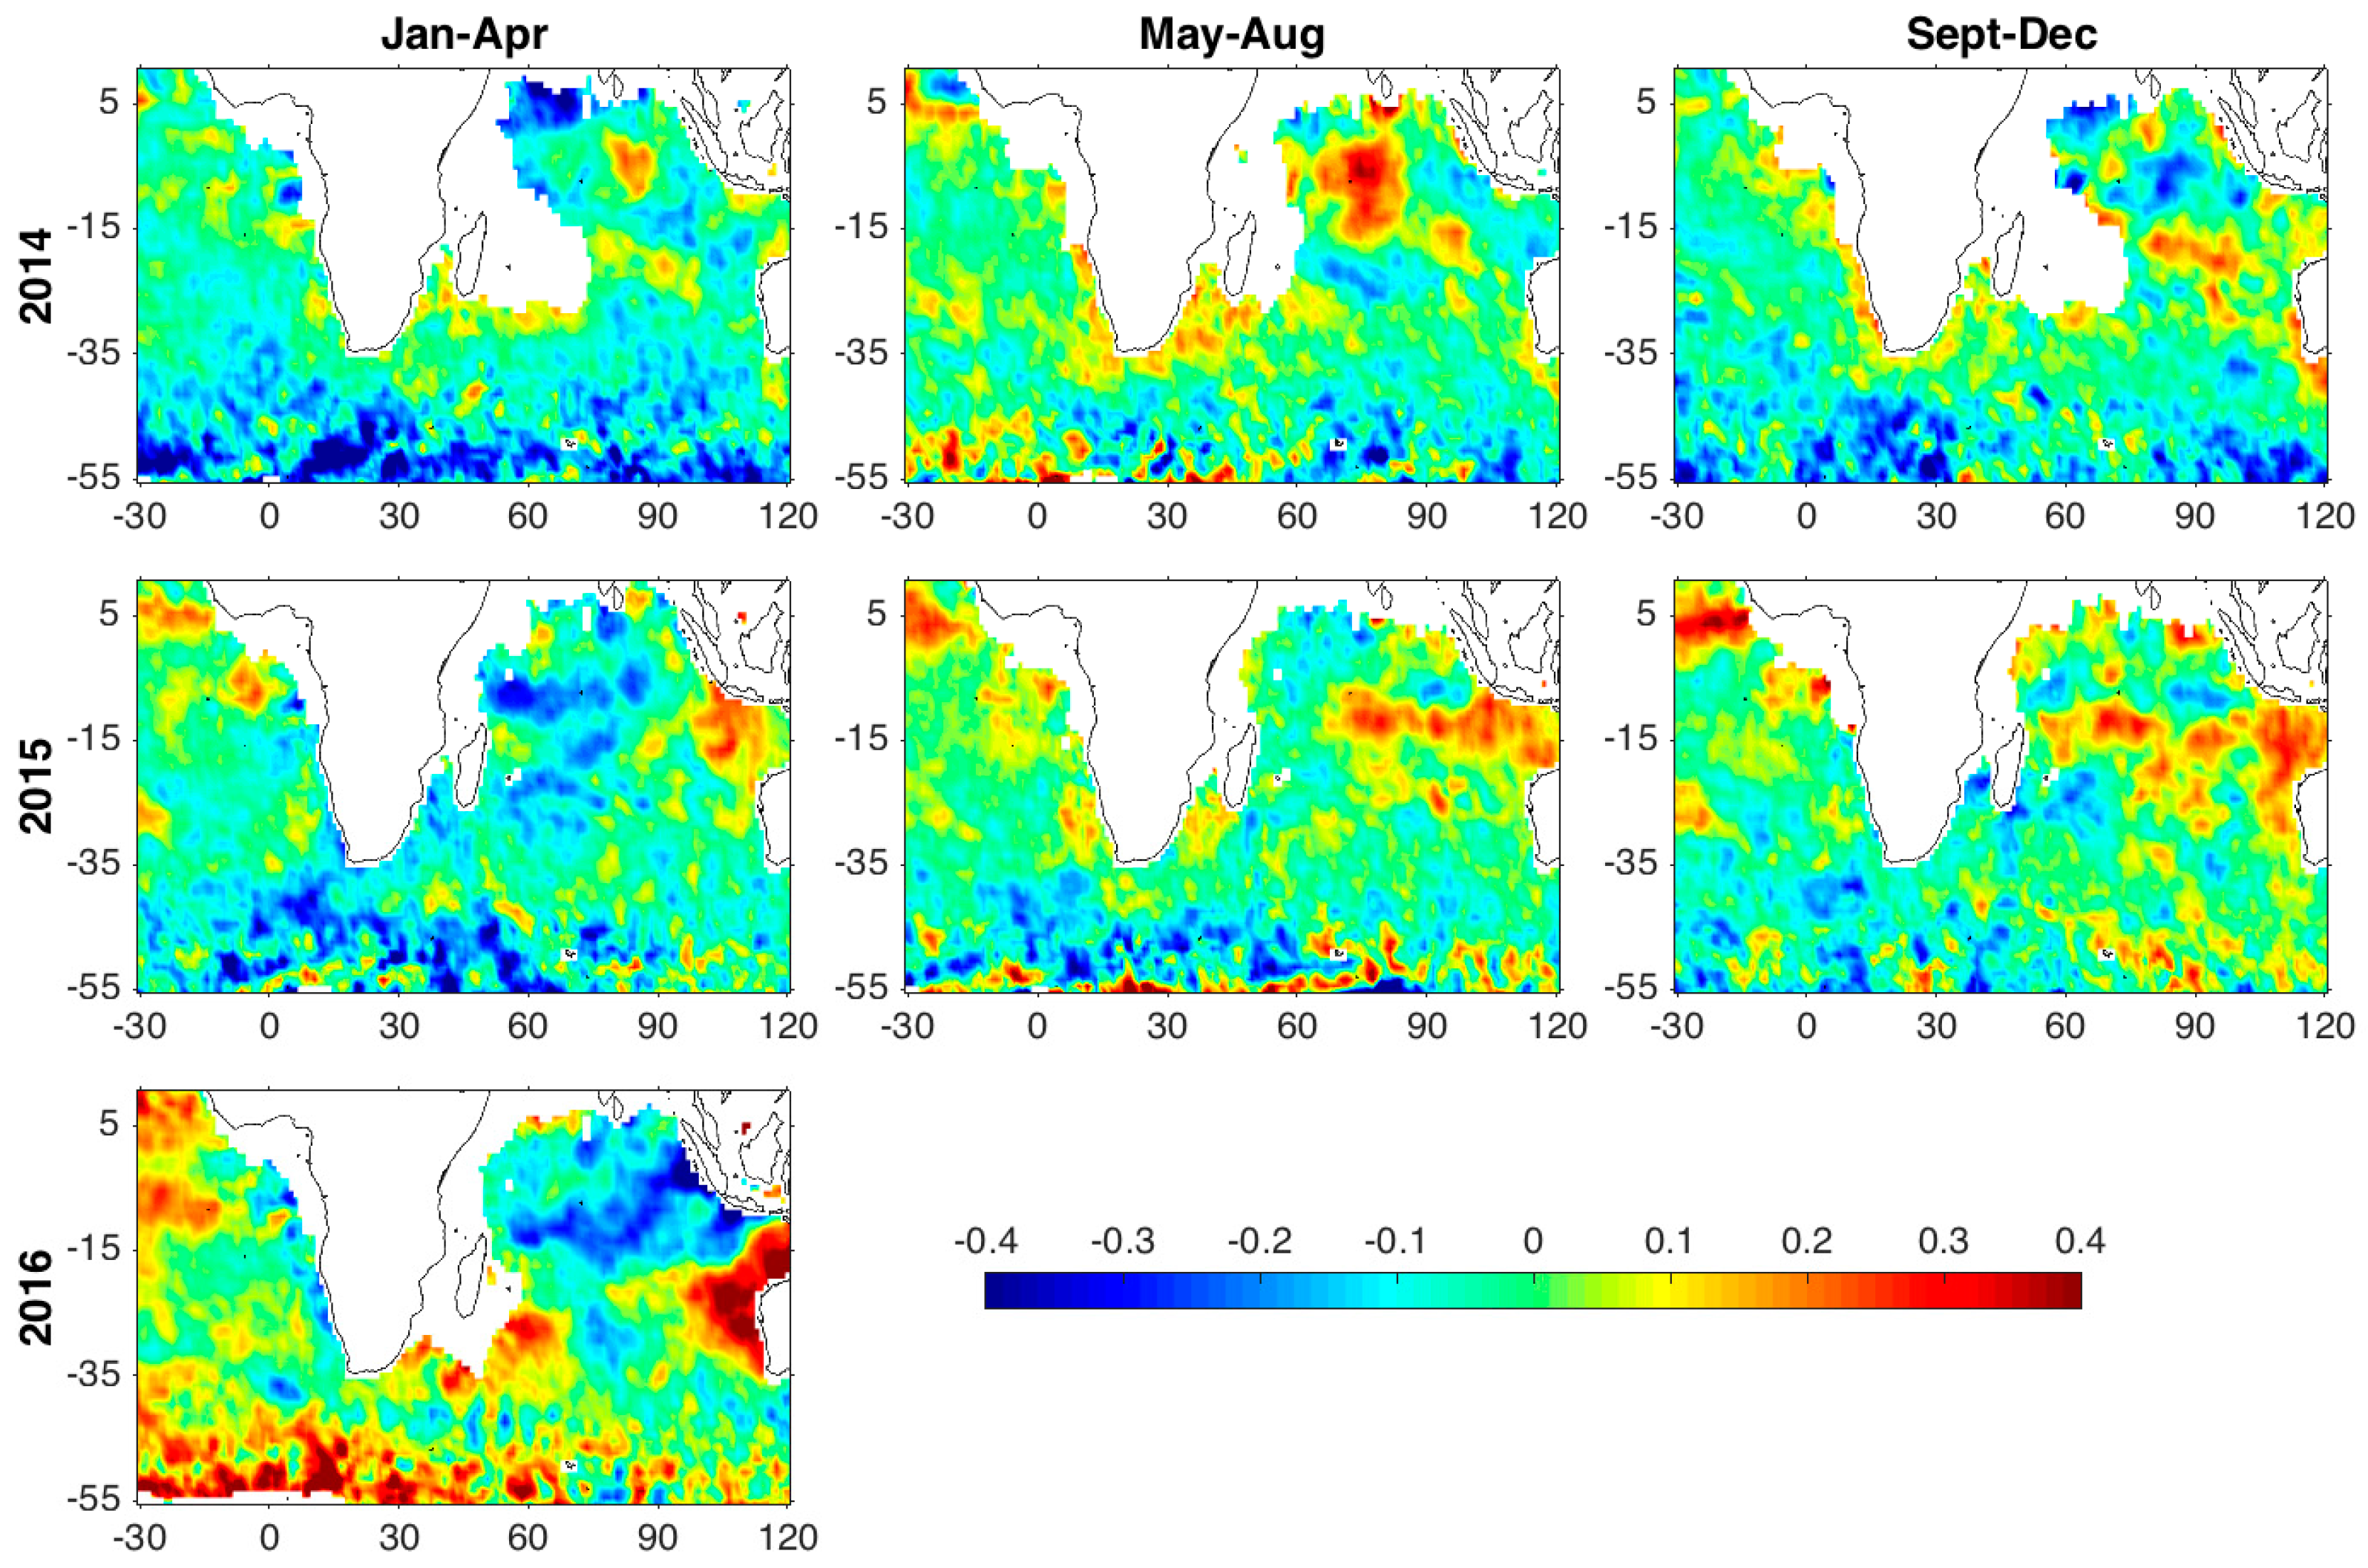
We include an additional figure, Figure 12, to show that recent salinity missions will be valuable resources for future work in this field. Figure 12 highlights the SSS signal from SMOS of the most recent El Niño event (2015–2016). SMOS is able to provide a more accurate representation than previously available models. Also, recently launched (launch date: 31 January 2015 and data availability since April 2015) Soil Moisture Active Passive (SMAP) derived salinity will be useful in ENSO studies.
Acknowledgments
This work is supported by the NASA/South Carolina Space Grant Consortium Mini-REAP grant awarded to BS. The Authors duly acknowledge the various data sources for the freely available data. AVHRR SST is downloaded from the National Center for Environmental Information (http://iridl.ldeo.columbia.edu/SOURCES/.NOAA/.NCDC/.OISST/.version2/.AVHRR/.sst/). The SMOS binned data used for this study is the level 3 Operational V2.0 provided by the ESA obtained from the SMOS Barcelona Expert Center Data distribution and visualization services (http://cp34-bec.cmima.csic.es/data/data-access/). The SMAP data are produced by Remote Sensing Systems, Santa Rosa, CA, and version 2.0 level 3 is obtained from NASA JPL PO.DAAC. SODA reanalysis product is a multi-institutional collaborative project between Texas A&M University and University of Maryland, which is obtained from the Asia-Pacific Data Research Center (APDRC) of the International Pacific Research Centre (IPRC). The authors would like to thank three anonymous reviewers and the editor, whose comments significantly contributed to the improvement of this paper.
Author Contributions
Morgan L. Paris and Bulusu Subrahmanyam conceived and designed the data analysis and interpretation of the results. Morgan L. Paris prepared all the figures and writing of this article, and Bulusu Subrahmanyam designed the project, guided this work and corrected the paper.
Conflicts of Interest
The authors declare no conflict of interest. The founding sponsors had no role in the design of the study; in the collection, analyses, or interpretation of data; in the writing of the manuscript, and in the decision to publish the results.
References
- Ridgway, K.R.; Dunn, J.R. Observational evidence for a Southern Hemisphere oceanic supergyre. Geophys. Res. Lett. 2007, 34. [Google Scholar] [CrossRef]
- Beal, L.M.; De Ruijter, W.P.; Biastoch, A.; Zahn, R. On the role of the Agulhas system in ocean circulation and climate. Nature 2011, 472, 429–436. [Google Scholar] [CrossRef] [PubMed]
- Simon, M.H.; Arthur, K.L.; Hall, I.R.; Peeters, F.J.; Loveday, B.R.; Barker, S.; Ziegler, M.; Zahn, R. Millennial-scale Agulhas Current variability and its implications for salt-leakage through the Indian–Atlantic Ocean Gateway. Earth Planet. Sci. Lett. 2013, 383, 101–112. [Google Scholar] [CrossRef]
- Biastoch, A.; Durgadoo, J.V.; Morrison, A.K.; Van Sebille, E.; Weijer, W.; Griffies, S.M. Atlantic multi-decadal oscillation covaries with Agulhas leakage. Nat. Commun. 2015, 6. [Google Scholar] [CrossRef] [PubMed] [Green Version]
- Ruijter, W.D.; Biastoch, A.; Drijfhout, S.S.; Lutjeharms, J.R.E.; Matano, R.P.; Pichevin, T.; Weijer, W. Indian-Atlantic interocean exchange: Dynamics, estimation and impact. J. Geophys. Res. Oceans 1999, 104, 20885–20910. [Google Scholar] [CrossRef] [Green Version]
- Durgadoo, J.V.; Rühs, S.; Biastoch, A.; Böning, C.W. Indian Ocean sources of Agulhas leakage. J. Geophys. Res. Oceans 2017, 122, 3481–3499. [Google Scholar] [CrossRef]
- Meyers, G. Variation of Indonesian throughflow and the El Niño-Southern Oscillation. J. Geophys. Res. Oceans 1996, 101, 12255–12263. [Google Scholar] [CrossRef]
- Le Bars, D.L.B.; Dijkstra, H.A.; De Ruijter, W.P.M. Impact of the Indonesian Throughflow on Agulhas leakage. Ocean Sci. Discuss. 2013, 10, 353–391. [Google Scholar] [CrossRef]
- Stramma, L.; Lutjeharms, J.R. The flow field of the subtropical gyre of the South Indian Ocean. J. Geophys. Res. Oceans 1997, 102, 5513–5530. [Google Scholar] [CrossRef]
- Putrasahan, D.; Kirtman, B.P.; Beal, L.M. Modulation of SST Interannual Variability in the Agulhas Leakage Region Associated with ENSO. J. Clim. 2016, 29, 7089–7102. [Google Scholar] [CrossRef]
- De Ruijter, W.P.; van Aken, H.M.; Beier, E.J.; Lutjeharms, J.R.; Matano, R.P.; Schouten, M.W. Eddies and dipoles around South Madagascar: formation, pathways and large-scale impact. Deep Sea Res. Part I Oceanogr. Res. Pap. 2004, 51, 383–400. [Google Scholar] [CrossRef]
- Schouten, M.W.; De Ruijter, W.P.; Van Leeuwen, P.J. Upstream control of Agulhas Ring shedding. J. Geophys. Res. Oceans 2002, 107. [Google Scholar] [CrossRef]
- Elipot, S.; Beal, L.M. Characteristics, energetics, and origins of Agulhas Current meanders and their limited influence on ring shedding. J. Phys. Oceanogr. 2015, 45, 2294–2314. [Google Scholar] [CrossRef]
- Loveday, B.R.; Durgadoo, J.V.; Reason, C.J.; Biastoch, A.; Penven, P. Decoupling of the Agulhas leakage from the Agulhas Current. J. Phys. Oceanogr. 2014, 44, 1776–1797. [Google Scholar] [CrossRef]
- Palastanga, V.; Van Leeuwen, P.J.; De Ruijter, W.P.M. A link between low-frequency mesoscale eddy variability around Madagascar and the large-scale Indian Ocean variability. J. Geophys. Res. Oceans 2006, 111. [Google Scholar] [CrossRef]
- Cai, W.; Meyers, G.; Shi, G. Transmission of ENSO signal to the Indian Ocean. Geophys. Res. Lett. 2005, 32. [Google Scholar] [CrossRef]
- Feng, M.; Meyers, G. Interannual variability in the tropical Indian Ocean: a two-year time-scale of Indian Ocean Dipole. Deep Sea Res. Part II Top. Stud. Oceanogr. 2003, 50, 2263–2284. [Google Scholar] [CrossRef]
- Kilpatrick, K.A.; Podesta, G.P.; Evans, R. Overview of the NOAA/NASA advanced very high resolution radiometer Pathfinder algorithm for sea surface temperature and associated matchup database. J. Geophys. Res. Oceans 2001, 106, 9179–9197. [Google Scholar] [CrossRef]
- Tokinaga, H.; Tanimoto, Y. Seasonal transition of SST anomalies in the tropical Indian Ocean during El Niño and Indian Ocean dipole years. J. Meteorol. Soc. Jpn. Ser. II 2004, 82, 1007–1018. [Google Scholar] [CrossRef]
- Swart, S.; Speich, S.; Ansorge, I.J.; Goni, G.J.; Gladyshev, S.; Lutjeharms, J.R. Transport and variability of the Antarctic Circumpolar Current south of Africa. J. Geophys. Res. Oceans 2008, 113. [Google Scholar] [CrossRef]
- Dencausse, G.; Arhan, M.; Speich, S. Spatio-temporal characteristics of the Agulhas Current retroflection. Deep Sea Res. Part I Oceanogr. Res. Pap. 2010, 57, 1392–1405. [Google Scholar] [CrossRef]
- Kug, J.S.; Kang, I.S. Interactive feedback between ENSO and the Indian Ocean. J. Clim. 2006, 19, 1784–1801. [Google Scholar] [CrossRef]
- Grunseich, G.; Subrahmanyam, B.; Murty, V.S.N.; Giese, B.S. Sea surface salinity variability during the Indian Ocean Dipole and ENSO events in the tropical Indian Ocean. J. Geophys. Res. Oceans 2011, 116. [Google Scholar] [CrossRef]
- Richard, Y.; Trzaska, S.; Roucou, P.; Rouault, M. Modification of the southern African rainfall variability/ENSO relationship since the late 1960s. Clim. Dyn. 2000, 16, 883–895. [Google Scholar] [CrossRef]
- Rouault, M.; Pohl, B.; Penven, P. Coastal oceanic climate change and variability from 1982 to 2009 around South Africa. Afr. J. Mar. Sci. 2010, 32, 237–246. [Google Scholar] [CrossRef]
- Krug, M.; Tournadre, J. Satellite observations of an annual cycle in the Agulhas Current. Geophys. Res. Lett. 2012, 39. [Google Scholar] [CrossRef]
- Rouault, M.; Penven, P.; Pohl, B. Warming in the Agulhas Current system since the 1980′s. Geophys. Res. Lett. 2009, 36. [Google Scholar] [CrossRef]
- Biastoch, A.; Böning, C.W.; Schwarzkopf, F.U.; Lutjeharms, J.R.E. Increase in Agulhas leakage due to poleward shift of Southern Hemisphere westerlies. Nature 2009, 462, 495–498. [Google Scholar] [CrossRef] [PubMed]
Figure 1.
Composite mean for all La Niña events listed in Table 1 from January–March for both Advanced Very High Resolution Radiometer (AVHRR) sea surface temperature (SST) anomalies (left column) and Simple Ocean Data Assimilation (SODA) sea surface salinity (SSS) anomalies (right column) during the peak (a,b), the following year (c,d), and two years after (e,f). The boxes represent the established leakage region (37°–45°S, 10°–20°E).

Figure 2.
Same as Figure 1 except for all El Niño events listed in Table 1 during the peak (a,b), the following year (c,d), and two years after (e,f).

Figure 3.
Composite mean of SODA SSS anomalies for all La Niña events (left column) and for all El Niño events (right column) listed in Table 1 two years after the peak for April–June (a,b), July–September (c,d), October–December (e,f), and three years after the peak for January–March (g,h). The boxes represent the established leakage region (37°–45°S, 10°–20°E).

Figure 4.
Composite mean for strong 1988–1989 La Niña event from January-March for both AVHRR SST anomalies (left column) and SODA SSS anomalies (right column) during the peak (a,b), the following year (c,d), and two years after (e,f). The boxes represent the established leakage region (37–45°S, 10–20°E).

Figure 5.
Same as Figure 4 except in reference to the strong 1997–1998 El Niño event during the peak (a,b), the following year (c,d), and two years after (e,f).
Figure 5.
Same as Figure 4 except in reference to the strong 1997–1998 El Niño event during the peak (a,b), the following year (c,d), and two years after (e,f).

Figure 6.
Same as Figure 4 except in reference to the weak 2000–2001 La Niña event during the peak (a,b), the following year (c,d), and two years after (e,f).
Figure 6.
Same as Figure 4 except in reference to the weak 2000–2001 La Niña event during the peak (a,b), the following year (c,d), and two years after (e,f).

Figure 7.
Same as Figure 4 except in reference to the weak 2004–2005 El Niño event during the peak (a,b), the following year (c,d), and two years after (e,f).
Figure 7.
Same as Figure 4 except in reference to the weak 2004–2005 El Niño event during the peak (a,b), the following year (c,d), and two years after (e,f).

Figure 8.
Composite mean for strong 1988–1989 La Niña minus the weak 2000–2001 La Niña from January–March for both AVHRR SST anomalies (right column) and SODA SSS anomalies (left column) during the peak (a,b), the following year (c,d), and two years after (e,f). The boxes represent the established leakage region (37°–45°S, 10°–20°E).

Figure 9.
Same as Figure 8 except in reference to the strong 1997–1998 El Niño minus the weak 2004–2005 El Niño during the peak (a,b), the following year (c,d), and two years after (e,f).
Figure 9.
Same as Figure 8 except in reference to the strong 1997–1998 El Niño minus the weak 2004–2005 El Niño during the peak (a,b), the following year (c,d), and two years after (e,f).

Figure 10.
Time series from 1981–2016 for monthly box-averaged (37°–45°S, 10°–20°E) AVHRR SST (solid line) and SODA SSS (dashed line) anomalies. ENSO events are represented during their peak (January–March) by vertical shaded bars (red for El Niño and blue for La Niña).
Figure 10.
Time series from 1981–2016 for monthly box-averaged (37°–45°S, 10°–20°E) AVHRR SST (solid line) and SODA SSS (dashed line) anomalies. ENSO events are represented during their peak (January–March) by vertical shaded bars (red for El Niño and blue for La Niña).

Figure 11.
Correlation analysis between absolute values of Oceanic Niño Index (ONI) index and box-averaged AVHRR SST anomalies (solid line) and SODA SSS anomalies (dashed line) at monthly lag intervals for El Niño years in red and La Niña years in blue.
Figure 11.
Correlation analysis between absolute values of Oceanic Niño Index (ONI) index and box-averaged AVHRR SST anomalies (solid line) and SODA SSS anomalies (dashed line) at monthly lag intervals for El Niño years in red and La Niña years in blue.

Figure 12.
Composite mean of Soil Moisture Ocean Salinity (SMOS) SSS anomalies from January–April (first column), May–August (middle column) and September–December (last column) during the most recent El Niño event starting and stopping in 2014 (top row), restarting in 2015 (middle row), and reaching its peak in 2016 (bottom row).


Table 1.
El Niño Southern Oscillation (ENSO) phase years between 1981–2015.
| El Niño | La Niña | Neutral | |
|---|---|---|---|
| 1982–1983 1 | 1983–1984 2 | 1980 | 2003 |
| 1986–1987 | 1984–1985 2 | 1981 | 2005 |
| 1987–1988 | 1988–1989 1 | 1985 | 2008 |
| 1991–1992 | 1995–1996 2 | 1989 | 2011 |
| 1994–1995 2 | 1998–1999 | 1990 | 2012 |
| 1997–1998 1 | 1999–2000 | 1992 | 2013 |
| 2002–2003 | 2000–2001 2 | 1993 | 2014 |
| 2004–2005 2 | 2007–2008 | 1995 | |
| 2006–2007 2 | 2010–2011 2 | 1996 | |
| 2009–2010 | 2011–2012 | 1998 | |
| 2015–2016 1 | 2001 | ||
1 Strong ENSO event; 2 weak ENSO event.
© 2018 by the authors. Licensee MDPI, Basel, Switzerland. This article is an open access article distributed under the terms and conditions of the Creative Commons Attribution (CC BY) license (http://creativecommons.org/licenses/by/4.0/).
Share and Cite
MDPI and ACS Style
Paris, M.L.; Subrahmanyam, B. Role of El Niño Southern Oscillation (ENSO) Events on Temperature and Salinity Variability in the Agulhas Leakage Region. Remote Sens. 2018, 10, 127. https://0-doi-org.brum.beds.ac.uk/10.3390/rs10010127
AMA Style
Paris ML, Subrahmanyam B. Role of El Niño Southern Oscillation (ENSO) Events on Temperature and Salinity Variability in the Agulhas Leakage Region. Remote Sensing. 2018; 10(1):127. https://0-doi-org.brum.beds.ac.uk/10.3390/rs10010127
Chicago/Turabian StyleParis, Morgan L., and Bulusu Subrahmanyam. 2018. "Role of El Niño Southern Oscillation (ENSO) Events on Temperature and Salinity Variability in the Agulhas Leakage Region" Remote Sensing 10, no. 1: 127. https://0-doi-org.brum.beds.ac.uk/10.3390/rs10010127
Note that from the first issue of 2016, this journal uses article numbers instead of page numbers. See further details here.